Submitted:
13 July 2025
Posted:
14 July 2025
You are already at the latest version
Abstract
Sarcopenia remains underdiagnosed in Vietnam due to the absence of simple, reliable screening instruments tailored to primary‐care settings, so we developed ViSarco to facilitate early identification of sarcopenia among community‐dwelling older adults; using a six‐phase exploratory mixed‐methods design, we generated candidate items through a comprehensive literature review and in‑depth interviews with 37 frontline healthcare providers, then conducted a cross‑sectional study of 416 adults aged ≥60 years applying AWGS 2019 criteria and logistic regression to assign scores of 2 for body‐mass index, 1 for arm circumference and 1 for calf circumference; we validated ViSarco in an independent cohort of 806 older adults and benchmarked its performance against six established international tools, finding that at a cut‑off score ≥2 it achieved 77.2% sensitivity, 76.6% specificity and an AUC of 0.77 in the derivation sample and maintained 78% overall accuracy with an AUC of 0.83 on external validation, outperforming all comparators; these results demonstrate that ViSarco is a brief, feasible and high‐performing screening tool well suited to resource‐limited primary‐care environments, offering robust diagnostic capability to support timely case finding and intervention for sarcopenia in older Vietnamese populations.
Keywords:
sarcopenia
; screening tool
; community-dwelling older adults
; primary healthcare
; Vietnam
1. Introduction
Sarcopenia (ICD-10-CM M62.84) is a progressive geriatric syndrome characterized by loss of skeletal muscle mass and function, and it has emerged as both a distinct pathological entity and a pressing global public health concern [1,2]. Beginning in mid-life, individuals may lose up to one-third of their muscle mass between ages 50 and 80, accompanied by increasing weakness, fatigue, and functional decline that compromise mobility and elevate fall risk. Consequently, older adults with sarcopenia experience disproportionately higher rates of falls, disability, hospitalization, and mortality, undermining individual well-being and straining healthcare systems, thereby jeopardizing the WHO’s “Decade of Healthy Ageing” objectives [3,4,5,6,7].
Economically, sarcopenia imposes substantial burdens: in the United States, direct costs reached an estimated $18.5 billion in 2000 (approximately 1.5 % of total healthcare expenditures), with hospitalization costs up to 34 % higher among affected older adults [8]; in the United Kingdom, annual health and social care expenditures for people aged 71-80 with sarcopenia are projected at £2.5 billion [9]. Moreover, a comprehensive cost-effectiveness analysis from Iran demonstrated that seven interventions, ranging from structured exercise programs to protein and vitamin D supplementation, yielded significant gains in quality-adjusted life years (QALYs) and achieved incremental cost-effectiveness ratios within accepted willingness-to-pay thresholds compared to no treatment [10]. These data underscore the critical imperative for early identification: screening at-risk individuals opens a window for targeted nutritional, exercise, and lifestyle interventions that can forestall functional decline, reduce fall risk, and ultimately diminish the personal and financial toll of sarcopenia [7,11].
Vietnam is experiencing one of the most rapid demographic shifts in Southeast Asia, with individuals aged ≥ 60 years projected to account for nearly 25% of the population by 2050, at a rate three to five times faster than in many high-income countries [12]. National surveys indicate sarcopenia affects 32–47% of community-dwelling older adults and up to 69% of those in institutional care [13,14,15]. Despite EWGSOP2 and AWGS 2019 guidelines highlighting the importance of early detection, no standardized screening protocol exists at the primary healthcare units, and gold-standard diagnostics (Dual-Energy X-ray Absorptiometry (DEXA), Bioelectrical Impedance Analysis (BIA)) remain cost-prohibitive and equipment-intensive for widespread use in LMIC primary care settings [16,17,18]. Simplified tools, such as SARC-F or limb circumference measurements, have low sensitivity and, when applied to anthropometric thresholds from other populations, often miss cases or give false positive results, reducing their accuracy in the Vietnamese community [19,20,21]. As the cornerstone of Vietnam’s universal health coverage, the primary health care system is uniquely positioned to manage chronic conditions and care for older adults; however, it lacks any sarcopenia screening guidelines [19,20,21,22,23]. This shortfall results in missed opportunities for early intervention at the point of care, where affordable, lifestyle-based measures, targeted exercise, and nutritional support can effectively slow muscle loss, reduce falls and hospitalizations, and prevent functional decline [18,21].
Although sarcopenia is highly prevalent among older adults in Vietnam, particularly in community settings, there is currently no validated screening tool adapted to the country's primary health care system. This gap significantly limits early detection and timely intervention, undermining efforts to prevent functional decline and reduce long-term complications. Given the substantial clinical and economic burden posed by sarcopenia, there is an urgent need for a practical, population-specific screening solution tailored to Vietnam's healthcare context. Transitioning from late-stage diagnosis to proactive case identification would allow for the implementation of cost-effective strategies such as routine screening, targeted nutritional counseling, and community-based physical activity programs. For policymakers, investing in low-cost, scalable interventions that can be embedded into existing primary care infrastructure offers a pragmatic and sustainable alternative to high-cost, technology-dependent diagnostic methods.
To address this gap, we developed and validated ViSarco, a simple, context-adapted screening instrument tailored for use in Vietnamese primary care settings. Through a sequential exploratory mixed-methods design, the study comprised two phases. In phase 1, tool development involved an initial qualitative needs assessment with primary care providers to identify practical and culturally relevant indicators, followed by a comprehensive quantitative validation process. This included psychometric testing using exploratory factor analysis, reliability assessment, and regression modeling on data from a cross-sectional sample of older adults. In phase 2, the finalized tool underwent external validation in a large, independent community-based cohort. The objectives of this study were to (1) develop a brief, culturally appropriate screening tool for sarcopenia suitable for primary healthcare settings in Vietnam, and (2) validate its diagnostic performance in diverse community-dwelling older adult populations. ViSarco aims to support routine community-based screening, improve early sarcopenia detection, and reduce the health and economic burden of aging in Vietnam.
2. Materials and Methods
This study followed a sequential exploratory mixed-methods design, structured in two distinct phases, instrument development (Phase 1) and validation and implementation (Phase 2), comprising six key steps (Figure 1). According to the Mixed Methods Appraisal Tool (MMAT) guidelines, 2018 ensured methodological quality across both qualitative and quantitative components. The study protocol was approved by the Human Research Ethics Committee of Walailak University (WUEC 24 263 01; 24 July 2024). All procedures adhered to the Declaration of Helsinki, and written informed consent was obtained from each participant prior to enrollment.
- Phase 1: Instrument Development
2.1. Targeted Literature Review
Our review was registered with PROSPERO (CRD42024512949) and followed PRISMA 2020 guidelines. We searched PubMed, Embase, Scopus, Google Scholar, and ResearchGate through 20 February 2024 for sarcopenia screening tools in community dwelling older adults (≥ 60 years). Inclusion criteria were studies reporting diagnostic accuracy metrics (sensitivity, specificity, AUC, likelihood ratios) against established reference standards (EWGSOP, EWGSOP2, AWGS, FNIH, IWGS). Two independent reviewers screened titles, abstracts, and full texts; a third reviewer resolved discrepancies. Quality appraisal used QUADAS 2 and COSMIN checklists, with interrater reliability assessed by Cohen’s kappa [24].
2.2. Qualitative Needs Assessment
A descriptive qualitative study grounded in the constructivist paradigm explored primary care providers’ perspectives. Thirty seven professionals in Can Tho City were purposively sampled (13 in depth interviews; 24 across two focus groups). Data collected between July and December 2024 were audio recorded, transcribed verbatim, and managed in NVivo 15. A hybrid thematic analysis was conducted, inductive coding from the data informed by the interview guide, followed by consensus meetings to resolve coding discrepancies. Trustworthiness was ensured via member checking (n = 10), triangulation, audit trails, and reflexivity; thematic saturation was reached at the 37th participant.
2.3. Cross Sectional Survey
We recruited an independent sample of 416 community dwelling adults (≥ 60 years) via multistage stratified random sampling in two Can Tho districts. Participants underwent whole body DEXA (GE Lunar Prodigy), handgrip strength (HGS) testing (Jamar dynamometer), and 6 m gait speed assessment (6mGS) per AWGS 2019 criteria. Anthropometrics, BMI, AC, CC, and WC were measured using standardized protocols. Sample size exceeded Buderer’s calculation (n = 379). Data quality was assured through daily instrument calibration, staff training, double data entry, and 10% random re measurement.
2.4. Psychometric Evaluation and Score Development
Structural Exploration: Exploratory factor analysis (EFA) identified underlying dimensions of the draft item pool. Factors were retained based on eigenvalues > 1.0, scree plot inspection, and interpretability.
Internal Consistency: Cronbach’s alpha and corrected item-total correlations were computed for each factor. Items failing to meet α ≥ 0.70 or showing poor correlation were reviewed and removed.
Model Building: Bayesian model averaging and stepwise logistic regression were applied to combined hospital and community datasets to select the most predictive items. Model fit was compared using BIC, and clinical relevance guided final item inclusion.
Score Construction: Regression coefficients were rescaled relative to the smallest weight and rounded to the nearest integer. Maximizing the Youden index in the derivation sample determined the optimal cutoff.
- Phase 2: Validation and Implementation
2.5. Training and Feasibility
A standardized 2 day training workshop was delivered to community health workers (CHWs), covering ViSarco’s purpose, item administration, and scoring procedures. The program included theoretical instruction, hands on demonstrations, and simulated home visits to enhance practical application. Field supervision was provided during early implementation to ensure protocol adherence.
2.6. External Validation and Comparative Assessment
An independent multisite sample of 806 community dwelling older adults (urban and rural; diverse age and sex strata) was recruited. The finalized ViSarco tool was administered alongside established instruments (SARC F, SARC Calf, MSRA 5/7, RSS, Ishii). Muscle mass was re assessed using multi frequency BIA (InBody 970), with grip strength and gait speed per AWGS 2019. Diagnostic performance (sensitivity, specificity, AUC, likelihood ratios) was evaluated against the AWGS reference standard, subgroup analyses by gender, age group, and site assessed tool robustness across populations.
3. Results
3.1. Item Pool Development Based on Literature Review and Healthcare Provider Insights
In accordance with the MMAT 2018 guidelines, Phase 1 commenced with an extensive literature review (Step 1), synthesizing existing sarcopenia screening tools for community-dwelling older adults. Tools were systematically categorized into three main types: (1) questionnaire-based tools evaluating self-reported indicators of muscle strength, physical function, and lifestyle factors (e.g., SARC-F, MSRA-5/7, SARC-EBM); (2) anthropometric measures estimating muscle mass through indicators such as calf circumference (CC), body mass index (BMI), waist circumference (WC), mid-upper arm circumference (MUAC), and the finger-ring (Yubi-Wakka) test; and (3) physical performance assessments objectively measuring functional capacity, including grip strength, chair stand test, gait speed, balance tests, the timed up-and-go (TUG), and the Short Physical Performance Battery (SPPB).
From this literature synthesis, a pool of candidate items was extracted, encompassing:
- 15 questionnaire items addressing subjective muscle strength, gait speed, muscle mass, physical performance, personal characteristics and lifestyle, and relevant medical history;
- 5 anthropometric measures (BMI, WC, CC, MUAC, and the finger-ring test);
- 6 physical performance tests, including SPPB, TUG, grip strength, chair stand, gait speed, and balance tests.
Step 2 involved a qualitative inquiry with 37 primary healthcare providers across Vietnam (13 in-depth interviews and 2 focus group discussions), aiming to explore perceptions, challenges, and practical needs related to sarcopenia screening in low-resource settings. Thematic analysis using NVivo revealed several critical findings. First, there was a widespread lack of awareness and conceptual clarity about sarcopenia among frontline providers, with many perceiving it as a normal aging process rather than a diagnosable and modifiable condition. This knowledge gap, coupled with limited exposure to available screening tools and the absence of structured clinical pathways, contributed to minimal implementation at the primary care level.
Second, systemic barriers, particularly limited time, human resources, space, equipment, and accessibility in rural areas, were frequently cited as constraints to effective screening. Notably, providers emphasized the importance of a tool that is rapid, easy to administer, non-invasive, culturally sensitive, and feasible in routine practice without reliance on specialized equipment.
Based on these insights, the initial item pool was refined to ensure local relevance and feasibility. The draft of candidate items included:
- 19 modified questionnaire items, revised to binary (Yes/No) formats and adapted based on contextual appropriateness. Items irrelevant to the Vietnamese rural context were excluded (e.g., “climbing stairs” from SARC-F due to one-story homes, “daily milk intake” from MSRA due to uncommon dairy consumption). New items on risk factors were added following provider suggestions.
- 5 anthropometric measures, all anthropometric measurements were chosen by PHC providers due to their simplicity, speed, and availability of measuring devices, with the finger-ring test presented in two response options for feasibility testing.
- 2 retained physical performance tests (chair stand test and balance test), while grip strength, gait speed, SPPB, and TUG were excluded due to their requirement for specialized tools, space, or prolonged testing time.
These findings collectively informed the development of a context-appropriate, resource-sensitive candidate item set for the ViSarco tool (Supplementary file S1).
3.2. Cross-Sectional Assessment and Early Validation of ViSarco
To examine the psychometric properties of the draft candidate items, a cross-sectional study was conducted among 416 community-dwelling older adults recruited from both urban and rural regions in Vietnam. Participants were invited to a hospital setting where standardized assessments were performed. Each participant completed the full set of candidate items, followed by reference testing based on the diagnostic criteria of the Asian Working Group for Sarcopenia 2019 (AWGS 2019). The reference standard included dual-energy X-ray absorptiometry (DEXA) to assess muscle mass, handgrip strength (HGS) to evaluate muscle strength, and 6-meter gait speed (6mGS) as a measure of physical performance.
This phase enabled the evaluation of each item's discriminatory power, internal consistency, and overall contribution to the construct of sarcopenia. Preliminary validation of the ViSarco tool was carried out using this dataset, focusing on item reduction, reliability testing, and diagnostic accuracy in comparison to the AWGS 2019 standard.
3.2.1. Selection of Candidate Variables via Univariate Logistic Regression
To determine Vietnamese-specific anthropometric thresholds for BMI, CC, AC, and WC, the Youden Index was applied to identify optimal cut-off points that best-distinguished individuals with and without sarcopenia. Due to word count limitations, this analysis's detailed methodology and full results are reported in a separate publication. As a result, the proposed cut-off thresholds for the Vietnamese population are as follows: BMI ≤ 22.6 kg/m² for men and 21.2 kg/m² for women; CC ≤ 31 cm for men and 30 cm for women; AC ≤ 25 cm for men and 24 cm for women; and WC ≤ 86.5 cm for men and 74.5 cm for women. These context-specific thresholds were subsequently used to develop and validate the ViSarco tool. The descriptive table summarizing these findings is provided in Supplementary file S2.
After running univariate regression of the manuscript items from the qualitative study to identify items associated with sarcopenia. From the initial 28 items from the pool of items, only 12 items with p value of OR < 0.05 were left to be used for the validation steps of the new sarcopenia screening tool (Table 1).
3.2.2. Preliminary Factor Structure Exploration Using EFA
Testing the suitability of data for EFA
We used Exploratory Factor Analysis (EFA) to assess the structural validity, examining the underlying factor structure of the instrument (Figure 2). Before running EFA, we tested Kaiser-Meyer-Olkin (KMO) and Bartlett’s Sphericity Test to ensure that the data were suitable for factor analysis:
- KMO (Kaiser–Meyer–Olkin)
- Overall MSA = 0.73 (> 0.70) ⇒ the data were eligible for EFA.
- Each item had MSA > 0.60
- Bartlett’s test for sphericity
• Chi-square = 744.92, df = 66, p < 1 × 10⁻¹⁵ ⇒ the correlation matrix is not a unit matrix, EFA can be performed.
Determining the number of factors to extract
- Parallel analysis suggests that three factors should be extracted.
- Scree plot and eigenvalues analysis results support this choice.
- Since the sample size in our study is approximately 400, we choose a factor loading cutoff of 0.3.
- EFA and factor interpretation
- Apply factor analysis with minres method and varimax rotation on 3 factors.
- SS Loadings (Sum of squared loadings) show that all three factors have significant contributions to the diagnosis of muscular dystrophy, in which Factor 1 explains the largest change. Variance ratio shows the percentage of change in the data that each factor explains, Cumulative variance shows the total variance explained by the factors up to that factor, Chi-Square test with p-value less than 0.05, This shows that the model with 3 factors is suitable and sufficient to explain the data structure.
- Uniquenesses column shows that variables 5, 6, 9, 12 are highly independent, not clearly explained by the factors. Therefore, we will eliminate these 4 items from ViSarco's candidate items, leaving 8 items to be included in the next analysis steps.

Table 2.
Extracted factors and associated items with significant loadings (≥ 0.30).
| No | Items | Uniquenesses | Factor 1 | Factor 2 | Factor 3 |
|---|---|---|---|---|---|
| 1 | BMI_Vn threshold | 0,40 | 0.67 | 0.34 | |
| 2 | Waist_Vn threshold | 0,18 | 0.90 | ||
| 3 | CC_Vn threshold | 0,48 | 0.70 | ||
| 4 | Feeling muscle strength vs. peers (weaker) | 0,72 | 0.52 | ||
| 5 | 70 years and older | 0,91 | |||
| 6 | Hospitalizations last year | 0,92 | |||
| 7 | Weight loss last year | 0,77 | 0.46 | ||
| 8 | Gender male | 0,79 | 0.45 | ||
| 9 | >=3 chronic diseases | 0,94 | |||
| 10 | Ring finger | 0,73 | 0.43 | ||
| 11 | AC_Vn threshold | 0,66 | 0.47 | 0.31 | |
| 12 | Balance test_tandem stand | 0,92 | |||
| SS loading | 1.77 | 1.00 | 0.84 | ||
| Proportion Var | 0,15 | 0,08 | 0,07 | ||
| CumulativeVar | 0,15 | 0,23 | 0,30 | ||
| The chi square statistic is 48.56 on 33 degrees of freedom. The p-value is 0.0395 | |||||
3.2.3. Internal Consistency and Reliability of Extracted Factors
In Factor 1, the total cronbach's α > 0.7 (0.73) shows that the items in factor 1 have good internal consistency. In addition, the Gender male item, if removed, will increase the total cronbach's α to 0.77, the lowest correlation with the total group (0.40), so we removed the gender item from the candidate items. In Factor 2 and Factor 3, although the cronbach's α is low (0.52 and 0.36), however, because each factor consists of only 2 items, with short scales (less than 10 items), α is often low and this does not reflect the scale's lack of reliability [25]. According to Briggs & Cheek (1986), in the case of short scales, the more suitable index to assess internal consistency is mean inter-item correlation, the optimal value should be in the range of 0.20 - 0.40 [26]. Both groups of factors have optimal mean inter-item correlation indexes (0.35 and 0.22), so these two groups of factors are still considered to have good internal consistency, even though α is low. The corrected item–total correlation values show that all items of Factor 1,2,3 exceed the threshold of ≥0.30, proving that each item contributes well to the overall structure, there is no case with a value <0.2, so there is no need to remove any more items.
The intraclass correlation coefficients (ICCs) indicated varying levels of repeatability across factors. Factor 1 (ICC: 0.71–0.73) showed good consistency between measurements and assessors, supporting its reliability for field application. Factor 2 (ICC: 0.51–0.52) demonstrated moderate stability, though standardizing measurement procedures is advisable to reduce potential variability. In contrast, Factor 3 (ICC: 0.33–0.36) reflected low repeatability, warranting careful consideration and potential refinement before inclusion in the final model.
Table 3.
Internal consistency metrics of ViSarco factors and items.
| Measure/Item | Cronbach's Alpha 95% CI | Alpha if Item Deleted | Average_r | r.cor | ICC |
|---|---|---|---|---|---|
| Overall Factor 1 (4 items) | 0.73 (0.68-0.77) | 0.4 | 0.71-0.73 | ||
| Gender male | 0.77 | 0.4 | |||
| BMI_Vn | 0.61 | 0.73 | |||
| Waist_Vn | 0.56 | 0.81 | |||
| AC_Vn | 0.70 | 0.55 | |||
| Overall Factor 2 (2 items) | 0.52 (0.43-0.61) | 0.35 | 0.51-0.52 | ||
| CC_Vn | 0.35 | 0.49 | |||
| Ring finger | 0.35 | 0.49 | |||
| Overall Factor 3 (2 items) | 0.36 (0.24-0.48) | 0.22 | 0.33-0.36 | ||
| Feeling muscle strength vs. peers | 0.26 | 0.37 | |||
| Weight loss last year | 0.19 | 0.37 |
Average_r (mean inter-item correlation), r.cor (Corrected Item-Total Correlation).
3.3. Selection of the Optimal Model from Candidate Items
As shown in Table 4 and Table 5, both BMA and stepwise regression consistently identified BMI, CC, and AC as the strongest predictors of sarcopenia. These variables had the highest posterior inclusion probabilities (BMI and CC: 100%, AC: 85.6%) and were statistically significant (p < 0.01), with BMI showing the most significant effect (standardized β = 0.43).
Model 1, which included all three variables, demonstrated the best fit (lowest BIC = −164.83; Adjusted R² = 0.351), indicating good explanatory power. Other items had low inclusion probabilities and poor ICC values, supporting their exclusion.
These findings confirm that the final ViSarco model should retain only three anthropometric measures: BMI, CC, and AC. The consistency between BMA and stepwise methods also ensures that items with poor internal consistency and low repeatability (low ICC) were systematically excluded.
3.4. Weight Assignment and Optimal Cutpoint Identification for the ViSarco Tool
Table 6 presents the results of the final logistic regression model using backward selection. Three items, BMI, AC and CC below the Vietnamese threshold, were retained as significant predictors of sarcopenia. The regression coefficients were used to assign item scores by normalizing against the smallest coefficient and rounding to the nearest integer. BMI contributed the highest weight (score = 2), followed by CC (score = 1) and AC (score = 1), forming the final scoring scheme of the ViSarco tool.
To determine the optimal cut-off score for screening/diagnosing sarcopenia, we analyzed the diagnostic performance indexes at different cut-off points of the ViSarco score. The results showed that a ViSarco cut-off score of ≥ 2 was the optimal cut-off for screening sarcopenia. At this point, the sensitivity (77.2%) and specificity (76.6%) were high and balanced. The Youden index was 0.538 – the highest among the surveyed levels, and the AUC was 0.769 – reflecting the best classification performance. In addition, LR+ = 3.3 and LR− = 0.297 showed reliable diagnostic value.
Compared with neighboring cut-off points (≥ 1 and ≥ 3), this cut-off achieved a better balance between detecting the correct cases and avoiding misdiagnosis. Therefore, we chose the threshold of ViSarco ≥ 2 to screen and identify elderly people at high risk of sarcopenia.
Table 7.
Diagnostic accuracy of ViSarco at varying cut-off scores.
| Var X | OR | AUC | Sen | Spec | Youden’s | PLR | NLR |
|---|---|---|---|---|---|---|---|
| Total score | 2.65 | 0.832 | - | - | - | - | - |
| Cutpoint ≥ 1 | 10.00 | 0.696 | 0.916 | 0.478 | 0.394 | 1.754 | 0.175 |
| Cutpoint ≥ 2 | 11.10 | 0.769 | 0.772 | 0.766 | 0.538 | 3.302 | 0.297 |
| Cutpoint ≥ 3 | 15.05 | 0.766 | 0.637 | 0.896 | 0.533 | 6.099 | 0.405 |
| Cutpoint ≥ 4 | 14.56 | 0.691 | 0.433 | 0.950 | 0.383 | 8.694 | 0.597 |
3.5. Assessing External Validity of the ViSarco Tool by Subgroup and Site
The results of the extrapolation validity assessment of the sarcopenia screening tool in 806 community-dwelling elderly people showed a good overall performance, with an area under the curve (AUC) of 0.77 (95% CI: 0.74–0.80) and an accuracy of 78%. At a cut-off point ≥2, the tool maintained a balance between sensitivity (72%) and specificity (82%), reflecting the ability to correctly detect cases of the disease as well as to reasonably exclude those without the disease. The positive likelihood ratio reached 3.93 – a clinically valid threshold, while the negative likelihood ratio reached 0.34, indicating a reliable ability to help rule out sarcopenia. Subgroup analyses also showed the stability and discriminatory performance of the tool. In terms of age group, the performance remained stable with AUC ranging from 0.73 to 0.79; The 70–79 age group had the highest sensitivity. In terms of gender, men tended to be more likely to be diagnosed with the disease (high sensitivity) but were more likely to be false positives due to low specificity; conversely, women were more likely to be identified as disease-free due to high specificity, but were more likely to be missed. In terms of area of residence, urban residents had higher specificity and accuracy, while rural residents had superior sensitivity, suggesting that the tool retains its screening effectiveness across different contexts.
Table 8.
Diagnostic performance of ViSarco in a community-based sample and subgroup analyses (n = 806, cutpoint ≥2 ).
Table 8.
Diagnostic performance of ViSarco in a community-based sample and subgroup analyses (n = 806, cutpoint ≥2 ).
| Sample | AUC (cutpoint ≥2) | Sen | Spec | PLR | NLR | Accuracy |
|---|---|---|---|---|---|---|
| Total (n = 806) | 0.77 (0.74-0.80) | 0.72 | 0.82 | 3.93 | 0.34 | 0.78 |
| Age (years old) | ||||||
| 60 – 69 (n=543) | 0.75 (0.71-0.79) | 0.67 | 0.83 | 3.94 | 0.39 | 0.78 |
| 70 – 79 (n=229) | 0.79 (0.74-0.84) | 0.79 | 0.79 | 3.81 | 0.27 | 0.79 |
| ≥ 80 (n=34) | 0.73 (0.58-0.89) | 0.75 | 0.71 | 2.63 | 0.35 | 0.74 |
| Gender | ||||||
| Male (n=261) | 0.79 (0.74-0.84) | 0.88 | 0.70 | 2.91 | 0.17 | 0.78 |
| Female (n=545) | 0.75 (0.71-0.79) | 0.63 | 0.87 | 4.72 | 0.43 | 0.78 |
| Area | ||||||
| Rural (n=355) | 0.75 (0.71-0.80) | 0.76 | 0.75 | 3.05 | 0.32 | 0.75 |
| Urban (n=451) | 0.77 (0.72-0.81) | 0.68 | 0.86 | 4.76 | 0.38 | 0.80 |
3.6. Comparison of ViSarco with Existing Sarcopenia Screening Tools
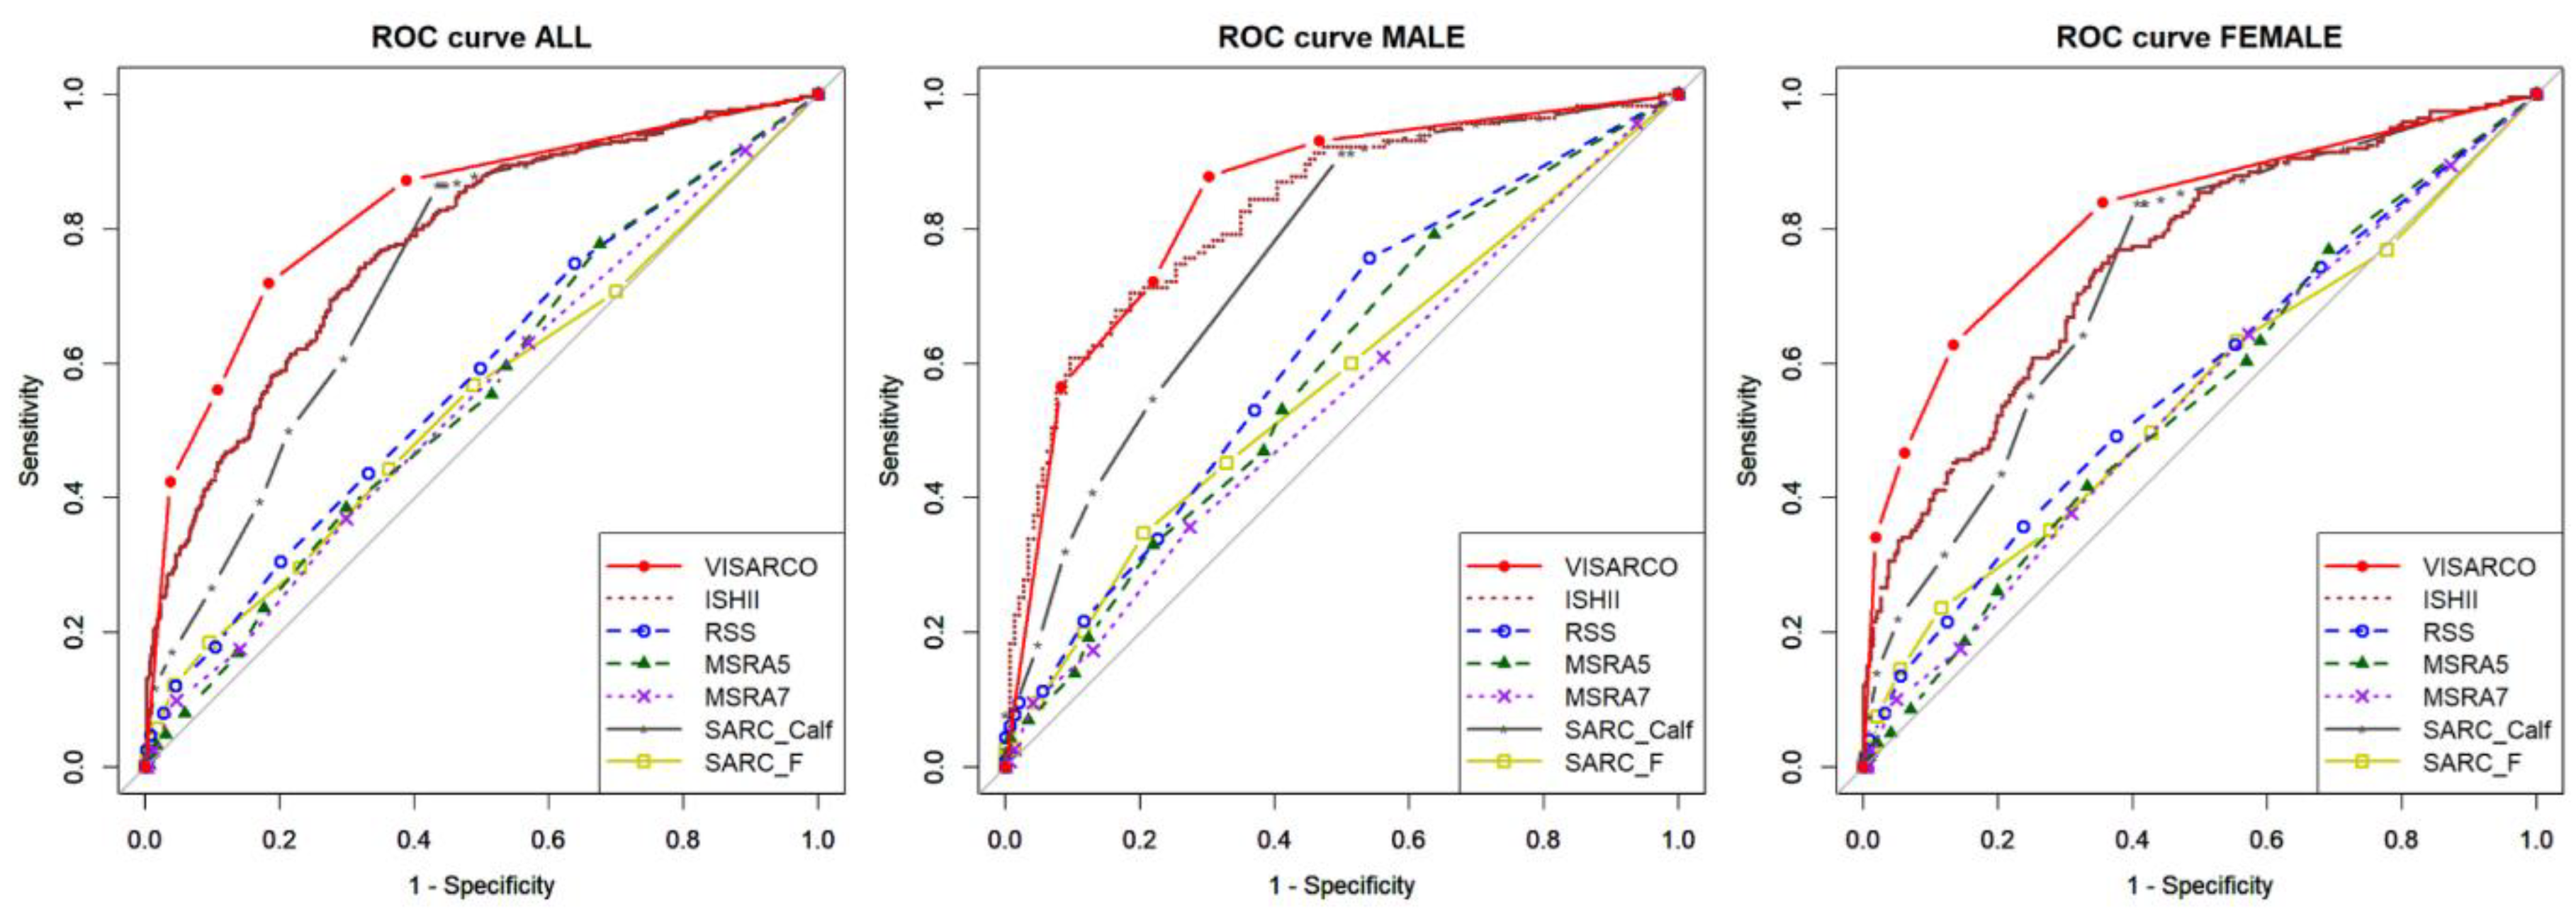
The convergent validity evaluation of 806 community-dwelling older adults showed that ViSarco outperformed six commonly used sarcopenia screening tools (SARC-F, SARC-Calf, RSS, MSRA5, MSRA7, and Ishii). ViSarco achieved an overall AUC of 0.83 and a diagnostic threshold AUC of 0.77, both the highest in the group, reflecting good discrimination. The tool also had a good balance between sensitivity (72%) and specificity (82%), while the other tools were either low in sensitivity (SARC-Calf 50%, RSS 31%) or low in specificity (Ishii 49%). ViSarco's PLR was 3.93, the highest in the group, indicating a strong positive predictive value, while the NLR was 0.34, reflecting confidence in negative results. The overall accuracy was 78%, significantly higher than the other tools. ViSarco also showed consistent performance between genders: in men, the sensitivity was 88% and the AUC was 0.79; in women, the specificity was 87% and the AUC was 0.75 – both the highest. Although the sensitivity in women was lower than Ishii, the high specificity helped to reduce false positives.
Table 9.
Comparative performance of ViSarco and six current sarcopenia screening tools.
| Sample (n= 806) | AUC (total score) | AUC (cutpoint) | sen | spec | PLR | NLR | Accuracy | |
|---|---|---|---|---|---|---|---|---|
|
SARC-F (cutpoint ≥ 4) |
All | 0.55 (0.51-0.59) | 0.53 (0.50-0.56) | 0.29 | 0.77 | 1.29 | 0.91 | 0.59 |
| Male | 0.57 (0.51-0.64) | 0.54 (0.50-0.59) | 0.20 | 0.88 | 1.72 | 0.91 | 0.58 | |
| Female | 0.55 (0.50-0.60) | 0.54 (0.50-0.58) | 0.35 | 0.72 | 1.27 | 0.90 | 0.59 | |
|
SARC-Calf (cutpoint ≥ 11) |
All | 0.74 (0.70-0.77) | 0.64 (0.61-0.68) | 0.50 | 0.79 | 2.34 | 0.64 | 0.67 |
| Male | 0.76 (0.70-0.81) | 0.64 (0.59-0.69) | 0.41 | 0.87 | 3.14 | 0.68 | 0.67 | |
| Female | 0.73 (0.69-0.77) | 0.65 (0.61-0.69) | 0.55 | 0.75 | 2.22 | 0.60 | 0.68 | |
|
RSS (cutpoint ≤14) |
All | 0.58 (0.54-0.62) | 0.55 (0.52-0.58) | 0.31 | 0.80 | 1.52 | 0.87 | 0.61 |
| Male | 0.62 (0.55-0.69) | 0.55 (0.50-0.60) | 0.22 | 0.88 | 1.88 | 0.89 | 0.59 | |
| Female | 0.57 (0.52-0.62) | 0.56 (0.52-0.60) | 0.36 | 0.76 | 1.50 | 0.84 | 0.61 | |
|
MSRA5 (cutpoint < 45) |
All | 0.56 (0.52-0.60) | 0.54 (0.51-0.58) | 0.39 | 0.70 | 1.29 | 0.88 | 0.58 |
| Male | 0.59 (0.52-0.66) | 0.56 (0.50-0.61) | 0.33 | 0.78 | 1.51 | 0.86 | 0.58 | |
| Female | 0.55 (0.50-0.60) | 0.54 (0.50-0.58) | 0.42 | 0.67 | 1.25 | 0.87 | 0.58 | |
|
MSRA7 (cutpoint < 30) |
All | 0.55 (0.51-0.59) | 0.54 (0.50-0.57) | 0.37 | 0.70 | 1.24 | 0.90 | 0.57 |
| Male | 0.55 (0.48-0.61) | 0.54 (0.48-0.60) | 0.35 | 0.73 | 1.30 | 0.89 | 0.56 | |
| Female | 0.55 (0.50-0.60) | 0.53 (0.49-0.58) | 0.38 | 0.69 | 1.21 | 0.90 | 0.57 | |
|
Ishii (male ≤ 105, female ≤ 120) |
All | 0.78 (0.74-0.81) | 0.68 (0.65-0.71) | 0.86 | 0.49 | 1.69 | 0.28 | 0.64 |
| Male | 0.83 (0.78-0.88) | 0.67 (0.62-0.71) | 0.93 | 0.40 | 1.56 | 0.17 | 0.63 | |
| Female | 0.75 (0.71-0.80) | 0.67 (0.64-0.71) | 0.82 | 0.52 | 1.73 | 0.34 | 0.63 | |
|
ViSarco (cutpoint ≥ 2) |
All | 0.83 (0.80-0.86) | 0.77 (0.74-0.80) | 0.72 | 0.82 | 3.93 | 0.34 | 0.78 |
| Male | 0.84 (0.79-0.89) | 0.79 (0.74-0.84) | 0.88 | 0.70 | 2.91 | 0.17 | 0.78 | |
| Female | 0.82 (0.78-0.85) | 0.75 (0.71-0.79) | 0.63 | 0.87 | 4.72 | 0.43 | 0.78 | |
Figure 3.
ROC curves comparing ViSarco with six established sarcopenia screening tools.
4. Discussion
4.1. Effectiveness and Feasibility of ViSarco in Primary Care Settings
This study developed and validated ViSarco, a simple, low-cost screening tool for sarcopenia based on three anthropometric measurements: BMI, upper arm circumference, and calf circumference. Designed for use in community settings, ViSarco is well suited to the practical constraints of PHC systems in low-resource settings. Its strong sensitivity and specificity support its usefulness as a rapid and accurate screening method for early detection of sarcopenia in older adults [27,28].
ViSarco overcomes barriers to widespread implementation in low- and middle-income countries (LMICs), such as limited infrastructure, personnel, and training, by eliminating the need for specialized equipment or complex procedures. Its simplicity allows for widespread deployment across PHC settings, from urban clinics to rural outreach programs, helping to address geographic and socioeconomic disparities in screening access. These features make it a promising option for integration into national healthy aging strategies and community-based care models [27,28].
ViSarco demonstrates strong internal consistency and maintains diagnostic performance when externally validated across diverse demographic groups, emphasizing its generalizability. A significant strength of ViSarco lies in its ability to minimize missed cases, its high sensitivity and low negative likelihood ratio in vulnerable groups (higher age, higher sensitivity, rural areas higher than urban areas) is important, as missing sarcopenia in these groups can lead to rapid functional decline and serious consequences, where early intervention is key. Conversely, its high specificity and high PLR in other groups (lower age, urban residents) ensure that positive results are more reliable, reducing the false positive rate and preventing unnecessary follow-up tests, patient anxiety, and unnecessary specialist referrals [29,30]. This balance leads to an efficient primary care workflow, ensuring that resources (time, further assessment, referral) are allocated appropriately, making the screening program sustainable and effective without burdening the health system or patients.
ViSarco’s main strength lies in its contextual design, a key determinant of the success of a medical tool, and the active involvement of PHC service providers in the design phase, emphasizing an important principle in implementation science: the success of a medical intervention is deeply influenced by its adaptation to the context. Many diagnostic tools are developed in highly controlled, well-resourced academic or clinical settings, often resulting in a gap between research and practice when translated into real-world, resource-limited settings [31]. ViSarco’s proactive approach, by directly integrating input from those who would use the tool (frontline PHC providers), enabled researchers to proactively identify and address potential real-world barriers (e.g., limited time and space for physical performance testing, lack of specialized equipment, cultural sensitivity to inappropriate questions, subjectivity and memory issues of older adults with questionnaires). This collaborative approach ensured that the resulting tool was scientifically sound, highly feasible to integrate into existing workflows, and acceptable to providers and patients [31,32]. This significantly increased the likelihood of successful adoption and sustainable use. ViSarco provides a scalable model for developing practical solutions in resource-constrained settings that are co-created, not imposed.
4.2. Comparison with Previous Tools
The anthropometric indices in ViSarco, BMI, upper arm circumference, and calf circumference, are both physiologically relevant and operationally feasible for primary care settings. BMI serves as a surrogate for overall nutritional status, while upper arm and calf circumference provide direct measures of peripheral muscle mass, which are hallmarks of sarcopenia [33,34]. With an area under the ROC curve (AUC) of 0.83, ViSarco demonstrates a favorable diagnostic profile, balancing a sensitivity of 0.72 and a specificity of 0.82. Compared with six existing screening tools, ViSarco demonstrates superior performance, confirming its value as a simple, rapid, and reliable solution in resource-poor primary care settings. Questionnaire-based tools, including the SARC-F, RSS, MSRA-5, and MSRA-7, have shown limited clinical utility, often missing a significant proportion of sarcopenia cases. Their low sensitivity (30–40%) and likelihood ratios close to 1 suggest that relying solely on these tools could result in missing up to 60% of sarcopenia cases in community-based screening in Vietnam. Although simple to implement, these tools do not meet the performance threshold required for effective detection [24]. Prediction score-based tools such as the Ishii score, although having higher sensitivity (0.86), have low specificity (0.49), resulting in higher false-positive rates and potentially unnecessary follow-up examinations. In contrast, hybrid tools such as SARC-Calf, while having moderate specificity (0.79), have low sensitivity (0.50), resulting in missed diagnoses in approximately half of real cases.
The more balanced diagnostic characteristics of ViSarco position it as a practical and effective screening tool for frontline primary care. Identifying actual cases while minimizing inappropriate referrals is essential in resource-poor settings, where overloading already limited systems can compromise the quality of care. By achieving both accuracy and feasibility, ViSarco addresses a longstanding gap in sarcopenia detection and provides a scalable model for low- and middle-income countries.
4.3. Strengths and Limitations of the Study
- Strengths.
We used a sequential exploratory mixed methods design guided by the MMAT 2018 framework, ensuring methodological rigor in the qualitative and quantitative phases. The initial systematic review was pre-registered in PROSPERO and conducted according to PRISMA guidelines, enhancing transparency and reproducibility. During the qualitative phase, frontline PHC providers co-designed ViSarco, aligning the tool to real-world constraints and stakeholder needs. Our quantitative validation utilized large, stratified cohorts (n = 416 induction; n = 806 external validation), exceeding the recommended sample size and enhancing statistical power. Criterion validity was established against gold standard measures (DEXA, HGS, 6mGS), and psychometric properties were examined through EFA, Cronbach's alpha, item-total correlations, Bayesian model means, and stepwise logistic regression. External validation across age, gender, and urban/rural groups confirmed the tool's robustness, while direct comparisons with six established screening tools demonstrated superior diagnostic balance. ViSarco stands out for being "context-adapted" and developed in collaboration with frontline providers, directly addressing local system barriers. This positions it not only as a novel health tool but also a successful model for indigenous innovation.
In contrast to imported solutions from rich countries that are often ineffective in resource-poor settings, ViSarco was designed from the ground up to address the realities of primary care in Vietnam. A bottom-up approach incorporating local knowledge, promoting ownership, and building system capacity is vital for sustainability. This success could be a blueprint for developing other contextually appropriate health tools globally.
- Limitations
Despite its strengths, this study has two significant limitations. First, we used DEXA during tool development but switched to multi-frequency BIA (InBody 970) for external validation due to cost, portability, and limited community access. Although BIA showed good overall agreement with DEXA, method-specific biases, particularly in women and individuals with extreme body composition, may subtly influence diagnostic thresholds [35]. DEXA is considered the gold standard for body composition assessment; however, its high cost, limited portability, and requirement for specialized facilities make it impractical for large-scale community-based studies, especially in resource-limited settings. Therefore, the researchers made a necessary and justified pragmatic choice to use a multi-frequency BIA device for the external validation phase to achieve broader community participation and generalizability. This was a strategic decision to prioritize external validity over absolute consistency of measurement methods across phases.
Although the study recruited participants from urban and rural areas, the entire study was conducted in a single city in southern Vietnam. This geographic limitation should be noted because regional differences in culture, dietary habits, health literacy, and health infrastructure may impact the performance and feasibility of ViSarco. Specifically, cultural and nutritional differences may impact body composition and sarcopenia, thereby altering the effectiveness of universal anthropometric measurements and reducing the sensitivity/specificity of the tool in other settings. At the same time, low health literacy directly limits awareness of health information, reducing screening participation and adherence to interventions [36]. Finally, a lack of health infrastructure and resources may make implementing even a simple tool like ViSarco challenging.
4.4. Clinical Practice and Future Research
Clinical Practice.
ViSarco provides a rapid, noninvasive screening method ideal for integration into routine primary care. Based on measurements already taken during standard health screenings (i.e., BMI), the method requires only two additional anthropometric assessments (AC, CC), each completed in less than two minutes with minimal training and no specialized equipment. Patients with a ViSarco score ≥ 2 can immediately initiate low-cost, lifestyle-based interventions (e.g., personalized nutrition counseling and resistance exercise programs) delivered at the primary care level. Given the lack of approved pharmacological treatments for sarcopenia, timely, community-based strategies such as these are essential. Primary care providers can therefore play a key role in early detection, education on healthy aging, and coordination of referrals to geriatric or rehabilitation specialists when indicated [37,38].
By overcoming significant system barriers, limited diagnostic capacity, and a lack of practical screening tools, ViSarco supports scalable implementation across urban, rural, and remote areas. Its usability and simplicity make it an attractive candidate for inclusion in national screening initiatives and routine geriatric assessments. Early detection at reversible stages is essential to halt the degenerative-frailty-disability cascade and reduce the incidence of disability in older populations [39], thereby reducing functional decline and associated health care utilization. In addition to direct cost savings (fewer hospitalizations, reduced need for long-term care, lower medication costs), effective early screening also protects the autonomy, dignity, and quality of life of older adults, while reducing caregiver burden and strengthening community support networks. These combined health and socioeconomic benefits underscore the value of ViSarco as a strategic component of healthy aging policies.
Future research.
Future research should focus on validating the predictive value and feasibility of ViSarco in real-world settings: longitudinal cohort studies would clarify its ability to predict functional decline and adverse outcomes. At the same time, cross-cultural evaluations could identify appropriate cutoffs and ensure accuracy across diverse populations. At the same time, practical implementation studies should explore how the tool integrates into routine primary care, provider uptake, and its impact on patient engagement and health outcomes. Together, these efforts will streamline the transition of ViSarco from research to policy-driven screening programs that support healthy aging at scale.
5. Conclusion
ViSarco, co-designed with primary health care providers, is more than just a screening tool; it demonstrates a model of indigenous innovation that can be scaled up in global health, overcoming systemic barriers such as equipment, time, and training constraints. This contextual relevance ensures high acceptability and applicability, which is a key factor for the success of any health intervention in a resource-limited setting.
Compared to questionnaire-based tools with low sensitivity (30-40%) that often miss more than half of potential sarcopenia cases in the Vietnamese community, ViSarco provides a more balanced diagnostic profile. This is particularly important in sarcopenia, a silent progressive condition where missed diagnosis can lead to irreversible functional decline and increased disease burden.
Ultimately, ViSarco standardizes sarcopenia screening at the primary care level and promotes consistent use of evidence-based interventions. As a context-sensitive tool, built on the real needs of primary care, ViSarco promises to improve sarcopenia prevention and management and healthy aging outcomes for older adults in Vietnam.
Supplementary Materials
The following supporting information can be downloaded at the website of this paper posted on Preprints.org, Supplementary S1. Refinement of candidate items based on PHC provider feedback. Supplementary S2. Optimal cut-off values and diagnostic performance of anthropometric indicators by gender.
Author Contributions
Conceptualization, H.T.N., C.N.L., C.S., and A.W.; methodology, H.T.N., C.S., A.W., W.S., and T.T.P.; software, H.T.N.; validation, H.T.N., T.N., and C.N.L.; formal analysis, H.T.N.; investigation, H.T.N., T.N., and C.N.L.; resources, H.T.N.; data curation, H.T.N.; writing—original draft preparation, H.T.N.; writing—review and editing, C.N.L., C.S., A.W., W.S., and T.T.P.; visualization, W.S. and T.T.P.; supervision, C.S., A.W., W.S., and T.T.P.; project administration, H.T.N.; funding acquisition, C.S. and A.W. All authors have read and agreed to the published version of the manuscript.
Funding
This research was funded by Walailak University Graduate Research Fund, grant number CGS-RF-2024/18.
Institutional Review Board Statement
The study was conducted in accordance with the Declaration of Helsinki and approved by the Ethics Committee in Human Research of Walailak University (approval number WUEC-24-263-01, dated 24 July 2024).
Informed Consent Statement
Informed consent was obtained from all subjects involved in the study.
Data Availability Statement
The data presented in this study are available on request from the corresponding author. The data are not publicly available due to ethical restrictions.
Acknowledgments
The authors extend their heartfelt appreciation to the research team for their commitment and invaluable contributions throughout the study. We gratefully acknowledge the administrative and fieldwork support provided by Can Tho University of Medicine and Pharmacy, whose collaboration significantly enhanced the data collection process and community engagement. Support from the Graduate Scholarship of Walailak University, Thailand (Contract No. 07/2023), is also sincerely appreciated. During the preparation of this manuscript, the authors used Grammarly (version unspecified) for grammar and spelling correction. The authors have thoroughly reviewed and edited the output and take full responsibility for the content of this publication.
Conflicts of Interest
The authors declare no conflicts of interest. The funders had no role in the design of the study; in the collection, analyses, or interpretation of data; in the writing of the manuscript; or in the decision to publish the results.
Abbreviations
The following abbreviations are used in this manuscript:
| BMI | Body Mass Index |
| CC | Calf Circumference |
| AC | Arm Circumference |
| WC | Waist Circumference |
| WWI | The Weight-Adjusted Waist Index |
| AWGS 2019 | The Asian Working Group For Sarcopenia 2019 |
| ROC | Receiver Operating Characteristic |
| AUC | Area Under The Curve |
| BIA | Bioelectrical Impedance Analysis |
| DEXA | Dual-Energy X-ray Absorptiometry |
| HGS | Handgrip strength |
| 6mGS | 6-meter Gait Speed |
References
- Anker, S.D.; Morley, J.E.; von Haehling, S. Welcome to the ICD-10 code for sarcopenia. J Cachexia Sarcopenia Muscle 2016, 7, 512-514. [CrossRef]
- Gao, Q.; Hu, K.; Yan, C.; Zhao, B.; Mei, F.; Chen, F.; Zhao, L.; Shang, Y.; Ma, Y.; Ma, B. Associated Factors of Sarcopenia in Community-Dwelling Older Adults: A Systematic Review and Meta-Analysis. Nutrients 2021, 13, 4291.
- Beaudart, C.; Zaaria, M.; Pasleau, F.; Reginster, J.Y.; Bruyère, O. Health Outcomes of Sarcopenia: A Systematic Review and Meta-Analysis. PLoS One 2017, 12, e0169548. [CrossRef]
- Bruyère, O.; Beaudart, C.; Ethgen, O.; Reginster, J.-Y.; Locquet, M. The health economics burden of sarcopenia: a systematic review. Maturitas 2019, 119, 61-69. [CrossRef]
- Yuan, S.; Larsson, S. Epidemiology of sarcopenia: Prevalence, risk factors, and consequences. Metabolism: Clinical and Experimental 2023. [CrossRef]
- Liu, J.; Zhu, Y.; Tan, J.K.; Ismail, A.H.; Ibrahim, R.; Hassan, N.H. Factors Associated with Sarcopenia among Elderly Individuals Residing in Community and Nursing Home Settings: A Systematic Review with a Meta-Analysis. Nutrients 2023, 15. [CrossRef]
- Darvishi, A.; Hemami, M.R.; Shafiee, G.; Daroudi, R.; Mohseni, M.; Shekarabi, F.H.; Heshmat, R. Sarcopenia screening strategies in older people: a cost effectiveness analysis in Iran. BMC Public Health 2021, 21, 926. [CrossRef]
- Sousa, A.S.; Guerra, R.S.; Fonseca, I.; Pichel, F.; Ferreira, S.; Amaral, T.F. Financial impact of sarcopenia on hospitalization costs. Eur J Clin Nutr 2016, 70, 1046-1051. [CrossRef]
- Pinedo-Villanueva, R.; Westbury, L.D.; Syddall, H.E.; Sanchez-Santos, M.T.; Dennison, E.M.; Robinson, S.M.; Cooper, C. Health Care Costs Associated With Muscle Weakness: A UK Population-Based Estimate. Calcif Tissue Int 2019, 104, 137-144. [CrossRef]
- Darvishi, A.; Shafiee, G.; Balajam, N.Z.; Hemami, M.R.; Ostovar, N.; Heshmat, R. Cost-effectiveness analysis of sarcopenia management interventions in Iran. BMC Public Health 2023, 23, 819. [CrossRef]
- Beaudart, C.; Alcazar, J.; Aprahamian, I.; Batsis, J.A.; Yamada, Y.; Prado, C.M.; Reginster, J.Y.; Sanchez-Rodriguez, D.; Lim, W.S.; Sim, M.; et al. Health outcomes of sarcopenia: a consensus report by the outcome working group of the Global Leadership Initiative in Sarcopenia (GLIS). Aging Clin Exp Res 2025, 37, 100. [CrossRef]
- Maheshwari, A.; Maheshwari, G. Aging Population in Vietnam: Challenges, Implications, and Policy Recommendations. International Journal of Aging 2024, 2, e1. [CrossRef]
- Châu, N.T.Q.; Linh, N.T.; Chinh, P.T.T. Khẩu phần ăn và thực trạng suy mòn cơ của người cao tuổi tại một trung tâm chăm sóc người cao tuổi tại Hà Nội năm 2023. Tạp chí Dinh dưỡng và Thực phẩm 2023, 19, 92-101.
- Pham, L.-A.T.; Nguyen, B.T.; Huynh, D.T.; Nguyen, B.-M.L.T.; Tran, P.-A.N.; Van Vo, T.; Bui, H.-H.T.; Thai, T.T. Community-based prevalence and associated factors of sarcopenia in the Vietnamese elderly. Scientific Reports 2024, 14, 17. [CrossRef]
- Trần, G.H.; Ngô, L.P.; Đỗ, A.T.; Lê, T.K.O.; Lê, T.K.D.; Nguyễn, T.H. Tình hình sarcopenia và một số yếu tố liên quan ở người cao tuổi huyện Phong Điền thành phố Cần Thơ năm 2024. Tạp chí Y Dược học Cần Thơ 2025, 184-190. [CrossRef]
- Cruz-Jentoft, A.J.; Baeyens, J.P.; Bauer, J.M.; Boirie, Y.; Cederholm, T.; Landi, F.; Martin, F.C.; Michel, J.P.; Rolland, Y.; Schneider, S.M.; et al. Sarcopenia: European consensus on definition and diagnosis: Report of the European Working Group on Sarcopenia in Older People. Age Ageing 2010, 39, 412-423. [CrossRef]
- Fielding, R.A.; Vellas, B.; Evans, W.J.; Bhasin, S.; Morley, J.E.; Newman, A.B.; Abellan van Kan, G.; Andrieu, S.; Bauer, J.; Breuille, D.; et al. Sarcopenia: an undiagnosed condition in older adults. Current consensus definition: prevalence, etiology, and consequences. International working group on sarcopenia. J Am Med Dir Assoc 2011, 12, 249-256. [CrossRef]
- Chen, L.K.; Woo, J.; Assantachai, P.; Auyeung, T.W.; Chou, M.Y.; Iijima, K.; Jang, H.C.; Kang, L.; Kim, M.; Kim, S.; et al. Asian Working Group for Sarcopenia: 2019 Consensus Update on Sarcopenia Diagnosis and Treatment. J Am Med Dir Assoc 2020, 21, 300-307.e302. [CrossRef]
- Dung, V.; Thi Mai Lan, N.; Thu Trang, V.; Xuan Cu, T.; Minh Thien, L.; Sy Thu, N.; Dinh Man, P.; Minh Long, D.; Trong Ngo, P.; Minh Nguyet, L. Quality of life of older adults in nursing homes in Vietnam. Health Psychol Open 2020, 7, 2055102920954710. [CrossRef]
- Giang, L. The Aging population in Viet Nam: Current status, prognosis, and possible policy responses; 2011.
- Adulkasem, N.; Ekasame, V.; Pojchong, C.; Apichat, A.; and Unnanuntana, A. Evaluation of the Diagnosis Accuracy of the AWGS 2019 Criteria for “Possible Sarcopenia” in Thai Community-Dwelling Older Adults. Clinical Interventions in Aging 2025, 20, 425-433. [CrossRef]
- Health, T.M.o. Decision 1588/QD-BYT 2020 professional document Guidelines for health management of the elderly. 2020.
- Health, T.M.o. Decision 5904/QD-BYT 2019 document on Guidelines for diagnosing non-communicable diseases at commune health stations. 2019.
- Nguyen, H.T.; Suwanbamrung, C.; Wattanapisit, A.; Satheannoppakao, W.; Nguyen, T.; Truong, N.T.; Ha, G.H.; Huynh, D.T.N.; Le, C.N. Cultural Contexts Meet Clinical Precision: A Systematic Review and Meta-Analysis of Sarcopenia Screening Tools in Global Aging Communities. Journal of Posthumanism 2025, 5, 1735-1769. [CrossRef]
- Pallant, J. SPSS Survival Manual: A Step by Step Guide to Data Analysis Using SPSS, 4th Edition ed.; Allen & Unwin, Berkshire, 2011.
- Piedmont, R.; Hyland, M. Inter-Item Correlation Frequency Distribution Analysis: A Method for Evaluating Scale Dimensionality. Educational and Psychological Measurement - EDUC PSYCHOL MEAS 1993, 53, 369-378. [CrossRef]
- Seidell, J.C.; Kahn, H.S.; Williamson, D.F.; Lissner, L.; Valdez, R. Report from a Centers for Disease Control and Prevention Workshop on Use of Adult Anthropometry for Public Health and Primary Health Care. The American Journal of Clinical Nutrition 2001, 73, 123-126. [CrossRef]
- Ha, T.; McNamara, M.; Melo, L.; Frost, E.; Moore, G. Filling the gap between evidence, policy and practice: are 45 and Up Study researchers planning for impact? Public Health Research & Practice 2023, 33, e45.
- Trevethan, R. Response: Commentary: Sensitivity, Specificity, and Predictive Values: Foundations, Pliabilities, and Pitfalls in Research and Practice. Frontiers in Public Health 2020, Volume 7 - 2019. [CrossRef]
- Ben-Haim, Y.; Dacso, C.C. Interpreting PPV and NPV of Diagnostic Tests with Uncertain Prevalence. Rambam Maimonides Med J 2024, 15. [CrossRef]
- Dekker - van Doorn, C.; Wauben, L.; van Wijngaarden, J.; Lange, J.; Huijsman, R. Adaptive design: adaptation and adoption of patient safety practices in daily routines, a multi-site study. BMC Health Services Research 2020, 20, 426. [CrossRef]
- Carlfjord, S.; Lindberg, M.; Bendtsen, P.; Nilsen, P.; Andersson, A. Key factors influencing adoption of an innovation in primary health care: a qualitative study based on implementation theory. BMC Family Practice 2010, 11, 60. [CrossRef]
- Luo, S.; Chen, X.; Hou, L.; Yue, J.; Liu, X.; Xia, X.; Dong, B.; Cao, L. The accuracy of body mass index and calf circumference values when assessing sarcopenia in a multi-ethnic cohort of middle-aged and older adults: West China health and aging trend study results. Heliyon 2023, 9, e15027. [CrossRef]
- Wang, B.; Nong, C.; Zhang, J.; Deng, L.; Li, W.; Zhang, X.; Liu, P. Prevalence and associated body composition factors of sarcopenia in community-dwelling older adults. European Journal of Medical Research 2024, 29, 598. [CrossRef]
- Sun, G.; French, C.R.; Martin, G.R.; Younghusband, B.; Green, R.C.; Xie, Y.-g.; Mathews, M.; Barron, J.R.; Fitzpatrick, D.G.; Gulliver, W.; et al. Comparison of multifrequency bioelectrical impedance analysis with dual-energy X-ray absorptiometry for assessment of percentage body fat in a large, healthy population1–3. The American Journal of Clinical Nutrition 2005, 81, 74-78. [CrossRef]
- Van Ancum, J.M.; Meskers, C.G.M.; Reijnierse, E.M.; Yeung, S.S.Y.; Jonkman, N.H.; Trappenburg, M.C.; Pijnappels, M.; Maier, A.B. Lack of Knowledge Contrasts the Willingness to Counteract Sarcopenia Among Community-Dwelling Adults. Journal of Aging and Health 2019, 32, 787-794. [CrossRef]
- Xie, W.Q.; Xiao, G.L.; Hu, P.W.; He, Y.Q.; Lv, S.; Xiao, W.F. Possible sarcopenia: early screening and intervention-narrative review. Ann Palliat Med 2020, 9, 4283-4293. [CrossRef]
- Won, C.W. Management of Sarcopenia in Primary Care Settings. Korean J Fam Med 2023, 44, 71-75. [CrossRef]
- Crosignani, S.; Sedini, C.; Calvani, R.; Marzetti, E.; Cesari, M. Sarcopenia in primary care: screening, diagnosis, management. J Frailty Aging 2021, 10, 226-232. [CrossRef]
Figure 1.
Overview of ViSarco development and validation process.
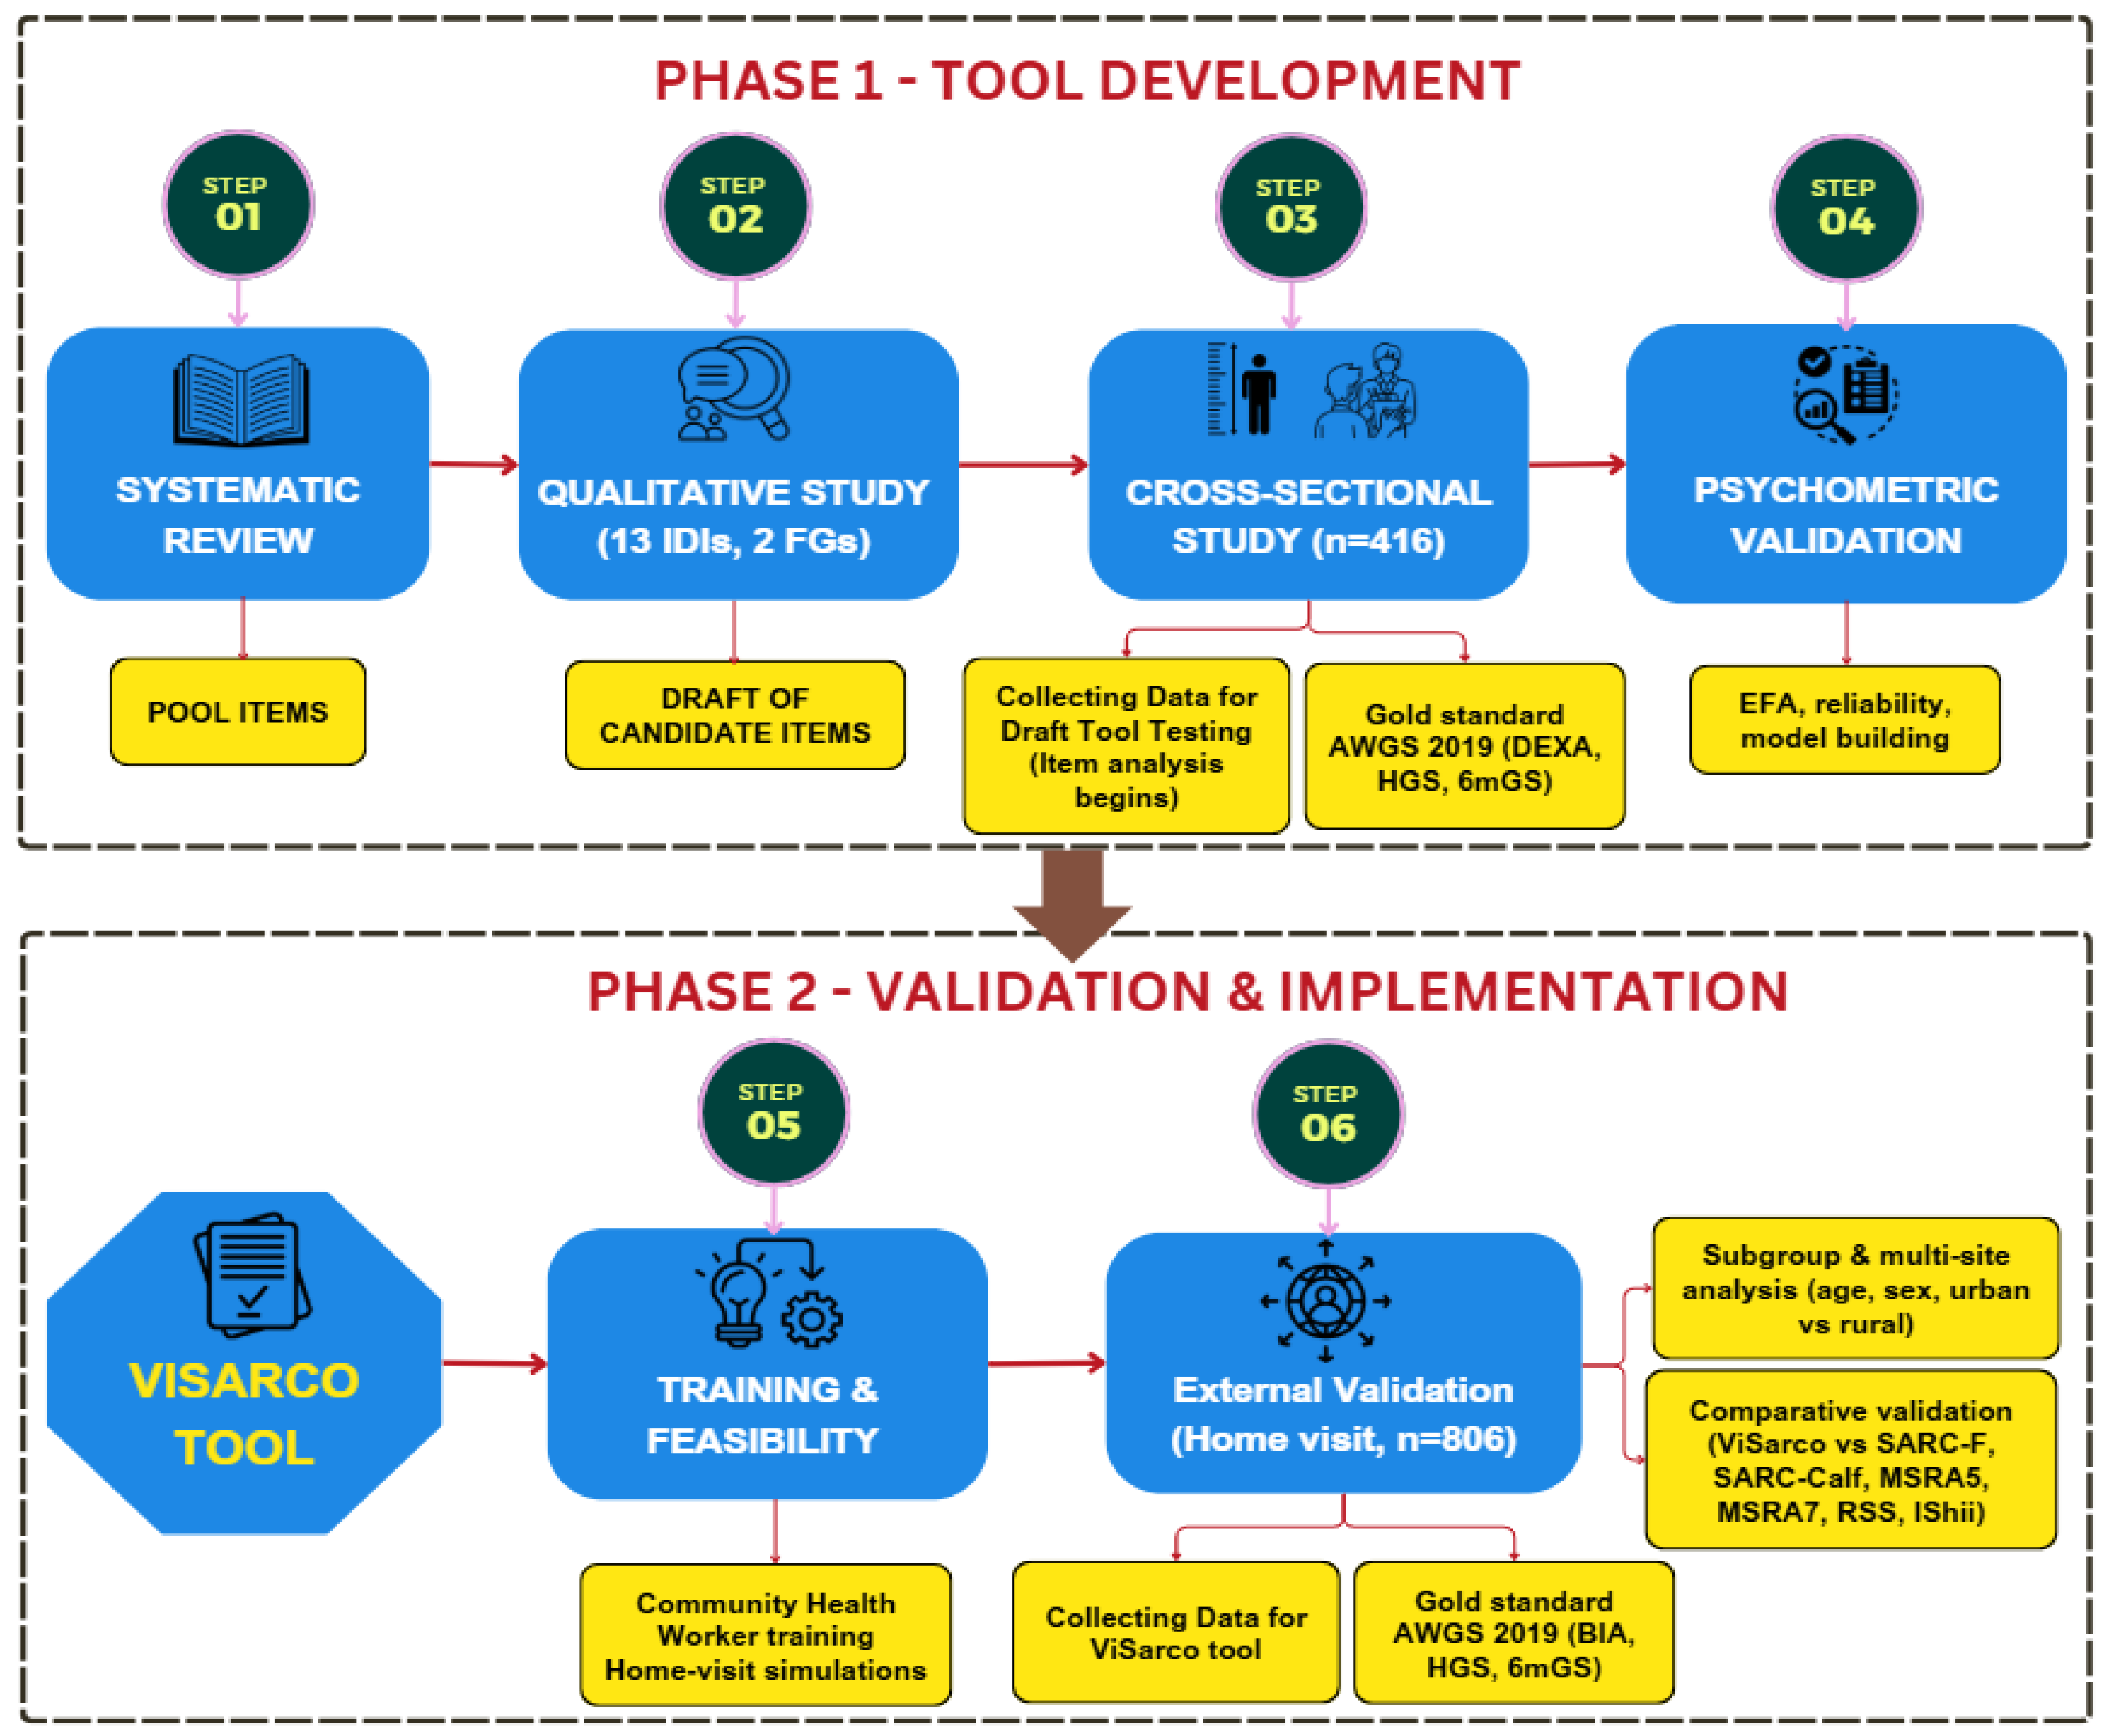
Figure 2.
Scree plot of initial eigenvalues from exploratory factor analysis.
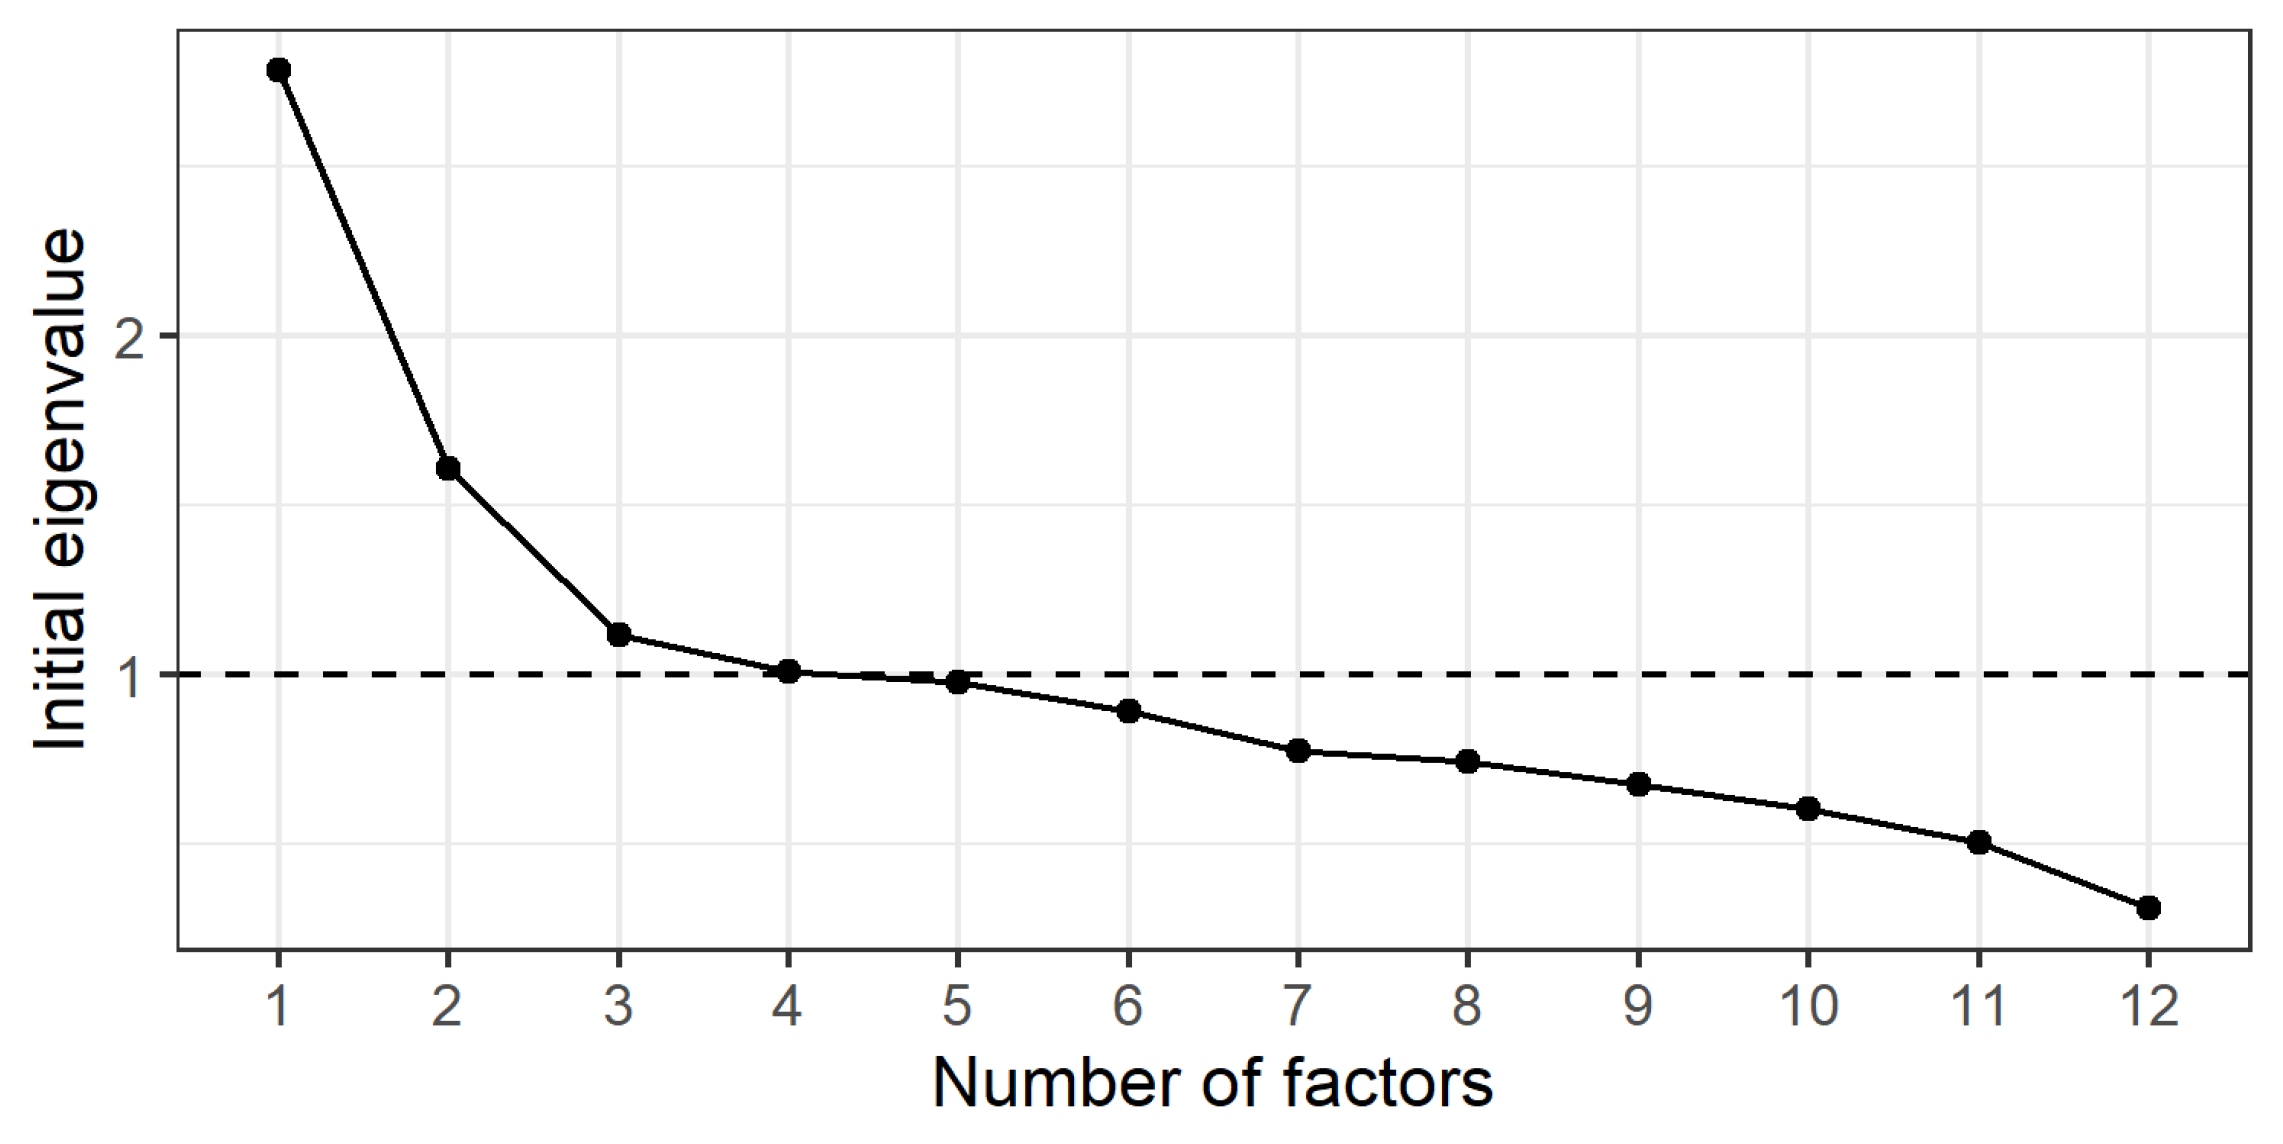
Table 1.
Results of univariate logistic regression for candidate item selection.
| No. | Candidate Items | OR | p_OR | AUC (95% CI) | p_AUC |
|---|---|---|---|---|---|
| I.1 | Trouble moving in room | 0.89 | 0.56 | 0.51(0.47-0.56) | 0.28 |
| I.2 | Walks faster than peers | 1.13 | 0.52 | 0.52(0.46-0.56) | 0.26 |
| I.3 | Struggles to lift 5 kg | 1.43 | 0.08 | 0.54(0.49-0.59) | 0.04 |
| I.4 | Struggles to stand up | 1.11 | 0.58 | 0.51(0.47-0.56) | 0.29 |
| I.5 | Falls in the past year | 1.15 | 0.60 | 0.51(0.47-0.54) | 0.30 |
| I.6 | Wring out towels or clothes | 1.33 | 0.23 | 0.52(0.48-0.56) | 0.12 |
| I.7 | Feeling muscle strength vs. peers (weaker) | 1.93 | 0.003 | 0.57(0.53-0.61) | 0.001 |
| I.8 | 70 years and older | 2.16 | <0.001 | 0.59(0.54-0.63) | <0.001 |
| I.9 | Walking ability | 1.15 | 0.48 | 0.52(0.47-0.57) | 0.24 |
| I.10 | Protein intake frequency | 1.07 | 0.81 | 0.5(0.47-0.54) | 0.41 |
| I.11 | Enough 3 meals | 0.87 | 0.54 | 0.51(0.47-0.55) | 0.27 |
| I.12 | Hospitalizations last year | 1.88 | 0.008 | 0.55(0.51-0.59) | 0.004 |
| I.13 | Weight loss last year | 1.89 | 0.01 | 0.55(0.51-0.59) | 0.06 |
| 1.14 | Gender male | 2.17 | <0.001 | 0.58(0.54-0.63) | <0.001 |
| 1.15 | >=3 chronic diseases | 1.99 | 0.01 | 0.55(0.51-0.58) | <0.001 |
| I.16 | Smoking | 1.31 | 0.34 | 0.52(0.48-0.55) | 0.17 |
| I.17 | Drinks alcohol | 0.78 | 0.57 | 0.50(0.48-0.52) | 0.44 |
| I.18 | Daily sleep hours. | 1.21 | 0.38 | 0.52(0.48-0.56) | 0.19 |
| I.19 | Follow a diet | 1.29 | 0.33 | 0.52(0.48-0.55) | 0.16 |
| I.20 | Ring finger | 3.29 | <0.001 | 0.64(0.60-0.69) | <0.001 |
| I.21 | BMI_Vn threshold | 13.1 | <0.001 | 0.77(0.73-0.81) | <0.001 |
| I.22 | Waist_Vn threshold | 5.23 | <0.001 | 0.69(0.65-0.74) | <0.001 |
| I.23 | AC_Vn threshold | 5.41 | <0.001 | 0.70(0.65-0.74) | <0.001 |
| I.24 | CC_Vn threshold | 4.60 | <0.001 | 0.68(0.64-0.73) | <0.001 |
| I.25 | 5-CST | 1.35 | 0.13 | 0.54(0.49-0.58) | 0.07 |
| I.26 | Balance test_feet together stand | 5511049 | 0.98 | 0.51(0.50-0.52) | 0.02 |
| I.27 | Balance test_semi-tandem stand | 2.34 | 0.05 | 0.52(0.50-0.55) | 0.02 |
| I.28 | Balance test_tandem stand | 1.65 | 0.03 | 0.54(0.50-0.59) | 0.02 |
Table 4.
Top five models selected based on posterior probability and BIC (BMA results).
| Items | PIP (%) | Post-mean β (SD) | Model 1 | Model 2 | Model 3 | Model 4 | Model 5 |
|---|---|---|---|---|---|---|---|
| BMI_Vn | 100 | 0.44(0.05) | 0.43 | 0.49 | 0.42 | 0.42 | 0.41 |
| Waist_Vn | 4 | 0.001(0.01) | . | . | . | . | 0.03 |
| AC_Vn | 85.6 | 0.12(0.06) | 0.14 | . | 0.14 | 0.14 | 0.13 |
| Ring finger | 6.9 | 0.004(0.02) | . | . | . | 0.05 | . |
| CC_Vn | 100 | 0.19(0.04) | 0.18 | 0.21 | 0.18 | 0.17 | 0.19 |
| Feeling muscle strength vs. peers | 8.3 | 0.004(0.02) | . | . | 0.06 | . | . |
| Weight loss last year | 0.0 | 0.00(0.00) | . | . | . | . | . |
| nVar | 3 | 2 | 4 | 4 | 4 | ||
| r2 | 0.36 | 0.34 | 0.36 | 0.36 | 0.36 | ||
| BIC | -164.83 | -161.76 | -160.66 | -160.31 | -159.19 | ||
| Post prob | 0.67 | 0.14 | 0.08 | 0.07 | 0.04 |
Table 5.
Stepwise selection process and cumulative R² by step.
| Step | Variable | R² | Adj. R² | Beta | Std. Beta | SE | t | p |
|---|---|---|---|---|---|---|---|---|
| 0 | Base Mode | 0.000 | 0.000 | 0.17 | - | 0.03 | 5.23 | <0.001 |
| 1 | BMI_Vn (+) | 0.302 | 0.301 | 0.43 | 0.43 | 0.05 | 9.27 | <0.001 |
| 2 | CC_Vn (+) | 0.342 | 0.338 | 0.18 | 0.18 | 0.04 | 4.32 | <0.001 |
| 3 | AC_Vn (+) | 0.356 | 0.351 | 0.13 | 0.13 | 0.05 | 3.02 | 0.003 |
Table 6.
Logistic regression coefficients and assigned scores for ViSarco items (backward selection model).
Table 6.
Logistic regression coefficients and assigned scores for ViSarco items (backward selection model).
| Items | OR | 95% CI | Regression coefficient | Assigned score* | Score |
|---|---|---|---|---|---|
| BMI_Vn threshold | 8.18 | (4.87-14.04) | 2.10 | 2.84 | 2 |
| AC_Vn threshold | 2.10 | (1.26-3.47) | 0.74 | 1.00 | 1 |
| CC_Vn threshold | 2.81 | (1.73-4.58) | 1.03 | 1.39 | 1 |
* Assigned scores were calculated by dividing each regression coefficient by the smallest coefficient in the model, followed by rounding the result to the nearest whole number.
Disclaimer/Publisher’s Note: The statements, opinions and data contained in all publications are solely those of the individual author(s) and contributor(s) and not of MDPI and/or the editor(s). MDPI and/or the editor(s) disclaim responsibility for any injury to people or property resulting from any ideas, methods, instructions or products referred to in the content. |
© 2025 by the authors. Licensee MDPI, Basel, Switzerland. This article is an open access article distributed under the terms and conditions of the Creative Commons Attribution (CC BY) license (http://creativecommons.org/licenses/by/4.0/).
Copyright: This open access article is published under a Creative Commons CC BY 4.0 license, which permit the free download, distribution, and reuse, provided that the author and preprint are cited in any reuse.


