Submitted:
09 July 2025
Posted:
10 July 2025
You are already at the latest version
Abstract
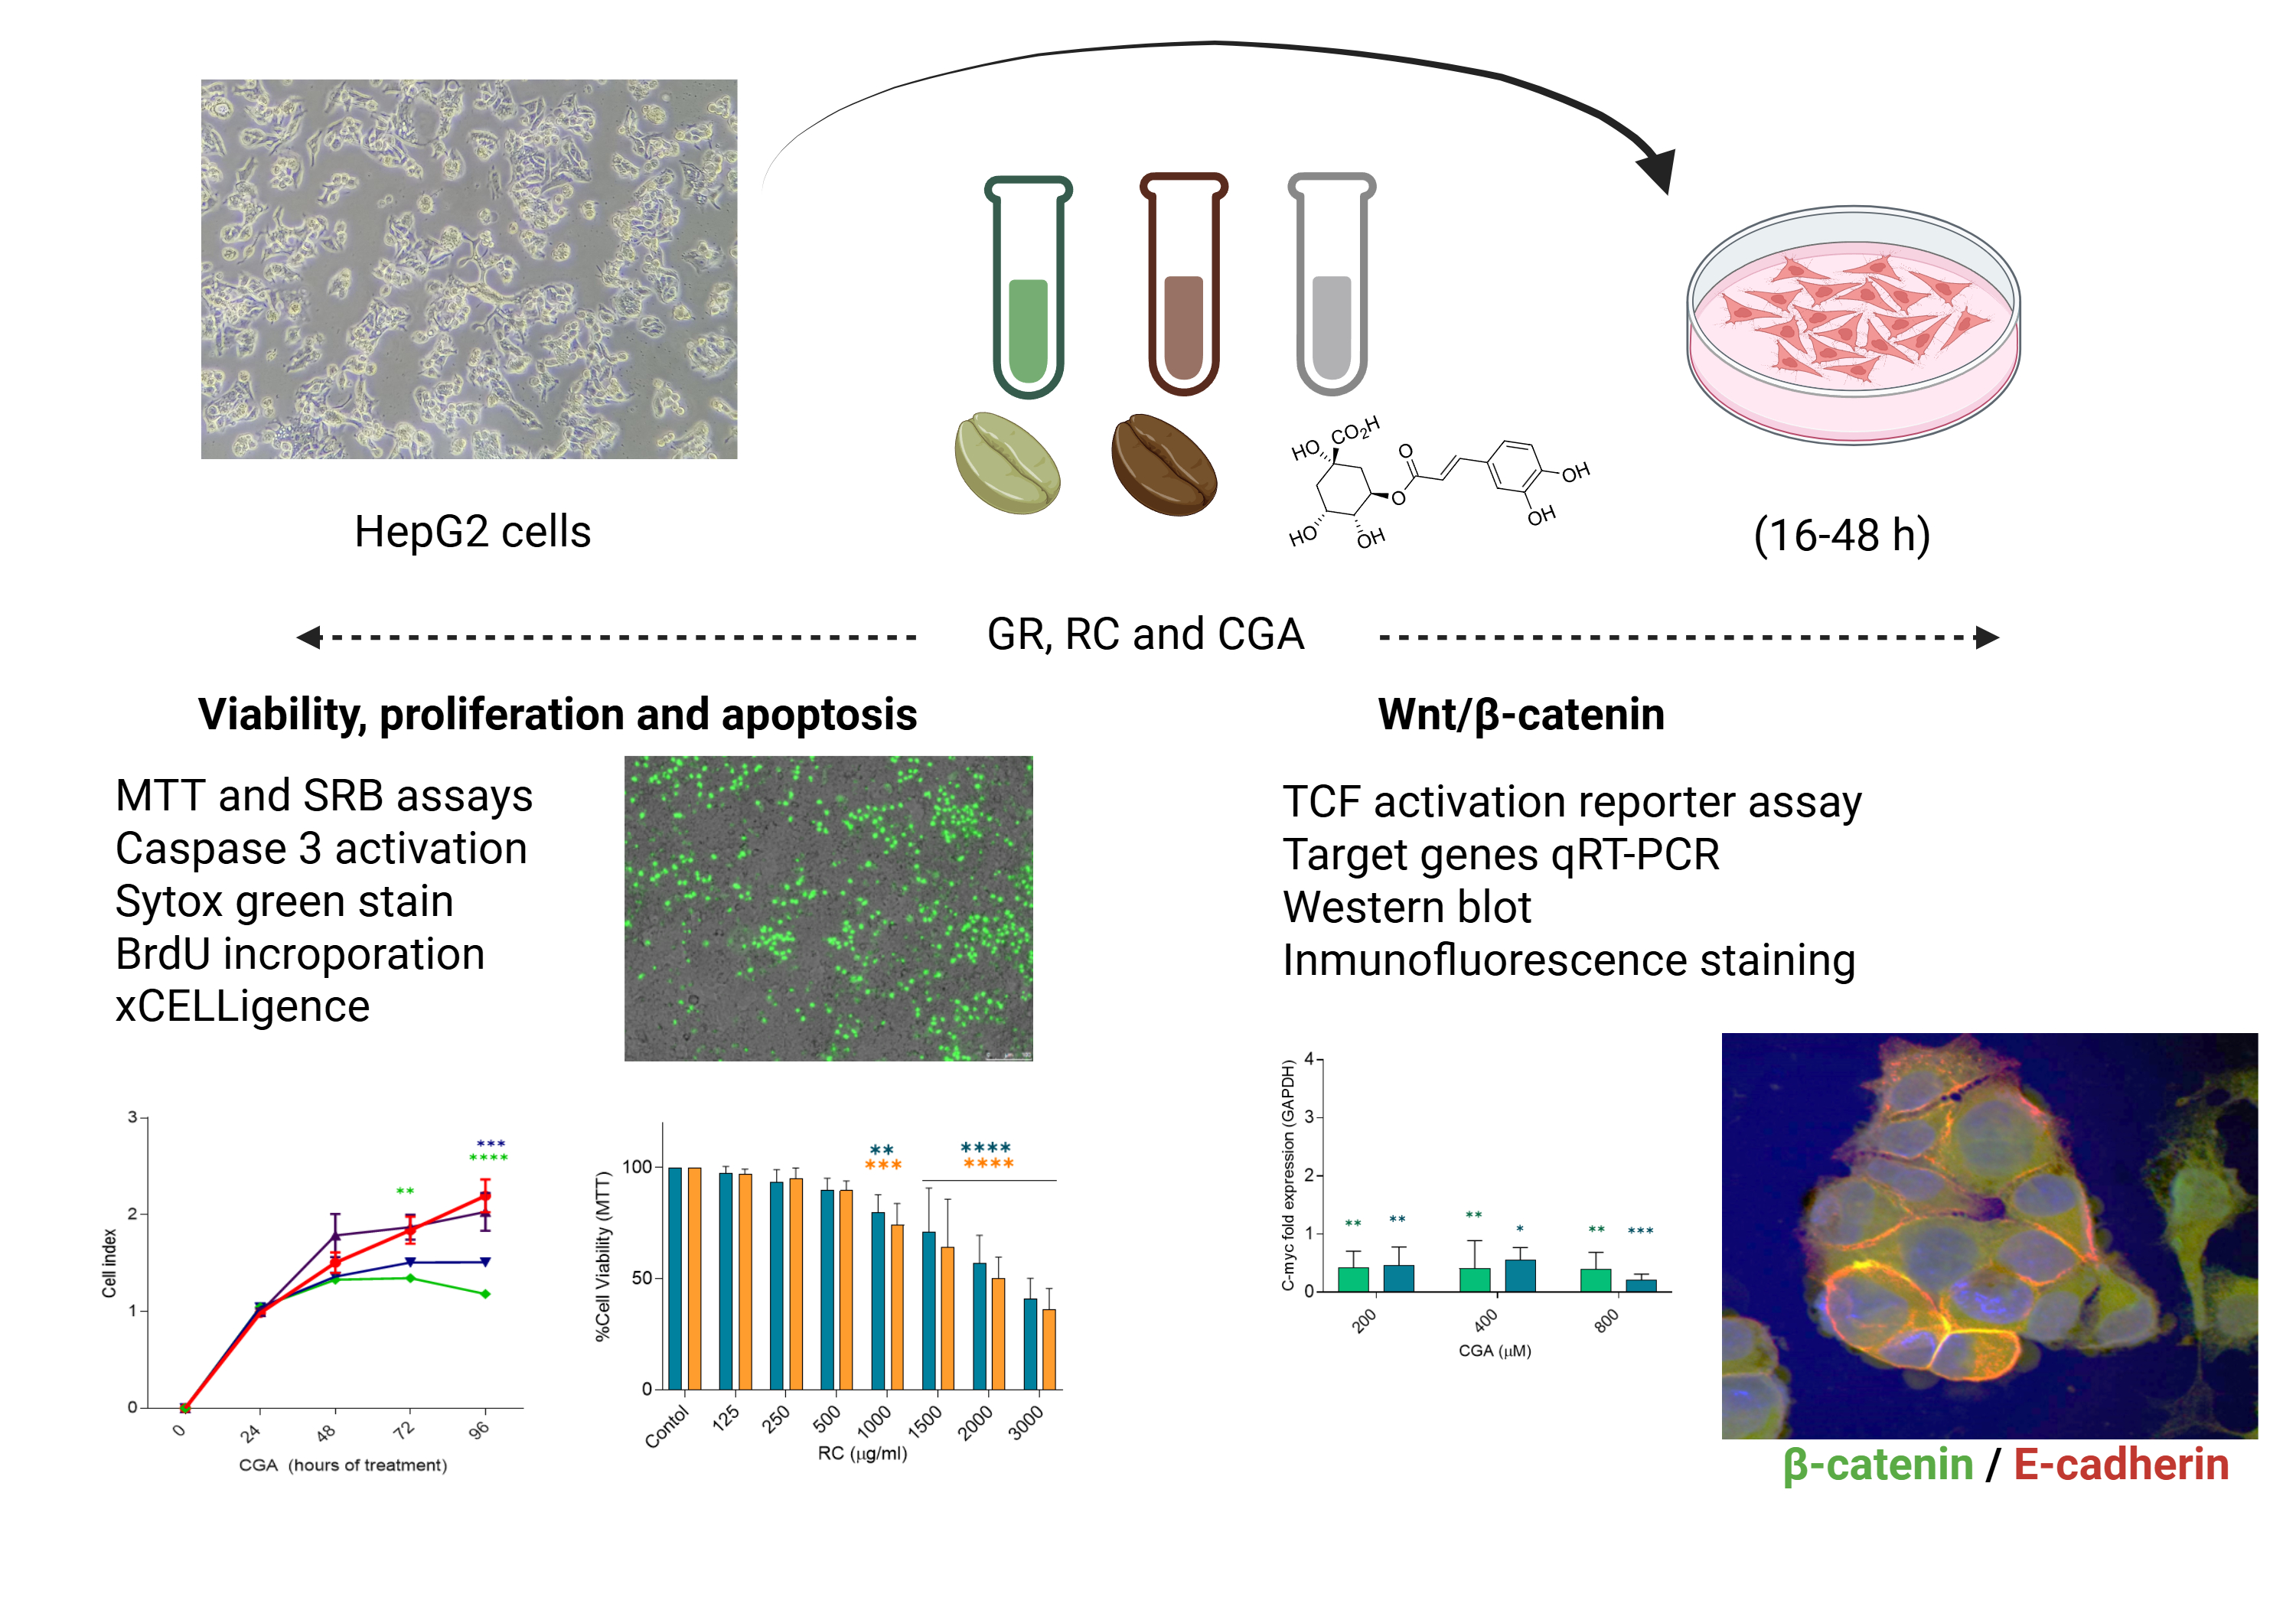
Hepatocellular carcinoma (HCC) is the most common type of liver cancer. It is associated with poor clinical prognosis and a high mortality, despite the advances related to therapeutic options for HCC. Therefore, exploring alternative therapeutic options and its associated mechanisms is relevant and urgently needed. Natural products may be an important source of novel anti-cancer compounds. Coffee consumption is associated with protective effects against liver diseases, but the molecular mechanisms underlying these benefits remain poorly understood. In this study, we evaluated the in vitro effects of green (GC) and roasted coffee (RC) extracts, alongside chlorogenic acid (CGA), on the proliferation of HepG2 hepatocellular carcinoma cells. Both coffee extracts and CGAs significantly reduced the viability and proliferation of HepG2 cells in a dose-dependent manner. GC at 500 µg/ml and CGA at 400 and 800 µM significantly induced caspase-3 activity. In addition, HepG2 cells treated with coffee extracts (500 and 1000 µg/ml) resulted in dose-dependent membrane permeabilization, leading to an increased number of necrotic cells. Despite these anti-proliferative effects, TOP/FOP luciferase assays revealed minimal activation of the Wnt/β-catenin signaling pathway. Among canonical Wnt target genes, only c-Myc expression was notably downregulated after treatment. Moreover, β-catenin protein levels and subcellular localization remained largely unchanged. These findings suggest that coffee extracts and chlorogenic acids inhibit HepG2 cell proliferation, highlighting their hepatoprotective properties, even in cells containing mutations that constitutively activate Wnt signalling.
Keywords:
coffee extracts
; chlorogenic acid
; hepatoma cell line
; cell proliferation
; Wnt/β-catenin signaling
1. Introduction
Hepatocellular carcinoma (HCC) is the most common liver cancer type. Although the global cancer mortality rate has been declining since 2022, incidence and mortality from liver cancer continue to rise. In 2025, liver cancer-related deaths were 809.259 compared to 758.725 in 2022 [1]. Despite advancements in therapeutic strategies, mortality rates for liver cancer have remained stable due to a lack of prevention strategies, tumor heterogeneity, and frequent resistance to chemotherapy treatments [2], resulting in a poor clinical prognosis related to HCC [3]. Hepatocarcinogenesis involves a complex process of chronic inflammation leading to liver fibrosis and cirrhosis, accompanied by aberrant activation of cellular signaling pathways [4]. The development of HCC is linked to genetic and epigenetic alterations in various genes such as c-MYC, AXIN1, and TP53, which deregulate critical cellular pathways related to proliferation, differentiation, and cell survival [5]. The Wnt/β-catenin pathway, in particular, plays a central role in this process, as its aberrant activation in many cases of HCC contributes to the uncontrolled proliferation of hepatocytes and resistance to treatments [6]. This pathway has been extensively studied, and although some drugs targeting this signaling pathway are in the research phase, a full understanding of their preventive and therapeutic implications remains a significant challenge [7]. Considering the key role of the Wnt/β-catenin signaling pathway in HCC tumorigenesis, progression, and therapy resistance, targeting this pathway may be a new potential therapeutic approach for HCC patients [8,9].
Currently, there is an increasing interest in chemopreventive and chemotherapeutic effects of natural products-derived compounds from dietary sources [10,11]. Coffee consumption is inversely associated with the development of metabolic diseases and chronic liver diseases [12], and recent evidence also indicates that coffee consumption decreases the risk of adverse clinical outcomes in chronic liver disease [13]. Studies have also shown that coffee consumers are less likely to develop liver fibrosis, a precursor to cirrhosis and liver cancer [14]. Preventive effects of coffee in liver cancer have also been explored, showing that regular coffee consumption is associated with a significant reduction in HCC risk [15]. Mechanisms associated with the protective effects of coffee against liver cancer include coffee's ability to mitigate liver damage, reduce inflammation, and even lower cancer cell proliferation [16]. Coffee includes thousands of bioactive compounds, of which caffeine and chlorogenic acids (CGA) have been linked with liver-protective effects [17,18].
Experimental studies have shown that CGAs decrease oxidative stress, cell proliferation, and reduce inflammation, supporting their therapeutic potential in HCC [5]. Likewise, experimental evidence demonstrated that coffee-derived components can reduce liver fibrosis and modulate key signaling pathways associated with carcinogenesis, such as the Wnt/β-catenin pathway [19,20]. Moreover, CGAs have demonstrated toxicity to HepG2 cells and reducing their proliferation. CGA treatment was also related to reduction of tumor size in mouse models [16]. Nevertheless, the molecular mechanisms related to the protective effect of coffee against HCC are not fully elucidated yet. Likewise, experimental models exploring the biological effects of coffee extracts in hepatoma cell lines are still limited, and the regulation of key signaling pathways such as Wnt/β-catenin in this context is still unclear. Although some compounds derived from natural products have shown inhibitory effects on this pathway in cancer models, research on coffee compounds in this context remains limited. In this study, we evaluate the antiproliferative effects of Colombian coffee extracts and CGA on HepG2 cells and its relation to the Wnt/ β-catenin signaling.
2. Materials and Methods
2.1. Cells and Treatments
Experiments were performed in HepG2 cell line (ATCC HB8065). Cells were cultured in DMEM medium (D6429 GIBCO, Life Technologies, NY, USA) supplemented with 10% FBS (Ref. 10438026 GIBCO), 1% penicillin-streptomycin (Ref. 15140122 GIBCO), 1% sodium pyruvate (Ref. 11360070 GIBCO), and 1% MEM non-essential amino acids (Ref. 11140050 GIBCO). Cultures were maintained at 37°C in a humidified atmosphere with 5% CO₂. For treatment with coffee extracts, coffee beans (Coffea arabica) were provided by Natucafé, which were harvested from the La Arboleda farm, located in the Andes municipality, Antioquia, Colombia. Coffee extracts were prepared from both roasted and green (almond) beans and were characterized for total phenolic content and in vitro antioxidant activity by DPPH and FRAP assay. These results are available in the publication of Villota and Moreno et al. [21]. Chlorogenic (3-(3,4-Dihydroxycinnamoyl) quinic acid, ≥95% (C3878-1G, Sigma Aldrich,) was prepared at 50 mM, aliquoted, and stored at –20°C. All treatments were diluted in DMEM supplemented with 10% FBS and 1% penicillin-streptomycin, without sodium pyruvate or non-essential amino acids. Cells were seeded and cultured for 24h, after which they were treated once with different concentrations of roasted coffee extracts (RC), green coffee extracts (GC) (125-3000 µg/ml) or Chlorogenic acids (CGA) (100-1600 µM), for 16 h, 24 h or 48 h.
2.2. Cell Viability/Cytotoxicity Measurements
Cell viability was determined by two different assays: MTT assay (Sigma Aldrich M5556) and sulforhodamine B assay (SRB) (Sigma Aldrich 3520-421), which evaluate metabolic activity of viable cells. HepG2 cells were seeded in 96-well plates at a density of 10⁴ cells/well and incubated overnight for treatment with green coffee and roasted coffee extracts (125–3000 µg/mL), and with Chlorogenic acid (100–1600 µM), for 24h and 48h. For MTT assay, 10 µL of MTT (5 mg/mL) was added to each well and cells were incubated for 4 hours. The medium was then removed, and 100 µL of DMSO was added to solubilize the formazan crystals. For the SRB assay, cells were fixed after treatment with 50% trichloroacetic acid for one hour at 4°C. The following day, 100 µl of SRB 0.4% was added to each well, and fixed cells were incubated for 30 min at room temperature. Cells were washed with 1% acetic acid. Absorbance was measured using a spectrophotometer at 570 nm and 490 nm, for the MTT and SRB assay, respectively. Results were calculated as a percentage of cell viability relative to non-treated control cells. Percentage of cell viability: (absorbance of treated cells−absorbance of background controls)/ (absorbance of nontreated cells−absorbance of background controls)
2.3. Cell Death Assessment
To determine apoptosis, caspase-3 enzyme activity was assayed as described previously. Fluorescence was quantified using a spectrofluorometer using an excitation wavelength of 380 nm and an emission wavelength of 460 nm. Arbitrary fluorescence units were normalized to the control condition and expressed as fold increase compared to non-treated control cells. Additionally, SYTOX® green nucleic acid stain (S7020 Invitrogen, Carlsbad, CA, USA) was used as previously reported for staining of necrotic cells. HepG2 cells were treated with different concentrations of green coffee and roasted coffee extracts (125-1000ug/ml) and chlorogenic acids (100-1000 µM) compounds for 48h. SYTOX green solution (125 nmol/L) was added to the cells after the treatment for 15 min at 37 °C in a 5% (v/v) CO2-containing atmosphere. Nuclei of necrotic cells with disrupted membrane integrity were stained green and visualized using a Leica DMI6000 fluorescence microscope (Leica, Amsterdam, The Netherlands) at 512–542 nm. SYTOX green-positive cells were quantified using ImageJ. The total number of SYTOX-positive cells (green nuclei) was counted per image, and three different images were analyzed per condition. To avoid bias because of high cell death percentage in some conditions, normalization was performed for each image by calculating cell area percentage (cell confluency), and the relative number of SYTOX-positive cells was calculated compared to the non-treated cells.
2.4. Cell Proliferation Assays
Cell proliferation was determined by the BrdU Cell Proliferation Assay (11669 915001, Merck). HepG2 cells were cultured in black 96-well plates and treated with green coffee, roasted coffee extracts (100–1000 µg/ml) or CGA (100–800 µM) and incubated for 24h and 48h, and then incubated with BrDU for 3 hours. After that, cells were fixed, and anti-BrdU-POD conjugated antibody was added and incubated for 90 minutes at room temperature. Chemoluminescence was measured using a luminometer reader. Results are expressed as a percentage of cell proliferation, taking as 100% untreated HepG2 cells. HepG2 cell proliferation was also assessed using a real-time cell analyzer (XCelligence RTCA DP, ACEA Biosciences), which measures electron flow across gold microelectrodes at the bottom of culture plates. Adherent cells block the electric current, and this impedance is expressed as arbitrary units (cell index). Cells were cultured in XCelligence plates (96-well plates, 10⁴ cells/well) and treated with coffee extracts (125–1000 µg/ml) and CGA (200–800 µM). Cell index was monitored from 0 h until 96 h of culture.
2.5. TOP/FOP Luciferase Reporter Assay
Wnt/β-catenin signaling activation was first evaluated using TOP/FOP luciferase reporter system. HepG2 cells were seeded in 12-well plates (0.5x10⁶ cells/well) and were transiently transfected with 1 µg of each TOP flash (wildtype TCF binding sites) or FOP flash (mutated TCF binding sites) plasmids (Millipore) using Lipofectamine 3000 (L3000015, Invitrogen). Transfected cells were incubated with green coffee, roasted coffee extracts, and CGA for 24 h. Luciferase activity was determined using a Luciferase Assay System (Promega) according to the manufacturer's protocol.
2.6. Wnt/β-Catenin Related Genes RNA and Protein Expression
For RNA analysis, cells were harvested 16h and 24h after treatment. To evaluate the effect of green and roasted coffee extracts (250-1000 µg/ml) and chlorogenic acid (200-800 µM) on the modulation of Wnt/β-catenin signaling, mRNA levels of Wnt/β-catenin related genes: Axin2, c-myc, β-catenin, and E-cadherin were determined. Total RNA was isolated using TRIzol (Sigma-Aldrich) according to the manufacturer’s instructions First-strand cDNA synthesis was performed using a reverse transcription kit (Ref. EP0442, Thermofisher), using 2.0μg of total RNA, 1X RT buffer (500 mmol/L Tris-HCl [pH 8.3]; 500 mmol/L KCl; 30 mmol/L MgCl2; 50 mmol/L DTT), 1 mmol/L deoxynucleotides triphosphate (dNTPs, R0191), 10 ng/μL random nanomers (Sigma-Aldrich), 0.6 U/μL RNaseOUT™ (Invitrogen, Carlsbad, CA, USA) and 4 U/μL M-MLV reverse transcriptase (Invitrogen) at a final volume of 20 μL. The cDNA synthesis program was 25 °C/6 min, 42 °C/60 min, and 70 °C/6 min. Complementary DNA (cDNA) was diluted 20× in nuclease-free water. Real-time qPCR was carried out in a CFX96 thermal cycler (Bio-Rad) using Maxima SYBR Green qPCR Master Mix (2X) kit (Ref. K0252, Thermo Fisher). For qPCR, 2× reaction buffer, 10 μmol/L of sense and antisense primers were used (Table S1). The PCR program comprised 5-minute enzyme activation and denaturation phase at 95°C, followed by 40 cycles of 15 seconds at 95°C and one minute at 60°C. mRNA levels were normalized to the GAPDH housekeeping gene and further normalized to the mean expression level of the control. Primer sequences are listed in Supplementary Table S1. For Western blot analysis, HepG2 cells were resuspended using lysis buffer containing 25 mM HEPES, 150 mM KAc, 2 mM EDTA, and 0.1% NP-40 and protease inhibitors (Sigma-Aldrich). Protein concentrations were quantified using the Bio-Rad Protein Assay (Bio-Rad). Proteins were separated by 7.5–10% gradient sodium dodecyl sulfate (SDS)-polyacrylamide gel electrophoresis. Semi-dry blotting was performed using a Trans-Blot Turbo Midi Nitrocellulose Membrane with Trans-Blot Turbo System Transfer (BioRad). Ponceau S 0.1% w/v (Sigma-Aldrich) staining was used to confirm protein transfer. Specific antibodies were used to detect β-catenin and E-cadherin andGAPDH (Calbiochem #CB1001) was used as a loading control. Blots were analyzed with a ChemiDoc XRS system (Bio-Rad). Protein band intensities were quantified by ImageLab 6.1 software (BioRad).
2.7. β-Catenin and E-Cadherin Immunofluorescent Staining
To assess subcellular localization of β-catenin and E-cadherin, cells were seeded on glass coverslips and treated for 16, 24, and 48 h with coffee extracts or CGA. After treatment, cells were fixed in 4% paraformaldehyde for 10 min, permeabilized with 0.1% Triton X-100 and stored in PBS/Glycerol (50:50) solution at -20°C until further use. Cells were subsequently washed with 1X PBS and blocked with fetal bovine serum for 45 min. Cells were then incubated with a rabbit anti-E-cadherin polyclonal antibody (CD324, Thermo Fisher info antibody) diluted 1:500 in TBS-T at 4°C overnight. Cells were then washed three times with PBS for 10 min , followed by incubation with an anti-rabbit IgG-IgG-conjugated secondary antibody (Alexa Fluor 546, Thermo Fisher) diluted 1:200 was added at 4°C for 60 min. Cells were washed again three times with PBS for 10 min, followed by incubation with a mouse anti-β-catenin polyclonal antibody (PA5-77934, Ivitrogen) diluted 1:500 at 4°C for 60 min, washed three times with PBS for 10 min and an anti-mouse IgG-conjugated secondary antibody (Alexa Fluor 488, Thermo Fisher) diluted 1:500 was added at 4°C for 60 min. Finally, the slides were washed three times with PBS, incubated with 2 µg/ml Hoechst 33258 (H1398, Thermo Fisher) at 4°C for 10 minutes, washed three times with PBS. Slides were mounted using Fluorsave reagent (Thermo Fisher). Images were visualized using an Olympus IX81 confocal microscope coupled to a spinning disk (DSU) and epifluorescence (Thermo Fisher) with three reading channels (Hoechst: blue, β-catenin: green, E-cadherin: red). For image analysis, the images were converted to 8-bit TIFF format, image processing was standardized for the β-catenin and E-cadherin channels, the "Despeckles" function was applied, and they were segmented using the "Li" algorithm. Finally, colocalization images between both channels were obtained using the "DNA" function of the "Image Calculator" tool. The number of positive pixels for the signals of the markers used, their respective area value (µm2), and the percentage of colocalization between β-catenin and E-cadherin were quantified.
2.9. Statistical Analysis
All the experiments were performed using cells from at least three independent cultures (n = 3) and two replicates for each experimental condition. Normality tests were performed using the Kolmogorov–Smirnov or the Shapiro–Wilk test. The statistical significance of differences between the means of the experimental groups was evaluated using one-way and two-way analysis of variance (ANOVA) and the t-Student test as a post-test. The results are presented as the mean ± standard deviation (mean ± SD). Significant differences were considered when p≤ 0.05. Analyses were performed using GraphPad Prism software 9 (Version 9.4.1, GraphPad Software Inc., San Diego, CA, USA).
3. Results
3.1. Coffee Extracts and CGA Effects in HepG2 Cell Viability
We first evaluated the cytotoxic effect of a range of concentrations of green (GC) and roasted (RC) coffee extracts (125-3000 µg/ml) and for chlorogenic acid (100-1600 µM), after 24 h and 48 h of treatment using the MTT and SRB assays. Cell viability decreased after treatment with GC 500 µg/ml and RC 1000 µg/ml compared to the control. Differences were statistically significant by both methods (Figure 1A). For CGA-treated cells, a significant reduction in cell viability was only observed with 800 µM. These results demonstrated that treatment with coffee extracts—particularly the roasted coffee extract —led to a pronounced reduction in metabolic activity and cellular protein content compared to CGA, suggesting a dose-dependent reduction of cell viability. Roasted Coffee extract induces a greater reduction in cell viability. Based on the MTT and SBR assays, we calculated the half-maximal inhibitory concentration (IC50). We observed that IC50 values determined via MTT were lower for the coffee extracts after 48 hours (GC: 5579 µg/ml; RC: 2377 µg/ml), whereas the SRB assay showed lower IC50 values for CGA at both 24 and 48 hours (4445 µM - 1575,17 µg/ml -, and 3114 µM - 1103,51 µg/ml -, respectively), and for coffee extracts after 48 hours (CV: 4686 µg/ml; CT: 1827 µg/ml). Figure 1 shows the reduction in viability measured by MTT assay (Figure 1, upper panel) and SRB assay (Figure 1, lower panel). Table S2 shows the IC50 values for all the treatments. To compare the IC50 of CGA treatment with those of coffee extracts, we calculated the values for CGA in µM and µg/ml.
3.2. Effects of Coffee Extracts and CGA on HepG2 Cell Death
We also assessed caspase3 activation to assess if coffee extracts and CGA induce apoptosis in HepG2 cells after 16 h and 24 h of treatment. All treatments induced caspase-3 activation after 16 h of treatment, but significant differences were only observed with GC at 500 µg/ml and CGA at 400 and 800 µM (Figure 2). In CGA-treated cells, a dose-dependent increase of caspase-3 activation was observed. These results correlated with results observed for MTT and SBR assays.
Furthermore, to confirm if coffee extracts or CGA treatments induce cell death, SYTOX Green assay was conducted after 48 hours of treatment. Fluorescence microscopy revealed that chromatin in the untreated cell group was only slightly stained with SYTOX Green, indicating an intact plasma membrane. HepG2 cells treated with coffee extracts resulted in dose-dependent membrane permeabilization, leading to an increased number of SYTOX-Green positive cells for concentrations of 500 and 1000 µg/ml of either GC or RC (Figure 2A, C). In addition, for treatment with GC or RC at 1000 µg/ml, an increase of greater than twofold in cell membrane permeability was observed compared to non-treated cells. In contrast, no significant increase of SYTOX-Green positive cells was observed in the CGA-treated cells (100-800 µM) and a decrease in cell death was actually observed after treatment with CGA at 800 µM (Figure 2 B, D). These results confirm that coffee extracts and CGA treatments induce cell apoptosis but only GC and RC extracts are toxic when used at higher concentrations. Based on this, we continued using the same range of concentrations for subsequent experiments
3.3. Coffee Extracts and CGA Inhibit Cell Proliferation of HepG2 Cells
Since we observed that coffee extracts and CGA treatments reduced cell viability and induced apoptosis in HepG2 cells, we next investigated the effect on cell proliferation. First, cell proliferation was measured by BrdU incorporation after 24 h and 48 h treatment with coffee extracts or CGA. As shown in Figure 3, the proliferation rate of HepG2 cells was significantly reduced in treated cells compared to untreated controls after 24 h. For GC and RC extracts, higher reductions of cell proliferation were observed at 250 µg/ml and after 24 h treatment (Figure 3A). However, only CGA-treated cells showed a statistically significant decrease in DNA synthesis after 48 h of treatment.
Additionally, the proliferation kinetics of HepG2 cells were assessed by real-time cell analysis (RTCA) system. The cultured cells were allowed to stabilize for 24 hours, and then treated with GC and RC extracts (125–1000 µg/ml) and CGA (200–800 µM) for 72 hours. Figure 3B shows that CGA treatment, but not RC or GC treatment, reduces the cell index in a dose/time-dependent manner.
3.4. Evaluation of Coffee Extracts and CGA Effect on of β-Catenin Dependent Transcriptional Activity
We observed antiproliferative effects for GC and RC extracts and CGA treatments. Therefore, we assessed the effect of these treatments on the regulation of the Wnt/β-signaling pathway using the TOP/FOP Flash reporter system, which is used to evaluate β-catenin-dependent transcriptional activation. First, HepG2 cells were transfected with the TOP/FOP Flash reporter plasmid and treated with GC, RC extracts (125 and 250 µg/ml) and CGA (100 and 200 µM) for 24 h and 48 h. We also included treatment with recombinant Wnt3a (50 ng/ml) and CT-025 GSK-β inhibitor (2 µM) as a control for Wnt/ β-catenin activation. After 24 h of treatment, GC showed a significant downregulation of the Wnt/ β-catenin pathway (Figure 4A), while RC and CGA had no effect. On the other hand, after 48 hours of treatment, GC 250 µg/ml and RC 250 µg/ml showed an activating effect on the Wnt/ β-catenin pathway. None of the control compounds showed a significant effect.
3.5. Coffee Extracts and CGA Modulate Expression of Wnt/β-Signaling Related Genes
qPCR analysis was used to evaluate the mRNA expression levels of Wnt/β-catenin-related genes, such as AXIN2, MYCC, CTNNB1 (which encodes β-catenin) and CDH1 (which encodes E-cadherin). GAPDH was used as a housekeeping gene to normalize expression levels. HepG2 cells were treated with GC, RC (250- 1000 µg/ml) and CGA (200-800 µM) for 16 and 24 hours.
As shown in Figure 5, CGA induced a significant reduction in c-Myc mRNA levels for all doses and treatment times. In the case of GC, the effect was observed at lower doses and after 16 h treatment and for RC, the effect was evident for all doses at 24 hours of treatment. Only GC at 24 hours of treatment reduced β-catenin mRNA level. On the contrary, E-cadherin mRNA expression was increased by GC and RC at 250 µg/ml of GC and RC at 16 h and 24 h, respectively. None of the treatments affected the expression of Axin2 mRNA. Effects on protein expression of β-catenin and E-cadherin were also assessed by Western blot and immunofluorescent staining. No significant differences in protein expression were detected (Figure 6).
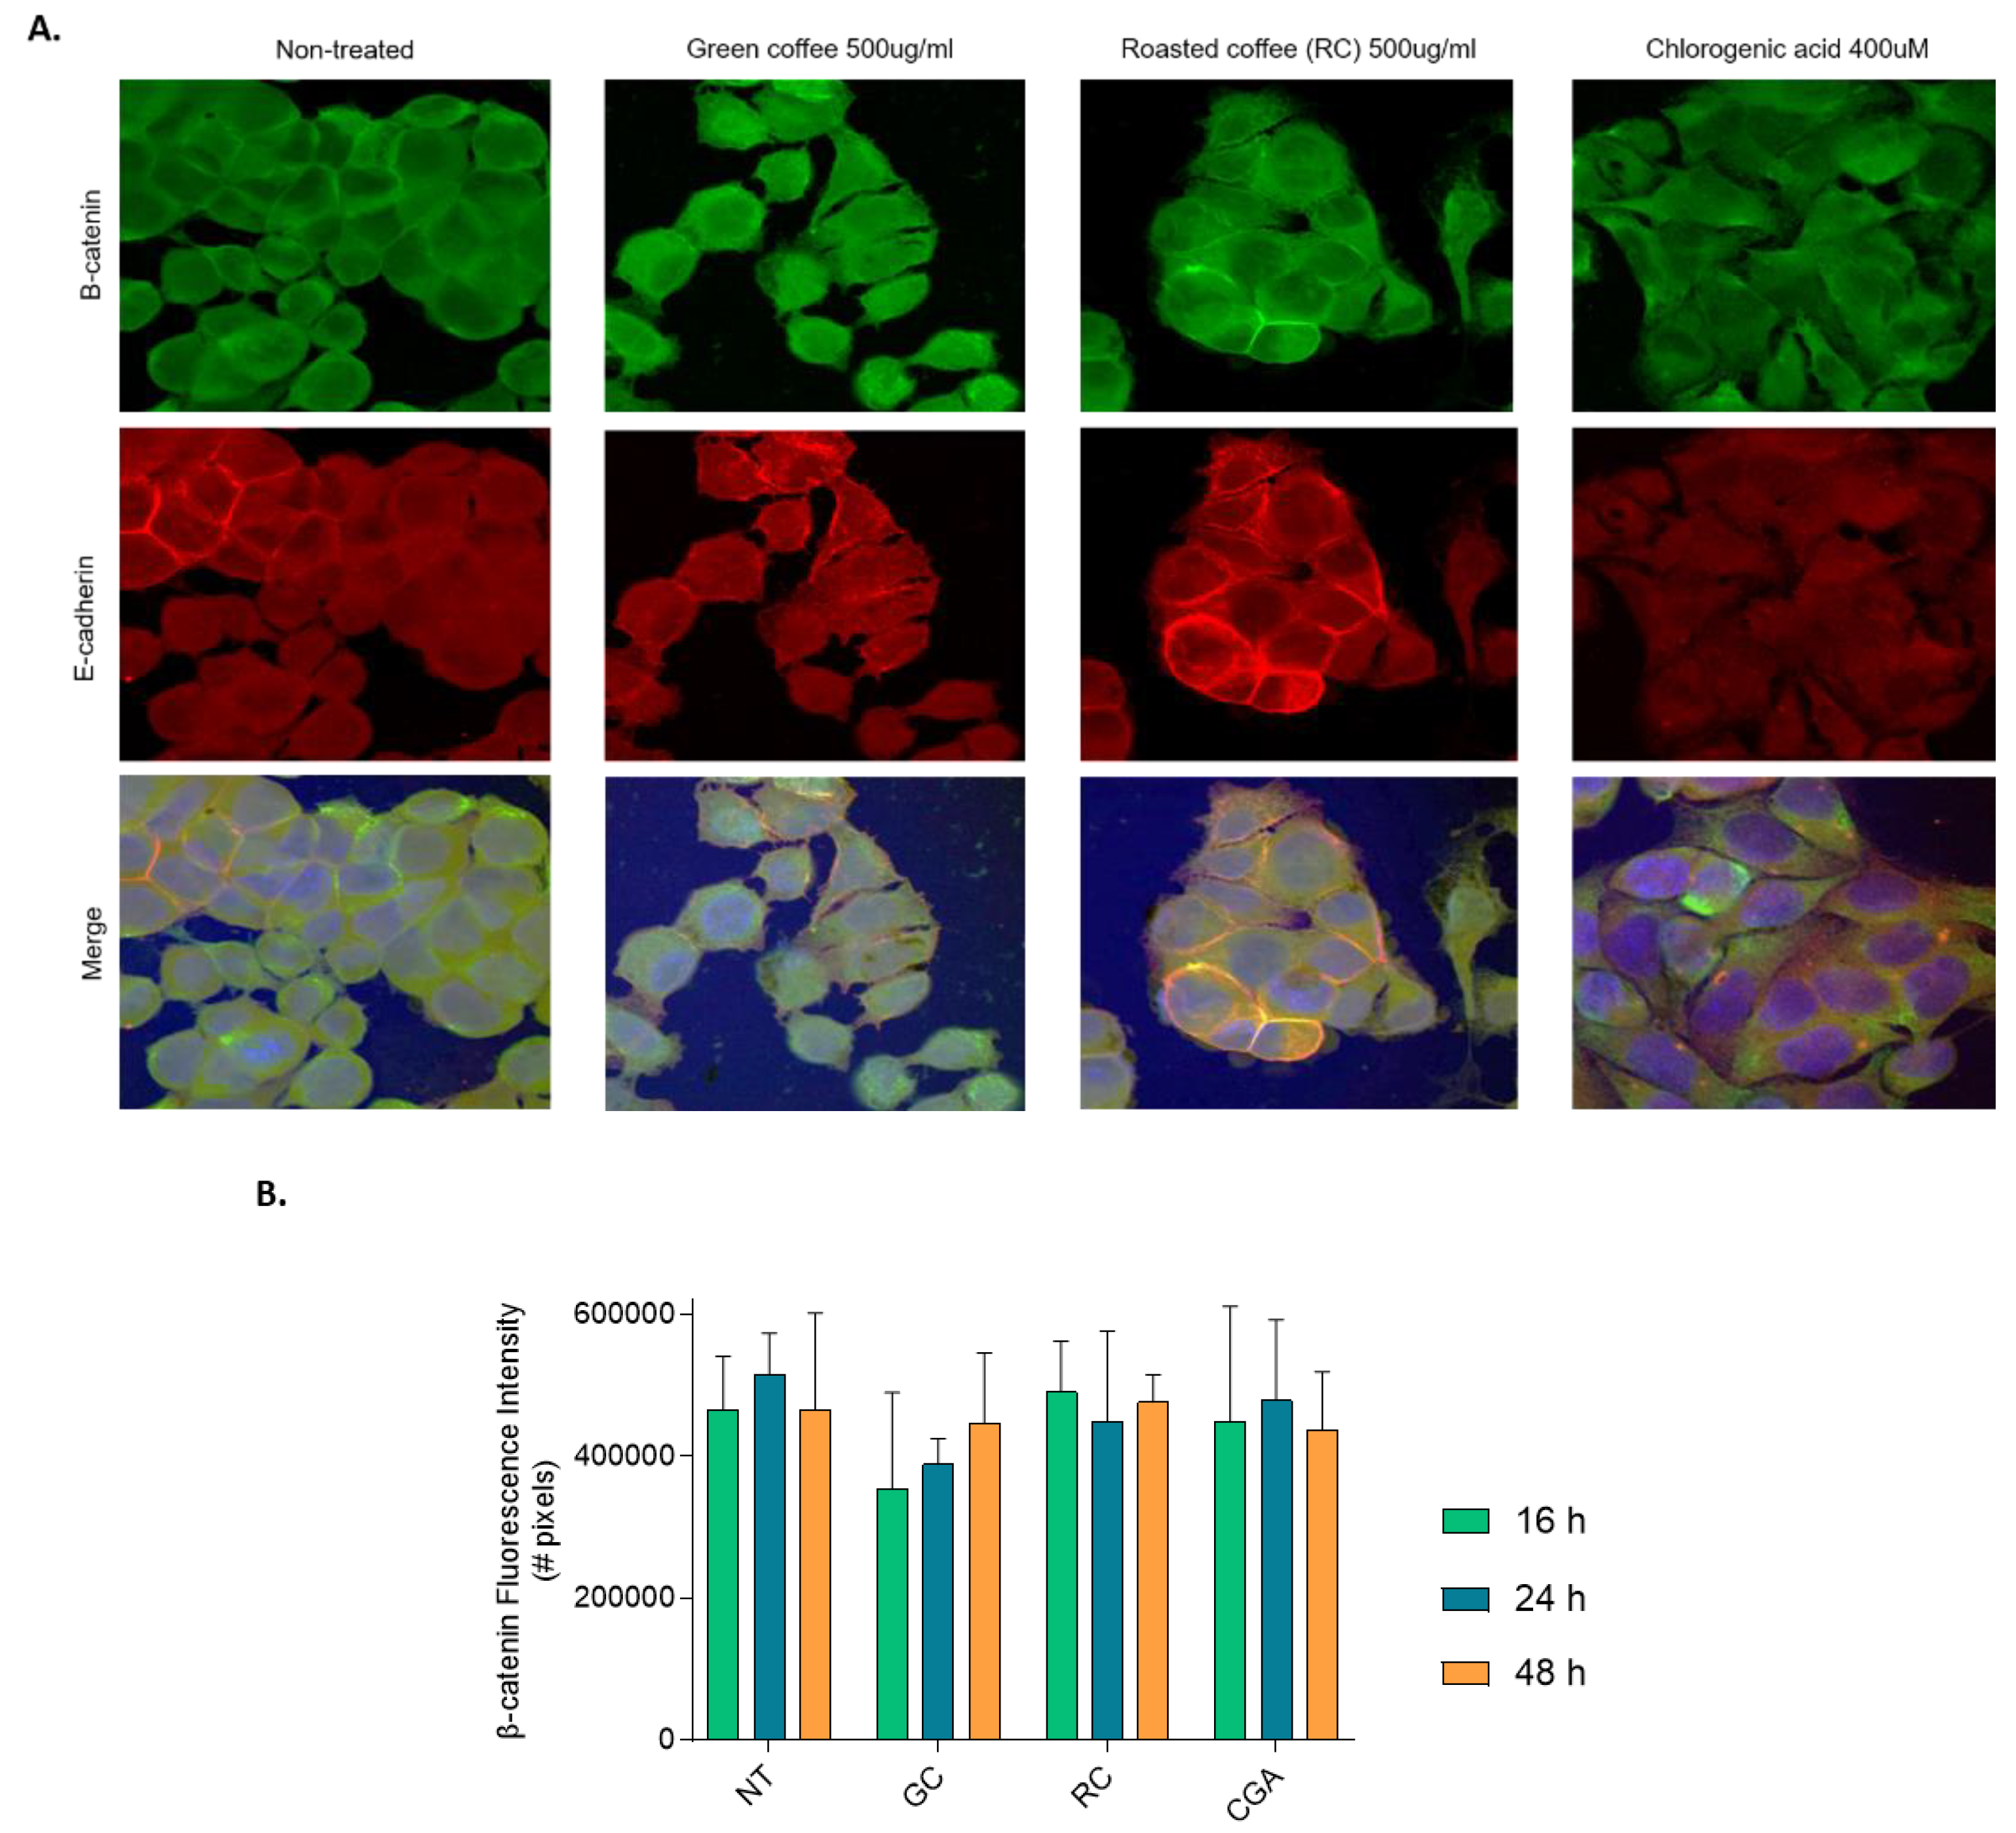
Finally, immunofluorescence staining and confocal microscopy were performed to determine the effect of the treatments on the subcellular localization of β-catenin and E-cadherin proteins in HepG2 cells treated with GC and RC (500 µg/ml) and CGA (400 µM) during 16 h, 24 h, and 48 h. In agreement with the results on mRNA and protein expression, none of the treatments induced changes in either the expression of β-catenin or E-cadherin, or in the percentage of colocalization of both proteins (Figure 7).
4. Discussion
Discovering novel, effective chemopreventive strategies remains a challenge for HCC since conventional therapies based on radiotherapy, chemotherapy, and surgical resection are still ineffective, and are in some cases even associated with a high recurrence rate [22,23]. Although high coffee intake is associated with reduced risk of HCC development, there are still discrepancies between studies and further analysis, including specific groups such as patients with viral hepatitis B or C infection is needed [24].
The evaluation of coffee components as treatment for HCC is challenging, due to the presence of many bioactive compounds in coffee, that vary depending on the species of coffee plant, level of roasting and the brewing method [17,25]. CGA, the main phenolic acid present in green coffee beans has a high antioxidant potential, and is hepatoprotective by reducing inflammation and fibrosis [19,25]. In addition, it has antiproliferative effects on HCC cells in in vivo models [16]. In a previous study from our group, coffee extracts were characterized. We identified CGA as the most abundant phenolic compound, and demonstrated that CGA reduced cell viability and migration in colorectal adenocarcinoma-derived cells [21].
Understanding the role of signaling pathways involved in cancer has become a strategy to find new molecular therapeutic targets [26]. Current evidence shows that the Wnt/β-catenin signaling pathway plays a pivotal role in tumorigenesis, progression, and therapeutic resistance of hepatocellular carcinoma (HCC) cells [27]. Its abnormal activation—through mutations in CTNNB1, inactivation of regulatory proteins like APC or AXIN, or external factors like HBV/HCV infection and alcohol—drives proliferation, metastasis, immune evasion, and cancer stem cell maintenance in HCC [28]. Given its central role, the Wnt/β-catenin axis has become an attractive therapeutic target, with a variety of inhibitors, monoclonal antibodies, and decoy receptors in development [28]. However, clinical translation remains limited due to the involvement of the Wnt/β-catenin pathway in normal tissue homeostasis and concerns about toxicity, thus prompting interest in less toxic, natural inhibitors.
Several bioactive compounds such as curcumin, berberine, emodin, and resveratrol, have been reported to downregulate β-catenin activity, suppress Wnt ligand interactions, or promote β-catenin degradation in preclinical HCC models [29,30]. Recent findings suggest that natural products such as dietary polyphenols and compounds found in coffee have potential as modulators of the Wnt/β-catenin pathway, and at the same time show reduced toxicity and adverse effects [31]. Coffee is rich in bioactive compounds, including a variety of polyphenols and several studies has shown that coffee consumption is associated with reduced risk of liver cancer [32]. This protection can be partially explained by the suppression on Wnt/β-catenin signaling by coffee components via inhibition of oxidative stress and kinase activity [33,34]. These dietary compounds may therefore act as effective chemopreventive, chemotherapeutic or adjuvant agents, offering a complementary strategy to conventional treatments for Wnt-driven liver cancer.
The present study evaluated cytotoxic and antiproliferative effects of green and roasted coffee extracts (GC and RC) and chlorogenic acid (CGA) on HepG2 cells, a hepatocellular carcinoma (HCC) derived cell line. Our findings support that both coffee extracts and CGA show significant antiproliferative effects, demonstrated by inhibition of cell viability and cell proliferation, induction of cell death and modulation of the Wnt/β-catenin signaling pathway. Both GC and RC decreased HepG2 cell viability, with RC being more potent than GC These findings are similar to what was previously reported for colon cancer cells treated with the same coffee extracts [21]. Likewise, other studies using HepG2 cells treated with different coffee bean extracts (CBEs) and black instant coffee (BICs) have shown similar results, with BICs being more potent than CBEs, regarding antioxidant and cell killing capacity [35]. Taken together, these results support the idea that bioactive compounds generated during the roasting process are critical in the biological effects of coffee [36].
CGA showed moderate effects in reducing cell viability at the higher concentrations used in this study (800 and 1600 µM), while CGA treatment was able to induce significant activation of caspase-3 (800 µM) and showed significant reduction of cell proliferation (200-800 µM) (Figure 1 and Figure 3). These results are comparable to those reported by Yan et al, who demonstrated that CGA reduces cell viability in HepG2 cells, although at lower doses. Interestingly, cell cycle analysis showed that CGA induced S-phase arrest in vitro and decreased tumor progression and tumor size in a murine model with HepG2 xenografts. Furthermore, in this study the biological effects of CGA were associated with the inhibition of ERK1/2 in HepG2 cells and reduction of Matrix metalloproteinase 2 (MMP-2) expression [16].
In our study, we observed that coffee extracts and CGA significantly inhibit DNA synthesis and suppress cell proliferation. These results suggest that, in addition to cytotoxicity, these compounds interfere with the cell cycle and cell proliferation. Previous studies showed that polyphenols downregulate cyclin expression and cell cycle progression pathways such as the PI3K/AKT signaling pathway in experimental liver cancer models [37]. Likewise, caffeine, one of the most significant bioactive compounds present in coffee, inhibits the proliferation, migration, and invasion of HepG2 and Huh-7 cells via modulation of the Akt and extracellular signal-regulated kinase (ERK)1/2 signaling pathways [18].
Our findings also demonstrated that the effects of green coffee extract (GC), roasted coffee extract (RC), and chlorogenic acid (CGA) are partially mediated via modulation of the Wnt/β-catenin signaling pathway. In the TOP/FOP (Figure 4) reporter assay, only green coffee-treated HepG2 cells showed a significant reduction in transcriptional activity and a reduced expression of β-catenin RNA, measured by qPCR (Figure 5), whereas CGA significantly reduced c-Myc mRNA levels. This observation highlights the role of c-Myc as Wnt/β-catenin target gene in cancer cell proliferation and in hepatocarcinogenesis. Similar results were reported by Zhao et al. (2023), observing that hydrogen sulfide (H₂S) suppresses H₂O₂-induced proliferation of HepG2 cells by inhibiting downstream effectors of the Wnt/β-catenin pathway, including Cyclin D1 and TCF4 [38]. These shared effects suggest that both CGA and GC may disrupt mitogenic signals driven by β-catenin-mediated gene transcription.
Our data also revealed an upregulation of E-cadherin mRNA levels following treatment with low doses of GC and CGA, indicating resoration of the epithelial phenotype and reduced metastatic potential. We did observe partial reduction of β-catenin mRNA levels but we did not observe any changes in AXIN2 mRNA levels. In addition, although GC at 24 hours significantly downregulated β-catenin mRNA level, this was not accompanied by changes in β-catenin or E-cadherin protein levels (Figure 6). Promising findings have been reported before: Fako et al. (2016) demonstrated that pimozide treatment reduces β-catenin and EpCAM mRNA and protein levels in HepG2 cells [39], but also highlighted the complexity of β-catenin regulation due to mutations in CTNNB1, such as the exon 3-4 truncation present in HepG2 cells. Such mutations confer β-catenin stabilization, which could explain why mRNA modulation does not translate to reduced protein levels in our system.
The effect of CGA as an anticancer compound in HCC has been reported before by others. For instance, Yang et al. (2021) reported that CGA contributes to anti-HCC activity by modulating the AKT/Cyclin D1/p21/p27 axis [40]. Given that Cyclin D1 is also a β-catenin target, this finding supports the crosstalk between the Wnt/β-catenin and AKT signaling pathways as a target of CGA. We observed that CGA treatment consistently reduces c-Myc mRNA, with limited effects on β-catenin protein, suggesting that CGA is targeting downstream β-catenin target genes rather than core protein pathway regulators themselves.
c-Myc expression is known to be regulated by the Wnt/β-catenin dependent and independent signaling pathways in hepatocellular carcinoma (HCC) [4]. It has been shown that receptor tyrosine kinase (RTK)-mediated pathways such as MAPK/ERK, PI3K/AKT, and JAK/STAT can upregulate c-myc transcription and enhance its protein stability [8]. Likewise, EGFR activation can stimulate Ras/MAPK signaling, promoting c-Myc expression independently of Wnt/β-catenin signaling. Similarly, c-Myc signaling through its ligand HGF activates downstream PI3K/AKT and STAT3 cascades, both of which contribute to increased c-Myc transcription and translation. Additionally, FGF19-FGFR4 signaling, often co-amplified with the CCND1 oncogene, has been implicated in liver tumorigenesis and may upregulate c-Myc through transcriptional crosstalk [28]. These alternative regulatory pathways highlight c-Myc as a key driver of cell proliferation and tumor progression, in HCC even when Wnt/β-catenin is not the dominant oncogenic pathway. Altogether, these findings suggest that dietary polyphenols such as CGA, like other bioactive compounds from coffee, are effective in targeting Wnt-driven oncogenic transcription in HCC. However, further investigation to understand in more detail the mechanisms involved in their ant-cancer effects is needed.
Both the present study as well as our previous study using colorectal carcinoma (CRC) cell lines [41], demonstrate that chlorogenic acid (CGA) and coffee extracts exhibit antiproliferative and cytotoxic effects, which correlate with the ability to modulate the Wnt/β-catenin signaling pathway . In both cancer types, CGA consistently downregulated key oncogenic targets (such as c-Myc in HCC and Cyclin D1 in CRC), although the effects at the protein level vary between these models, likely due to intrinsic differences in the molecular background of these cell lines. in the HCC study, we observed partial inhibition of β-catenin-mediated transcription (notably with green coffee), whereas in the CRC study we showed stronger and more consistent effects in SW480 cells, which display a higher baseline level of Wnt/β-catenin. In addition, both studies highlighted the influence of coffee bean processing on bioactive compound content, showing differential biological features that can translate in differential molecular mechanisms, suggesting that the composition and biological properties of green coffee vs roasted coffee extracts should be further explored These findings collectively support the potential of CGA and coffee polyphenols as chemotherapeutic and adjunctive agents to target Wnt/β-catenin driven tumors.
5. Conclusions
Coffee has significant hepatoprotective and HCC-preventive effects. Understanding the mechanisms of action involved in these effects is therefore very relevant. In the present study, we demonstrated that two coffee extracts rich in polyphenols (green coffee and roasted coffee) and CGA inhibit cell proliferation and viability of HCC-derived HepG2 cells. This effect was accompanied by reduced c-Myc expression and independent of Wnt/β-catenin-mediated signaling. Our results differ from those obtained previously in CRC cells, and provide useful information on the effect of coffee polyphenols in the context of HCC and the possible involvement of c-myc, independent of the Wnt pathway. Further studies are needed to determine the specific regulatory mechanism of these molecules in the protection against HCC. Moreover, future studies exploring the effect of coffee compounds on Wnt/β-catenin signaling in other experimental liver experimental models are needed.
Highlights of this Paper:
- Coffee extracts (green and roasted) and chlorogenic acids (CGAs) reduce HepG2 cell viability.
- Cell death and anti-proliferative effects are dose-dependent.
- TOP/FOP luciferase assays suggest little activation of the Wnt/β-catenin pathway.
- Among Wnt targets, only c-myc expression is notably regulated.
- β-catenin protein and subcellular localization are not altered.
Supplementary Materials
The following supporting information can be downloaded at the website of this paper posted on Preprints.org.
Author Contributions
Conceptualization, J.C.A.-O., F.M.C.-M. and M.M.-C.; formal analysis and investigation, M.M.-C, J.C.A.-O. and F.M.C.-M.; writing—original draft preparation, M.M.-C., J.C.A.-O., F.M.C.-M. and H.M; writing—review and editing, J.C.A.-O., F.M.C.-M. and H.M.; supervision, J.C.A.-O., F.M.C.-M. and H.M.; project administration, F.M.C.-M. and H.M. All authors have read and agreed to the published version of the manuscript.
Funding
This research was funded by a Minciencias grant (project code: 115080763215 CT 811-2018) and was supported by the Instituto Tecnológico Metropolitano and Universidad de Antioquia.
Institutional Review Board Statement
Not applicable
Informed Consent Statement
Not applicable
Data Availability Statement
Not applicable.
Acknowledgments
The authors thank Natucafé for providing the coffee beans to obtain the extracts evaluated in this work. We also thank project Minciencias grant (project code: 115080763215 CT 811-2018) for funding supplies and reagents.
Conflicts of Interest
The authors declare no conflict of interest.
References
- Mph, R.L.S.; Sung, H.; Mph, T.B.K.; Msph, A.N.G. Cancer statistics , 2025. no. October 2024, pp. 10–45, 2025.
- Bray, F.; Ferlay, J.; Soerjomataram, I.; Siegel, R.L.; Torre, L.A.; Jemal, A. Global cancer statistics 2025: GLOBOCAN estimates of incidence and mortality worldwide for 36 cancers in 185 countries. CA. Cancer J. Clin. 2025, 70, 394–424. [Google Scholar]
- Loo, L. Global Epidemiology and Genetics of Hepatocellular Carcinoma. Gastroenterology 2025, 164, 766–782. [Google Scholar]
- Giakoustidis, A.; Giakoustidis, D.; Mudan, S.; Sklavos, A.; Williams, R. Molecular Signalling in Hepatocellular Carcinoma: Role of and Crosstalk among Wnt/β-Catenin, Sonic Hedgehog, Notch and Dickkopf-1. Can. J. Gastroenterol. Hepatol. 2016, 29, 209–217. [Google Scholar] [CrossRef] [PubMed]
- Perugorria, M.J.; et al. Wnt–β-catenin signalling in liver development, health and disease. Nat. Rev. Gastroenterol. Hepatol. 2019, 16, 121–136. [Google Scholar] [CrossRef] [PubMed]
- Gedaly, R.; et al. Targeting the Wnt/β-catenin signaling pathway in liver cancer stem cells and hepatocellular carcinoma cell lines with FH535. PLoS One 2014, 9. [Google Scholar] [CrossRef] [PubMed]
- Russell, J.O.; Monga, S.P. Wnt/β-Catenin Signaling in Liver Development, Homeostasis, and Pathobiology. Annu. Rev. Pathol. Mech. Dis. 2018, 13, 351–378. [Google Scholar] [CrossRef]
- Zhao, Z.; et al. Wnt/β-Catenin signaling pathway in hepatocellular carcinoma: pathogenic role and therapeutic target. Front. Oncol. 2024, 14, 1–18. [Google Scholar] [CrossRef]
- Wang, Y.; Deng, B. Hepatocellular carcinoma : molecular mechanism, targeted therapy, and biomarkers. Cancer Metastasis Rev. 2023, 42, 629–652. [Google Scholar] [CrossRef]
- Ruiz, R.B.; Hernández, P.S. Cancer chemoprevention by dietary phytochemicals: Epidemiological evidence. Maturitas. 2016. [Google Scholar]
- Moreno-Ceballos, M.; Arroyave, J.C.; Cortes-Mancera, F.M.; Röthlisberger, S. Chemopreventive effect of coffee against colorectal cancer and hepatocellular carcinoma. Int. J. Food Prop. 2019, 22, 536–555. [Google Scholar] [CrossRef]
- Grosso, G.; Godos, J.; Galvano, F.; Giovannucci, E.L. Coffee, Caffeine, and Health Outcomes: An Umbrella Review. Annu. Rev. Nutr. 2017, 37. [Google Scholar] [CrossRef] [PubMed]
- Bhurwal, A.; et al. Inverse Association of Coffee with Liver Cancer Development : an Updated Systematic Review and Meta-Analysis 2020, 29, 421–428.
- Pelizzaro, F.; Cardin, R.; Sartori, A.; Imondi, A.; Penzo, B.; Farinati, F. Coffee and hepatocellular carcinoma: Epidemiologic evidence and biologic mechanisms. Hepatoma Res. 2021, 7. [Google Scholar] [CrossRef]
- Li, Z.; et al. Exploring the impact of coffee consumption on liver health: A comprehensive bibliometric analysis. Heliyon 2024, 10, e31132. [Google Scholar] [CrossRef]
- Yan, Y.; Liu, N.; Hou, N.; Dong, L.; Li, J. Chlorogenic acid inhibits hepatocellular carcinoma in vitro and in vivo. J. Nutr. Biochem. 2017. [Google Scholar] [CrossRef]
- Gaascht, F.; Dicato, M.; Diederich, M. Coffee provides a natural multitarget pharmacopeia against the hallmarks of cancer. Genes Nutr. 2015, 10. [Google Scholar] [CrossRef]
- Shan, L.; Zhao, N.; Wang, F.; Zhai, D.; Liu, J.; Lv, X. Caffeine in Hepatocellular Carcinoma: Cellular Assays, Animal Experiments, and Epidemiological Investigation. J. Inflamm. Res. 2024, 17, 1589–1605. [Google Scholar] [CrossRef]
- Shi, H.; et al. Chlorogenic acid protects against liver fibrosis in vivo and in vitro through inhibition of oxidative stress. Clin. Nutr. 2016. [Google Scholar] [CrossRef]
- Naveed, M.; et al. Chlorogenic acid (CGA): A pharmacological review and call for further research. Biomed. Pharmacother. 2018, 97, 67–74. [Google Scholar] [CrossRef]
- Villota, H.; et al. Modulatory Effect of Chlorogenic Acid and Coffee Extracts on Wnt/ β -Catenin Pathway in Colorectal Cancer Cells. Nutrients 2022, 14, 1–19. [Google Scholar] [CrossRef]
- Poole, R.; Kennedy, O.J.; Roderick, P.; Fallowfield, J.A.; Hayes, P.C.; Parkes, J. Coffee consumption and health: umbrella review of meta-analyses of multiple health outcomes. Br. Med. J. 2017, 359, 1–17. [Google Scholar] [CrossRef] [PubMed]
- Yu, J.; et al. Coffee, Green Tea Intake, and the Risk of Hepatocellular Carcinoma : A Systematic Review and Meta-Analysis of Observational Studies Coffee, Green Tea Intake, and the Risk of Hepatocellular Carcinoma : A. Nutr. Cancer 2023, 75, 1295–1308. [Google Scholar] [CrossRef]
- Wang, J.; Qiu, K.; Zhou, S.; Gan, Y.; Jiang, K.; Wang, H. Annals of Medicine Risk factors for hepatocellular carcinoma : an umbrella review of systematic review and meta- analysis. Ann. Med. 2025, 57. [Google Scholar]
- de Melo Pereira, G.V.; et al., Chemical composition and health properties of coffee and coffee by-products, 1st ed., vol. 91. Elsevier Inc., 2020.
- Mirabelli, C.K.; Nusse, R.; Tuveson, D.A.; Williams, B.O. Perspectives on the role of Wnt biology in cancer. Sci. Signal. 2019, 12, 1–4. [Google Scholar] [CrossRef]
- Hermida, M.A.; Kumar, J.D.; Leslie, N.R. GSK3 and its interactions with the PI3K/AKT/mTOR signalling network. Adv. Biol. Regul. 2017, 65, 5–15. [Google Scholar] [CrossRef] [PubMed]
- Gajos-Michniewicz, A.; Czyz, M. WNT/β-catenin signaling in hepatocellular carcinoma: The aberrant activation, pathogenic roles, and therapeutic opportunities. Genes Dis. 2024, 11, 727–746. [Google Scholar] [CrossRef]
- Iqbal, A.H.M.O.; Tareen, U.J.M.B.K.; Ramzan, D.A.A.; Naeem, S.P.M. Inhibitory effect of polyphenols ( phenolic acids, lignans, and stilbenes ) on cancer by regulating signal transduction pathways : a review. Clin. Transl. Oncol. 2022, 24, 432–445. [Google Scholar]
- Gajos-Michniewicz, A.; Czyz, M. Therapeutic Potential of Natural Compounds to Modulate WNT/β-Catenin Signaling in Cancer: Current State of Art and Challenges. Int. J. Mol. Sci. 2024, 25. [Google Scholar] [CrossRef] [PubMed]
- Di Pietrantonio, D.; Palitti, V.P.; Cichelli, A.; Tacconelli, S. Protective Effect of Caffeine and Chlorogenic Acids of Coffee in Liver Disease. Foods 2024, 13, 1–15. [Google Scholar] [CrossRef]
- Kennedy, O.J.; Fallowfield, J.A.; Poole, R.; Hayes, P.C.; Parkes, J.; Roderick, P.J. All coffee types decrease the risk of adverse clinical outcomes in chronic liver disease: a UK Biobank study. BMC Public Health 2021, 21, 1–14. [Google Scholar] [CrossRef]
- Cheng, Z.; et al. Bruceine D inhibits hepatocellular carcinoma growth by targeting β-catenin/jagged1 pathways. Cancer Lett. 2017, 403, 195–205. [Google Scholar] [CrossRef] [PubMed]
- Murai, T.; Matsuda, S. The Chemopreventive Effects of Chlorogenic Acids, Phenolic Compounds in Coffee, against Inflammation, Cancer, and Neurological Diseases. Molecules 2023, 28. [Google Scholar] [CrossRef] [PubMed]
- Chen, Y.; Yu, W.; Niu, Y.; Li, W.; Lu, W.; Yu, L.L. Chemometric Classification and Bioactivity Correlation of Black Instant Coffee and Coffee Bean Extract by Chlorogenic Acid Profiling. pp. 1–16, 2024.
- Asamenew, G.; et al. Food Chemistry : X Comprehensive characterization of hydroxycinnamoyl derivatives in green and roasted co ff ee beans : A new group of methyl hydroxycinnamoyl quinate. Food Chem. X 2019, 2, 100033. [Google Scholar] [CrossRef] [PubMed]
- Yang, X.; et al. Phytomedicine Fuzheng Jiedu Xiaoji formulation inhibits hepatocellular carcinoma progression in patients by targeting the AKT / CyclinD1 / p21 / p27 pathway. Phytomedicine 2021, 87, 153575. [Google Scholar] [CrossRef]
- Zhao, H.; Zhao, L.; Wu, L.; Hu, S.; Huang, Y.; Zhao, W. Hydrogen sulfide suppresses H 2 O 2 - induced proliferation and migration of HepG2 cells through Wnt / β - catenin signaling pathway. Med. Oncol. 2023, 40, 1–10. [Google Scholar] [CrossRef]
- Fako, V.; Yu, Z.; Henrich, C.J.; Ransom, T.; Budhu, A.S.; Wang, X.W. Inhibition of wnt / β -catenin Signaling in Hepatocellular Carcinoma by an Antipsychotic Drug Pimozide. 2016, 12.
- Zhang, C.; et al. Protective effect of the herbal medicine Gan-fu-kang against carbon tetrachloride-induced liver fibrosis in rats. Mol. Med. Rep. 2013, 8, 954–962. [Google Scholar] [CrossRef]
- Villota, H.; et al. Biological Impact of Phenolic Compounds from Coffee on Colorectal Cancer. Pharmaceuticals 2021, 14, 1–12. [Google Scholar] [CrossRef]
Figure 1.
Effect of coffee extracts and chlorogenic acid on HepG2 viability.Cells were treated with Green coffee extract (GC), Roasted coffee extract (RC) or Chlorogenic acids (CGA) 24 h and 48 h after plating. A) MTT assay. B) Sulforhodamine B assay. Relative cell viability was normalized to non-treated cells (100%). Results were obtained from three independent experiments (n = 3, * p ≤ ** p ≤ 0.01, *** p ≤ 0.001, **** p ≤ 0.0001).
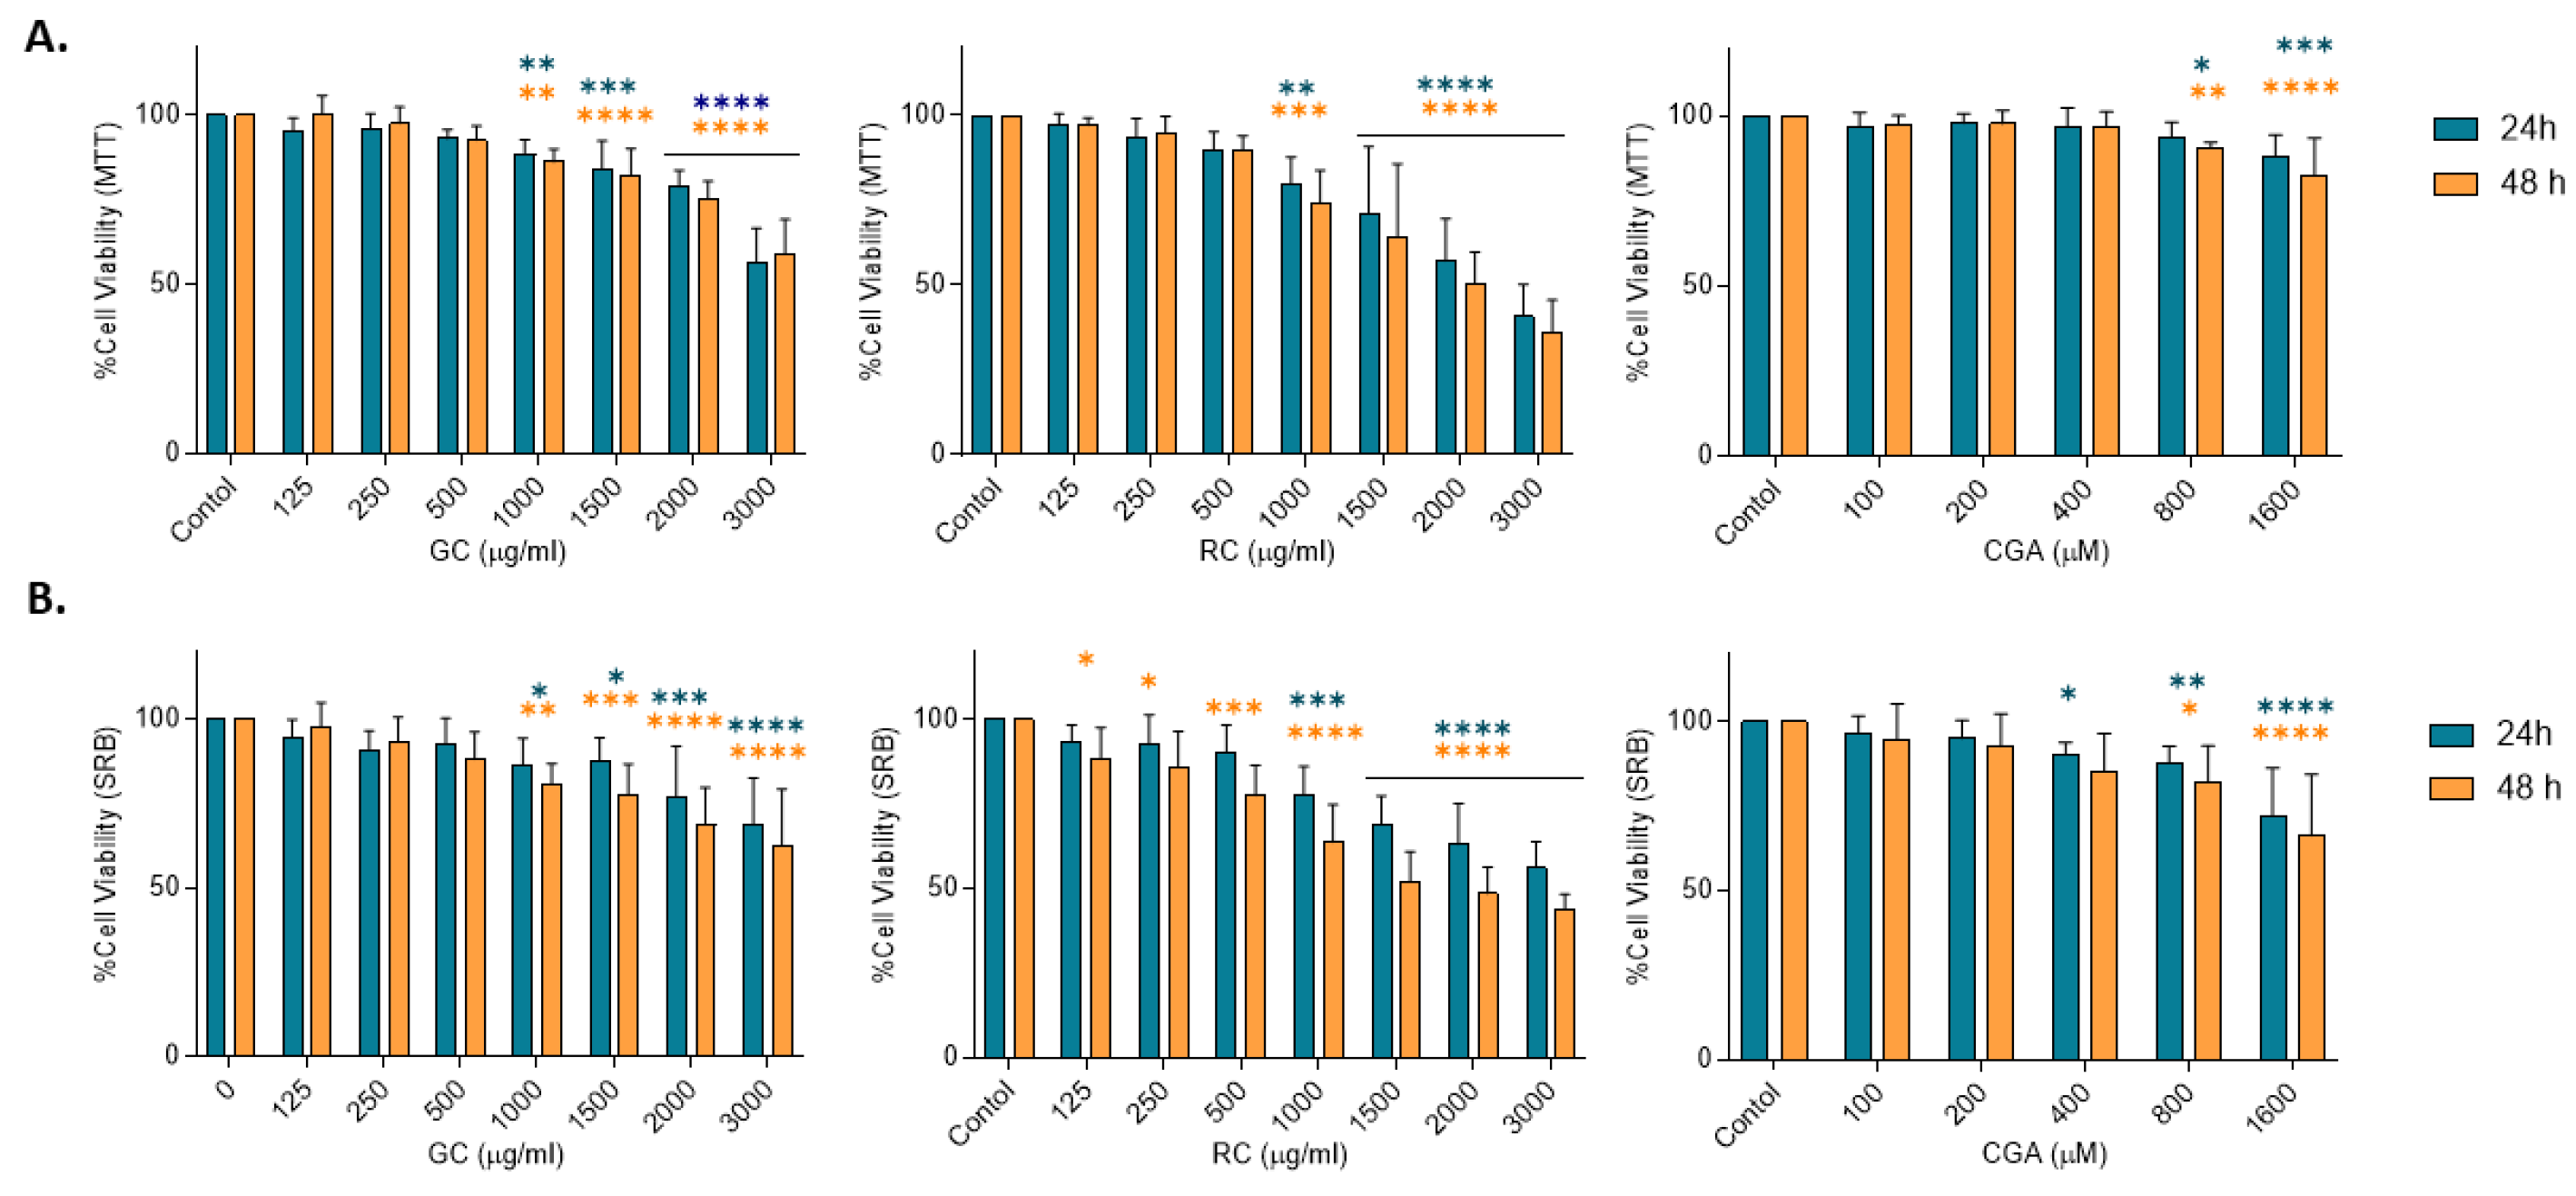
Figure 2.
Cell death assessment in HepG2 cells treated with Coffee extracts and Chlorogenic acid. HepG2 cells were treated with Green coffee extract (GC) and Roasted coffee extract (RC), 125-1000ug/ml, or chlorogenic acid (CGA), 100-800 µM A) Caspase-3 activity in HepG2 cells treated for 16 h and 24 h. B) SYTOX Green staining of HepG2 cells and C) CGA treatment for 48h. Green: necrotic cells. D) and E) Quantification of SYTOX green-positive cells relative to the BSA control. SYTOX green-positive cell counting was also normalized according to the confluency of the cell cultures. Results were obtained from three independent experiments (n = 3, * p ≤ ** p ≤ 0.01, *** p ≤ 0.001, **** p ≤ 0.0001).
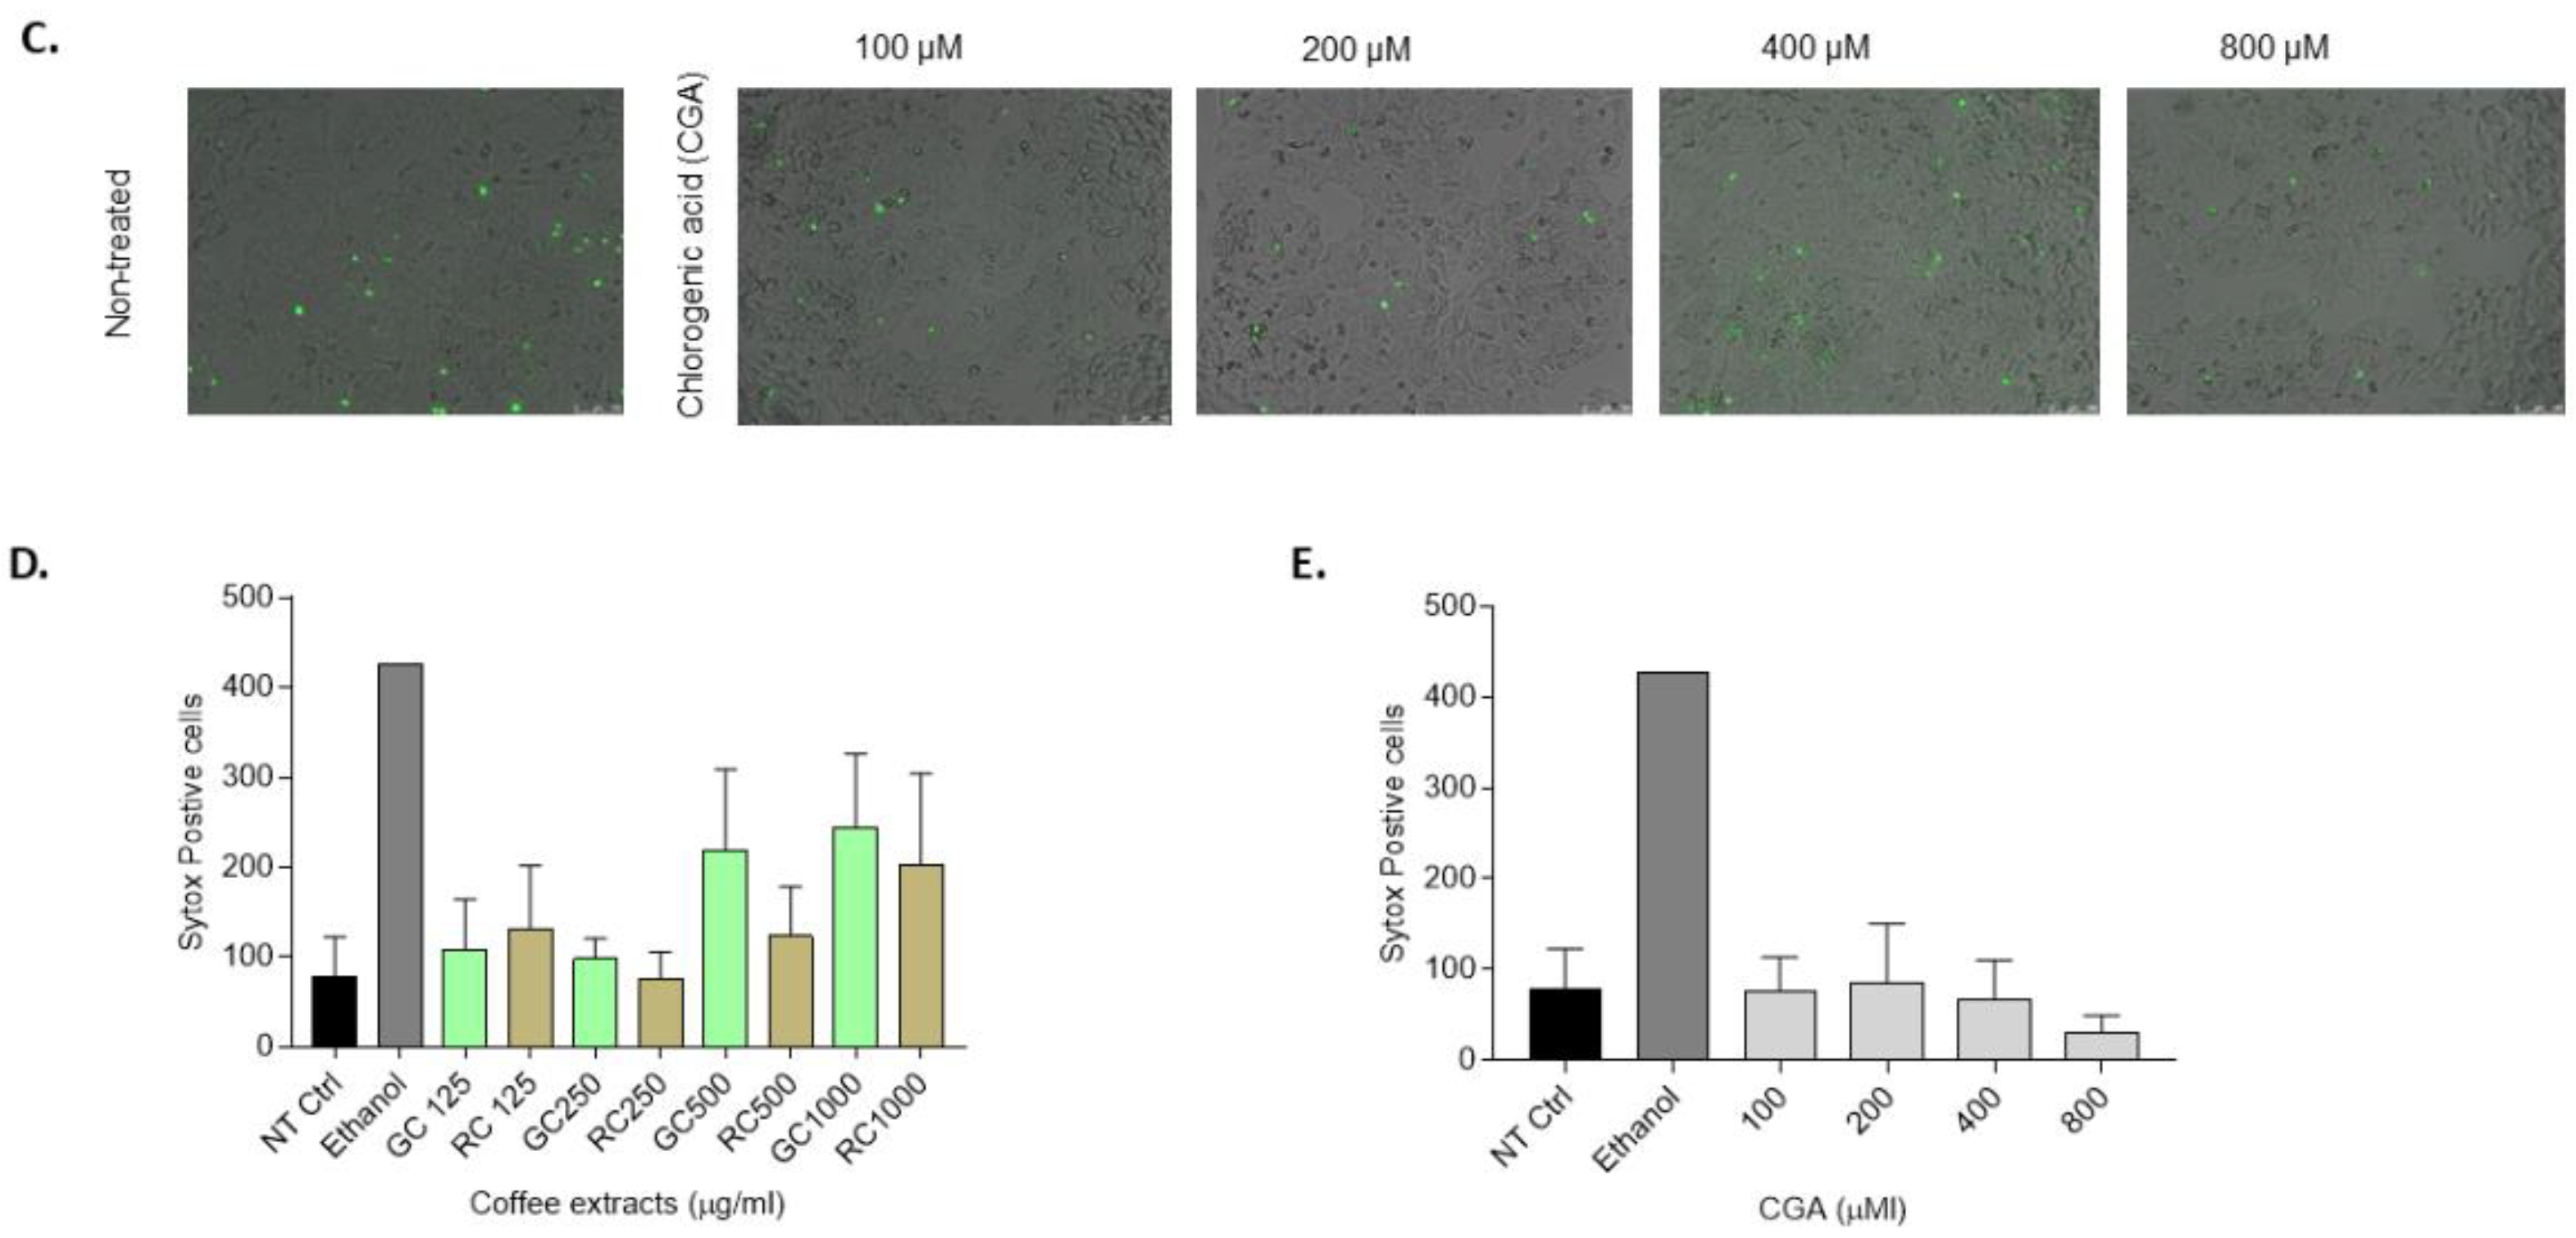
Figure 3.
Cell proliferation in HepG2 cells treated with coffee extracts and Chlorogenic acid. HepG2 cells were treated with Green coffee (GC) extract and roasted coffee extract (RC), 125-1000 µg/ml, and chlorogenic acid (CGA), 100 to 800uM. A) BrdU proliferation assay after 24 h and 48 h of treatment. B) Cell confluence kinetics measured by XCelligence for 96 h. Results were obtained from three independent experiments (n = 3, * p ≤ ** p ≤ 0.01, *** p ≤ 0.001, **** p ≤ 0.0001).
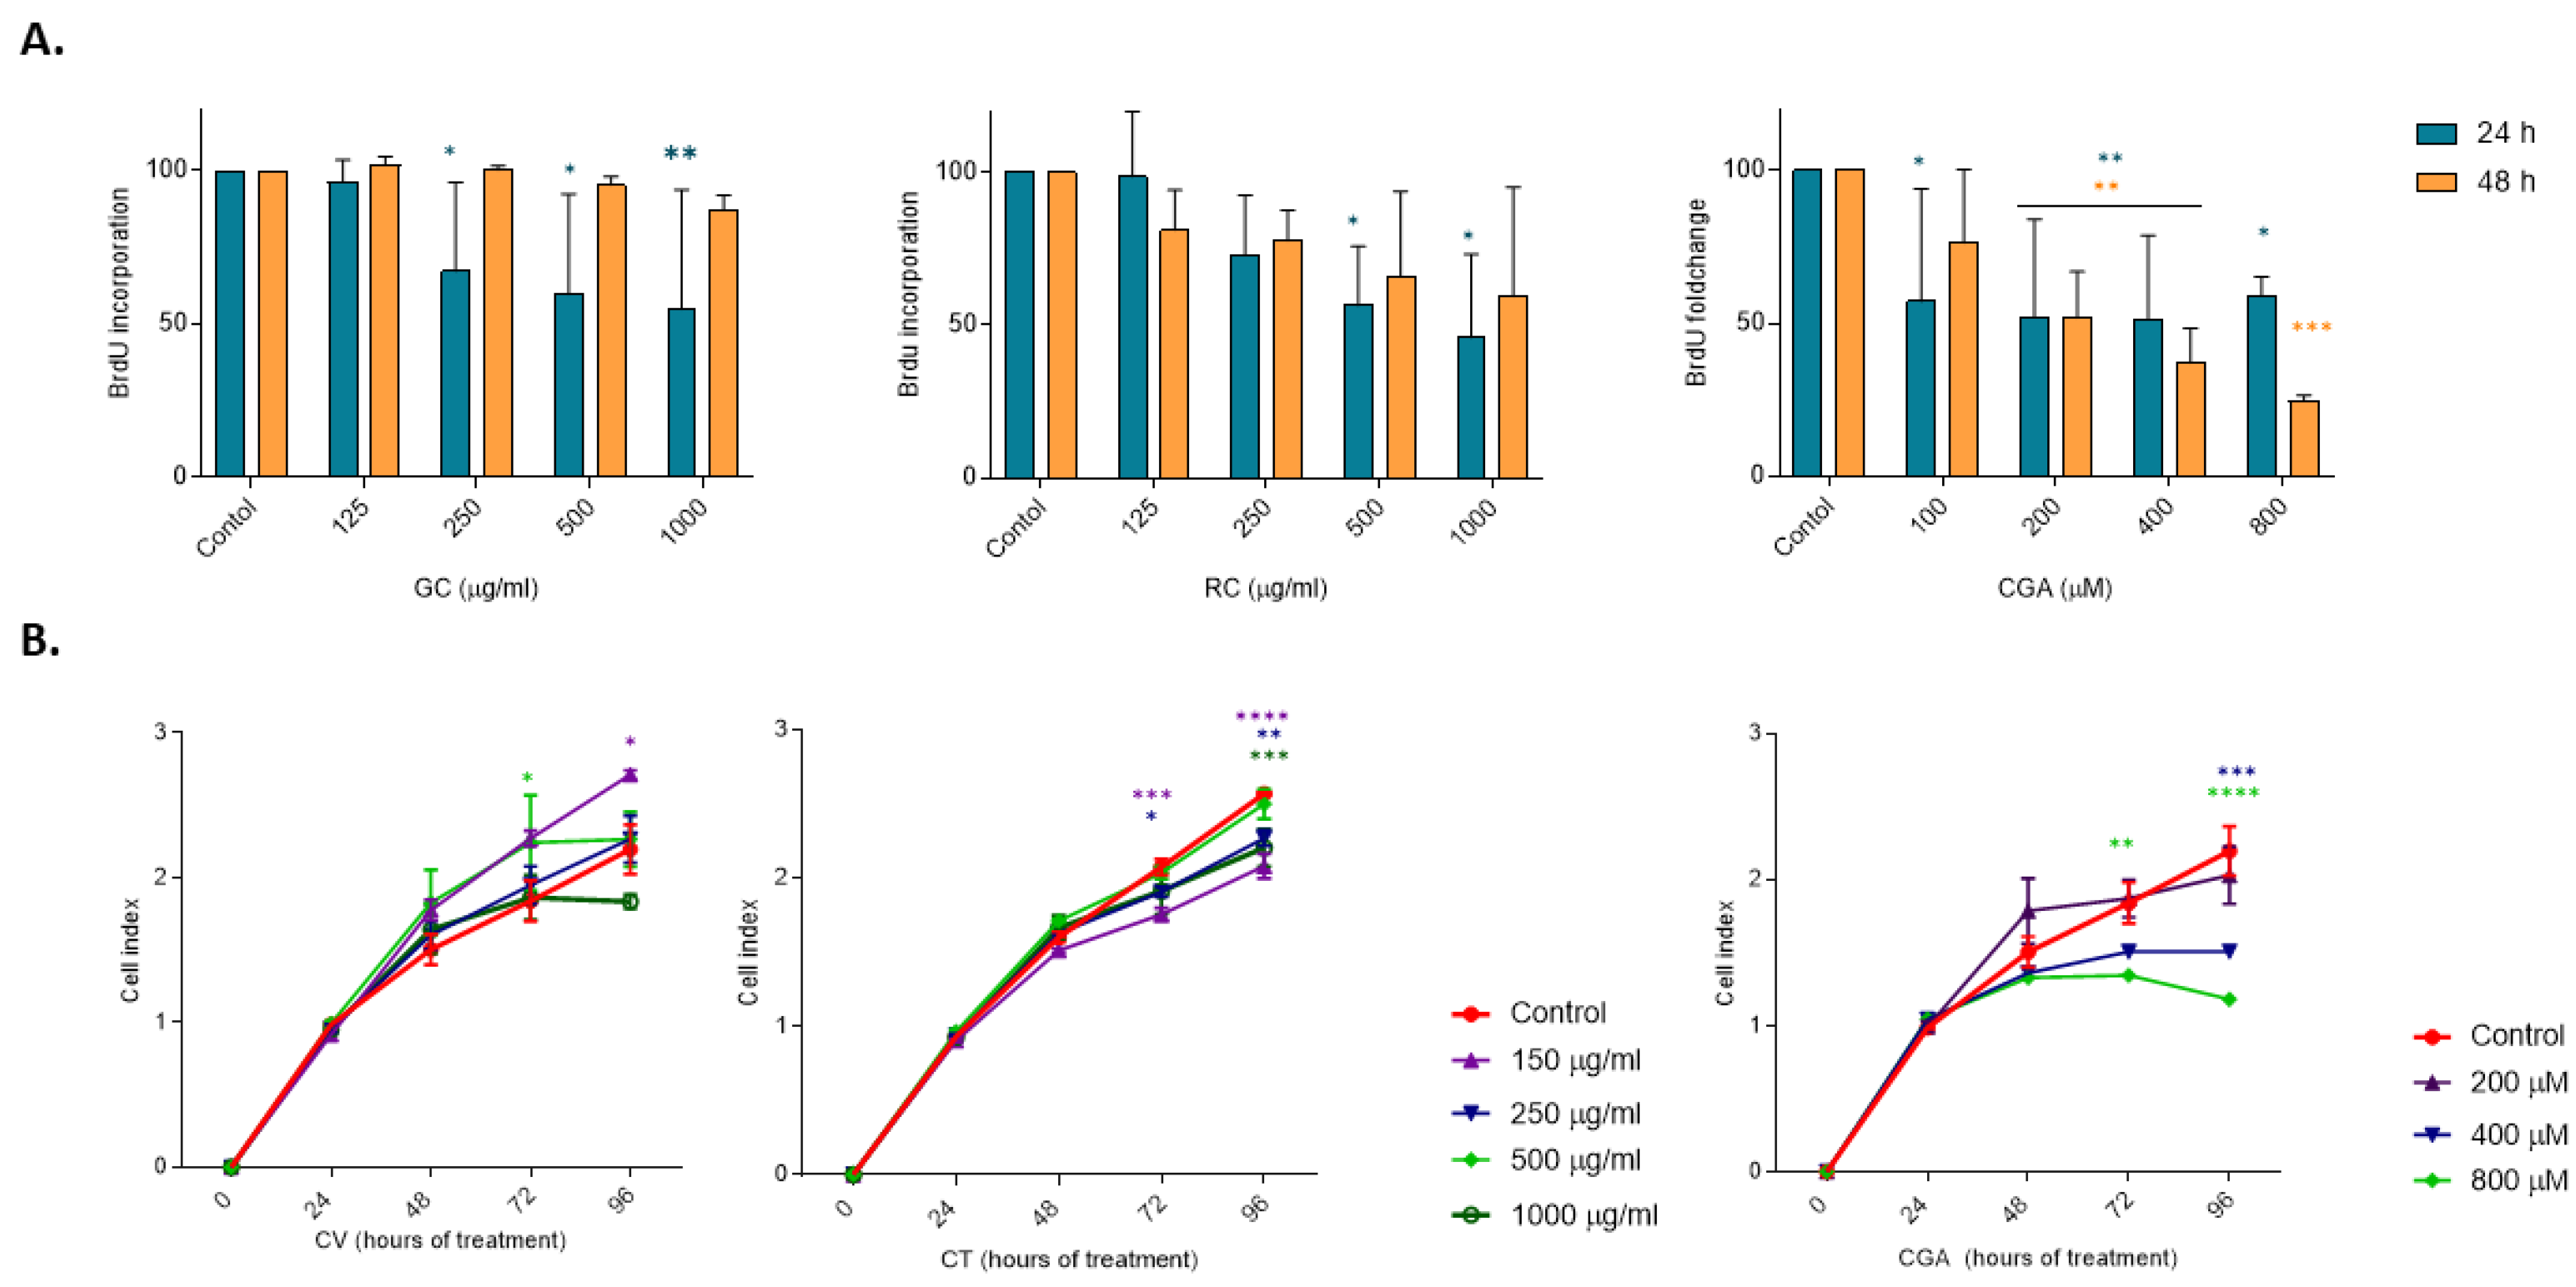
Figure 4.
TOP/FOP luciferase reporter assay in HepG2 cells treated with coffee extracts and Chlorogenic acid. HepG2 cells were incubated with Green coffee extract (GC) and Roasted coffee extract (RC), 125-250 µg/ml, Chlorogenic acid (CGA), 100 to 200 µM, Wnt3a (50 ng/ml) or CT-025 (2 µM) for 24 h (A) and 48 h (B). Results were obtained from three independent experiments (n = 3, * p ≤ ** p ≤ 0.01, *** p ≤ 0.001, **** p ≤ 0.0001).
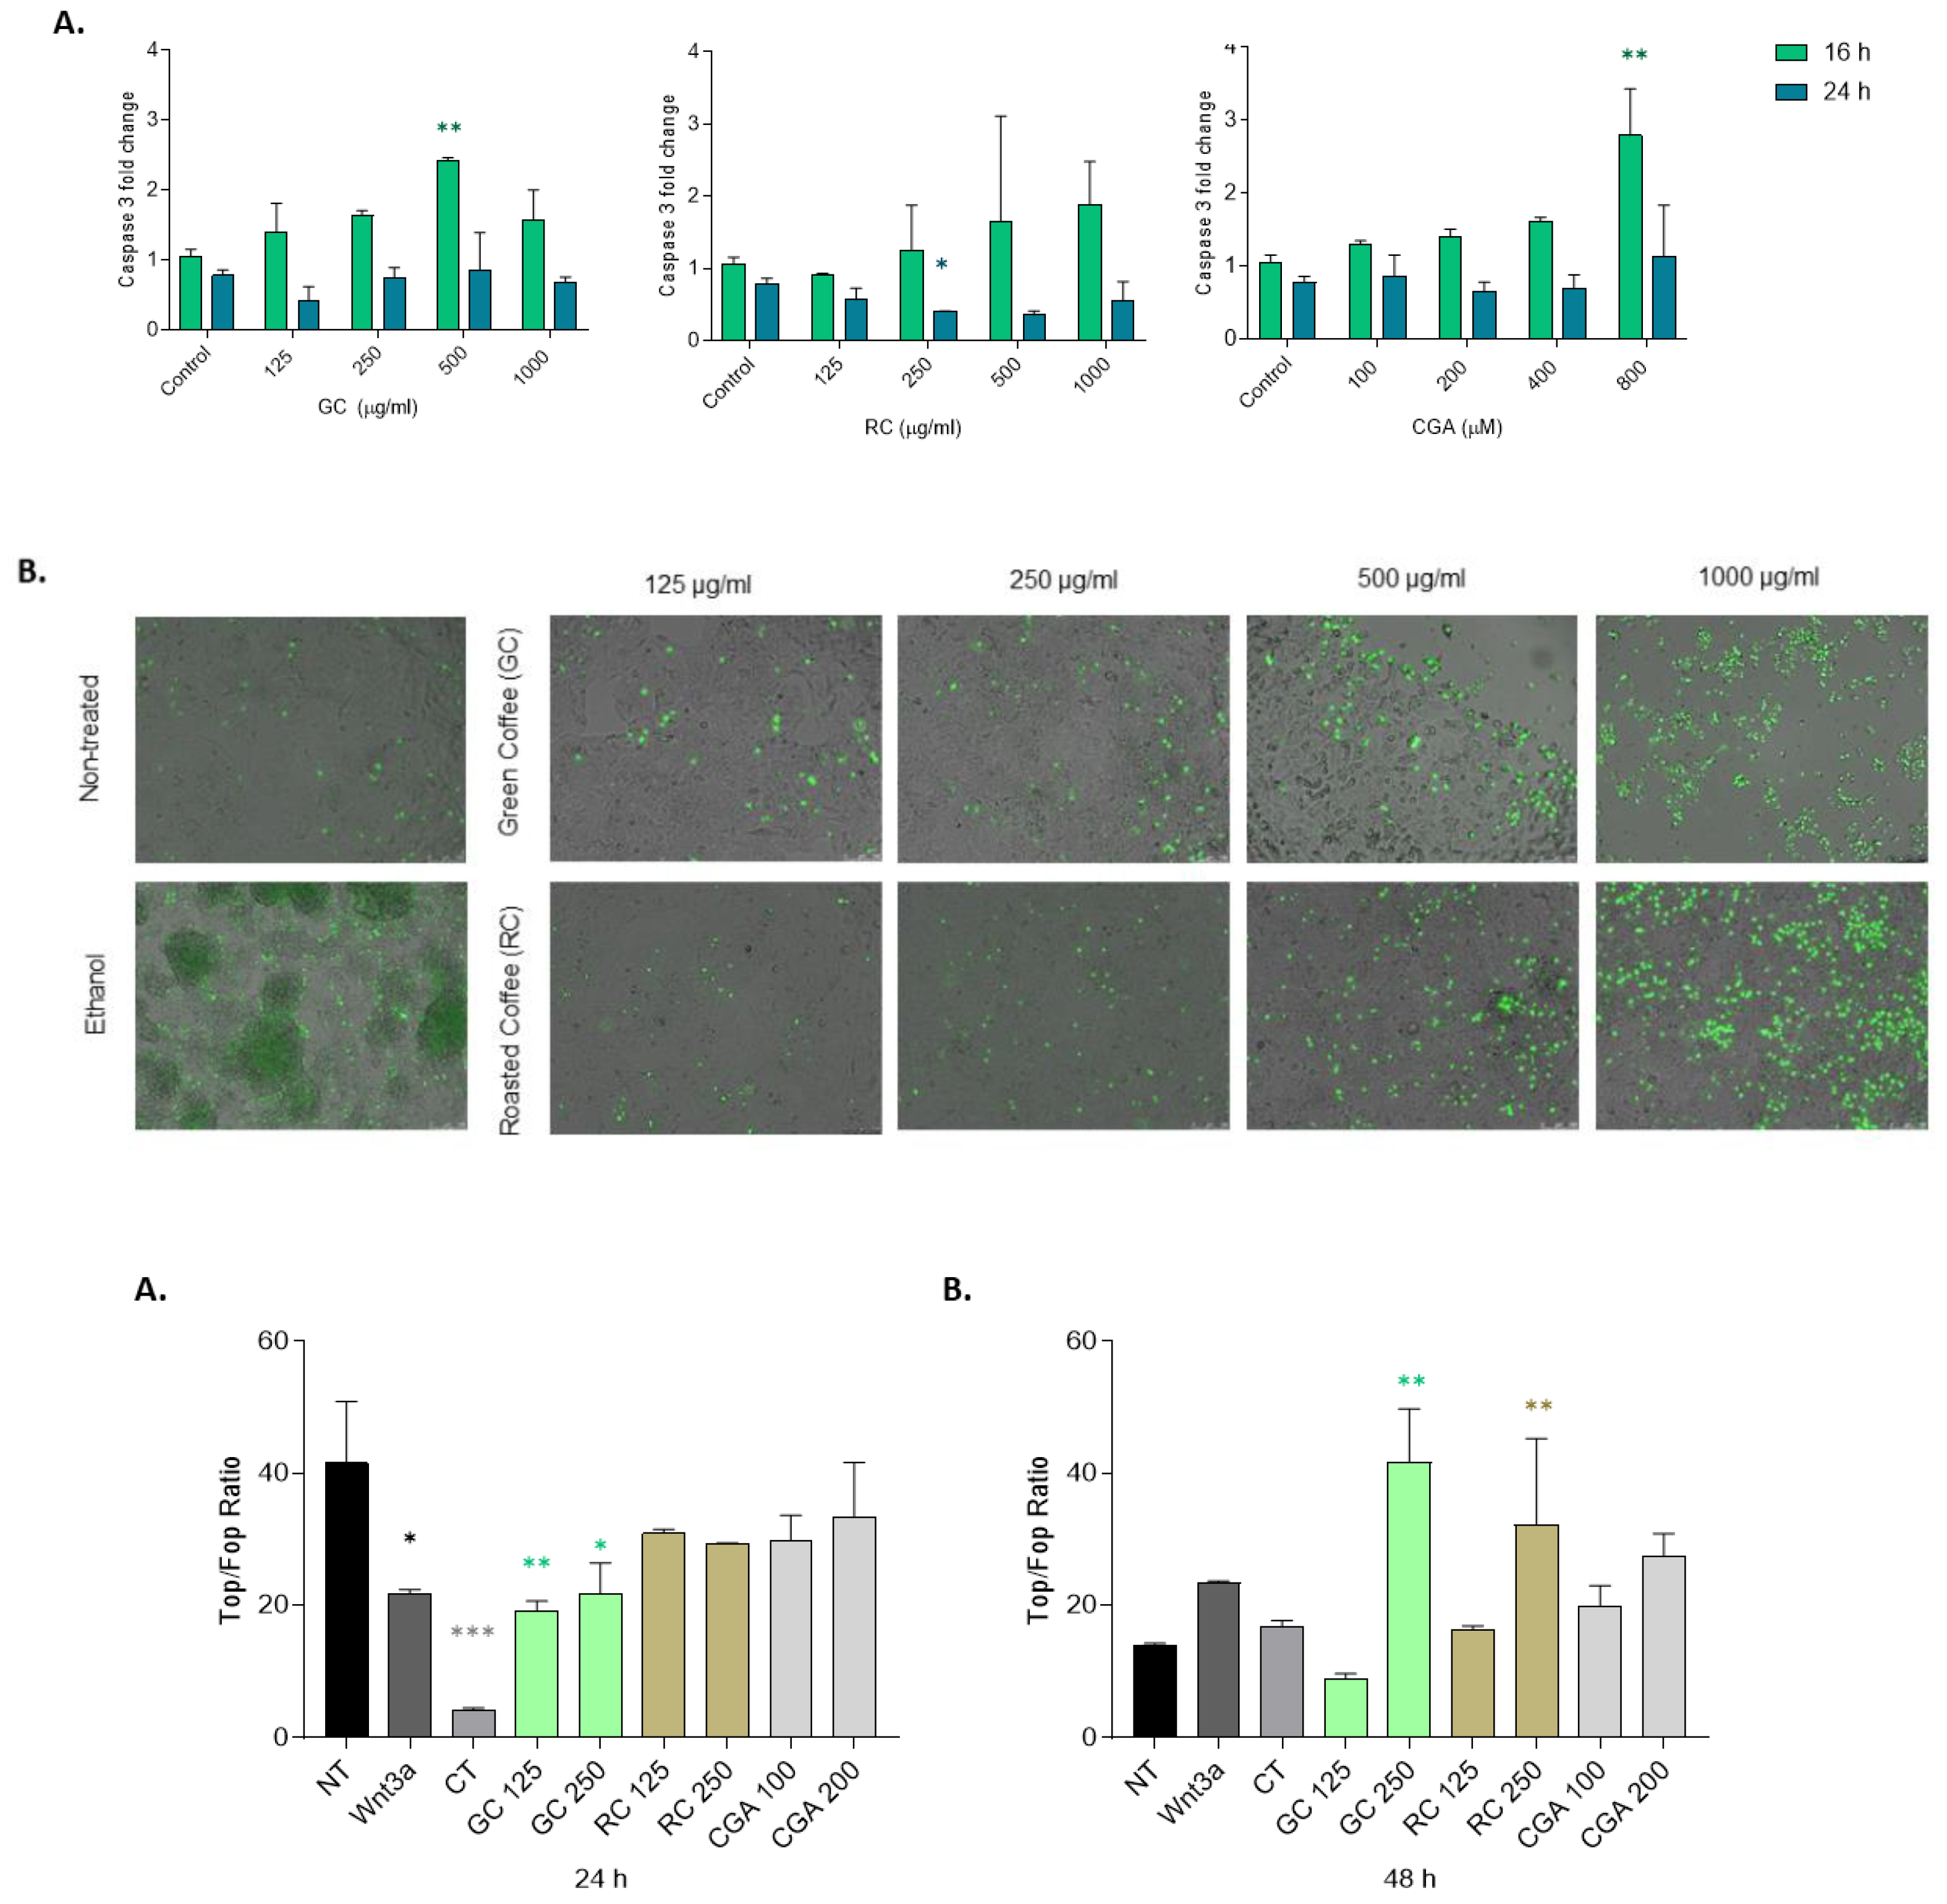
Figure 5.
Expression of Wnt/β-cateninrelated genes. HepG2 cells were treated with Green coffee and Roasted coffee extracts: GC and RC (250-1000 µg/ml), and Chlorogenic acid: CGA (200-800 µM) for 16 h and 24 h. (A) mRNA quantification by qRT-PCR of Axin2, c-myc (B), β-catenin (C), and E-cadherin (D). Results were obtained from three independent experiments (n = 3, * p ≤ ** p ≤ 0.01, *** p ≤ 0.001, **** p ≤ 0.0001).
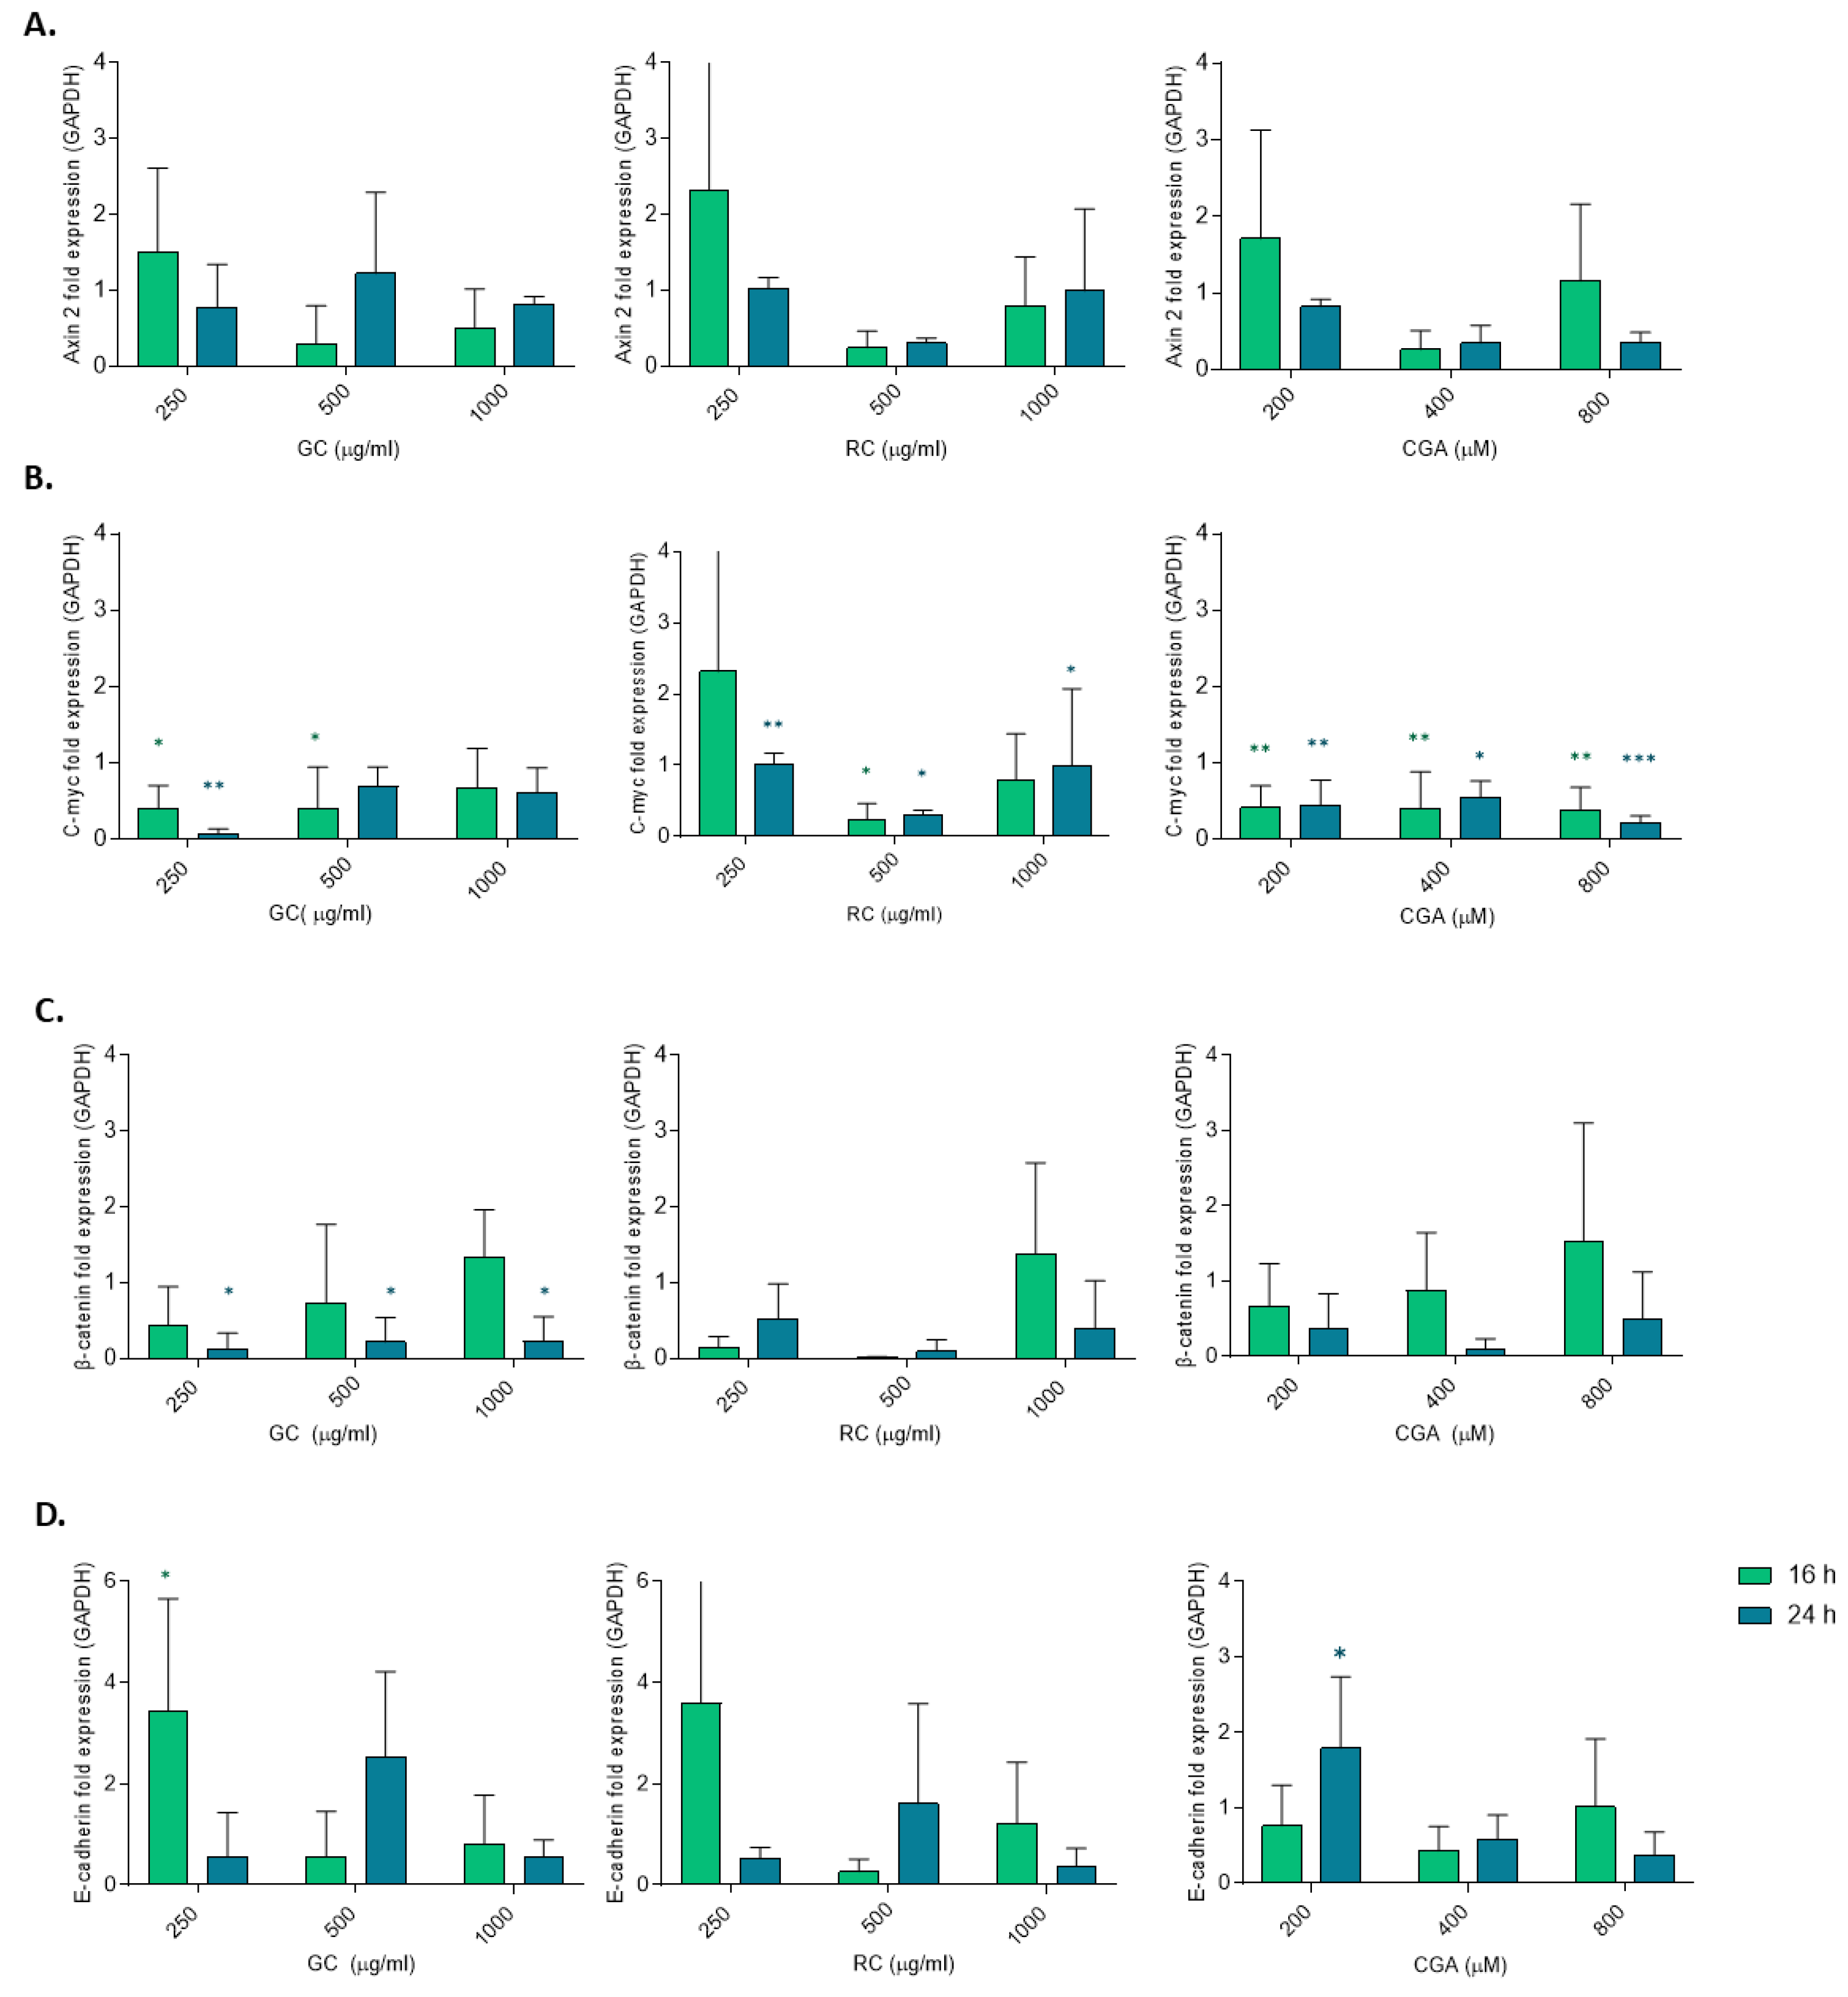
Figure 6.
β-catenin and E-cadherin protein expression in HepG2. Cells were treated for 24 h with Green coffee (GC) and Roasted coffee (RC) extracts (250-1000 µg/ml), and chlorogenic acid (CGA), 100-800 µM. A) β-catenin and E-cadherin protein detection by Western blot. B) Quantification of β-catenin and E-cadherin protein from Western blot.
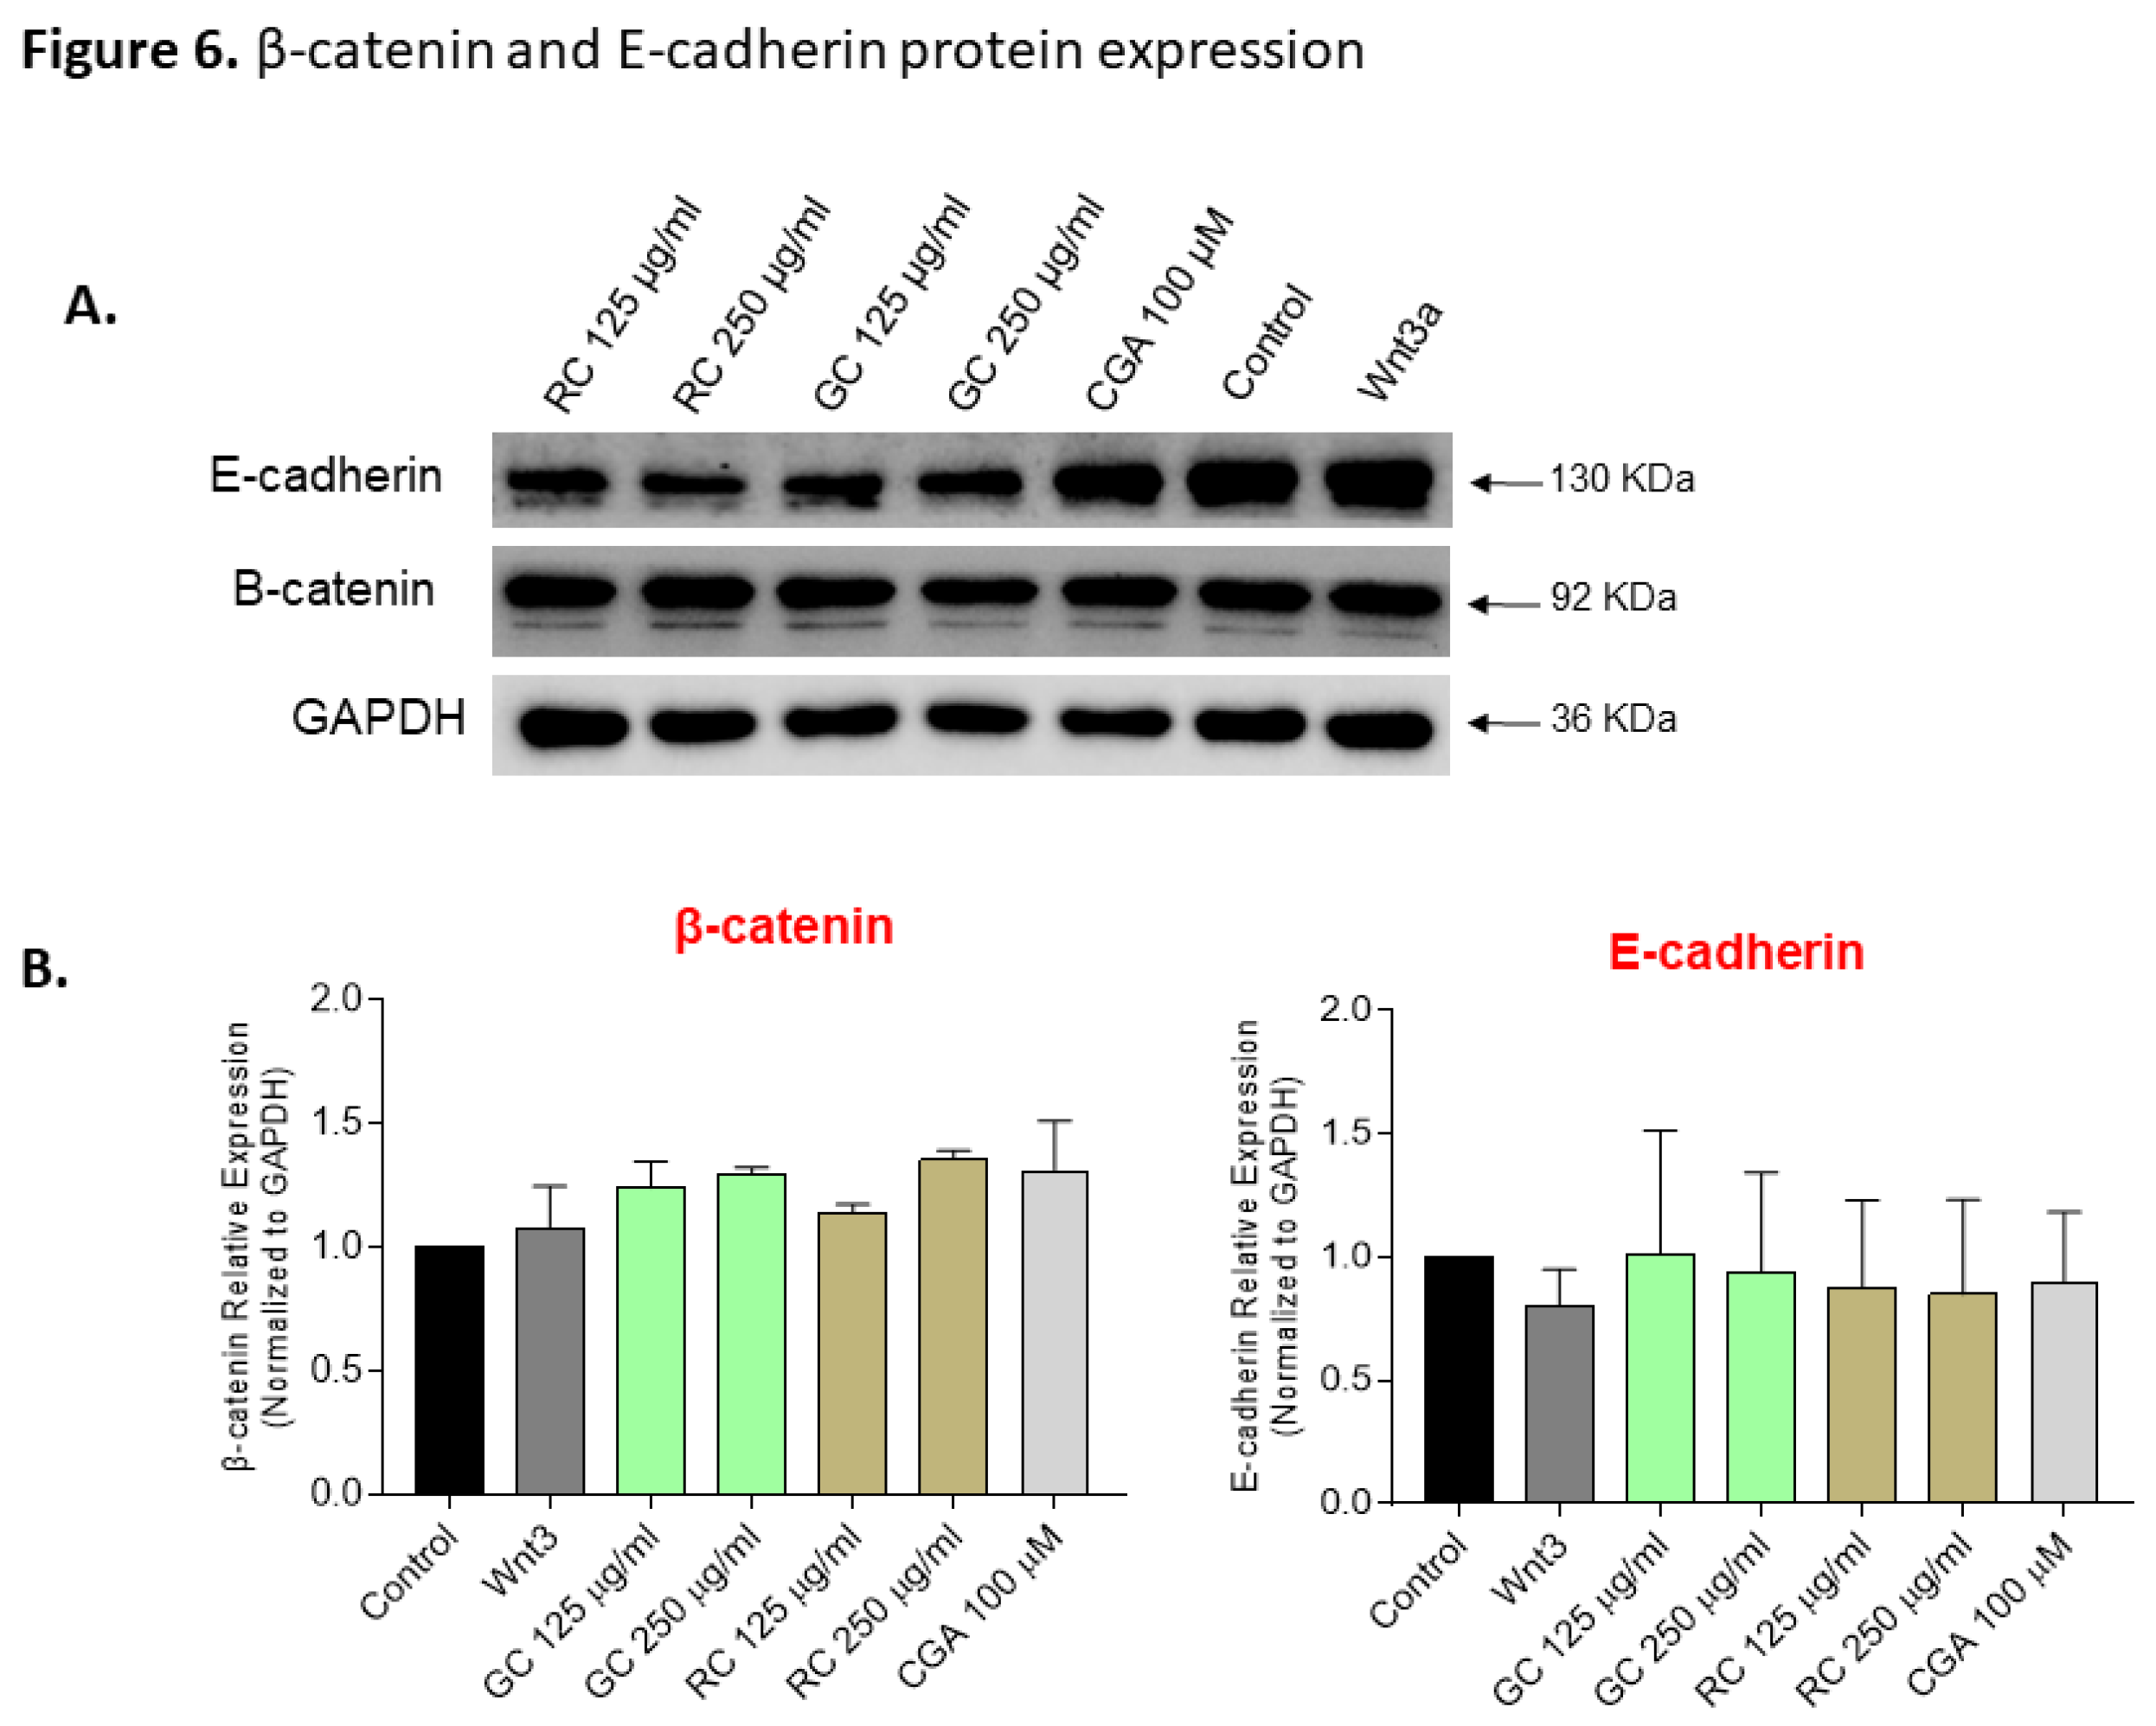
Figure 7.
β-Catenin and E-cadherin subcellular localization. β-catenin and E-cadherin subcellular localization detected by immunofluorescence staining and visualized using Olympus IX81 confocal microscope. Nuclei: blue, β-catenin: green, E-cadherin: red). HepG2 cells were treated with Green coffee and Roasted coffee extracts: GC and RC (500 µg/ml), and Chlorogenic acid: CGA (400 µM), for 16 h, 24 h and 48 h. Nuclei were stained with Hoechst. The panel include representative images for treatments at 48 h (A). (B) Quantification of β-catenin protein fluorescence intensity. Supplementary Figure S1 shows representative images for treatments at 16 h and 24 h.
Disclaimer/Publisher’s Note: The statements, opinions and data contained in all publications are solely those of the individual author(s) and contributor(s) and not of MDPI and/or the editor(s). MDPI and/or the editor(s) disclaim responsibility for any injury to people or property resulting from any ideas, methods, instructions or products referred to in the content. |
© 2025 by the authors. Licensee MDPI, Basel, Switzerland. This article is an open access article distributed under the terms and conditions of the Creative Commons Attribution (CC BY) license (http://creativecommons.org/licenses/by/4.0/).
Copyright: This open access article is published under a Creative Commons CC BY 4.0 license, which permit the free download, distribution, and reuse, provided that the author and preprint are cited in any reuse.


