
Submitted:
09 July 2025
Posted:
10 July 2025
You are already at the latest version
Abstract
Solar photovoltaic (PV) systems play a pivotal role in sustainable energy generation, yet their efficiency declines with elevated operating temperatures caused by solar irradiance and environmental factors. To address this, hybrid, active, and passive cooling technologies have emerged as effective solutions, offering the dual benefit of temperature regulation and waste heat recovery for secondary applications. This paper presents a comprehensive review of recent advancements in PV cooling methods, analyzing their working principles, thermal performance, advantages, and limitations. Special emphasis is placed on hybrid cooling systems, which integrate multiple techniques to maximize efficiency, alongside active and passive approaches. Furthermore, the study explores the integration of heat recovery systems , such as heat pumps and thermal storage tanks , to repurpose waste heat for domestic, industrial, or space-heating applications, thereby enhancing overall energy utilization. The review concludes by identifying critical research gaps and future directions for optimizing PV cooling and heat recovery systems.
Keywords:
photovoltaic (PV) systems
; hybrid cooling
; active cooling
; passive cooling
; heat recovery
; heat sink
; heat pump
; thermal energy storage
1. Introduction
The global transition toward clean energy systems has positioned solar photovoltaic (PV) technology as a cornerstone of renewable electricity generation.
Capable of converting sunlight directly into electricity with zero operational emissions, PV systems offer a scalable solution particularly suited to high-insolation regions such as Africa. The International Energy Agency (IEA) projects solar PV will emerge as the dominant renewable source by 2030, accounting for 16% of global renewable generation—surpassing hydropower (13%) [1].
This remarkable growth trajectory, illustrated in Figure 1 , underscores the technology's rapid evolution from a niche energy source to a mainstream power generation option, driven by continuous cost reductions and policy support worldwide.
Despite this rapid adoption, PV systems face a critical efficiency challenge: their performance degrades with rising operating temperatures. Crystalline silicon (c-Si) panels, which dominate ~90% of the market [1], exhibit a power temperature coefficient of −0.4% to −0.5%/°C above standard test conditions (25°C) [2]. In high-temperature environments (60–80°C), this results in 15–25% power loss [3], severely impacting energy yields in regions with otherwise optimal solar resources.
The thermal vulnerability of c-Si panels stems partly from their material composition: 70% glass, 18% aluminum (frame), and only 3% active silicon (Figure 2) [4].
This design, while durable, creates thermal management challenges. Compounding the issue, Kazem et al. [5] demonstrate how dust accumulation synergizes with temperature to induce hotspots, accelerating degradation and reducing panel lifespan by 10–15%. These hotspots create localized thermal stress that damages materials, while dust further insulates panels, exacerbating efficiency losses.
Addressing these challenges requires integrated solutions that combine :
- -
- Thermal regulation (e.g., passive/active cooling),
- -
- Hotspot mitigation (e.g., advanced monitoring), and
- -
- Heat recovery (e.g., hybrid PV-thermal systems).
This review examines these strategies, evaluating their potential to enhance PV performance and economic viability in high-temperature environments.
2. Cooling Solutions for Optimal PV Performance
Building upon the fundamental challenges of PV thermal management outlined earlier, our review adopts the comprehensive classification framework proposed by Gharzi [6] (Figure 3) to systematically evaluate advancements in PV cooling technologies since 2020. This analysis specifically examines: (1) passive approaches leveraging natural convection and radiative cooling, (2) active systems employing forced fluid circulation and thermoelectric elements, and (3) hybrid solutions that synergistically combine multiple cooling mechanisms. The temporal focus on post-2020 innovations is particularly significant, as this period has witnessed remarkable progress in nano-enhanced phase change materials (PCMs), thermal regulation, and integrated PV-thermal (PV/T) systems - developments that address the material limitations and efficiency losses detailed in the preceding discussion.
Kaneesamkandi's comprehensive study [6] presents a multi-criteria evaluation of photovoltaic cooling technologies, with key performance metrics systematically compared in Table 1. The analysis reveals significant variations in cooling effectiveness across different approaches:
Active cooling methods demonstrate superior performance, with both water spraying and evaporative cooling achieving 40°C temperature reductions and 15% efficiency gains (150 W/m² power increase).
Passive systems show moderate improvements: thermosiphon/clay pot configurations yield 28°C cooling with 10% efficiency gains (100 W/m²), while standard thermosiphon and forced convection systems provide 22-23°C reductions.
Advanced materials exhibit good results but a high cost: phase change materials match passive system performance (23°C, 10%), while heat pipes offer balanced performance (14.2°C, 8%).
2.1. Passive Cooling
Passive cooling approaches provide a sustainable solution for enhancing photovoltaic performance by utilizing natural heat transfer mechanisms to reduce operating temperatures. These self-regulating systems leverage fundamental thermodynamic processes—convection, conduction, and radiation—to dissipate excess heat without requiring water or electrical power. This characteristic makes them particularly well-suited for desert environments and remote installations where minimal maintenance and operational simplicity are critical.
2.1.1. Heat Sinks Cooling Systems
Among passive cooling technologies, aluminum heat sinks with extended fin designs have shown remarkable effectiveness. Hassan's research [7] validated their performance through comprehensive simulation and experimental studies conducted under harsh desert conditions. The investigation revealed that incorporating an aluminum heat sink on the rear surface of solar panels reduced cell temperatures by 16.4% while significantly increasing daily energy output (Figure 4). The heat sink's superior performance results from three primary mechanisms: the extended fin surface area enhances natural convection cooling, aluminum's high thermal conductivity facilitates efficient heat transfer from the panel, and the optimized fin geometry promotes beneficial airflow patterns across the module.
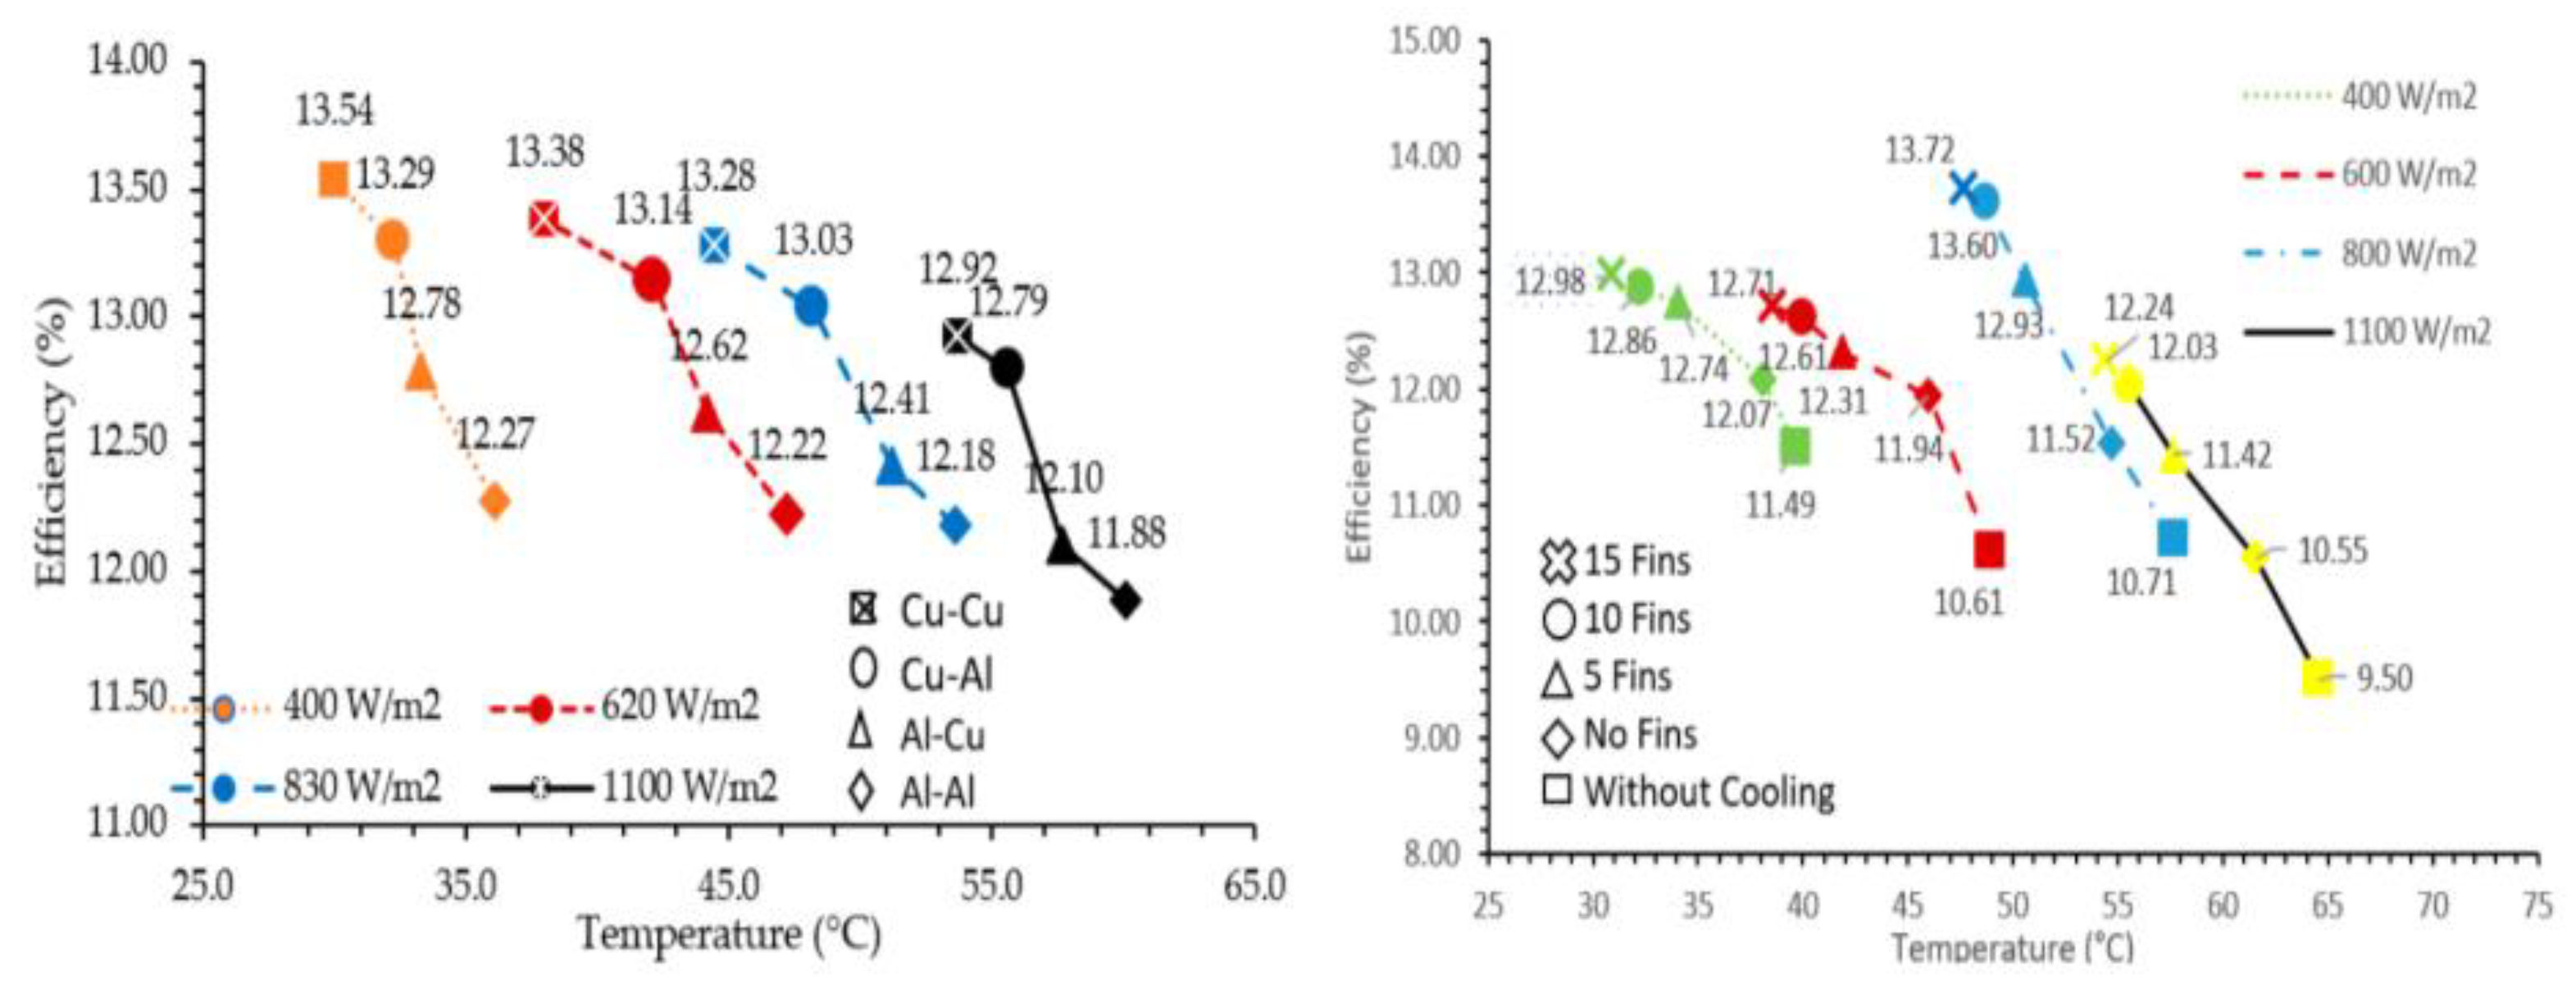
Zainal Arifin's [8] research further optimized heat sink design by testing configurations with varying fin counts and materials (Figure 5).
A significant finding was that :
- -
- 15 fin copper heat sinks provided the best cooling performance, leading to a 10.2°C temperature reduction and a 2.74% improvement in efficiency.
- -
- Increasing the number of fins (tested with 5, 10, and 15 fins) provided better cooling capacity and improved photovoltaic performance, though the improvement from 10 to 15 fins was less significant than from 5 to 10 fins.
- -
- Material choice affected cooling performance , copper performed better than aluminum due to its higher thermal conductivity, with copper-copper heat sinks achieving the lowest temperature of 53.7°C at 1100 W/m2 intensity.
Figure 5.
Effect of heat sink materials and the number of fins on solar cell cooling efficiency [8].
Figure 5.
Effect of heat sink materials and the number of fins on solar cell cooling efficiency [8].
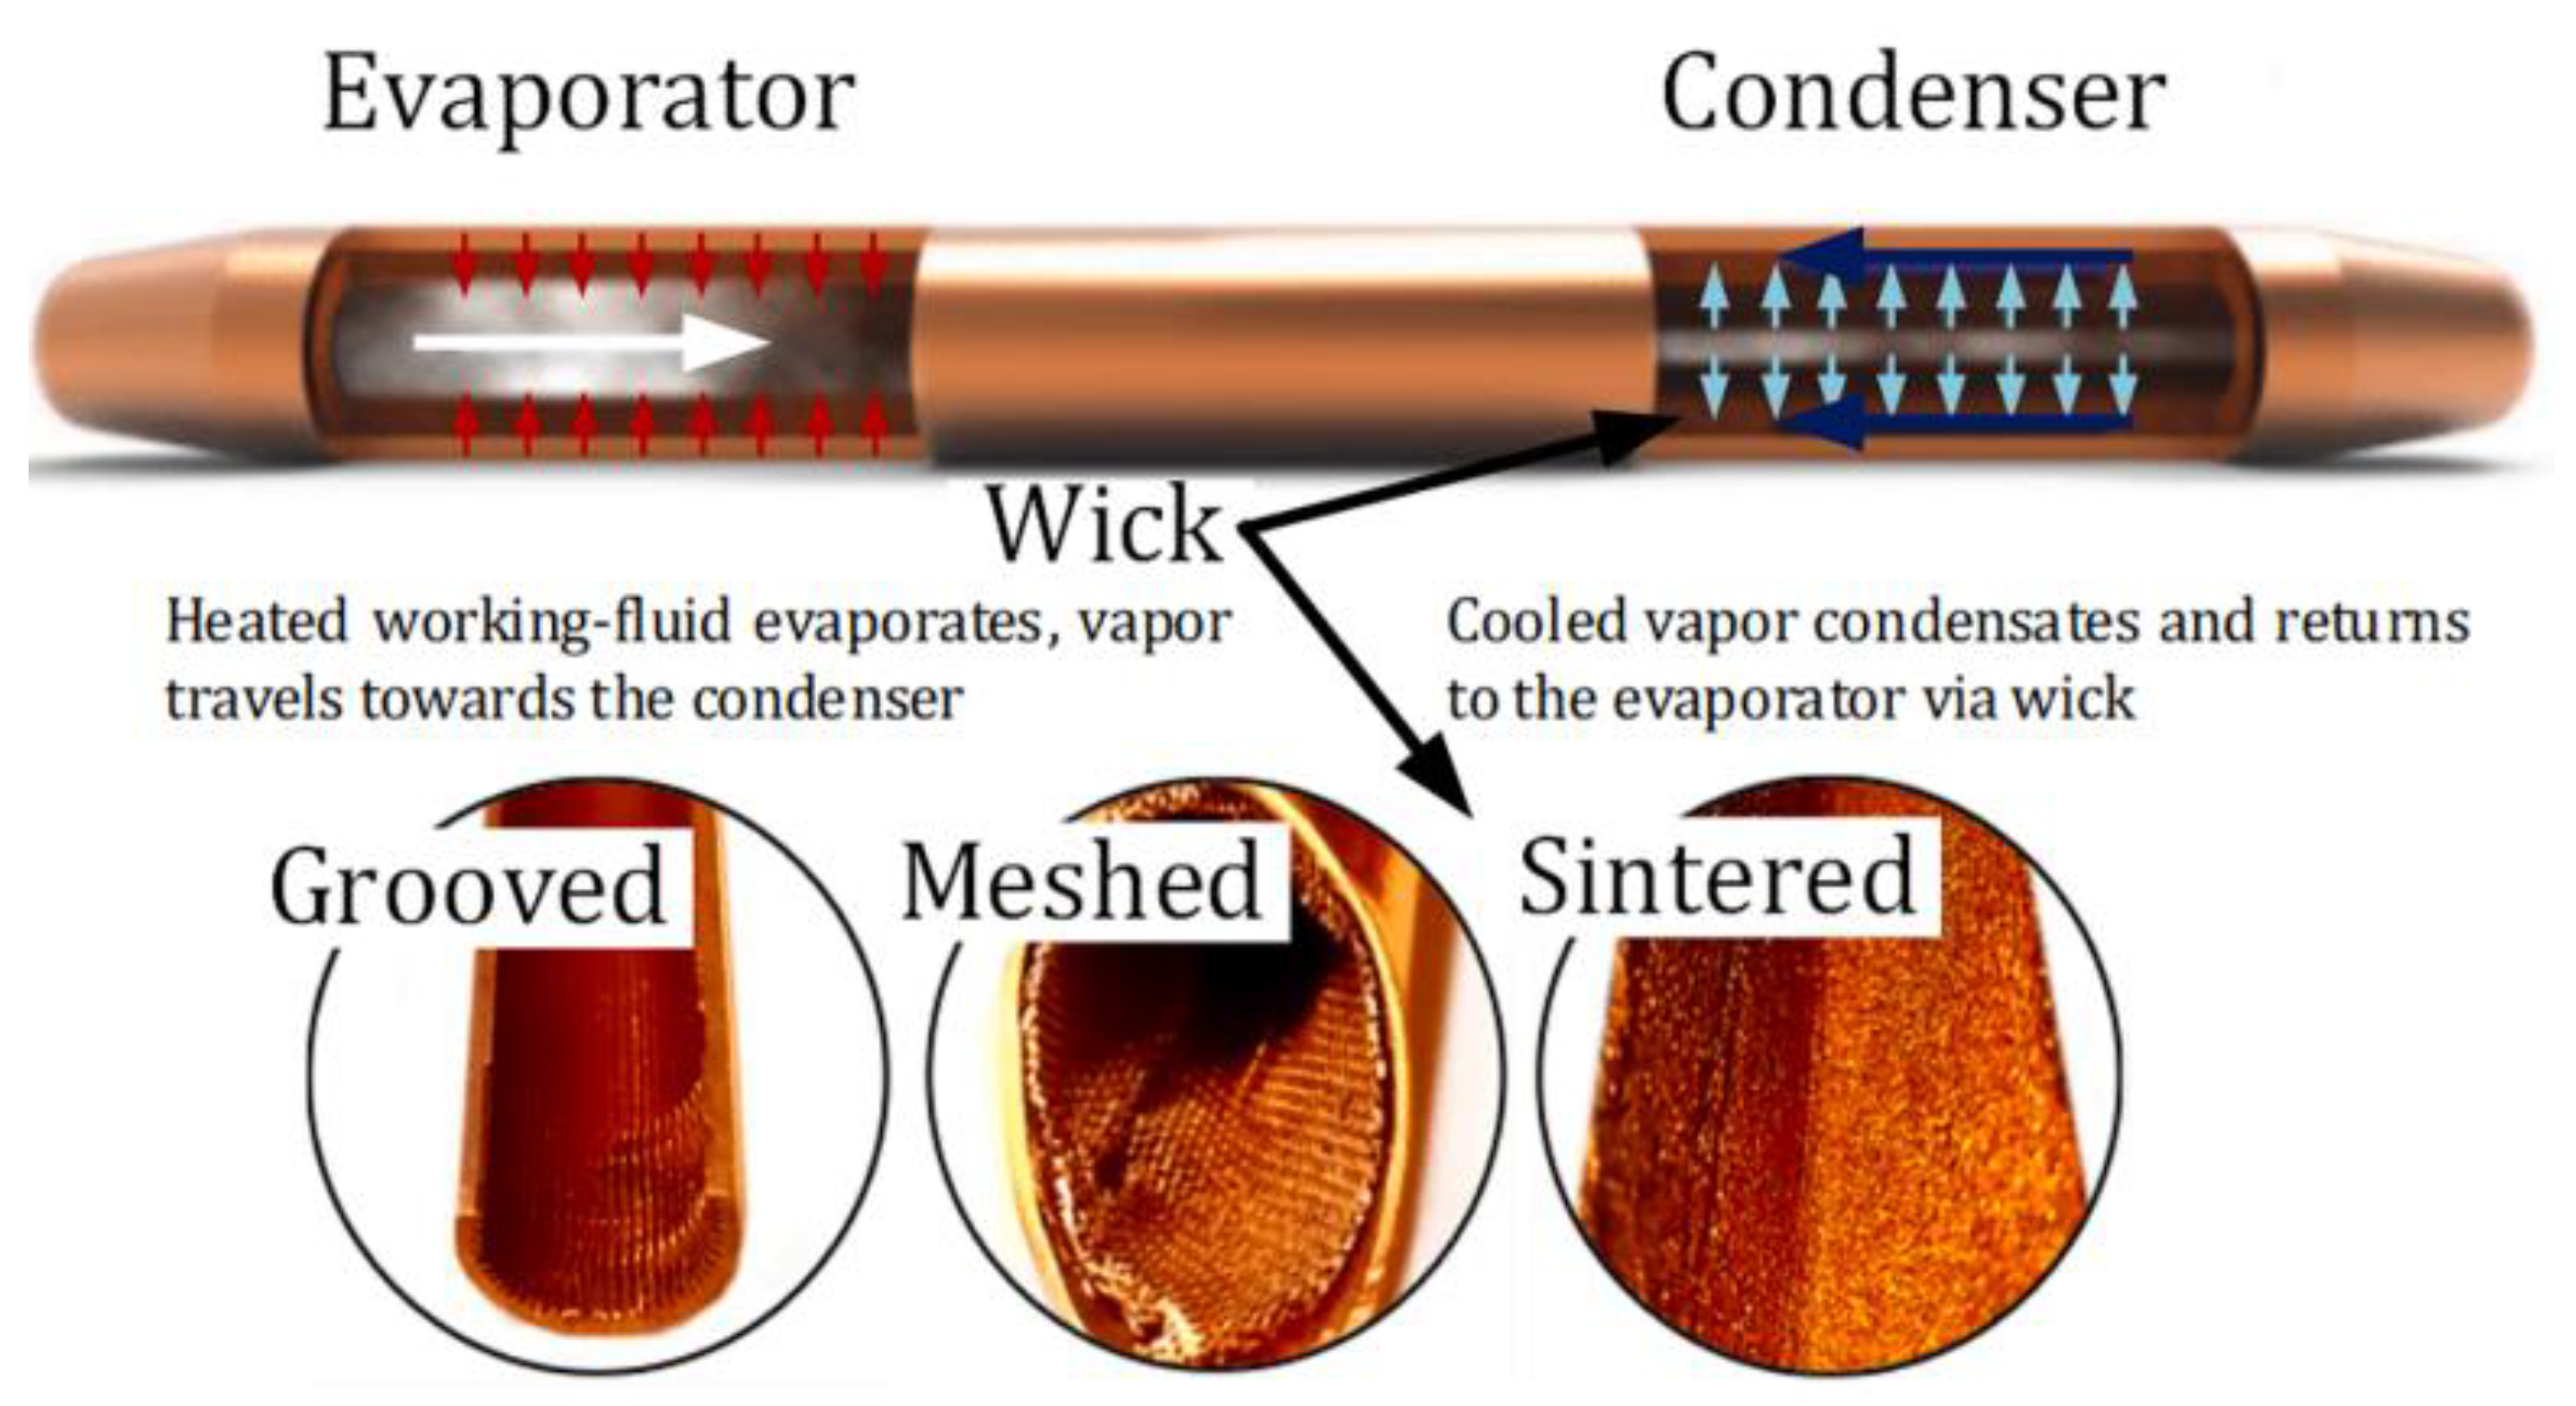
2.1.2. Heat Pipes Cooling Systems
Heat pipes represent another promising passive cooling strategy for PV modules, utilizing phase-change heat transfer (Figure 5) principles to effectively dissipate thermal energy without external power requirements. Initially developed for electronics thermal management, heat pipes are gaining widespread adoption in solar panel applications due to their exceptional efficiency and reliability.
Figure 5.
Schematic of a Copper heat pipe HP together with alternative wick constructions [9].
Figure 5.
Schematic of a Copper heat pipe HP together with alternative wick constructions [9].
Kaneesamkandi's study [10] examined passive PV cooling using a copper heat pipe thermosiphon (HPT) system with acetone working fluid, achieving operating temperature reductions of up to 10°C. This approach delivers improved efficiency without external energy consumption, providing a low-maintenance solution ideally suited for hot climates such as Saudi Arabia (Figure 6).
Ma et al study [11] investigates the effectiveness of a heat pipe-based cooling system (PV-HP) for photovoltaic (PV) modules through experimental and numerical analyses (Figure 7). The results demonstrate that the PV-HP system significantly reduces PV module temperatures compared to uncooled modules, achieving an average temperature drop of 5.47°C (10.36% reduction) and a 9.13% increase in power output. The integration of air cooling further enhances performance, reducing temperatures by up to 8.12°C and improving power output by 10.15%. Numerical simulations reveal that increasing the number of heat pipes and the inclination angle of the condensation section optimizes cooling efficiency, with 14 heat pipes and a 30° angle yielding the best results (12.74% efficiency) (Figure 8).
2.1.3. Phase Change Material (PCM) Cooling Systems
The Phase Change Material (PCM) cooling system, examined by Hassabou [12] for photovoltaic thermal management, utilizes daily temperature fluctuations in hot arid climates to control panel temperatures (Figure 9).
While experimental data demonstrate that PCM-based cooling can reduce PV peak temperatures by 10°C , improving efficiency and lifespan , this method faces challenges such as low thermal conductivity, phase-change volume expansion, and higher costs compared to heat pipes or heat sinks. To overcome these limitations, future research could explore advanced PCM composites or combined systems integrating PCM with heat pipes, offering more efficient and cost-effective passive cooling for photovoltaics. Supporting this approach, Sharifi et al. [13] investigated a hybrid heat pipe-PCM system for lithium-ion batteries (Figure 10 (a) and (b)) , where the PCM was decoupled from the batteries and placed between the pack and an air-cooled section—a departure from conventional direct-contact designs. Experimental and numerical analyses revealed that the PCM reduced battery temperatures by up to 14% at lower air velocities (2–4 m/s) and maintained temperatures below 50°C under cyclic operation (Figure 10 (c) and (d) ).
Passive cooling technologies, such as finned heat sinks and phase change materials (PCMs), offer significant potential for enhancing photovoltaic performance, particularly in environments with limited resources. However, as summarized in Table 2, each method involves unique trade-offs concerning cost, complexity, and overall effectiveness.
2.2. Active Cooling
Active cooling systems significantly improve photovoltaic (PV) performance by using external energy inputs—such as fans, pumps, or refrigeration cycles—to actively remove excess heat. Unlike passive cooling, which depends on natural convection or radiation, active systems offer precise temperature regulation, making them particularly effective in high-irradiance conditions. However, their higher energy consumption and maintenance needs must be weighed against the efficiency improvements they provide.
This study focuses on two main active cooling techniques :
- -
- Forced Air Cooling: Utilizes fans or blowers to enhance convective heat transfer from PV panels. This approach is simple, cost-effective, and commonly employed in commercial installations.
- -
- Liquid-Based Cooling: Employs water, nanofluids, or refrigerants for more efficient heat extraction, particularly in high-performance applications.
2.2.1. Forced Air Cooling Systems
- -
- Natural Convection: Relies on the "chimney effect" with varying air channel dimensions (aspect ratios: 0.0525, 0.0675, 0.0825).
- -
- Forced Convection: Uses fans to drive air at controlled velocities (2–4 m/s) through the channels.
Their findings confirm that PV efficiency declines by approximately 0.4–0.5% per °C temperature rise, primarily due to reduced open-circuit voltage.
Figure 12 demonstrates that forced convection outperforms natural cooling, lowering panel temperatures by up to 16°C and increasing power output by 3–5%. While forced convection delivers superior thermal management, optimized natural convection remains a viable, energy-efficient alternative. These results underscore the importance of system design—particularly air channel sizing—in maximizing PV energy yield.
2.2.2. Forced Liquide Cooling Systems
Forced air and water cooling systems offer fundamentally different solutions for active thermal management of photovoltaic panels, each with distinct advantages in cooling performance and operational complexity.
The key differentiating factors lie in their thermal properties: water's exceptional specific heat capacity (approximately 4200 J/kg·K versus air's 1005 J/kg·K) and higher density (1000 kg/m³ versus 1.225 kg/m³) combine to give water a volumetric heat capacity nearly 3500 times greater than air. This means that for the same volume of coolant, water can absorb about 3500 times more thermal energy than air, enabling far more efficient temperature stabilization even under extreme irradiance conditions.
Performance comparisons reveal significant differences: while forced air systems (operating at 2-4 m/s airflow) typically achieve temperature reductions of 10-16°C, water cooling can lower panel temperatures by 20-30°C due to its superior heat transfer capabilities. Research by S. Odeh et al [13] demonstrates these benefits clearly, showing that a water trickling system can boost PV output by 15% during peak radiation and deliver 5% greater annual energy yield in warm, dry climates (Figure 13).
In addition, Hassan et al [16] conducted an experimental rig evaluation of a PV water cooling system as demonstrated in Figure 14 :
The research found that water cooling significantly improved PV performance by reducing cell temperatures from 83°C to 45°C at 960 W/m² solar irradiation, which increased electrical efficiency from 12% to 14% and boosted power output from 55W to 75W compared to uncooled PV modules (Figure 15). The study demonstrated that higher water flow rates (up to 16 L/min) provided better cooling effects, with the mean PV temperature decreasing as flow rate increased throughout the day. The water-cooled PVT system showed enhanced electrical parameters including improved short-circuit current (3.7 to 4.7 A) and open-circuit voltage (13.2 to 16.8 V) when flow rates increased from 4 to 16 L/min. The findings confirm that water-based cooling is an effective thermal management strategy for PV systems in hot subtropical climates, providing substantial improvements in both electrical efficiency and power generation capacity.
Water and air cooling systems each present distinct advantages and challenges for solar PV panels. Water cooling, while effective for maximizing performance in high-value installations, entails complex plumbing, potential corrosion, and freezing risks. Air cooling, conversely, offers a more practical solution for most commercial PV arrays due to its simpler design, lower maintenance, and absence of leakage concerns. Regardless of the chosen method, optimizing flow parameters and channel configurations is crucial to balance cooling effectiveness with operational energy demands.
2.3. Hybrid Cooling
The emerging hybrid cooling approach strategically combines the advantages of both systems, integrating passive air cooling with active water-based thermal management. This innovative solution leverages water's unmatched cooling capacity during peak thermal loads while utilizing passive air cooling during moderate conditions, optimizing both performance and energy efficiency. The hybrid system represents an intelligent compromise, particularly valuable for installations where maximizing energy output must be balanced against operational complexity and maintenance requirements.
2.3.1. PhotoVoltaic-Thermal (PVT) with Ground Source Heat Pump (GSHP) Systems
Beltran research paper [17] investigates the design of photovoltaic-thermal (PVT) collectors optimized for integration with ground source heat pump (GSHP) systems, focusing on enhancing heat capture from ambient air and heat recovery from the PV panel by water absorber (Figure 16).
Numerical modeling and techno-economic analysis were used to evaluate various absorber designs (Figure 17), materials, and configurations.
- -
- Absorber Design and Materials Evaluation :
The corrugated absorber (CG) design demonstrated superior performance compared to the box channel (BC) design, exhibiting a 30% higher U-value and 15% greater zero-loss efficiency. Interestingly, the selection between aluminum (AL) and polycarbonate (PC) materials had a negligible effect on thermal performance, with less than a 2% difference in U-value, as detailed in Table 3.
- -
- Fins and Forced Convection :
Adding fins significantly enhanced heat capture, particularly for aluminum corrugated absorbers. 10mm, 20mm, and 30mm fins increased U-value by 61%, 82%, and 100% respectively. However, polycarbonate absorbers showed diminishing returns with longer fins due to lower thermal conductivity as illustrated in Table 4 and Figure 18.
- -
- Annual Thermal Output calculation :
Forced convection, specifically with a 4 m/s airflow, was found to double the U-value of finless absorbers. In aluminum finned designs, the annual thermal energy output surpassed 2, 000 kWh/m²-yr when the mean fluid temperature was 5°C, even without forced convection. From a cost-effectiveness standpoint, the corrugated polycarbonate (CG-PC) absorber emerged as the optimal choice. It achieved the highest energy-to-mass ratio, exceeding aluminum CG-AL) by 50%, and demonstrated superior energy-to-cost performance, despite its lower absolute thermal output. These findings are illustrated in Table 4 and Figure 19, respectively.
This paper [17] offers valuable insights into PVT collector design for heat pump applications, focusing on both technical performance and economic viability. This aligns with current renewable energy trends by emphasizing ambient heat recovery from PV systems and low-temperature operation.
2.3.2. PV/T-PCM Cooling Systems
The experimental study by Sarafraz et al. [18] (Figure 20) investigated a hybrid PV/T-PCM cooling system utilizing MWCNT (Multi-Walled Carbon NanoTubes) enhanced WEG50 (Water/Ethylene Glycol, 50:50) nanofluid at an optimal concentration of 0.2 wt%.
The integration of MWCNT-based nanofluid and PCM significantly improved PV performance by enhancing thermal energy absorption, reducing panel surface temperature, and increasing electrical power output by ~20%. Notably, 45% of the total electricity generation occurred between 12:30 PM and 3:30 PM, confirming the system’s effectiveness during peak solar irradiance.
The low nanoparticle concentration (0.2 wt%) ensured stable nanofluid dispersion while minimizing pumping power losses, and the PCM further contributed to efficient thermal regulation.
These results demonstrate that the hybrid nanofluid-PCM water cooling approach is particularly promising for PV applications in high-temperature climates, where excessive heat typically degrades efficiency.
However, further research is needed to assess long-term stability, durability, and economic viability for large-scale implementation
3. Conclusion
This review underscores the importance of strategic selection among photovoltaic cooling technologies, emphasizing a tripartite evaluation framework encompassing environmental suitability, economic feasibility, and energy requirements.
Passive cooling systems, characterized by their low cost and minimal maintenance, deliver moderate temperature regulation ideal for temperate climates but face inherent limitations in cooling capacity.
In contrast, active systems , though superior in performance, entail higher energy consumption and operational complexity, rendering them less viable for resource-constrained environments, particularly arid regions with water scarcity.
Hybrid systems emerge as a transformative solution, synergizing the reliability of passive methods (e.g., ground-source heat exchange in PVT-GSHP systems) with the precision of active thermal management to achieve exceptional performance (>2, 000 kWh/m²-yr). The integration of heat recovery mechanisms, such as thermal storage and heat pumps, further elevates system efficiency by repurposing waste heat, aligning with circular economy principles.
Innovations like nanofluid-enhanced PCMs also address traditional material limitations, though challenges persist in scalability, long-term durability, and cost competitiveness.
Future efforts must prioritize these key areas to fully realize the potential of these technologies :
- -
- Material Science : Develop low-cost, high-conductivity Phase Change Material (PCM) composites.
- -
- System Integration : Optimize hybrid designs for various climatic and infrastructural contexts.
- -
- Economic Models : Conduct lifecycle cost analyses to validate commercial viability.
By bridging these gaps, advanced PV cooling systems will play a pivotal role in enhancing the efficiency and sustainability of global solar energy infrastructure, accelerating the transition to a decarbonized energy future.
Author Contributions
Writing and original draft, A.B.; supervision, B.E., M.R.; writing—review and editing, A.B. , N.C., B.E. and M.R.. All authors have read and agreed to the published version of the manuscript.
Funding
This research received no external funding.
Conflicts of Interest
The authors declare no conflict of interest.
References
- IEA Website. Available online: Share of renewable electricity generation by technology, 2000-2030 – Charts – Data & Statistics - IEA, (accessed on 3 July 2025).
- Griffith, J.S.; Rathod, N.S.; Paslaski, J. Some tests of flat plate photovoltaic module cell temperatures in simulated field conditions. Proc. 15th IEEE Photovoltaic Specialists Conf., Kissimmee, FL, 1981; pp. 822–830. [Google Scholar]
- Dubey, S.; Sarvaiya, J.N.; Seshadri, B. Temperature Dependent Photovoltaic (PV) Efficiency and Its Effect on PV Production in the World A Review. Energy Procedia 2013, 33, 311–321. [Google Scholar] [CrossRef]
- Chen, P.H.; Chen, W.S.; Lee, C.H.; Wu, J.Y. Comprehensive Review of Crystalline Silicon Solar Panel Recycling: From Historical Context to Advanced Techniques. Sustainability 2024, 16, 60. [Google Scholar] [CrossRef]
- Kazem, A.A.; Chaichanb, M. T.; Kazem, H.A. Dust effect on photovoltaic utilization in Iraq: Review article. Renewable and Sustainable Energy Reviews 2014, 37, 734–749. [Google Scholar] [CrossRef]
- Kaneesamkandi, Z.; Ur Rehman, A. Selection of a Photovoltaic Panel Cooling Technique Using Multi-Criteria Decision Analysis. Applied Sciences 2023, 13, 1949. [Google Scholar] [CrossRef]
- Hassan, Y.; Orabi, M.; Alshereef, A.; Alrabghi, O. Improvement of Extracted Power of Pole Mounted Solar Panels by Effective Cooling Using Aluminum Heat Sink under Hot Weather and Variable Wind Speed Conditions. Energies 2020, 13, 3159. [Google Scholar] [CrossRef]
- Arifin, Z.; Suyitno, S.; Dominicus, D.P.T.; Juwana, W.E. The Effect of Heat Sink Properties on Solar Cell Cooling Systems. Applied Sciences 2020, 10, 7919. [Google Scholar] [CrossRef]
- Wrobel, R.; McGlen, R.J. Heat pipes in thermal management of electrical machines – A review. Thermal Science and Engineering Progress 2021, 26, 101053. [Google Scholar] [CrossRef]
- Kaneesamkandi, Z.; Almalki, M.J.; Sayeed, A.; Haidar, Z.A. Passive Cooling of PV Modules Using Heat Pipe Thermosiphon with Acetone: Experimental and Theoretical Study. Applied Sciences 2023, 13, 1457. [Google Scholar] [CrossRef]
- Ma, S.; Jin, Y.; Alam, F. Heat Pipe-Based Cooling Enhancement for Photovoltaic Modules: Experimental and Numerical Investigation. Energies 2024, 17, 4272. [Google Scholar] [CrossRef]
- Hassabou, A.; Isaifan, R.J. Simulation of Phase Change Material Absorbers for Passive Cooling of Solar Systems. Energies 2022, 15, 9288. [Google Scholar] [CrossRef]
- Sharifi, N.; Shabgard, H.; Millard, C.; Etufugh, U. Hybrid Heat Pipe-PCM-Assisted Thermal Management for Lithium-Ion Batteries. Batteries 2025, 11, 64. [Google Scholar] [CrossRef]
- Hernández, R.M.; IsaifanGarcía-Cascales, J.R. Improving the Electrical Parameters of a Photovoltaic Panel byMeans of an Induced or Forced Air Stream. International Journal of Photoenergy 2013, 2013. [Google Scholar] [CrossRef]
- Odeh, S.; Behnia, M. Improving Photovoltaic Module Efficiency Using Water Cooling. Heat Transfer Engineering (Taylor & Francis Group) 2009, 30, 499–505. [Google Scholar] [CrossRef]
- Hasan, H.A.; Sherza, J.S.; Mahdi, J.M.; Togun, H.; Abed, A.M.; Ibrahim, R.K.; Yaïci, W. Experimental Evaluation of the Thermoelectrical Performance of Photovoltaic-Thermal Systems with a Water-Cooled Heat Sink. Sustainability 2022, 14, 10231. [Google Scholar] [CrossRef]
- Beltrán, F.; Sommerfeldt, N. Cold solar : PVT heat exchanger designs for heat pump integration. Applied Thermal Engineering 261 2025, 125020. [Google Scholar] [CrossRef]
- Sarafraz, M.M.; Safaei, M.R. Experimental Investigation on Thermal Performance of a PV/T-PCM (Photovoltaic/Thermal) System Cooling with a PCM and Nanofluid. Energies 2019, 12, 2572. [Google Scholar] [CrossRef]
Figure 1.
IAE Share of renewable electricity generation by technology, 2000-2030 [1].
Figure 1.
IAE Share of renewable electricity generation by technology, 2000-2030 [1].
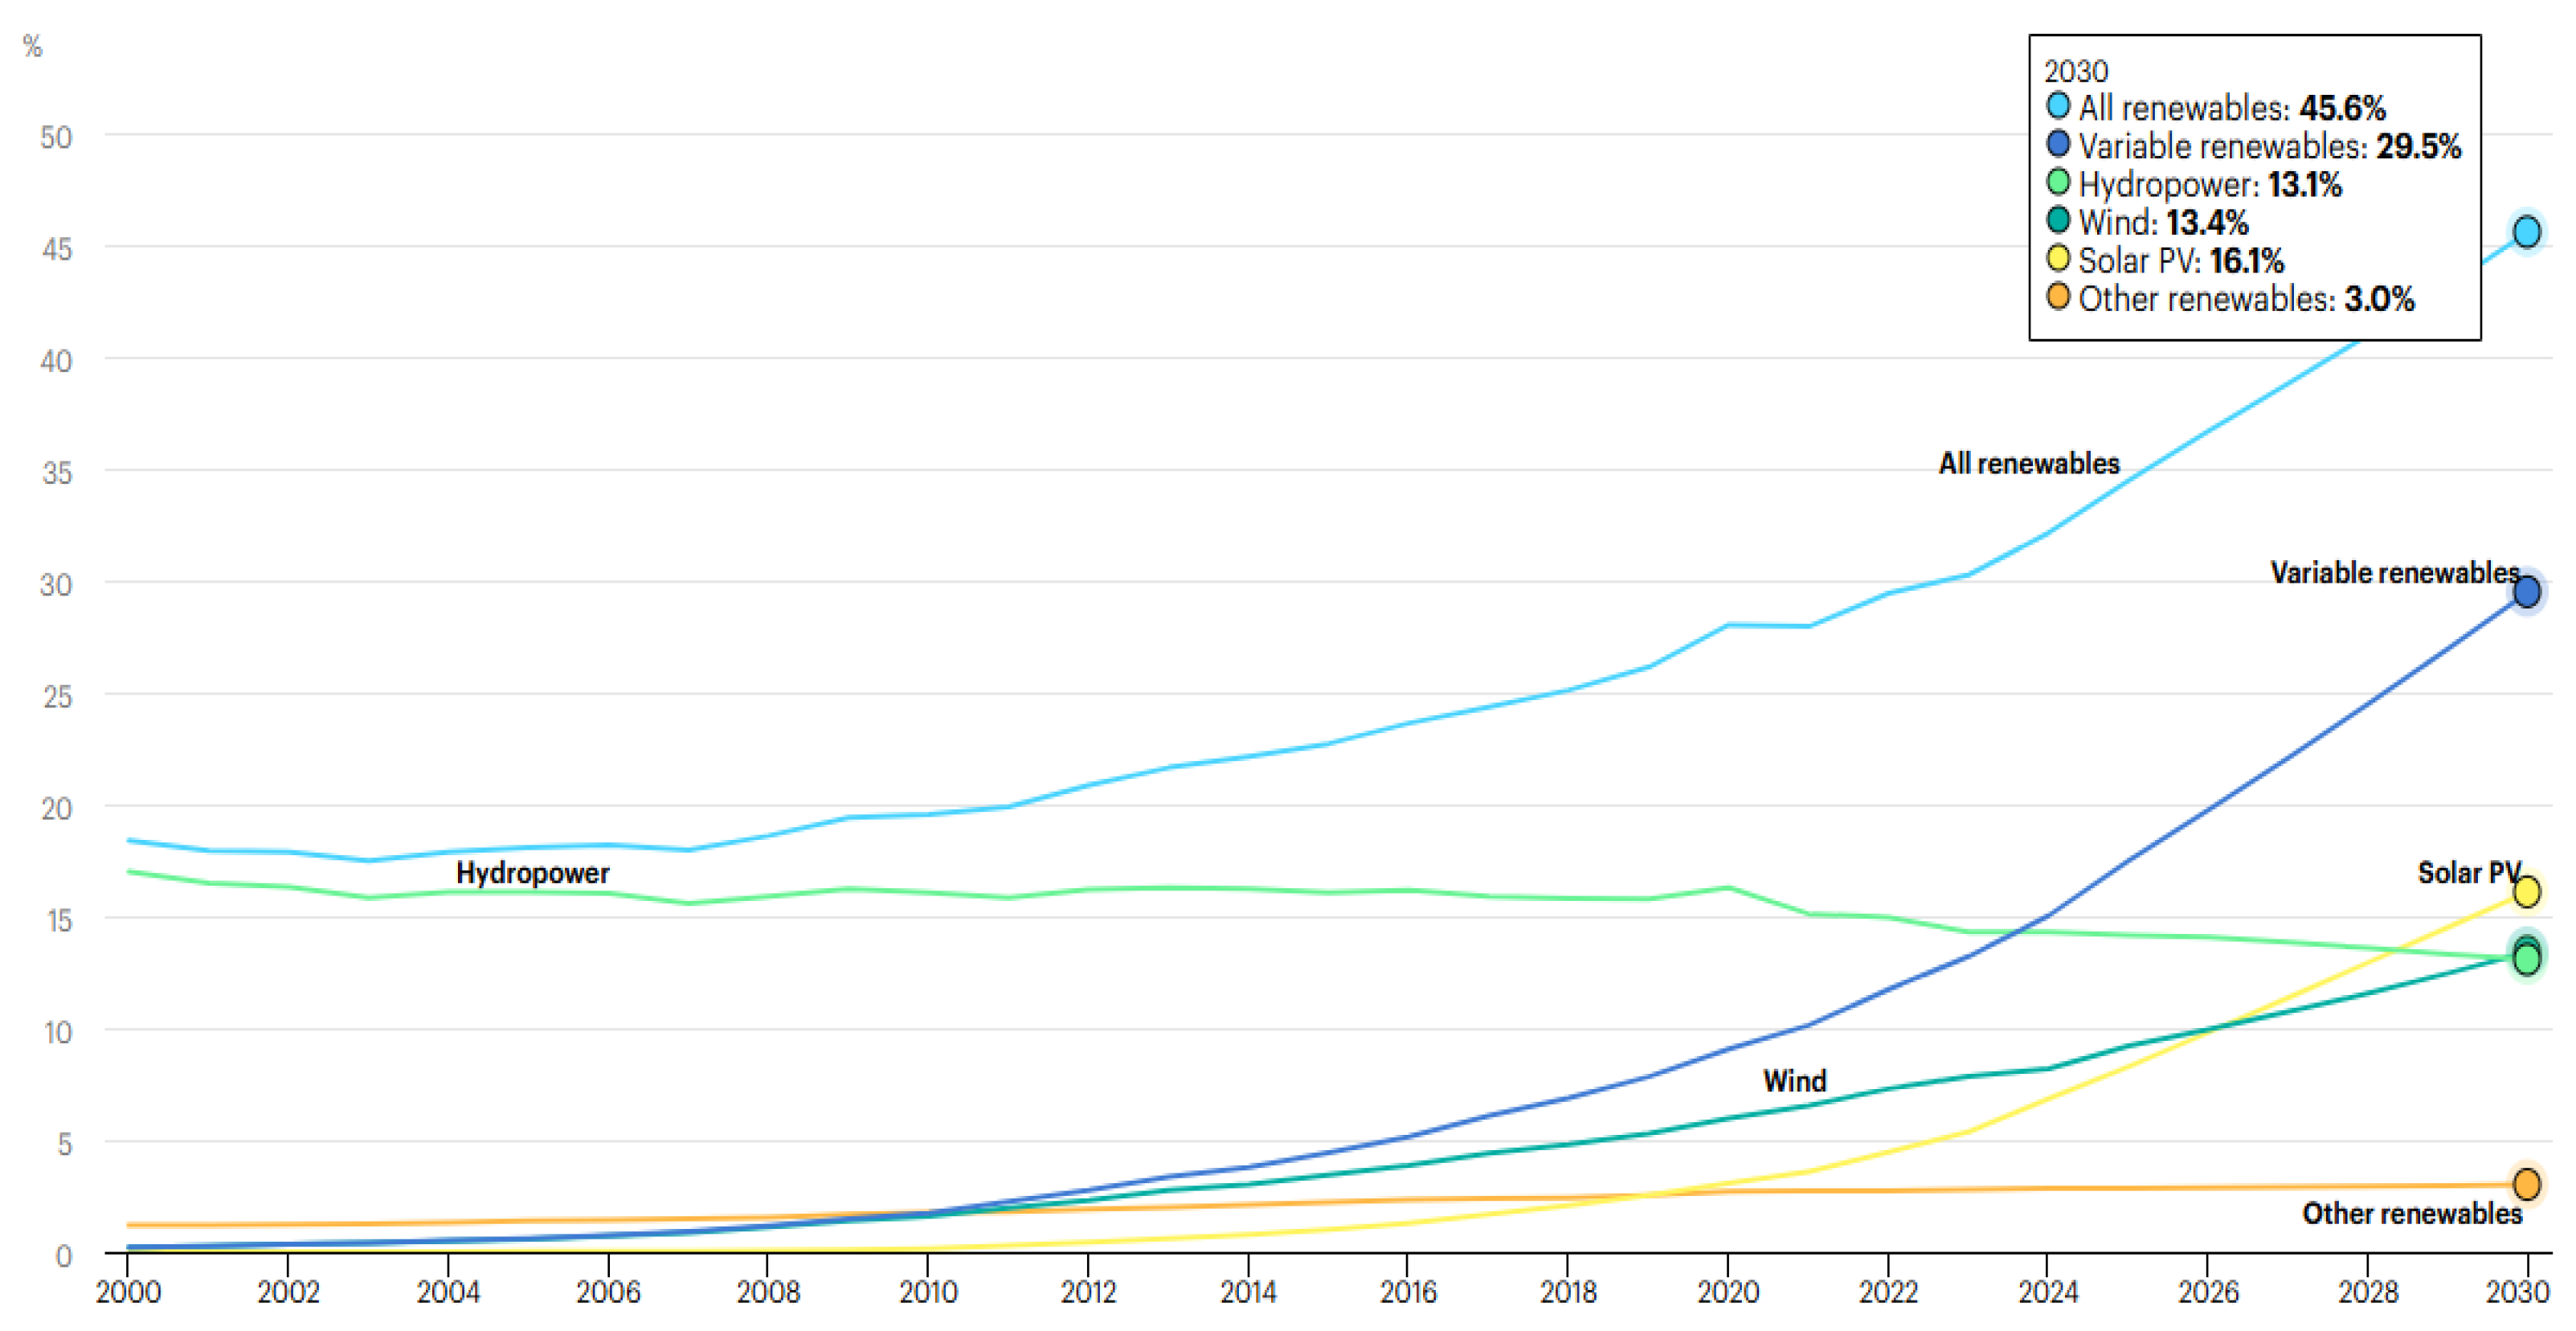
Figure 2.
The composition of some crystalline silicon solar PV panels [4].
Figure 2.
The composition of some crystalline silicon solar PV panels [4].
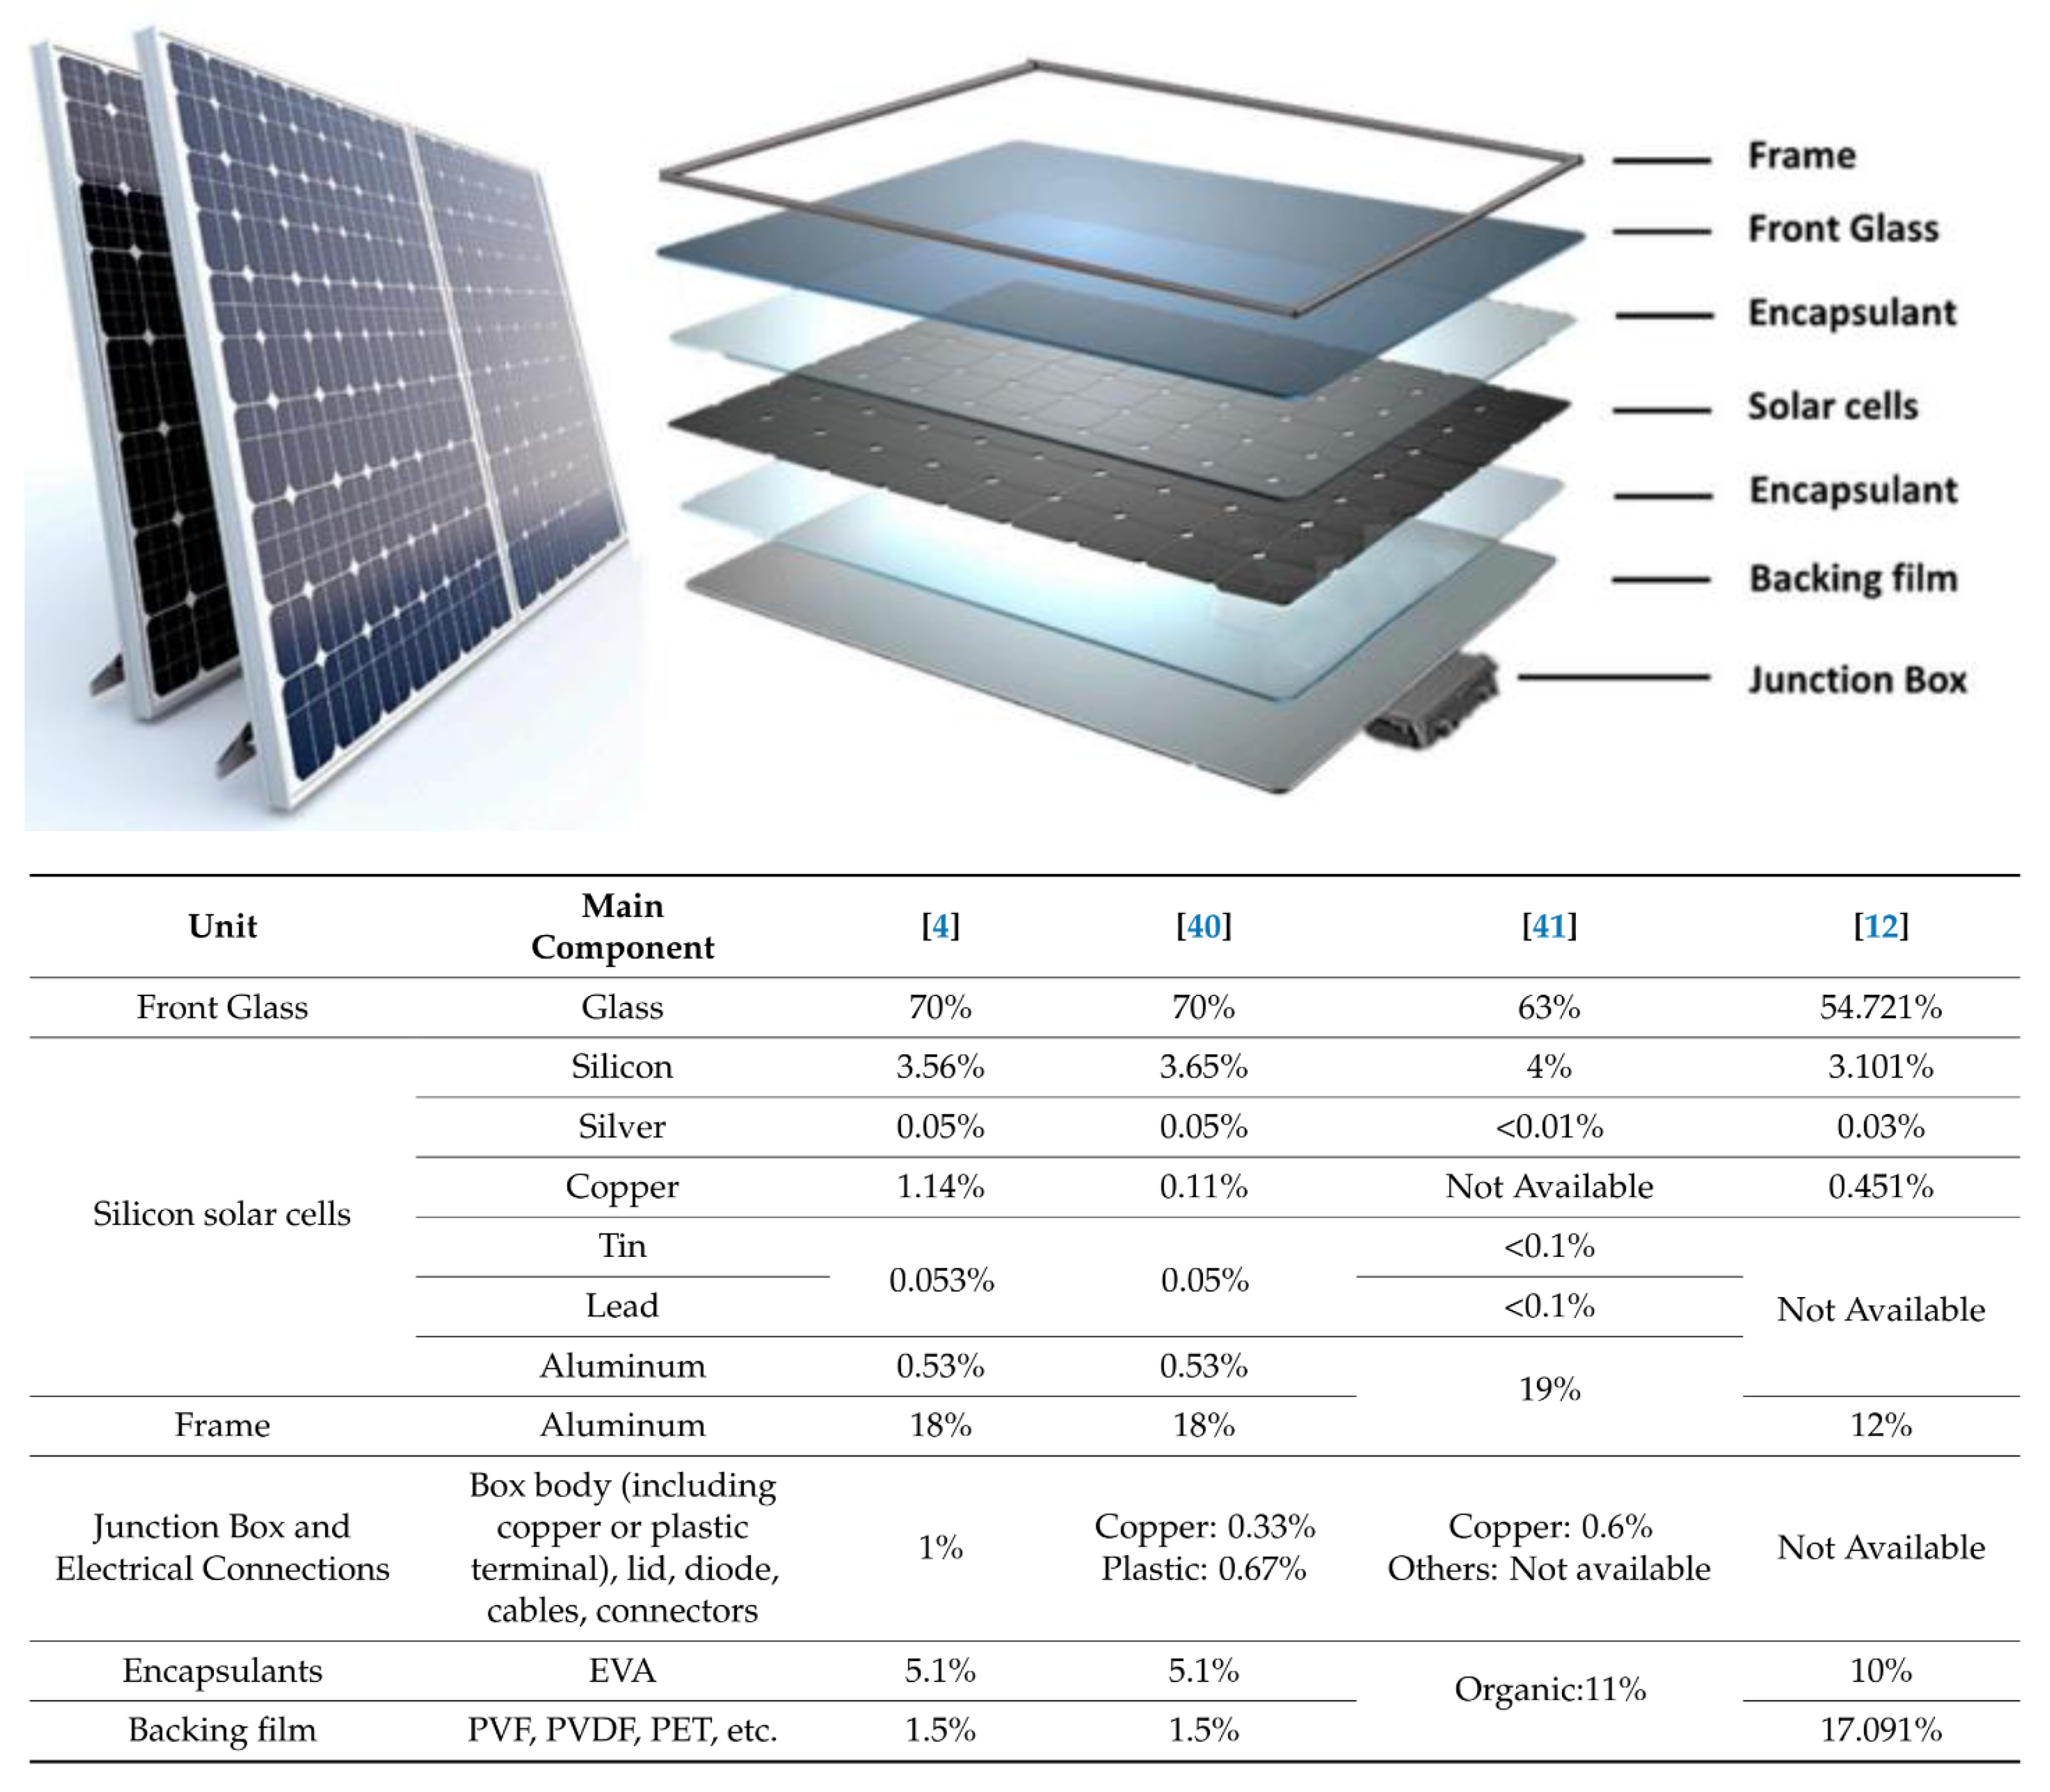
Figure 3.
Schematic and innovative classification of cooling PV and CPV modules [6].
Figure 3.
Schematic and innovative classification of cooling PV and CPV modules [6].
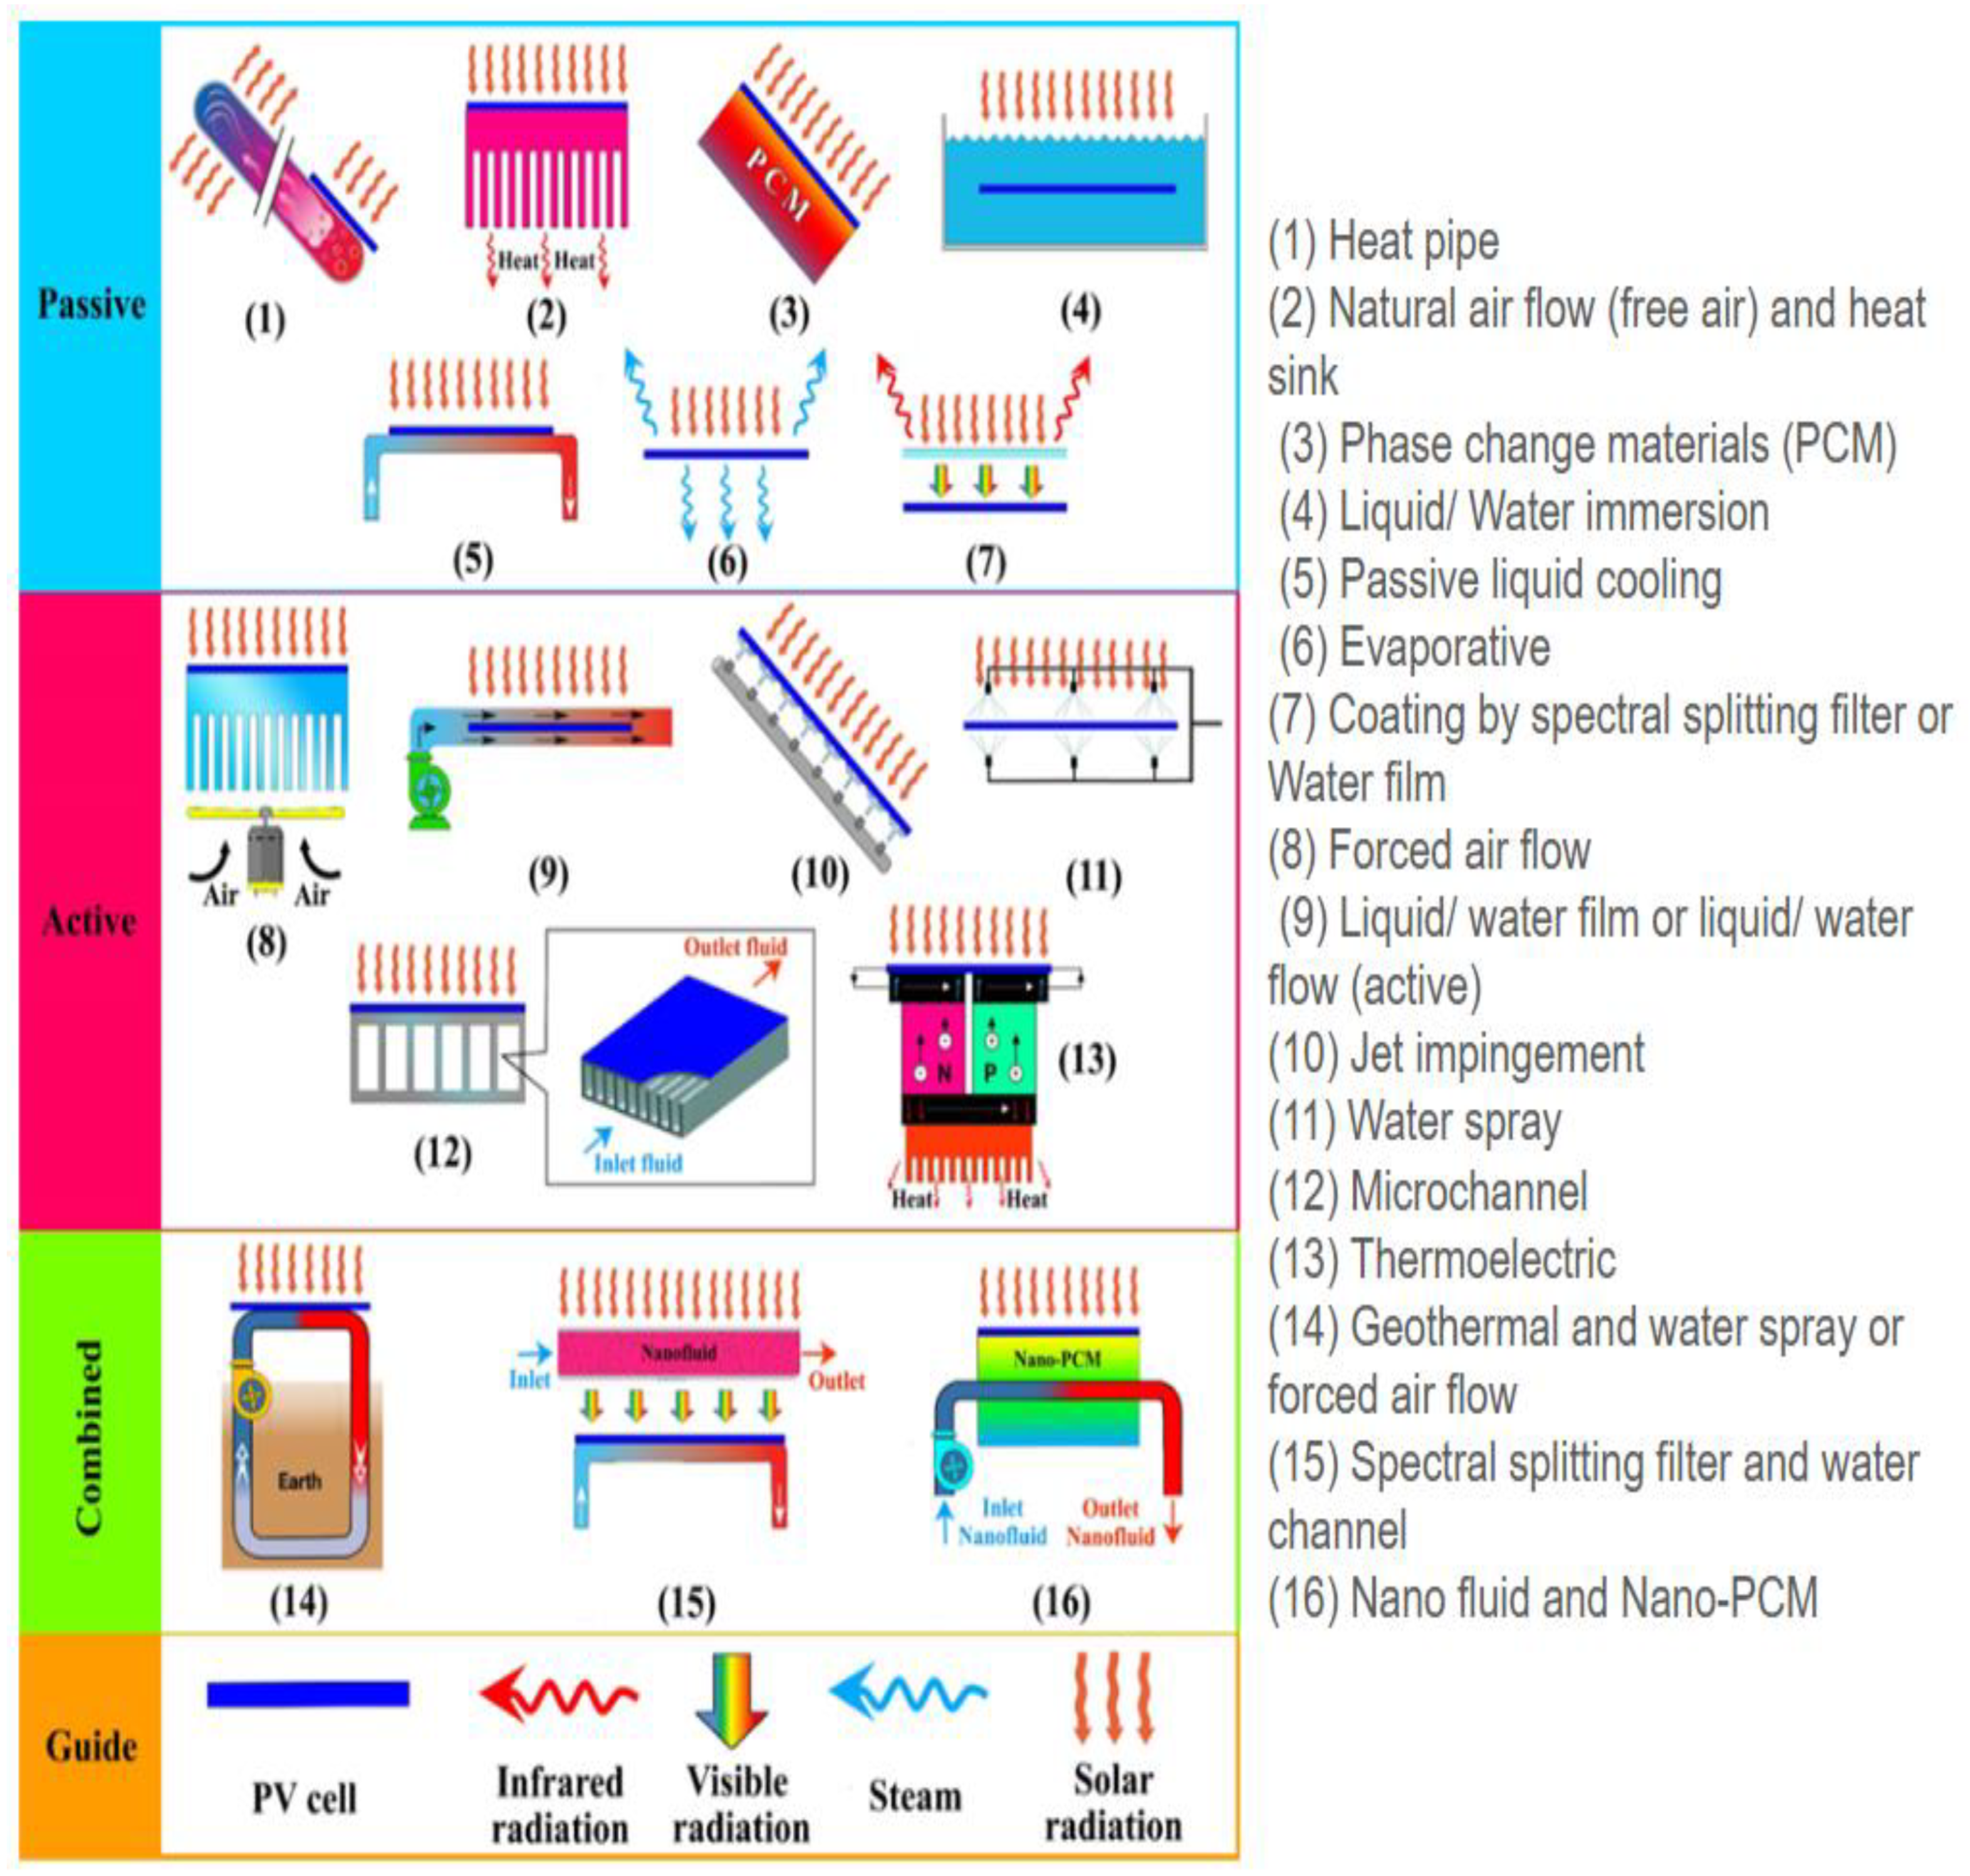
Figure 4.
Solar cell temperature for various hours and wind speeds with and without installation of the aluminum heat sink [7].
Figure 4.
Solar cell temperature for various hours and wind speeds with and without installation of the aluminum heat sink [7].
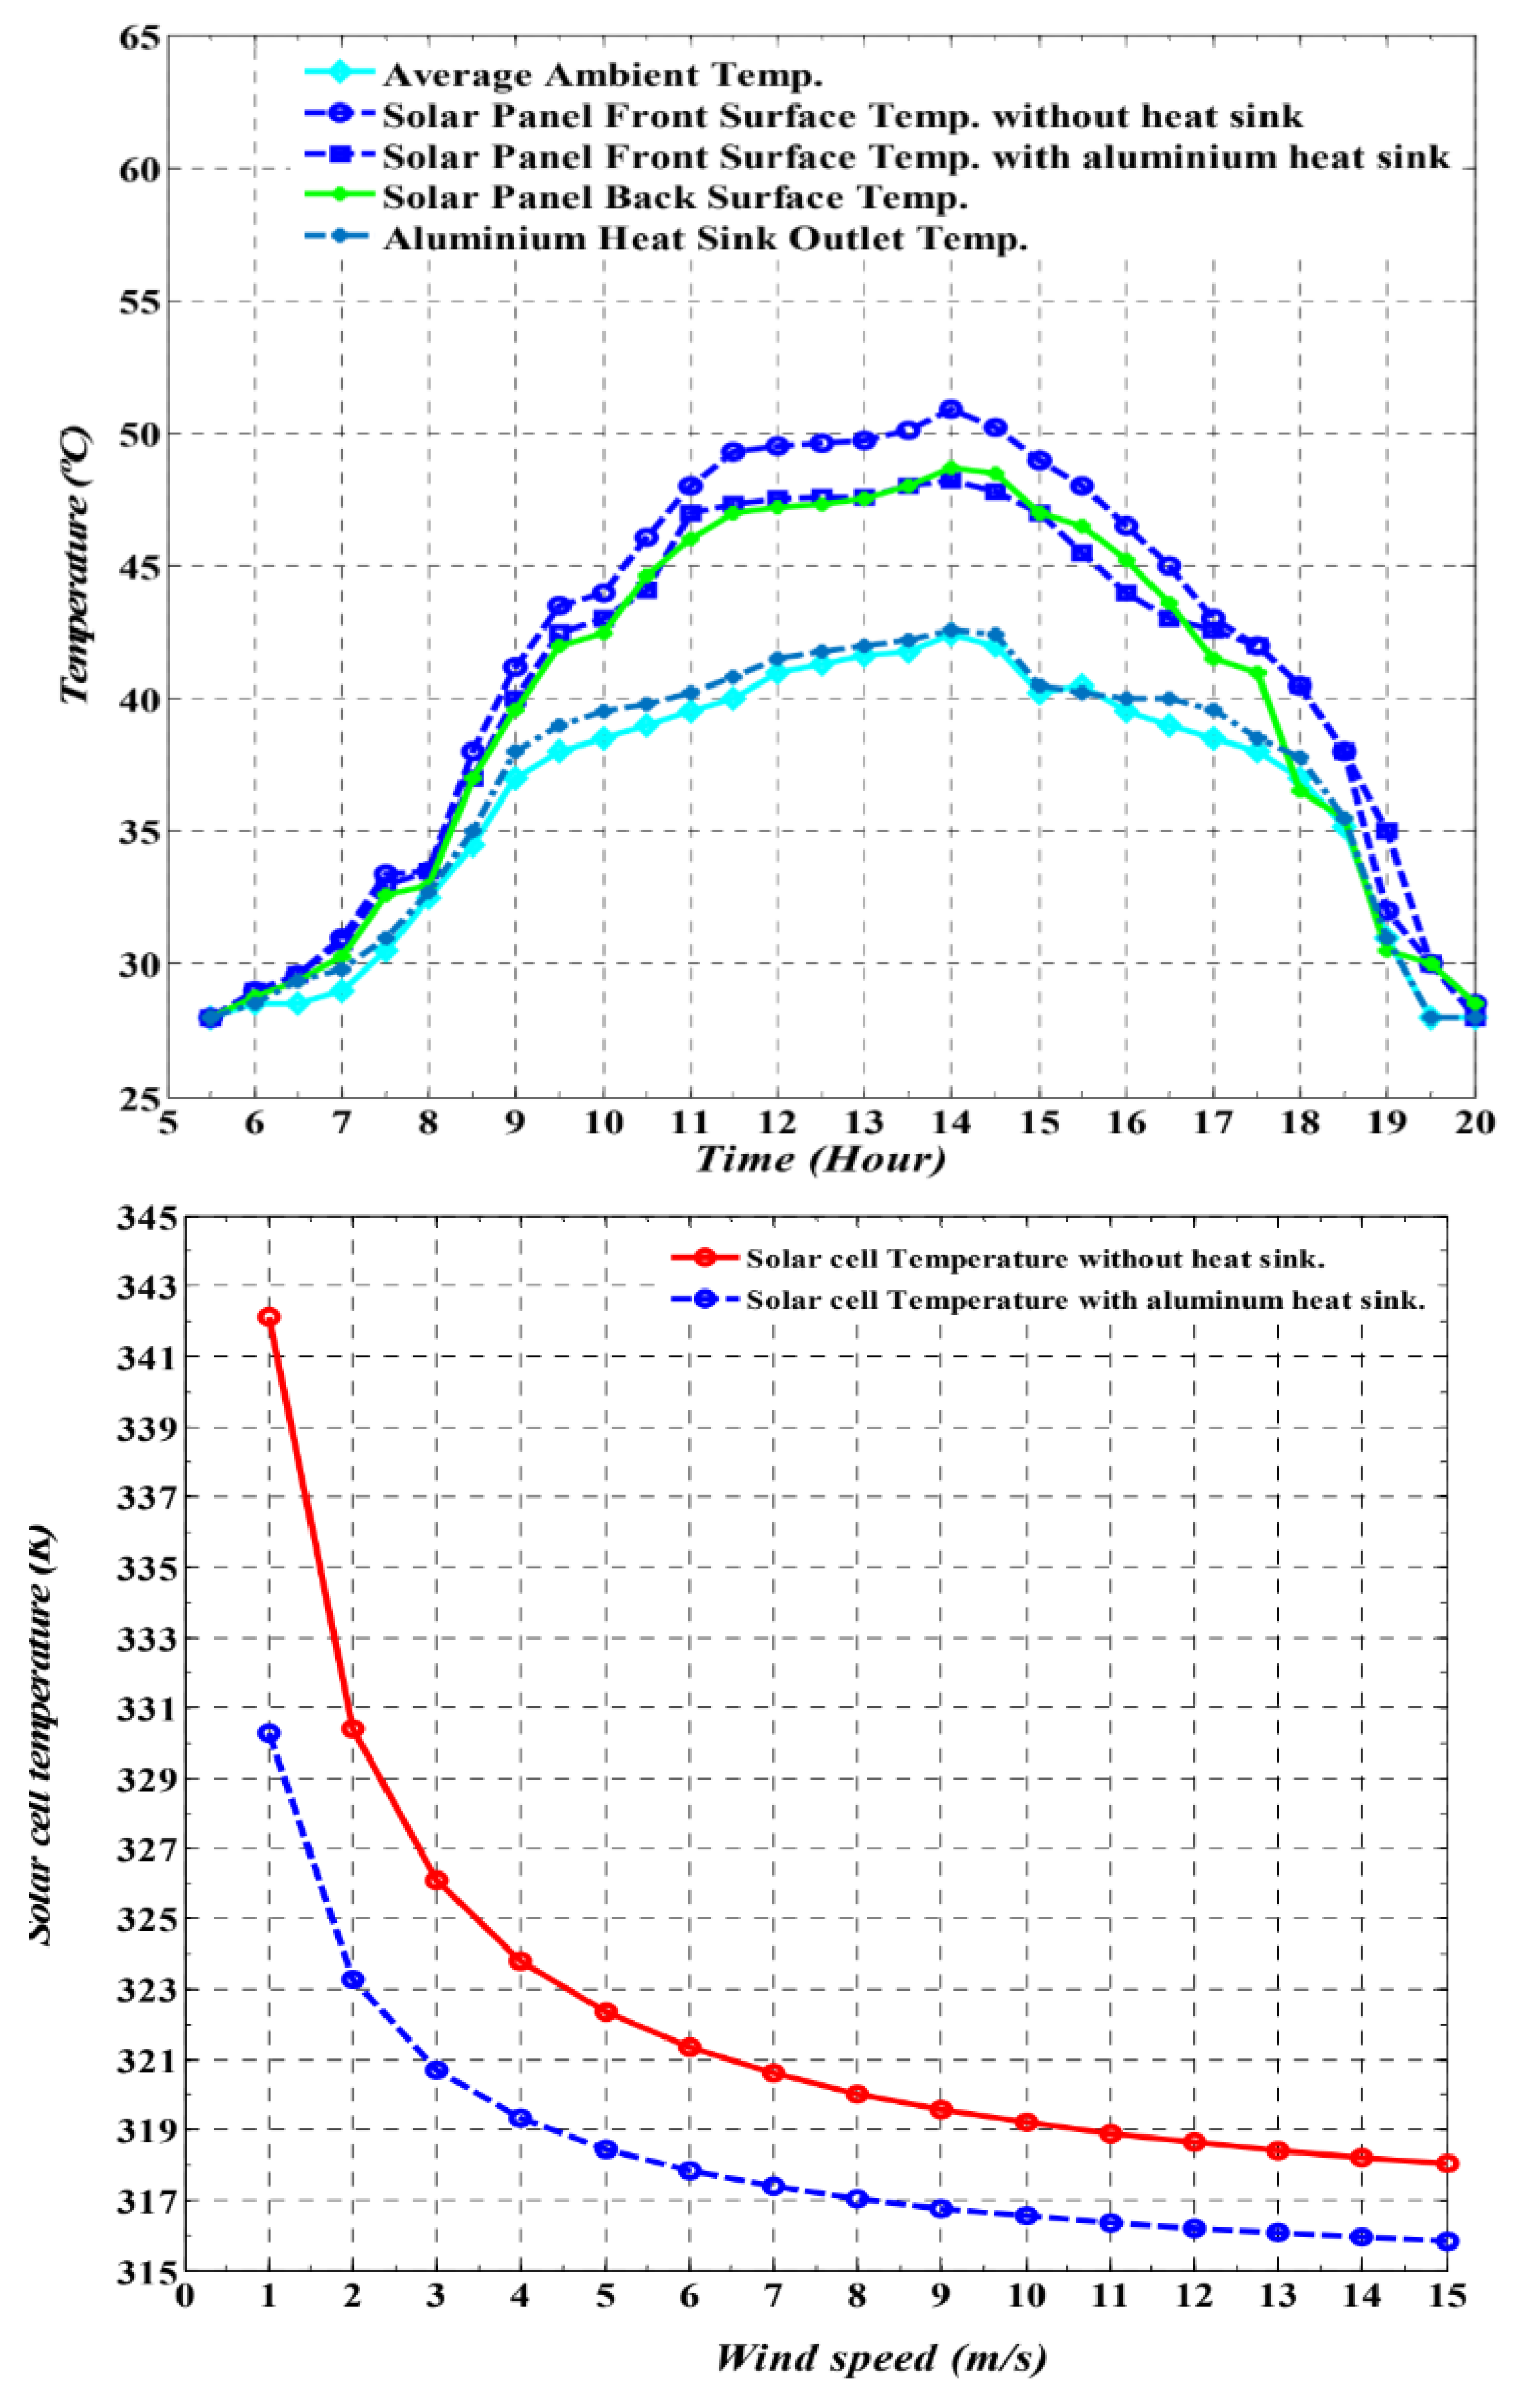
Figure 6.
The temperature of the reference PV panel and cooled PV with HPT 50 mL acetone [10].
Figure 6.
The temperature of the reference PV panel and cooled PV with HPT 50 mL acetone [10].
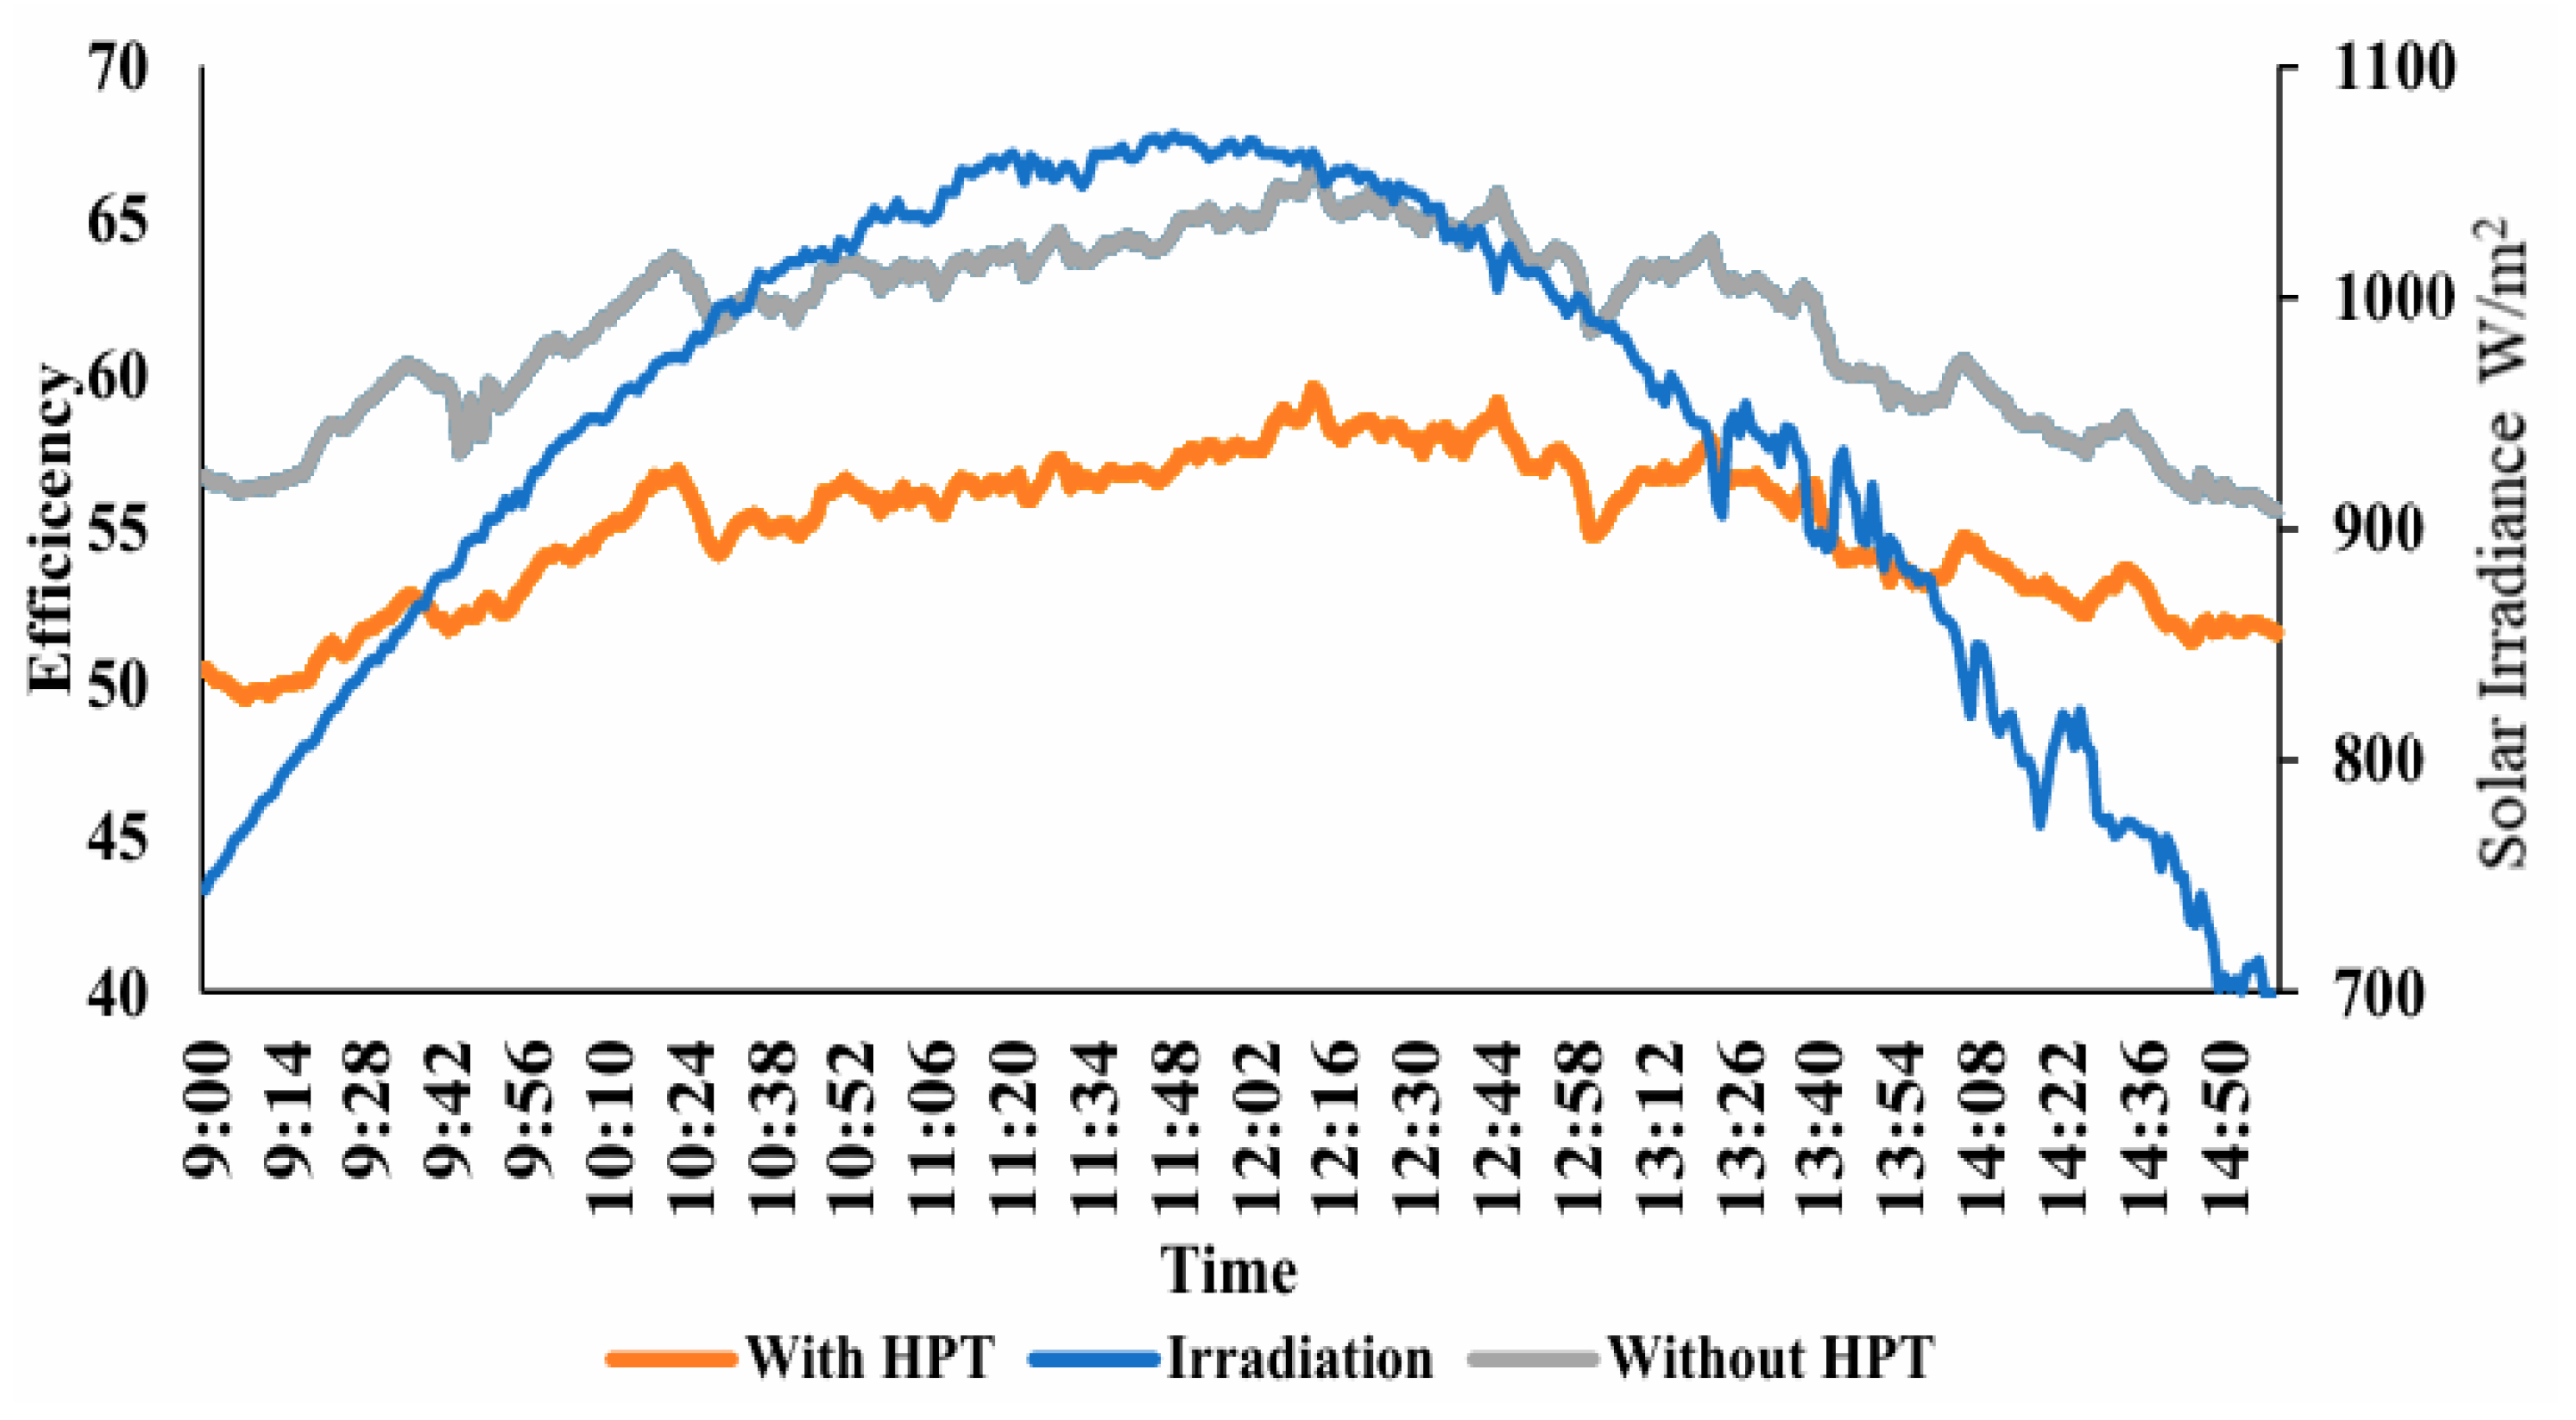
Figure 7.
Schematic and picture of setting the angle at 30° for the HP cooling system [11].
Figure 7.
Schematic and picture of setting the angle at 30° for the HP cooling system [11].
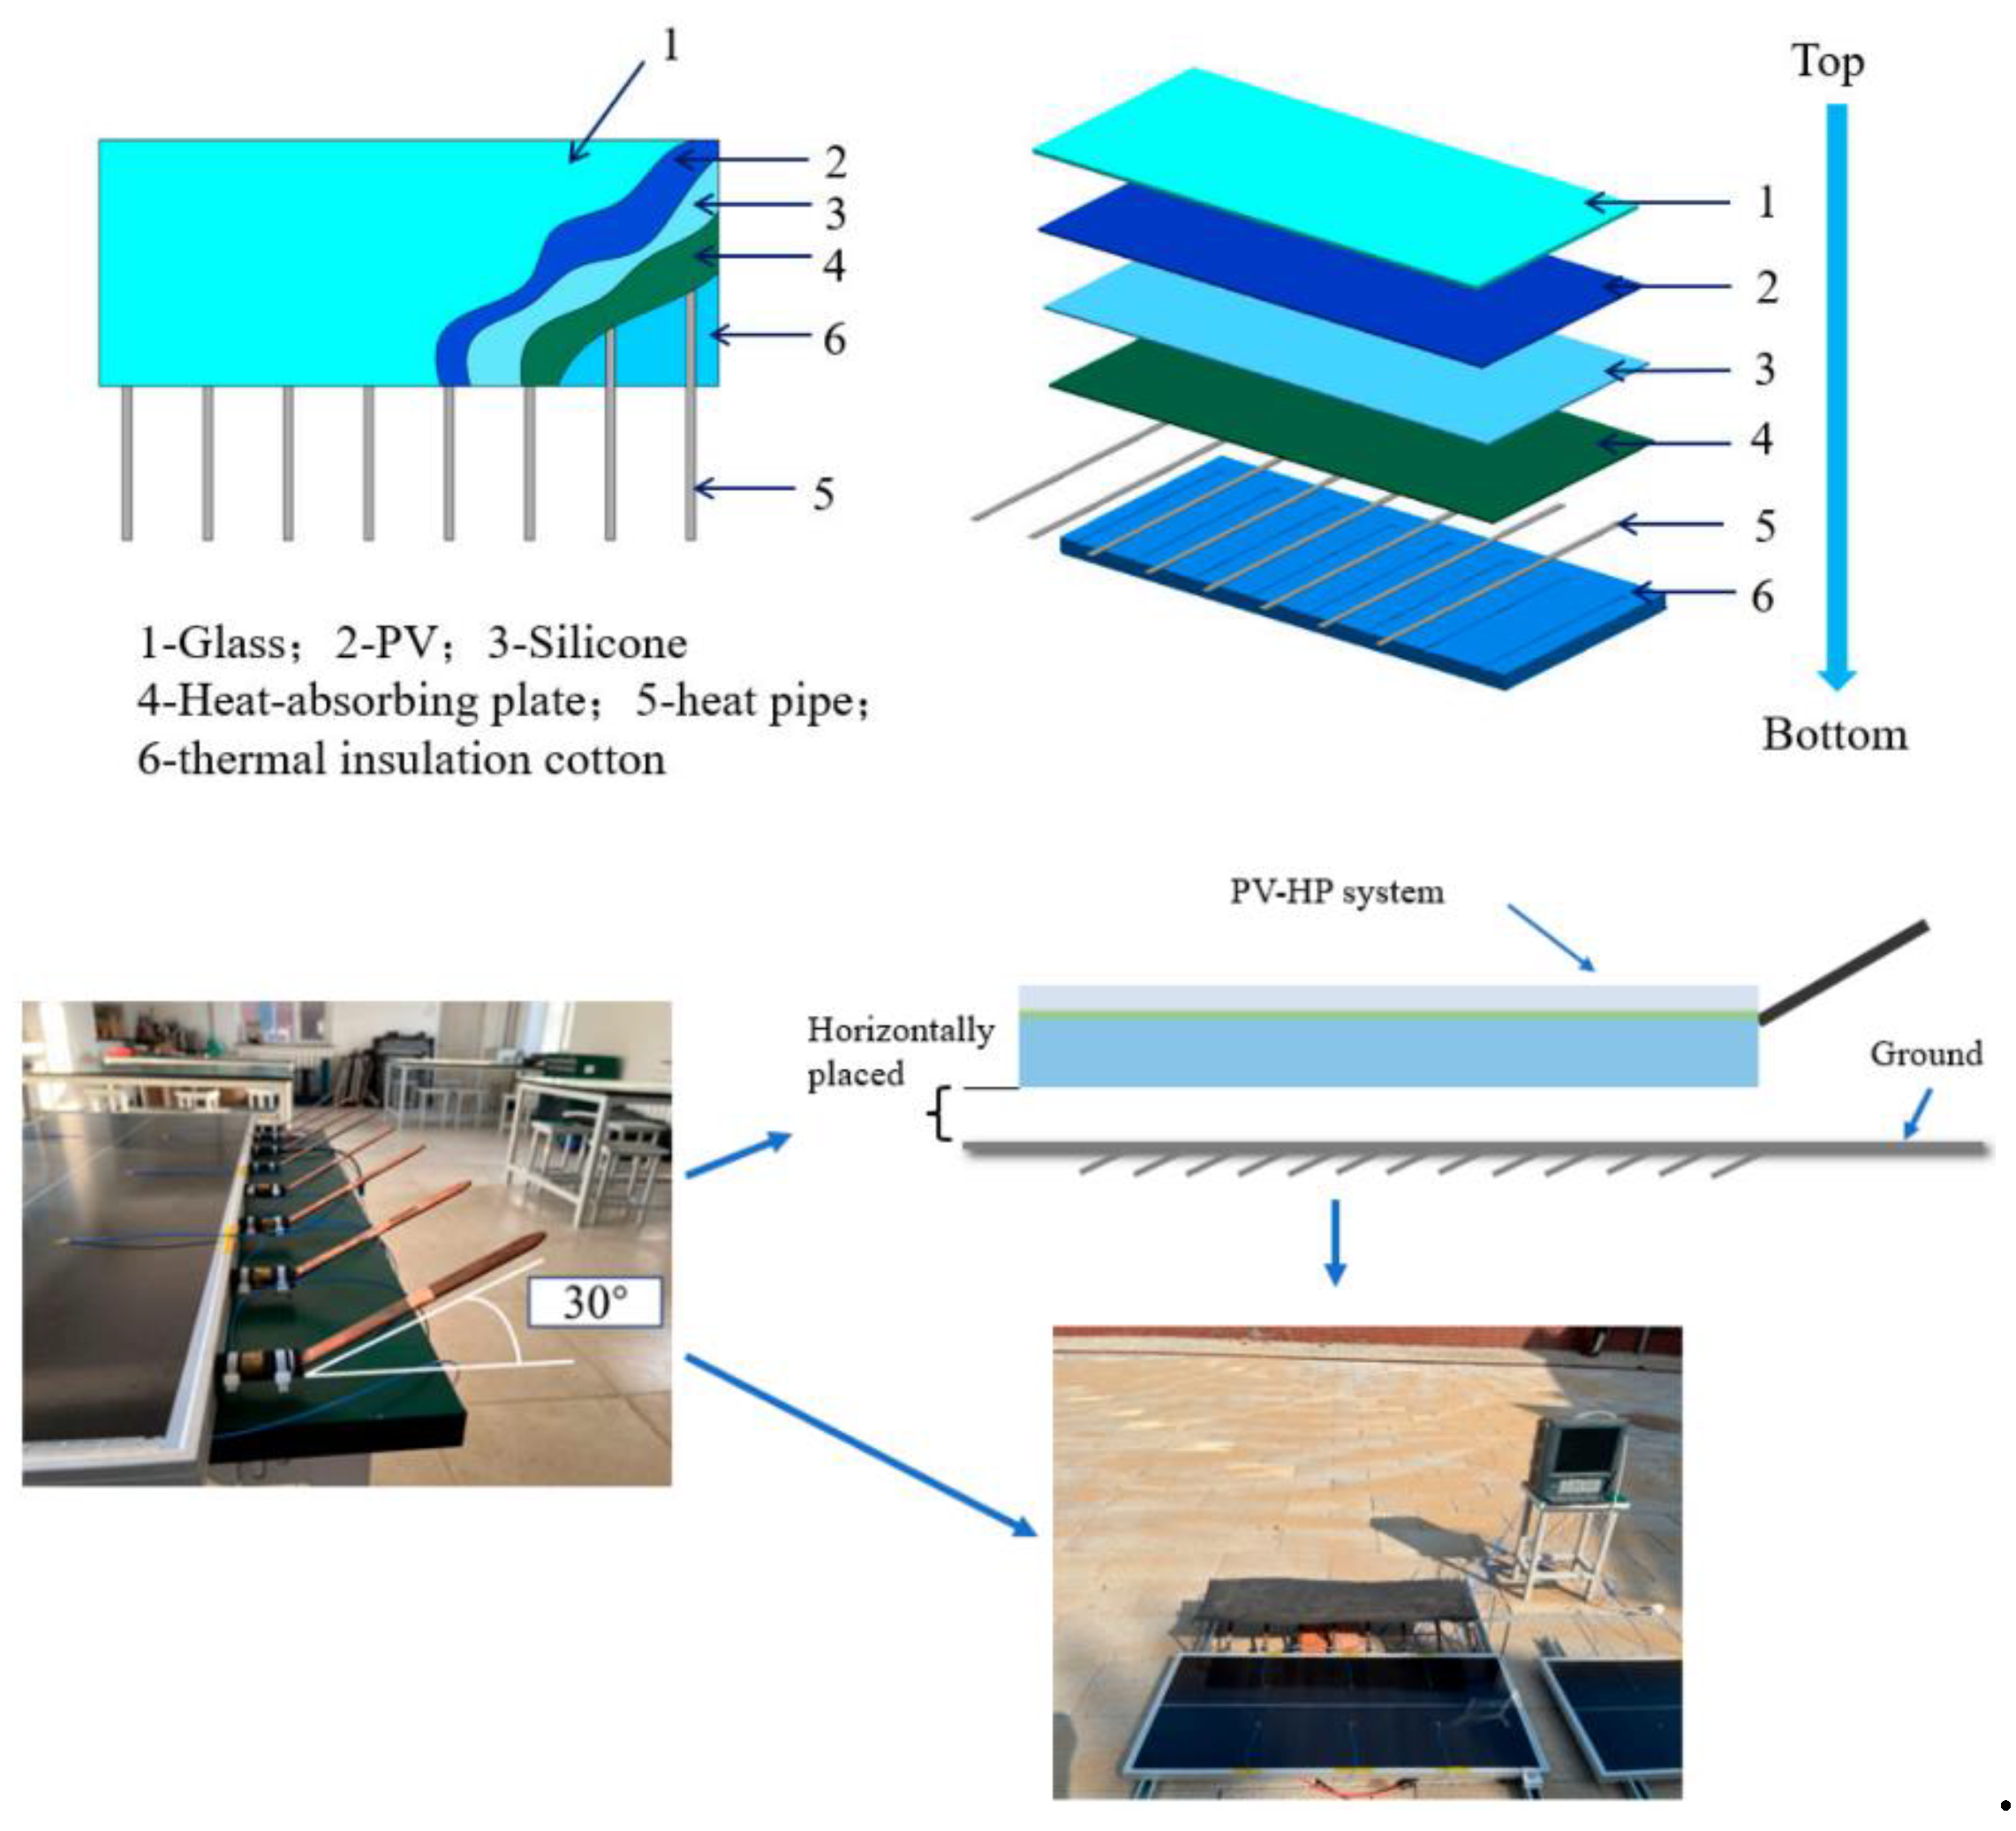
Figure 8.
CFD results with temperature cloud maps of PV modules under : (a) N(HP) = 8; (b) N(HP) = 10; (c) N(HP) = 12;(d) N(HP)= 14. [11].
Figure 8.
CFD results with temperature cloud maps of PV modules under : (a) N(HP) = 8; (b) N(HP) = 10; (c) N(HP) = 12;(d) N(HP)= 14. [11].
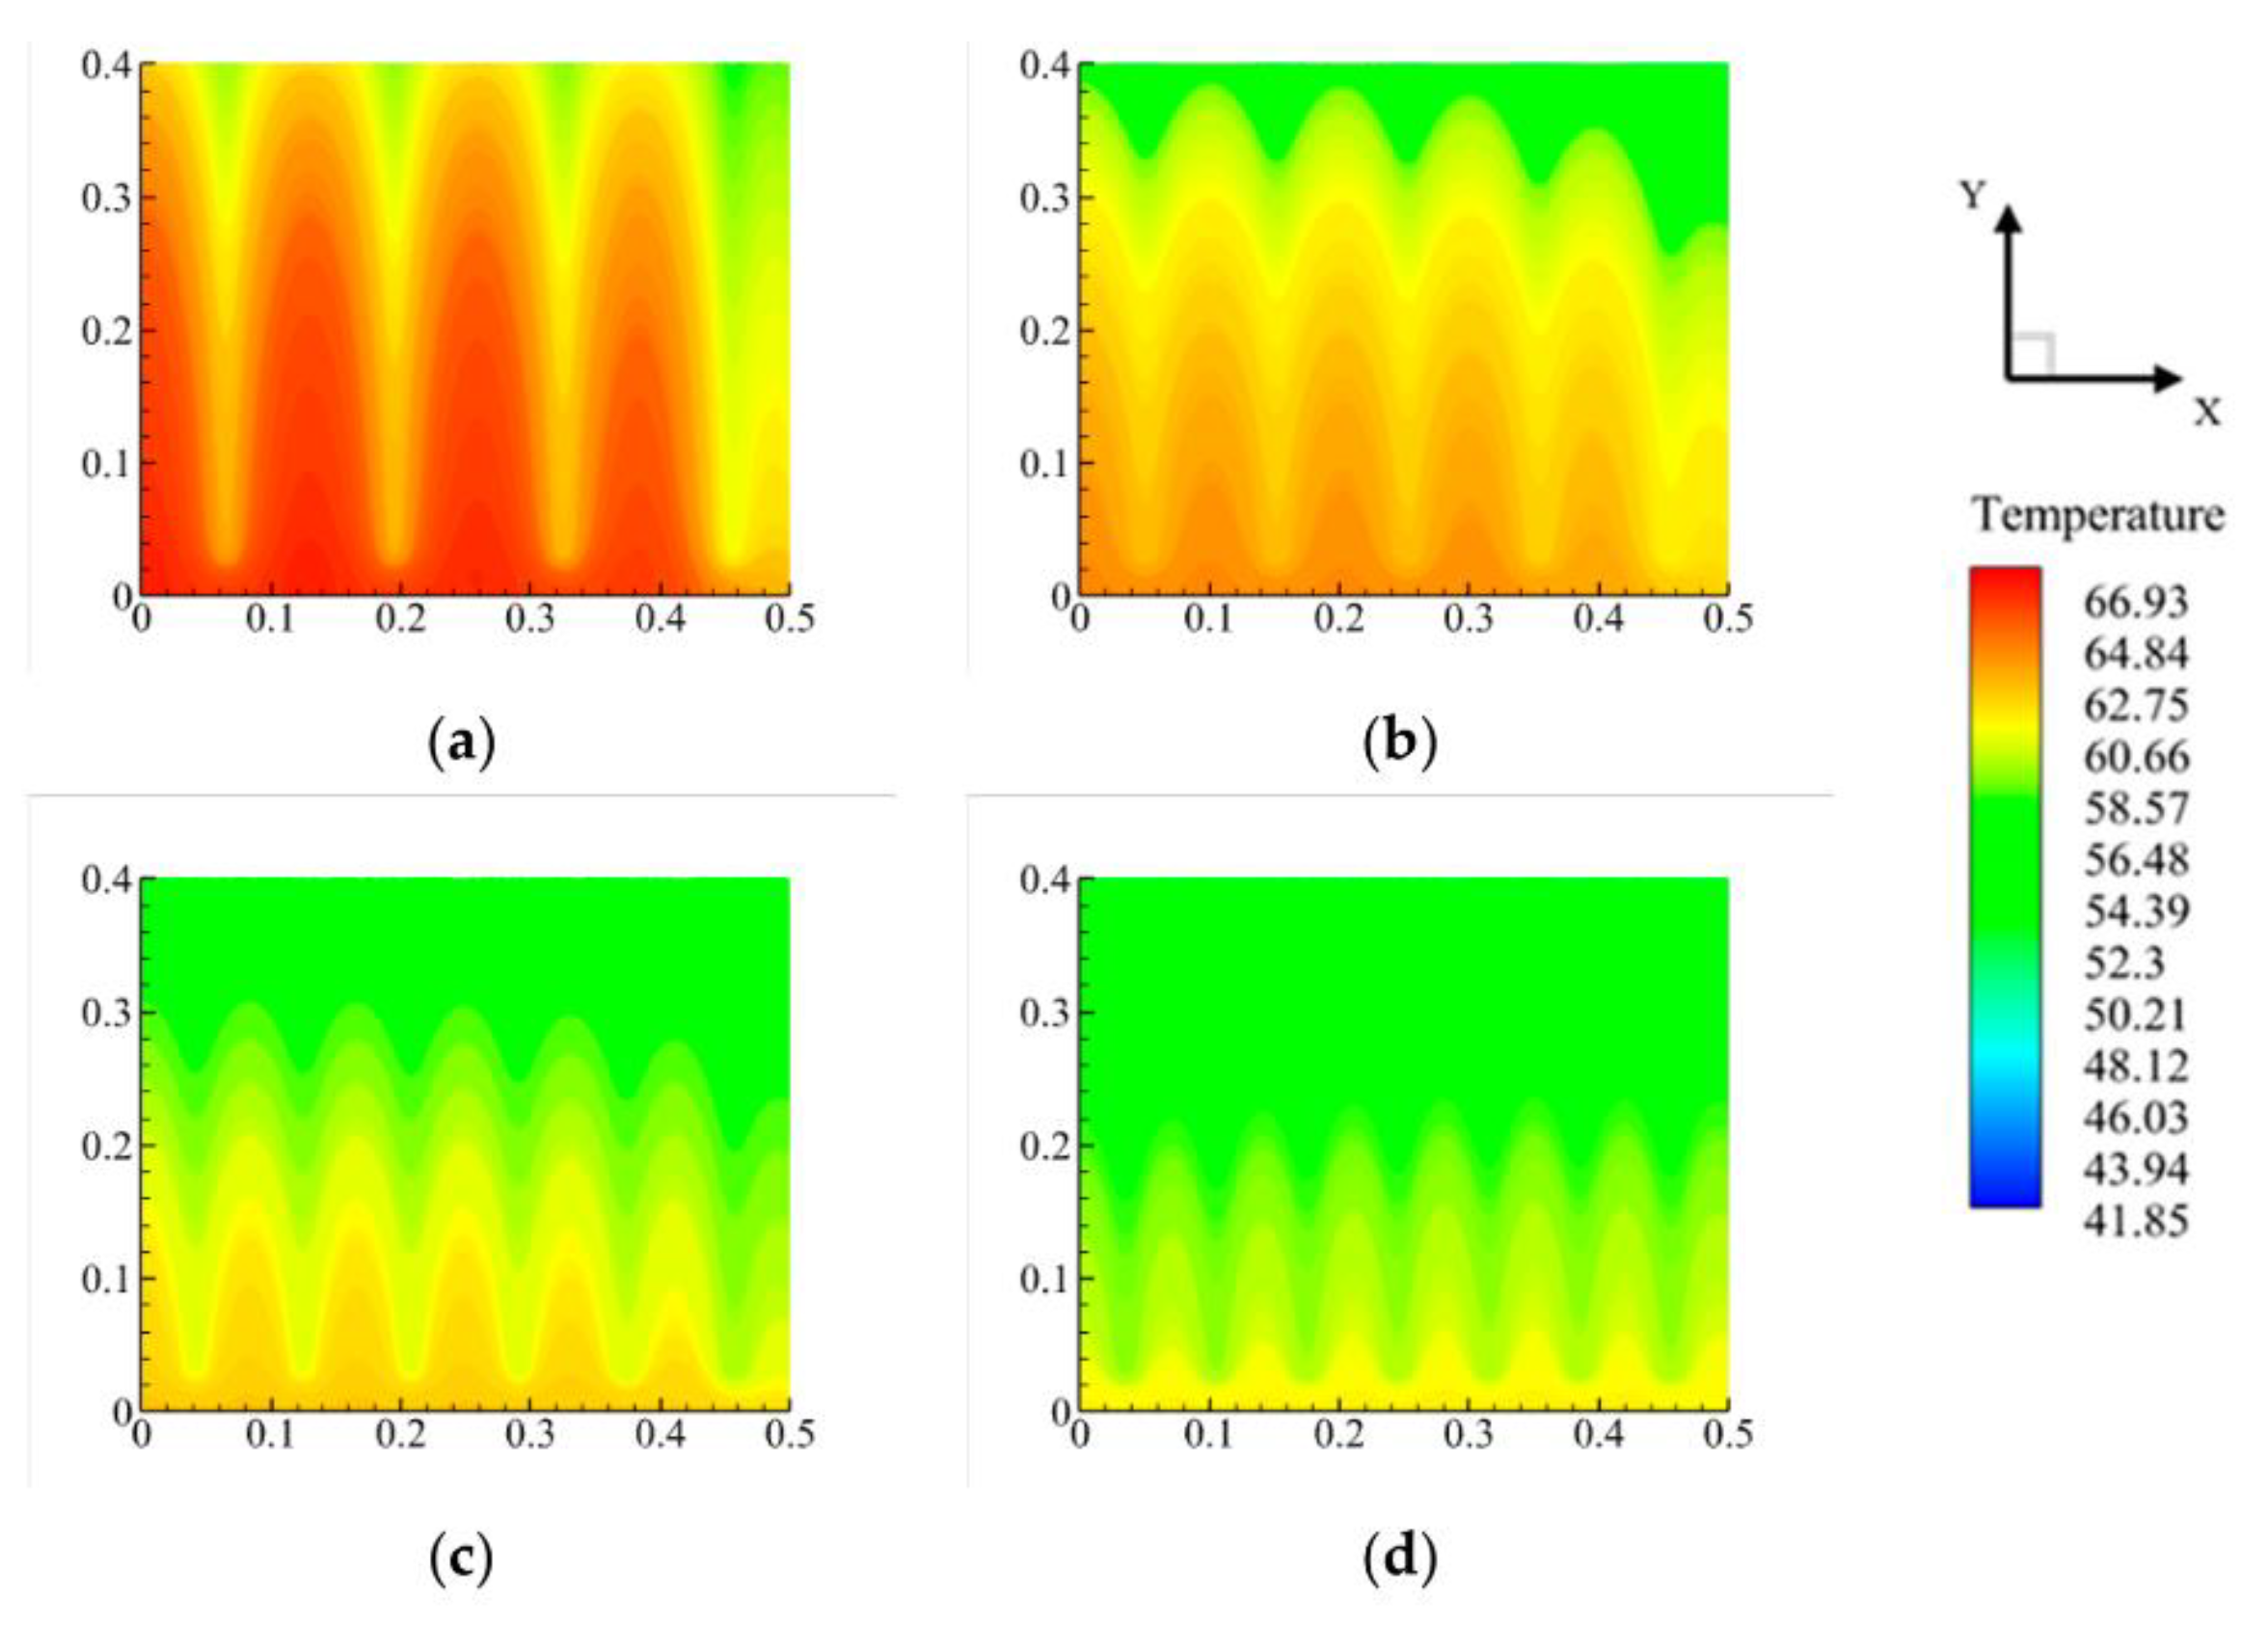
Figure 9.
Passively cooled solar PV panel with PCM matrix absorber [12].
Figure 9.
Passively cooled solar PV panel with PCM matrix absorber [12].
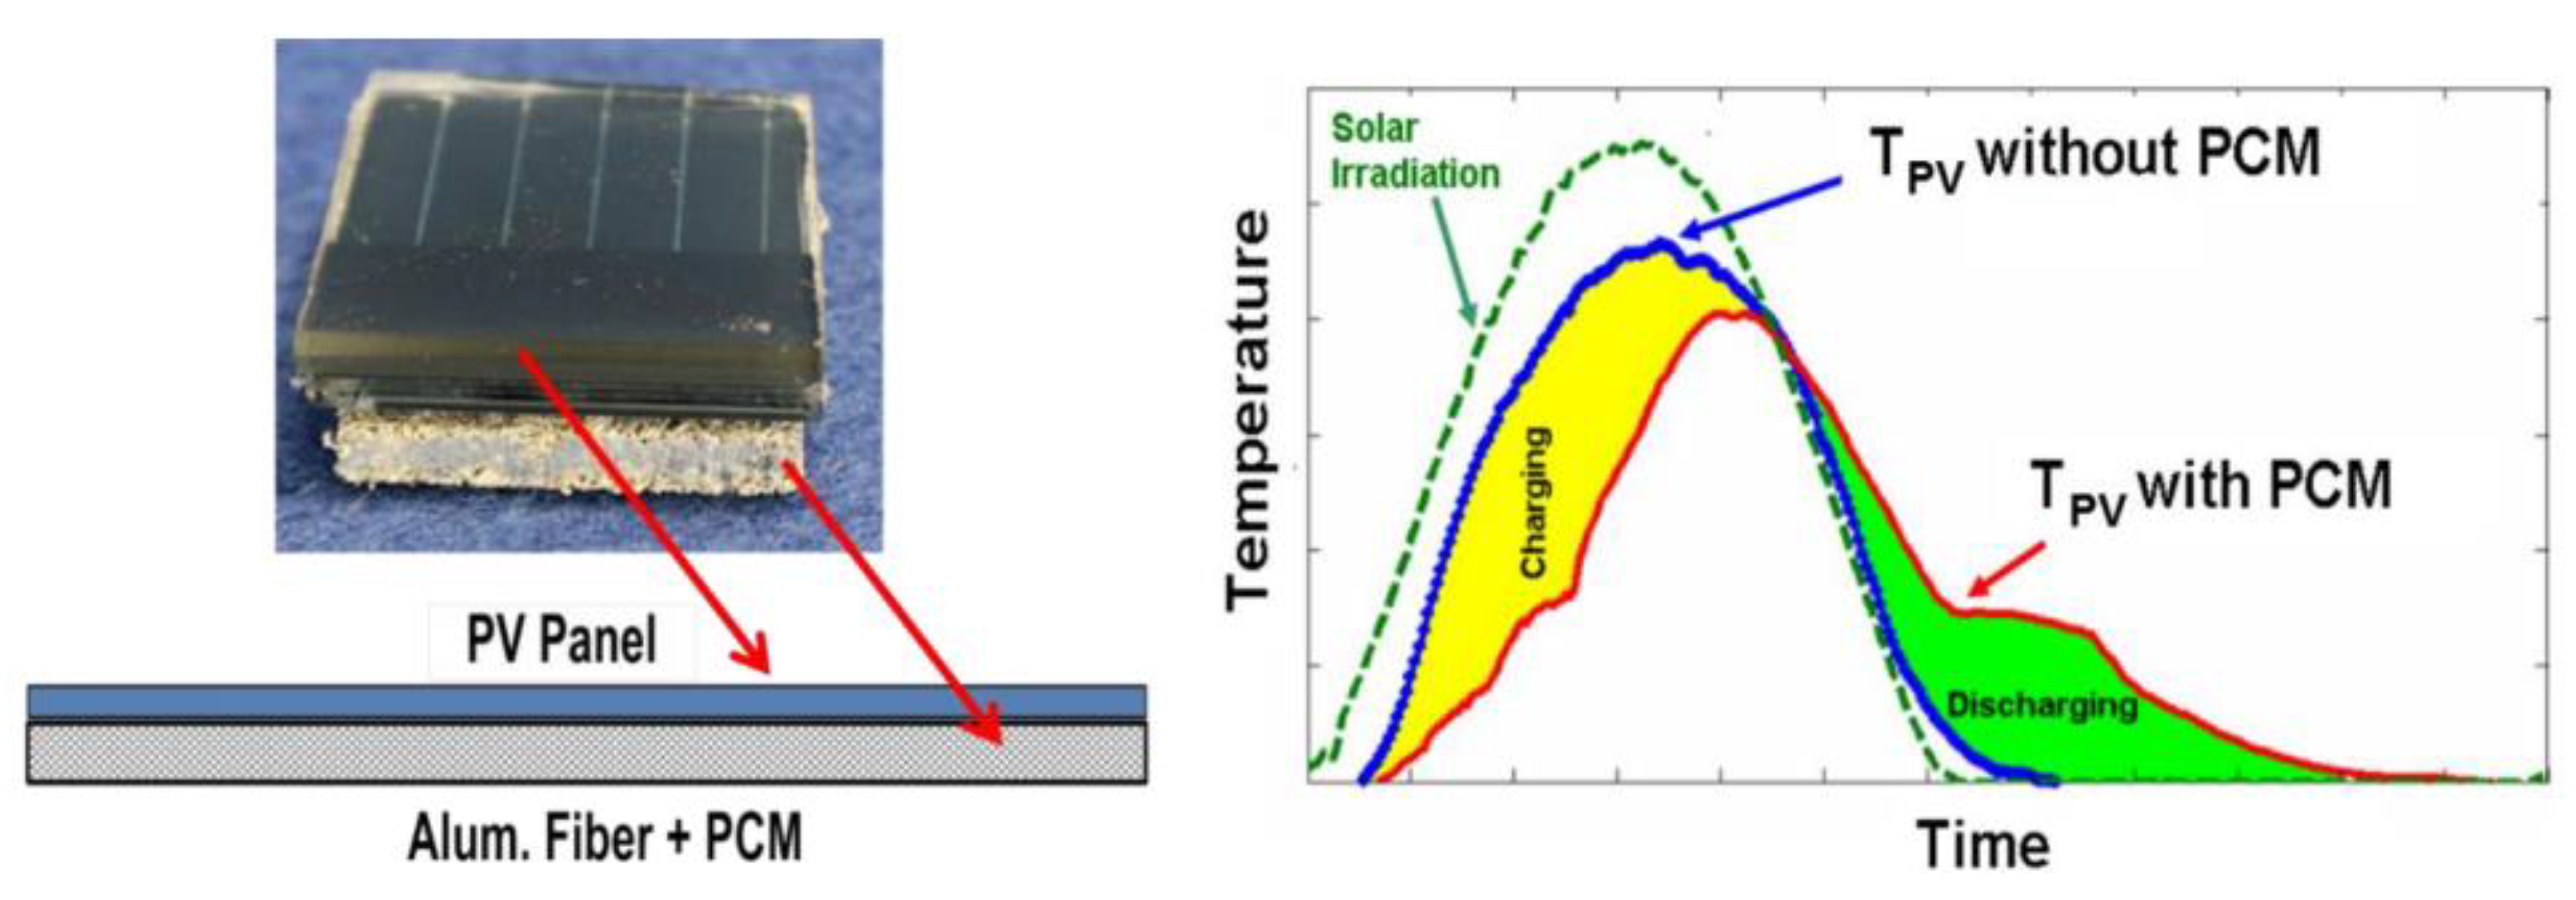
Figure 10.
Schematic view of the setup illustrating its components, dimensions, and thermocouple locations: (a) Side view; (b) Top view and the predicted and measured battery temperatures for a total input power of 16 W at different air velocities: (c) with PCM; (d) without PCM [13].
Figure 10.
Schematic view of the setup illustrating its components, dimensions, and thermocouple locations: (a) Side view; (b) Top view and the predicted and measured battery temperatures for a total input power of 16 W at different air velocities: (c) with PCM; (d) without PCM [13].
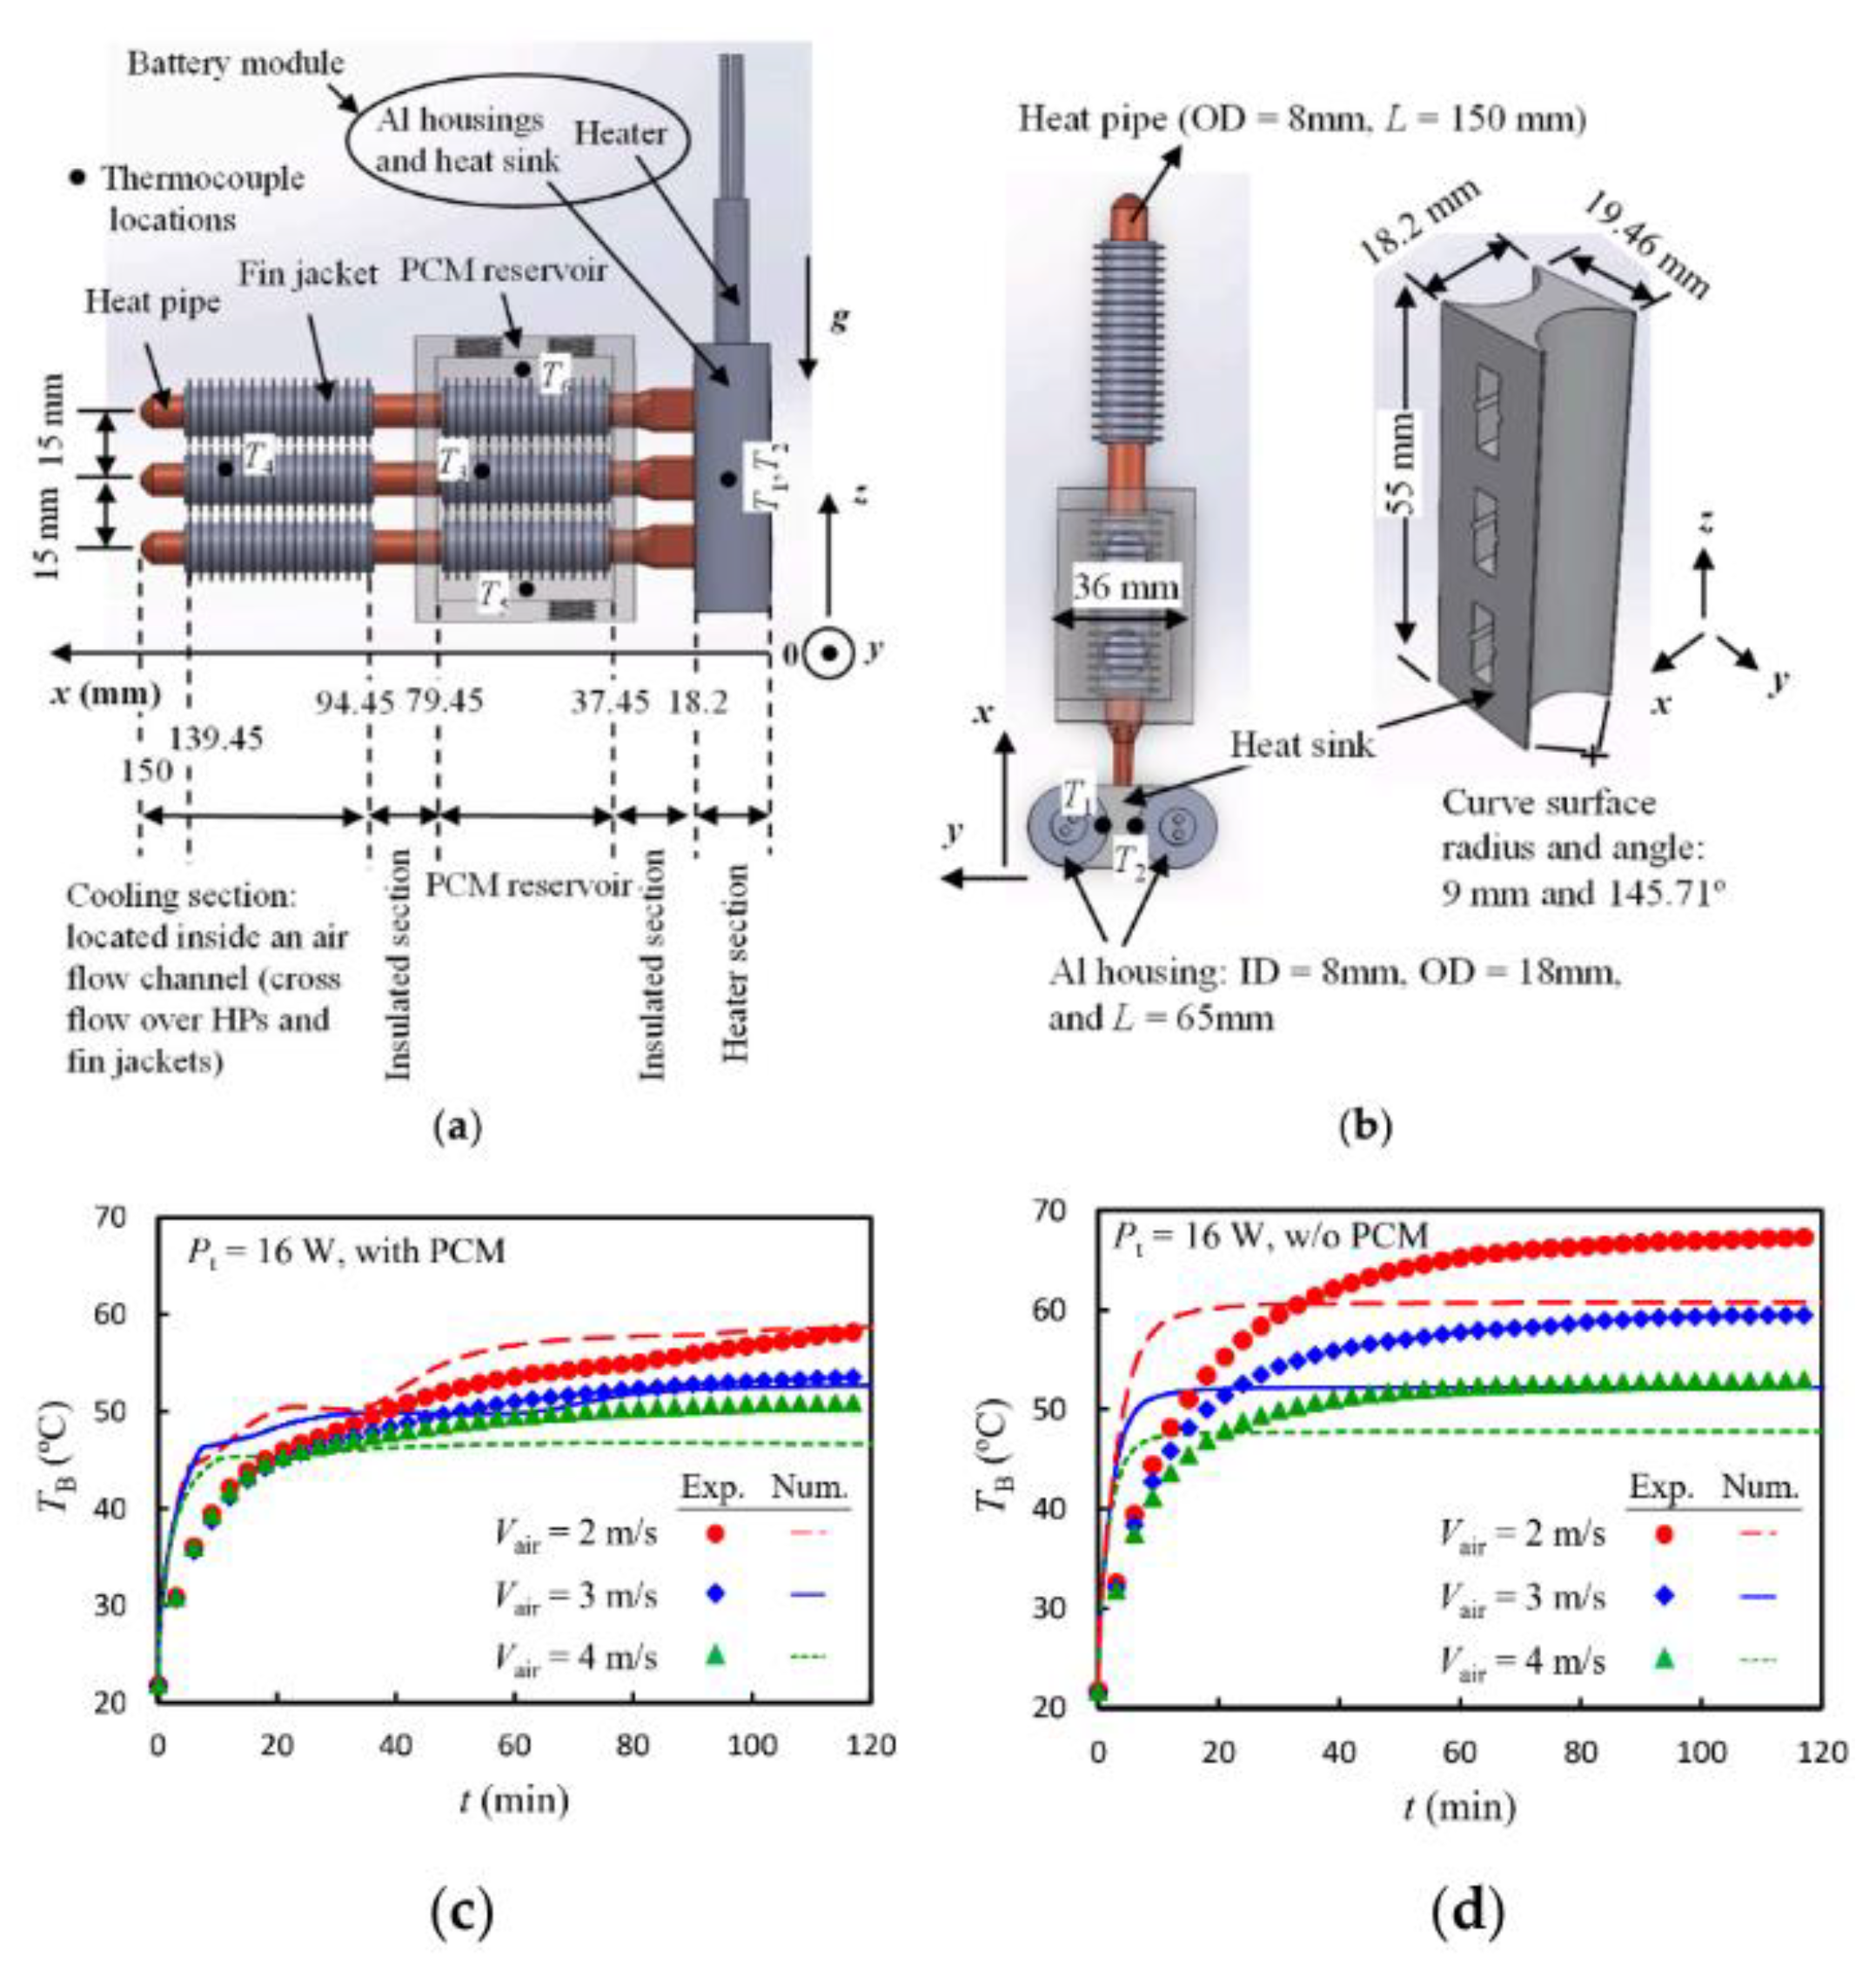
Figure 11.
Solar experimental facility. The left panel labelled as panel A is not modified and the right panel labelled as panel B is above a steel plate, creating an air channel underneath it. (a) Natural convection configuration. (b) Forced convection configuration [14].
Figure 11.
Solar experimental facility. The left panel labelled as panel A is not modified and the right panel labelled as panel B is above a steel plate, creating an air channel underneath it. (a) Natural convection configuration. (b) Forced convection configuration [14].
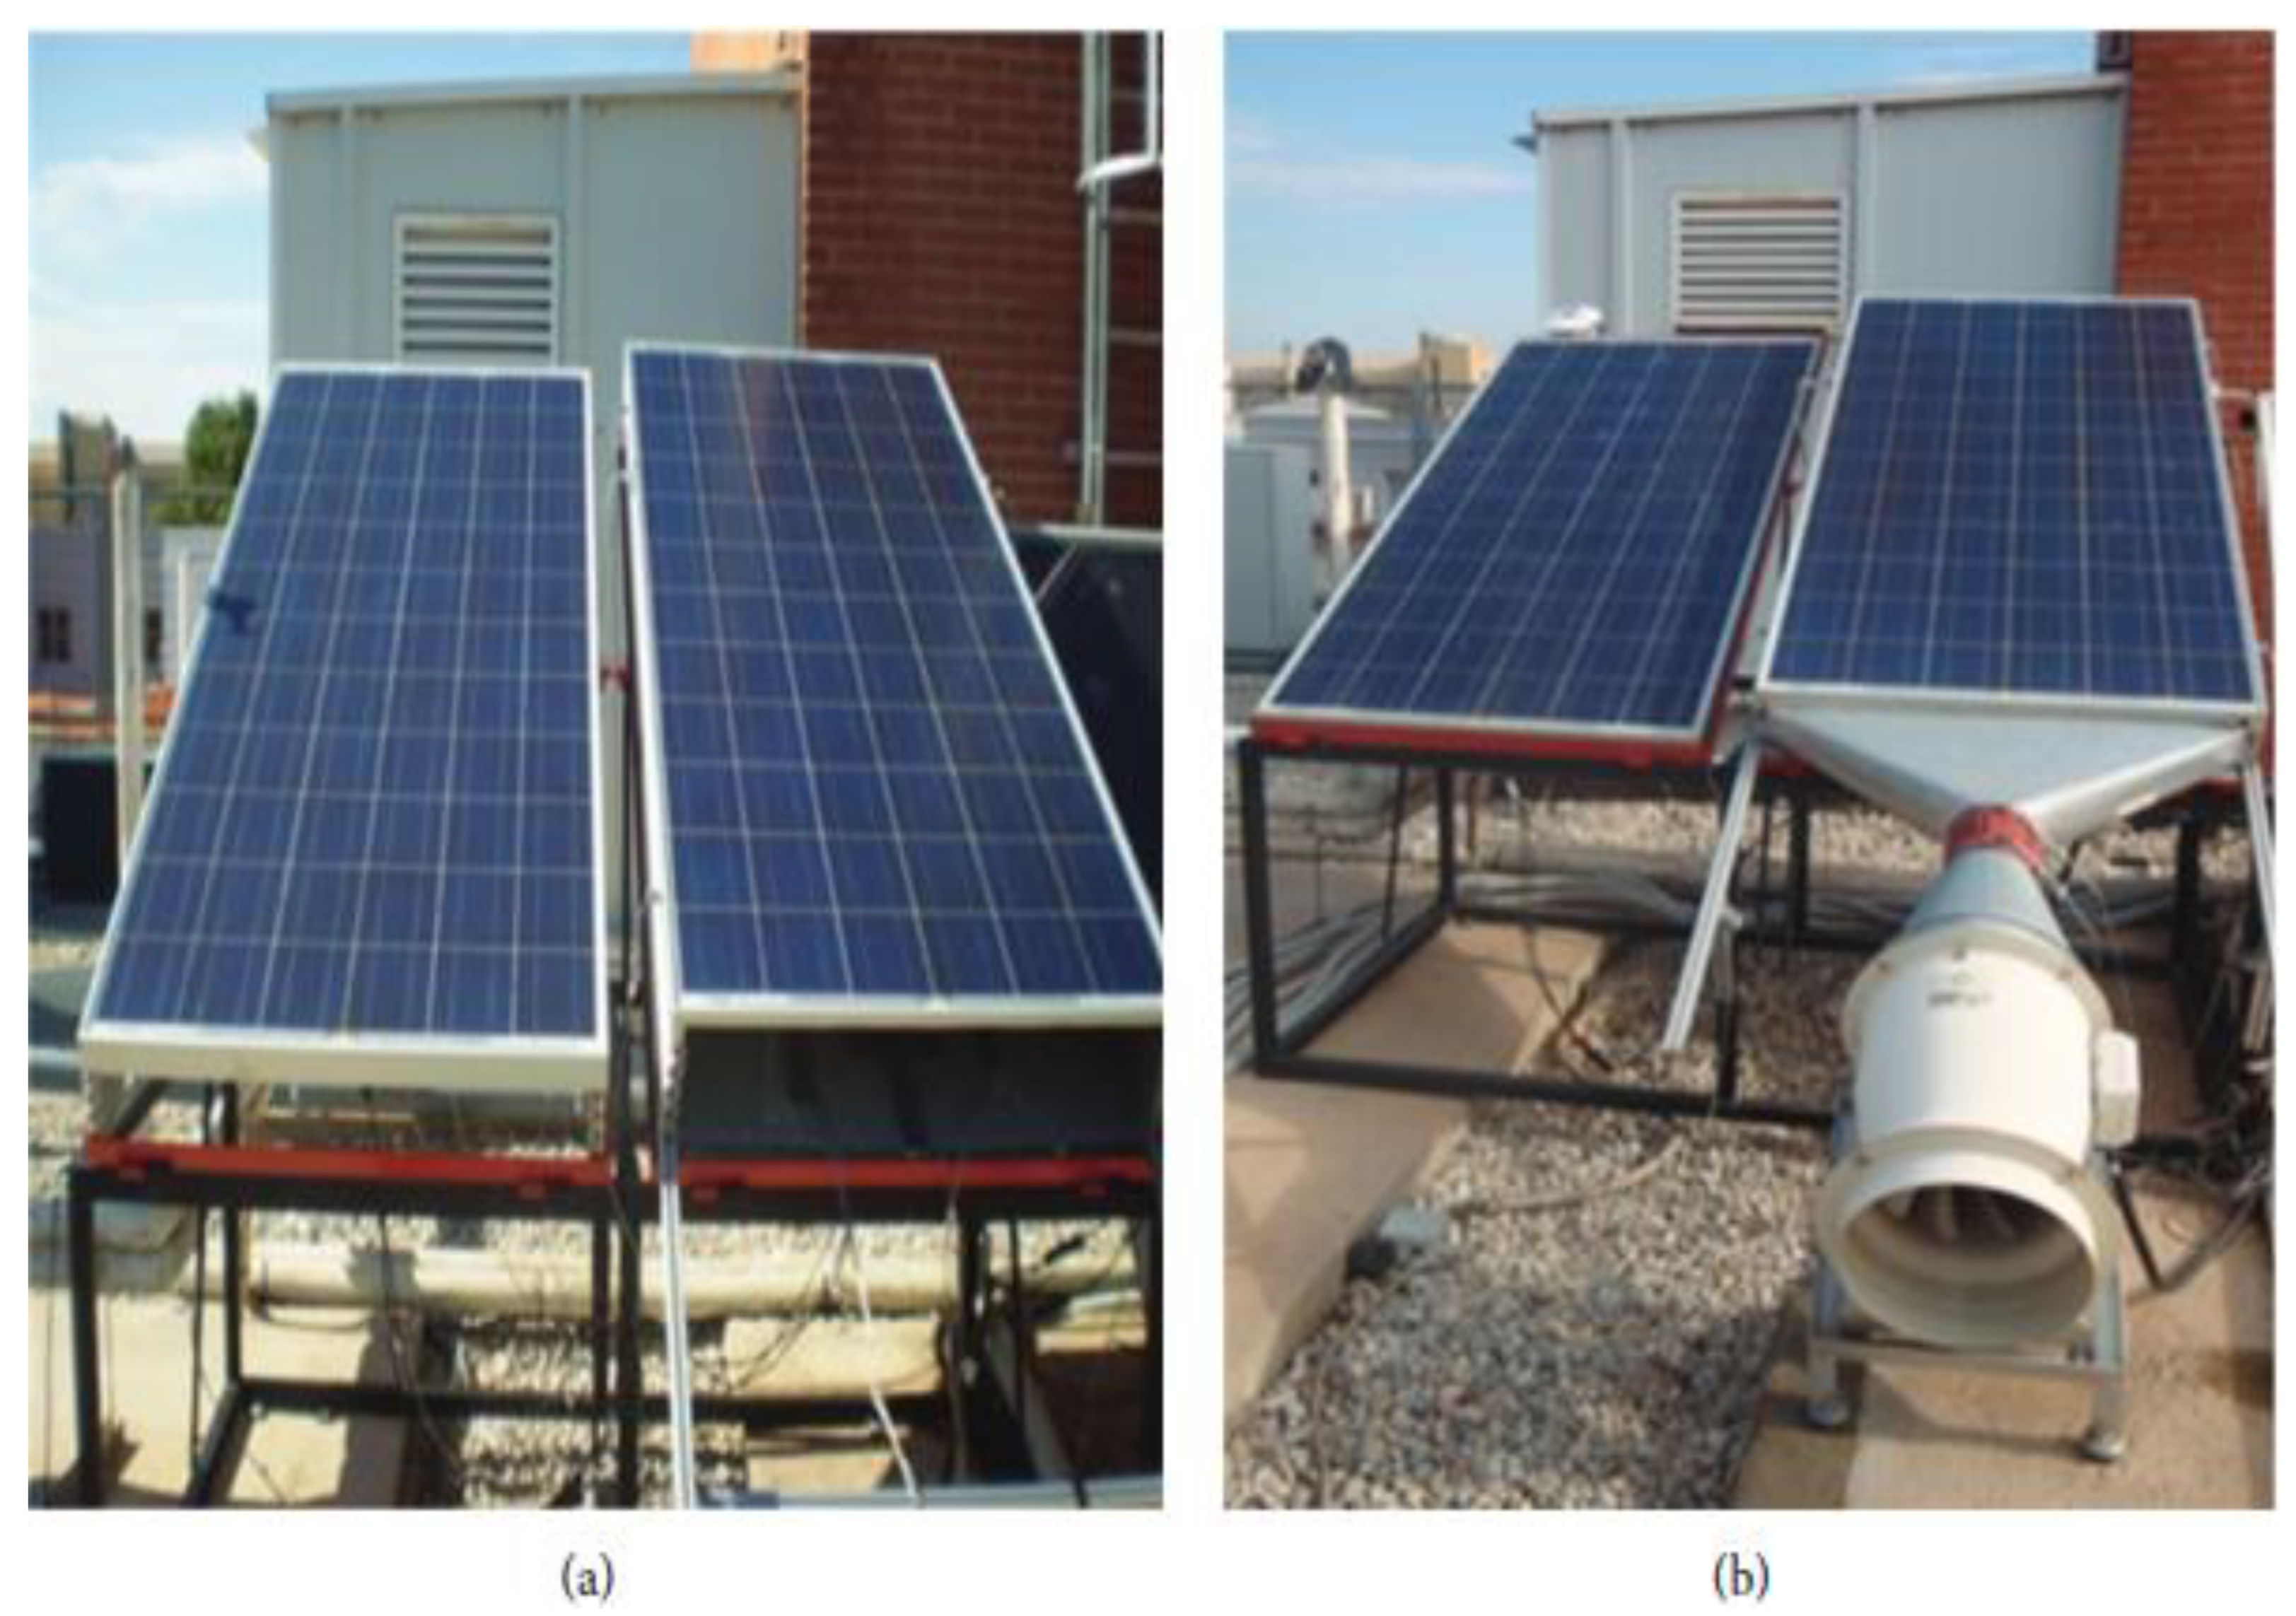
Figure 12.
Comparison between natural and forced convection cases at different aspect ratios. (a) Peak power. (b) Temperature difference between the panel and ambient [14].
Figure 12.
Comparison between natural and forced convection cases at different aspect ratios. (a) Peak power. (b) Temperature difference between the panel and ambient [14].
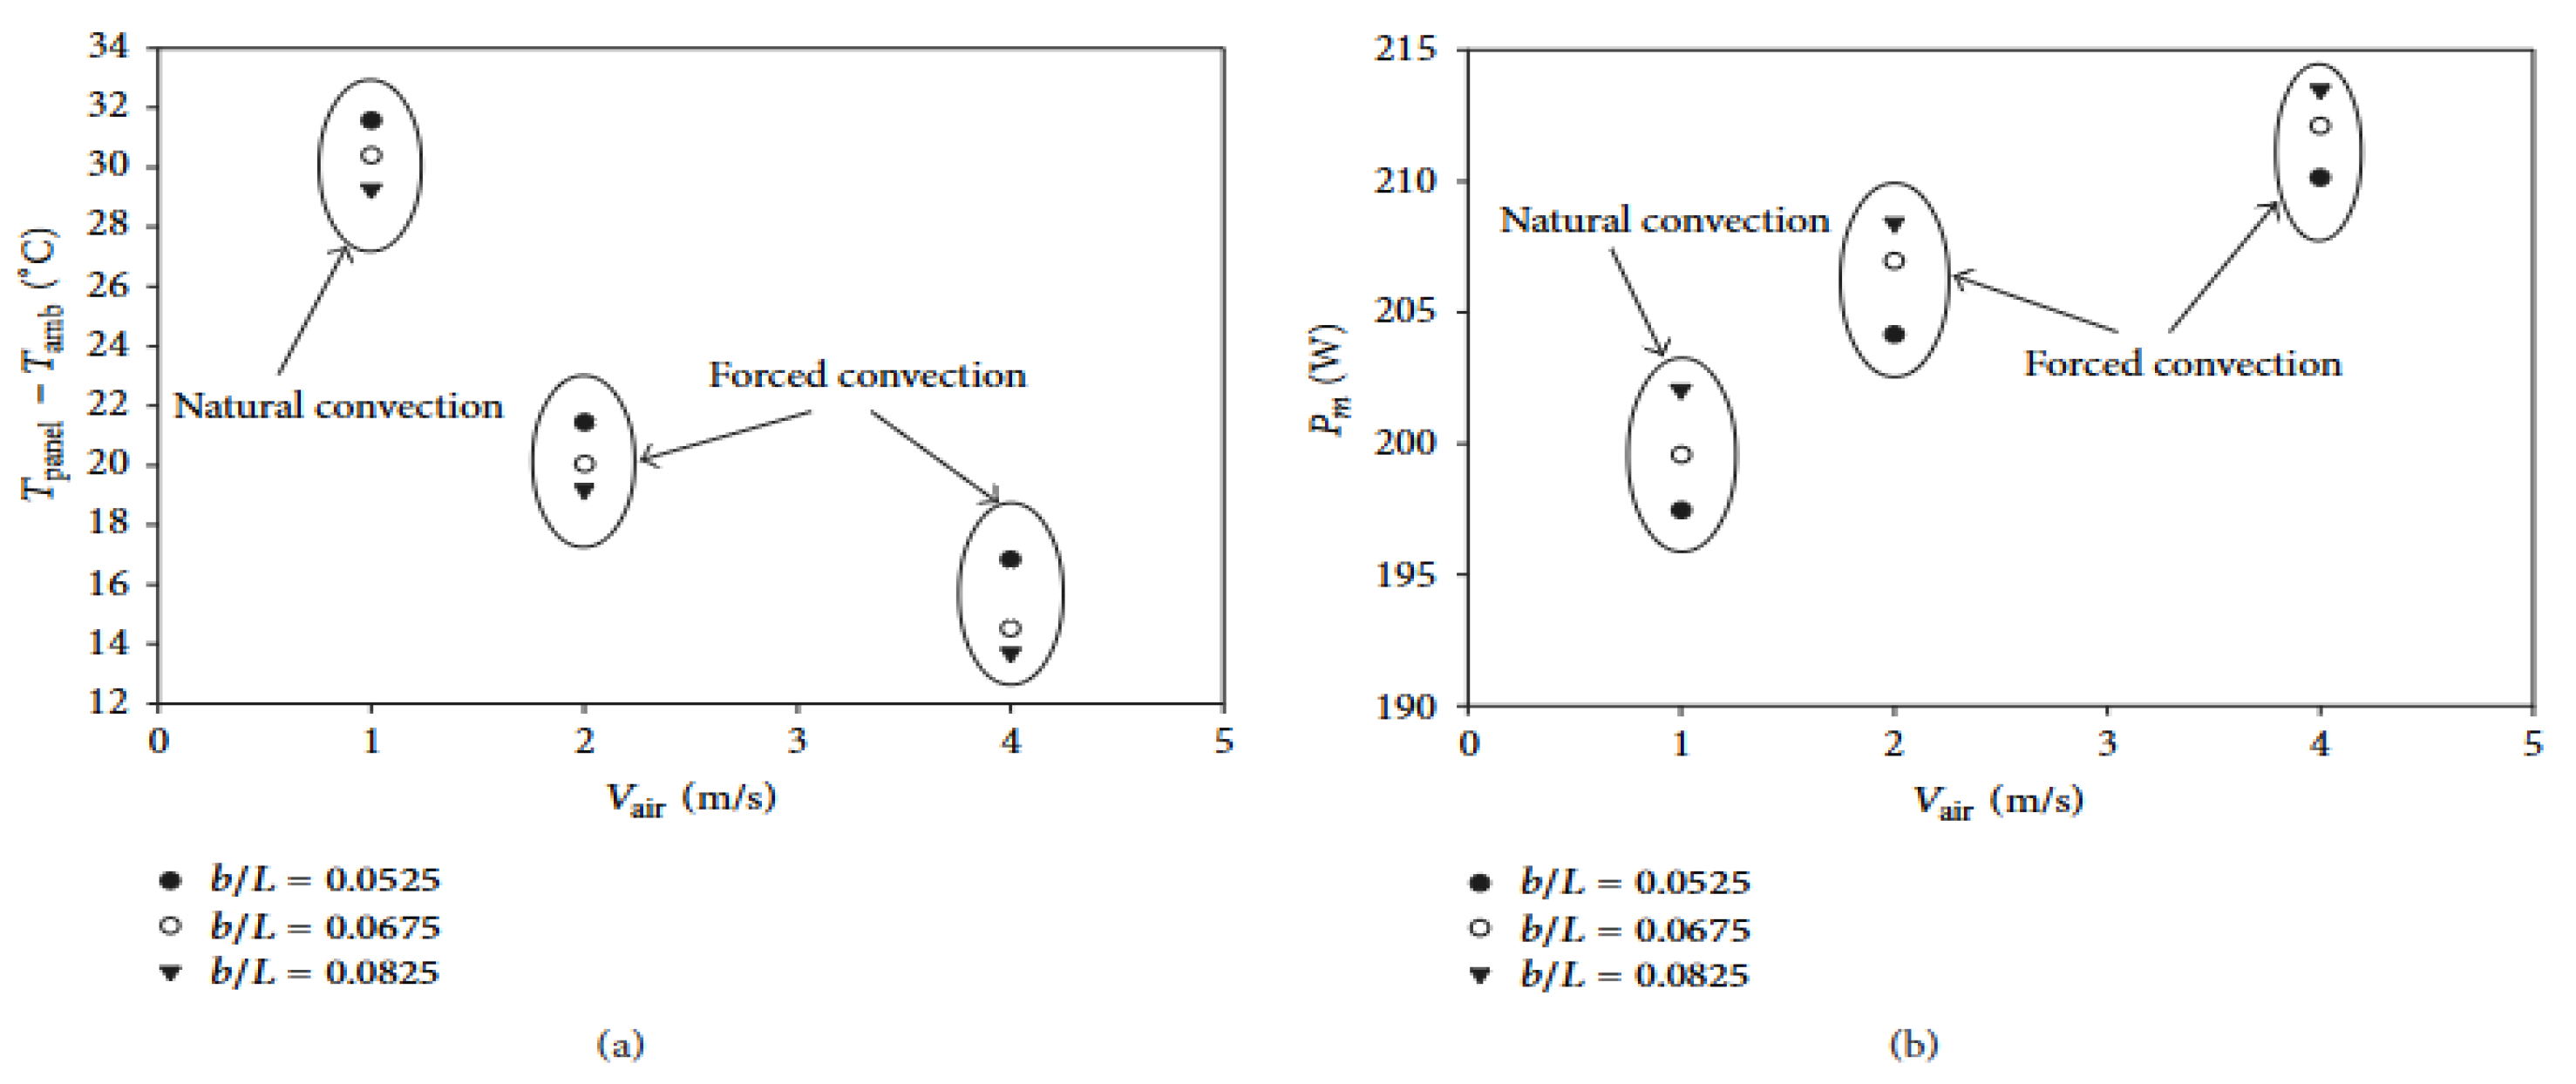
Figure 13.
Photo of the PV water cooling test and results of the energy for a summer day [15].
Figure 13.
Photo of the PV water cooling test and results of the energy for a summer day [15].
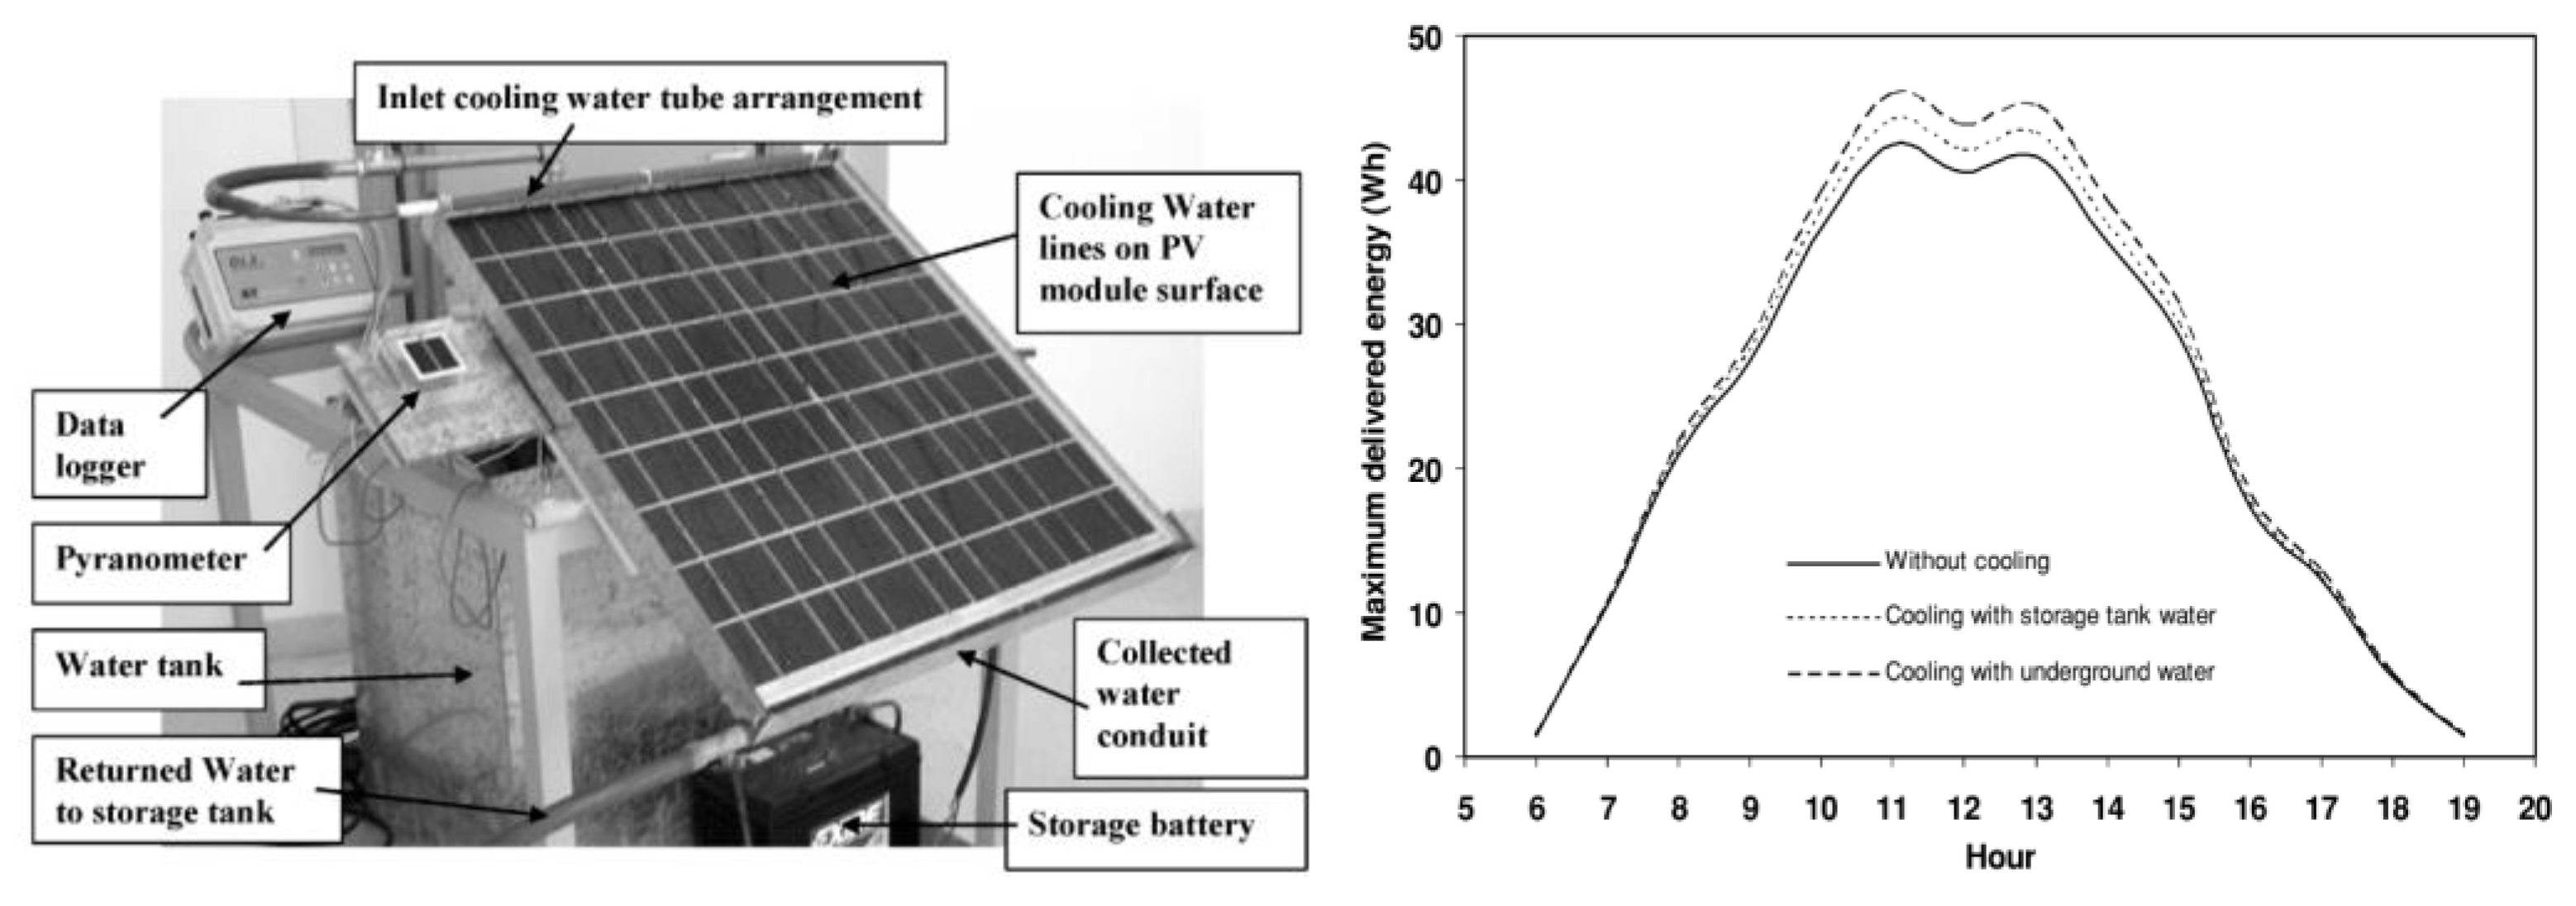
Figure 14.
Schematic of the PVT cooling system and cross section with internal components. [16].
Figure 14.
Schematic of the PVT cooling system and cross section with internal components. [16].
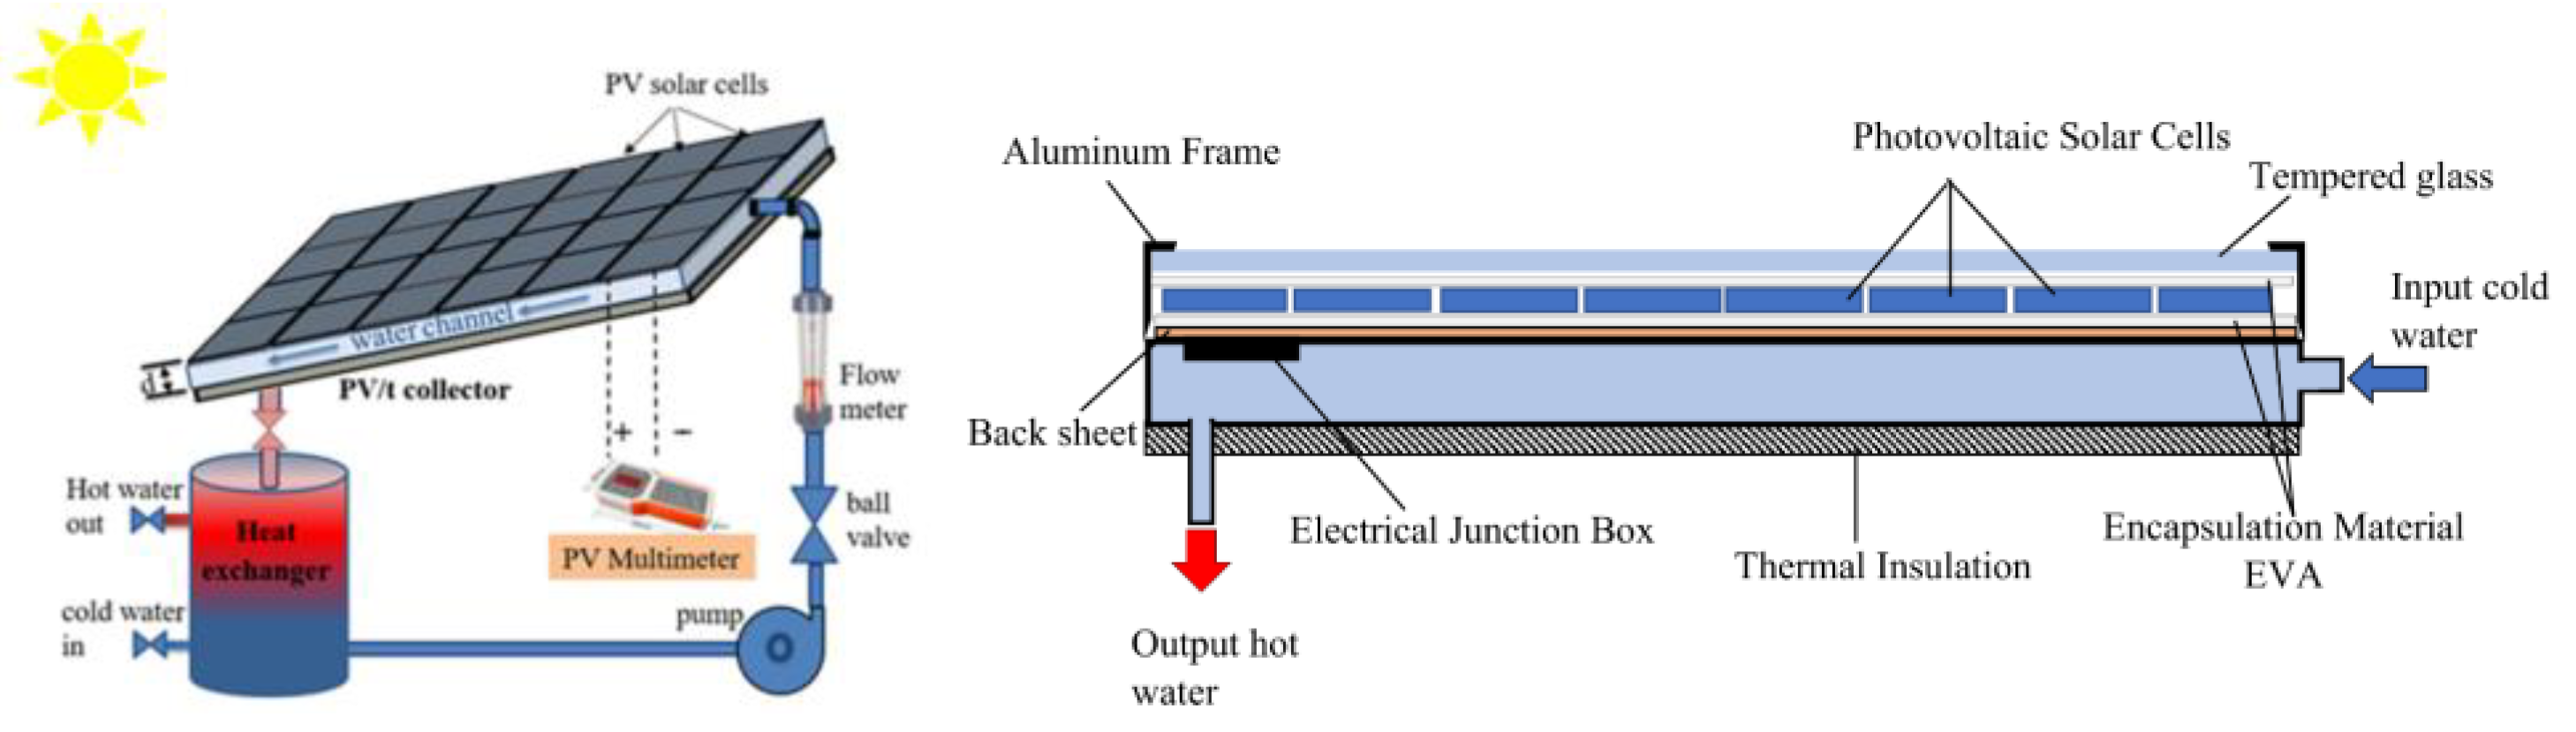
Figure 15.
Variations of PV temperature (a) and electrical efficiency (b) at different solar radiation with and without water cooling systems and for varying mass flow rate (c) [16].
Figure 15.
Variations of PV temperature (a) and electrical efficiency (b) at different solar radiation with and without water cooling systems and for varying mass flow rate (c) [16].
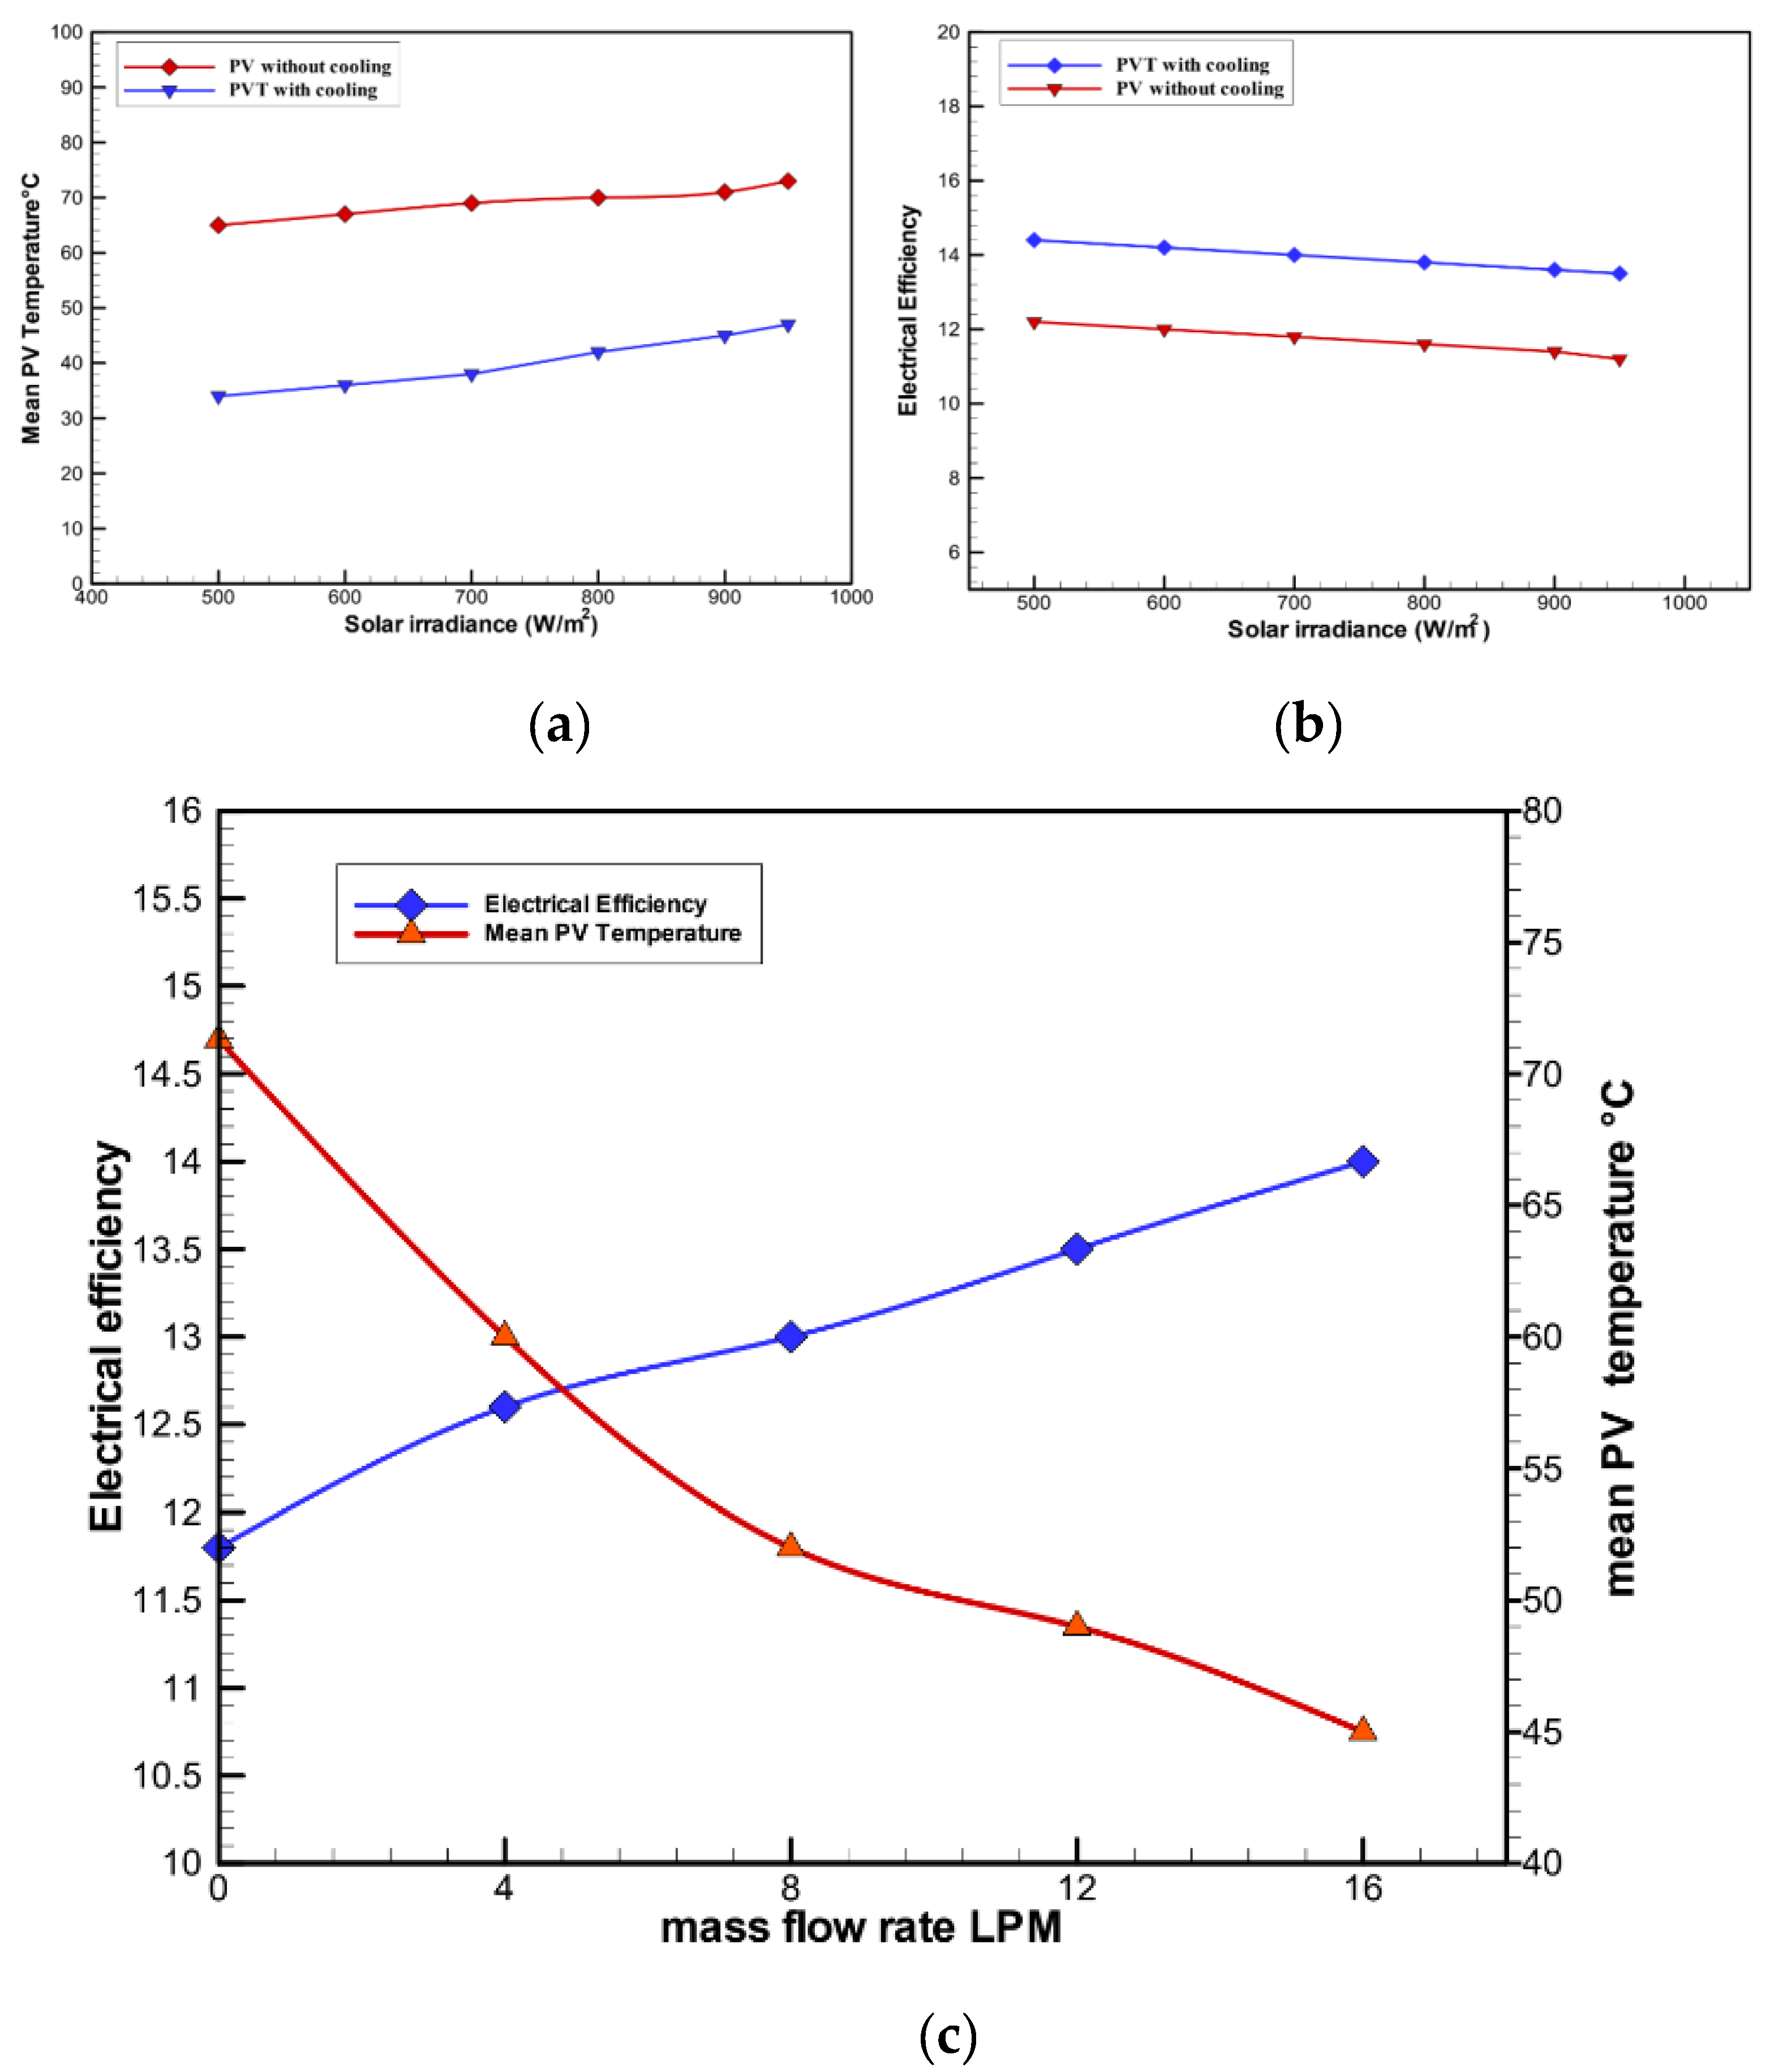
Figure 16.
Process flow diagram PFD of the connected PVT + GSHP system [17].
Figure 16.
Process flow diagram PFD of the connected PVT + GSHP system [17].
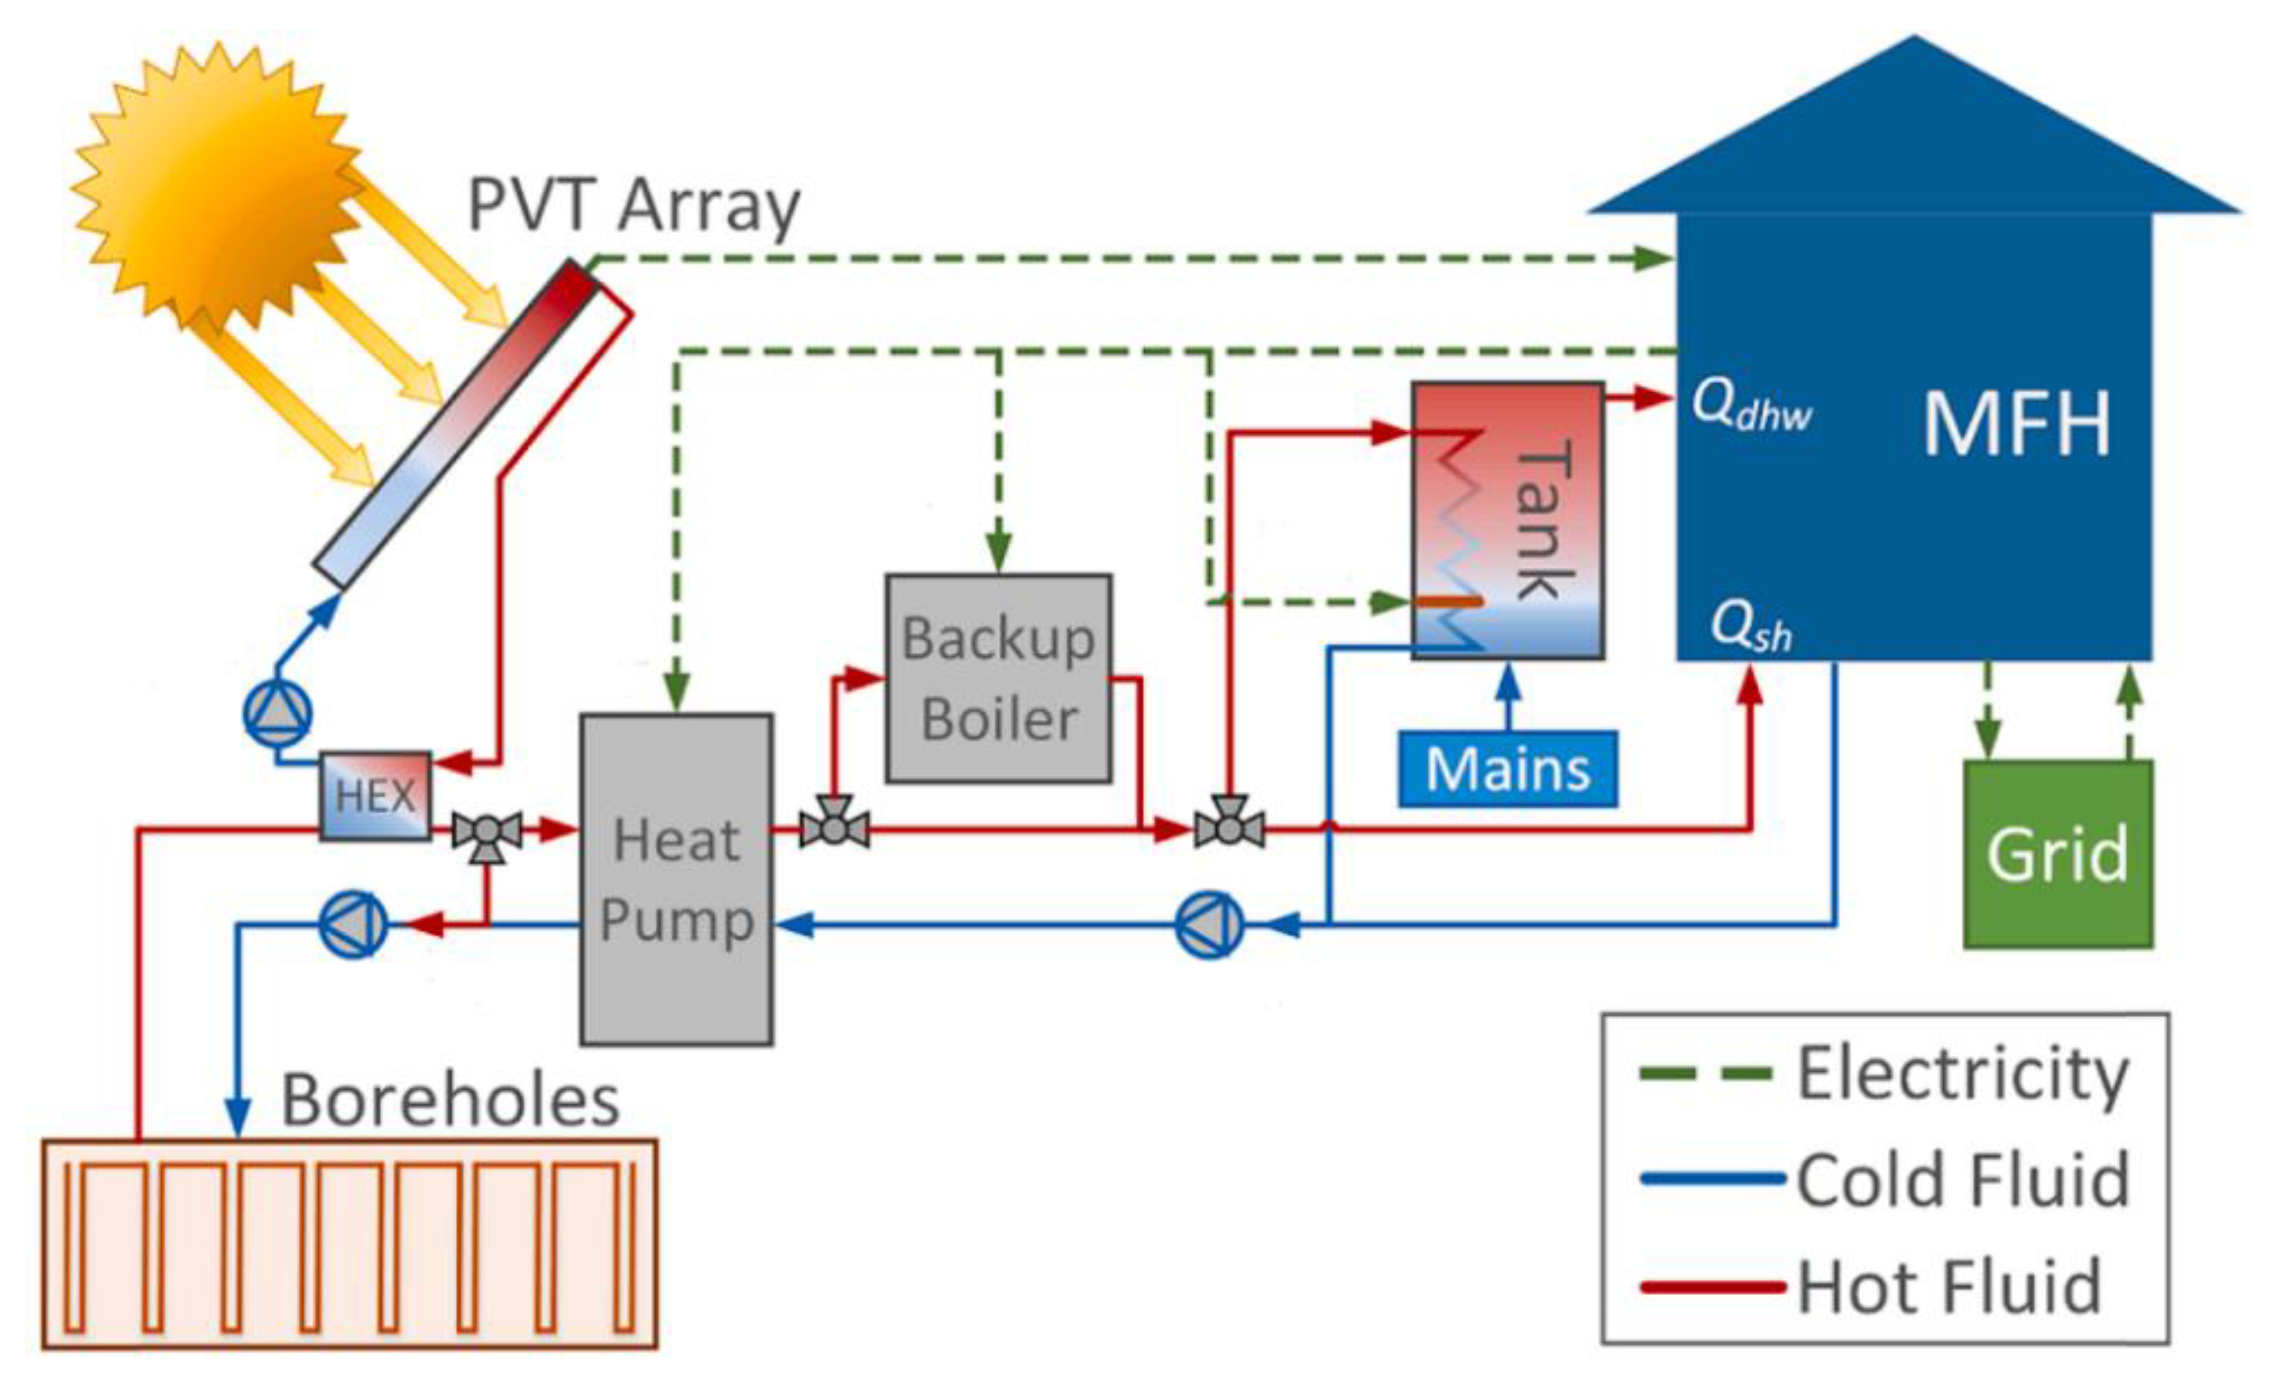
Figure 17.
3D (left) and 2D (right) representations of box-channel (top) and corrugated (bottom) thermal absorbers [17].
Figure 17.
3D (left) and 2D (right) representations of box-channel (top) and corrugated (bottom) thermal absorbers [17].
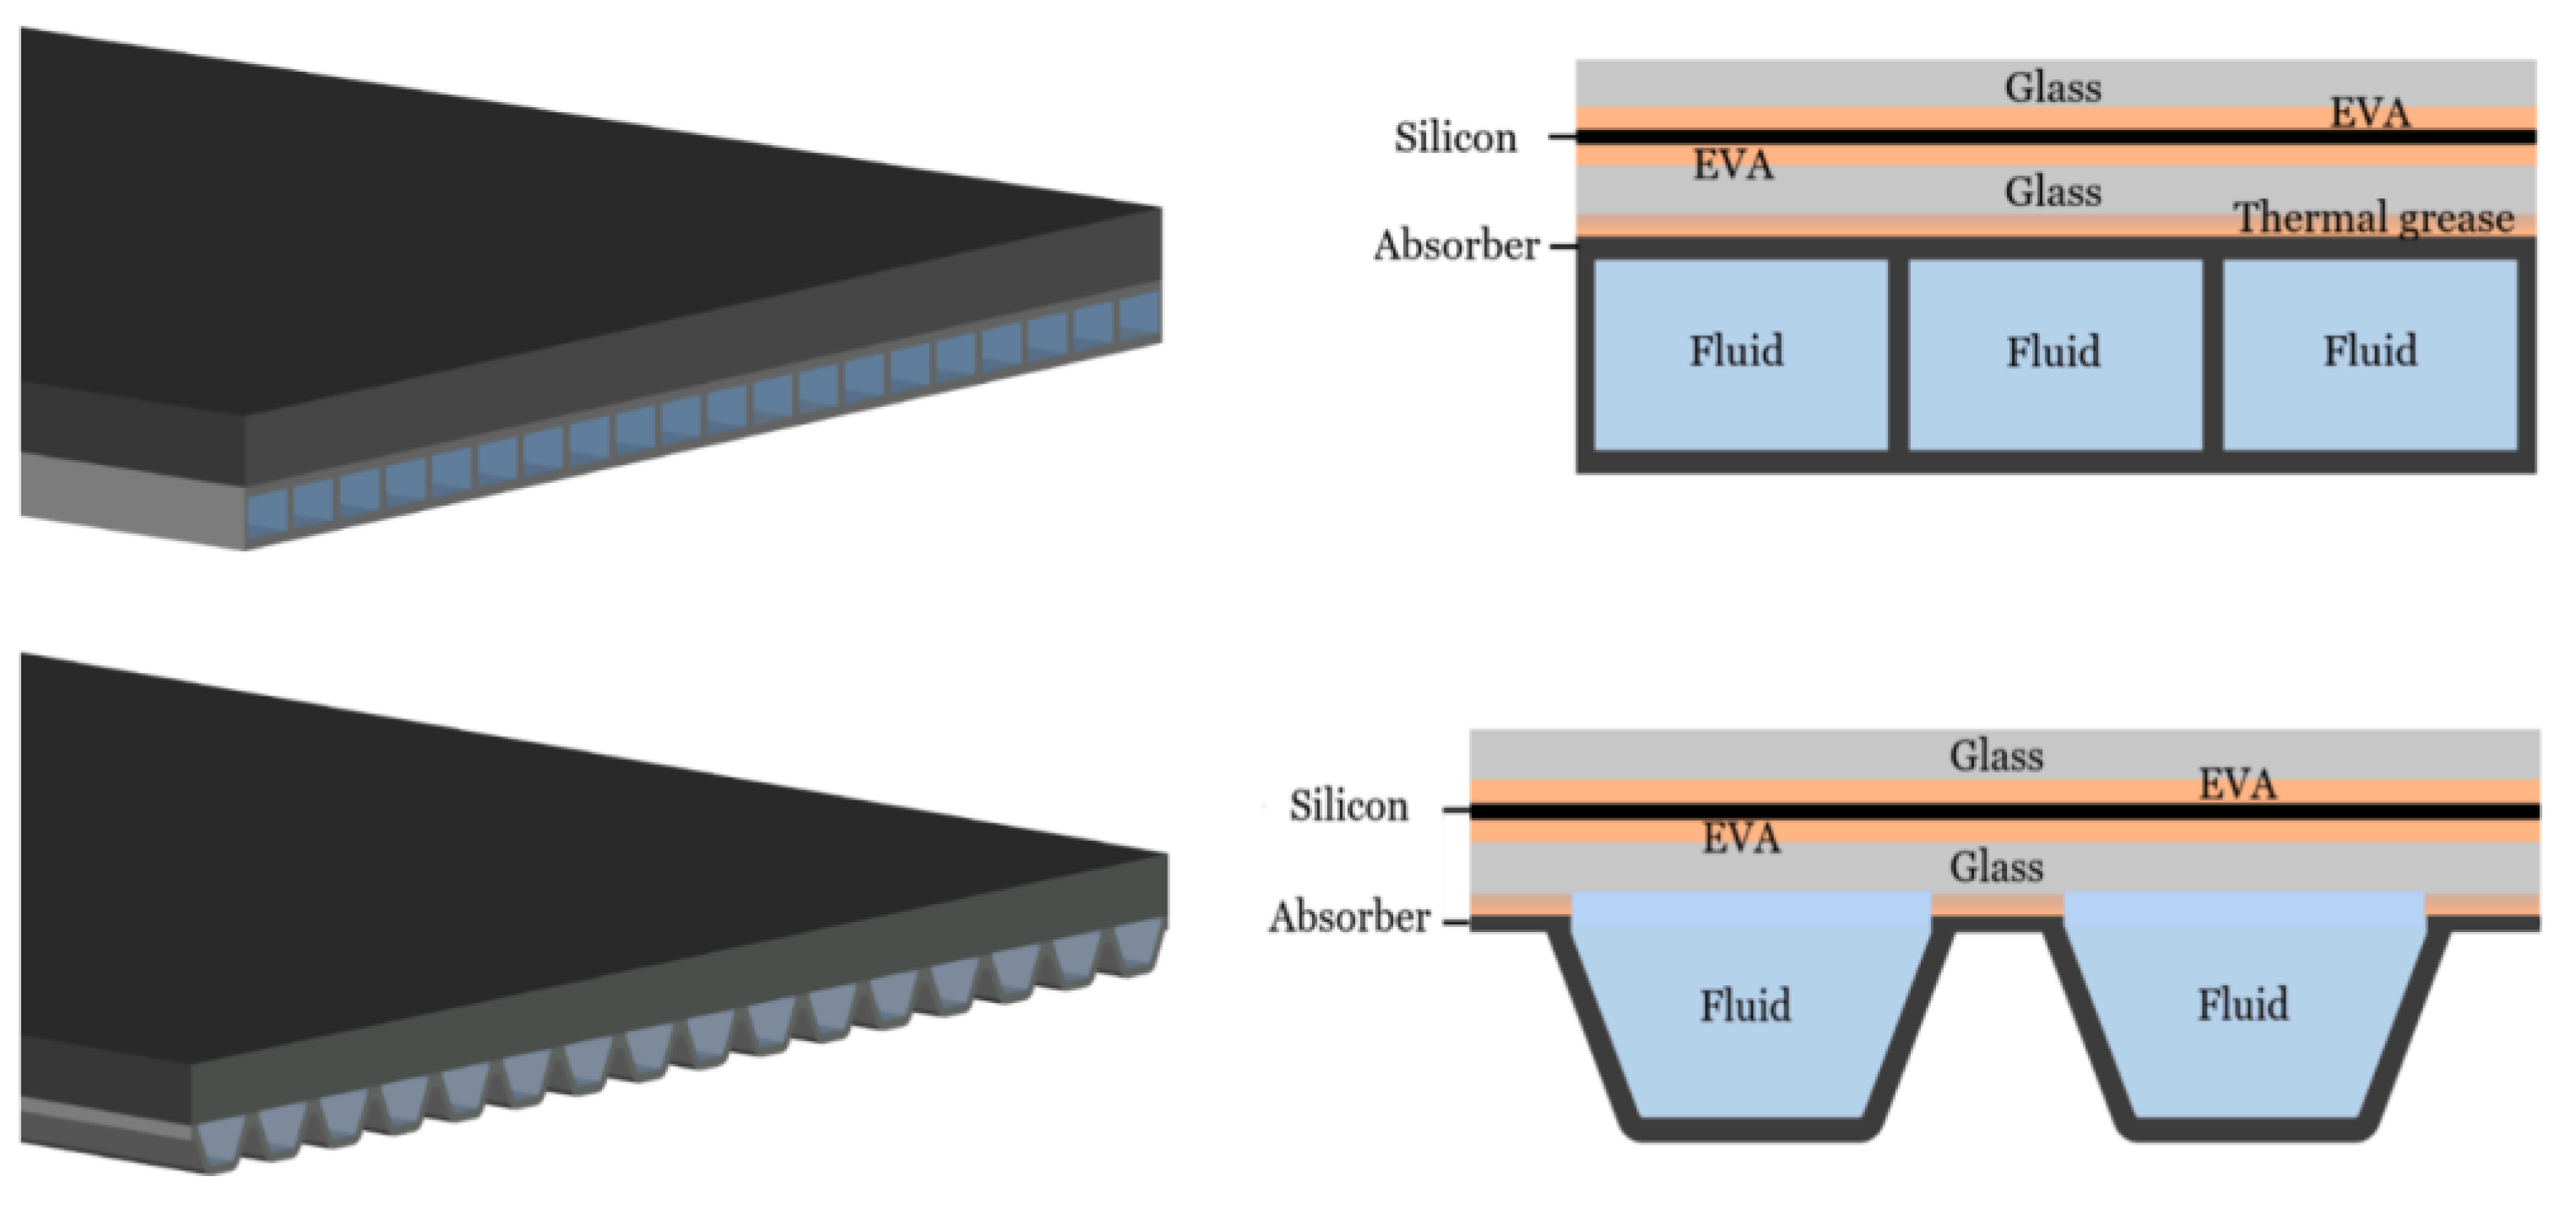
Figure 18.
Temperature distribution at the inlet plane of the CG-AL absorber (a) , of the CG-PC absorber (b) with 0, 10, 20 and 30 mm fins and (c) at the entire outer surface of the CG-AL and CG-PC collector with 30 mm fins. [17].
Figure 18.
Temperature distribution at the inlet plane of the CG-AL absorber (a) , of the CG-PC absorber (b) with 0, 10, 20 and 30 mm fins and (c) at the entire outer surface of the CG-AL and CG-PC collector with 30 mm fins. [17].
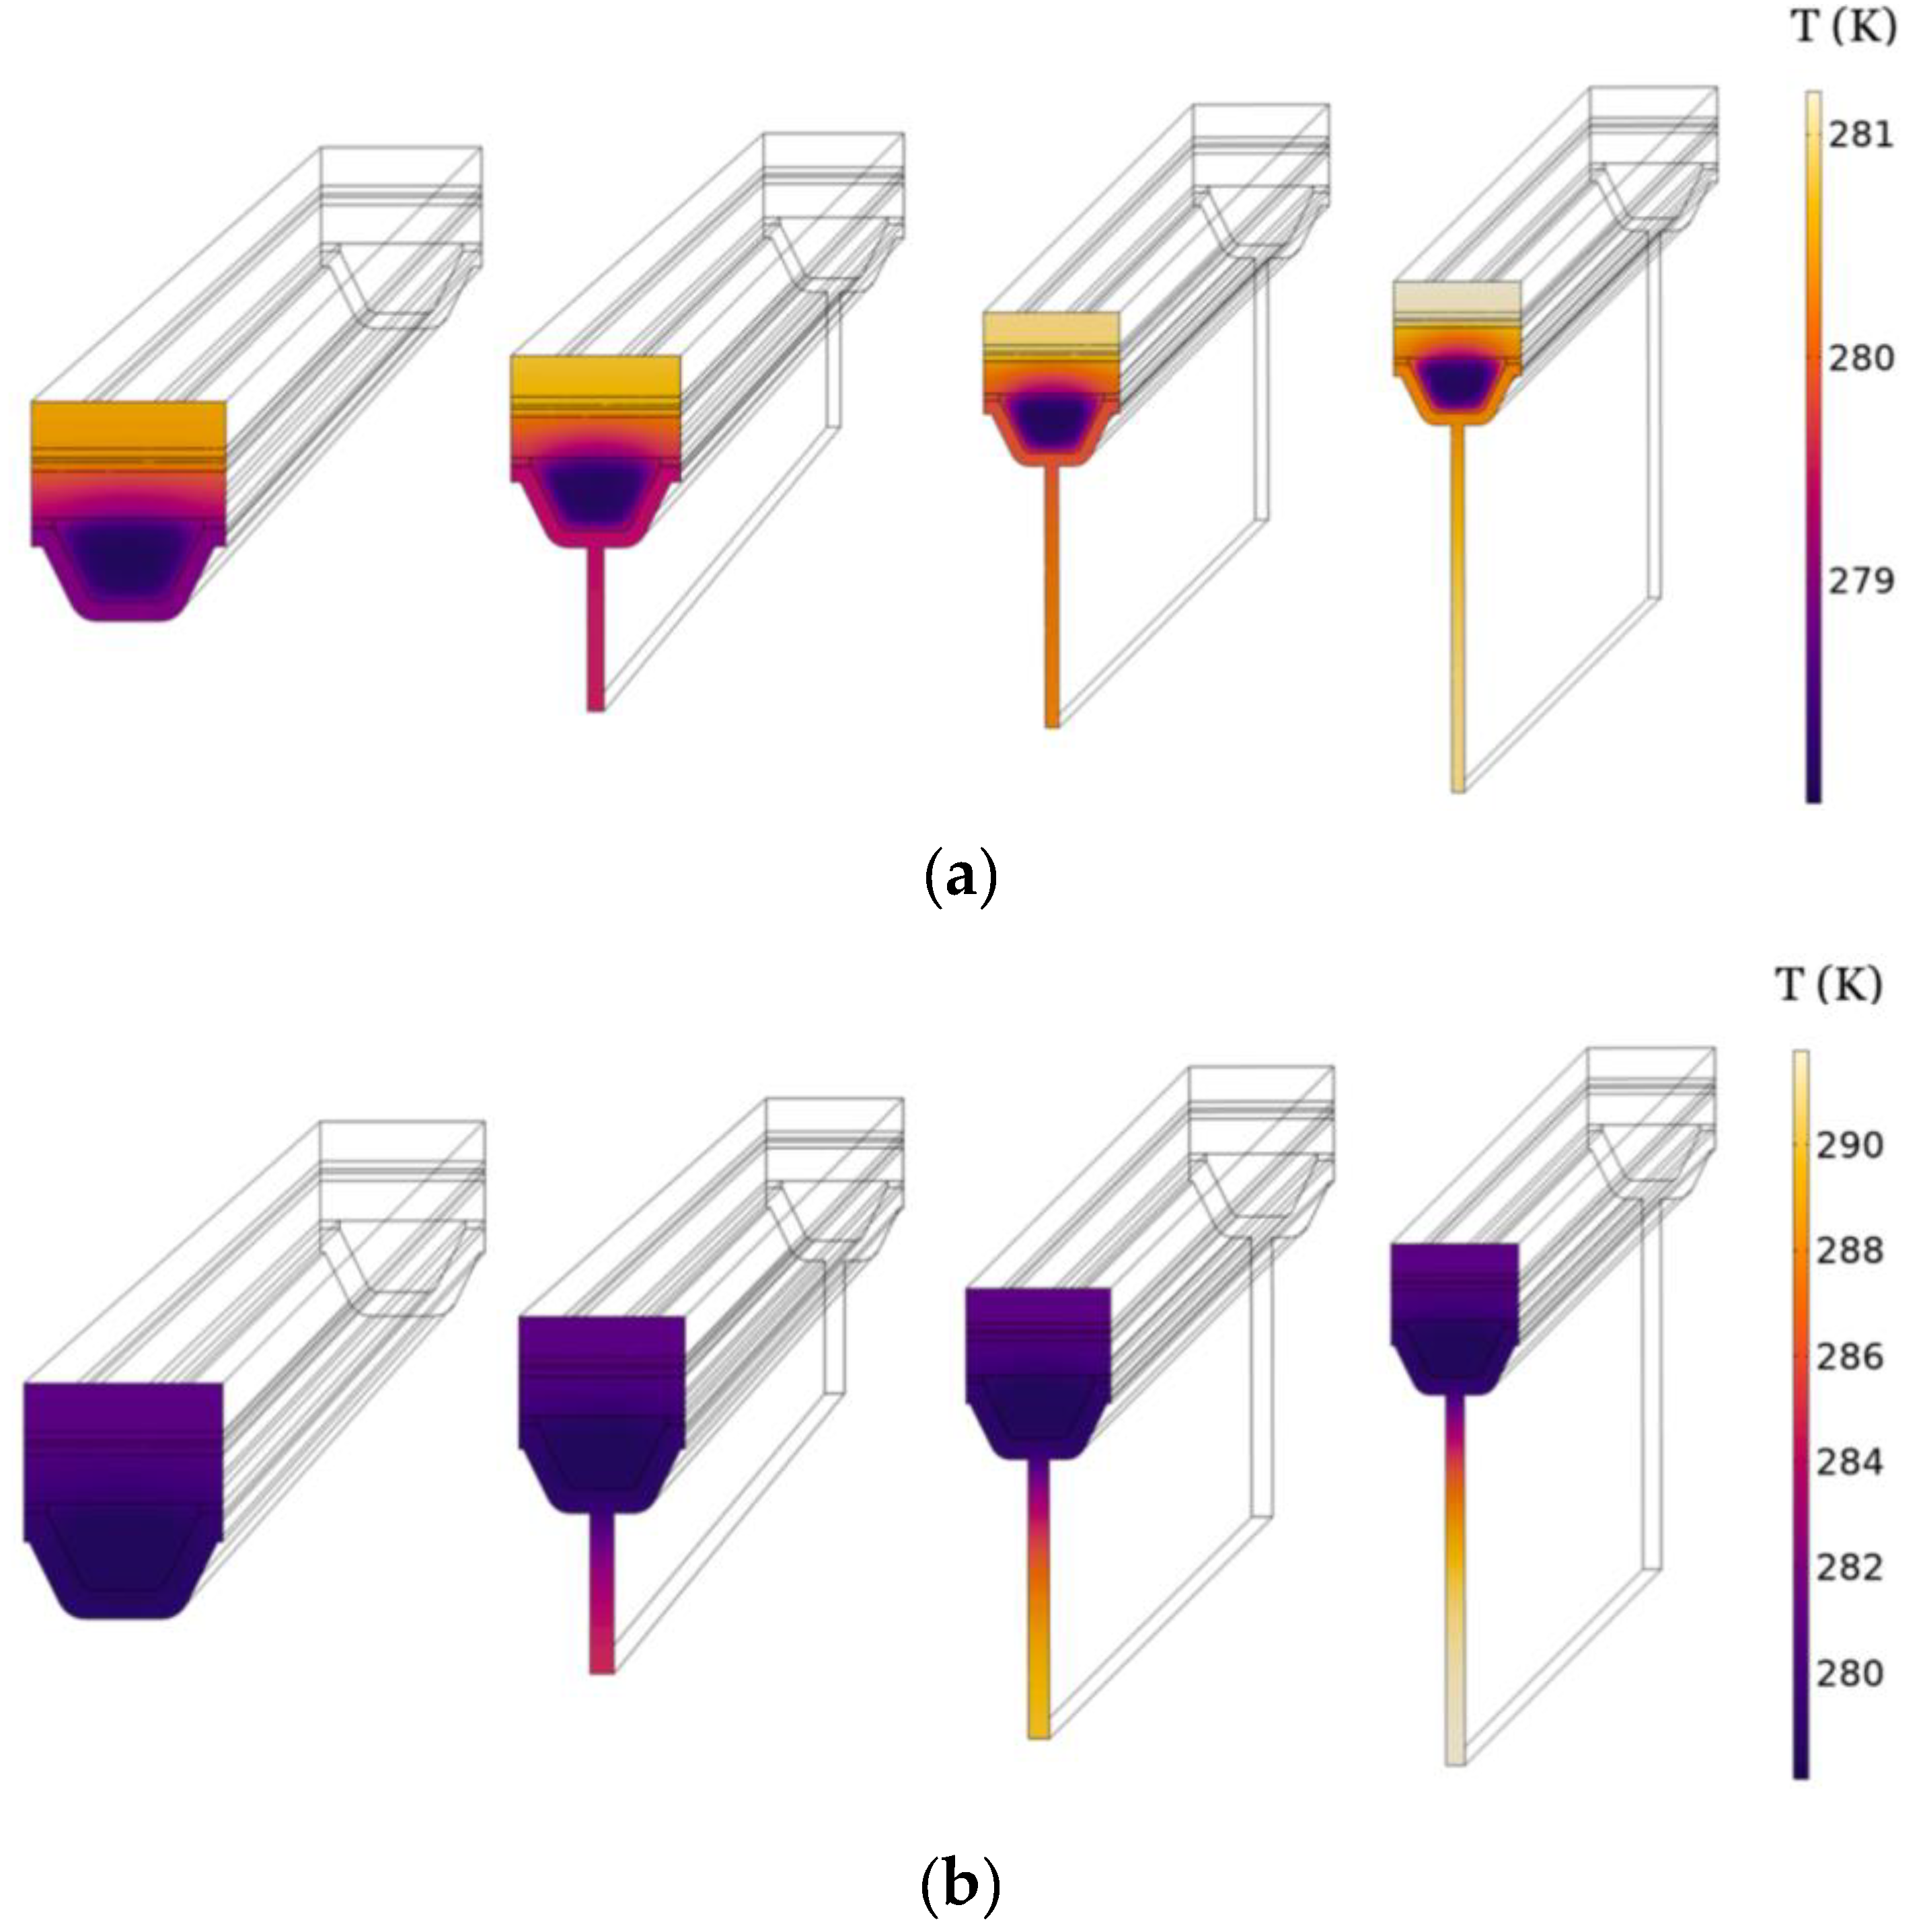
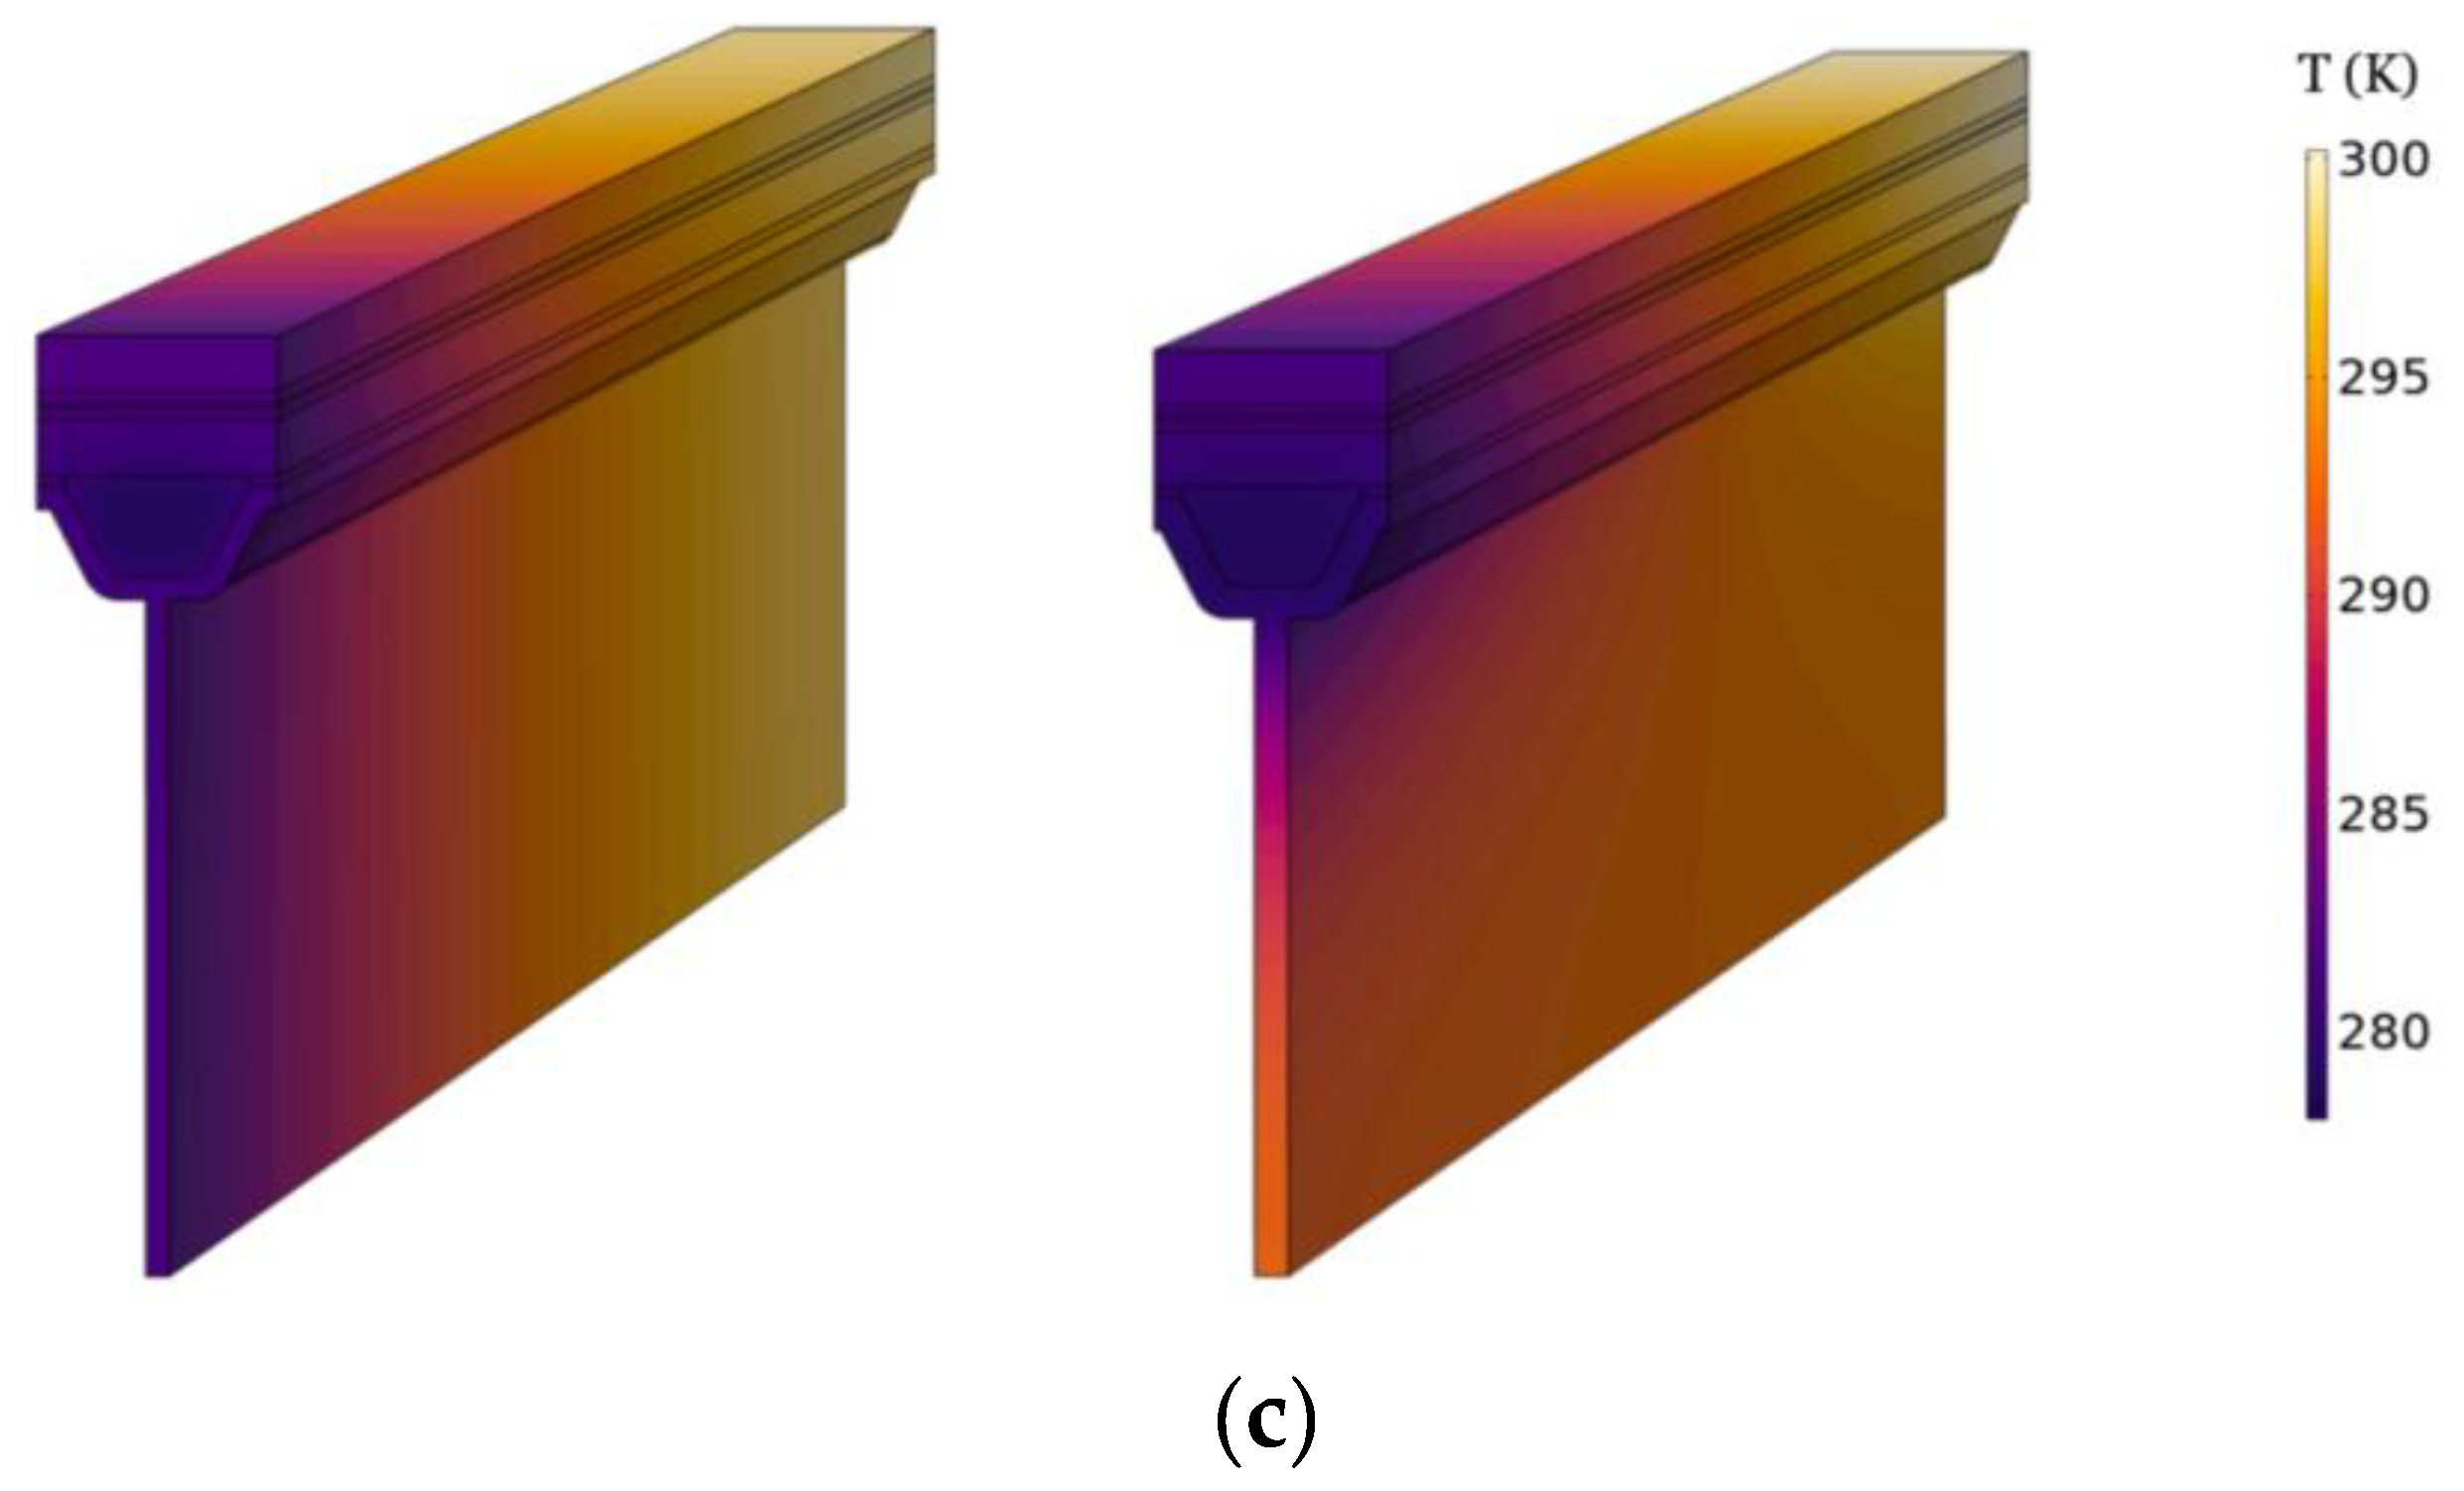
Figure 19.
Annual collector thermal energy output for 3 fin length with forced convection [17].
Figure 19.
Annual collector thermal energy output for 3 fin length with forced convection [17].
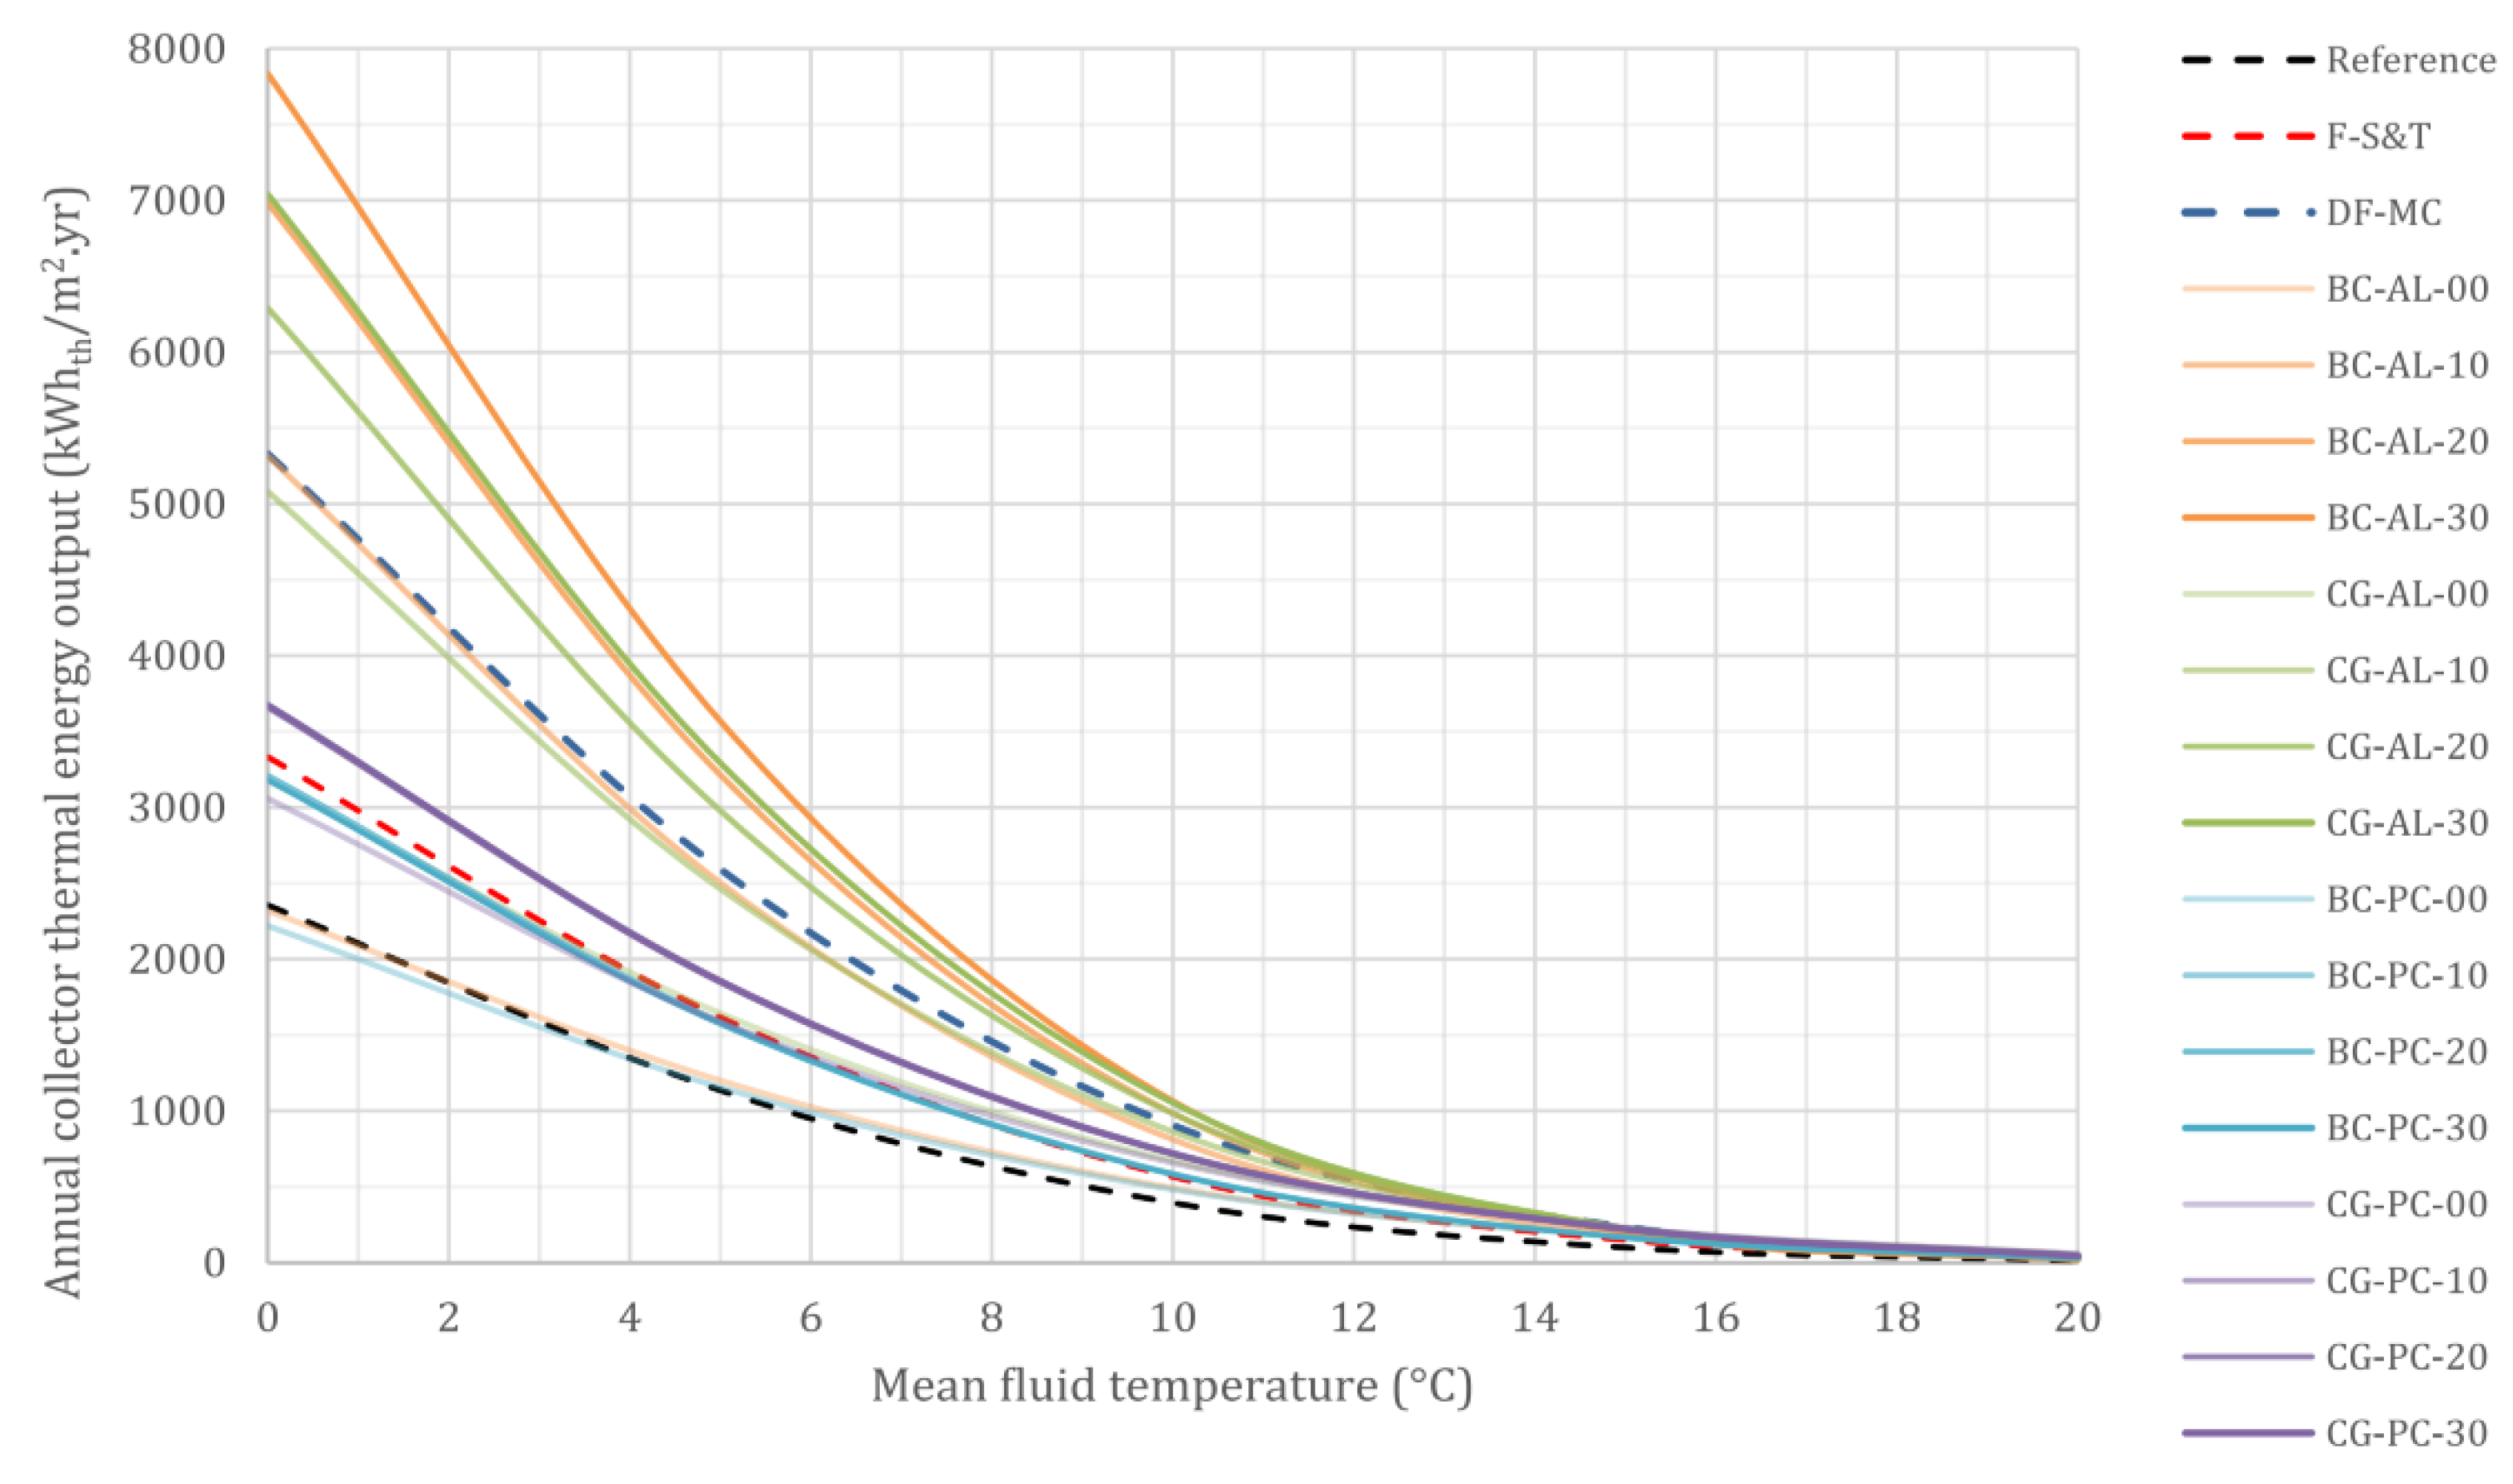
Figure 20.
Schematic diagram of the test rig and the PCM container used in Sarafraz et al. work. (A) Schematic diagram of the experimental setup, (B) cooling jacket of the PV panel and the PCM container [18].
Figure 20.
Schematic diagram of the test rig and the PCM container used in Sarafraz et al. work. (A) Schematic diagram of the experimental setup, (B) cooling jacket of the PV panel and the PCM container [18].
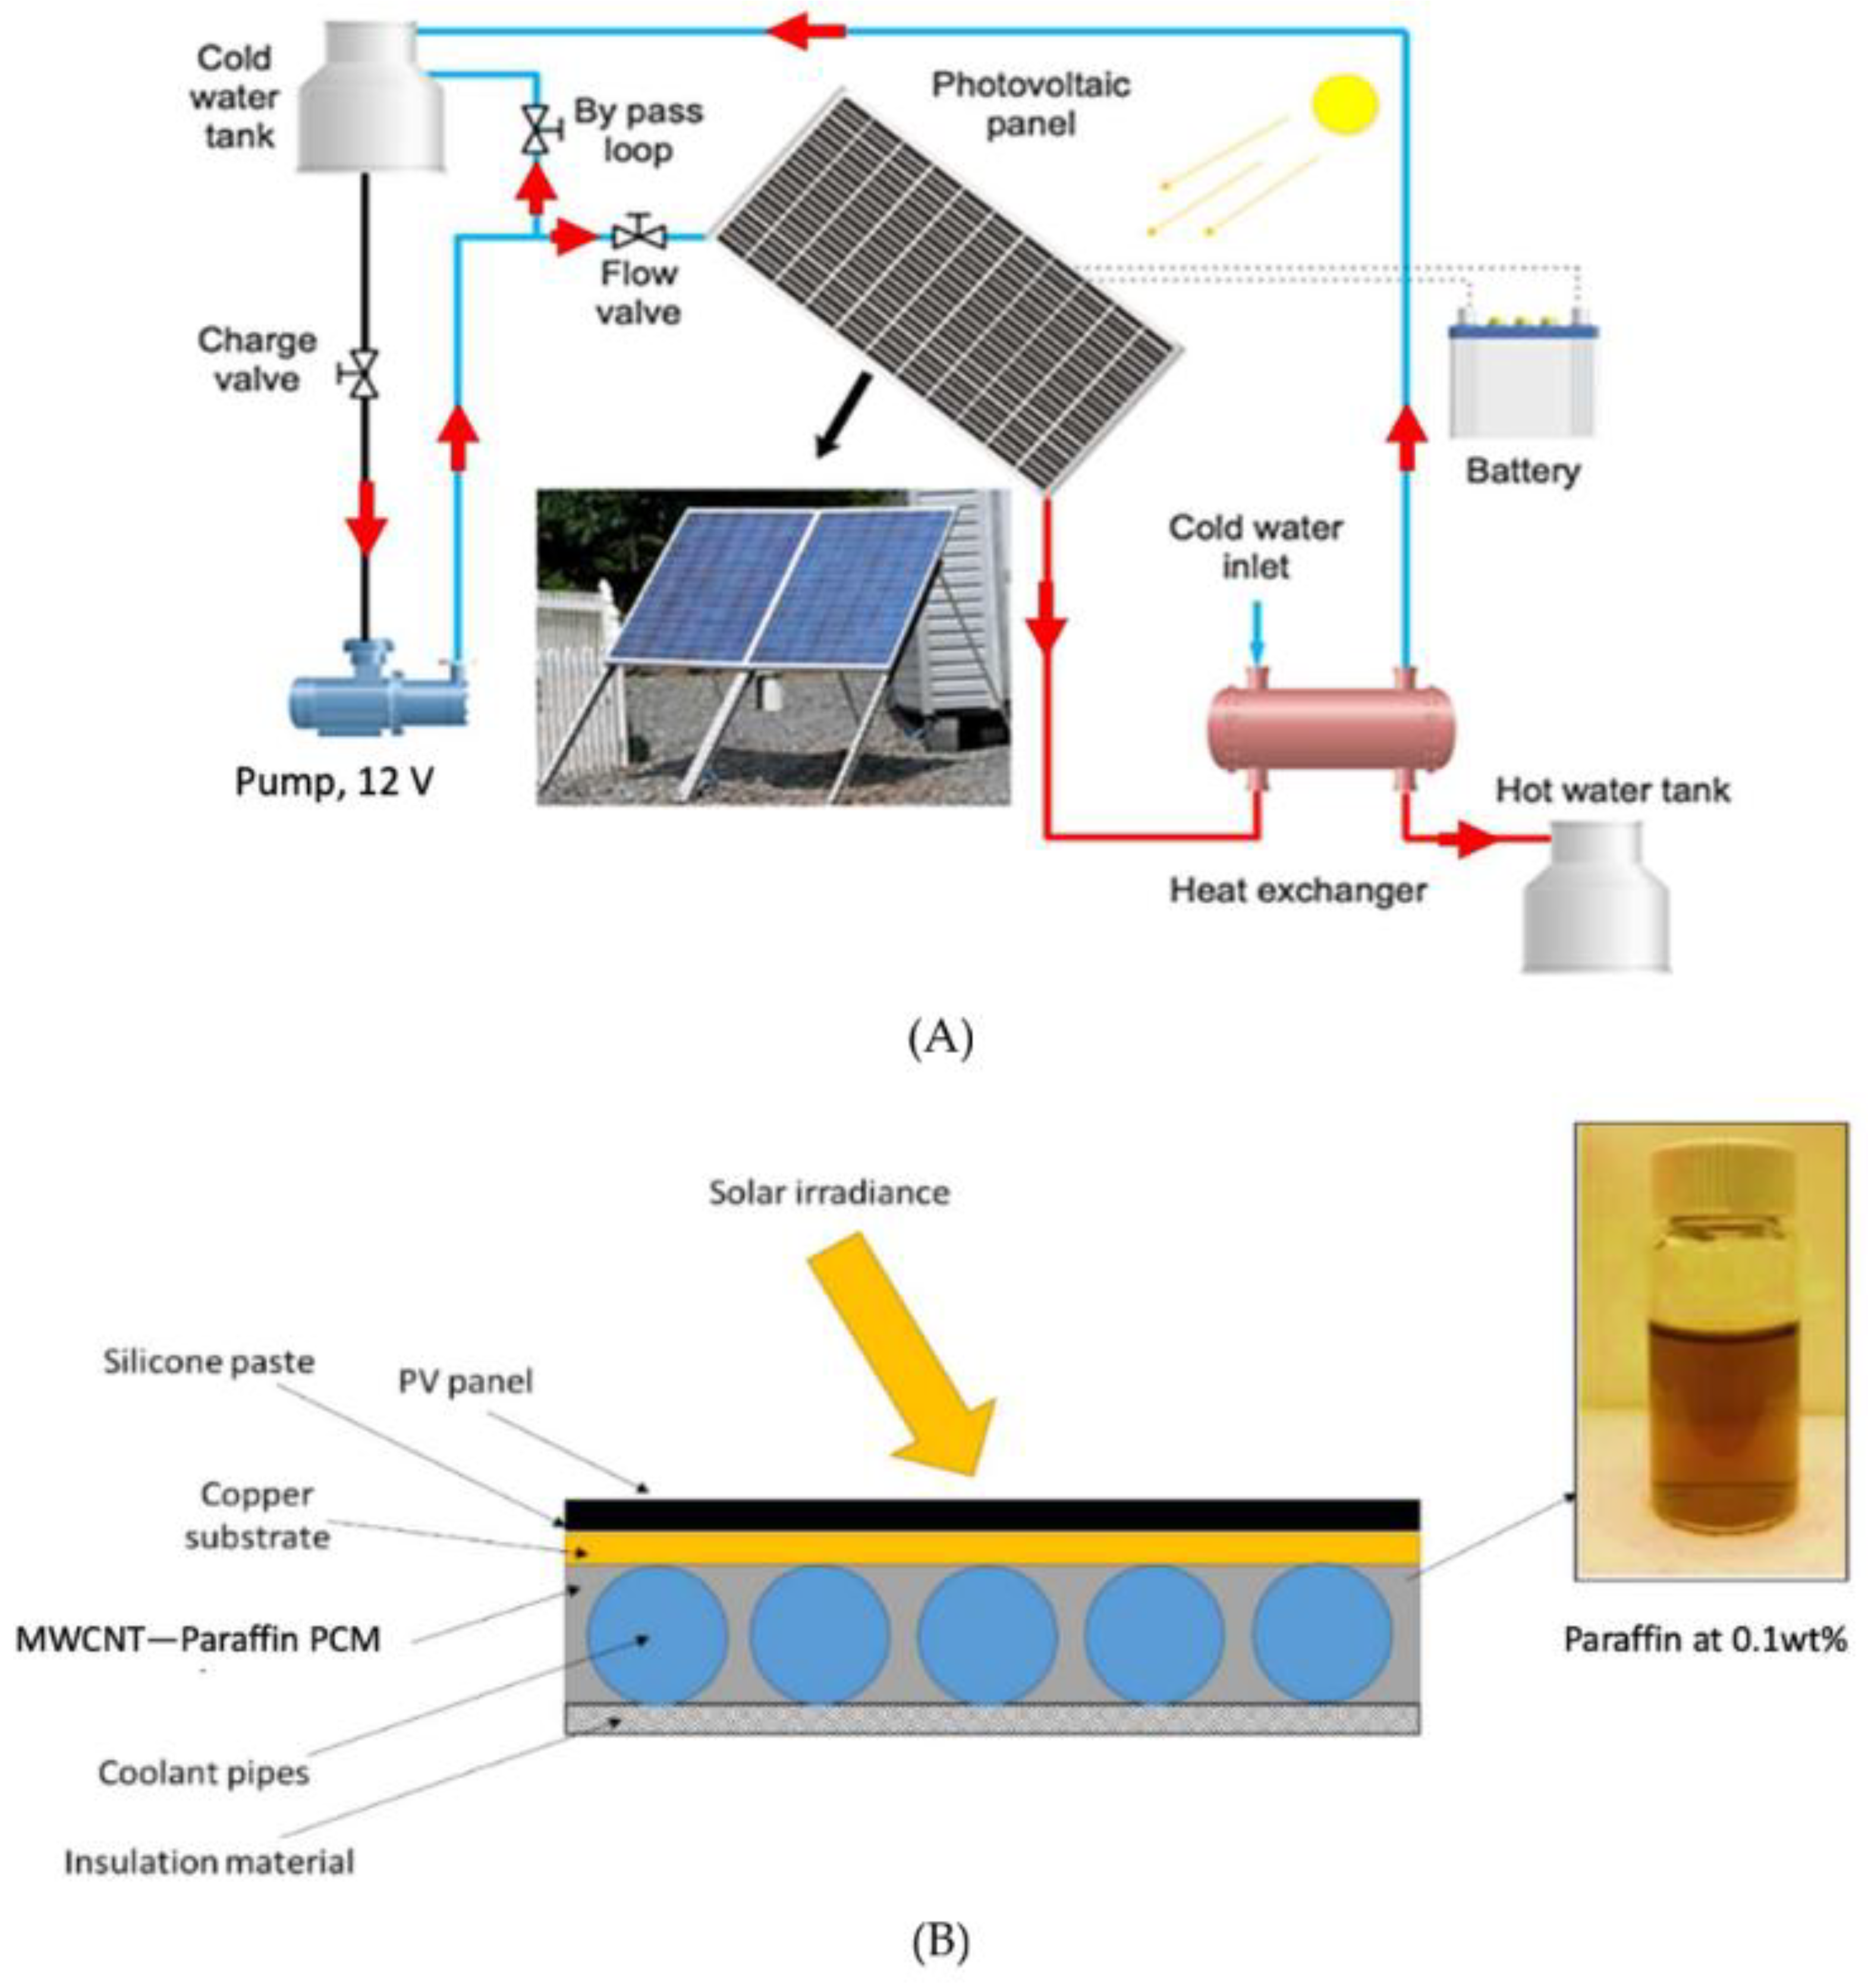

Table 1.
Technical performance results and economical cost of different cooling methods [6] with 2,7,8-monocrystalline silicon PV cells and 1,3,4,5,6-polycrystalline silicon.
Table 1.
Technical performance results and economical cost of different cooling methods [6] with 2,7,8-monocrystalline silicon PV cells and 1,3,4,5,6-polycrystalline silicon.
| Cooling Method | Temperature Drop (°C) | Efficiency Enhancement | Net Power Gain (W/m²) | Total Cost USD/m² |
|---|---|---|---|---|
| 1. Water Spraying | 40 | 15% | 150 | 75 |
| 2. Evaporative Cooling | 40 | 15% | 150 | 75 |
| 3.Thermosiphon with clay Pot | 28 | 10% | 100 | 25 |
| 4. Phase Change Material | 23 | 10% | 100 | 1125 |
| 5. Thermosiphon | 23 | 8% | 80 | 25 |
| 6. Forced Convection | 22 | 7% | 70 | 68 |
| 7. Heat Pipe | 14.2 | 8% | 80 | 168 |
| 8. Aluminum Fins | 12.5 | 4% | 40 | 58 |
Table 2.
Comparison of Passive Cooling Techniques for PV Modules.
| Cooling Method | Key Findings | Advantages | Limitations |
|---|---|---|---|
| Heat Sinks | 16.4% temp. reduction, improved energy output | No water/power needed , Simple and low maintenance | Bulkier design |
| Heat Pipes (HPT) | Up to 10°C reduction (acetone fluid) | Compact, low maintenance | Limited scalability |
| PCM Cooling | 10°C peak temp. reduction | High latent heat storage | Higher cost |
Table 3.
Thermal performance coefficients and U-value at 1.3 m/s for different absorber designs.
| Thermal performance coefficients |
Box Channel Aluminum |
Box Channel Polycarbonate |
Corrugated Aluminum |
Corrugated Polycarbonate |
|---|---|---|---|---|
| U-value [W/m².K] | 12.07 | 11.87 | 15.96 (+32%) | 15.81 (+33%) |
Table 4.
Collector design and their U-value with and without forced convection[17].
Table 4.
Collector design and their U-value with and without forced convection[17].
| Collector design | U-value [W/m².K] Without forced convection | U-value [W/m².K] With forced convection |
|---|---|---|
| Reference | 16.3 | 29.8 |
| BC-AL-00 | 12.1 | 19.3 |
| BC-AL-10 | 26.9 | 55.8 |
| BC-AL-20 | 39.8 | 82.8 |
| BC-AL-30 | 50.8 | 100.9 |
| CG-AL-00 | 16 | 25.9 |
| CG-AL-10 | 25.8 | 49.9 |
| CG-AL-20 | 34.7 | 68.8 |
| CG-AL-30 | 42.4 | 82.9 |
| BC-PC-00 | 11.9 | 18.7 |
| BC-PC-10 | 20.4 | 33.1 |
| BC-PC-20 | 22.1 | 33.7 |
| BC-PC-30 | 22.3 | 33.4 |
| CG-PC-00 | 15.8 | 25.1 |
| CG-PC-10 | 21.8 | 34.6 |
| CG-PC-20 | 23.0 | 35.1 |
| CG-PC-30 | 23.2 | 35.1 |
Disclaimer/Publisher’s Note: The statements, opinions and data contained in all publications are solely those of the individual author(s) and contributor(s) and not of MDPI and/or the editor(s). MDPI and/or the editor(s) disclaim responsibility for any injury to people or property resulting from any ideas, methods, instructions or products referred to in the content. |
© 2025 by the authors. Licensee MDPI, Basel, Switzerland. This article is an open access article distributed under the terms and conditions of the Creative Commons Attribution (CC BY) license (http://creativecommons.org/licenses/by/4.0/).
Copyright: This open access article is published under a Creative Commons CC BY 4.0 license, which permit the free download, distribution, and reuse, provided that the author and preprint are cited in any reuse.


