Submitted:
09 July 2025
Posted:
10 July 2025
You are already at the latest version
Abstract
Intravenous push (IVP) administration of controlled substances in hospital settings presents operational challenges related to medication waste, documentation, and diversion risk. This multi-site observational study aimed to quantify the pharmacy workforce time and associated costs linked to IVP waste management across a 16-hospital health system in Southwest Florida. Data was collected from over 4,400 controlled substance transactions involving fentanyl, midazolam, hydromorphone, morphine, ketamine, and lorazepam. Methods included automated transaction analysis, manual chart reviews, and software-based compliance case evaluations. Results indicated patterns of partial dose waste particularly for midazolam (85.2%) and hydromorphone (78.8%) and identified opportunities where documentation efforts could be further optimized through automation. Manual review of 333 incidents required an average of 6 minutes and 43 seconds per case, extrapolating to over 496 hours of quarterly pharmacy labor or nearly 1,985 hours annually. Software-based case reviews added another 32 hours per quarter or 130 hours annually. Additionally, waste receptacle systems incurred over $1.1 million in capital costs and $322,500 in annual maintenance, with technician labor contributing further operational burden. These findings underscore the resource demands of IVP waste management and support the need for standardized dosing, enhanced documentation workflows, and pharmacy-led interventions to improve efficiency and reduce diversion risk.
Keywords:
ready to administer
; waste
; intravenous
; IV push
; pharmacy
; cost effectiveness
1. Introduction
Injectable medications are widely used across many health systems and are common root causes of medication errors. About one-third to one-half of such medication errors that occur with intravenous (IV) medications are preparation and administration errors. These errors lead to more than one million hospitalizations annually, adding around $2.7 billion to $5.1 billion of medical costs to the US healthcare system.1,4 Controlled substances are associated with medication errors and carry unique risks, including drug diversion. Meanwhile, health-system policies and procedures for handling and disposing of controlled substances vary. Controlled substances including fentanyl, hydromorphone, and morphine are associated with particularly high abuse and diversion risk and therefore proper disposal of these agents is best practice. The Drug Enforcement Agency (DEA) estimates that prescription drug diversion in the United States is a $25 billion-a-year industry.2
Bluesight™, a medication intelligence company, has reported diversion and controlled substance documentation data from over 900 clinical sites. This report confirms the highest variance in documentation rates with fentanyl, midazolam, hydromorphone, morphine, and lorazepam, due to incorrect documentation (50%), issues with documentation timing (31%), and missing documentation (19%). Of these drugs, fentanyl is reported as the drug with the highest variances (24%), followed by midazolam (15%), hydromorphone (10%), morphine (7%), and lorazepam (6%).11, 12 Depending on the patient care unit, the quantity and variety of controlled substances administered can create an administrative and regulatory burden on health-care professionals. Policies requiring thorough documentation, checks and balances, and audits necessitate an institutional investment of time and resources. There are significant costs associated with proper controlled substance disposal, management, and regulatory compliance. In the context of the current opioid crisis, and given the high abuse potential of fentanyl, hydromorphone, and morphine, it is imperative that waste is minimized, and waste procedures are followed to ensure safe disposal of controlled substances. Previous research has been conducted in operating rooms demonstrating significant costs associated with both product waste and the workforce time associated with compliance.5,6,7
A prospective multicenter study in Italy focused specifically on observing this phenomenon specifically in ICU, emergency areas, and OR settings. The study observed that the estimated yearly waste amounted to 139,531 syringes, for a total estimated financial cost of €78,060 ($92,569).3 Furthermore, a previous study by Hertig et. al found significant product waste (PW) and nurse and anesthesia workforce time waste (WTW) associated with controlled substances in procedural care areas, with an estimated WTW of $56,557 over a span of 10 days.10 However, limited data exist for pharmacy workforce time waste and the resulting implications on overall waste minimization practices in inpatient hospital settings. This information is critical to support the expanded adoption of improved waste compliance processes for controlled substances. The purpose of this study is to quantify pharmacy workforce time and cost association with IV controlled substance products in inpatient hospital units. Specific data on medication volume will help to evaluate pharmacy involvement along the medication use process. The study will be conducted at a large 16-hospital health system in Southwest Florida including facilities such as St. Joseph’s Hospital, St. Joseph’s Women’s & Children’s Hospital, and Morton Plant Hospital. Given the high abuse potential of controlled substances, it is imperative waste procedures are followed to ensure proper waste disposal. While previous research has focused on clinical nursing and anesthesia areas, research is needed to better understand the pharmacy-specific financial and workforce impacts associated with drug waste in these healthcare settings.
2. Materials and Methods
The primary aim of this study is to quantify the total pharmacy workforce time and costs associated with administering ketamine, midazolam, fentanyl, hydromorphone, morphine, and lorazepam via the IVP route. This will be evaluated through the quantification of pharmacy workforce time defined as “workforce time waste” (WTW) associated with (1) process incidents that require pharmaceutical waste (PW) and (2) total time required to reconcile various reported PW incidents. This will be measured through continuous reporting of waste and administration documentation. The secondary aim of this study is to analyze workflow practices related to evaluating costs for waste disposal practices and WTW required to maintain waste disposal requirements.
This observational study was conducted across a wide range of inpatient and procedural care environments within a large, multi-hospital health system. Clinical units included high-acuity areas such as Intensive Care Units (ICUs), Emergency Departments (EDs), and Post-Anesthesia Care Units (PACUs), as well as general inpatient medical-surgical floors, pediatric and neonatal intensive care units (PICU and NICU), and specialized procedural areas like the Operating Room (OR), Cardiac Catheterization Lab (Cath Lab), and Endoscopy Suites. Maternal-child health units (e.g., Labor and Delivery, Postpartum), behavioral health units, and outpatient infusion and dialysis centers were also represented. This diversity of settings strengthens the generalizability of the findings by capturing the varied workflows, documentation practices, and medication use patterns that influence pharmacy workforce time waste across the continuum of hospital care.
All hospital-based areas were identified and evaluated using controlled substance volume data, with similar mechanisms for tracking controlled substance waste. In settings where automated systems were used to manage controlled substances, a pharmacy workflow time study design and a subset of continuous direct observation time motion studies were employed. A data collection tool developed in a previous study by Hertig et al. was used to capture medication type, waste amount, activity time stamps, total time, and the number of incidents reported. Once automated methods and processes were observed, a standardized process was synthesized for data analysis. Consistent with previous studies, descriptive statistics were used. Data measures such as number of assessments, workforce waste, and incident reporting were reported for each drug (ketamine, midazolam, fentanyl, hydromorphone, morphine, and lorazepam) individually and in aggregate. For continuous variables, mean, standard deviation, and median (with minimum and maximum values) were calculated. For categorical variables, frequency tables including counts and percentages were generated.
Bluesight Control Check™ (formerly Protenus®) analyzed data from Pyxis medication dispensing stations, focusing on controlled substance incident-related transactions that were returned to stock, disposed of, or unreconciled. A transaction was considered unreconciled when the dispensed amount did not match the documented quantity for administration, waste, or return. The analysis included incident-related transactions involving IV push fentanyl, hydromorphone, midazolam, morphine, ketamine, and lorazepam, recorded from October to December 2024 across 16 hospital sites. Transactions were excluded if the dispensed amount was zero or if the unreconciled amount was zero or negative. Remaining unreconciled transactions were categorized as:
Likely Waste: Partial administration documented, but the remainder unaccounted for.
Likely Administration: Partial waste documented, but the remainder unaccounted for.
Everything: No documentation of waste or administration, or totals that did not reconcile with the dispensed amount.
The total number of incident-related transactions was calculated for each medication, along with a half-vial analysis to identify the most commonly wasted vial type. Transactions were classified as “half-wasted” when the documented waste equaled exactly half of the standard vial size. Importantly, while “everything” transactions reflect incomplete data capture, they do not confirm improper handling. These often originate from procedural areas—such as Catheterization Labs, Radiology, and other settings—where alternative documentation systems or paper charting may be used. Because these systems may not be fully integrated with the electronic health record platforms that feed into Bluesight Control Check™, they contribute to a high volume of transactions with missing or partial documentation. Similarly, “likely waste” and “likely administration” transactions also represent incident-related events that may be documented elsewhere but require manual validation. These classifications arise when automated systems cannot definitively determine the outcome of a medication transaction, necessitating manual human review to confirm whether the medication was administered, wasted, or otherwise handled. This presents a significant operational challenge, as all such transactions—regardless of category—require manual review to validate medication handling. Table IIB quantifies the time burden associated with these reviews and highlights the need for improved system integration and documentation practices.
“Likely Waste, Administration and Everything Manual Review”
Bluesight Control Check™ was used to extract detailed data for each incident, including the incident ID, date, associated Automated Dispensing Cabinet (ADC), and records of medication handling actions (e.g., dispensed, completed, disposed). To validate this data, a single research team member conducted a comprehensive manual review of patient charts. This review was carried out over several weeks during March and April 2025.
A standardized process was developed to guide the review and ensure all potentially unverified components—such as missing documentation for administration, waste, or both—were thoroughly assessed. This included examining nursing notes, anesthesia records, operative and procedural documentation, flow sheets, and the Medication Administration Record (MAR). The goal was to cross-reference and confirm the accuracy of the medication handling data reported in Bluesight Control Check™. To support consistent time tracking, an Excel-based database was created with an integrated macro. This tool enabled the reviewer to log start and stop times using clickable buttons, which automatically applied timestamps to the relevant fields, streamlining the documentation of each unverified waste evaluation.
“Incident-Related Transactions Case Review”
When incidents such as delayed waste documentation, unreconciled drug transactions (e.g., missing waste or administration records), delayed administrations, or other discrepancies are identified, the Bluesight Control Check™ software uses machine learning algorithms to generate cases for further evaluation. These cases are flagged based on patterns of concern and categorized as “Very Suspicious,” “Suspicious,” or unclassified, using statistical comparisons such as mean and z-score analyses relative to peer activity within similar ADC usage groups. For this study, a designated Pharmacy Diversion Analyst was responsible for tracking timestamps throughout the case evaluation process. The analyst reviewed cases that included at least one unreconciled medication, along with any other incident-related events. These cases occurred over a one-year period, from May 2024 to May 2025. To support accurate time tracking, an Excel-based database was developed with an integrated macro that allowed the analyst to record start and stop times using clickable buttons. These actions automatically applied timestamps to the relevant data fields, streamlining the documentation process during case evaluations. Based on this workflow, three core steps were identified in the compliance review process:
- Pulling ADC Data – Retrieving up to 30 days of automated dispensing cabinet (ADC) transaction data relevant to the case timeframe.
- Reviewing Data – Analyzing key metrics such as waste transactions, frequency of vends per product, and daily usage patterns. This step also involved comparing the subject’s activity to peer benchmarks across ADCs and hospital units to identify trends or anomalies.
- Providing a Recommendation – Summarizing findings and offering a recommendation for next steps. These recommendations support hospital leadership in determining appropriate follow-up actions, which may include case closure, referral to a nurse manager, or escalation to the Diversion Response Team (DRT).
This structured approach ensures consistency in case evaluation and supports timely, data-driven decision-making in the controlled substance diversion review process.
“IV Push Waste Receptable Costs and Waste Receptable Workforce Time Waste (WTW)”
To evaluate the operational costs associated with IV push waste receptacle systems, two analyses were conducted. First, the capital and ongoing costs of waste receptacle products (e.g., Cactus Smart Sink® and Pharma Lock® Controlled Substance Waste Management System), based on the number of Pyxis locations at each facility was calculated. For each site, the number of installed waste receptacle units was determined, and associated startup and maintenance fees were extracted from vendor contracts to estimate total system costs.
The pharmacy associated workforce time waste (WTW) was related to upkeep and maintenance of these systems. This included technician labor required for routine tasks such as replacing batteries and cartridges. A sample size was determined to evaluate the average time required for these maintenance activities, with scheduled observations conducted at Morton Plan Hospital, where cartridge changes occur biannually (as also practiced at St. Joseph’s Hospital (SJH)). Time data collected from these observations were used to estimate labor costs associated with WTW across facilities. The research was approved as exempt from full instructional review board review by the BayCare Health System Institutional Review Board (IRB FWA00008336).
3. Results
A total of 4,432 controlled substance transactions were analyzed for fentanyl, hydromorphone, midazolam, morphine, ketamine, and lorazepam. Each transaction was categorized based on documentation patterns into one of three groups: “Likely Waste”, “Likely Administration”, or “Everything” (which includes transactions with incomplete or ambiguous documentation). As shown in Table 1A, Fentanyl had the highest number of total transactions (1,871), followed by midazolam (1,217) and hydromorphone (528). Notably, midazolam had the highest proportion of transactions categorized as “Likely Administration” (367), while fentanyl had the most evenly distributed documentation across all three categories. Morphine and lorazepam also showed a high number of “Everything” transactions, suggesting frequent gaps in documentation for these agents. Ketamine, while representing the smallest sample size (33 transactions), still demonstrated a notable proportion of transactions lacking clear documentation.
A secondary analysis, visualized in Figure 1, focused on transactions where the dispensed amount matched the standard vial size, allowing for an evaluation of how often exactly half of the vial was documented as waste. This revealed consistent patterns of partial dose waste, particularly for midazolam (85.2%), hydromorphone (78.8%), and morphine (75.0%), suggesting opportunities for standardization in dosing or packaging to reduce waste. These findings are further detailed in Table 1B, which summarizes the frequency of partial dose waste.

Table 1A.
Incident-Related Transactions.
| Medication | Likely Waste | Likely Administration | Everything* | Total Transactions |
| Fentanyl | 602 | 619 | 650 | 1,871 |
| Hydromorphone | 150 | 115 | 263 | 528 |
| Midazolam | 70 | 367 | 780 | 1,217 |
| Morphine | 46 | 65 | 332 | 443 |
| Ketamine | 9 | 9 | 15 | 33 |
| Lorazepam | 94 | 110 | 136 | 340 |
Table 1B.
Half-Vial Waste Analysis.
| Medication | Vial Size | Eligible Transactions** | Half Wasted Transactions*** | % Half Wasted |
| Fentanyl | 100 mcg | 1,227 | 749 | 61.04% |
| Hydromorphone | 1 mg | 193 | 152 | 78.76% |
| Midazolam | 2 mg | 398 | 339 | 85.18% |
| Morphine | 4 mg | 44 | 33 | 75.00% |
| Ketamine | 200 mg | 20 | 5 | 25.00% |
| Lorazepam | 2 mg | 232 | 128 | 55.17% |
*“Everything” includes transactions with only dispensed data or with all data (dispensed, administration, and waste). **Eligible transactions include those with documented administration and/or waste. ***Half-wasted transactions are those where the documented waste was exactly half of the vial size.
A total of 333 medication incidents were reviewed in this arm of the study, including 193 fentanyl, 57 hydromorphone, 26 midazolam, 46 morphine, 5 ketamine, and 6 lorazepam. The average pharmacy workforce time waste (WTW) per incident varied by medication, with fentanyl requiring 6:54 minutes, hydromorphone 7:12 minutes, midazolam 4:44 minutes, morphine 6:25 minutes, ketamine 6:31 minutes, and lorazepam 6:48 minutes, as detailed in Table 2A. Overall, the average WTW for all 333 incidents was 6:43 minutes per incident, amounting to a total of approximately 37 hours, 36 minutes, and 39 seconds spent confirming the accuracy of medication handling data from Bluesight Control Check™. When these findings were extrapolated to the 4,432 medication incidents from the fourth quarter (October–December), the total pharmacy workforce time waste was estimated to be 496 hours, 8 minutes, and 16 seconds, or nearly 1,985 hours annually, as summarized in Table 2B.
Table 2A.
Manual Review of Unverified Waste: Pharmacy Workforce Time Waste (WTW).
| Medication | Sample Size (n) | Avg. Pharmacy WTW per Incident (min:sec) |
| Fentanyl | 193 | 6:54 |
| Hydromorphone | 57 | 7:12 |
| Midazolam | 26 | 4:44 |
| Morphine | 46 | 6:25 |
| Ketamine | 5 | 6:31 |
| Lorazepam | 6 | 6:48 |
Table 2B.
Summary of Unverified Waste Manual Review.
| Summary | Value |
| Overall Average WTW per Incident (n = 333) | 6:43 (min:sec) |
| Total Sample Size WTW (n = 333) | 37:36:39 (hh:mm:ss) |
| Total Quarterly WTW (n = 4,432) | 496:08:16 (hh:mm:ss) |
| Annualized WTW | 1,984:33:04 (hh:mm:ss) |
A total of 35 medication cases were reviewed using the software compliance review process. These cases represent a subset of medication incidents that required further investigation and formal case creation. Each case underwent a structured three-step review process: pulling ADC data, reviewing the data, and providing a recommendation. On average, Step 1 (Pull ADC Data) required 3 minutes and 13 seconds, Step 2 (Review Data) took 4 minutes and 57 seconds, and Step 3 (Provide Recommendation) took 3 minutes and 20 seconds. The total average time per case was 11 minutes and 30 seconds. The standard deviation for each step was 28 seconds, 1 minute and 24 seconds, and 26 seconds, respectively, with an overall standard deviation of 1 minute and 17 seconds for total review time, as detailed in Table 3A. When extrapolated to the full set of 170 cases that were reviewed during the fourth quarter (October 1 and December 31, 2024) of 2024, the total pharmacy workforce time spent conducting software compliance reviews was approximately 32 hours, 31 minutes per quarter, which equates to roughly 130 hours and 4 minutes annually as shown in Table 3B.
Table 3A.
Incident-Related Transactions Case Review.
| Step Number | Description | Time | Standard Deviation |
| 1 | Pull ADC Data | 03:13 (min:sec) | 00:28 (sec) |
| 2 | Review Data | 04:57 (min:sec) | 01:24 (min:sec) |
| 3 | Provide Recommendation | 3:20 (min:sec) | 00:26 (sec) |
| Total | Time per Case | 11:30 (min:sec) | 01:17 (min:sec) |
Table 3B.
Pharmacy Case Review Workforce Time Waste (WTW).
| Summary | Time |
| Cases Reviewed (n = 35) | 11:30 (min:sec) per case |
| Total Quarterly WTW (n = 170) | 32:31:00 (hh:mm:ss) |
| Annualized WTW | 130:04:00 (hh:mm:ss) |
Table 4 outlines the list prices (as of 2022 and not including any discounts, etc.) associated with IV push waste receptacle systems, including setup and maintenance costs for both solid and liquid waste disposal. The Cactus Smart Sink®, priced at $1,500 per unit, requires both solid and liquid cartridges, while the Cactus Pharma Lock® OR sink, used specifically in anesthesia areas, costs $675 and requires only a liquid cartridge. Smart sinks were deployed across 15 hospital locations, totaling 503 units, and Pharma Lock® O.R. units were installed in 284 anesthesia-related locations, resulting in a combined total of 787 waste receptacle units. Deployment varied by site size: small sites required fewer than 10 units, medium sites 20–60 units, and large sites over 100 units. Based on setup costs of $1,750 per Med Station and $800 per Pharma Lock® O.R. unit, the total estimated list price for equipment deployment was approximately $1,107,450.
These figures represent initial capital investments; however, it is important to note that ongoing maintenance costs including cartridge replacements every six months and potential equipment servicing are required to sustain long-term functionality and compliance. Cartridge replacements are needed every six months, with each cartridge costing $125. Given the replacement frequency and cartridge requirements of four cartridges annually per Smart Sink and two per Pharma Lock® O.R. unit, the estimated annual maintenance list costs are approximately $322,500.
To estimate the labor cost associated with controlled substance waste handling across all hospital locations, a baseline hourly wage of $20 was applied for pharmacy technicians. At BayCare, approximately 750 waste receptacle units require technician involvement, consisting of 500 Cactus Smart Sink units (each with 2 cartridges) and 250 Pharma Lock units (each with 1 cartridge), totaling 1,250 cartridge exchanges annually. Each cartridge exchange takes an average of 8.2 minutes of focused technician time. This time encompasses tasks such as exchanging solid and liquid waste cartridges.
The 8.2-minute estimate was derived from workflow observations conducted at one of the larger hospital sites. During a standard 8-hour shift, two pharmacy technicians were dedicated solely to managing waste receptacle exchanges. Over the course of the day, a total of 117 cartridge exchanges were completed, averaging approximately 58.5 exchanges per technician per shift. The average time per exchange was calculated by dividing the total technician time (16 hours combined) by the number of exchanges, resulting in an average of 8.2 minutes per cartridge observed in Table 5A.
While over half of the units are battery-powered, battery replacements were excluded from this analysis, as they are addressed on an ad-hoc basis. Based on this methodology, the estimated pharmacy technician labor across all hospitals is approximately $854 per quarter, totaling $3,416 annually. This corresponds to a total of 170 hours and 50 minutes of technician time per year or approximately 1 day, 18 hours, and 43 minutes per quarter dedicated to waste receptable cartridge exchanges, shown in Table 5B. It is important to note that this estimate reflects uninterrupted, task-specific time. In practice, workflow interruptions and variations in facility layout such as the location of Automated Dispensing Cabinets (ADCs) can significantly affect task duration.
Table 5A.
IV Push Waste Receptable Management.
| Time Study Sample (Observation-Based) | |
| Average Time per Cartridges Exchange (n = 117) | 8:12 (min:sec) |
| Total Technician Time for 117 Exchanges | 16 hours (2 techs x 8 hrs) |
| Exchanges per Technician per Shift | 58.5 |
Table 5B.
Pharmacy Waste Receptable Management Workforce Time Waste (WTW).
| Hospital-Wide Estimates. | |
| Total Quarterly WTW (n = 1,250 cartridges) | 1 day 18:42:30 (hh:mm:ss) |
| Total Annually WTW (n=1,250 cartidges) | 7 days 02:50:00 (hh:mm:ss) |
| Estimated Quarterly Labor Cost | $854 |
| Estimated Annualized Labor Cost | $3,416 |
4. Discussion
This multi-site observational study provides a comprehensive assessment of pharmacy workforce time waste (WTW) associated with intravenous push (IVP) controlled substance waste in inpatient hospital settings. It uniquely quantifies the time and resource burden on pharmacy personnel across five key areas: automated incident-related transactions and avoidable waste (Tables 1A/B), manual verification of incident-related transactions (Table 2A/B), software-based incident case review (Table 3A/B), waste receptacle system costs (Table 4), and waste receptacle maintenance and technician labor (Table 5A/B).
The study evaluated controlled substance utilization across a diverse range of hospital settings. As expected, high transaction volumes were observed, particularly in areas where medication administration may not have been fully captured in the electronic health record systems integrated with Bluesight Control Check™. These include procedural environments such as Catheterization Labs, Radiology, and other specialized units where alternative documentation systems—or even paper charting—may be used for medication reconciliation. The variability in documentation platforms across these settings contributed to discrepancies in recorded administration data. The findings from Table 1B highlights the scale of avoidable waste, with over 4,400 transactions analyzed and fentanyl accounting for the highest volume of unreconciled and disposed units. Notably, a substantial proportion of transactions involved the disposal of exactly half of a vial, particularly for midazolam (85.2%) and hydromorphone (78.8%), suggesting a systemic pattern of partial dose waste that may be amenable to packaging or dosing standardization interventions.
Tables 2A/B further contextualizes the operational burden by quantifying the time required for manual review of 333 medication incidents. The average WTW per incident was 6 minutes and 43 seconds, translating to over 37 hours of pharmacy labor for the reviewed sample and an estimated 496 hours when extrapolated to all 4,432 incidents from the fourth quarter of 2024. This reinforces the significant time investment required to ensure accurate documentation and regulatory compliance, particularly in the absence of automated reconciliation tools.
Tables 3A/B focuses on a more intensive review process involving 35 escalated cases that required formal case creation and software-based compliance review. Each case underwent a structured three-step process—pulling ADC data, reviewing documentation, and providing a recommendation—with an average total time of 11 minutes and 30 seconds per case. When extrapolated to the 170 cases reviewed during the study period, this equates to over 32 hours of pharmacy labor. These findings suggest that while escalated cases represent a smaller subset of total incidents, they demand a disproportionately higher time commitment due to their complexity and the need for multidisciplinary follow-up. It is important to note that the time analysis captured only the core review steps—data retrieval, documentation review, and recommendation. Additional time commitments, such as scheduling meetings, attending diversion response team discussions, and engaging with suspected team members, were not included in the measured workflow. These activities vary by hospital and pharmacy department, depending on internal protocols and the structure of diversion response procedures, and represent further unquantified demands on pharmacy resources.
Table 4A outlines the financial investment required to implement IV push waste receptacle systems across 15 hospital locations. A total of 787 units—503 Cactus Smart Sink® and 284 Pharma Lock® O.R. units—were deployed, resulting in an estimated capital list cost of $1.1 million. These systems require ongoing maintenance, primarily cartridge replacements every six months, contributing to an annual maintenance list cost of $322,500.
In addition to equipment costs, Table VB highlights the technician labor required to support these systems. Cartridge exchanges averaged 8.2 minutes per unit, totaling approximately 170 hours of technician time and $3,416 in annual labor costs. While battery-powered units were not included in this review, they represent an additional ad-hoc maintenance consideration. These findings underscore the importance of accounting for both capital and operational demands when evaluating the long-term sustainability of waste receptacle systems.
Together, these results underscore the multifaceted nature of pharmacy WTW in the context of controlled substance waste. They also highlight opportunities for targeted interventions, such as optimizing vial sizes, enhancing documentation systems, and leveraging automation to reduce manual workload. Importantly, the study provides a replicable framework for quantifying pharmacy labor costs associated with waste management, which can inform resource allocation and policy development across health systems. By including such a comprehensive cross-section of hospital units, the study provides a robust foundation for identifying system-wide opportunities to improve waste documentation, streamline pharmacy workflows, and reduce the risk of diversion.
Notably, while reviewing all incident-related transactions is more time-consuming than reviewing individual cases, this is expected. Diversion-focused software is designed to streamline the process by generating mostly accurate data and organizing it into manageable cases, making manual review by pharmacy personnel more efficient and targeted.
5. Conclusions
This multi-site observational study demonstrates that pharmacy workforce time waste (WTW) associated with intravenous push (IVP) controlled substance waste is both measurable and operationally significant. Across multiple review modalities—including automated transaction analysis, manual chart review, and software-based case evaluation—pharmacy personnel invested substantial time in documenting, verifying, and resolving waste-related incidents.
The average time per incident ranged from approximately 6 to 11 minutes, with extrapolated quarterly and annual burdens exceeding 496 and 1,984 hours for manual reviews and 32 and 130 hours for escalated case evaluations. Additionally, the study identified consistent patterns of partial dose waste—particularly for midazolam, hydromorphone, and morphine—highlighting opportunities for standardization in dosing or packaging. Beyond time spent on direct case review, further unmeasured labor is required for scheduling, multidisciplinary meetings, and diversion response team activities, which vary by institution. The study also quantified the financial and labor costs associated with waste receptacle systems, adding another layer to the hidden operational burden of IVP waste management.
These findings underscore the need for health systems to invest in waste reduction strategies, such as standardized dosing, matching product availability with practice, improved documentation workflows, and integrated analytics platforms. By quantifying both the direct and indirect labor costs of waste management, this study supports the case for pharmacy-led interventions that enhance compliance, reduce diversion risk, and improve overall operational efficiency.
Author Contributions
Conceptualization, John B. Hertig and Les Louden; methodology, John B. Hertig; software, Blake Shay; validation, John B. Hertig, Les Louden, and Blake Shay; formal analysis, Blake Shay; investigation, Armando Soto and Thi Doan; resources, Les Louden; data curation, Thi Doan and Zach Gross; writing—original draft preparation, John B. Hertig; writing—review and editing, Les Louden and Zach Gross; visualization, Blake Shay; supervision, John B. Hertig; project administration, Les Louden; funding acquisition, John B. Hertig. All authors have read and agreed to the published version of the manuscript.
Funding
This research was funded by Fresenius Kabi, USA under an investigator initiated grant program.
Institutional Review Board Statement
The study was conducted in accordance with the Declaration of Helsinki, and approved by the BayCare Health System Institutional Review Board (IRB FWA00008336).
Acknowledgments
During the preparation of this manuscript, the authors used Microsoft Copilot, an AI-powered language model, to support portions of the writing, editing, and formatting. This included assistance with summarizing content, refining language for clarity and conciseness, and aligning sections with journal formatting guidelines. The authors have reviewed and edited all AI-assisted content to ensure accuracy, integrity, and compliance with the study’s objectives. The authors take full responsibility for the content of this publication.
Conflicts of Interest
The authors declare no conflicts of interest.
Abbreviations
The following abbreviations are used in this manuscript:
| ADC | Automated Dispensing Cabinet |
| Cath Lab | Cardiac Catheterization Laboratory |
| DEA | Drug Enforcement Agency |
| DRT | Diversion Response Team |
| ED | Emergency Department |
| EHR | Electronic Health Record |
| ICU | Intensive Care Unit |
| IRB | Institutional Review Board |
| IV | Intravenous |
| IVP | Intravenous Push |
| MAR | Medication Administration Record |
| NICU | Neonatal Intensive Care Unit |
| OR | Operating Room |
| PACU | Post-Anesthesia Care Unit |
| PICU | Pediatric Intensive Care Unit |
| PW | Product Waste |
| WTW | Workforce Time Waste |
References
- Arora, P. , Muehrcke, M. & Hertig, J. A Cost-Effectiveness Study Comparing Ready-to-Administer and Traditional Vial-and-Syringe Method for Opioids. Pain Ther 2022, 11, 937–950. [Google Scholar] [CrossRef] [PubMed]
- Inciardi JA, Surratt HL, Lugo Y, Cicero TJ. The Diversion of Prescription Opioid Analgesics. Law Enforc Exec Forum. 2007, 7, 127–141. [Google Scholar] [PubMed] [PubMed Central]
- Barbariol F, Deana C, Lucchese F, Cataldi G, Bassi F, Bove T, Vetrugno L, De Monte A. Evaluation of Drug Wastage in the Operating Rooms and Intensive Care Units of a Regional Health Service. Anesth Analg. 2021, 132, 1450–1456. [Google Scholar] [CrossRef] [PubMed]
- Lahue BJ, Pyenson B, Iwasaki K, Blumen HE, Forray S, Rothschild JM. National burden of preventable adverse drug events associated with inpatient injectable medications: healthcare and medical professional liability costs. Am Health Drug Benefits. 2012, 5, 1–10. [Google Scholar]
- Taxis K, Barber N. Ethnographic study of incidence and severity of intravenous drug errors. BMJ. 2003, 326, 684. [Google Scholar] [CrossRef] [PubMed]
- Taxis K, Barber N. Incidence and severity of intravenous drug errors in a German hospital. Eur J Clin Pharmacol. 2004, 59, 815–817. [Google Scholar] [CrossRef] [PubMed]
- Parshuram CS, To T, Seto W, Trope A, Koren G, Laupacis A. Systematic evaluation of errors occurring during the preparation of intravenous medication. CMAJ. 2008, 178, 42–48. [Google Scholar] [CrossRef] [PubMed]
- Hertig, John et al. “A Continuous Observation Workflow Time Study to Assess Intravenous Push Waste.” Hospital pharmacy 2021, 56, 584–591. [CrossRef]
- Barbariol F, Deana C, Lucchese F, Cataldi G, Bassi F, Bove T, Vetrugno L, De Monte A. Evaluation of Drug Wastage in the Operating Rooms and Intensive Care Units of a Regional Health Service. Anesth Analg. 2021, 132, 1450–1456. [Google Scholar] [CrossRef] [PubMed]
- Hertig, J. B., Louden, L., Shay, B., Soto, A., Robbins, G., Kornilova , T.,; Arora, P. Assessing the Costs of Intravenous Push Waste in Intraoperative Areas Through Observation: A Multi-Site Study. Pain and Therapy 2024. [Google Scholar]
- “Diversion Quarterly Report Q2 2024”. Bluesight: ControlCheck. 2024. “2024 Diversion Trends Report: An Analysis of Drug Diversion Investigations and Events From 2022 Through 2023”. Bluesight: ControlCheck. 2024.
Figure 1.
Percentage of Transactions with Exactly Half Wasted.
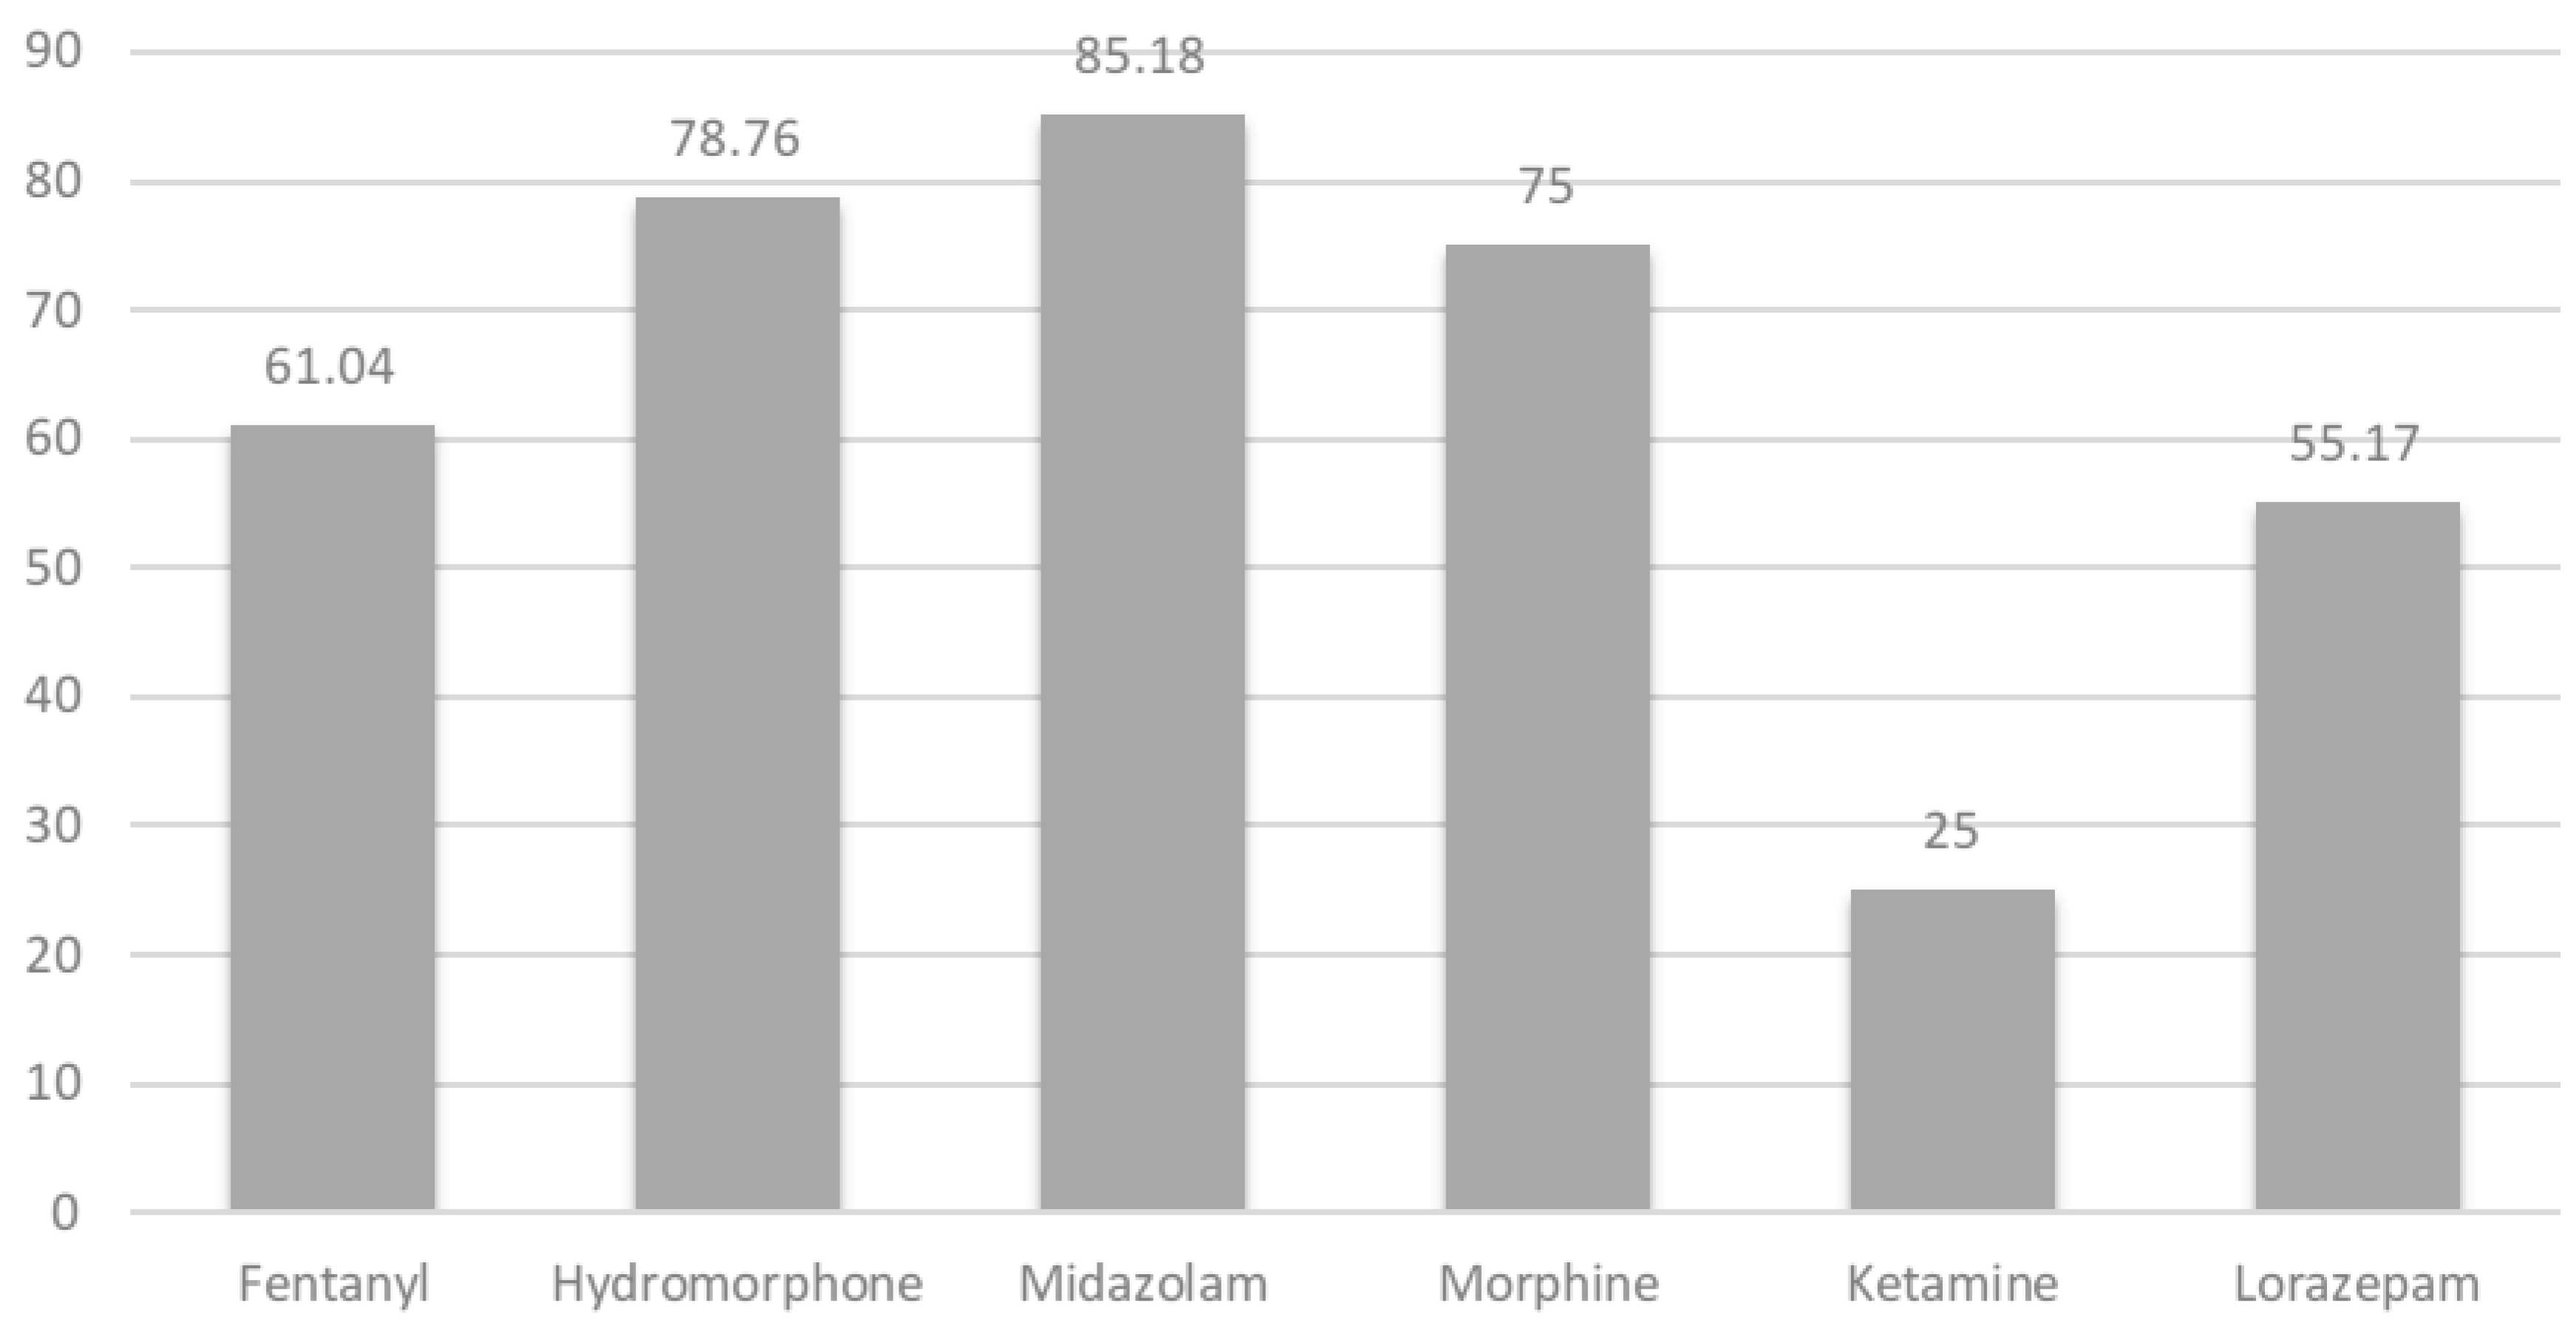
Table 4.
IV Push Waste Receptable Costs.
| Costs Related to Waste | Costs* |
| Set Up Cost for Med Station (Solid and Liquid) Cost for Anesthesia Stations (Liquid only) Every six months, per replacement (Solid or Liquid Cartridge) |
$1,750.00 $800.00 $125.00 |
*Costs are shown as list prices from 2022 for equipment not including any discounts.
Disclaimer/Publisher’s Note: The statements, opinions and data contained in all publications are solely those of the individual author(s) and contributor(s) and not of MDPI and/or the editor(s). MDPI and/or the editor(s) disclaim responsibility for any injury to people or property resulting from any ideas, methods, instructions or products referred to in the content. |
© 2025 by the authors. Licensee MDPI, Basel, Switzerland. This article is an open access article distributed under the terms and conditions of the Creative Commons Attribution (CC BY) license (http://creativecommons.org/licenses/by/4.0/).
Copyright: This open access article is published under a Creative Commons CC BY 4.0 license, which permit the free download, distribution, and reuse, provided that the author and preprint are cited in any reuse.


