
Submitted:
09 July 2025
Posted:
09 July 2025
You are already at the latest version
Abstract
The cellular slime mold Dictyostelium discoideum is a soil-dwelling eukaryotic organism that undergoes distinctive morphological changes during starvation, making it a promising candidate for bioassay development. In this study, we evaluated the impact of copper exposure on the morphological transformation of D. discoideum and performed a comparative proteomic analysis. Copper exposure on agar media delayed aggregate formation by 3.5 hours compared to controls. Using immobilized pH gradient two-dimensional gel electrophoresis followed by silver staining, approximately 280 protein spots were detected. Three spots were found to disappear upon copper exposure. Based on isoelectric point and molecular weight analyses, the proteins were predicted to be formin-1, cytoplasmic regulator of adenylyl cyclase (CRAC), and a tetratricopeptide repeat (TPR)-containing protein. Formin-1 and CRAC are known to be involved in aggregation processes. These findings suggest copper disrupts aggregation-related protein expression in D. discoideum and highlight the potential of D. discoideum-based bioassays using proteomic biomarkers for environmental monitoring.
Keywords:
Dictyostelium discoideum
; copper toxicity
; proteomics
; bioassay
; heavy metal contamination
; aggregation delay
1. Introduction
Environmental contamination by heavy metals and organic pollutants remains a significant global issue, threatening both ecosystems and human health [1,2]. Bioassays utilizing living organisms provide a direct and sensitive method to assess environmental toxicity. Traditional bioassays often rely on endpoints such as mortality rates or growth inhibition, requiring prolonged observation and often lacking mechanistic insights into toxicity [3,4].
Recently, there has been increasing interest in understanding how pollutants impact specific cellular signaling pathways and stress responses [5]. Dictyostelium discoideum, a eukaryotic microorganism inhabiting forest soils, exhibits a unique life cycle transitioning from unicellular amoebae to multicellular structures under starvation conditions. This morphological transformation is rapid, highly regulated, and sensitive to environmental stressors, making D. discoideum a valuable model for investigating cellular responses to toxic substances [6].
Previous studies have indicated that D. discoideum is sensitive to heavy metals such as mercury and copper [7,8,9]. However, most assays have employed liquid cultures, which differ substantially from the organism’s natural soil environment. Here, we employed solid agar-based cultures supplemented with copper to closely mimic natural conditions. We aimed to establish a rapid and sensitive bioassay based on aggregation delay and to identify proteomic biomarkers associated with copper-induced toxicity.
2. Materials and Methods
2.1. Chemicals
All chemicals, including copper standard solution (1000 ppm), Mycological Peptone, Yeast Extract, and reagents for electrophoresis, were purchased from recognized suppliers (Wako, Kanto Chemicals, Becton, Dickinson and Company, nacalai tesque, GE Healthcare).
2.2. Strain and Culture Conditions
The seed stock was provided from the Science & Education Center, Ochanomizu University. The AX-2 strain of D. discoideum was cultured axenically in AX-2 medium. D. discoideum was statically cultured in 4 mL of AX-2 medium at 22°C under sterile conditions until the density of the cellular slime mold reached 1-2 × 10⁷ cells/mL. A suspension of D. discoideum was added to a petri dish containing 4 mL of X-2 medium, and the cell density was adjusted to 1-4 × 10⁴ cells/mL, followed by static culture at 22°C.
2.3. Aggregation Assay
The cells were collected from the bottom of the dish in AX-2 medium, by pipetting with 2 mL of Bonner's salt solution. The bacterial solution in the dish was transferred to a tube, stirred for 5 seconds on a vortex mixer, and centrifuged at 627 × g for 1 minute. The supernatant was discarded, and 2 mL of Bonner's salt solution was added, stirred for 5 seconds on a vortex mixer, and centrifuged at 627 × g. This washing procedure was repeated three times. After washing, the cell density was measured using a hemocytometer (Life Technologies Corporation, CA, USA) under an upright optical microscope (Shimadzu Corporation, Kyoto, Japan), and the cell density was adjusted to 3.2 × 10⁷ cells/mL by adding Bonner's salt solution. D. discoideum (6.4 × 10⁷ cells) were seeded on a non-nutrient agar medium (1.5% (w/v) Agarose) and cultured at 22°C under light irradiation. The number of aggregates in an area of 1.4 × 1.0 mm2 was recorded and observed under a microscope every 30 minutes for 24 hours using image analysis software Motic Images Plus 2.1S (Shimadzu Corporation, Kyoto, Japan). The effect of copper exposure was examined by seeding D. discoideum on copper-added agar medium (1 ppm (w/v) Cu, 1.5% (w/v) agarose) and performing the same procedure as for the non-nutrient agar medium.
2.4. Protein Extraction and Quantification
The protein concentration of the analytical samples was measured by measuring the absorbance using Qubit® Protein Assay Kits and a QubitⓇ Fluorometer (Life Technologies Corporation, CA, USA) according to the Qubit® Protein Assay Kits (Life Technologies Corporation, CA, USA). The protein concentration of the analytical samples was calculated from the measured absorbance.
Cells at the aggregation stage (10.5 hours post-seeding) were harvested. Proteins were extracted using trichloroacetic acid precipitation, solubilized in a buffer containing urea, thiourea, CHAPS (3-[(3-Cholamidopropyl)dimethylammonio]-1-propanesulfonate), and Triton X-100, and quantified using the Qubit Protein Assay Kit.
2.5. Two-Dimensional Gel Electrophoresis (2-DE)
In this study, immobilized pH gradient isoelectric focusing was used. Immobilized pH gradient isoelectric focusing was performed based on the IPG (immobilized pH gradient strip dry gel) isoelectric focusing method from Nihon Eido Co., Ltd. (Tokyo, Japan). 50 μg of protein from the analysis sample and swelling solution (8 M urea, 4% (w/v) CHAPS, 65 mM DTT (dithiothreitol), 0.5% (w/v) Ampholines pH 3.5-10, 0.001% (w/v) BPB (bromophenol blue) were added to IPG gel (pH 3-10 liner, 7 cm, GE Healthcare, Bucks, UK), and allowed to swell for 16-18 hours at 23°C, after which isoelectric focusing was performed. The electrophoretic conditions were 200 V for 10 min, 400 V for 10 min, 1000 V for 1 h, and 1500 V for 18-22 h. After isoelectric focusing, the gel was shaken for 10 min in 4 mL of SDS-PAGE (sodium dodecyl sulfate-polyacrylamide gel electrophoresis) equilibration buffer (0.0625 M Tris-HCl pH 6.8, 25% (w/v) glycerol, 2% (w/v) SDS, 0.01% (w/v) BPB, 5% (v/v) 2-mercaptoethanol). SDS-PAGE was carried out according to the method of Laemmli [10] using a separating gel of 10% (w/v) polyacrylamide containing 0.1% (w/v) SDS. The acrylamide gel used for the second dimension SDS-PAGE had a gel size of 8.5 cm × 8.5 cm × 0.1 cm, and consisted of a stacking gel of 1 cm and a separating gel of 7.5 cm. The equilibrated gel was placed on top of the prepared acrylamide gel. After the IPG gel was fixed onto the second-dimension SDS-PAGE gel with 1.5% (w/v) agarose-containing SDS-PAGE equilibration buffer, the gel was electrophoresed up to 1 cm from the anode end of the gel at a constant current of 11 mA/cm2 in the stacking gel and 17 mA/cm2 in the separating gel.
After electrophoresis, the gel was shaken in 50% (v/v) methanol 5% (v/v) acetic acid for 14-18 hours and then in 50% (v/v) methanol for 30 minutes to fix the proteins, followed by silver staining (Wako, Osaka, Japan).
2.6. Image and Data Analysis
The silver-stained gel was scanned using a scanner (GT-X900, EPSON, Tokyo, Japan) and EPSON Scan ver. 3.01, and the behavior of the proteins displayed on the gel was analyzed by the differential display method. The differential display method is a method for comparatively analyzing the difference in the expression level of RNA or protein between different samples using PCR and electrophoresis. The colors of the spots in the obtained electropherograms of copper-exposed and unexposed samples were replaced with red and green, respectively, using ImageJ ver. 1.43, and the expression of the spots in copper-exposed and unexposed samples was compared by overlaying them. Based on the isoelectric point and molecular weight of the proteins whose expression was lost by copper exposure obtained by the analysis, proteins predicted to be expressed were examined using TagIdent. The search conditions were the error tolerance of isoelectric point ±0.1, the error tolerance of molecular weight ±5%, and the organism species was limited to D. discoideum.
3. Results
3.1. Morphological Observations
Figure 1 shows the morphological changes of D. discoideum on non-nutrient agar at different time points after seeding. On non-nutrient agar, D. discoideum formed aggregates by 10.5 hours after seeding. Figure 2 shows the morphological changes of D. discoideum on copper-supplemented agar. Cells on copper-supplemented agar formed aggregates only after 14 hours, indicating a 3.5-hour delay. The number of aggregates significantly decreased under copper exposure at 14 and 24 hours (p < 0.05).
Figure 3 shows the time-course of aggregate number changes on control and copper-exposed agar. Aggregates were detected 10.5 h after starvation in unexposed cells and 14 h after copper exposure. Copper exposure delayed aggregate formation by 3.5 h and reduced the number of aggregates. Figure 4 shows the comparison of aggregate numbers at 14 and 24 hours with and without copper exposure. A significant reduction in D. discoideum aggregates was observed between copper-exposed and unexposed plants at both 14 and 24 hours after inoculation.
3.2. Proteomic Analysis
Figure 5A and B show the representative silver-stained gel images of D. discoideum proteins. The samples were treated with trichloroacetic acid (TCA), extracted with a protein solubilizing solution containing urea, and separated by immobilized pH gradient two-dimensional electrophoresis combining isoelectric focusing electrophoresis (IEF) and SDS-PAGE, and then silver stained. Approximately 280 protein spots were detected in both control and copper-exposed samples.
Figure 5C shows the differential display analysis highlighting protein spots affected by copper exposure. Figure 5D to I shows the enlargement of spots a, b, and c disappearing under copper exposure. The spots in the electrophoretic diagram obtained from D. discoideum were colored green for those exposed to copper and red for those not exposed, and the spots were overlaid to compare the expression levels. Three spots (designated spot a, b, and c) were missing under copper exposure. Based on database searches, spot a corresponded to formin-1, spot b to CRAC, and spot c to a TPR-containing protein (Table 1).
4. Discussion
Copper exposure delayed aggregation and reduced the number of aggregates formed by Dictyostelium discoideum. This suggests that copper toxicity interferes with the normal developmental program of D. discoideum, specifically the transition from unicellular amoebae to multicellular aggregates. Similar inhibitory effects of copper on developmental processes have been observed in other model organisms, including Arabidopsis thaliana and Caenorhabditis elegans, highlighting the conserved nature of metal-induced developmental disruption across species [11,12]. These findings support the potential utility of D. discoideum as a sensitive bioindicator organism.
Our proteomic analysis revealed that the expression of three protein spots disappeared under copper exposure. Based on isoelectric point and molecular weight analysis, the proteins were predicted to be formin-1, CRAC (cytoplasmic regulator of adenylyl cyclase), and a TPR-containing protein. Both formin-1 and CRAC are known to be essential for the aggregation process in D. discoideum, pointing to mechanistic disruption of actin cytoskeleton organization and cAMP-mediated chemotaxis. Formin-1 is involved in the nucleation and elongation of actin filaments, which are crucial for pseudopodia formation and directional cell movement [13]. Previous studies have demonstrated that formin knockout strains of D. discoideum exhibit severely impaired aggregation and chemotactic responses [14], reinforcing our interpretation.
CRAC is critical in the relay of cAMP signals, enabling coordinated cell aggregation during starvation. Inhibition or downregulation of CRAC has been shown to result in defective cAMP wave propagation and failure of aggregation center formation [15]. Thus, the disappearance of CRAC under copper stress suggests a direct impairment of signal transduction necessary for aggregation, further explaining the 3.5-hour delay observed in our morphological assays.
The loss of a TPR-containing protein also implies broader disruption in protein complex formation or intracellular transport. TPR domains mediate protein-protein interactions involved in signal transduction, transcriptional regulation, and chaperone function [16]. Though the specific role of the identified TPR-containing protein in D. discoideum is not fully elucidated, similar proteins have been implicated in stress response pathways in mammals [17], suggesting that copper may interfere with cellular stress responses as well.
It should be noted that our identification was based on bioinformatic predictions, and the definitive identification of the affected proteins remains a limitation. Therefore, future work should involve LC-MS/MS analysis to conclusively identify these proteins and to further clarify the molecular pathways disrupted by copper exposure.
Our results demonstrate that copper-induced proteomic changes correlate with measurable developmental phenotypes in D. discoideum. Given the organism's short developmental cycle, genetic tractability, and conservation of key eukaryotic signaling pathways, these findings strengthen the argument for its use in environmental toxicology, particularly in proteomics-based bioassays. Previous research has proposed D. discoideum as a model for neurotoxicity, oxidative stress, and heavy metal responses [18,19]. Our study adds proteomic evidence to this body of work, highlighting the utility of two-dimensional electrophoresis in detecting environmentally responsive protein biomarkers.
5. Conclusions
Our study demonstrates that D. discoideum aggregation is a sensitive indicator of copper toxicity and that proteomic profiling can identify key affected proteins. This approach may serve as a basis for developing rapid and mechanistic environmental bioassays.
Author Contributions
Conceptualization, A.I. and R.S.; methodology, A.I. and K. K. and R.S. ; validation, A.I. and K. K.; formal analysis, A.I. and K.K.; investigation, K.K.; resources, R.S. and A.I.; writing—original draft preparation, K. K. and R.S.; writing—review and editing, K.K. and R. S. and A. I.; project administration, A.I. and R.S. All authors have read and agreed to the published version of the manuscript.
Funding
This research received no external funding.
Data Availability Statement
The data presented in this study are available on request from the corresponding author.
Acknowledgments
We sincerely thank Dr. Yasutaka Kakiuchi of the Science and Education Center, Ochanomizu University, for providing the D. discoideum strains and valuable advice.
Conflicts of Interest
The authors declare no conflicts of interest.
Abbreviations
The following abbreviations are used in this manuscript:
| SDS-PAGE | Sodium Dodecyl Sulfate Polyacrylamide Gel Electrophoresis |
References
- Focazio, M. J.; Kolpin, D. W.; Barnes, K. K.; Furlong, E. T.; Meyer, M. T.; Zaugg S., D.; Barber, L. B.; Thurman, M. E. A national reconnaissance for pharmaceuticals and other organic wastewater contaminants in the United States—II) Untreated drinking water sources. Sci Total Environ. 2008, 402, 01–216. [Google Scholar] [CrossRef] [PubMed]
- Kolpin, D. W.; Furlong, E. T.; Meyer, M. T.; Thurman, E. M.; Zaugg, S. D.; Barber, L. B.; Buxton, H. T. Pharmaceuticals, hormones, and other organic wastewater contaminants in U.S. streams, 1999–2000: A national reconnaissance. Environ. Sci. Technol. 2002, 36, 1202–1211. [Google Scholar] [CrossRef] [PubMed]
- Adak, T.; Govindharaj, G.; Panneerselvam, P.; Gadratagi B., G.; Kumar, U. Imidacloprid application changes microbial dynamics and enzyme activities in tropical rice soil. Ecotoxicol. Environ. Saf. 2017, 144, 123–130. [Google Scholar] [CrossRef]
- Wang, X.; Chai, J.; Liu, W.; Zhu, X.; Liu, H. : Wei, X. Biochar, soil and land-use interactions that reduce nitrate leaching and nitrous oxide emissions: A meta-analysis. Sci. Total Environ. 2018, 626, 20–30. [Google Scholar] [CrossRef]
- Hajam A., H.; Ali, M. S.; Singh, S. K.; Bashri, G. Understanding cytokinin: Biosynthesis, signal transduction, growth regulation, and phytohormonal crosstalk under heavy metal stress. Environ. Exp. Bot. 2024, 228, 106025. [Google Scholar] [CrossRef]
- Liu, Y.; Wang, Y.; Zhang, H. Waterborne polyurethane composites with antibacterial activity by incorporating p-BzOH intercalated MgAl-LDH. Compos. Commun. 2019, 13, 1–5. [Google Scholar] [CrossRef]
- Francesco, D.; Henrik, J.; Mauro, R.; Gabriella, P.; Elena, B.; Giovanni, P.; Aldo, V. Cellular responses to environmental contaminants in amoebic cells of the slime mould Dictyostelium discoideum. Biochem. Physiol. C Toxico. Pharmacol. 2005, 143, 150–157. [Google Scholar] [CrossRef]
- Francesco, M.; Lara, B.; Elia, R.; Maria, C.; Valeria, M.; Francesco, D.; Aldo, V. Effects of mercury on Dictyostelium discoideum : Proteomics reveals the molecular mechanisms of physiological adaptation and toxicity. J. Proteome Res. 2010, 9, 2839–2854. [Google Scholar] [CrossRef]
- Sforzini, S.; Dagnino, A.; Torrielli, S.; Dondero, F.; Fenoglio, S.; Negri, A.; Boatti, L.; Viarengo, A. Use of highly sensitive sublethal stress responses in the social amoeba Dictyostelium discoideum for an assessment of freshwater quality. Sci. Total Environ. 2008, 395, 101–108. [Google Scholar] [CrossRef] [PubMed]
- Laemmli U., K. Cleavage of structural proteins during assembly of the head of bacteriophage T4. Nature 1970, 227, 680–685. [Google Scholar] [CrossRef] [PubMed]
- Ali, H.; Khan, E.; Sajad, M. A. Phytoremediation of heavy metals—Concepts and applications. Chemosphere 2013, 91, 869–881. [Google Scholar] [CrossRef] [PubMed]
- Leung, M. C.; Williams, P. L.; Benedetto, A.; Au, C.; Helmcke, K. J.; Aschner, M.; Meyer, J. N. Caenorhabditis elegans: An emerging model in biomedical and environmental toxicology. Toxicol. Sci. 2008, 106, 5–28. [Google Scholar] [CrossRef] [PubMed]
- Faix, J.; Grosse, R. Staying in shape with formins. Developmental Cell 2006, 10, 693–706. [Google Scholar] [CrossRef] [PubMed]
- Junemann, A.; Winterhoff, M.; Nordholz, B.; Rottner, K.; Eichinger, L.; Gräf, R.; Faix, J. ForC lacks canonical formin activity but bundles actin filaments and is required for multicellular development of Dictyostelium cells. Euro. J. Cell Biol. 2013, 92, 201–212. [Google Scholar] [CrossRef] [PubMed]
- Insall, R. H.; Borleis, J.; Devreotes, P. N. The aimless RasGEF is required for processing of chemotactic signals through G-protein-coupled receptors in Dictyostelium. Current Biol. 1996, 6, 719–729. [Google Scholar] [CrossRef] [PubMed]
- D’Andrea, L. D.; Regan, L. TPR proteins: The versatile helix. Trends in Biochemical Sciences 2003, 28, 655–662. [Google Scholar] [CrossRef] [PubMed]
- Bouron, A.; Kiselyov, K.; Oberwinkler, J. Permeation, regulation and control of expression of TRP channels by trace metal ions. Pflugers Arch. – Eur. J. Physiol. 2015, 467, 1146–1164. [Google Scholar] [CrossRef] [PubMed]
- Williams, R. S.; Boeckeler, K.; Graf, R.; Muller-Taubenberger, A.; Li, Z.; Ismailoglu, I.; Gourley, C. Dictyostelium discoideum as a model for the study of neurodegenerative diseases. Seminars in Cell & Dev. Biol. 2006, 17, 512–524. [Google Scholar] [CrossRef]
- Zhu, J.; Fu, X.; Lin, H.; Chen, L.; Jin, Y. Proteomic analysis of copper stress response in rice seedlings. Environ. Sci. Pollution Res. 2019, 26, 20524–20533. [Google Scholar] [CrossRef]
Figure 1.
Morphological changes of D. discoideum on non-nutrient agar at different time points after seeding. A: Immediately after inoculation, B: 5 hours after inoculation, C: 10.5 hours after inoculation, D: 14 hours after inoculation. The arrows indicate D. discoideum aggregates, which have a round outline. No aggregates were observed 5 hours after inoculation, but aggregate formation was detected 10.5 hours after inoculation. The number of aggregates increased 14 hours after inoculation. Scale bars represent 0.5 mm.
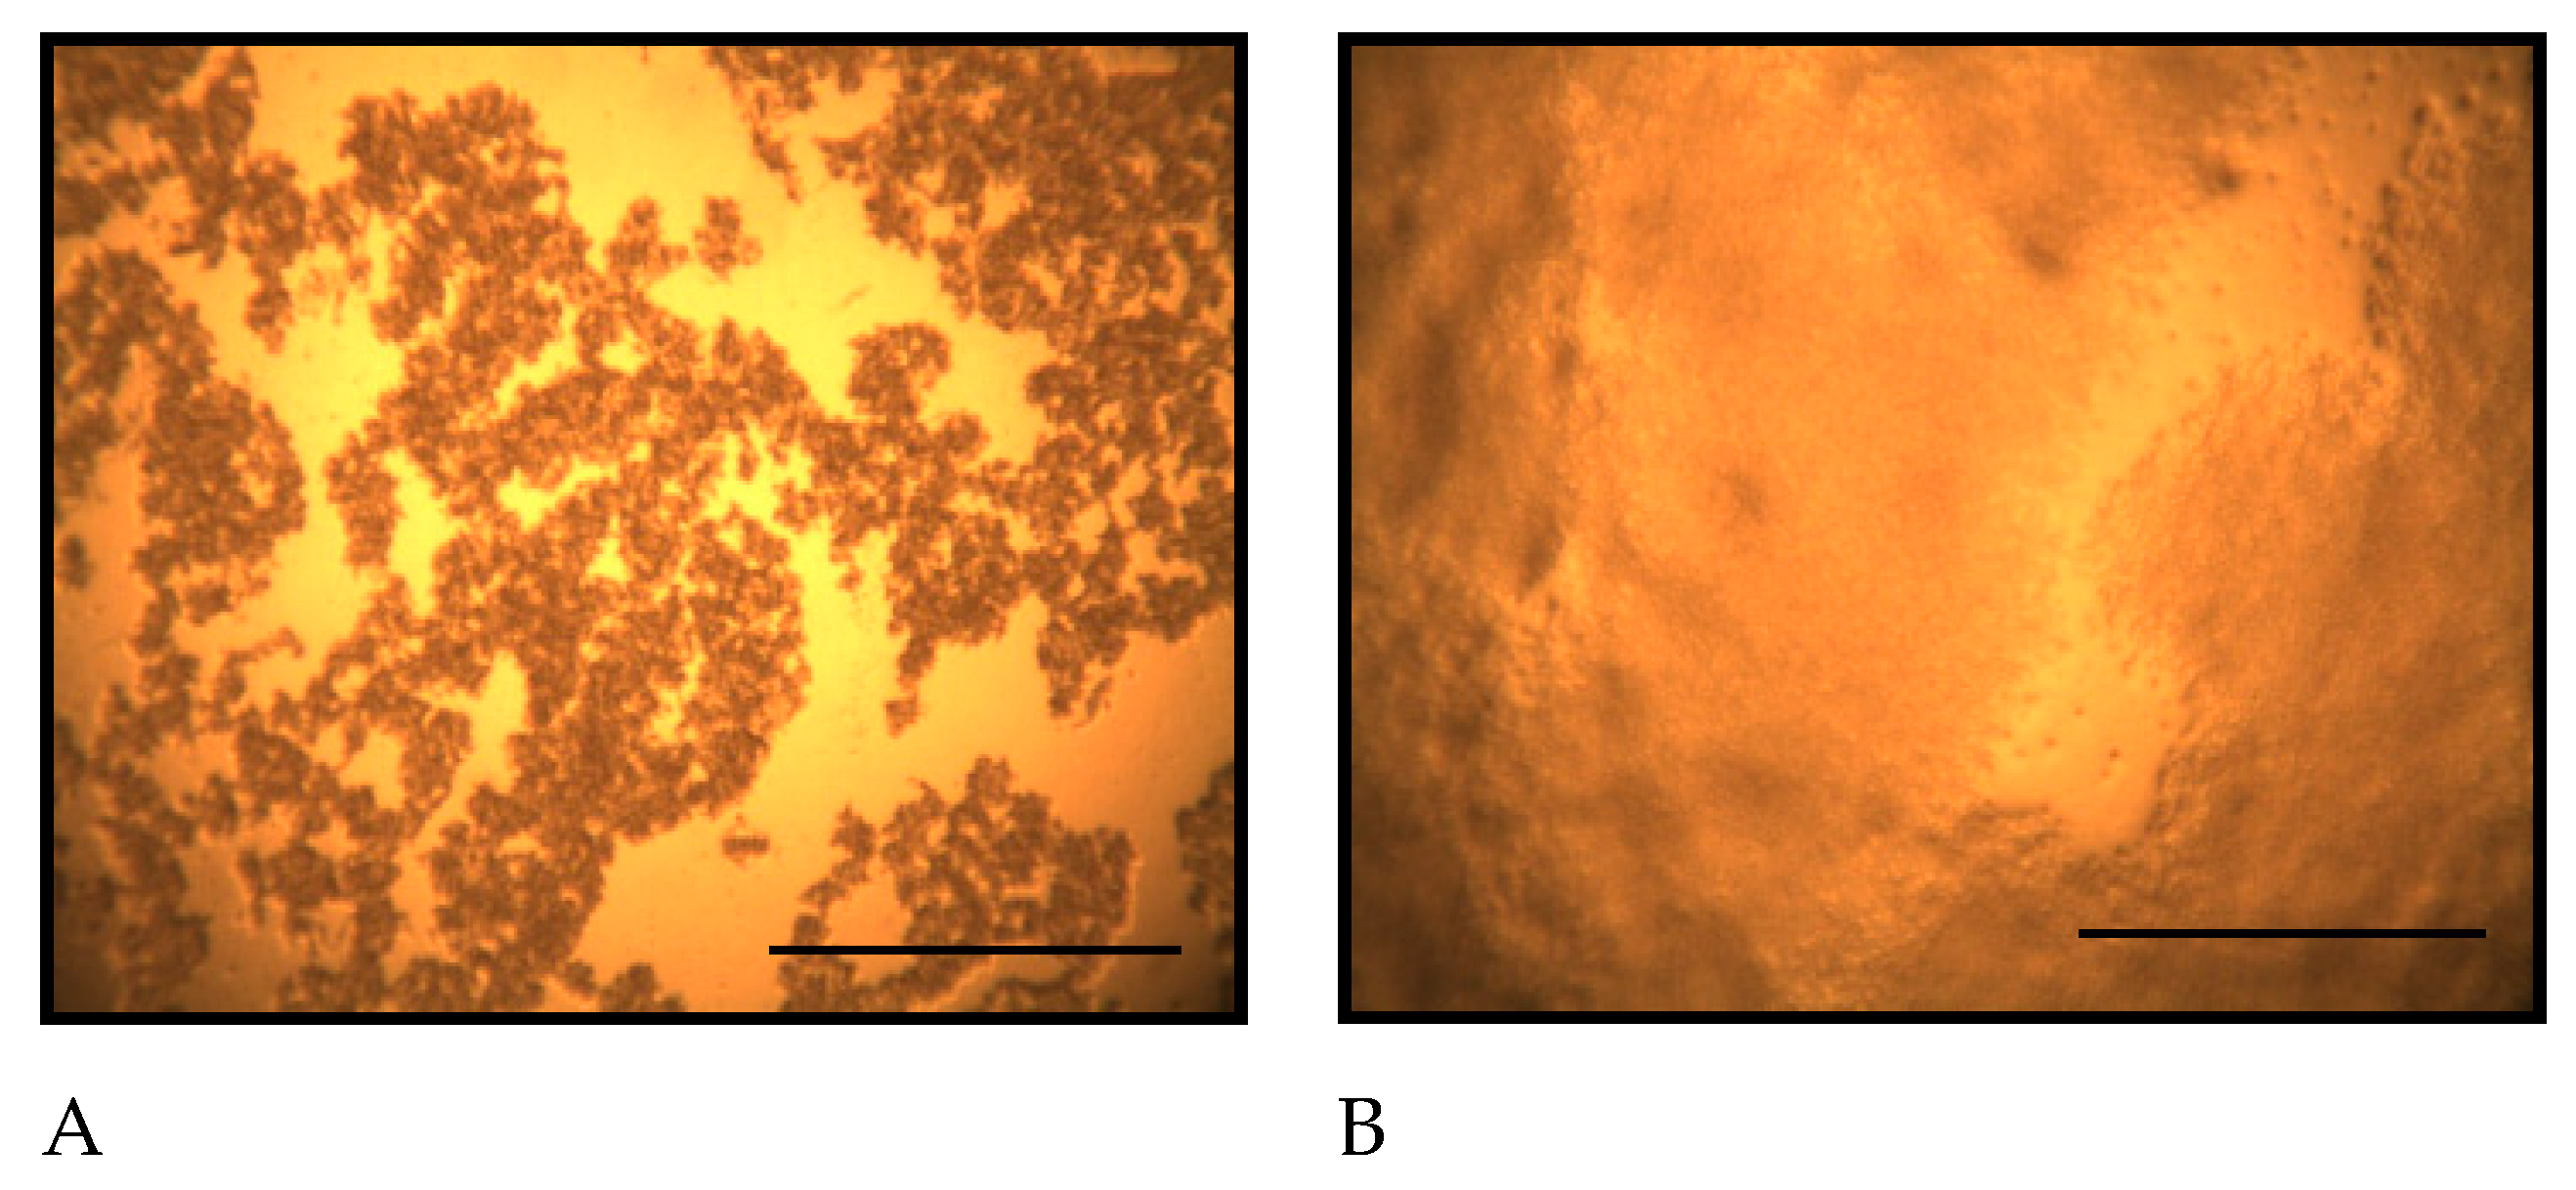
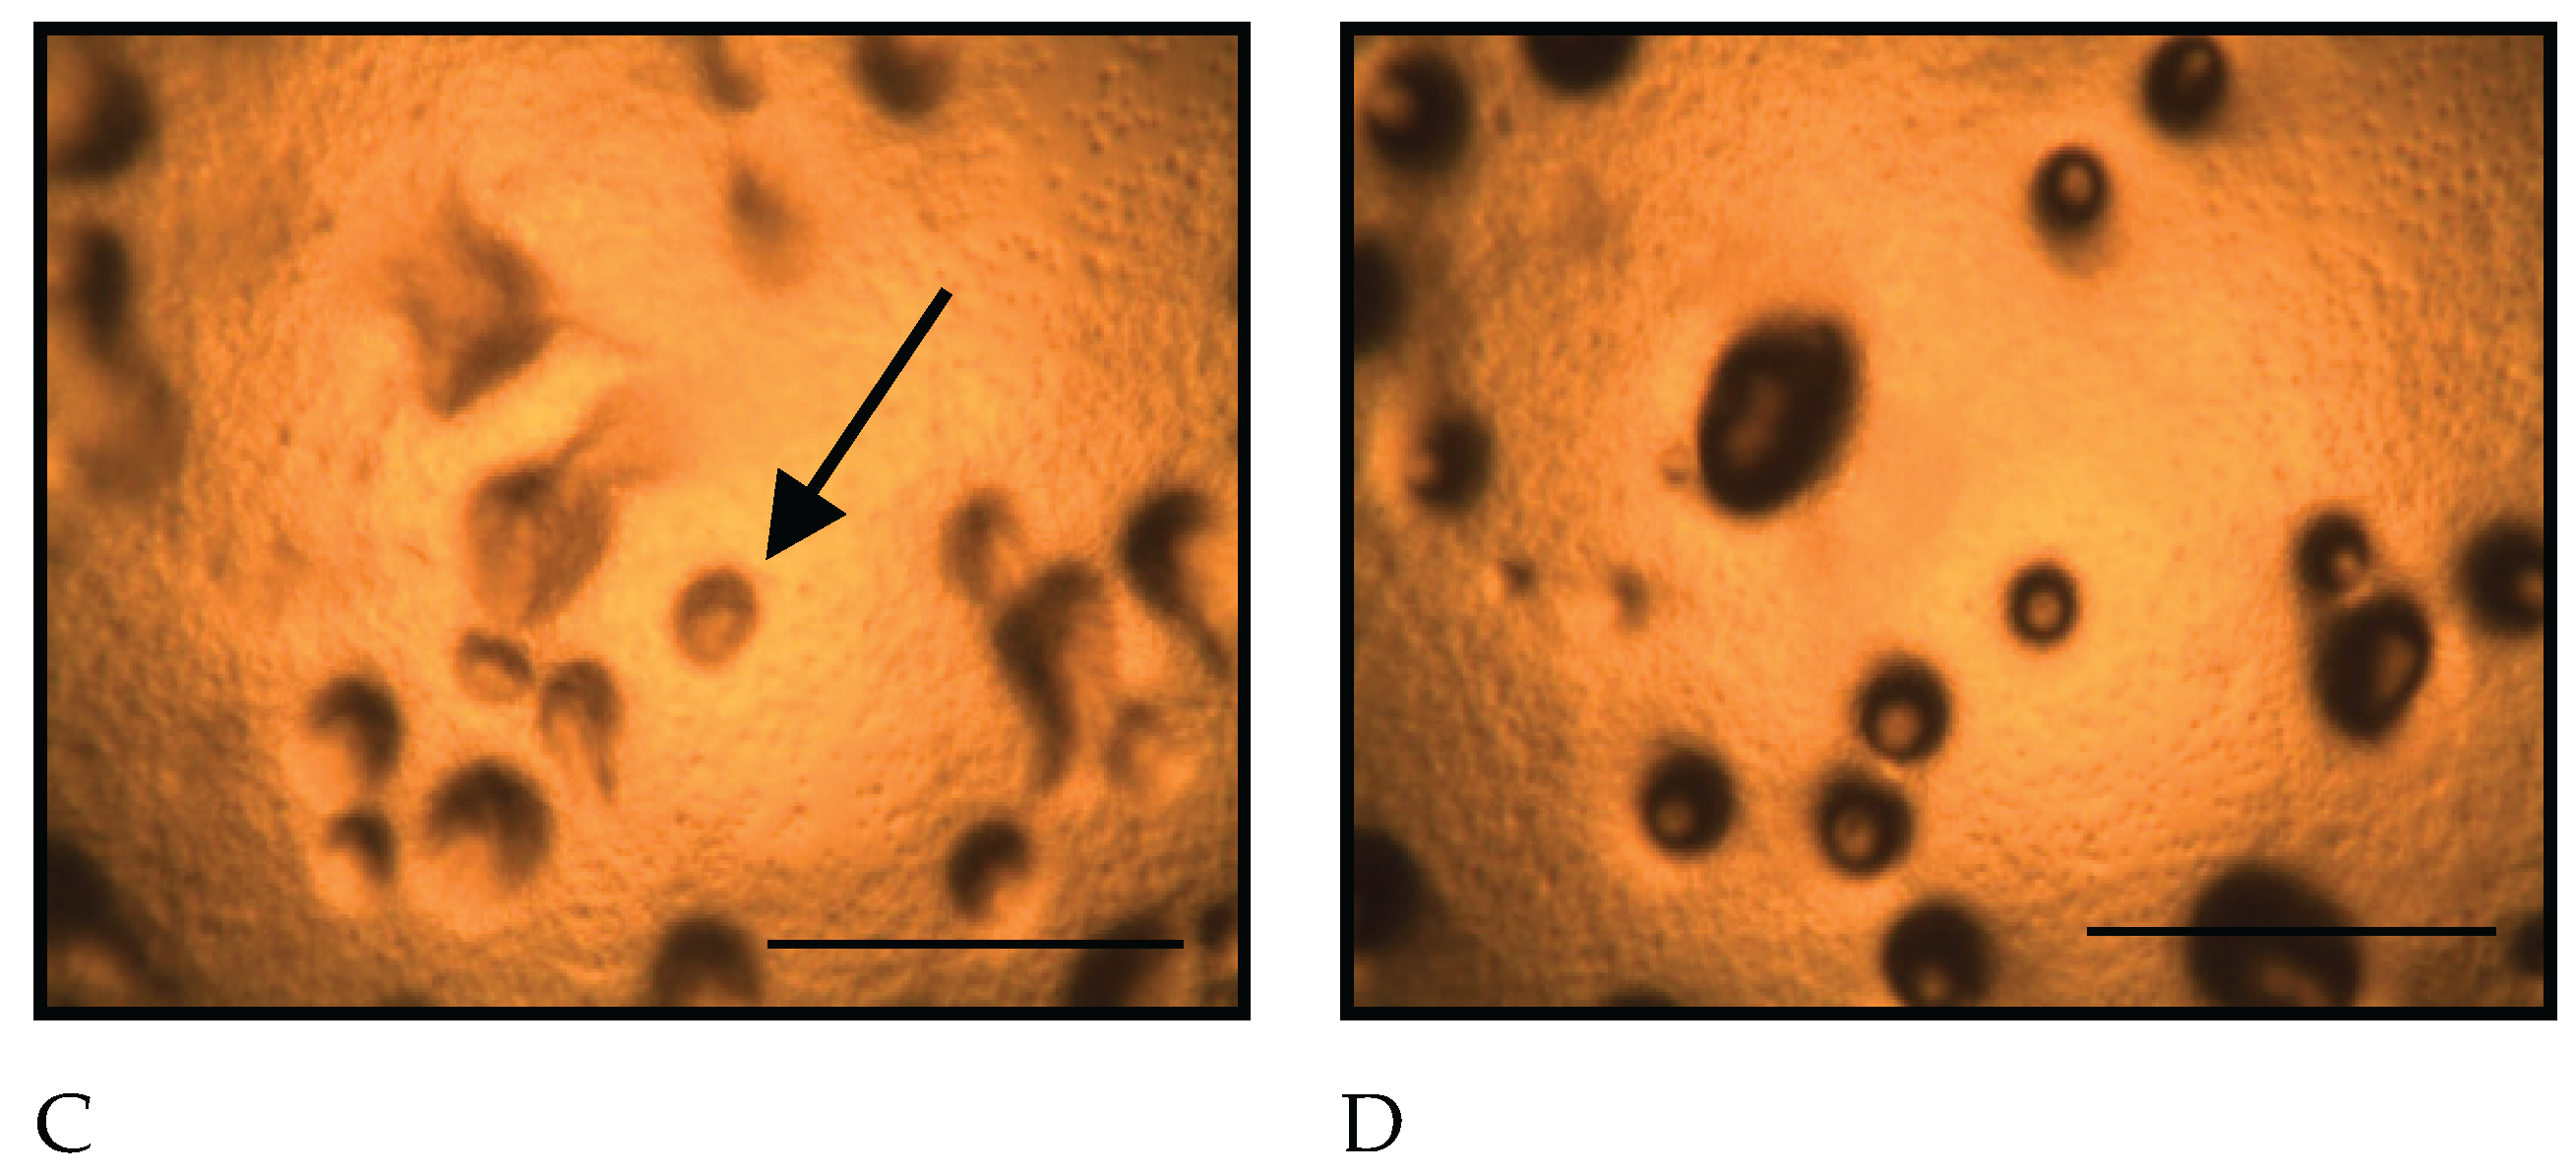
Figure 2.
Morphological changes of D. discoideum on copper-supplemented agar. A: Immediately after inoculation, B: 5 hours after inoculation, C: 10.5 hours after inoculation, D: 14 hours after inoculation. No aggregate formation of D. discoideum was confirmed 5 and 10.5 hours after inoculation, but aggregates were detected 14 hours later. Scale bars represent 0.5 mm.
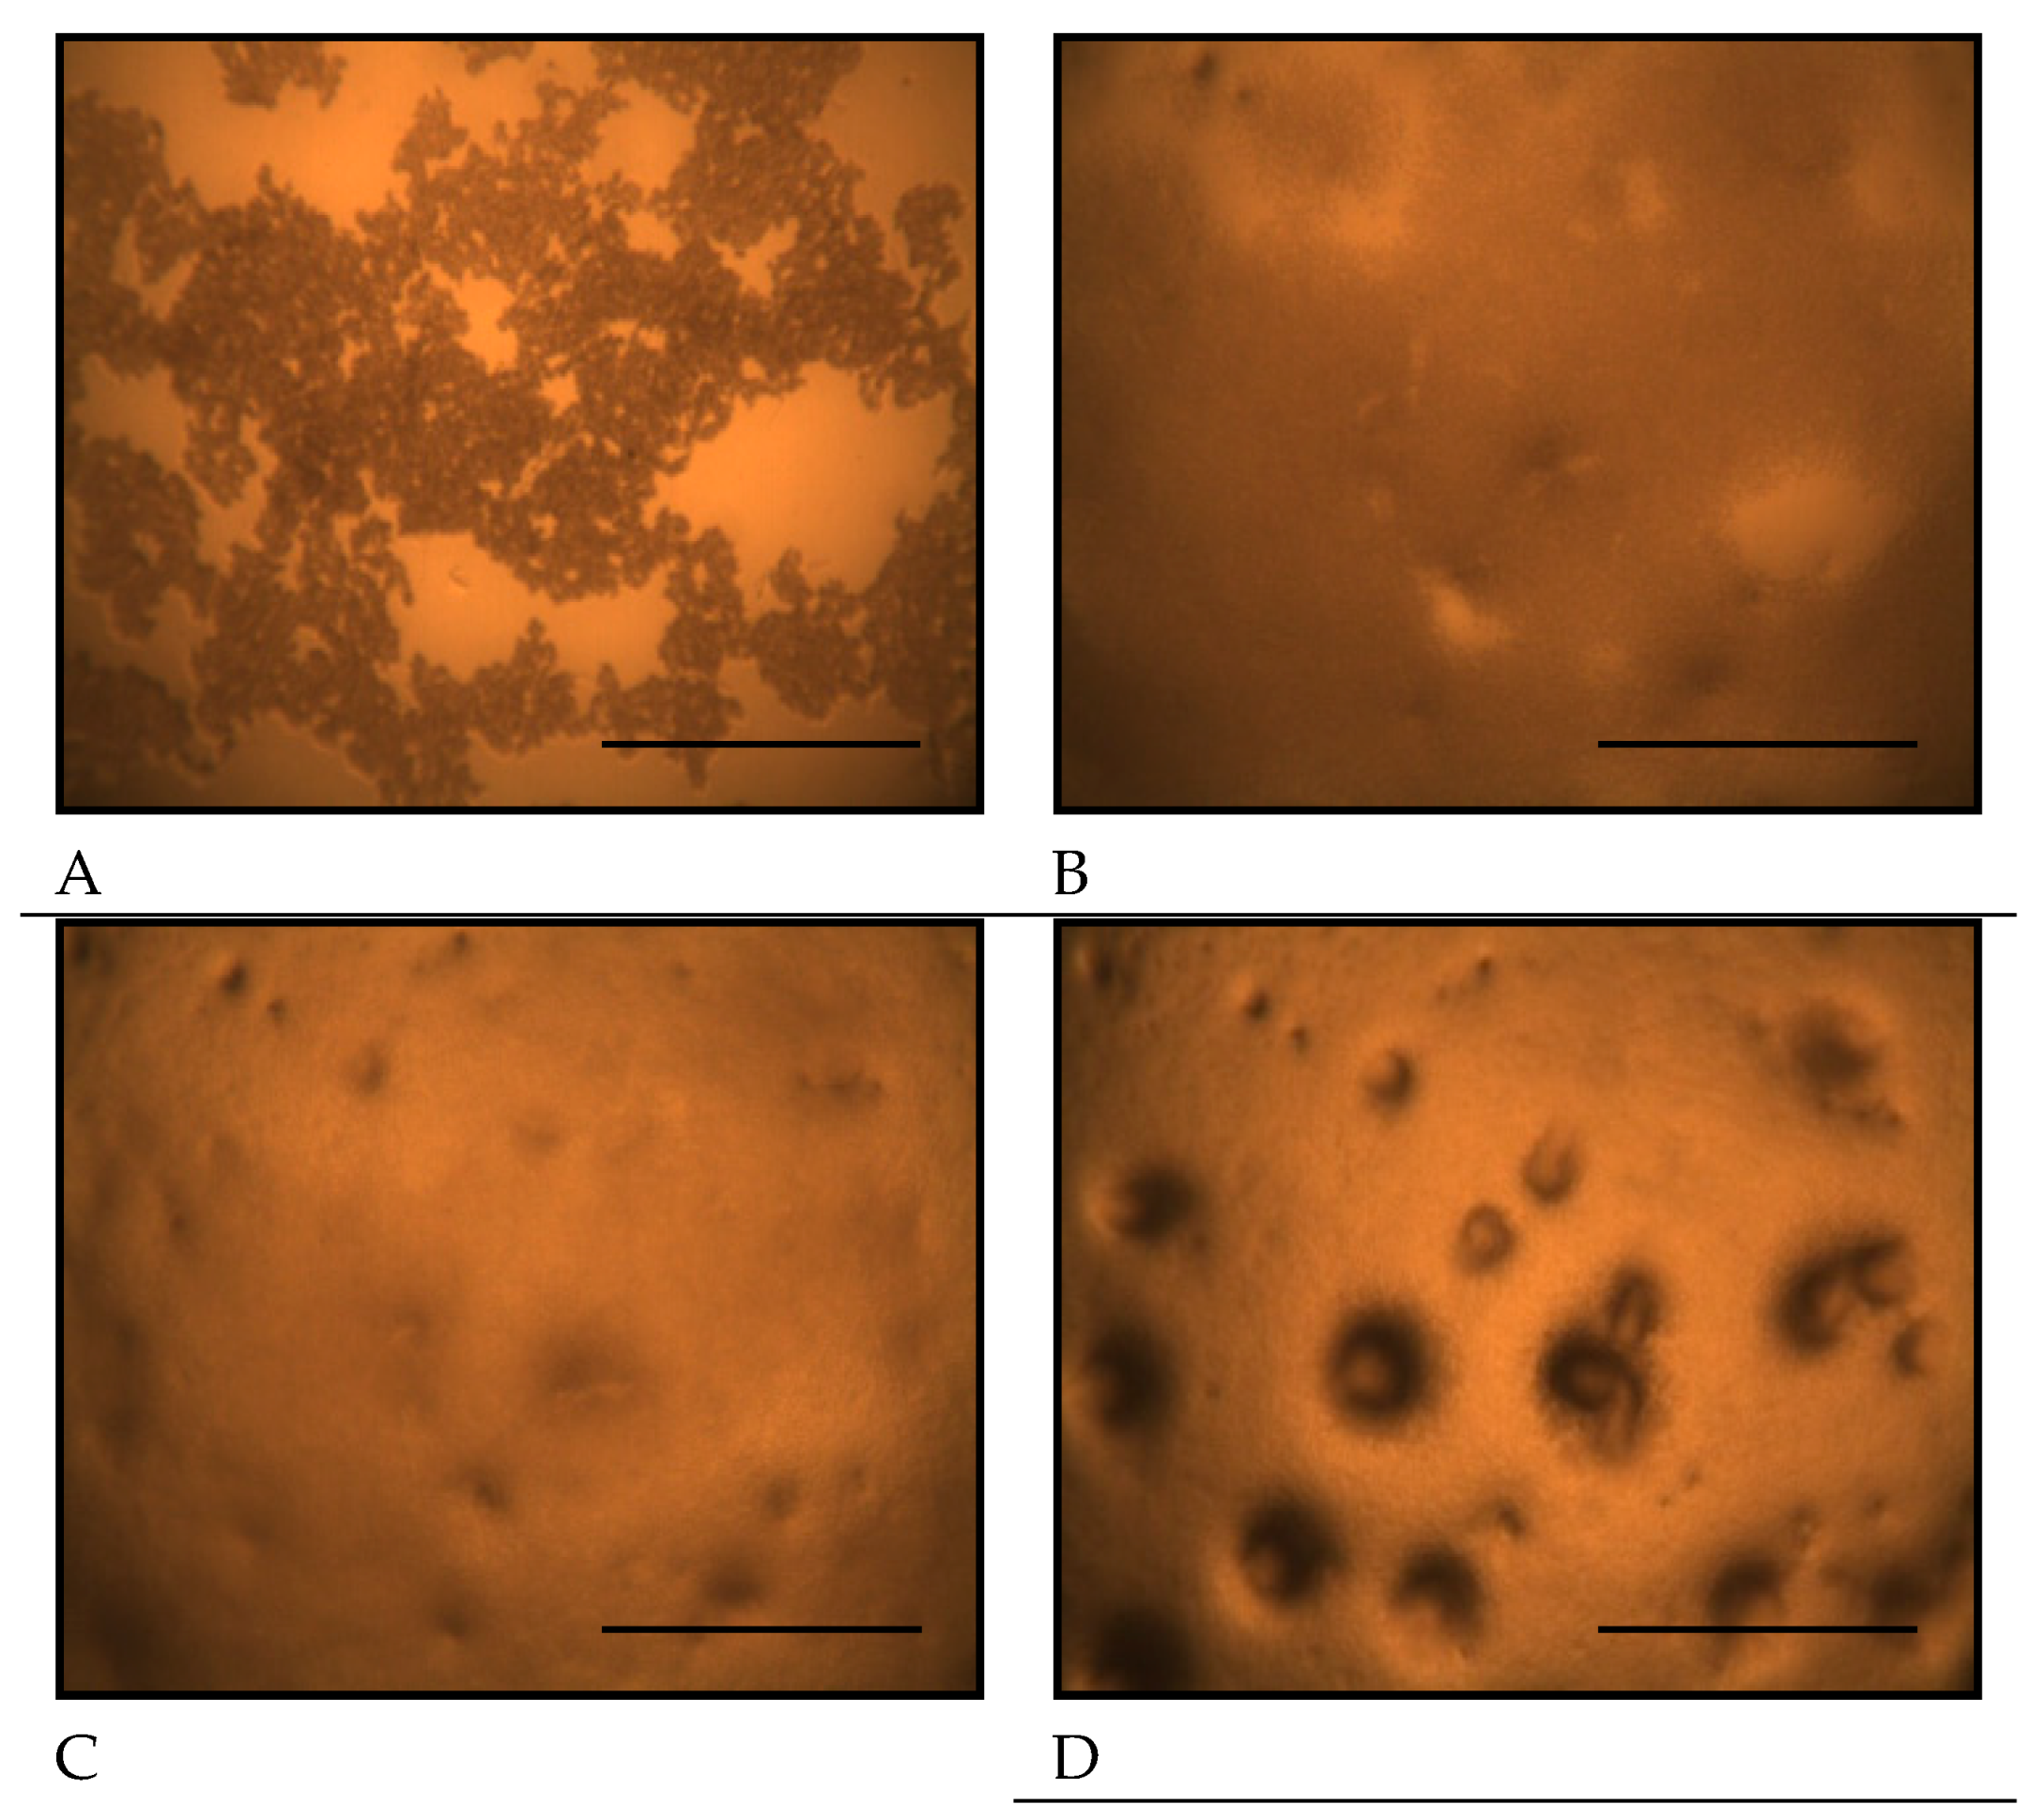
Figure 3.
Time-course of aggregate number changes on control and copper-exposed agar. Error bars indicate standard deviation. Squares and diamonds indicate the aggregates number in the condition of control and copper-exposure, respectively. Aggregates were detected 10.5 h after starvation in unexposed cells and 14 h after copper exposure. Copper exposure delayed aggregate formation by 3.5 h and reduced the number of aggregates.
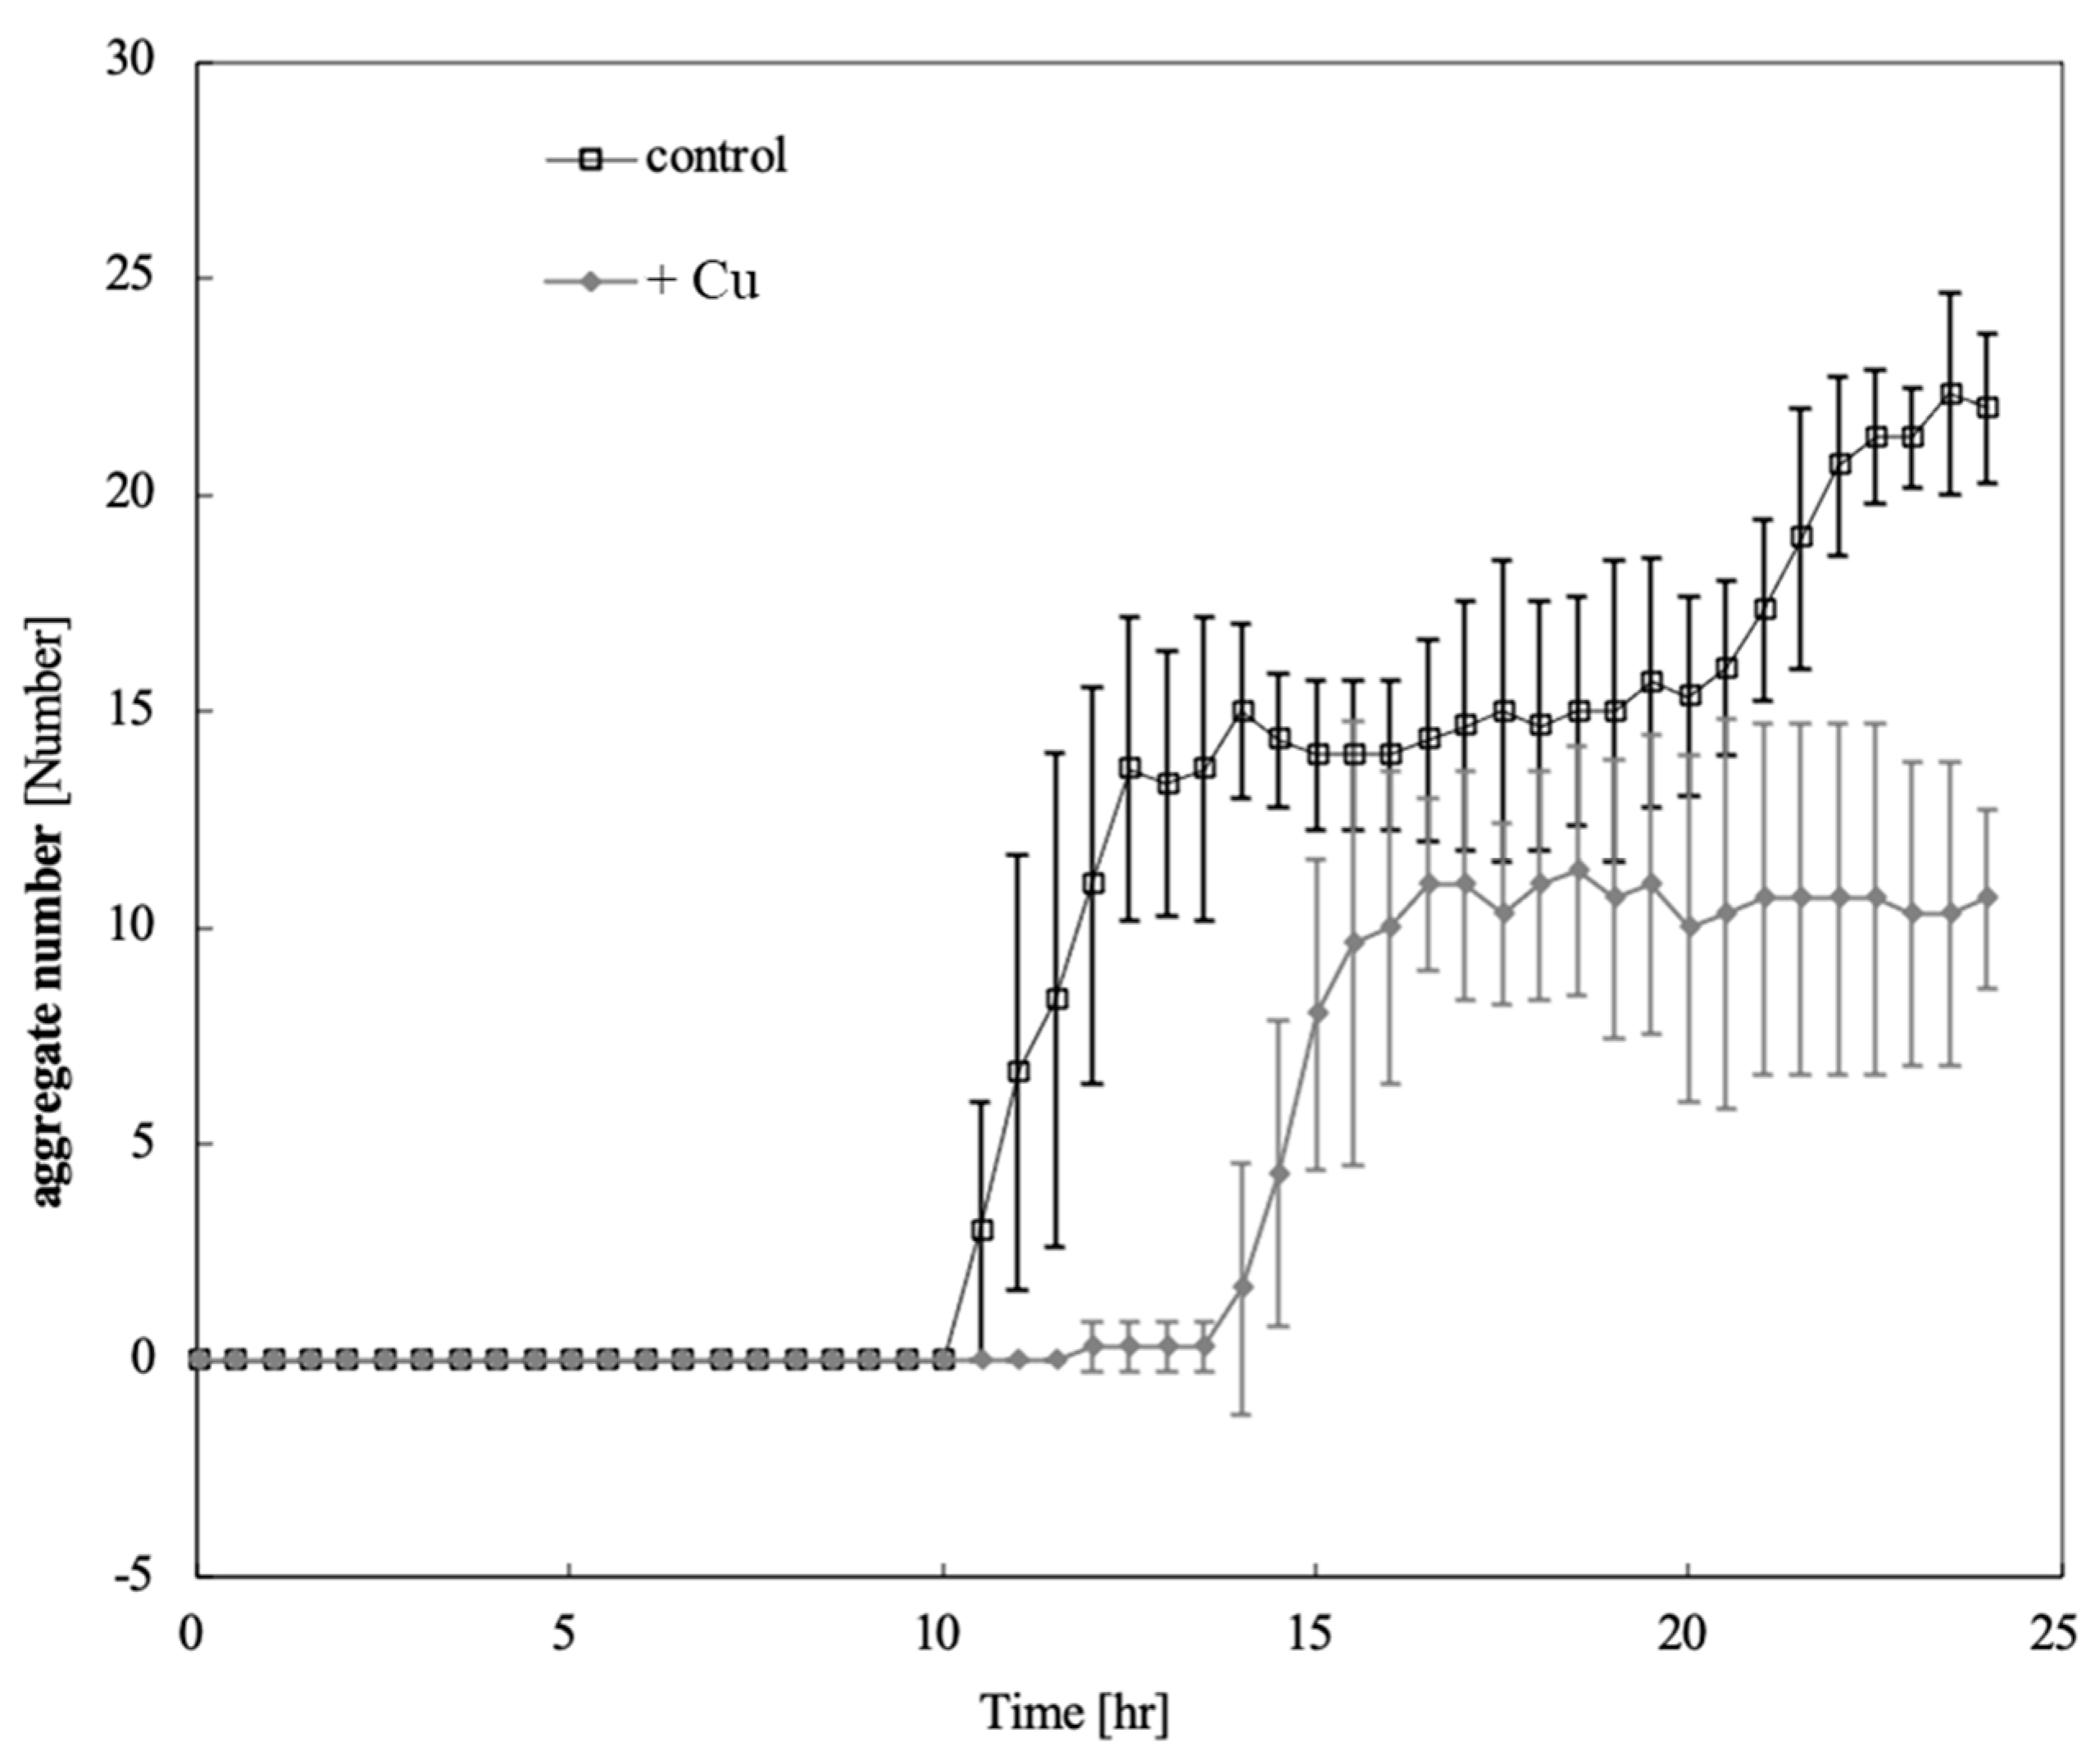
Figure 4.
Comparison of aggregate numbers at 14 and 24 hours with and without copper exposure. Asterisk indicates a significant difference in the number of D. discoideum aggregates between copper-exposed and unexposed condition by t-test (p << 0.05). There was a significant difference in the reduction in the number of D. discoideum aggregates between copper-exposed and unexposed plants at both 14 and 24 hours after inoculation.
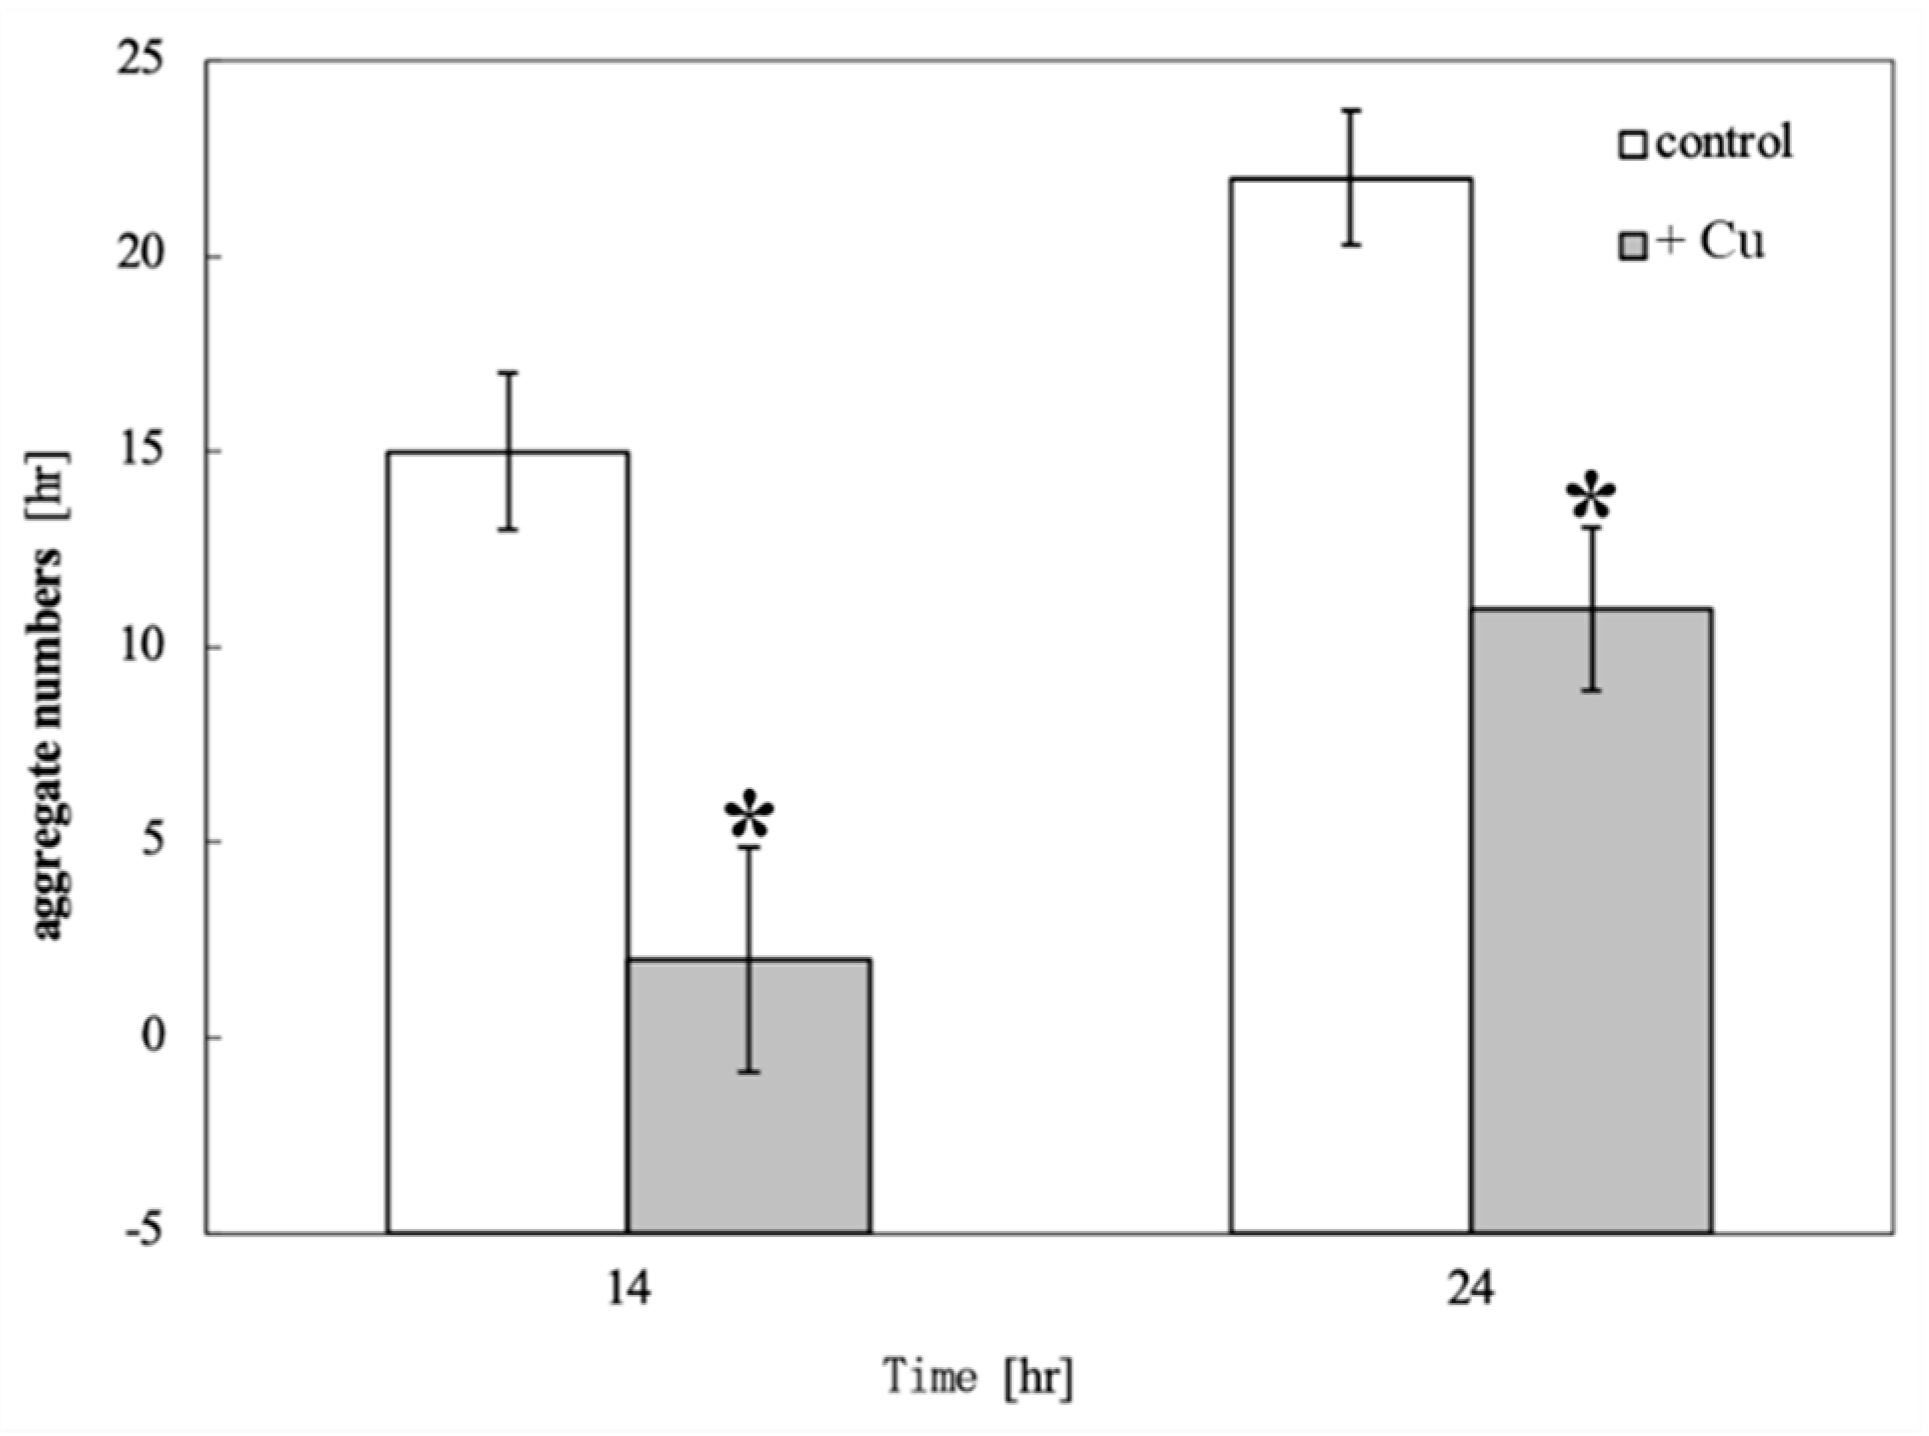
Figure 5.
Two dimensional gel electrophoresis images of D. discoideum proteins. The samples were treated with TCA, extracted with a protein solubilizing solution containing urea, and separated by immobilized pH gradient two-dimensional electrophoresis combining IEF and SDS-PAGE, and then silver stained. A: control, B: copper exposure. Expression of 280 proteins was detected in both copper exposure and non-exposure. The spots in the electrophoretic diagram obtained from D. discoideum were colored green for those exposed to copper and red for those not exposed, and the spots were overlaid to compare the expression levels (C). Copper exposure caused the expression of spot a, spot b, and spot c to disappear. Panels D to I show magnified views of spots a to c, as indicated in panel C. The spots a, b, and c detected in the control (panels D, F, H) are absent under the copper exposure condition (panels E, G, I).
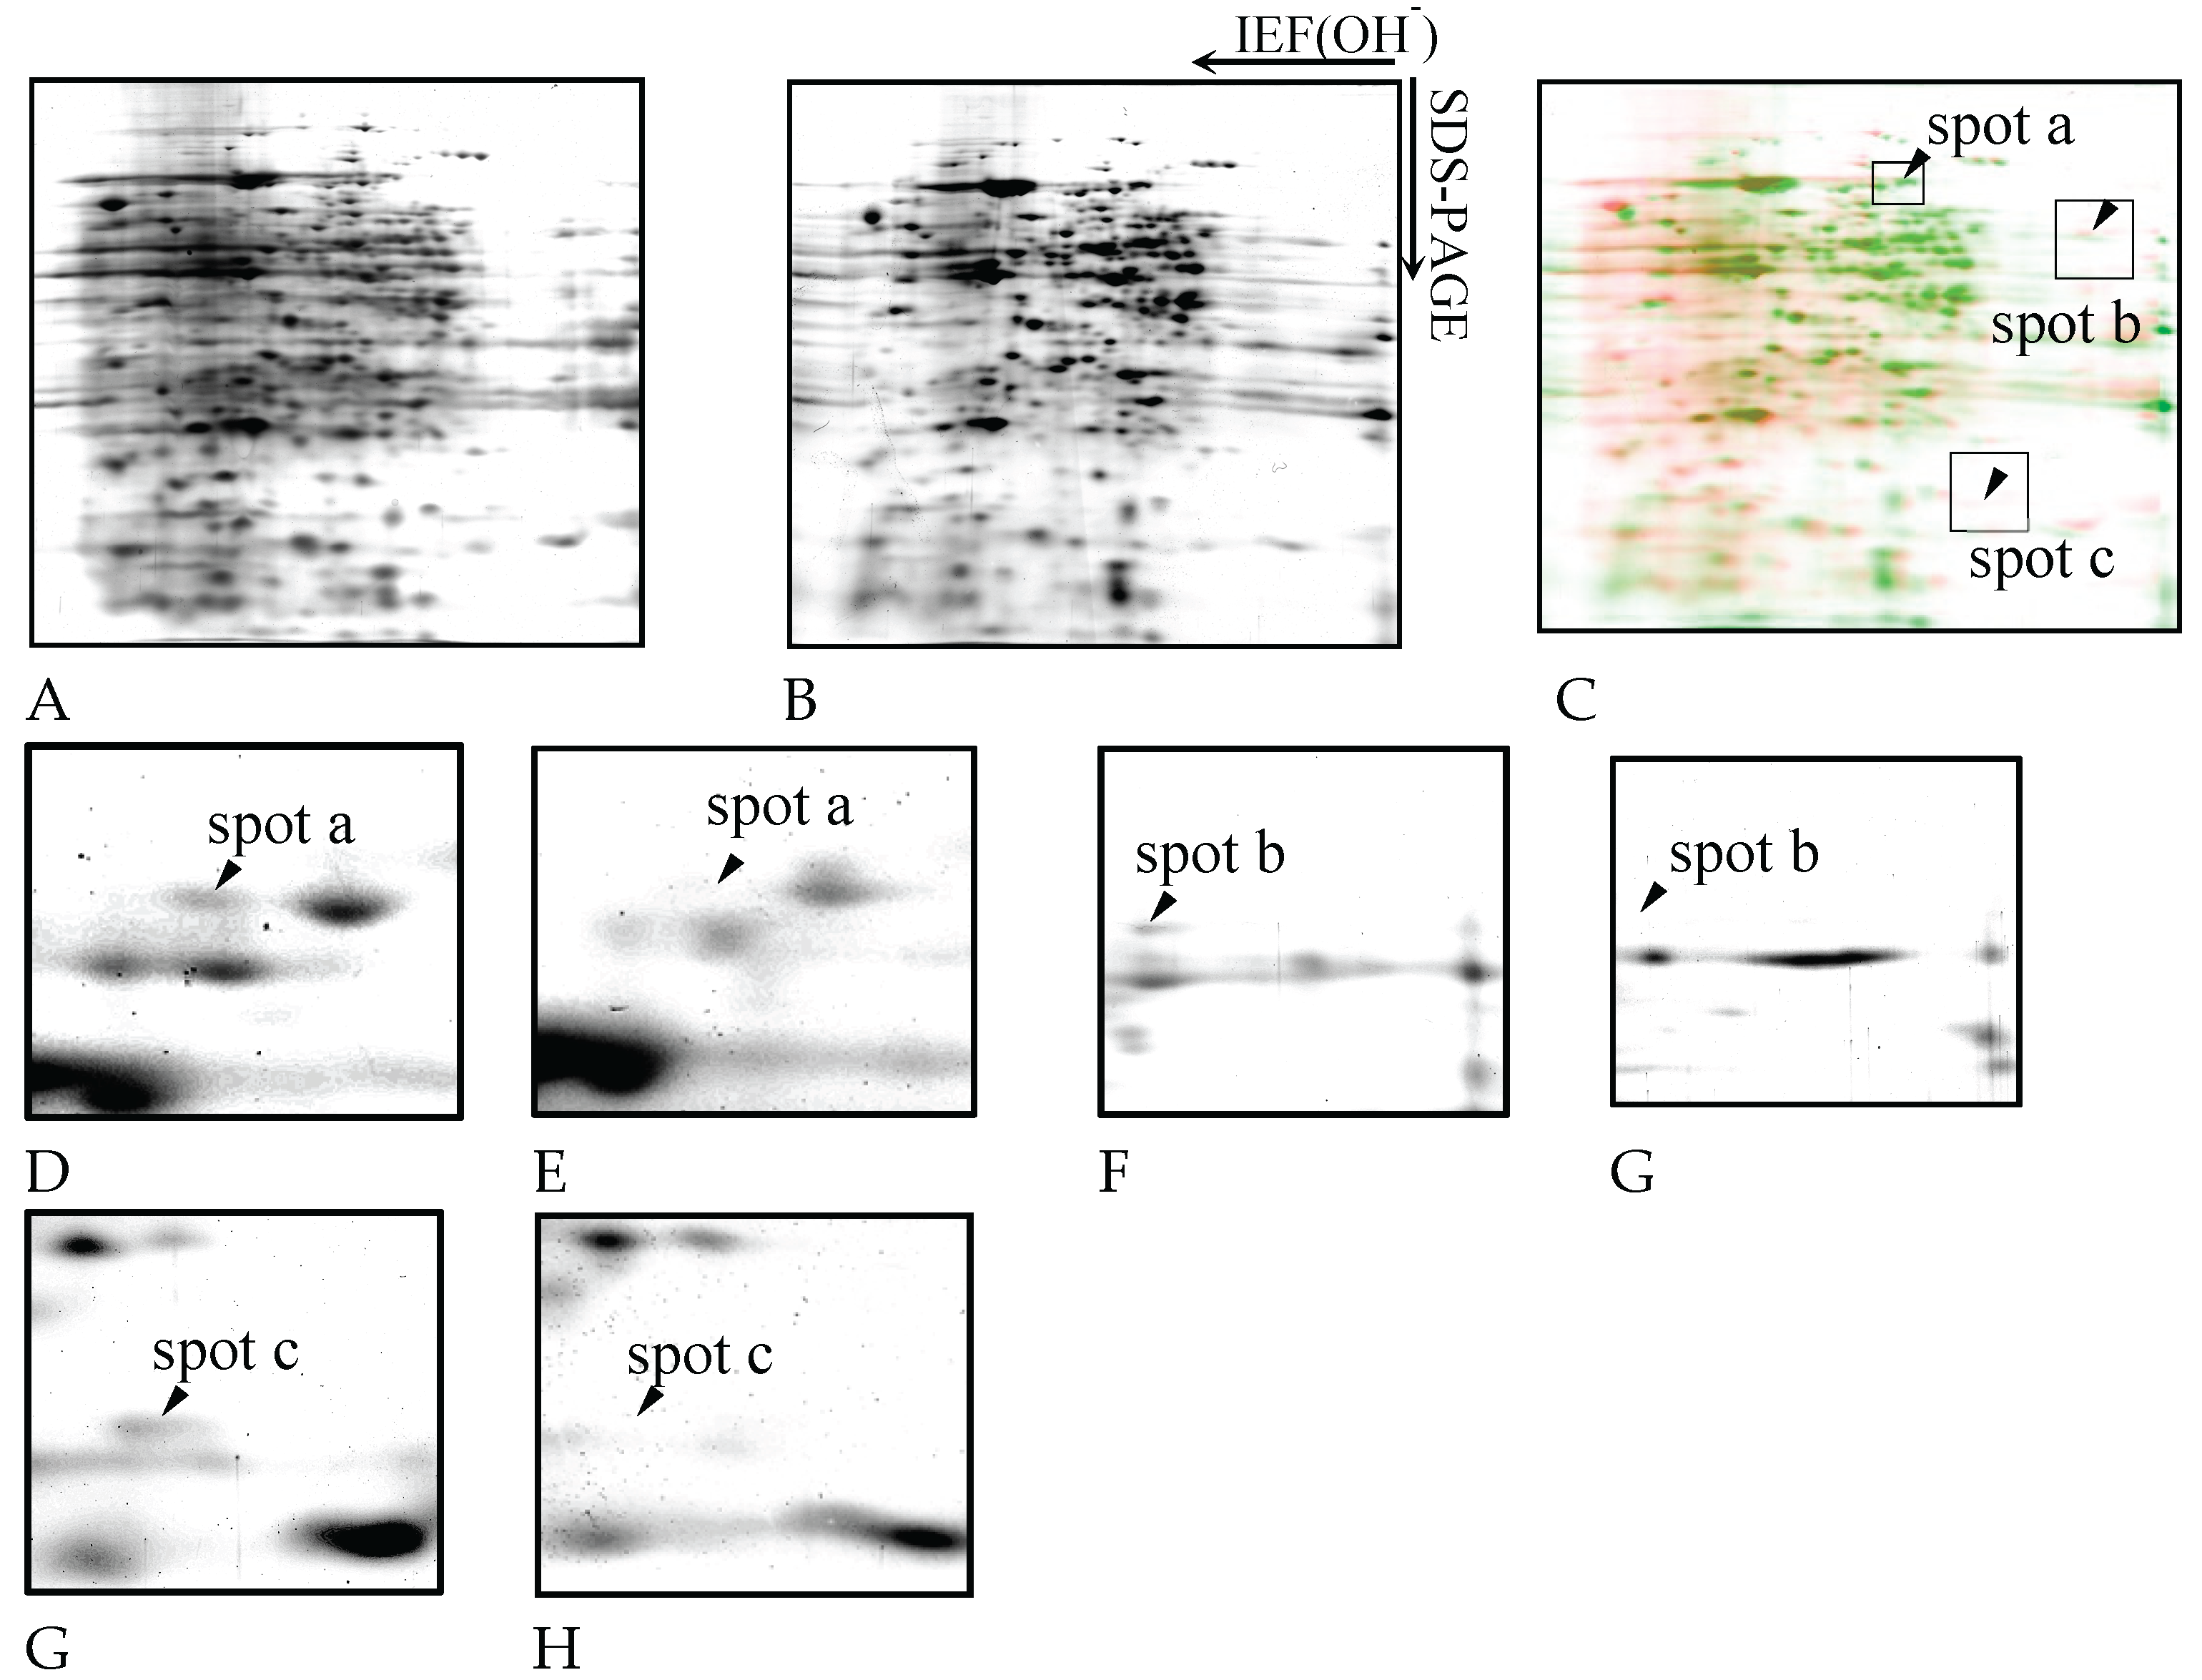

Table 1.
Identified proteins corresponding to spots that disappeared under copper exposure.
| spot | experiment value | protein name | Dictybase ID | ExPasy data base | |||
| pI | Mw(kDa) | DDB | pI | Mw(Da) | Rank | ||
| a | 6.3 | 102 | formin-I | DDB_G0284519 | 6.27 | 106462 | 1 |
| probable ATP-dependent RNA helicase ddx10 | DDB_G0284017 | 6.24 | 100359 | 2 | |||
| mental retardation GTPase activating protein homolog 2 | DDB_G0270024 | 6.33 | 97411 | 3 | |||
| dynamin-like protein A | DDB_G0268592 | 6.4 | 101404 | 4 | |||
| folliculin interacting protein repeat-containing protein | DDB_G0271996 | 6.29 | 105881 | 5 | |||
| myb-like protein K | DDB_G0276877 | 6.32 | 100912 | 6 | |||
| b | 8.1 | 78 | cytoplasmic regulator of Adenylylcyclase | DDB_G0285161 | 8.08 | 78499 | 1 |
| target of Myb protein 1 | DDB_G0290163 | 8.1 | 75375 | 2 | |||
| inner no outer 80 complex subunit D | DDB_G0288447 | 8.07 | 78233 | 3 | |||
| cycloartenol synthase | DDB_G0269226 | 8.19 | 80763 | 4 | |||
| c | 7.5 | 31 | tetratrico peptide repeat -containing protein | DDB_G0285095 | 7.57 | 29748 | 1 |
Disclaimer/Publisher’s Note: The statements, opinions and data contained in all publications are solely those of the individual author(s) and contributor(s) and not of MDPI and/or the editor(s). MDPI and/or the editor(s) disclaim responsibility for any injury to people or property resulting from any ideas, methods, instructions or products referred to in the content. |
© 2025 by the authors. Licensee MDPI, Basel, Switzerland. This article is an open access article distributed under the terms and conditions of the Creative Commons Attribution (CC BY) license (http://creativecommons.org/licenses/by/4.0/).
Copyright: This open access article is published under a Creative Commons CC BY 4.0 license, which permit the free download, distribution, and reuse, provided that the author and preprint are cited in any reuse.


