
Submitted:
08 July 2025
Posted:
09 July 2025
You are already at the latest version
Abstract
Systems 10R5 [(PPO)8 – (PEO)22 – (PPO)8], 17R4 [(PPO)14 – (PEO)24 – (PPO)14] and 31R1 [(PPO)26 – (PEO)7 – (PPO)26], selected based on their different molecular weights and PPO/PEO ratios, were studied in aqueous solution in order to investigate the effect of the variation of the copolymer hydrophobicity on the phase behavior of the system. Measurements and analysis of density, sound velocity, viscosity, and surface tension of the solutions were carried out, as well as confirmatory methods such as direct observation, dynamic light scattering and dynamic and shear rheological properties of the systems. From the density and sound velocity results, molar volume, apparent adiabatic compressibility, and hydration profiles were calculated. The zones of random networks, flower-like micelles and micellar networks were delineated for the three systems and plotted within phase diagrams in the concentration ranges of 0.1 - 90 wt.% and temperatures from 6 to 70°C. The results also show that the 31R1/water system does not form flower-like micelles. In contrast, the 17R4/water and 10R5/water systems form them in a small interval each, which moves at higher concentration and temperature values with the PPO/PEO ratio, as well as the zones where the micellar networks and their transition are located. The study of the physicochemical behavior of the three systems is reported, providing important information for future research to evaluate their use as hydrophobic nanocarriers, either individually or in combination with another copolymer.
Keywords:
10R5
; 17R4
; 31R1
; copolymers
; reverse Pluronic
; phase diagram
1. Introduction
The increasing development of drugs classified as Class II or IV by the Biopharmaceutical Classification System (BCS), characterized by low aqueous solubility, has amplified the need for effective delivery carriers [1,2]. Copolymers have been established as potential controlled drug release systems due to their associative properties Pluronics (or poloxamers) are a type of triblock copolymer of the ABA form with the properties of a nonionic surfactant, whose structure is represented as (PEO)x-(PPO)y-(PEO)x, where x represents the amount of hydrophilic poly(ethylene oxide) (PEO) units and y represents the hydrophobic poly(propylene oxide) units [3].
Poloxamer-based hydrogels demonstrate notable promise in this context, particularly for enhancing the solubility and controlled release of anticancer drugs. This capability stems primarily from their intricate phase diagrams, which are governed by the temperature-dependent hydrophobic interactions of PPO blocks and hydrophilic interactions of PEO segments in aqueous environments. Typical examples include the solubilization of poorly water-soluble drugs such as silymarin, clozapine, oxcarbazepine, paclitaxel, or quercetin using Pluronic micelles [4,5]. Although reverse poloxamers remain understudied as drug delivery vehicles, their potential is increasingly recognized. Notably, mixed systems incorporating both reverse and direct poloxamers have demonstrated enhanced solubilization efficiency, underscoring the active contribution of reverse architectures in improving micellar performance [4].
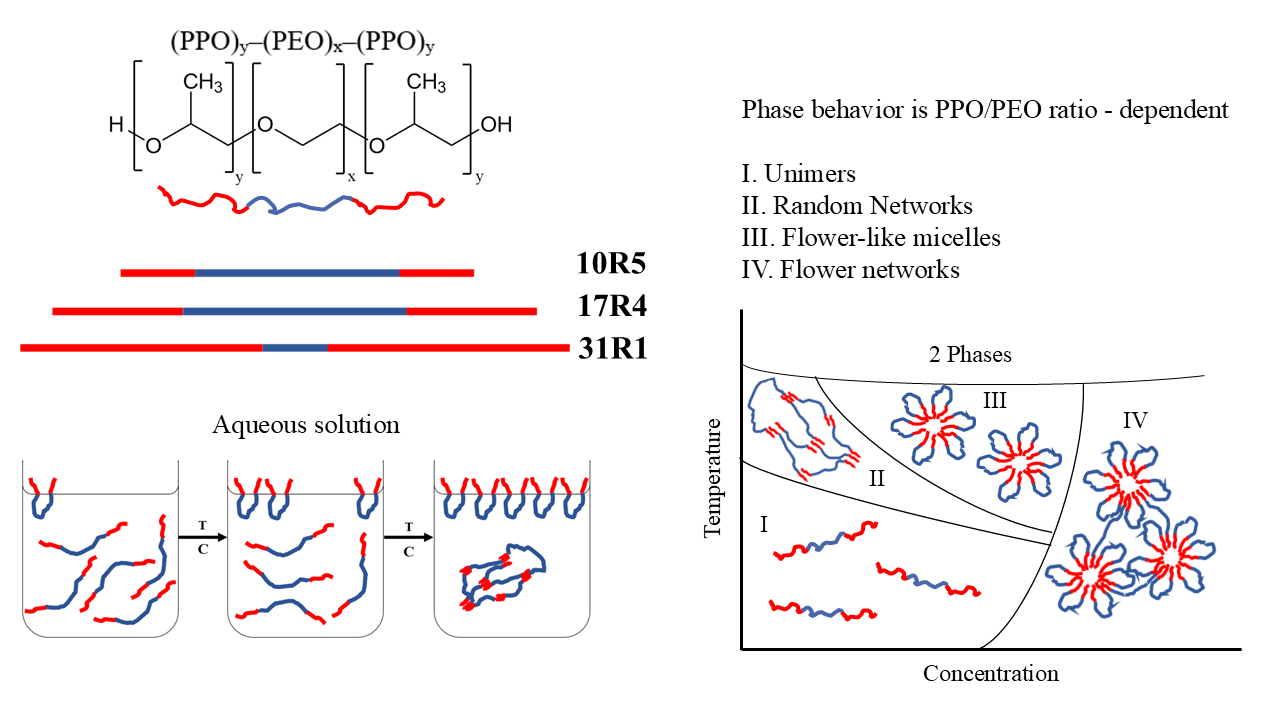
There is a reverse configuration denoted as (PPO)y-(PEO)x -(PPO)y which is known as reverse Pluronics or Meroxapoles (Figure 1). The nomenclature of these copolymers is given by the molecular weight of PPO divided by 1000, the letter R for reverse, and the percentage of PEO divided by 10. Thus, for example, copolymer 17R4 has an approximate molecular weight of 2700 g/mol, comprising 1700 g/mol of PPO, and approximately 40% (≈1000 g/mol) of PEO [6].
In contrast to the well-studied (PEO)x–(PPO)y–(PEO)x systems [7,8,9,10,11,12,13], reverse Pluronics have received comparatively less attention [14]. About 5 decades ago, a debate arose about the ability of BAB copolymers (i.e., with hydrophobic ends) to form micellar structures, where, based on theoretical calculations, the first important conclusions about these systems were obtained: the hydrophobic ends can form a core, while the hydrophilic block adopts a “looped” geometry, resembling the petal of a flower, although this “folding” drastically increases the critical micellar concentration (CMC) [15,16]. Furthermore, it has been thermodynamically demonstrated that it is very complicated for a PEO block to “bend”, and it is possible that some hydrophobic ends may be expelled from the core of one micelle and become part of the core of another neighboring micelle, thus forming a three-dimensional network of flower-like micelles [17].
At present, concentration – temperature phase diagrams are reported in the literature for the following systems: 10R5/water [18,19]; 17R4/water [20,21,22]; 31R1/water [20,23]; 25R2/water [24]; 25R4/water [24]; 25R8/deuterated water [25]. All are based on the same process: below the critical micellar temperature (CMT), both PEO and PPO are soluble. When the CMT and CMC are reached, the PPO block dehydrates and induces the formation of aggregates. As the temperature continues to rise above the CMT, a temperature is reached at which the solution separates into two phases, one rich in water and the other rich in copolymer. This point is referred to as the cloud point (CP).
Based on the aforementioned research (both theoretical and experimental), it is known that reverse Pluronics are capable of forming only three types of conformations: random networks [18,19,22,25], flower-like micelles [21,22,24], and micellar networks [19,24,25]. Only the latter two are considered micellar structures that form in the semi-dilute and concentrated ranges, respectively, while the random networks are considered a pre-micellization of the cloudy coloration that occurs only at low concentrations prior to phase separation. Table 1 presents a summary of the state of the art in this work, based on the findings reported by our predecessors in the phase study of these systems.
Some of the most recent studies carried out with these systems are mixtures of direct Pluronics (DP) and reverse Pluronics (RP) to give them greater stability and obtain a coexistence of both types of micelles or even obtaining an improvement in gelation thanks to the ability of the RP to interconvert with each other [11,26,27,28,29,30]. This topic is of great interest, as some studies suggest that the addition of RP improves the solubilization of drugs compared to the use of DP alone [4,31]. There have also been studies devoted to analyzing mixtures of these Pluronics with ionic liquids, aiming to develop green and environmentally friendly drug nanocarriers that eliminate the need for water [32,33,34].
Although it is known that RP can be used as defoaming, wetting and anti-caking agents due to their higher PPO content compared to DP [35,36,37], the study of the possible application of flower-like micelles or flower networks is still not as extensive, as the available information is not sufficient to establish relationships in the behavior of micellar phases according to the PPO/PEO ratios. The phase diagrams presented by different authors in studies of the same system, using various experimental techniques, differ significantly among them, even though the copolymer is from the same supplier.
For example, the phase diagram of the 10R5/water system reported by Naskar et al. [18], differs significantly in the structure formation zones from the phase diagram of the same system reported by Larrañeta and Isasi [19] Both conclude that this system is unable to form flower-like micelles due to the short length of the PEO blocks of this copolymer. However, although the two studies report different concentration intervals, they delineate a zone of existence of random networks that are separated by almost 10°C.
Another example can be found in the phase diagrams of the 17R4/water system reported by Zhou and Chu [21] and Huff et al. [22], which, unlike the previous ones, are very similar to each other. However, in both studies, it is argued that the zones of random networks, which are not considered as micellar structures, do not require delimitation. Therefore, it is necessary to report phase diagrams for these systems in which the zones and the structures they form can be homogenized.
This work aims to extend and homogenize the knowledge about RP. The 10R5, 17R4, and 31R1 systems were studied in aqueous solution using as selection criteria the differences in molecular weight and PPO/PEO ratios, which are translated as a measure of the hydrophobicity of the molecule. The identification of concentration and temperature ranges where unimers, random networks, flower-like micelles, and micellar networks exist was carried out by measuring and analyzing density (ρ), sound velocity (Us), viscosity (ηs), and surface tension (σ). These transitions were also confirmed by visual observations, dynamic light scattering (DLS), and rheometry. Based on these results, various calculations were performed to elucidate the molecular interactions in detail. Detailed phase diagrams were reported for each system to aid in the search for the appropriate structure and conditions for encapsulating and controlling release of a hydrophobic substance.
2. Materials and Methods
2.1. Materials and Solution Preparation
The three triblock copolymers analyzed: 10R5 [(PPO)8 – (PEO)22 – (PPO)8] MW=2000 g/mol and HLB=12.0-18.0, 17R4 [(PPO)14 – (PEO)24 – (PPO)14] MW=2700 g/mol and HLB=7.0-12.0, and 31R1 [(PPO)26 – (PEO)7 – (PPO)26] MW=3300 g/mol and HLB=2.0-7.0, were purchased from Merck (Darmstadt, Hesse, Germany) and used as received. The copolymers have PPO/PEO ratios of 0.96, 1.54, and 9.79, respectively, with Pluronic 10R5 being the most hydrophilic and Pluronic 31R1 being the most hydrophobic.
Double-distilled and deionized water provided by Selectropura (Guadalajara, Jalisco, Mexico) was used to prepare the dilutions and then passed through a Simplicity® UV (18.2 MΩ/cm) ultra purification system (18.2 MΩ/cm) from Millipore Water (Burlington, Massachusetts, United States). Samples were prepared in new 30 mL glass vials for storage of the solution. The vials of solution were vortexed and then wrapped in aluminum to prevent degradation by natural and/or artificial light sources. The solutions were allowed to stabilize for one week at a constant temperature of 5°C in a refrigerator, with gentle shaking and periodic agitation, as the systems are more soluble at low temperatures.
2.2. Visual Tests
The physical appearance and fluidity of the solutions were determined by visual tests conducted in a temperature range of 0 to 80°C, with a series of images taken every 5°C. The samples were allowed to stabilize in an isothermal bath for one hour at each temperature, paying particular attention to changes in the physical appearance of the solutions. Two polarizing plates, one in a parallel position and the other in a crossed position, were used to observe the static samples and under shear stress to determine if the systems exhibited birefringence.
2.3. Density and Sound Velocity
Measurements of density (ρ) and sound velocity (Us) were made using an Antor Paar DSA 5000M density meter (Graz, Styria, Austria), calibrated with ultrapure water of the same brand. For each solution, a stepwise temperature sweep was performed from 6 to 70°C, with measurements taken every 1°C and stabilized to an accuracy of ±0.001°C. Additionally, the instrument has a resolution of 1×10⁻⁶ g/cm3 and 1×10⁻² m/s for density and sound velocity, respectively. The sample is injected into the capillary using a syringe, and the capillary automatically passes through the two measuring cells, which are arranged in series: the density and sound velocity cells. This allows for both measurements to be performed simultaneously using the oscillating U-tube method. At the end of each experiment, the capillary is washed with 1% by weight solution of Alconox and double-distilled water. One syringe was used per sample to avoid contamination. Two replicates were performed per experiment, and the average of these is reported, along with a small discernible statistical error.
With these measurements, it is possible to calculate the apparent molar volume (Vϕ) and the apparent adiabatic molar compressibility (Κϕ) using equations 1 and 2, respectively [38].
In equation (1), ρs is the density of the solution in g/cm3, m is the molality of the solution (moles of copolymer/kg of water), M is the molecular weight of the copolymer, and ρw is the density of water. In equation (2), βs and βw are the adiabatic compressibilities of the solution and water, respectively, which are calculated using equations (3) and (4) as a function of the density and sound velocity of the solution Us,s and water Us,w, respectively.
In addition, hydration profiles can be determined from density and sound velocity data. Equation (5) was used to determine the infinite dilution hydration number (nH0), which represents the hydration number as the number of copolymer moles tends to zero.
Where nw and nd are the moles of water and solute, respectively, in the solution. The empirical fitting of the hydration number as a function of the molarity m (moles of copolymer/kg of water) used was proposed by Figueroa–Ochoa [39] and is described by equation (6), where a and b are fitting parameters.
2.4. Tensiometry
Semi-static surface tension measurements were performed in a portable Krüss BP50 bubble tensiometer (Hamburg, Germany). The solutions were placed in a glass cell covered by a fluid recirculation section, with the inlet and outlet connected to a recirculating bath of automotive coolant to control the system’s temperature. The tensiometer features a thermocouple to measure the actual sample temperature, allowing the temperature of the recirculating bath to be adjusted accordingly. A surface age of 1500 ms was set to ensure that equilibrium was reached after the perturbation when bubbling started. Surface tension measurements were performed for 10 minutes while keeping this parameter constant to ensure a steady state. Three replicates per experiment were performed, and the statistical average is reported.
The results of surface tension as a function of temperature (T) and concentration (C) were used to calculate the excess amount of copolymer adsorbed at the air–water interface (Γ) in units of mol/m2 with equation (7), known as the Gibbs adsorption isotherm.
Where R is the ideal gas constant, and linear fits were used for the derivative term dσ/d ln C. The minimum area (as) occupied by a copolymer molecule was calculated from equation (8) [40].
Where NA is Avogadro’s number (6.023 × 10²³ molecules/mol) and Γ∞ is the maximum amount of surfactant at the air–water interface, i.e., before CMC.
2.5. Dynamic Light Scattering
A Malvern Zetasizer Nano ZS90 from Malvern Instruments (Malvern, UK) was used for dynamic light scattering (DLS) measurements. The light source of the instrument was a 4 mW laser with a wavelength of λ = 632.8 nm. The instrument has a size measurement range of 0.3 nm to 10 μm and features a scattered light detector positioned at a 90° angle. The instrument uses the cumulant method to obtain intensity distributions.
2.6. Viscosimetry
The viscosity (ηs) of the solutions was measured using a Lovis 2000 M-ME module from Anton Paar (Graz, Styria, Austria). This instrument, a Höppler ball drop viscometer, functions as an add-on to the DSA 5000M density meter. Stepwise temperature sweeps were performed from 6 to 70°C, with measurements taken every 1°C to an accuracy of ±0.005°C. Measurements were taken at a constant tilt angle of 50° because no non-Newtonian behavior was observed in the rheological analysis over the entire concentration and temperature range. The instrument has a resolution of 1×10⁻³ s for ball rolling time measurements. Capillaries of 1.59, 1.8, and 2.5 mm in diameter were used according to the set measurement intervals of each capillary. Two replicates were performed per experiment, and an average is reported with an imperceptible statistical error.
2.7. Rheometry
An AR-G2 rheometer from TA-Instruments (New Castle, Delaware, USA) was used. The instrument has a Peltier-type temperature controller. The selection of geometries was made according to the viscosity magnitudes of each sample; three geometries of titanium cone and plate were used: one with a diameter of 60 mm and an angle of 1°, one with a diameter of 60 mm and an angle of 2°, and one with a diameter of 40 mm and an angle of 2°. All geometries were used with a humidification chamber to avoid evaporation of the samples at high temperatures. Prior to measurements, the temperature of the samples was stabilized in the Peltier for 1 minute. Two replicates were performed for each experiment.
- Simple shear: Shear viscosity measurements were performed in a speed range from 1 to 500 s-1, obtaining 5 points per logarithmic decade.
- To determine the linear viscoelastic zone (LVZ), the elastic and viscous moduli were obtained from 0.1 to 100% of relative deformation at a constant frequency of 10 rad/s, obtaining 10 points per logarithmic decade.
- Elastic and viscous moduli were obtained from a frequency of 0.1 to 100 rad/s at a constant strain within the LVZ. Dynamic viscosity was analyzed in conjunction with shear rate and viscosity determined in the viscometer.
- The elastic and viscous moduli were obtained as a function of temperature at a constant frequency of 10 rad/s and with the same percentage of deformation belonging to the LVZ.
3. Results and Discussion
3.1. Visual Tests
The dissolutions of the three systems show similar features. One of them is that none of them shows static or shear birefringence, indicating that there are no very complex structures. D’Errico et al. [24], who studied 25R2 and 25R4 systems, concluded that the RP require a minimum molecular weight for the existence of crystalline phases when mixed with water, since only the 25R4–water system showed them. The three systems studied here have a lower molecular weight than 25R4 (3,600 g/mol); hence, the results obtained in these tests agree with the conclusions of these authors.
There are changes in coloration with varying concentrations and temperatures in the three systems. These changes are shown in Figure S1 of the Supplementary Material, where the dots represent the temperatures at which the transition is detected, and a visual line is used to delineate the zones. The first transition observed is from transparent to cloudy coloration. For the 10R5/water system, it occurs between 55 and 65°C and between 1 and 40% by weight. For the 17R4/Water system, this coloration occurs between 40 and 50°C from 1 to 10% by weight. However, from concentrations of 15% to 40% by weight, this coloration starts at very low temperatures. For the 31R1/water system, turbidity appears between 15 and 20°C from 1 to 40% by weight. This turbidity is, in most cases, a transition before phase separation. This behavior was also observed by Huff et al. [22] in the 17R4/water system. This characteristic has been attributed to hydrophobic PPO impurities in the copolymer; some solutions have been filtered in an attempt to resolve this issue, but without success. In the present work, the samples were not filtered to avoid problems in the real concentration of the solutions. Zhou and Chu [21] also noted the turbidity occurring in the dilute range of this system. They reported the presence of free copolymers and “anomalous hydration” due to the “heterogeneity of the block copolymer composition”. This suggests that this coloration may be due to the formation of a random network.
Another transition observed only in the semi-dilute range of the 10R5/water and 17R4/water systems is from cloudy to transparent before phase separation. This suggests the presence of flower-like micelles. Additionally, a bluish transition was observed only at the 20% concentration of 17R4/water and 40% concentration of 31R1/water. Other authors have detected the bluish color in aqueous solutions of DP and, due to the intense light scattering that exists in this region, it is associated with micellar growth [43,44]. However, this type of coloration cannot be associated with a specific type of structure, but rather with particles of around 30 nm [45]. Other authors, such as Patel et al. [46], have detected this change very close to the CP, just before the dehydration of the PEO blocks, which is a conclusion that agrees with our results, as it involves a coloration very close to the phase separation.
For the three systems, from a concentration of 50%, there are no visual changes, and all the solutions are observed as transparent and viscous liquids. This observation was also noted by Mortensen et al. [25]. The same zone, where they detected the presence of micellar networks by rheometry and SANS, exhibits the same behavior in this work, which is discussed later. The exceptions are the pure copolymers 10R5 and 17R4, which exhibit gel behavior from 0 to 18°C. This point is referred to as the pour point and is reported by the manufacturer as 15°C for the 10R5 copolymer and 18°C for the 17R4 copolymer. The pour point of the 31R1 copolymer was not observed, as it is reported to be -25°C.
The phase separation temperatures (or cloud points) have been determined for each system. These are also bounded by the two-phase separation line (2Φ) in Figure S1. Allowing the temperature to stabilize for a long time was helpful in determining these points, as they were observed visually as two completely separated phases, with the copolymer in the lower part because it is denser than water. Pérez – Sanchez et al. [20], using computer simulations, obtained cloud point values similar to those found here for the same three systems. The researchers conclude that at high PPO/PEO ratios, “the equilibrium is easily shifted toward hydrophobic core-core interactions,” which favors aggregation and lowers the cloud point. Therefore, although the 10R5 and 17R4 copolymers have almost the same amount of PEO, the cloud points of the former are higher because the PPO content is very low.
3.2. Density and Sound Velocity
Figure 2 shows the density (a-c) and sound velocity (d-f) measurements as a function of temperature for the three systems. In the graphs shown in Figure 2a-c, as expected, the density decreases with increasing temperature and increases with increasing concentration. However, from a concentration of 40% by weight, the density of the three systems shows an almost linear behavior with respect to temperature. Moreover, the density change (Δρ) between higher concentrations is smaller than that between dilute and semi-dilute concentrations, which becomes more noticeable with increasing PPO/PEO ratio. In fact, the three pure copolymers (100%) are almost as dense as the dilutions at concentrations of 50%, 40% and 30% for 10R5, 17R4, and 31R1, respectively. For temperatures below 18°C, a maximum point can be observed for the pure copolymers 10R5 and 17R4, which exceeds the concentrations analyzed and is related to the pour point.
According to Fritz et al. [47], the identification of structure formation by densimetry is of great utility because the density of hydrated PPO chains is higher than the density they have when in the form of dehydrated cores. Indeed, in this study, all three systems have a critical temperature at which the density decreases more abruptly.
- In the 10R5/water system (Figure 2a), these decays are only observed when the derivative (not shown) is analyzed. Only a slight increase in density is visible at 65°C and above (at concentrations of 20 and 30 wt%), corresponding to phase separation, which was verified by direct observation. At these concentrations, the amount of copolymer is sufficient for the instrument to begin to detect homogeneity errors in the sample.
- In the 17R4/water system (Figure 2b), the density decays sharply at intermediate temperatures, around 20 and 40°C, exhibiting two distinct linear zones. Very similar to the 10R5 system, the 15, 20 and 30% concentrations experience a slight peak in density that rises and decays in the 45 and 50°C range due to phase separation.
- For the 31R1/water system (Figure 2c), the dehydration of the PPO blocks is more abrupt than for the other two systems, where again two linear zones can be delineated between 10 and 20°C. The phase separation of these systems was observed between 20 and 30°C, and above this temperature the density acquires an almost linear behavior, the slope of which increases with concentration.
Maccarini and Briganti [48] mention that a quadratic fit of the density with respect to temperature can be performed up to the transition temperature, in order to evaluate the temperature at which the maximum value the density can acquire is reached. Whether this temperature decreases or increases with increasing concentration determines whether the system is a structure former or a structure destroyer. For all three systems analyzed here, the transition temperatures decrease with concentration, suggesting that all three are structure formers.
Figure 2d-f shows plots of sound velocity as a function of temperature for the three systems. At dilute concentrations and temperatures below their respective transitions points, the sound velocity follows a behavior similar to that of water. Again, for the 10R5/water system, phase separation is visible to the naked eye only around 65°C. In contrast, for the 17R4/water and 31R1/water systems, two linear zones are observed where the sound velocity begins to decrease at intervals consistent with those obtained by densimetry. This decrease can be related to the formation of structures, since, according to Álvarez – Ramírez et al. [45]. The amount of effective particles is lower when they begin to aggregate, which translates into a decrease in sound velocity.
It is noteworthy that at concentrations below 50 wt.%, all profiles converge to similar values of sound velocity after the cloud point (above 65°C for 10R5/water, between 45 and 50°C for 17R4/water, and between 20 and 30°C for 31R1/water), in agreement with visual observations and densimetry. This behavior was observed in P104 copolymer by Wen and Verrall [49], who attributed it to the fact that, with increasing concentration and temperature, there is an apparent decrease in the speed of sound and the amount of aggregates due to increased interactions between molecules.
From concentrations of 30% for the three systems, the sonic velocity acquires a negative slope. Similarly to the densimetry results, it can be observed that for concentrations between 40 and 50% by weight, the ΔUs between concentrations reverses the trend and starts to decrease with increasing concentration, behaving almost linearly with increasing temperature. It is also evident that at these high concentrations, they eventually cross the sound velocity line of water above certain crossover temperatures, which decrease with increasing concentration. This behavior has been observed in previous works [39,45], where the sound velocity values at low concentrations converge to the same value, while at high concentrations, the molecular interactions are so strong that an apparent decrease in sound velocity is visualized [45]. In the case of the 31R1/water system, the higher concentrations show an irregular profile of the sound velocity attributed to the cloud point.
Comparing the three systems, both as a function of concentration and temperature, it is evident that the amount of PPO plays a key role in lowering the transition temperatures in each system. This is because the higher the PPO/PEO ratio, the steeper the dehydration of the chain and therefore the steeper the drop in density and sound velocity.
The 31R1/water system is the only one in which behaviors closer to those observed in DP are obtained. Álvarez – Ramírez et al. [45] and Figueroa – Ochoa et al. [39] studied the phase behavior of Pluronics P103 and P104 by densimetry and sound velocity, respectively. In general, these systems exhibited a drastic decrease in both properties, followed by the formation of structures at higher temperatures. In contrast, the 31R1 system showed only a decrease in properties, followed by phase separation. In RP, it is sufficient to analyze the visual evidence as a whole to confirm that the phase separation corresponds to this graphically detected change.
A more detailed analysis of these systems was performed by obtaining the derivative of sonic velocity and density as a function of temperature. Figure 3 shows the results for the 17R4/water system. This system was chosen as an example of the three systems because it has transitions at larger temperature intervals. The analyses for the 10R5/water and 31R1/water systems are shown in Figures S2 and S3 of the Supplementary Material, respectively.
For the 1 and 5% concentrations (Figure 3a), a decrease in dUS/dT is observed between 35 and 45°C, corresponding to the transition from transparent to cloudy, as detected in the visual tests, as shown in the insets. Between 40 and 50°C, a second irregular change in milky color is observed, consistent with phase separation. At the 10% concentration (Figure 3b), the same phenomenon occurs as at the lower concentrations, except that the cloud point is much more visible here, as the change is more abrupt and two separate phases are observed. For the 20% concentration, two transitions are observed before phase separation, indicating the presence of a distinct structure. At these concentrations, the first phase transition is to a visibly cloudy phase, followed by a transparent phase, and then to a bluish phase before phase separation occurs.
3.3. Molar Volume and Molar Adiabatic Compressibility
Figure 4 shows the physicochemical calculations obtained using density and sound velocity (equations 1 through 4) for the 17R4/water system. The same analyses for the systems 10R5/water and 31R1/water are found in Figure S4. In Figure 4a, it can be observed that the apparent molar volume (eq. 1) exhibits a linear increase with temperature, with a change in slope at temperatures corresponding to aggregation. This increase becomes more abrupt as the PPO/PEO ratio increases. At a 50% concentration, these changes in slope disappear, and acquire monotonic behavior over the entire temperature range. In addition, it can be observed how, for each system, the molar volume values approach the molecular weight of each copolymer (2000, 2700, and 3300 g/mol, respectively) with increasing concentration and temperature, considering that the density of the three systems does not exceed 1.1 g/cm3.
Analogous to density, PPO blocks occupy a larger volume in their dehydrated form. In other words, the volume occupied by the copolymer molecules is larger in the micellar state than in the monomeric state [50]. Similar to the results obtained by Wen and Verrall [49] and Álvarez – Ramírez et al. [45], a clear independence of the molar volume from concentration is observed in the approximate range of 5 to 40 wt%.
The apparent adiabatic compressibility (Eq. 2 to 4) as a function of temperature for 17R4/water system is shown in Figure 4b. A more pronounced increase is seen at aggregation temperatures, except for concentrations starting at 50%, where it behaves monotonically linear over the entire temperature range, similar to the molar volume. Additionally, the independence of compressibility values with respect to concentration is observed in the range of 3 to 20% by weight. The small values of this parameter (in the order of 10-7) indicate that aggregate formation is much more influenced by temperature than by pressure. This behavior is expected in systems with molecular interactions of the hydrogen bonding and Van der Waals type [49].
According to Armstrong et al. [51], compressibility is a very sensitive parameter to both molecular interactions (hydrophilic and hydrophobic). It is noteworthy that in all three systems it takes negative values over a wide range of concentration and temperature, despite its increasing slope towards positive values. It is worth noting that Κϕ depends on βs and βw, and is negative when βW is greater than βS, since the density is always greater for solution than for water (ρs>ρw), then the speed of sound has wide concentration and temperature intervals in which Us,w>Us,s due to molecular interactions [45], which causes Κϕ to have negative values. However, this makes physical sense since, according to Eagland and Crowther [52], negative values of compressibility are associated with increased hydration of the hydrophobic parts of the medium, and increasingly positive values are associated with increased dehydration of the hydrophobic parts of the medium. When the temperature is lower than the CMT, the surfactant molecules are surrounded by water molecules in a structured manner. As the temperature increases, dehydration causes this structure to break down, so it makes sense that this increase would be more pronounced at CMT.
3.4. Hydration Number
The hydration profiles (Eq. 5) of 17R4/water system as a function of temperature are shown in Figure 5a. As expected, the hydration number decreases with concentration, independent of temperature. The same analyses for the systems 10R5/water and 31R1/water are found in Figure S5a-b, respectively. A similar behavior was observed by Figueroa – Ochoa et al. [39] for Pluronic P104. However, in their results, they were able to show that above a specific temperature, the number of hydrogen-bonded molecules is independent of the concentration, since their values start to overlap. This does not happen in this case because they do not have more complex structures, such as cylinders, which are usually present in DP.
The decrease in the hydration number with temperature for all the concentrations studied can be attributed to the inverse effect of solubility on these copolymers with temperature. The CMTs are easily detectable here with a more abrupt decrease, which could be due to the compaction of the PPO blocks, becoming less susceptible with increasing concentration. As in the previous results, it can be observed how the dehydration corresponding to concentrations starting from 50 wt.% is linear with respect to temperature, showing no change until before the CMT.
It is noticeable that as the PPO/PEO ratio increases among the three copolymers, more values of the hydration number become negative. This is due to what was already discussed in the section on sound velocity results, as the higher concentrations cross the water line due to high molecular interactions [39].
The hydration numbers are plotted as a function of the copolymer molality in Figure 5b for 17R4/water and in Figure S5 of the Supplementary Material for 10R5/water and 31R1/water systems. It can again be seen how they decrease with increasing concentration and temperature. It is also much more evident that an inflection point exists in the behavior of the profiles at a concentration of about 50 wt.% for the three systems. By performing the nonlinear fit (Eq. 6) proposed by Figueroa – Ochoa [39] and indicated by the dotted lines in each set of experimental data, it is possible to determine the hydration numbers at infinite dilution, which is an approximation of the number of hydrogen molecules bound to a single copolymer molecule. All measured temperatures (6-70°C) were used, resulting in 65 nonlinear fits for each system. From these fits, the values a, b, and c of equation 6 were obtained, where a + c is the value of nH at infinite dilution (nH0).
Figure 6a shows the Arrhenius-type plot of the infinite solvation hydration number (nH0) as a function of temperature. Note the presence of three linear zones in the three systems. The first transition has its transition points at temperatures of 48, 21, and 11°C for systems 10R5, 17R4, and 31R1, respectively. However, these changes in slope must be analyzed with a proper approach because they are very weak due to their reduced ability to form structures. The second transition is associated with phase separation, where an abrupt decrease in hydration numbers is observed at temperatures of 64, 45, and 25°C for the 10R5, 17R4, and 31R1 systems, respectively. By analogy with the van’t Hoff equation for a chemical reaction, it is possible to obtain the dehydration energies, whose magnitudes are presented in Table 2, together with the pre-exponential factor α and the R2 of each linear fit.
According to the analysis of Aeberhardt et al. [53], in order to obtain an approximation of the magnitude of the hydration numbers, it is necessary to make a count of the sites where the copolymer molecule can interact with the water molecules through hydrogen bonds. According to this proposal, it is evident that the number of sites is closely related to the number of oxygen molecules (nO) that make up the structure of each copolymer. They obtained an excellent correlation between nO and nH0 for different carbohydrates, suggesting that this can be extrapolated to an even larger number of oxygen sites. Thus, the following numbers can be easily obtained by counting the oxygen units: 40, 54, and 61 for 10R5, 17R4, and 31R1, respectively. We took a temperature of 10°C so that the systems are below the CMT. In addition, the points corresponding to P103 [45] and P104 [39] were added with 95 and 116 oxygen units, respectively. Figure 6b shows a good correlation between RP and DP, as indicated by a logarithmic line fit, ln nH0 = 1.299 ln nO, at a temperature of 10°C.
3.5. Surface Tension
Figure 7a shows the semi-static surface tension of 17R4/water system as a function of temperature. The same graph for 10R5/water and 31R1/water systems can be found in Figure S6 of the Supplementary Material. It can be seen that the surface tension decreases with both concentration and temperature, with a lower slope with increasing concentration. A change in the slope of the surface tension occurs at temperatures that coincide with the transitions detected in the density and sound velocity. Above this temperature, the surface tension reaches an almost constant value, independent of concentration, of approximately 30 mN/m for the 10R5/water and 17R4/water systems and 32 mN/m for the 31R1/water system. This is because the increase in the number of copolymer molecules present in the solution is compensated by an increase in the number of structures, so that the activity of the copolymer in the solution remains almost constant, and therefore the surface tension reaches a value that changes very little with increasing concentration [54]. The irregular behavior of the 31R1 system is due to homogeneity errors in the sample, since the cloud point is reached quickly after the surface tension reaches the plateau.
The analysis of this parameter was also performed by concentration (Figure S7 in the Supplementary Material), where, in general, it can be observed how the surface tension decreases linearly with respect to the logarithm of the concentration. Wanka et al. [55] also observed a linear decrease with concentration for DP P104, P123, and P127. The Gibbs adsorption isotherm (equations 7 and 8) can be used to determine the area occupied per molecule at the air-water interface, which is U-shaped to avoid contact between the PPO blocks and the water.
The structure of a 4-unit chain of propylene oxide was drawn and optimized using Avogadro software [56]. This was done to approximate the volume of the molecule to a cylinder. Due to the sp3 hybridization of the carbons, the methyl groups that characterize propylene oxide can assume four different orientations when the molecule is viewed transversely. Thus, it can be said that the radius of this cylinder is approximately equal to the distance from the center of the main chain to where the methyl groups end. Thus, a theoretical radius of 3.3 Armstrong was found, and a total area of about 68 Å2, considering both ends of PPO.
The experimental values of the area occupied per molecule are shown in Figure 7b. It can be observed that the area occupied by the three copolymers shows a slightly increasing linear behavior with respect to temperature up to the approximate value of the CMT: 53°C for 10R5, 37°C for 17R4, and 23°C for 31R1. The reason why they show a slightly larger area than that calculated with the molecular model is due to possible entanglements at the water-air interface. In fact, according to Goswami et al. [57], these differences are attributed to an adsorption barrier due to the change in configuration of the copolymer at the interface. It is known that the zigzag pattern proposed for short chains is less likely to exist as the chain length increases.
These values are in agreement with those obtained by other authors for DP. For example, Alexandridis et al. [54] obtained areas of 40 Å2 for P123 and 152 Å2 for F108. Similarly, Prasad et al. [58] obtained values of 64 Å2 for L62 and 146 Å2 for L44. However, in both works, it was found that the increase in these areas is directly related to the amount of PEO, and that increases in PPO cause a decrease in area due to their folding at the interface. The results obtained here contradict these conclusions, as the area increases with the increase in PPO. A possible explanation is the different configuration of the chains at the water-air interface. DP adopt an inverted “U” shape at the surface because the central part is hydrophobic, whereas RP are arranged in a “U” shape due to the hydrophobic ends. Naskar et al. [18], who calculate this parameter for 10R5 using a different method, come to a similar conclusion. They mention that it is easier for DP to fold its central PPO block than for the two PPO blocks in the inverses to fold due to steric issues.
3.6. Dynamic Light Scattering
The size distributions allowed us to find the concentration and temperature ranges at which the flower-like micelles form. Figure 8a shows the apparent hydrodynamic diameter of the 10R5/water system for concentrations of 15 and 20% by weight at 60°C. It can be observed that the curve for 15% shows a peak of less than 10 nm corresponding to the dispersed monomer, which disappears at the 20% concentration. The same happens when the temperature analysis is carried out. Figure 8b shows the diameters of the 17R4/water system for temperatures of 40 and 43°C at a concentration of 15% by weight.
The 31R1/water system and concentrations below 15% of 10R5/water and 17R4/water were not suitable for measurement by this method because the polydispersity was too high and the results were not reproducible. According to the above results, there is only a cloudy transition in these samples, most likely due to the presence of random networks. Presumably, flower-like micelles are formed only by the 10R5 and 17R4 systems in the semi-dilute regime, which are quite stable with temperature, since they show no hysteresis in increasing and decreasing temperature sweeps with the same sample (Figure S8 in the Supplementary Material).
By determining the chain size of the 10R5 copolymer chain using the Avogadro software, an approximate extension of 14.1 nm can be obtained. This value is consistent with the values of 14.07 ± 0.15 nm and 16.46 ± 0.51 nm for the 15 and 20% concentrations, respectively, at 60°C. These values differ significantly from those reported in the literature for this system. Naskar et al. [18] and Larrañeta and Isasi [19] reported hydrodynamic radii around 3 nanometers. Most likely, they are reporting the size of the folded unimers, not flower-like micelles. In fact, it has been reported that the copolymer 10R5 does not form spherical micelles over the entire concentration and temperature range, and this inability has been attributed to the short length at the PPO ends. Here we demonstrate for the first time that this system has the ability, albeit small, to form micelles with this morphology.
Similarly, for the 17R4 copolymer, an approximate chain length of 19.2 nm was obtained. This value again agrees with the micellar diameters of 22.24 ± 0.66 nm and 24.56 ± 1.41 nm for the 15 and 20% concentrations, respectively, at 40°C. The reason why this diameter differs more from the calculated one compared to the 10R5 system may be due to the fact that this other system can form more hydrogen bonds, thereby obtaining a larger hydrodynamic diameter. This size differs from that reported for this system by Zhou and Chu [21], who report a hydrodynamic radius of 4 nm. However, various authors report an approximate hydrodynamic radius of 10 nm for the L64 copolymer, the counterpart of 17R4 in its direct form, a value that is consistent with the one obtained here [59,60].
3.7. Rheometry
The rheological behavior of these systems is straightforward. Figure 9a shows the frequency sweep of the 17R4/water system at 30% concentration at various temperatures at 40% strain. All measurements are within the linear viscoelastic zone, the range of which is quite large. In general, the behavior for the three systems has a slope of 1 in the G’’ modulus, while the G’ modulus acquires correct values with a slope of 2 only at high frequencies. This indicates a predominantly viscous behavior. No crossover between the moduli is observed at any point.
It is noteworthy that the modulus of elasticity G’ remains practically constant with respect to temperature and concentration. In fact, the difference between G’ and G’’ becomes larger with increasing concentration and smaller with increasing temperature. This is due to the viscous dominance of the systems over the whole range studied. Even the values of G’ are almost at the lower limit of the measurement at low frequencies. All this indicates that all three systems behave as viscous liquids over the entire range studied.
Figure 9b illustrates the viscosity behavior of the 17R4/water system at 30 wt.% concentration at various temperatures. The filled symbols correspond to the dynamic viscosity |η*|, the empty symbols correspond to the shear viscosity determined by rheometry (η), and the crossed symbols correspond to the same but determined in a ball drop viscometer (ηs). The complete viscometry temperature sweeps of the three systems are shown in Figure S9 of the Supplementary Material. It is clear that all three results are statistically equal and satisfy the Cox - Merz rule, which is not very common for associative polymers [61]. The fulfillment of this rule indicates that the copolymer chains are organized in such a way that their behavior in dynamic and static conditions is very similar, despite the different deformation conditions.
As expected, the viscosity, presumably Newtonian, decreases with temperature and increases with concentration (shown in Figure S9 Supplementary Material). However, it can be observed that from 30 to 40°C the viscosity remains almost constant. This is in agreement with the previous results, since it is in this temperature range that aggregation takes place. This superposition also occurs in the G’ modulus in the frequency sweep. This information is interesting because, despite the presence of aggregation, the rheological properties do not change abruptly, instead, they remain constant. The above can be visualized more clearly in Figure 9c, where tan(δ) is plotted as a function of temperature at different concentrations of the 17R4/water system. This relationship is maintained throughout the interval above 1, confirming that G’ is always higher and that the system is predominantly viscous. In addition, temperatures are shown where the decrease of this parameter is almost constant until before the cloud point (dotted line). These points correspond to those obtained with the previous methods, and again, the trend changes from the 50% concentration onwards, as the tan(δ) of the higher concentrations almost overlap. There is an overlap between the 60% and 90% concentrations, but this is influenced by the fact that the 60% sample separates into two phases. One possible explanation for the very similar values of tan(δ) in this interval is crowding due to the larger structure.
All the results discussed so far show peculiarities starting at a concentration of 50%. Mortensen el al. [25] found a decrease in the elastic and viscous moduli for the 25R8 system around this concentration, maintaining a viscous liquid behavior above certain temperatures with a practically constant G’ value. The SANS researchers found the presence of micellar networks in this zone. This network consists of spherical micelles share PPO blocks from core to core, connecting them. This is probably the reason why no complex behavior is observed in these networks. Furthermore, they mention that the viscosity of these networks is Newtonian when analyzed in single shear and that they remain transparent liquids over the entire temperature range; thus, our results are in full agreement. The 10R5/water and 31R1/water systems show similar behavior to that already presented (Figures S10 and S11 in the Supplementary Material).
3.8. Analysis by Concentration
To confirm the presence of other types of aggregates at high concentrations, plots such as those shown in Figure 10 were used. It shows an example of the concentration analysis of density, sound velocity, viscosity and molar volume at the 10 and 30°C isotherms for the 17R4 copolymer. The same analyses for the 10R5/water systems at 20 and 40°C and for 31R1/water at 6 and 15°C are shown in Figures S12 and S13 of the Supplementary Material.
At the 10°C isotherm, three main zones are observed. In zone 1, the characteristic cloudy coloration of the solutions of this copolymer is observed in the unimers zone, also reported by Huff et al. [20]. In addition, the sound velocity changes linearly with concentration up to 30%, where the change in slope begins, reaches a maximum value, and then starts to decrease, corresponding to zone II. This parameter returns to a negative linear slope with respect to concentration from 50% (zone III) and corresponds precisely to the concentration at which the samples no longer exhibit visual changes. It has been shown that sonic velocity depends linearly on the number of particles in the solution [62], so that such a behavior, following the logic of temperature analysis, indicates the presence of larger aggregates. These changes occur at the same concentrations in density, viscosity, and molar volume results: the increase in density changes the slope, the viscosity increases abruptly, and the molar volume shows distinct linear zones. These zones divide the transitions in the order “unimers - unimers and micellar networks - micellar networks”.
In the 30°C isotherm, different transitions are observed due to the more pronounced changes in slope, which are particularly noticeable in the molar volume. In zone I, a cloudy solution is observed with increasing concentration below 20% by weight; this coloration corresponds to that acquired by the copolymer solutions in the unimer zone. Between 20 and 30%, the first changes in the slope of the four properties analyzed are observed; this zone II coincides with the formation of random networks detected in the temperature analysis. Between 30 and 50% by weight, zone III appears, which also coincides with the temperature analysis carried out for the spherical micelles, along with the transition to transparent solutions. Up to 50% by weight, another change in the slope occurs, very similar to the previous ones, which is attributed to the formation of micellar networks (zone IV). This behavior was also observed by Mortensen et al. [25] in very similar concentration ranges for the 25R8 system.
The molar volume behavior is the most notable. González – Perez et al. [63] found similar behavior for alkyl dimethyl benzyl ammonium chloride surfactants varying the hydrophobic chain. The researchers attributed the first increase to the increasing volume of the micelles until an almost constant value was reached. Above certain concentrations, they detected another slight increase, which they attributed to the micellar transition from spheres to cylinders. For the three systems analyzed here, the first increase, which occurs from 1 to 10% concentration (zone I of both isotherms), is likely due to the increasing amount of unimers, and the second is clearly due to a change in structure to a larger size.
3.9. Phase diagrams
With the complete analysis described above, a total of 6 possible conformations were detected: unimers, random networks, flowers and unimers, flowers only, micellar networks, and unimers and micellar networks only. These are shown and listed in Figure 11, together with the phase diagrams of the three systems. In addition, the phase separation is represented by 2ϕ, and the gel behavior of the pure copolymers 10R5 and 17R4 is represented by P. The points obtained here correspond to an average between the transition temperatures and concentrations obtained in all the methods and calculations. The standard deviation in temperature or concentration is also provided, depending on the method of analysis.
The factors taken into account to identify the phase corresponding to each of the transitions are the following, whose drawings are shown in Figure 11a:
- I.
- Unimers: visually transparent with high polydispersity and monotonous physicochemical properties.
- II.
- Random networks: visually opaque with minor changes in viscosity, density, and sound velocity.
- III.
- Flower-like micelles and unimers: optically transparent with significant changes in viscosity.
- IV.
- Flower-like micelles: visually similar to zone III. Zones III and IV are distinguished by DLS size distributions.
- V.
- Micellar networks and unimers: Visually transparent and with abrupt changes in density, sound velocity, viscosity, and molar volume when analyzed by concentration.
- VI.
- Micellar networks: Visually similar to Zone V. Zone V and VI can be distinguished by the beginning and end of the transition development as shown in Figure 10.
Figure 11b shows the phase diagram of the 10R5/water system. This is very similar to the wedge shape reported by Naskar et al. [18] at low concentrations, but our values differ by almost 10°C. This difference can be attributed to the copolymer manufacturer. They also note that this system only forms random networks in this range. Larrañeta and Isasi [19] also report a phase diagram for this system that differs significantly from Naskar’s and the one reported here. This is most likely because they only used DLS and visual observations as a characterization method. Nevertheless, their diagram agrees with the one obtained in this work for the formation of micellar networks above the 50 wt.% concentration.
The phase diagram of the 17R4/water system is shown in Figure 11c, whose CMT behavior and magnitudes are in good agreement with those reported by Huff et al. [22] and Zhou and Chu [21]. In both works, the researchers identify only the flower-like micelle zone, as they consider that random networks are not a structure and do not strictly correspond to the CMT. Therefore, there is a contradiction between authors as to what is called CMT for these systems. In the present work, we identify it as the temperature at which the PPO block becomes insoluble, i.e., also considering random networks. It should be noted that this system has the PPO/PEO ratio that favors mycelization in RP.
The phase diagram of the 31R1/water system is shown in Figure 11d. In this system, flower-like micelles do not exist due to the short length of the central PEO block, making it very difficult for a stable micellar structure to form. This diagram is similar to the phase diagram of the 25R8-deionized water system by Mortensen et al. [25], as they also find that only random networks and micellar networks exist.
Several factors are notable when analyzing the three plots together. Notably, the micellar networks are observed at approximately the same 50% concentration. In addition, the clear effect of increasing the PPO/PEO ratio can be observed as 10R5 represents the hydrophilic end and 31R1 represents the hydrophobic end. In both cases, the formation of flower-like micelles is disfavored: in 10R5 due to its short PPO arms and 31R1 due to its short PEO center. It is also noteworthy that the CMTs and CPs are inversely proportional to the PPO/PEO ratio, since these transitions occur at lower temperatures as the latter increases. Finally, it is interesting to analyze the phase diagrams of copolymers 10R5 and 17R4 independently, as both contain almost the same number of PEO units (22 and 24, respectively), thereby demonstrating the strong effect of increasing PPO arms on flower formation.
4. Conclusions
In this work, the phase and rheological behavior of three inverted Pluronics with different PPO/PEO ratios in aqueous solution were analyzed: [(PPO)8–(PEO)22–(PPO)8], 17R4 [(PPO)14–(PEO)24 –(PPO)14] and 31R1 [(PPO)26–(PEO)7–(PPO)26]. This was achieved though visual observation, densimetry, sound velocity measurement, viscometry, tensiometry, dynamic light scattering, and rheometry. The differences in the PPO/PEO ratio and its effect on the solubility and micellization capacity of the surfactants are evident in each of the experiments performed. It was observed, as expected, that the dehydration temperatures of PPO (micellization) and PEO (phase separation) decrease with increasing PPO/PEO ratio. System 10R5/water having transitions at higher temperatures, while 31R1/water showed transitions at temperatures below room temperature.
For systems 10R5 and 17R4, a zone of random networks was found at low concentrations, a zone of flower-like micelles at medium concentrations and a zone of micellar networks of interconnected flowers at high concentrations, with system 17R4 being the one with the highest capacity to form flower-like micelles due to its balanced ratio between PEO and PPO. For system 31R1, only a zone of random networks was found at low and medium concentrations, and another zone of micellar networks at high concentrations, attributing the null capacity to form stable flowers to the short length of its central hydrophilic block.
The diagrams of the 10R5 and 17R4 systems in aqueous solutions have been extended over a wider concentration and temperature range than previously reported in the literature. This was achieved by completely different characterization methods, providing new insights into the behavior of these systems. In addition, a phase diagram for the 31R1 copolymer is presented for the first time.
Supplementary Materials
The following supporting information can be downloaded at the website of this paper posted on Preprints.org. Figure S1: Visual tests of the three systems obtained by direct observation. The lines represent the temperature at which the color change is observed C = clear, T = turbid, B = bluish, G = gel, 2ϕ = 2 phases, Figure S2: Derivative of sound velocity versus temperature of the 10R5/water system from visual observations. Concentrations in weight %: (a) 1 (──), 5 (──), (b) 10 (──) y 20 (──), Figure S3: Derivative of sound velocity versus temperature of the 31R1/water system from visual observations. Concentrations in weight %: (a) 1 (──), 5 (──), (b) 10 (──) y 20 (──), Figure S4: Apparent molar volume as a function of temperature of a)10R5/water and b) 31R1/water. Apparent molar adiabatic compressibility as a function of temperature of c)10R5/water and d) 31R1/water. The measurements being made at the concentrations in weight percent of: : 1 (□), 3 (○), 5 (△), 10 (▽), 15 (⬠), 20 (◇), 30 (◁), 40 (▷), 50 (☆), 60 (⎔) y 80 (✳), Figure S5: Hydration number as a function of temperature of a)10R5/water and b) 31R1/water.; measurements at the concentrations in weight % of: : 1 (□), 3 (○), 5 (△), 10 (▽), 15 (⬠), 20 (◇), 30 (◁), 40 (▷), 50 (☆), 60 (⎔) y 80 (✳). Hydration number as a function of concentration of c)10R5/water and d) 31R1/water. Figure S6: Semi-static surface tension as a function of temperature of a)10R5/water and b) 31R1/water at concentrations in weight % of: 0 (──), 1 (─□─), 2 (─☆─), 3 (─○─), 5 (─△─), 7 (─✳─), 10 (─▽─) and 20 (─◇─), Figure S7: Semi-static surface tension as a function of concentration and its linear fit, Figure S8: Increasing and decreasing temperature sweep for 10R5/water at concentrations of: a) 15 and b) 20 wt.%. 17R4/water at concentrations of: c) 15 y d) 20 wt. %, Figure S9: Viscosity as a function of reciprocal of temperature: (a) 10R5/water, (b)17R4/water y (c) 31R1/water. Measurements at concentrations in weight % of: 0 (──), 1 (□), 3 (○), 5 (△), 10 (▽), 15 (⬠), 20 (◇), 30 (◁), 40 (▷), 50 (☆), 60 (⎔) y 80 (✳), Figure S10: Rheometry of the 10R5/water system, (a) moduli G’ and G’’ as a function of frequency at 40% strain, (b) dynamic and shear viscosity (rheometry and viscometry) as a function of frequency and shear rate, (c) tan(δ) as a function of temperature, Figure S11: Rheometry of the 31R1/water system, (a) moduli G’ and G’’ as a function of frequency at 40% strain, (b) dynamic and shear viscosity (rheometry and viscometry) as a function of frequency and shear rate, (c) tan(δ) as a function of temperature. Figure S12: Example of analysis by concentration of the 10R5/water system: (a) 20°C and (b) 40°C. Property measurements: density (─□─), sound velocity (─○─), molar volume (─△─) and viscosity (─▽─), Figure S13: Example of analysis by concentration of the 31R1/water system: (a) 6°C and (b) 15°C. Property measurements: density (─□─), sound velocity (─○─), molar volume (─△─) and viscosity (─▽─).
Author Contributions
Conceptualization, E.R.M.-B. and J.F.A.S.-M.; methodology, A.A.-R., C.A.M.-C., V.V.A.F.-E., and R.O.-C.; software, A.A.-R. and G.L.-G.; validation, J.F.A.S.-M., Y.R. and E.R.M.-B.; formal analysis, A.A.-R., G.L.-G.; investigation, A.A.-R.; resources, J.F.A.S.-M., V.V.A.F.-E., and E.R.M.-B.; data curation, A.A.-R., E.R.M.-B., and G.L.-G.; writing—original draft preparation, A.A.-R.; writing—review and editing, A.A.-R., E.R.M.-B., and G.L.-G.; visualization, E.R.M.-B.; supervision, E.R.M.-B., and J.F.A.S.-M.; project administration, E.R.M.-B., and J.F.A.S.-M.; funding acquisition, J.F.A.S.-M. All authors have read and agreed to the published version of the manuscript.
Funding
This research was funded by SECIHTI, CVU number 1243505.
Institutional Review Board Statement
Not applicable.
Data Availability Statement
Data can be found in the figures from the manuscript.
Acknowledgments
A.A.-R. acknowledges the scholarship granted by SECIHTI from México.
Conflicts of Interest
The funders had no role in the design of the study; in the collection, analyses, or interpretation of data; in the writing of the manuscript; or in the decision to publish the results.
References
- Kesisoglou, F.; Wu, Y. Understanding the effect of API properties on bioavailability through absorption modeling. AAPS J 2008, 10(4), 516–525. [CrossRef]
- Chavda, H. V.; Patel, C. N.; Anand, I. S. Biopharmaceutics classification system. Systematic Reviews in Pharmacy 2010, 1(1), 62–69. [CrossRef]
- Malmsten, M. Surfactants and polymers in drug delivery. In Drugs and the pharmaceutical sciences, 1st ed.; Marcel Dekker: New York, USA, 2002; Volume 122, pp. 1–49. ISBN: 9780824743758.
- Garg, S.; Peeters, M.; Mahajan, R. K.; Singla, P. Loading of hydrophobic drug silymarin in pluronic and reverse pluronic mixed micelles. J Drug Deliv Sci Tech, 2022, 75, p. 103699. [CrossRef]
- Raval, A.; Pillai, S. A.; Bahadur, A.; Bahadur, P. Systematic characterization of Pluronic® micelles and their application for solubilization and in vitro release of some hydrophobic anticancer drugs. J Mol Liq, 2017, 230, 473-481. [CrossRef]
- Schmolka, I. R. A Review of Block Polymer Surfactants. J Am Oil Chem Soc 1977, 54(3), 110–116. [CrossRef]
- Zhang, K.; Khan, A. Phase Behavior of Poly(ethylene oxide)-Poly(propylene oxide)-Poly (ethylene oxide) Triblock Copolymers in Water. Macromolecules 1995, 28(11), 3807–3812. [CrossRef]
- Almgren, M.; Brown, W.; Hvidt S. Self-aggregation and phase behavior of poly(ethylene oxide )-poly(propylene oxide)-poly(ethylene oxide) block copolymers in aqueous solution. Colloid Polym Sci 1995, 273, 2–15. [CrossRef]
- Jiang, R.; Jin, Q.; Li, B.; Ding, D.; Shi, A. C. Phase diagram of poly(ethylene oxide) and poly(propylene oxide) triblock copolymers in aqueous solutions. Macromolecules 2006, 39(17), 5891–5896. [CrossRef]
- Alexandridis, P.; Holzwarth, J. F.; Hatton, T. A. Micellization of Poly(ethylene oxide)-Poly(propylene oxide)-Poly(ethylene oxide) Triblock Copolymers in Aqueous Solutions: Thermodynamics of Copolymer Association. Macromolecules 1994, 27(9), 2414–2425. [CrossRef]
- Wang Q.; Li, L.; Jiang S. Effects of a PPO-PEO-PPO triblock copolymer on micellization and gelation of a PEO-PPO-PEO triblock copolymer in aqueous solution. Langmuir 2005, 21(20), 9068–9075. [CrossRef]
- Linse, P. Micellization of Poly(ethylene oxide)-Poly(propylene oxide) Block Copolymers in Aqueous Solution. Macromolecules 1993, 26(17), 4437–4449, 1993. [CrossRef]
- Tsui, H. W.; Wang, J. H.; Hsu, Y. H.; Chen, L. J. Study of heat of micellization and phase separation for Pluronic aqueous solutions by using a high sensitivity differential scanning calorimetry. Colloid Polym Sci 2010, 288(18), 1687–1696. [CrossRef]
- Naharros-Molinero, A.; Caballo-González, M. Á.; de la Mata, F. J.; García-Gallego, S. Direct and Reverse Pluronic Micelles: Design and Characterization of Promising Drug Delivery Nanosystems. Pharmaceutics 2022, 14(12), 2628. [CrossRef]
- Tanaka, T.; Kotaka, T.; Inagaki, H. Thermodynamic and Conformational Properties of Styrene-Methyl Methacrylate Block Copolymers in Dilute Solution. V. Light-Scattering Analysis of Conformational Anomalies in p-Xylene Solution. Polym J 1972, 3(3), 338–349. [CrossRef]
- ten Brinke, G.; Hadziioannou, G. Topological Constraints and Their Influence on the Properties of Synthetic Macromolecular Systems. 2. Micelle Formation of Triblock Copolymers. Macromolecules 1987, 20(3), 486–489. [CrossRef]
- Balsara, N. P.; Tirrell, M.; Lodge, T. P. Micelle Formation of BAB Triblock Copolymers in Solvents That Preferentially Dissolve the A Block. Macromolecules 1991, 24(8), 1975–1986. [CrossRef]
- Naskar, B.; Ghosh, S.; Moulik, S. P. Solution Behavior of Normal and Reverse Triblock Copolymers (Pluronic L44 and 10R5) Individually and in Binary Mixture. Langmuir 2012, 28(18), 7134–7146. [CrossRef]
- Larrañeta, E.; Isasi, J. R. Phase Behavior of Reverse Poloxamers and Poloxamines in Water. Langmuir 2012, 29(4), 1045–1053. [CrossRef]
- Pérez-Sánchez, G.; Vicente, F. A.; Schaeffer, N.; Cardoso, I. S.; Ventura, S. P.; Jorge, M.; Coutinho, J. A. Rationalizing the Phase Behavior of Triblock Copolymers through Experiments and Molecular Simulations. J Phys Chem C 2019, 123(34), 21224–21236. [CrossRef]
- Zhou, Z.; Chu, B. Phase Behavior and Association Properties of Poly(oxypropylene)-Poly(oxyethylene)-Poly(oxypropylene) Triblock Copolymer in Aqueous Solution. Macromolecules 1994, 27(8), 2025. [CrossRef]
- Huff, A.; Patton, K.; Odhner, H.; Jacobs, D. T.; Clover, B. C.; Greer, S. C. Micellization and Phase Separation for Triblock Copolymer 17R4 in H2O and in D2O. Langmuir 2011, 27(5), 1707–1712. [CrossRef]
- Chowdhry, B. Z.; Snowden, M. J.; Leharne, S. A. A scanning calorimetric investigation of phase transitions in a PPO-PEO-PPO block copolymer. Eur Polym J 1999, 35(2), 273–278. [CrossRef]
- D’Errico, G.; Paduano, L.; Khan, A. Temperature and concentration effects on supramolecular aggregation and phase behavior for poly(propylene oxide)-b-poly(ethylene oxide)-b-poly(propylene oxide) copolymers of different composition in aqueous mixtures. J Colloid Interface Sci 2004, 279(2), 379–390. [CrossRef]
- Mortensen, K.; Brown, W.; Jorgensen, E. Phase Behavior of Poly(propylene oxide) - Poly(ethylene oxide) - Poly(propylene oxide) Triblock Copolymer Melt and Aqueous Solutions. Macromolecules 1994, 27(20), 5654–5666. [CrossRef]
- Liu, S.; Bao, H.; Li, L. Role of PPO-PEO-PPO triblock copolymers in phase transitions of a PEO-PPO-PEO triblock copolymer in aqueous solution. Eur Polym J 2015, 71(2), 423–439. [CrossRef]
- White, J. M.; Calabrese, M. A. Impact of small molecule and reverse poloxamer addition on the micellization and gelation mechanisms of poloxamer hydrogels. Colloids Surf A Physicochem Eng Asp 2022, 638, 128246. [CrossRef]
- Alexandridis, P.; Olsson, U.; Lindman, B. Phase Behavior of Amphiphilic Block Copolymers in Water-Oil Mixtures: The Pluronic 25R4-Water-p-Xylene System. J Phys Chem 1996, 100(1), 280–288. [CrossRef]
- Patel, D. ; Vaswani, P.; Sengupta, S.; Ray, D.; Bhatia, D.; Choudhury, S. D.; Aswalm V. K.; Kuperkar, K.; Bahadur, P. Thermoresponsive phase behavior and nanoscale self-assembly generation in normal and reverse Pluronics®. Colloid Polym Sci 2022, 301, 75–92. [CrossRef]
- White, J. M.; Garza, A.; Griebler, J. J.; Bates, F. S.; Calabrese, M. A. Engineering the Structure and Rheological Properties of P407 Hydrogels via Reverse Poloxamer Addition. Langmuir 2023, 39(14), 5084–5094. [CrossRef]
- Hassanzadeh S.; Feng, Z.; Pettersson, T.; Hakkarainen, M. A proof-of-concept for folate-conjugated and quercetin-anchored pluronic mixed micelles as molecularly modulated polymeric carriers for doxorubicin. Polymer (Guildf) 2015, 74, 193–204. [CrossRef]
- Sharma, R.; Kang, T. S.; Mahajan, R. K. Complexation of triblock reverse copolymer 10R5 with surface active ionic liquids in aqueous medium: A physico-chemical study. RSC Adv 2015, 5(21), 16349–16360. [CrossRef]
- Phani Kumar, B. V. N.; Reddy, R. R.; Pan, A.; Aswal, V. K.; Tsuchiya, K.; Prameela, G. K. S.; Abe, M.; Mandal, A. B.; Moulik, S. P. Physicochemical Understanding of Self-Aggregation and Microstructure of a Surface-Active Ionic Liquid [C4mim] [C8OSO3] Mixed with a Reverse Pluronic 10R5 (PO8EO22PO8). ACS Omega 2018, 3(5), 5155–5164. [CrossRef]
- Saoudi, O.; Lasrem, A.; Ghaouar, N. Studies of the behavior of reverse nonionic surfactant Pluronic 31R1 in aqueous and Propylammonium acetate (PAAc) ionic liquid solutions. J Polym Res 2020, 27(12), 357. [CrossRef]
- Heater, K. J.; Tomasko, D. L. Processing of epoxy resins using carbon dioxide as an antisolvent. J Supercrit Fluids 1998, 14(1), 55–65. [CrossRef]
- Lin, B. J.; Zhu, H. T.; Tieu, A. K.; Kosasih, B. Y.; Triani, G. The effect of molecular structure on the adsorption of PPO-PEO-PPO triblock copolymers on solid surfaces. MSF 2014, 773–774, 670–677. [CrossRef]
- Sharma, R.; Murali, R.; Murthy, C. N. Clouding and aggregation behavior of PPO-PEO-PPO Triblock Copolymer (Pluronic®25R4) in surfactant additives environment. TSD 2012, 49(2), 136–144. [CrossRef]
- Franks, F. F.; Quickenden, M. J.; Ravenhill, J. R.; Smith, H. T. Volumetric behavior of dilute aqueous solutions of sodium alkyl sulfates. J Phys Chem 1967, 72(7), 2668–2669. [CrossRef]
- Figueroa-Ochoa, E. B.; Bravo-Anaya, L. M.; Vaca-López, R.; Landázuri-Gómez, G.; Rosales-Rivera, L. C.; Diaz-Vidal, T.; Carvajal, F., Macías-Balleza, E. R.; Rharbi, Y.; Soltero-Martínez, J. F. A. Structural Behavior of Amphiphilic Triblock Copolymer P104/Water System. Polymers (Basel) 2023, 15(11), 2551. [CrossRef]
- Ghosh, P. Colloid and Interface Science, 1st ed; PHI Learning Private Limited, New Dehli, India, 2009. ISBN: 9788120338579.
- Hassan, P. A.; Rana, S.; Verma, G. Making sense of Brownian motion: Colloid characterization by dynamic light scattering. Langmuir 2015, 31(1), 3-12. [CrossRef]
- Schmidt, R. Dynamic Light Scattering for Protein Characterization. EAC 2010. [CrossRef]
- Patel, D.; Perez-Sanchez, G.; Jorge, M.; Ray, D.; Aswal, V. K.; Kuperkar, K.; Coutinho, J. A. P.; Bahadur, P. Rationalizing the Design of Pluronics-Surfactant Mixed Micelles through Molecular Simulations and Experiments. Langmuir 2022, 39(7), 2692–2709. [CrossRef]
- Causse, J.; Lagerge, S.; de Ménorval, L. C.; Faure, S.; Fournel, B. Turbidity and 1H NMR analysis of the solubilization of tributylphosphate in aqueous solutions of an amphiphilic triblock copolymer (L64 pluronic). Colloids Surf A Physicochem Eng Asp 2005, 252(1), 51–59. [CrossRef]
- Álvarez-Ramírez, J. G.; Fernández, V. V. A.; Macías, E. R.; Rharbi, Y.; Taboada, P.; Gámez-Corrales, R.; Puig J. E.; Soltero, J. F. A. Phase behavior of the Pluronic P103/water system in the dilute and semi-dilute regimes. J Colloid Interface Sci 2009, 333(2), 655–662. [CrossRef]
- Patel, D.; Patel, D.; Ray, D.; Kuperkar, K.; Aswal, V. K.; Bahadur, P. Single and mixed Pluronics® micelles with solubilized hydrophobic additives: Underscoring the aqueous solution demeanor and micellar transition. J Mol Liq 2021, 343, 117625. [CrossRef]
- Fritz, G.; Scherf, G.; Glatter, O. Applications of Densiometry, Ultrasonic Speed Measurements, and Ultralow ShearViscosimetry to Aqueous Fluids. J Phys Chem B 2000, 104(15), 3463–3470. [CrossRef]
- Maccarini, M.; Briganti, G. Density Measurements on C12Ej Nonionic Micellar Solutions as a Function of the Head Group Degree of Polymerization (j = 5-8). J Phys Chem A 2000, 104(48), 11451–11458. [CrossRef]
- Wen, X. G.; Verrall, R. E. Temperature Study of Sound Velocity and Volume-Related Specific Thermodynamic Properties of Aqueous Solutions of Poly(ethylene oxide)-Poly(propylene oxide)-Poly (ethylene oxide) Triblock Copolymers. J Colloid Interface Sci 1997, 196(2), 215–223. [CrossRef]
- Meilleur, L.; Hardy, A.; Quirion, F. Probing the Structure of Pluronic PEO-PPO-PEO Block Copolymer Solutions with Their Apparent Volume and Heat Capacity. Langmuir 1996, 12(20), 4697–4703. [CrossRef]
- Armstrong, J. K.; Parsonage, J.; Chowdhry, B.; Leharne, S.; Mitchell, J.; Beezer, A.; Löhner, K.; Laggner, P. Scanning Densitometric and Calorimetric Studies of Poly(ethylene oxide) / Poly(propylene oxide) / Poly(ethylene oxide)Triblock Copolymers (Poloxamers) in Dilute Aqueous Solution. J Phys Chem 1993, 97(15), 3904–3909. [CrossRef]
- Eagland, D.; Crowther, N. J. Hydrophobic Interactions in Dilute Solutions of Poly(vinyl alcohol). Faraday Symp Chem Soc 1982, 17, 141–160. [CrossRef]
- Aeberhardt, K.; de Saint Laumer, J. Y.; Bouquerand, P. E.; Normand, V. Ultrasonic wave spectroscopy study of sugar oligomers and polysaccharides in aqueous solutions: The hydration length concept. Int J Biol Macromol 2005, 36(5), 275–282. [CrossRef]
- Alexandridis, P.; Athanassiou, V.; Fukuda, S.; Hatton, T. A. Surface Activity of Poly(ethylene oxide)-block-Poly(propylene oxide)-block-Poly(ethylene oxide) Copolymers. Langmuir 1994, 10(8), 2604–2612. [CrossRef]
- Wanka, G.; Hoffmann, H.; Ulbricht, W. The aggregation behavior of poly-(oxyethylene)-poly-(oxypropylene)- poly-(oxyethylene)-block-copolymers in aqueous solution. Colloid Polym Sci 1990, 268, 101–117. [CrossRef]
- Hanwell, M. D.; Curtis D. E.; Lonie, D. C.; Vandermeersch, T.; Zurek, E.; Hutchison, G. R. Avogadro: An advanced semantic chemical editor, visualization, and analysis platform. J Cheminform 2012, 4(17), 1-17. [CrossRef]
- Goswami, A.; Verma, G.; Hassan, P. A.; Bhagwat, S. S. Equilibrium and Dynamic Surface Tension Behavior of Triblock Copolymer PEO-PPO-PEO in Aqueous Medium. J Dispers Sci Technol 2015, 36(6), 885–891. [CrossRef]
- Prasad, K. N.; Luong, T. T.; Florence A. T.; Paris, J.; Vaution, C.; Seiller, M.; Puisieux, F. Surface Activity and Association of ABA Polyoxyethylene-Polyoxypropylene Block Copolymers in Aqueous Solution. J Colloid Interface Sci 1979, 68(2), 225–232. [CrossRef]
- Jebari, M. M.; Ghaouar, N.; Aschi, A.; Gharbi, A. Aggregation behaviour of Pluronic® L64 surfactant at various temperatures and concentrations examined by dynamic light scattering and viscosity measurements. Polym Int 2006, 55(2), 176–183. [CrossRef]
- Yang, L.; Alexandridis, P.; Steytler, D. C.; Kositza, M. J.; Holzwarth, J. F. Small-angle neutron scattering investigation of the temperature-dependent aggregation behavior of the block copolymer Pluronic L64 in aqueous solution. Langmuir 2000, 16(23), 8555–8561. [CrossRef]
- Bromberg, L. Self-Assembly in Aqueous Solutions of Polyether-Modified Poly(acrylic acid). Langmuir 1998, 14(20), 5806–5812. [CrossRef]
- Glatter, O.; Scherf, G.; Schillén, K.; Brown, W. Characterization of a Polyethylene oxide)-Poly(propylene oxide) Triblock Copolymer (EO27-PO39-EO27) in Aqueous Solution. Macromolecules 1994, vol. 27(21), 6046–6054. [CrossRef]
- González-Pérez, A.; Czapkiewicz, J.; del Castillo, J. L.; Rodríguez, J. R. Micellar properties of long-chain alkyldimethylbenzylammonium chlorides in aqueous solutions. Colloids Surf A Physicochem Eng Asp 2001, 193(1-3), 129–137. [CrossRef]
Figure 1.
Chemical structure and nomenclature of reverse Pluronics. Adapted from [6].
Figure 1.
Chemical structure and nomenclature of reverse Pluronics. Adapted from [6].
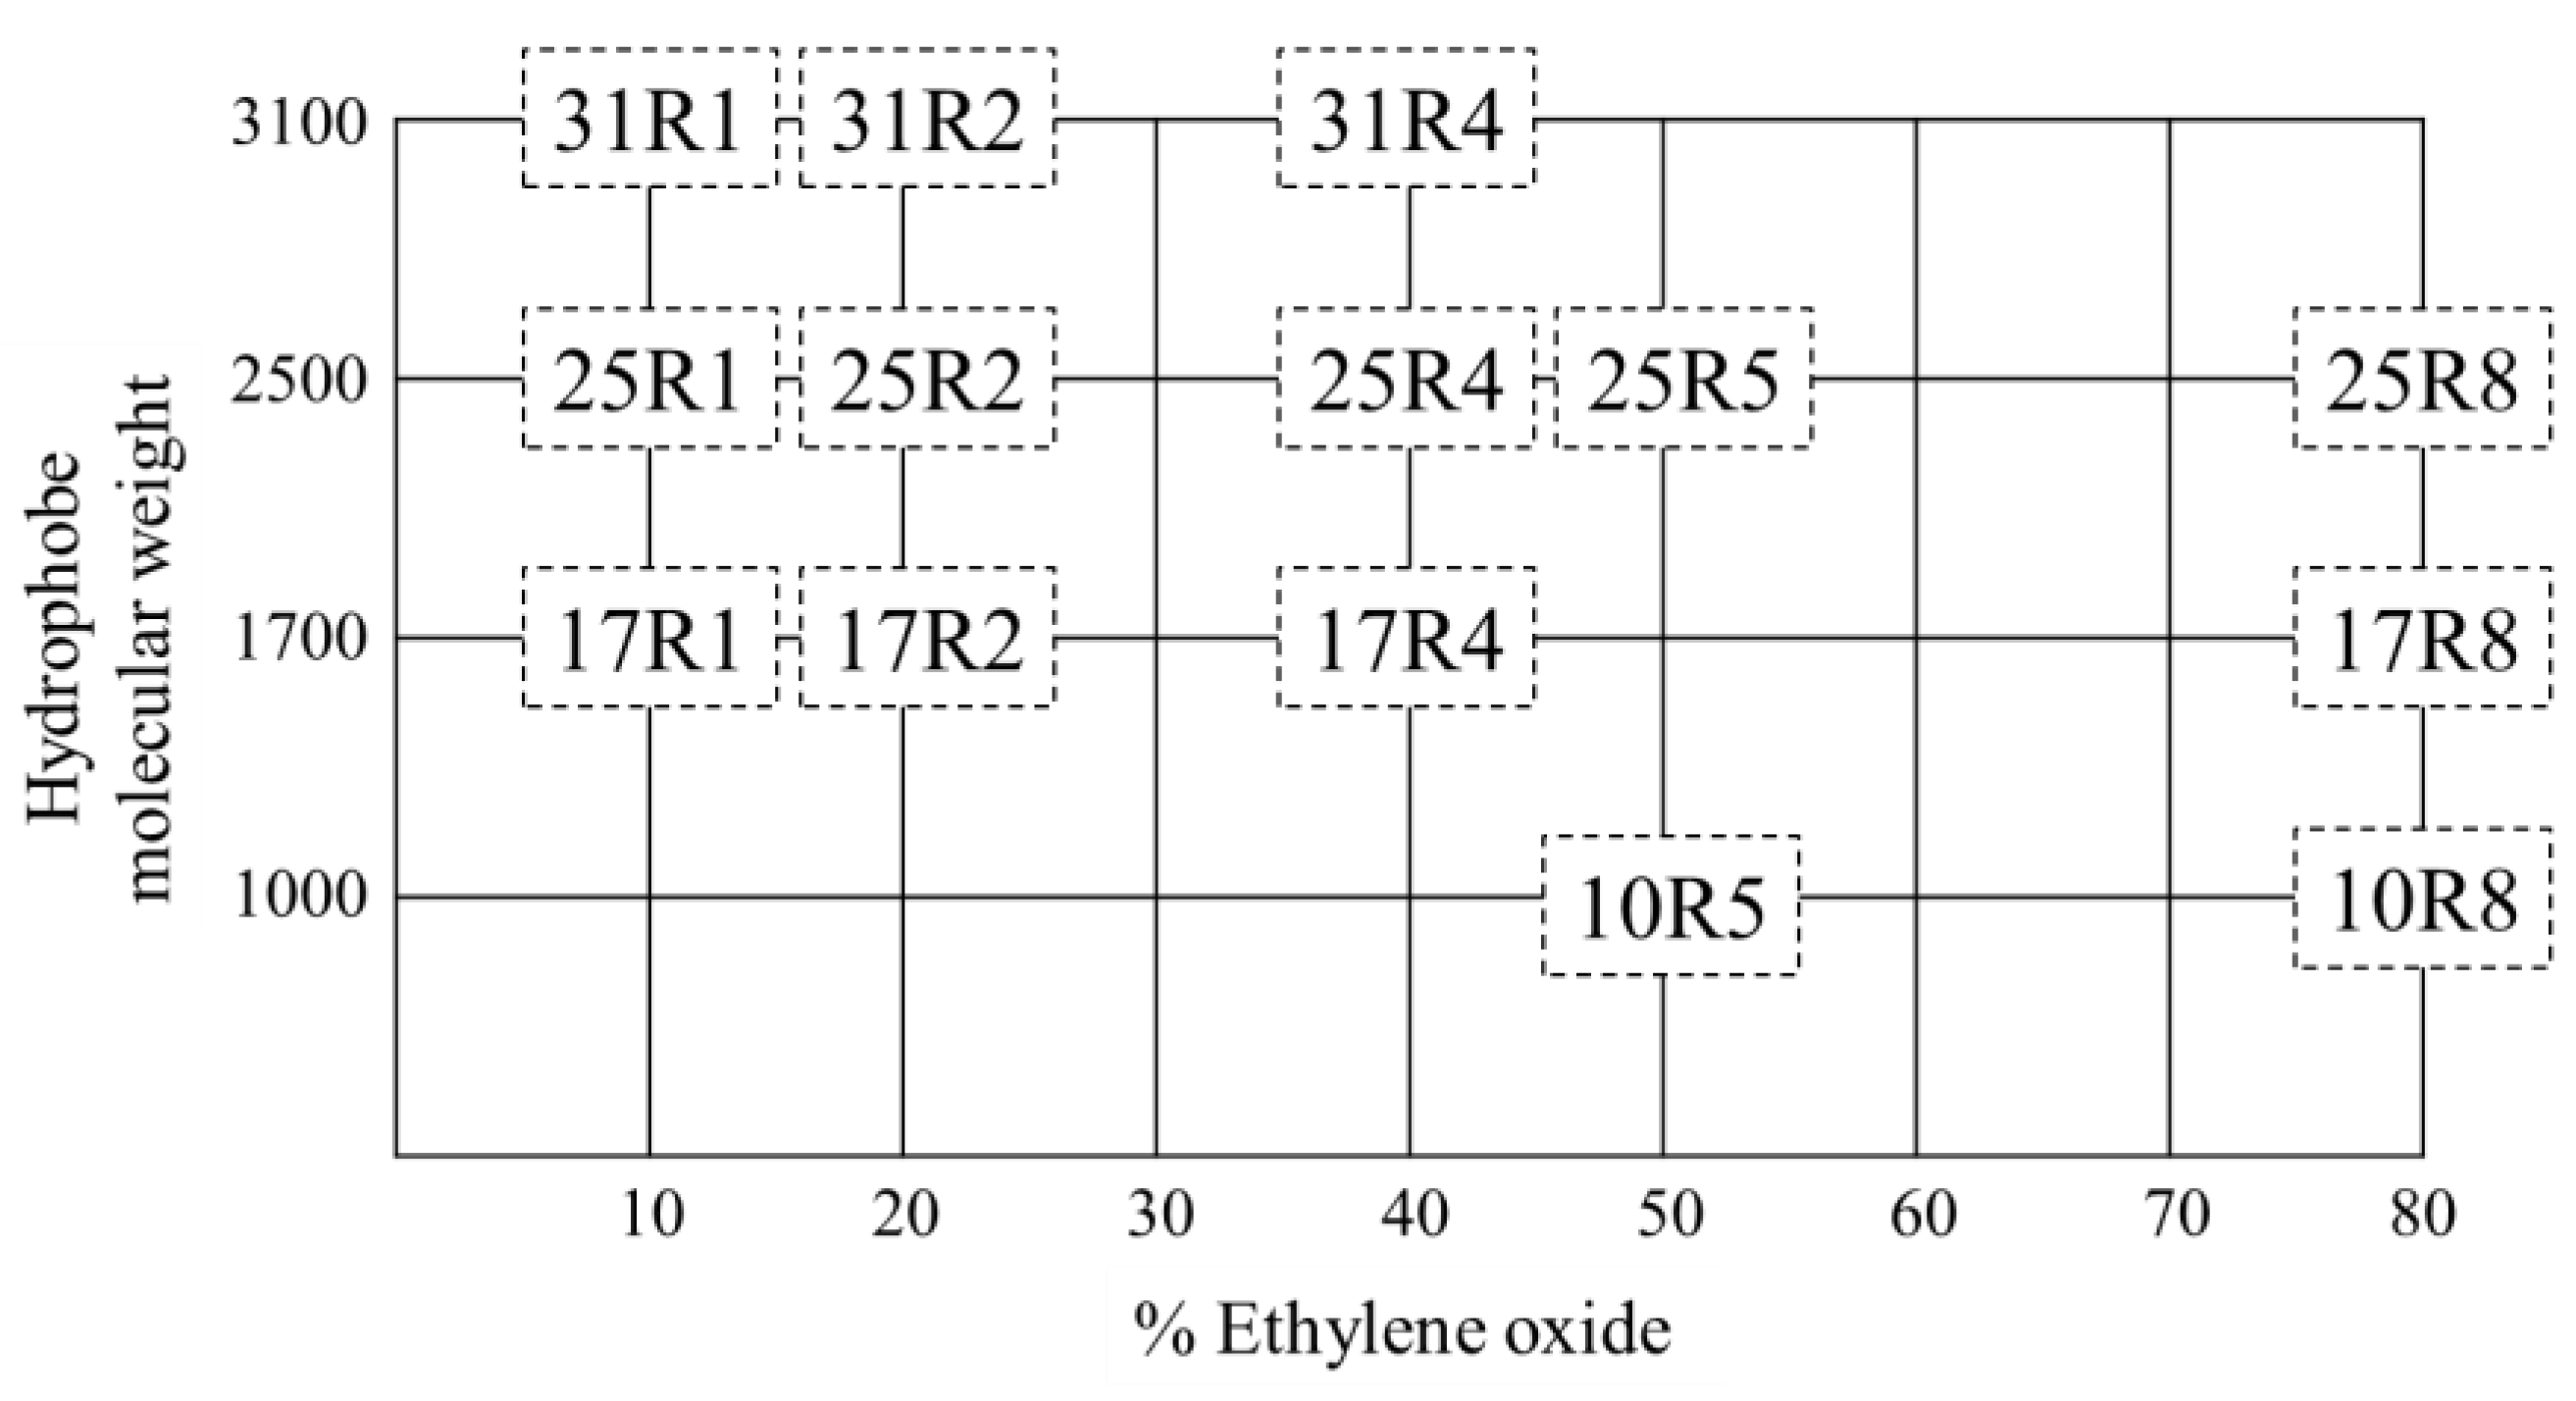
Figure 2.
Density as a function of temperature of: a) 10R5/water, b) 17R4/water, and c) 31R1/water; and sound velocity as a function of temperature of: d) 10R5/water, e) 17R4/water, and f) 31R1/water. Concentrations in weight percent: 0 (──), 1 (□), 3 (○), 5 (△), 10 (▽), 15 (⬠), 20 (◇), 30 (◁), 40 (▷), 50 (☆), 60 (⎔), 80 (✳) and 100 (╍╍).
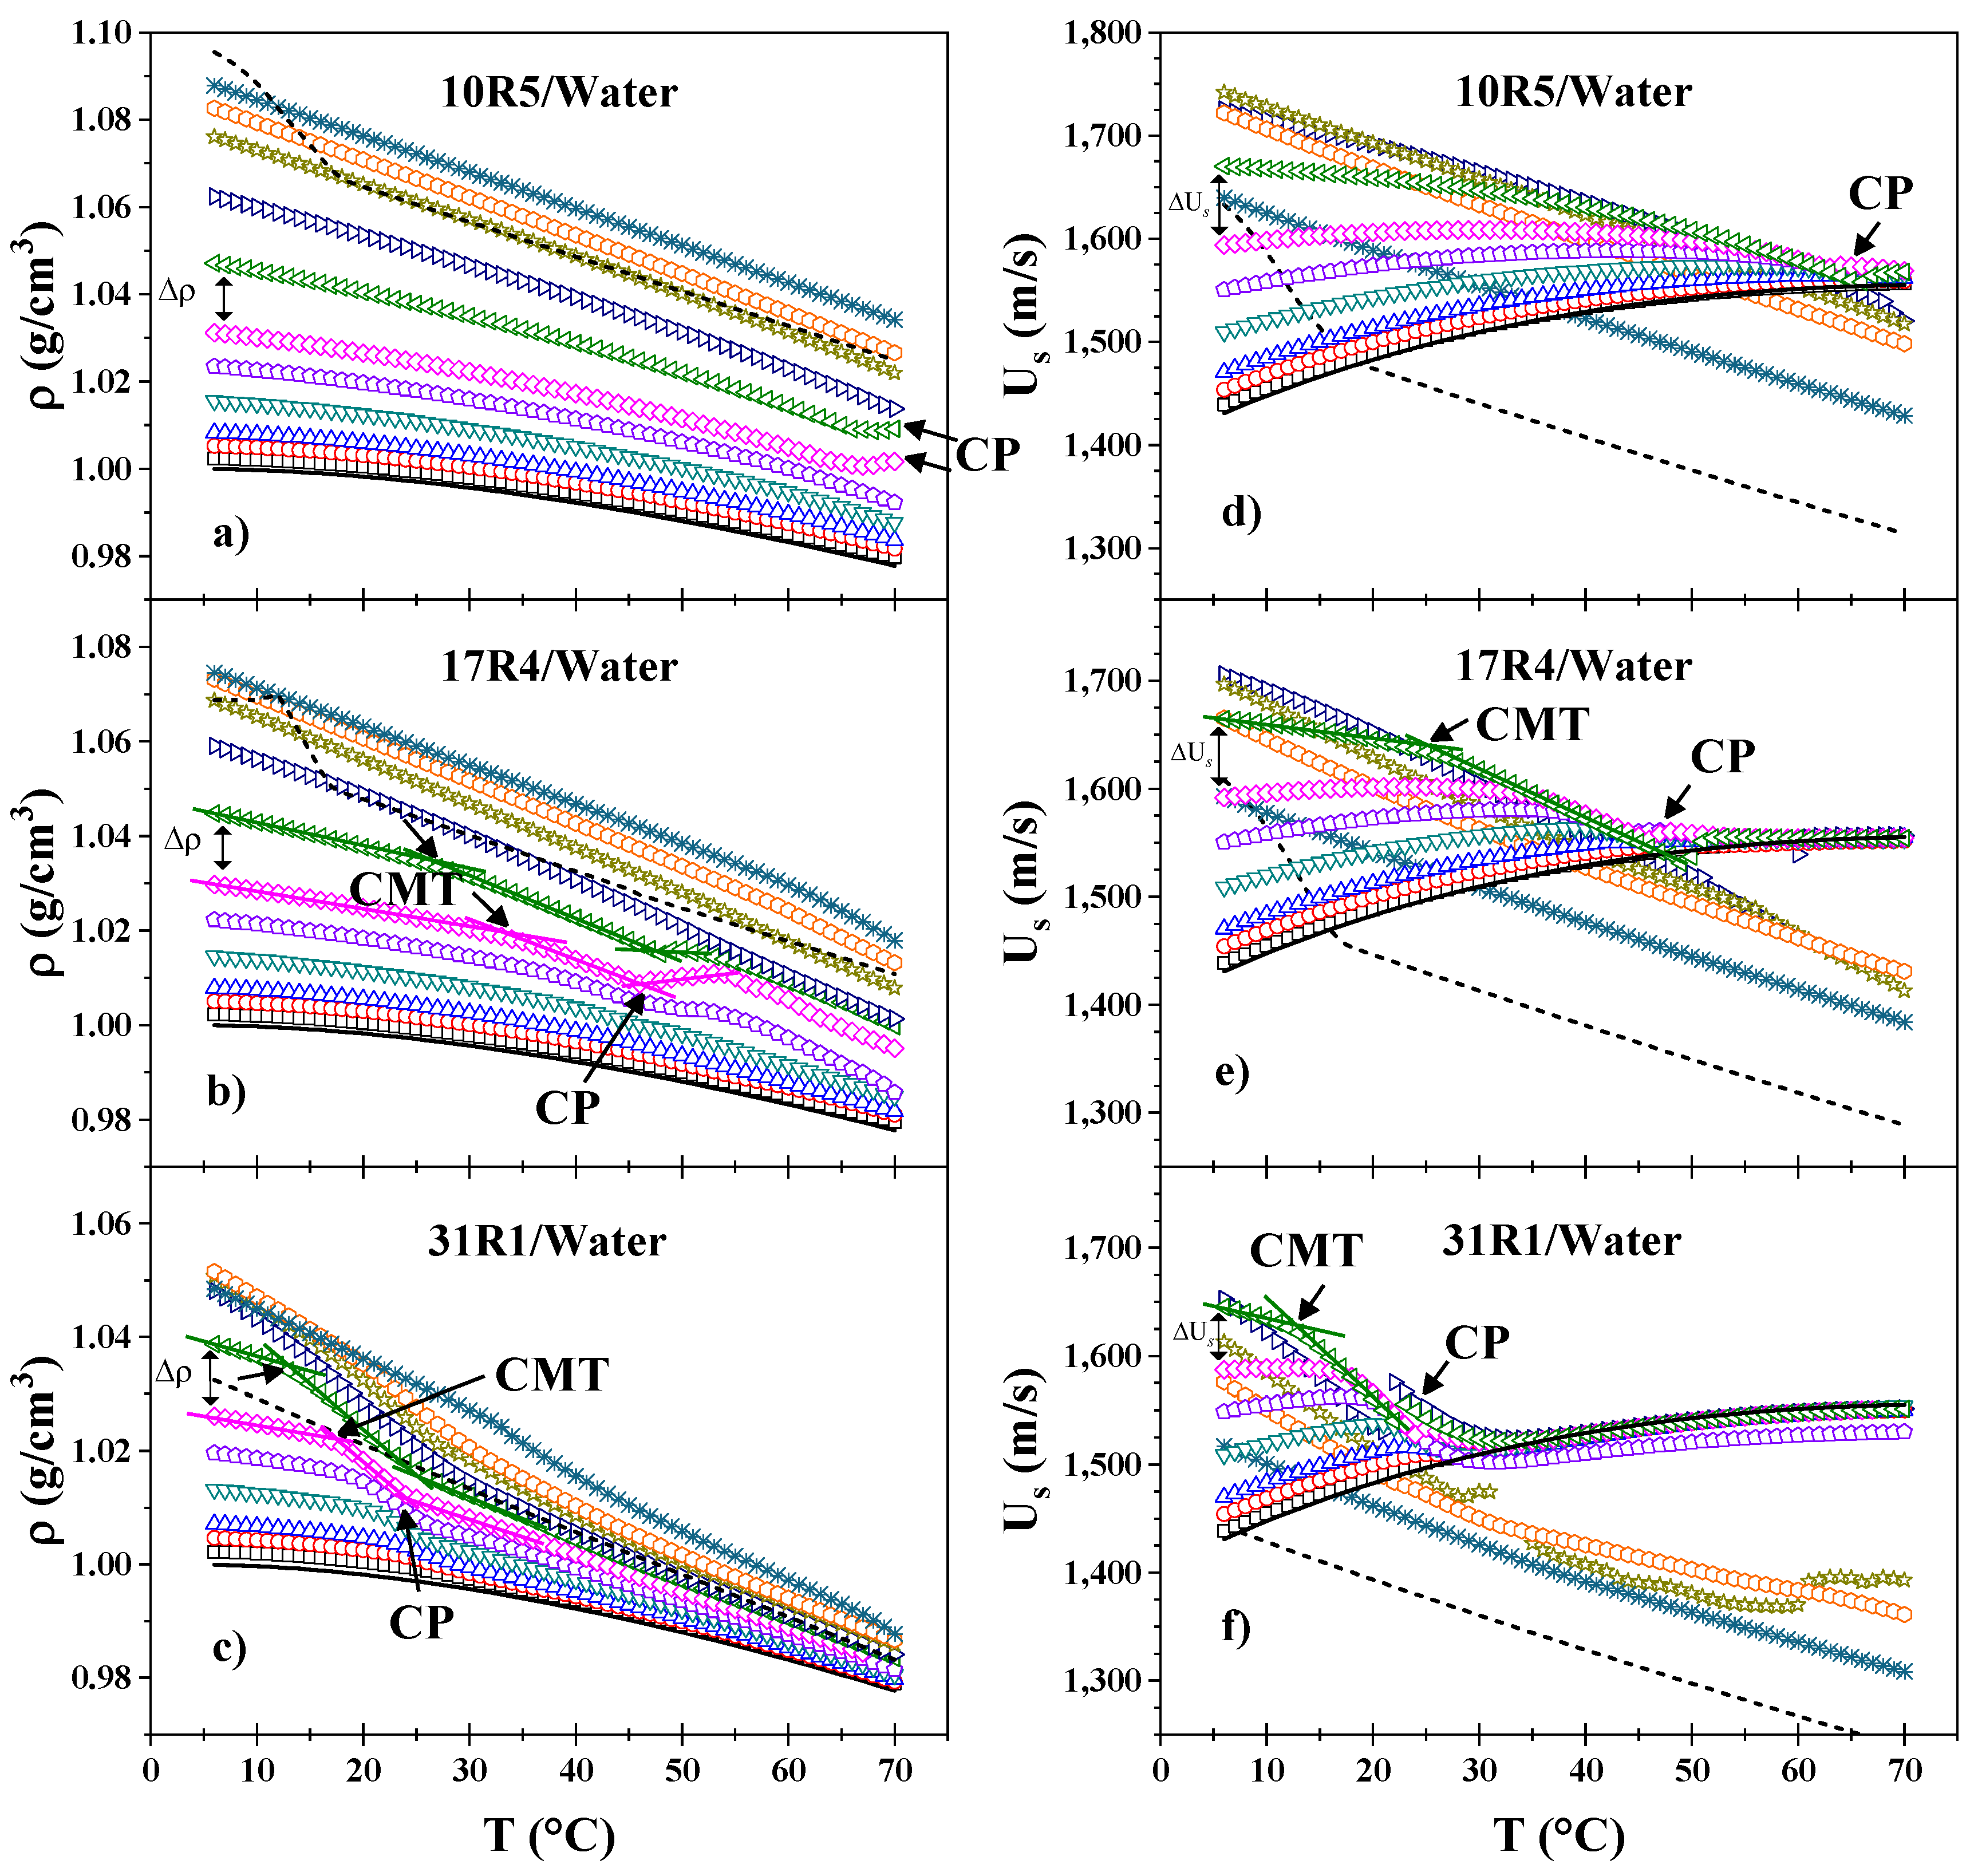
Figure 3.
Derivative of sound velocity versus temperature of the 17R4 system from visual observations. Concentrations in weight %: a) 1 (──), 5 (╌ ╌), b) 10 (┉ ┉) and 20 (─∙─).
Figure 3.
Derivative of sound velocity versus temperature of the 17R4 system from visual observations. Concentrations in weight %: a) 1 (──), 5 (╌ ╌), b) 10 (┉ ┉) and 20 (─∙─).
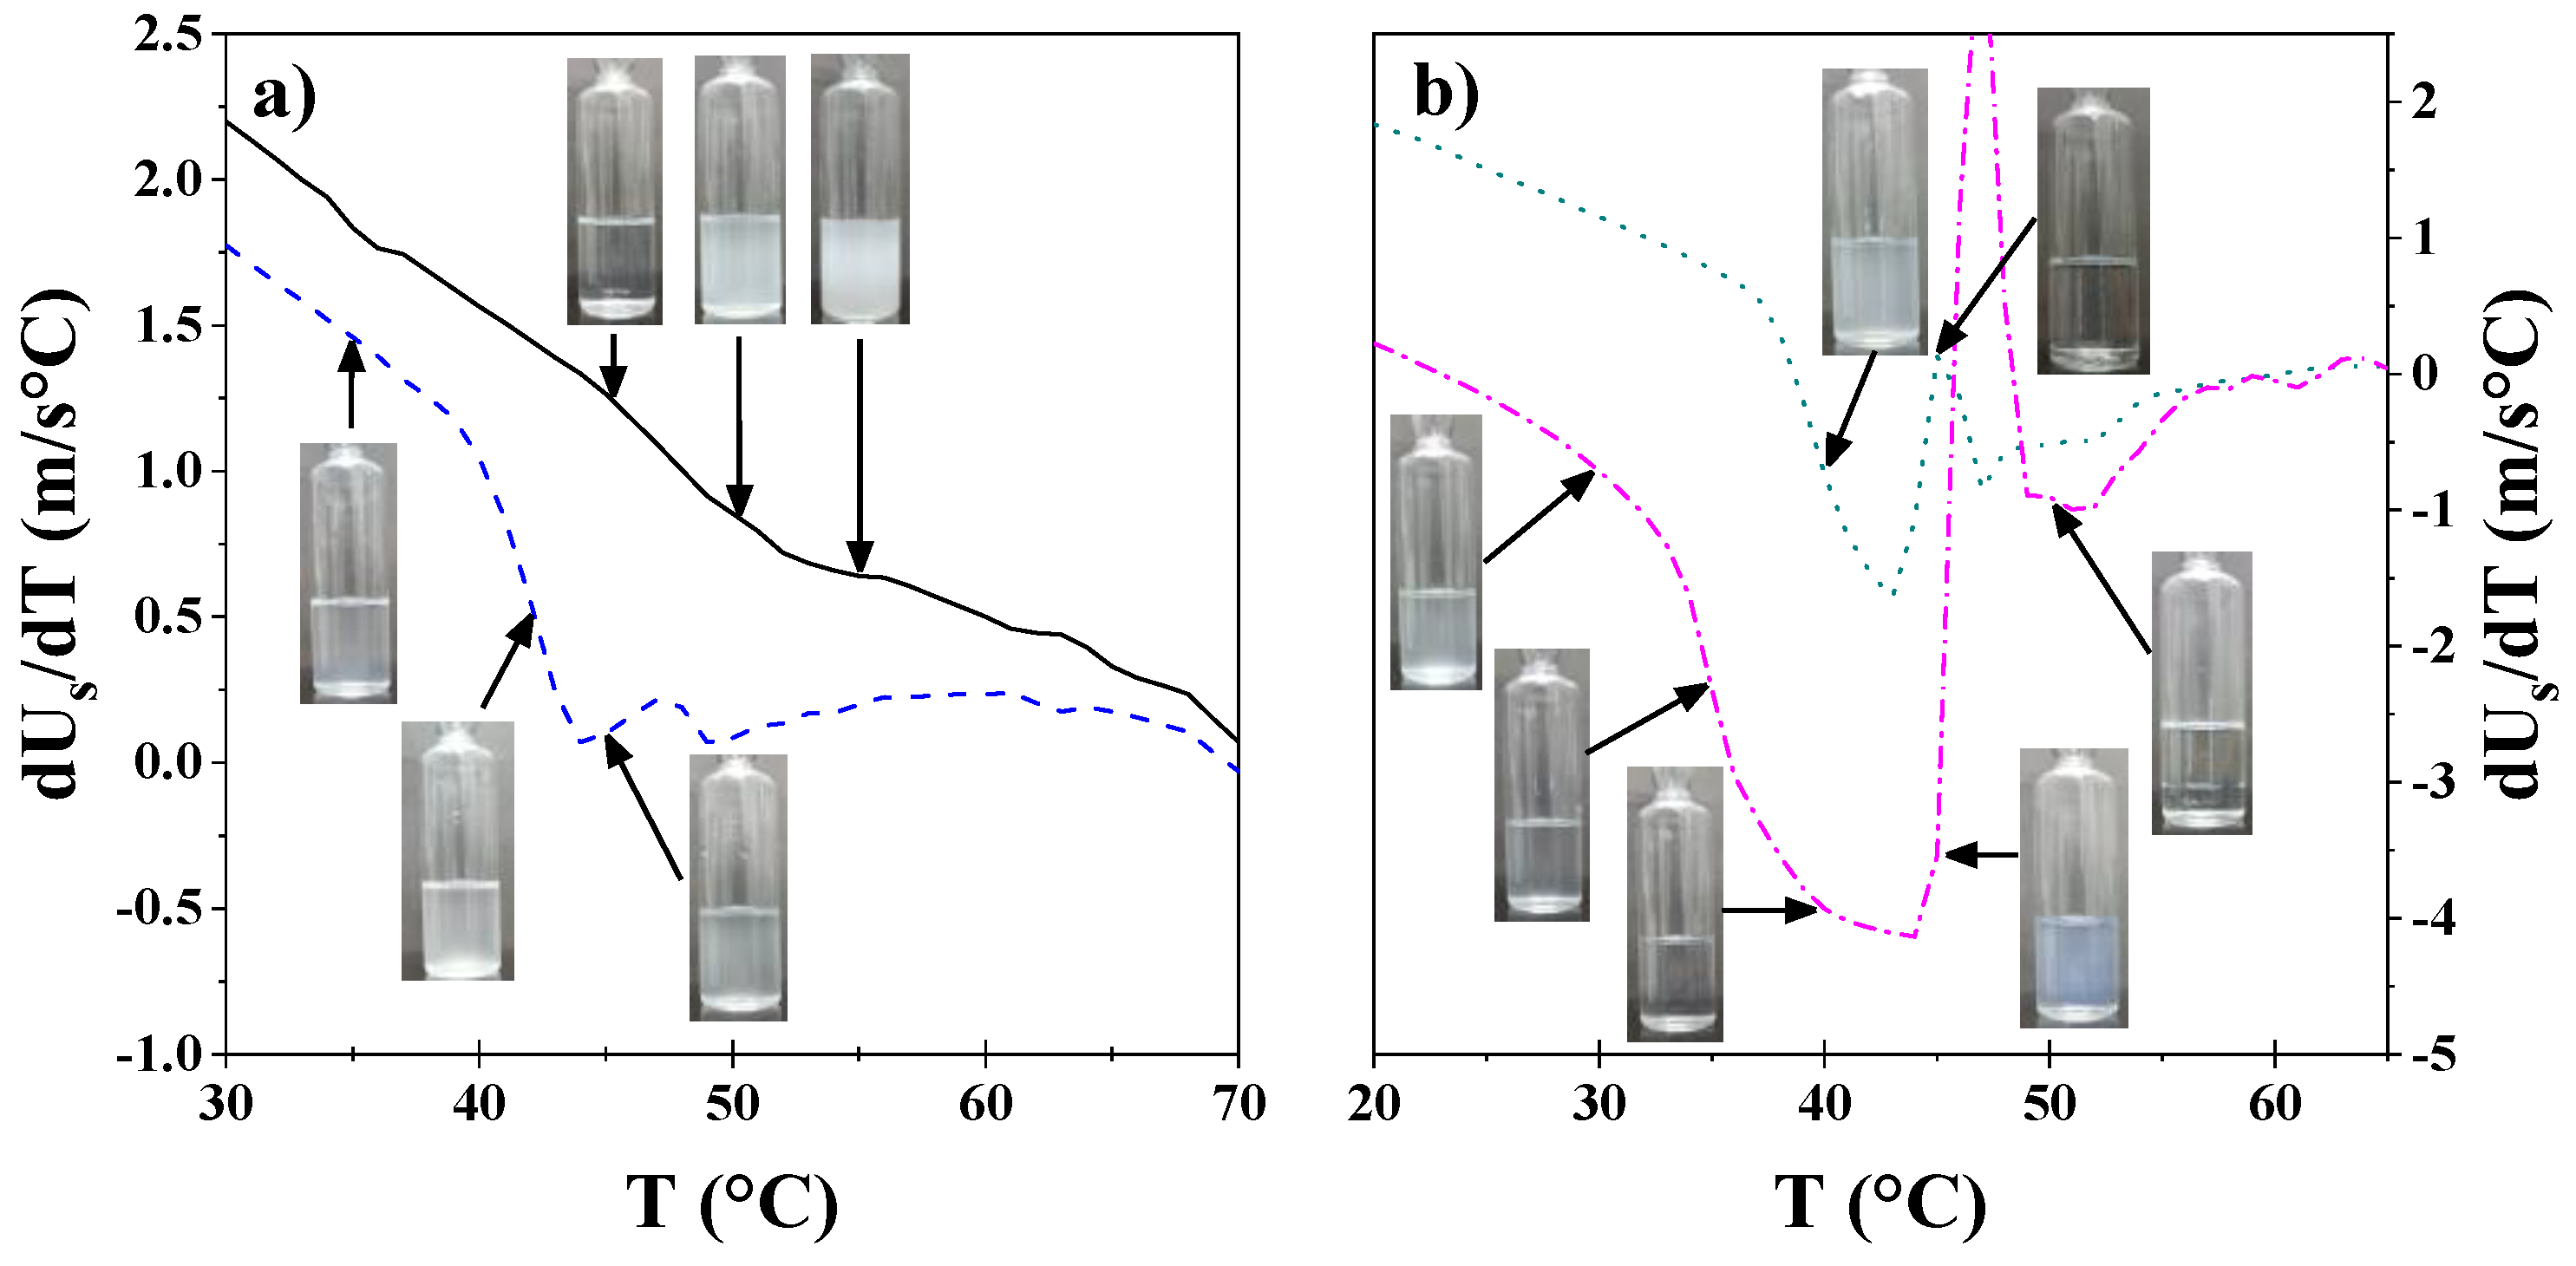
Figure 4.
a) Apparent molar volume as a function of temperature and b) apparent molar adiabatic compressibility as a function of temperature of 17R4/water system. The measurements being made at the concentrations in weight percent of: 1 (□), 3 (○), 5 (△), 10 (▽), 15 (⬠), 20 (◇), 30 (◁), 40 (▷), 50 (☆), 60 (⎔), 80 (✳).
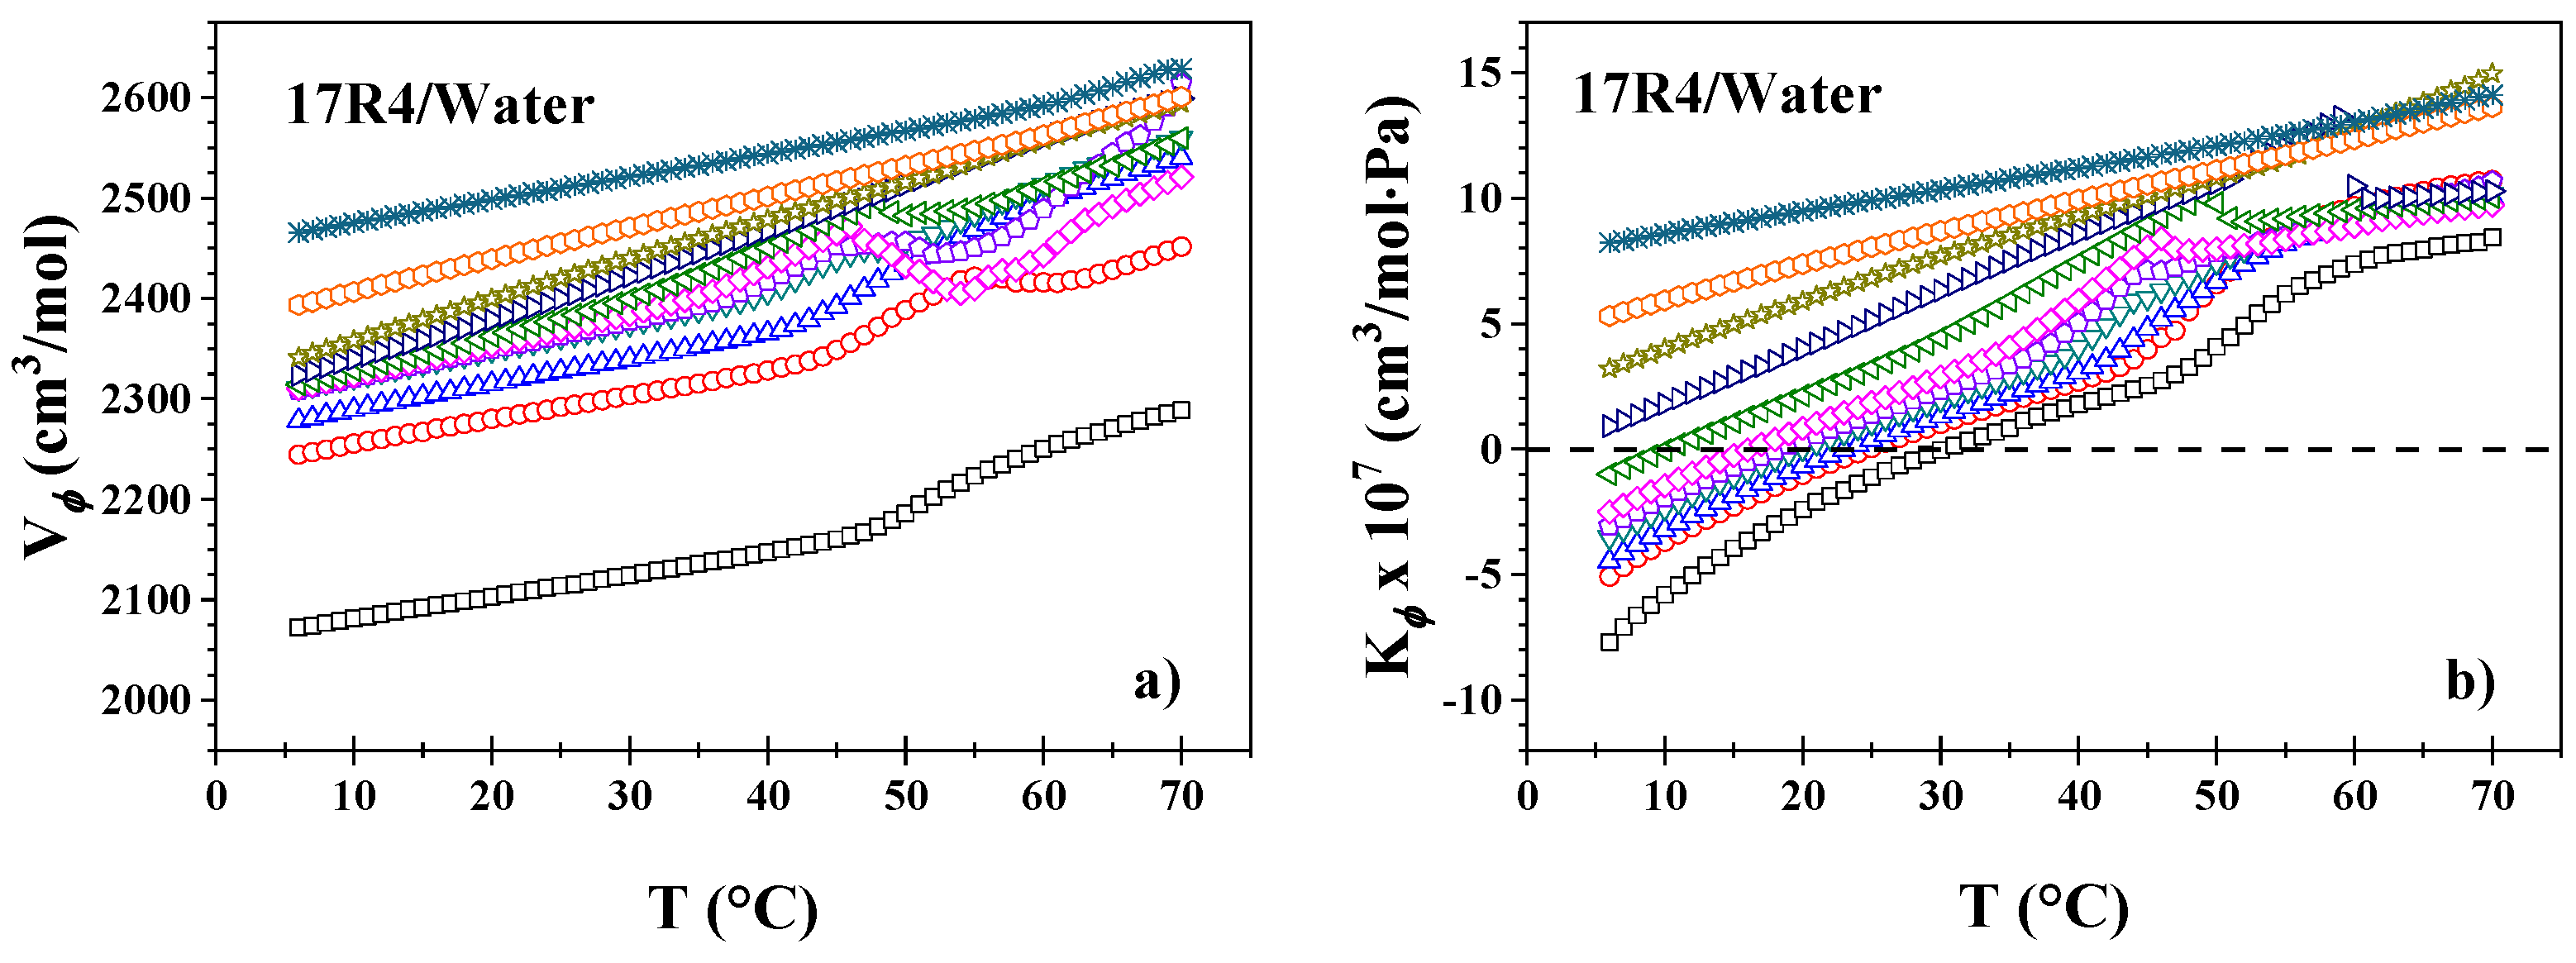
Figure 5.
a) hydration number as a function of temperature of 17R4/water system; measurements at the concentrations in weight % of: 1 (□), 3 (○), 5 (△), 10 (▽), 15 (⬠), 20 (◇), 30 (◁), 40 (▷), 50 (☆), 60 (⎔), 80 (✳); b) Hydration number as a function of concentration of 17R4/water system.
Figure 5.
a) hydration number as a function of temperature of 17R4/water system; measurements at the concentrations in weight % of: 1 (□), 3 (○), 5 (△), 10 (▽), 15 (⬠), 20 (◇), 30 (◁), 40 (▷), 50 (☆), 60 (⎔), 80 (✳); b) Hydration number as a function of concentration of 17R4/water system.
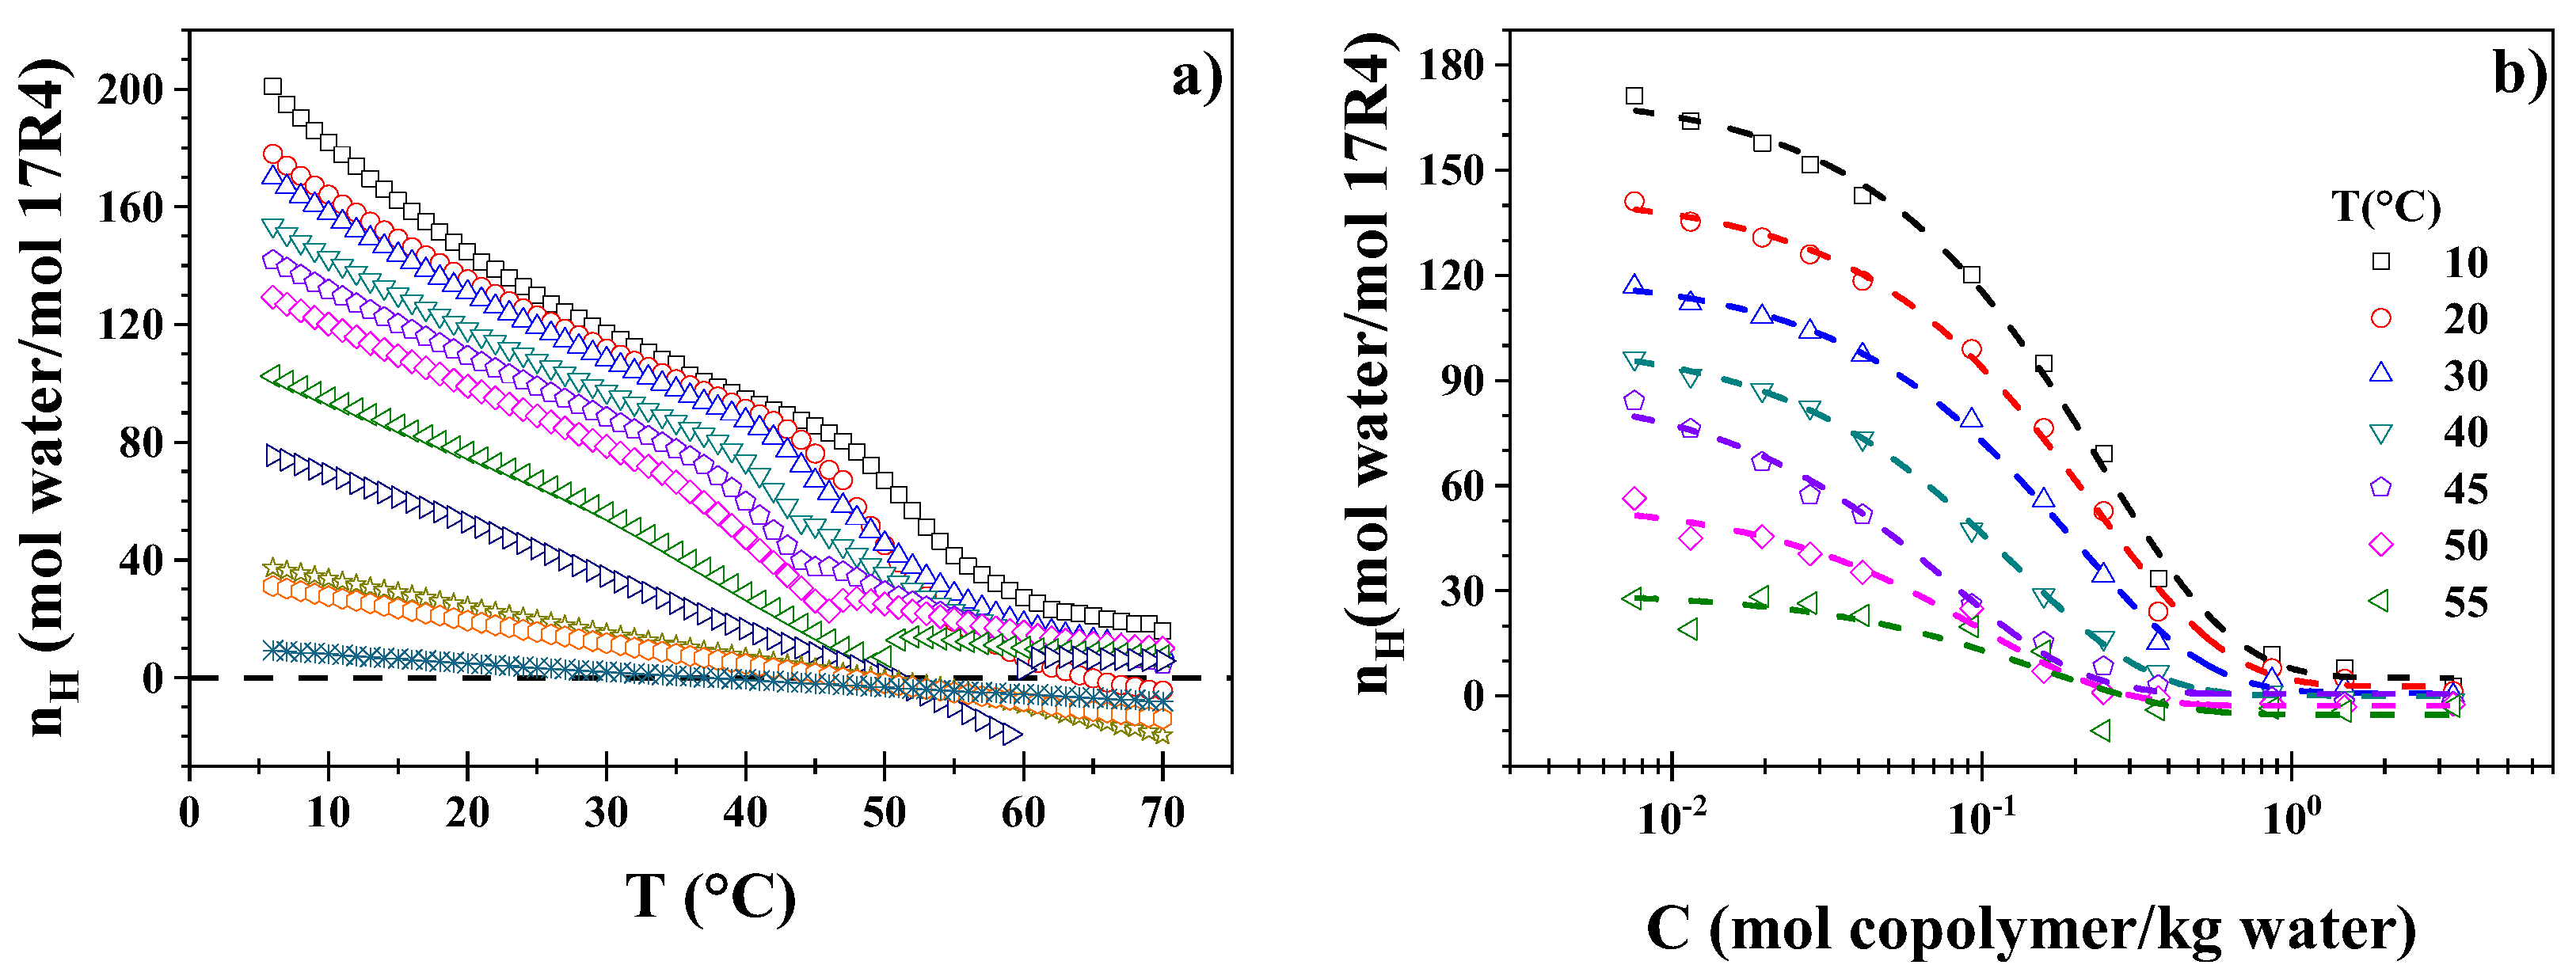
Figure 6.
a) Hydration number in infinite solution as a function of the reciprocal of the temperature; b) Hydration number in infinite solution as a function of the number of oxygens in RP and DP copolymers molecules at 10°C.
Figure 6.
a) Hydration number in infinite solution as a function of the reciprocal of the temperature; b) Hydration number in infinite solution as a function of the number of oxygens in RP and DP copolymers molecules at 10°C.
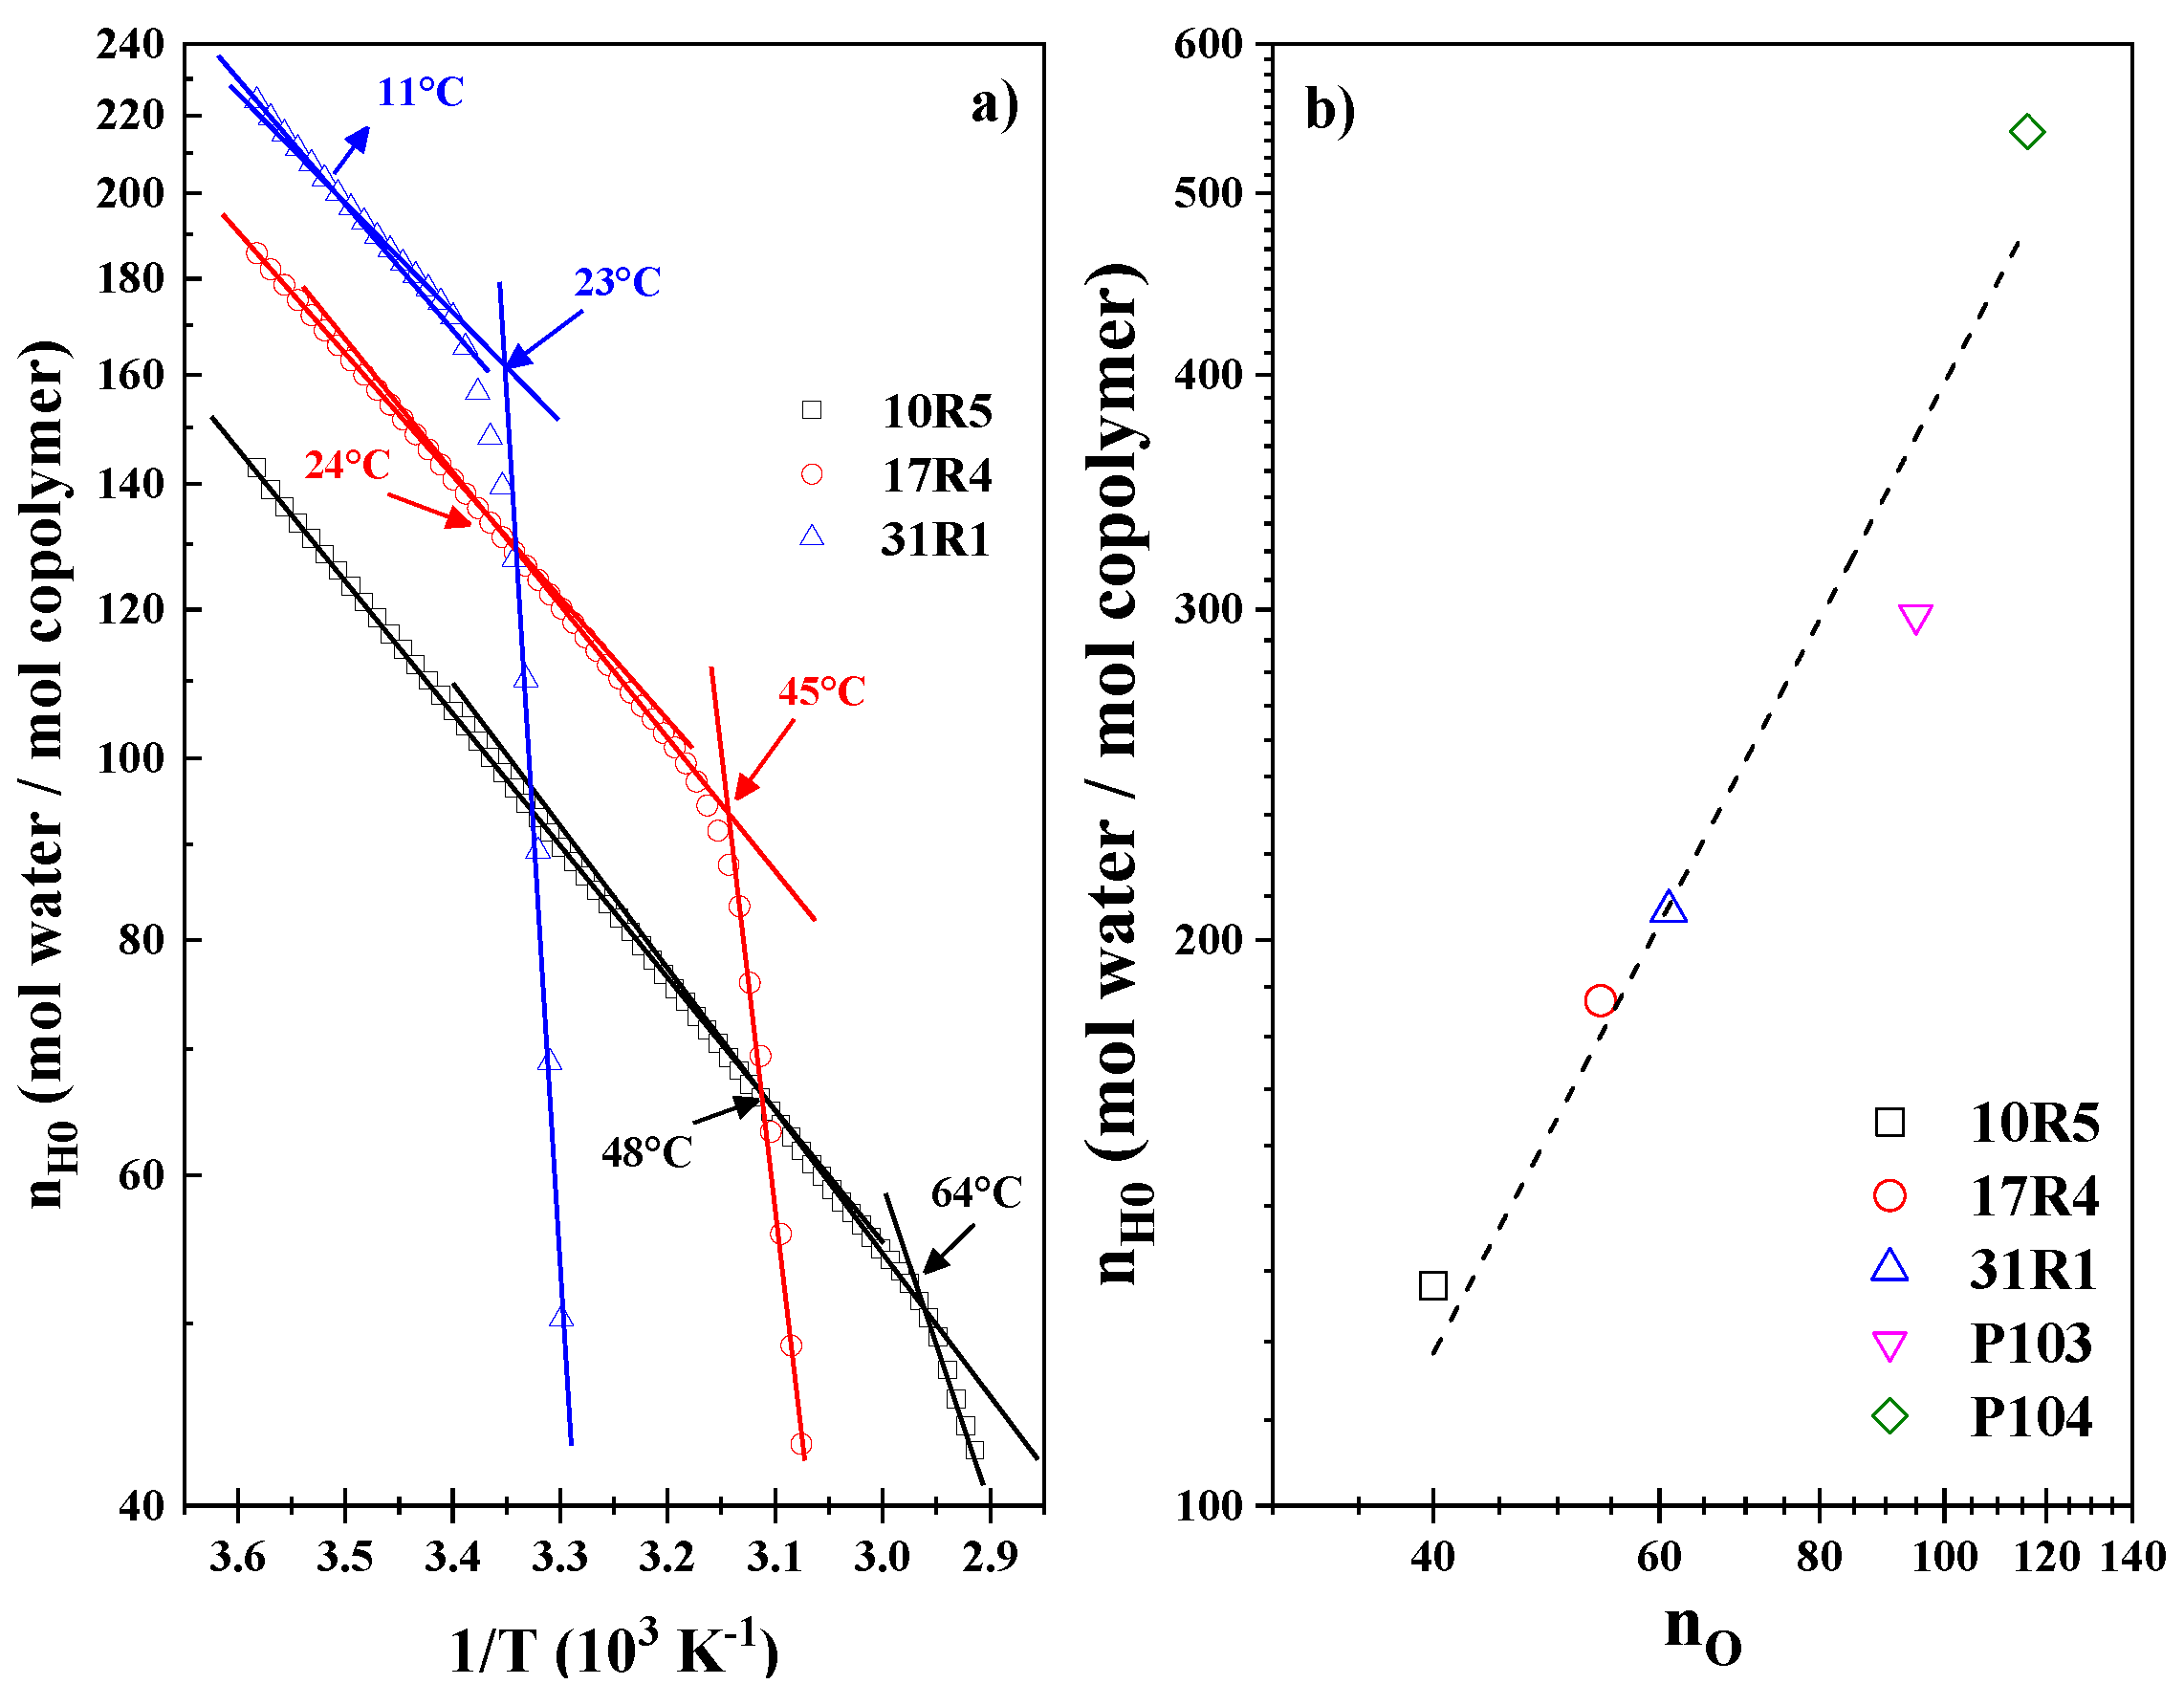
Figure 7.
a) semi-static surface tension as a function of temperature of 17R4/water at concentrations in weight % of: 0 (──), 1 (─□─), 2 (─☆─), 3 (─○─), 5 (─△─), 7 (─✳─), 10 (─▽─) and 20 (─◇─); Surface area as a function of temperature: a) 10R5/water (□), b)17R4/water (○) y c) 31R1/water (△).
Figure 7.
a) semi-static surface tension as a function of temperature of 17R4/water at concentrations in weight % of: 0 (──), 1 (─□─), 2 (─☆─), 3 (─○─), 5 (─△─), 7 (─✳─), 10 (─▽─) and 20 (─◇─); Surface area as a function of temperature: a) 10R5/water (□), b)17R4/water (○) y c) 31R1/water (△).
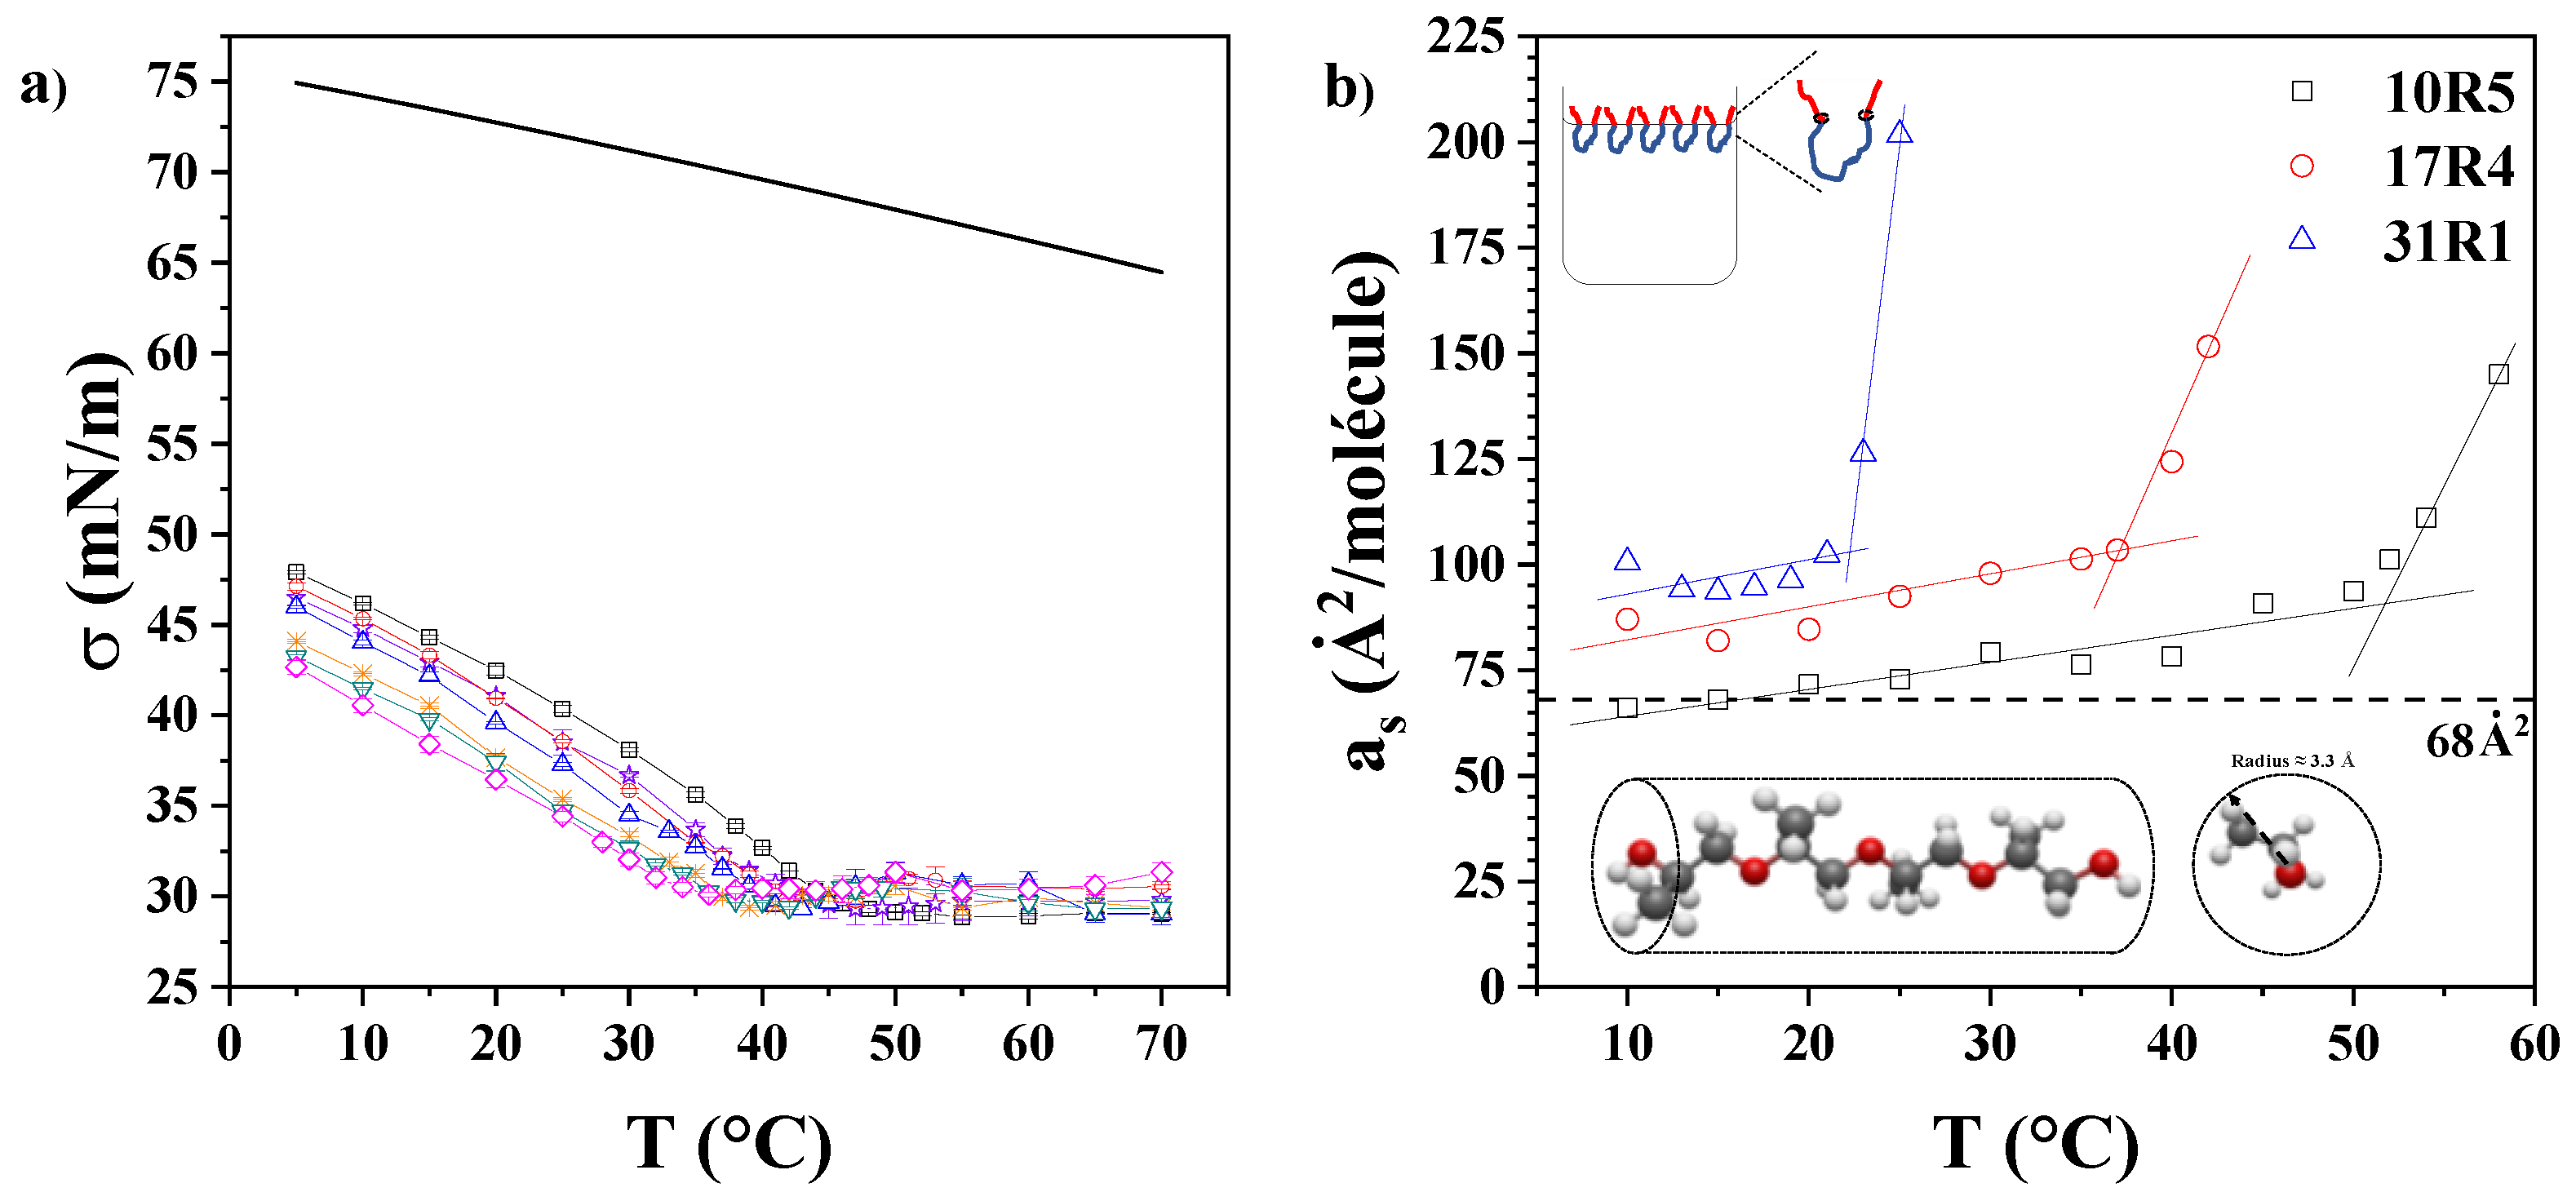
Figure 8.
Size distributions: a) at constant temperature (60°C) of the system 10R5/water at 15 (──) and 20 wt. % (──); b) at constant concentration (15 wt. %) of the 17R4/water system at 40 (──) and 43°C (──).
Figure 8.
Size distributions: a) at constant temperature (60°C) of the system 10R5/water at 15 (──) and 20 wt. % (──); b) at constant concentration (15 wt. %) of the 17R4/water system at 40 (──) and 43°C (──).
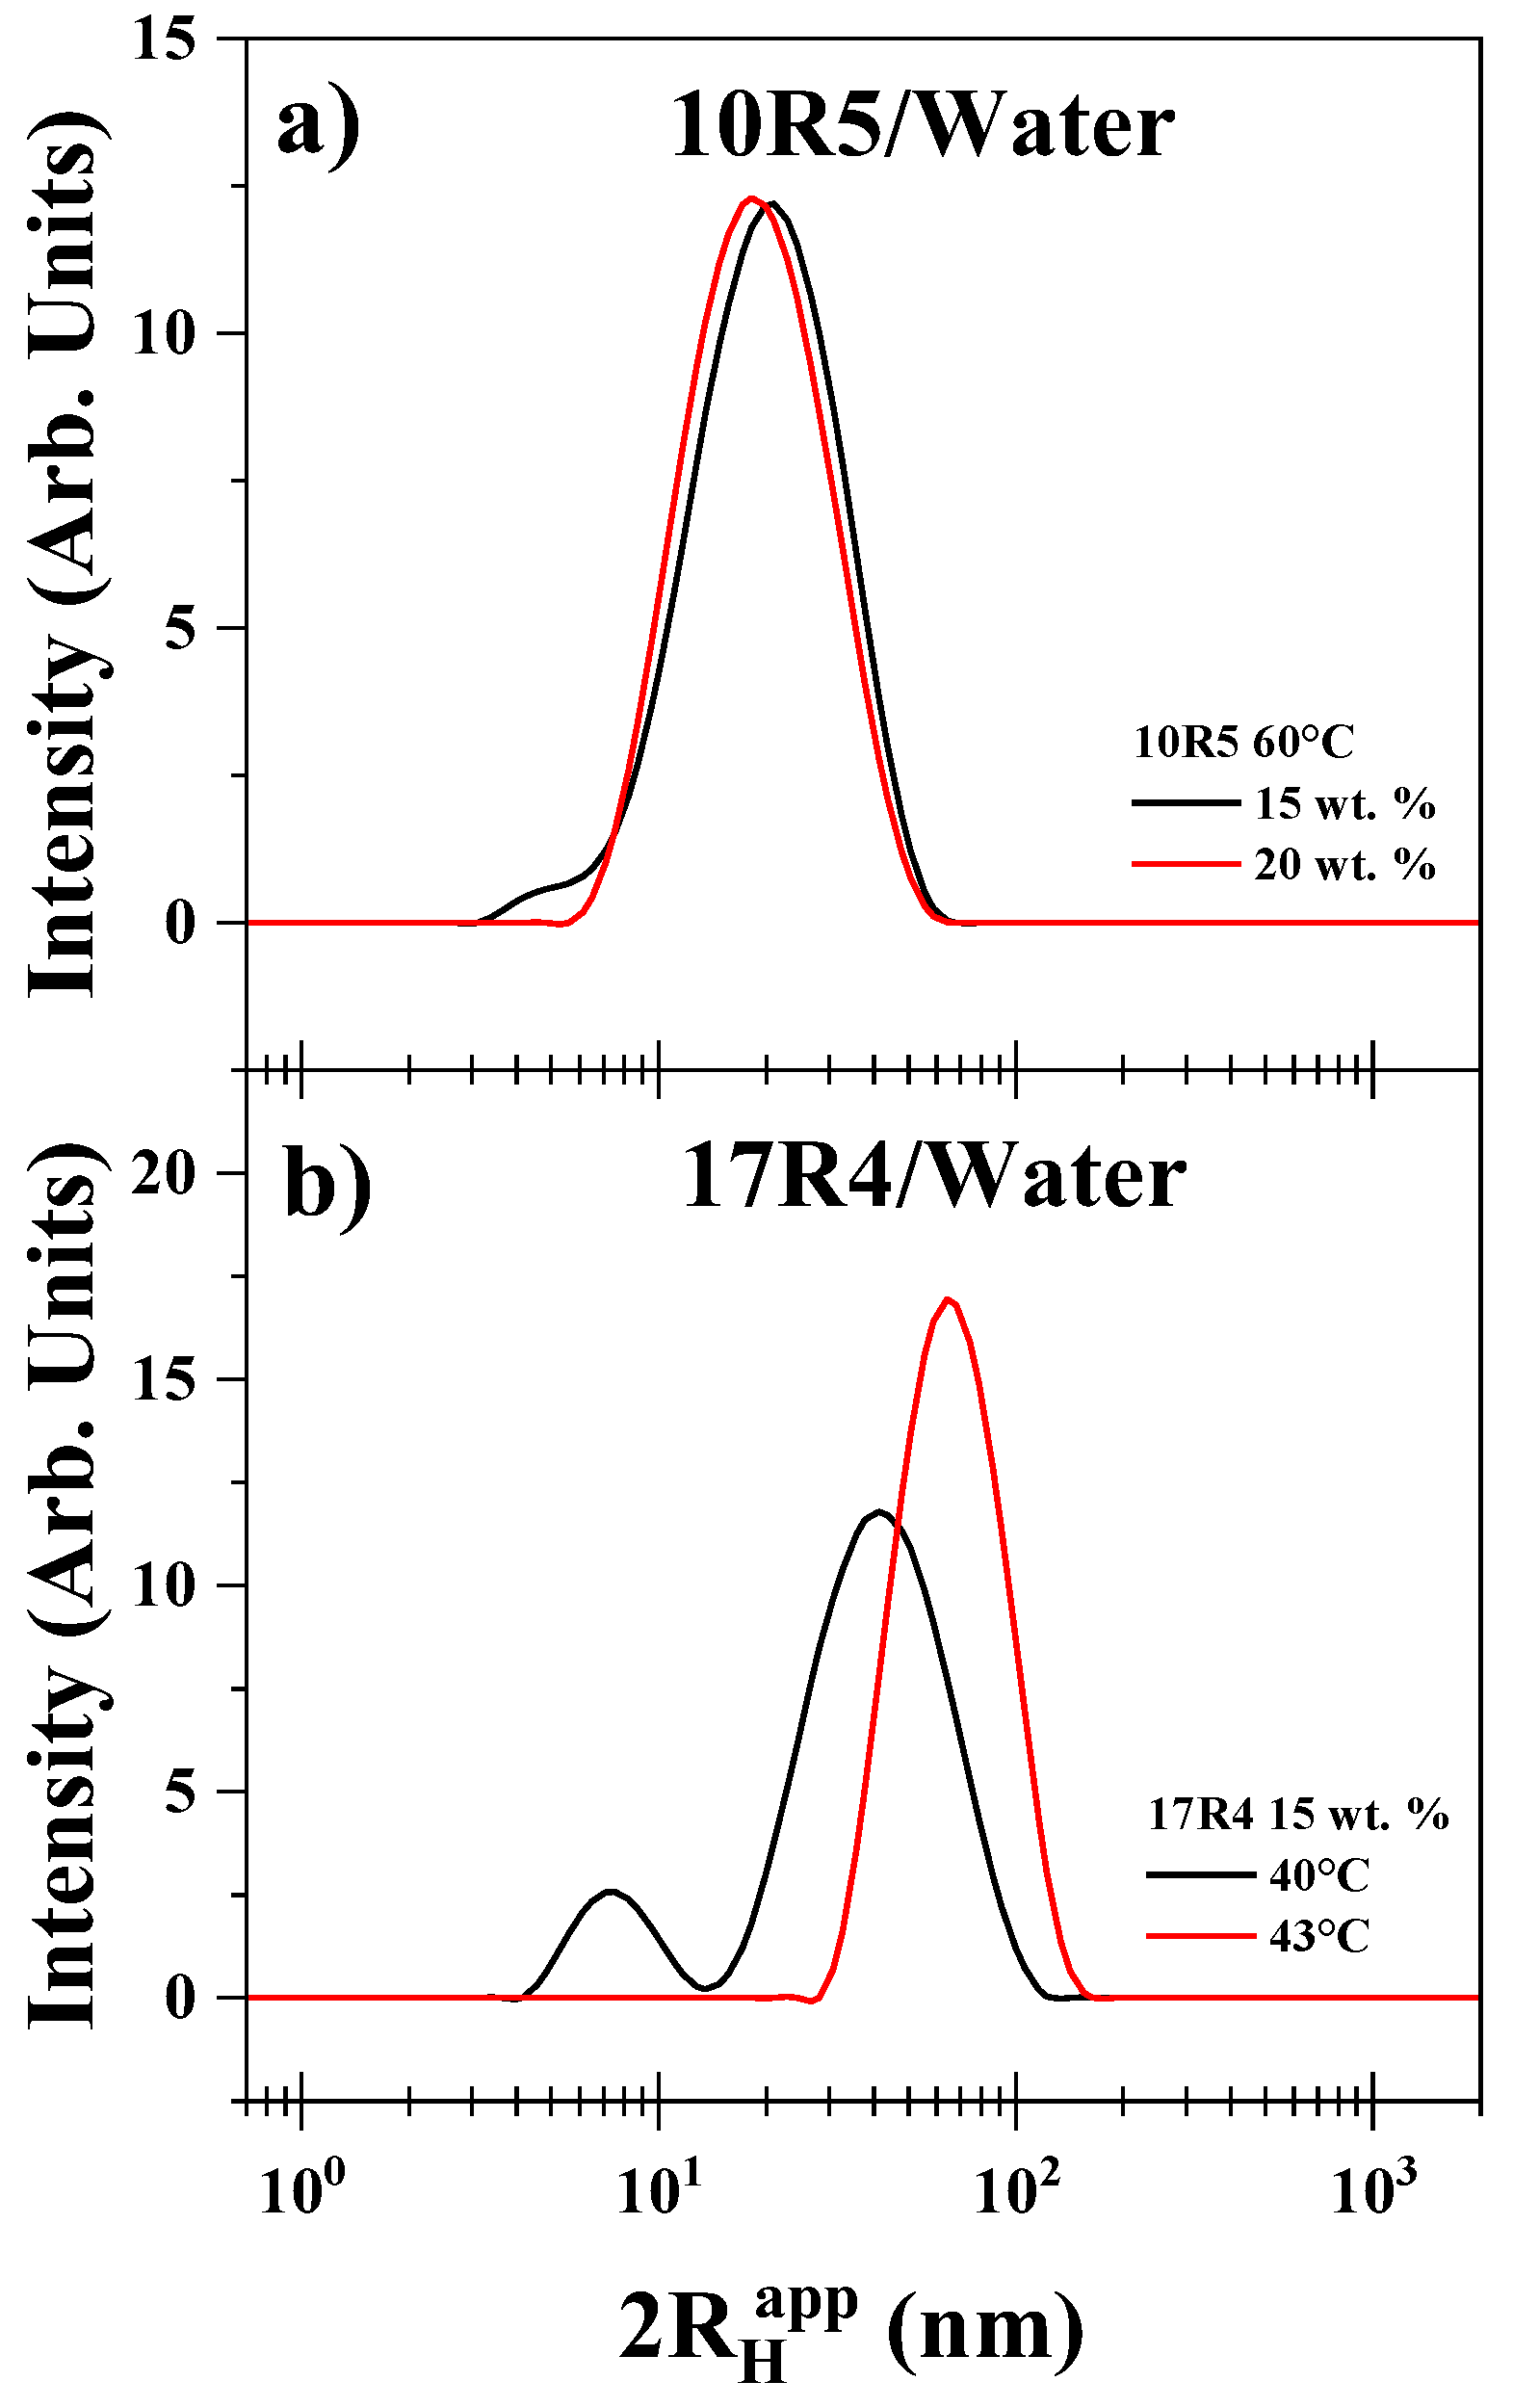
Figure 9.
Rheometry of the 17R4/water system, a) moduli G’ and G’’ as a function of frequency at 40% strain, b) dynamic and shear viscosity (rheometry and viscometry) as a function of frequency and shear rate, c) tan(δ) as a function of temperature.
Figure 9.
Rheometry of the 17R4/water system, a) moduli G’ and G’’ as a function of frequency at 40% strain, b) dynamic and shear viscosity (rheometry and viscometry) as a function of frequency and shear rate, c) tan(δ) as a function of temperature.
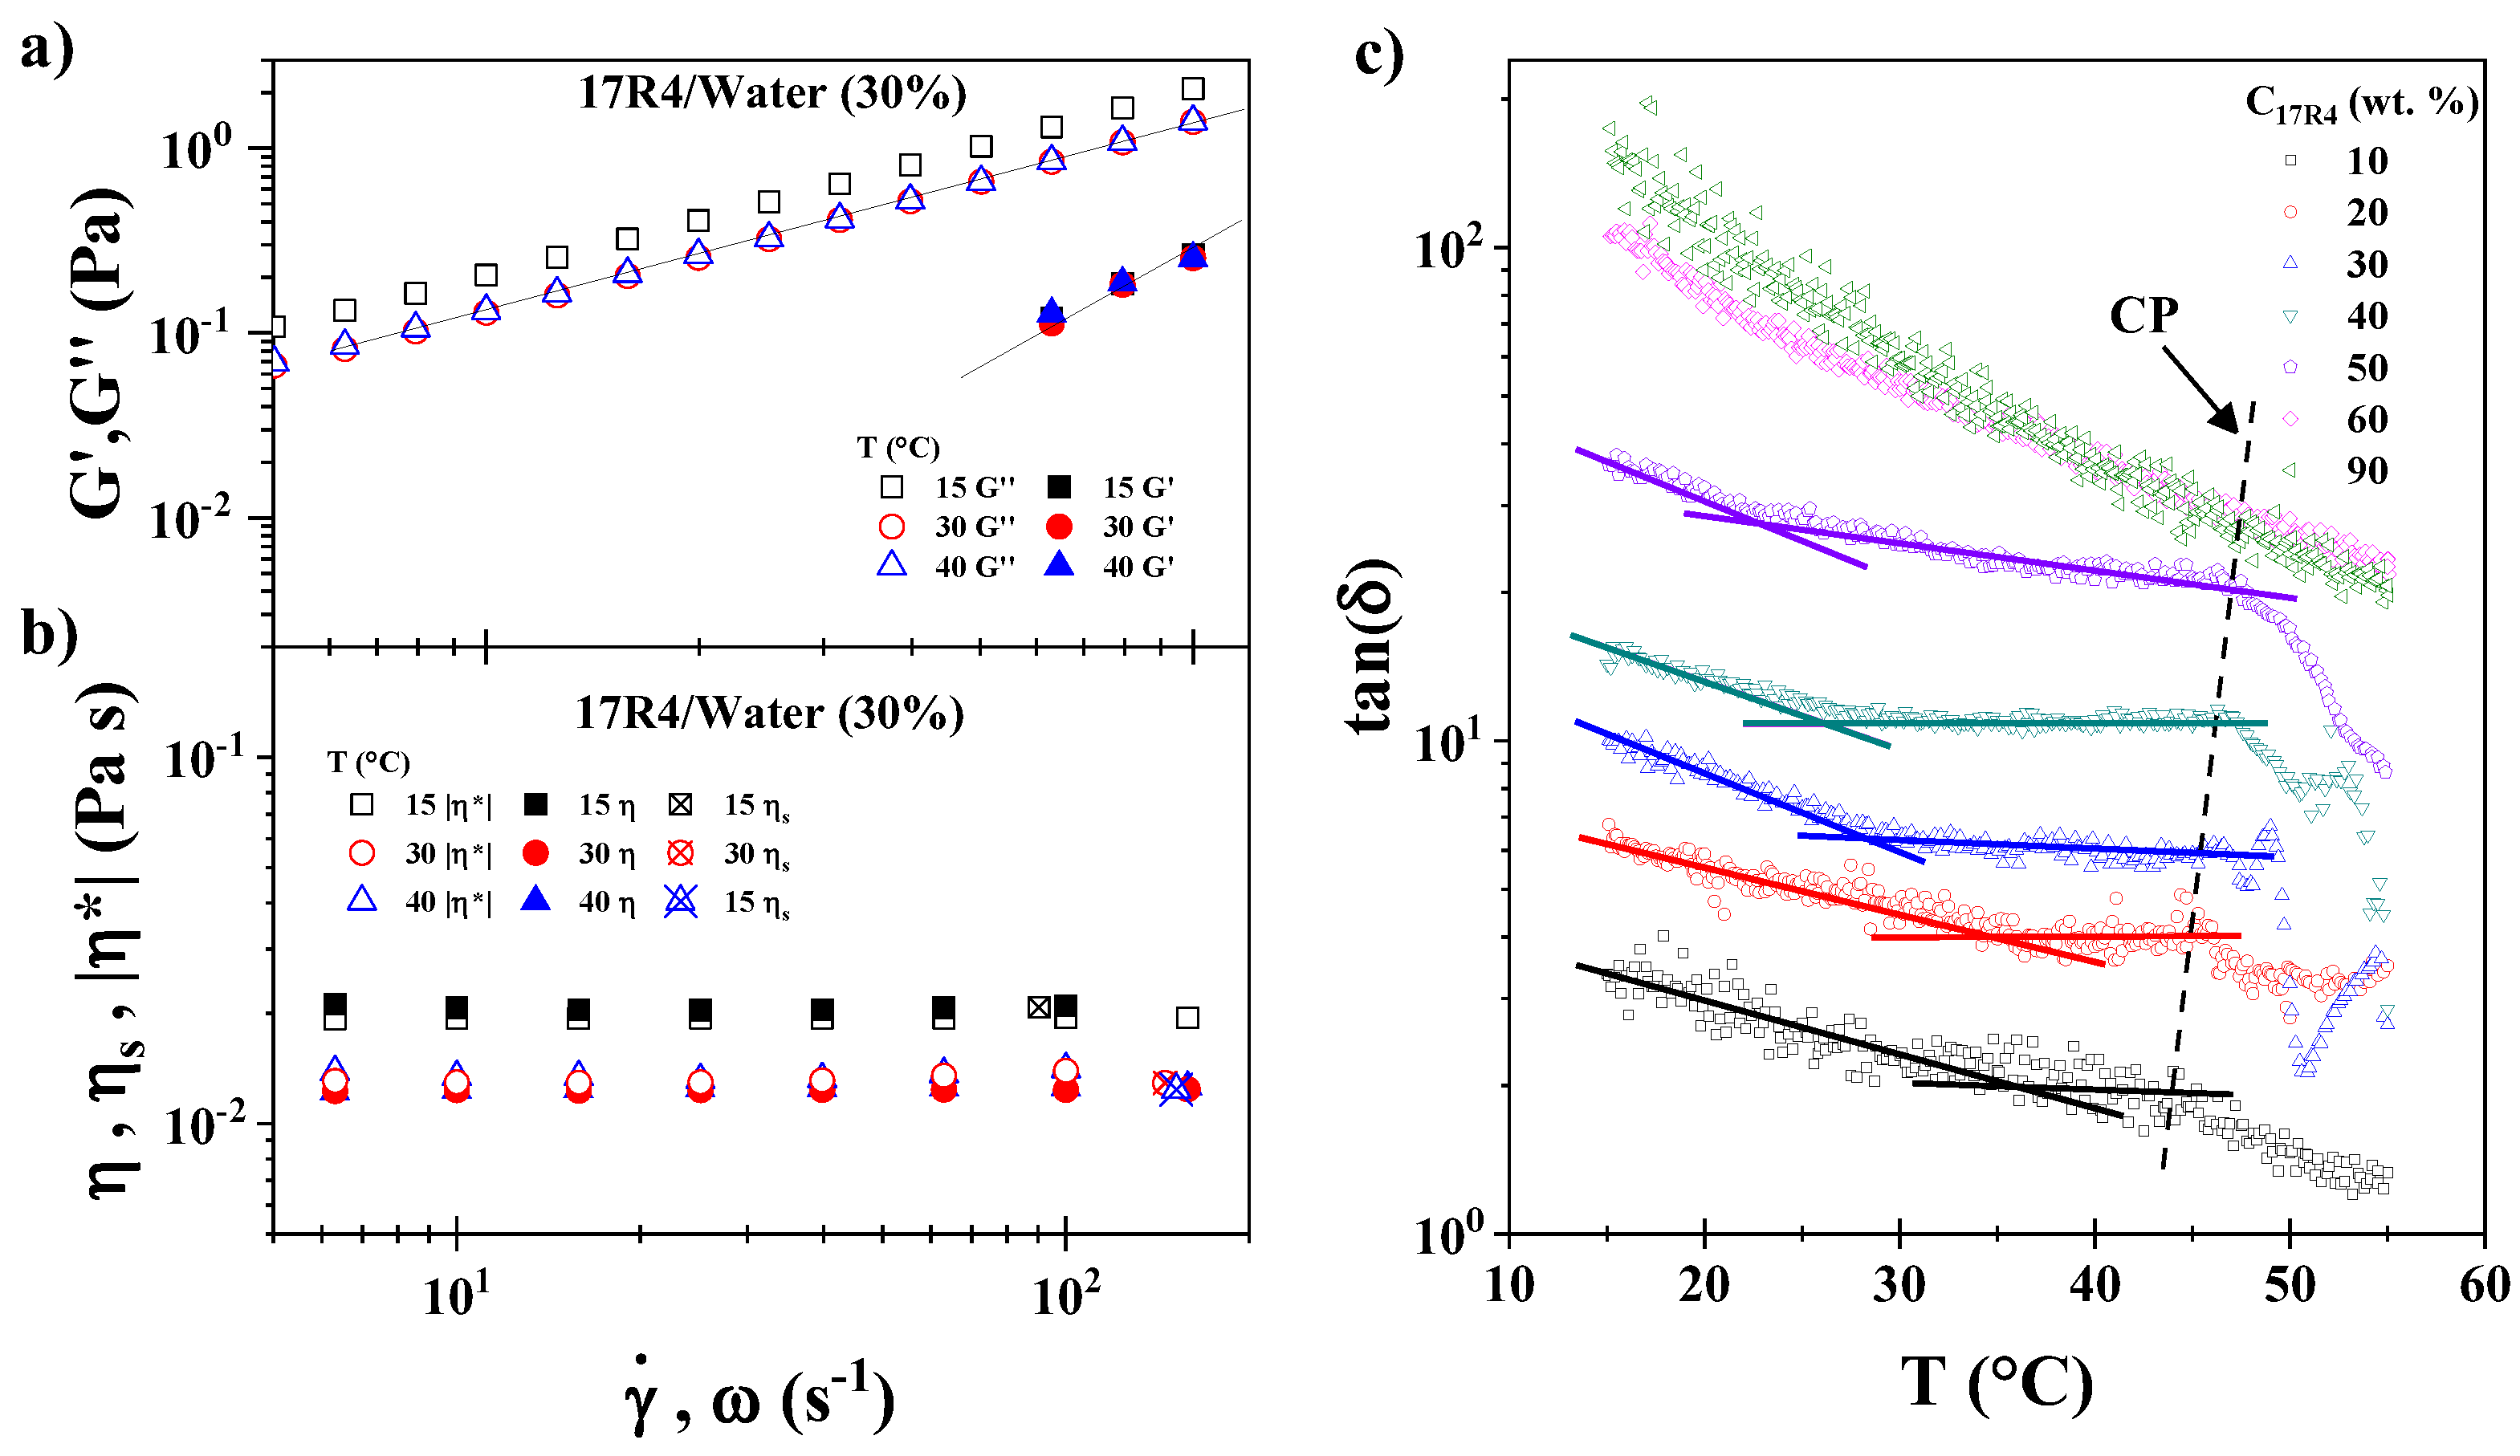
Figure 10.
Example of analysis by concentration of the 17R4/water system: a) 10°C and b) 30°C. Property measurements: density (─□─), sound velocity (─○─), molar volume (─△─) and viscosity (─▽─).
Figure 10.
Example of analysis by concentration of the 17R4/water system: a) 10°C and b) 30°C. Property measurements: density (─□─), sound velocity (─○─), molar volume (─△─) and viscosity (─▽─).
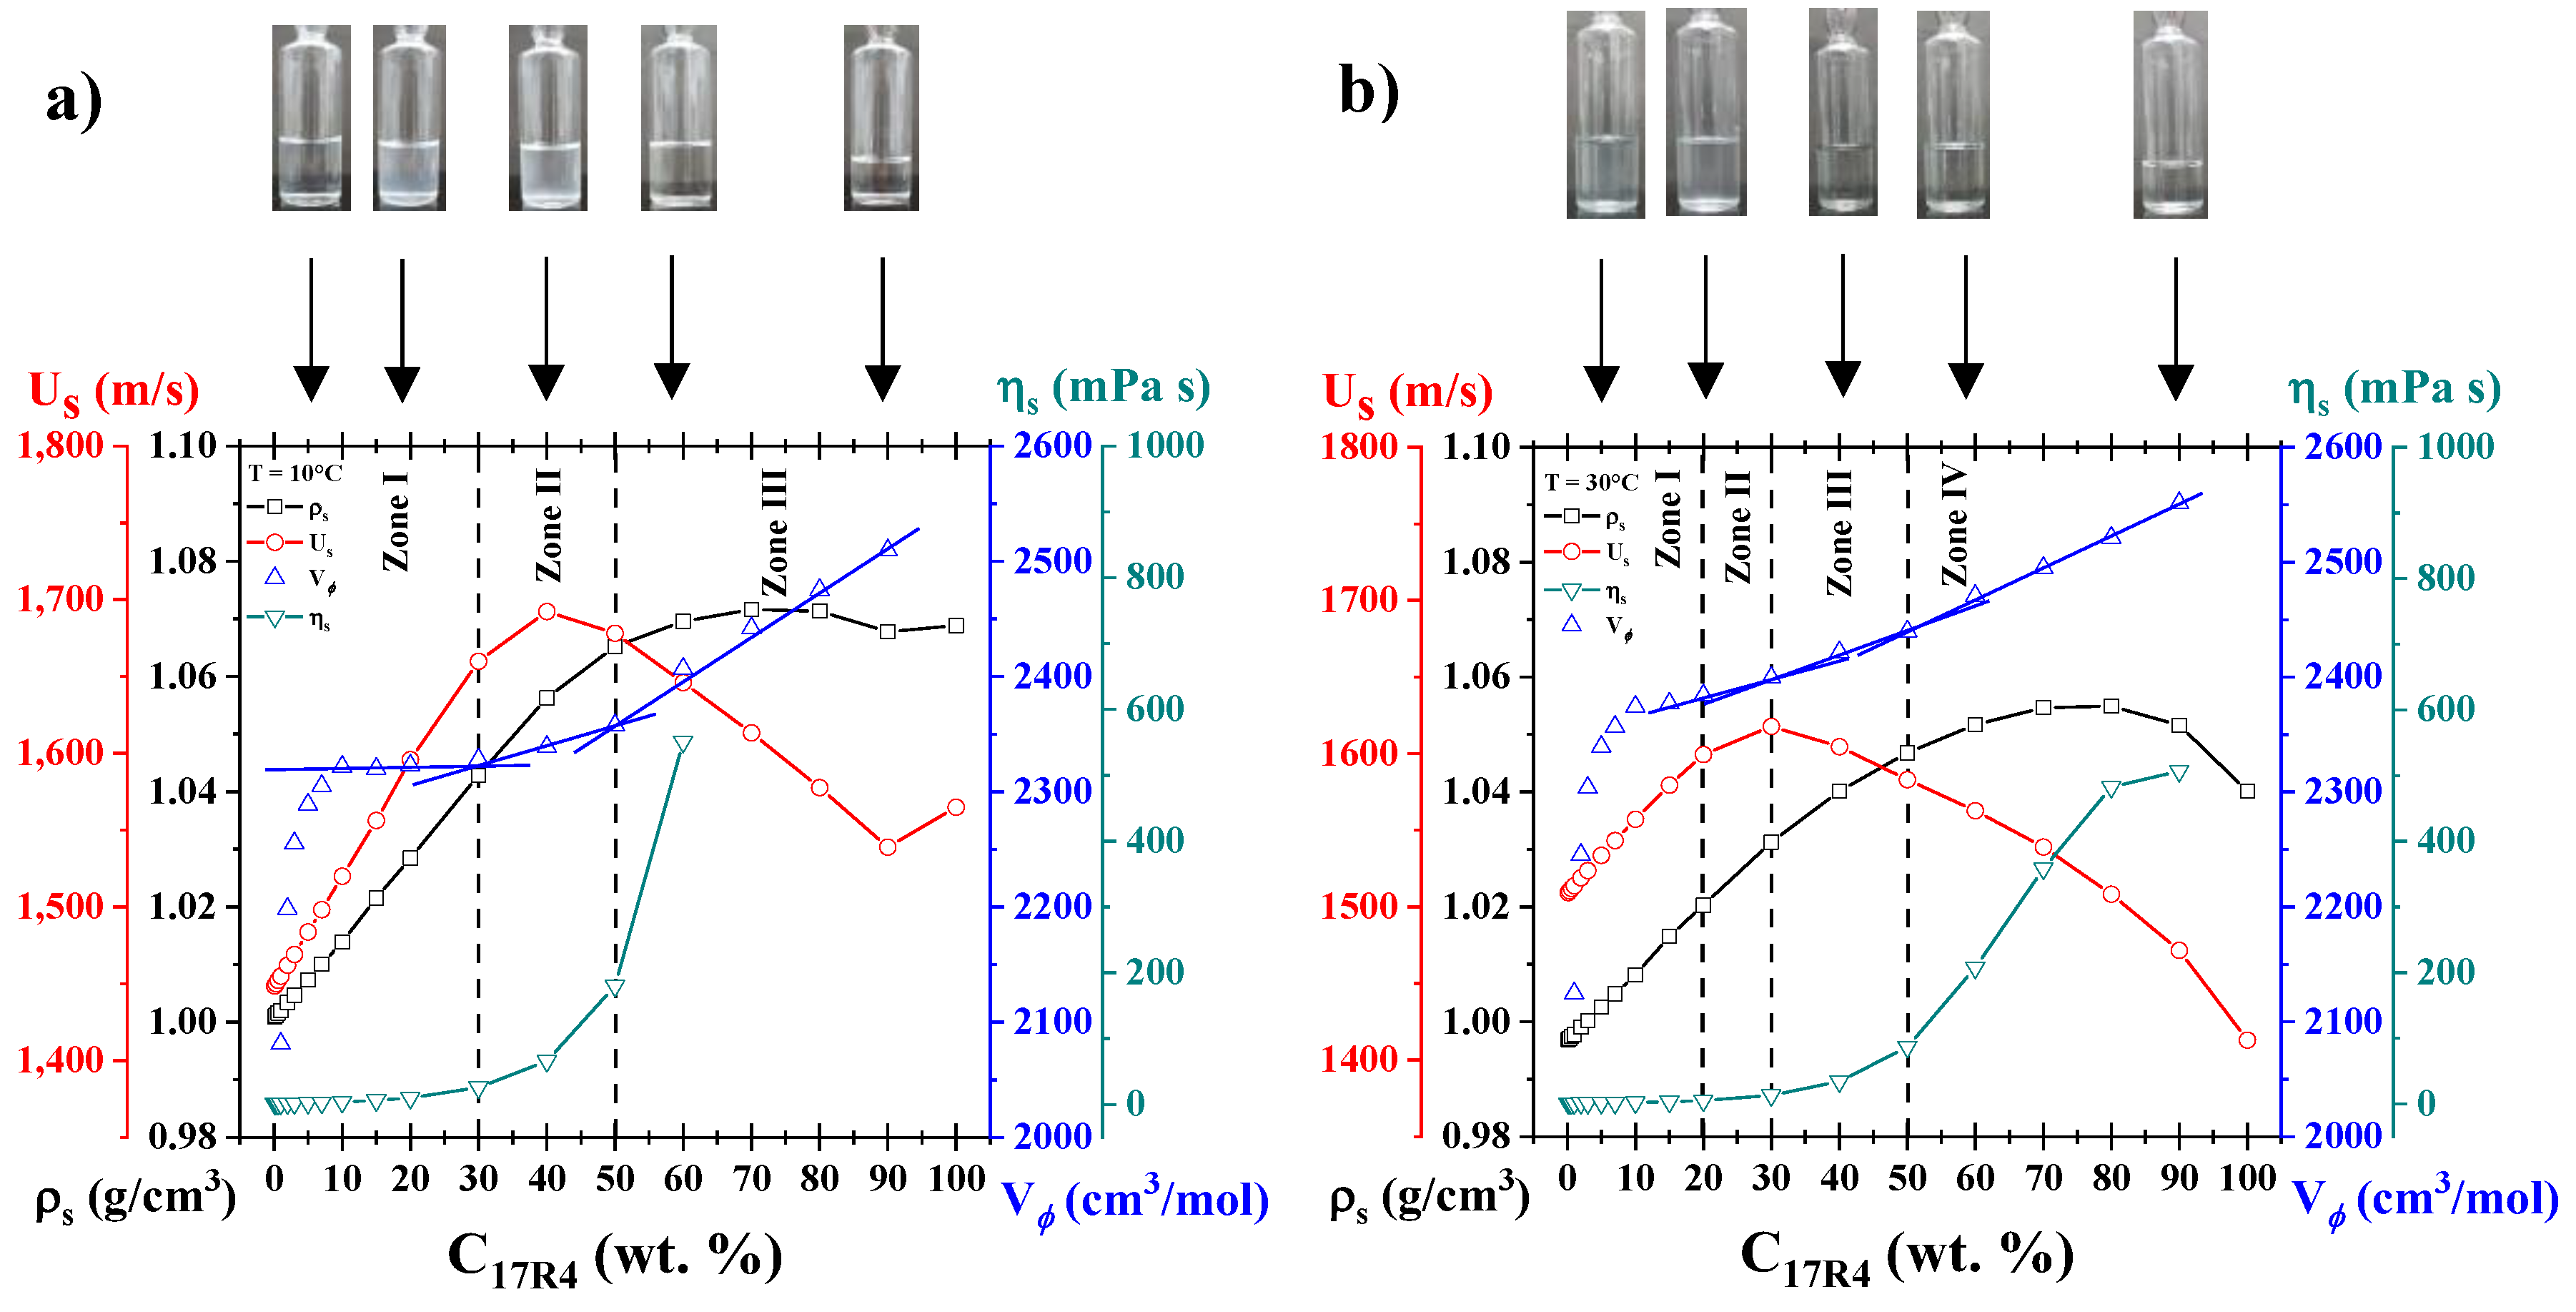
Figure 11.
a) Phase Nomenclature. Phase diagrams of the systems: b) 10R5/water, c) 17R4/water, and d) 31R1/water.
Figure 11.
a) Phase Nomenclature. Phase diagrams of the systems: b) 10R5/water, c) 17R4/water, and d) 31R1/water.
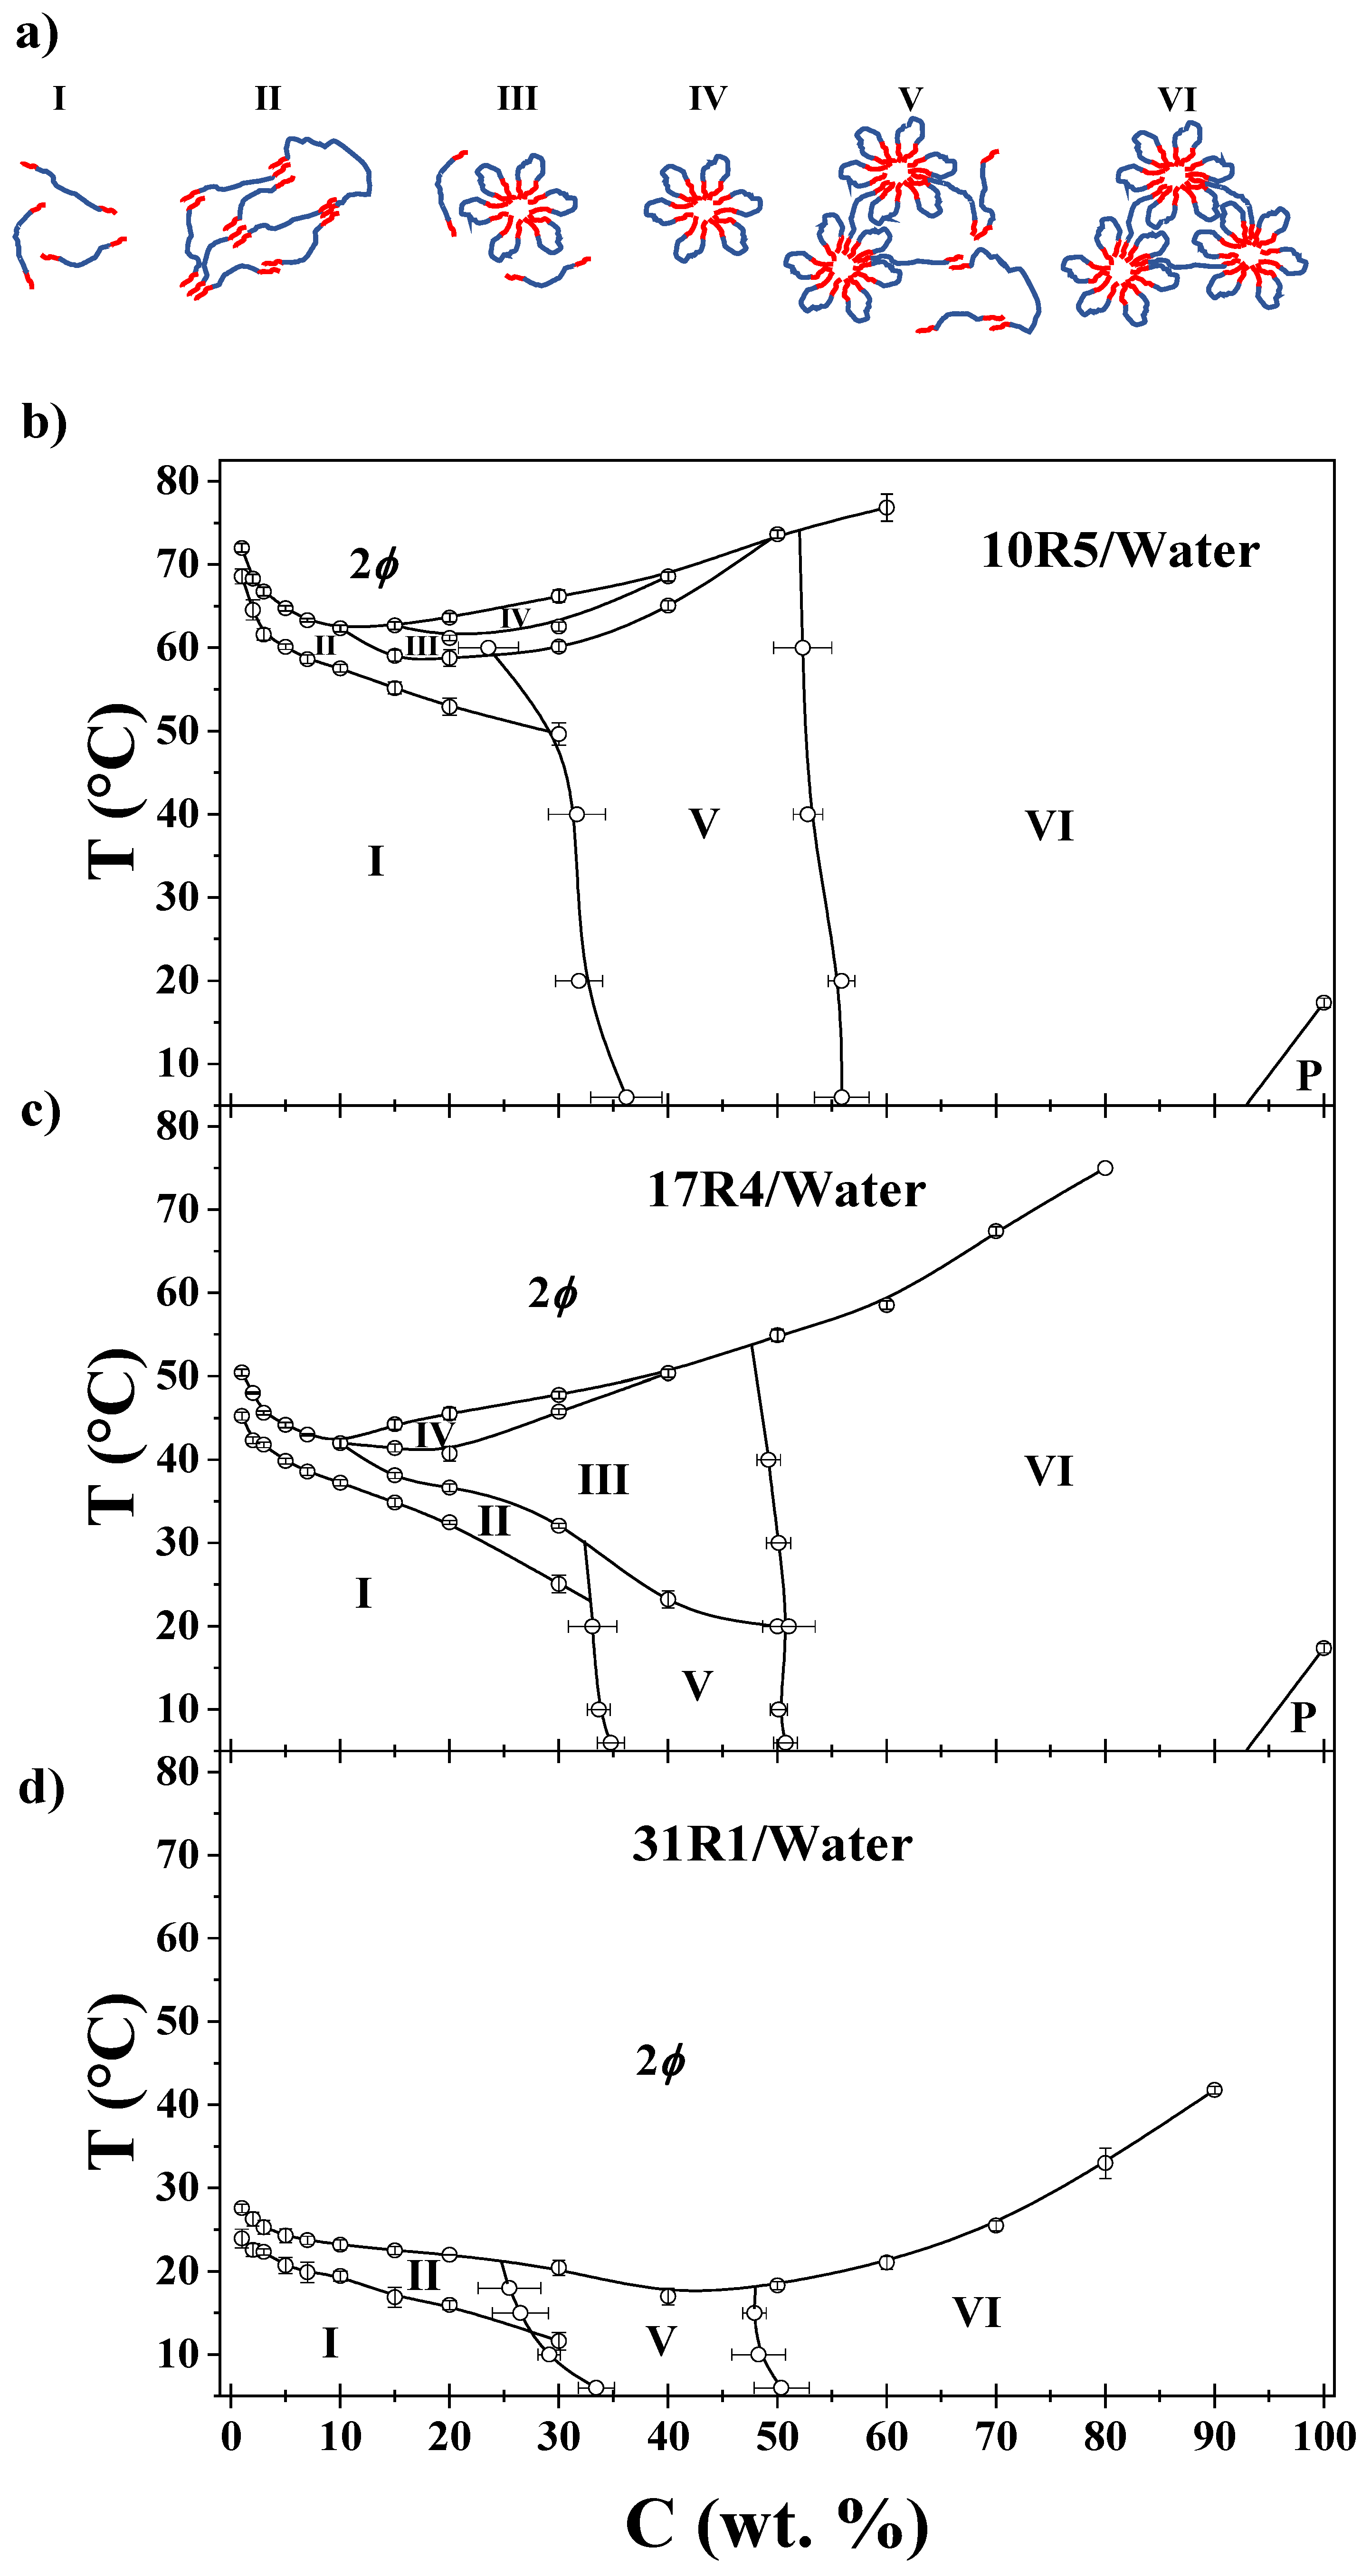

| Structure | Characteristics | System analyzed |
|---|---|---|
| Random networks |
|
10R5, 17R4, 25R8 |
| Flower-like micelles |
|
|
| 17R4 | ||
| Micellar networks |
|
10R5, 25R4, 25R8 |
| Lamellar Phase |
|
25R4, 25R8 |
Table 2.
Intercept α, dehydration energies (ΔEDH) and R2.
| System | Region | exp (α) | ΔEDH (kJ/mol) | R2 |
|---|---|---|---|---|
| 10R5/water | I | 0.406 ± 0.008 | 13.6 ± 0.02 | 0.9999 |
| II | 0.423 ± 0.031 | 13.47 ± 0.08 | 0.9996 | |
| III | 5.075 x 10⁻⁴ | 32.36 ± 0.95 | 0.9965 | |
| 17R4/water | I | 0.833 ± 0.014 | 12.55 ± 0.03 | 0.9999 |
| II | 0.610 ± 0.014 | 13.31 ± 0.04 | 0.9999 | |
| III | 2.359 x 10⁻¹⁷ | 113.64 ± 0.84 | 0.9988 | |
| 31R1/water | I | 1.027 ± 0.045 | 12.49 ± 0.12 | 0.9997 |
| II | 1.518 ± 0.027 | 11.57 ± 0.06 | 0.9997 | |
| III | 1.137 x 10-67 | 398.15 ± 50.9 | 0.9683 |
Disclaimer/Publisher’s Note: The statements, opinions and data contained in all publications are solely those of the individual author(s) and contributor(s) and not of MDPI and/or the editor(s). MDPI and/or the editor(s) disclaim responsibility for any injury to people or property resulting from any ideas, methods, instructions or products referred to in the content. |
© 2025 by the authors. Licensee MDPI, Basel, Switzerland. This article is an open access article distributed under the terms and conditions of the Creative Commons Attribution (CC BY) license (http://creativecommons.org/licenses/by/4.0/).
Copyright: This open access article is published under a Creative Commons CC BY 4.0 license, which permit the free download, distribution, and reuse, provided that the author and preprint are cited in any reuse.


