Submitted:
07 July 2025
Posted:
08 July 2025
You are already at the latest version
Abstract
Background/Objectives: Despite the biological plausibility and public health relevance of diet as a modifiable risk factor for depression, research specifically targeting peri- and post-menopausal women remains scarce. To address this gap, we conducted a scoping review mapping and synthesizing existing literature on diet and depression in this population. Methods: Studies were identified through Medline, EMBASE, PsycINFO, CENTRAL, Web of Science, and Scopus. After deduplication in Covidence, two reviewers independently screened titles, abstracts, and full texts using predefined eligibility criteria. Data were extracted using standardized forms and summarized in tables and figures. Methodological quality was assessed using the Cochrane RoB-2 tool for randomized trials and the National Heart, Lung, and Blood Institute (NHLBI) tools for cohort, cross-sectional, and case–control studies. Results: Thirty-nine studies—most with observational designs, published between 2020 and 2025, and focused on healthy peri- and/or post-menopausal women—were included. Investigated diet-related variables included dietary patterns, food groups, individual foods, and nutrients. All observational studies had moderate or high risk of bias, while over half of experimental studies had low risk of bias. Dietary patterns and vitamin D3 were the variables most consistently associated with depressive symptoms. In contrast, findings for other nutrients, foods, and food groups were inconsistent or conflicting. Conclusions: This review provides a comprehensive and up-to-date synthesis of evidence on diet and depression in peri- and post-menopausal women. By identifying critical gaps in the literature, particularly the need for high-quality prospective cohort studies and clinical trials, it offers a valuable foundation for guiding future research and informing health professionals working at the intersection of nutrition, psychiatry, and women’s health. Protocol registration: osf.io/b89r6.
Keywords:
nutrition
; dietary patterns
; foods
; nutrients
; depression
; depressive disorder
; perimenopause
; postmenopause
; women
; scoping review
1. Introduction
Depression is a pervasive mental health disorder that affected over 250 million individuals globally as of 2019, thereby ranking as the second leading cause of disability worldwide [1]. Beyond its psychological burden, depression significantly increases the risk of a range of comorbidities, including psychiatric conditions and cardiometabolic diseases [2,3,4]. Equally important, core symptoms of depression, such as persistent low mood, fatigue, and cognitive impairment, can severely impair one’s ability to carry out daily activities and fulfill social, familial, and professional responsibilities [5,6,7,8]. These impairments not only reduce quality of life [9,10,11,12] but also translate into substantial societal costs due to lost productivity and increased healthcare needs [5,6]. Given its significant individual and public health burden, improving the understanding, prevention, and management of depression remains a global health priority.
Importantly, depression does not affect all populations equally. Starting in adolescence, women are approximately twice as likely as men to experience depression, a disparity that is consistently observed across countries and cultures [7]. This gender difference is partly attributed to biological differences and psychosocial factors that increase women’s vulnerability to depression, particularly during specific reproductive life stages, like puberty, pregnancy, and the menopausal transition, which are often characterized as windows of vulnerability [8]. Although this period has historically been understudied, menopausal transition is associated with an approximately 2- to 5-fold higher risk of developing major depression or clinically significant depressive symptoms compared to pre-menopausal women [13,14,15,16,17,18,19,20]. Large cohort studies have demonstrated that even women with no prior depressive history may develop depressive symptoms during the menopausal transition [15,16,17,18,19,20]. Hormonal fluctuations, particularly declining estrogen levels, have been implicated in this increased risk [16,17,21], alongside psychosocial stressors, physical comorbidities, and age-related changes such as weight gain, body fat distribution and sleep disturbances [16,18]. Affected peri- and post-menopausal women tend to exhibit a distinct symptom profile, characterized by rapid mood swings, heightened irritability, paranoia, and pronounced fatigue, rather than the persistent low mood more typical in younger adults [22,23]. They have also shown a poorer response to standard antidepressant medications relative to pre-menopausal women [22,24,25,26,27]. This combination of increased prevalence, atypical symptomatology, and suboptimal treatment response in midlife women highlights a critical need for targeted research and interventions.
In recent years, growing attention has turned to modifiable lifestyle factors as potential levers for preventing or managing depression. Among these, diet has emerged as a particularly promising target, fueling the emerging field of nutritional psychiatry. This field explores how dietary patterns and nutrient intake influence mental health, with mounting evidence associating high-quality diets, such as the Mediterranean diet and anti-inflammatory diets, to reduced depression risk [28,29,30,31,32], and low-quality diets, characterized by high intakes of refined sugars and ultra-processed foods, to increased depression risk [33,34,35,36]. Biological mechanisms proposed to explain these associations include inflammatory pathways [37,38,39], oxidative stress [40,41,42], hypothalamic-pituitary-adrenal axis (HPA) function [43,44], neurogenesis [45,46], and gut microbiota composition [47,48]. Chronic low-grade inflammation, in particular, is thought to mediate the association between poor diet and depression [49,50].
Despite the biological plausibility and public health significance of diet as a modifiable risk factor for depression, research specifically focused on peri- and post-menopausal women remains relatively limited. To date, most diet-depression research has been conducted in general adult populations or specific population groups (e.g., young adults, older men and women combined), with limited attention paid to the unique context of midlife women. This is an important oversight, given that menopause-related changes may influence not only depression risk but also how dietary factors interact with neurobiological and emotional processes.
To our knowledge, no prior review has systematically mapped the existing evidence on diet and depression in this specific subgroup. Thus, the objective of the present scoping review was to comprehensively identify, characterize, and synthesize available studies examining diet-related variables and depressive symptoms in this population. By doing so, this review aims to clarify what is currently known about the topic, highlight key knowledge gaps, and inform future research efforts to support the development of more targeted, evidence-based dietary strategies for the prevention and management of depression in peri- and post-menopausal women.
2. Materials and Methods
This scoping review is reported following the Preferred Reporting Items for Systematic Reviews and Meta-Analyses checklist’s extension for Scoping Reviews (PRISMA-ScR) (see Supplementary Table 1) [51]. The methods used for this scoping review were informed by Arksey & O'Maley's (2005) framework for conducting scoping reviews [52] as well as Peters et al.'s (2015) guidelines for scoping reviews [53]. The initial protocol has been prospectively registered on the Open Science Framework (https://osf.io/b89r6/). The detailed final protocol has been published as a protocol paper [54].
2.1. Deviations from the Intended Protocol
The only deviation from the published protocol is that one additional database, namely the Cochrane Central Register of Controlled Trials (CENTRAL), was searched.
2.2. Step 1 – Identifying the Research Questions
This scoping review aimed to answer the following question: “To date, what is the available evidence on diet-related variables and depression in peri- and post-menopausal women?”. The sub-questions were:
- What are the characteristics of available evidence on diet-related variables and depression in peri- and post-menopausal women?
- What are the main findings of available evidence on diet-related variables and depression in peri- and post-menopausal women?
- What are the main research gaps on the topic of diet-related variables and depression in peri- and post-menopausal women?
2.3. Step 2 – Identifying the Relevant Studies
Studies examining the associations between diet-related variables and depression in peri- and post-menopausal women were systematically retrieved via Medline, EMBASE, PsycINFO, CENTRAL, Web of Science, and Scopus. The search was conducted from the inception of each database to November 15th, 2024. Languages were restricted to English and French. A backward citation tracking of all included articles was conducted to identify any other pertinent articles. The search strategies for all databases are available in Supplementary Tables 2–6 and the published protocol [54].
2.4. Step 3 – Study Selection
To be eligible for inclusion in this review, studies were required to meet the criteria
described below regarding the types of participants, exposures, interventions, comparators, outcomes, and study designs.
2.4.1. Type of Participants
Studies including (1) healthy peri- and post-menopausal women or (2) peri- and post-menopausal women with diagnoses of primary major or persistent depressive disorder prior to enrollment in the study were considered eligible for this review. No restrictions were applied as to participants’ age or race. Only studies focusing exclusively on women with chronic health conditions other than those mentioned above, women on sex hormone replacement therapy, and women who underwent hysterectomies were excluded.
2.4.2. Type of Exposures and Interventions
The exposures and interventions of the included studies could include a wide range of diet-related variables. Diet-related variables were only excluded if they were considered unusual, linked to an underlying health condition or surgical procedure, or were unlikely to be found in their unaltered forms in foods. As such, while studies assessing macronutrients, vitamins, minerals, and phytonutrients (e.g., phenolic compounds, nondigestible carbohydrates) supplements were considered eligible, those involving herbal supplements (e.g., Ginkgo biloba, ginseng, St. John’s Wort) or any pharmaceutical agents (e.g., Semaglutide, Naltrexone-bupropion, etc.) aimed at modifying eating behaviors, food intake, and/or nutrient metabolism were excluded. No restrictions were applied as to dietary intake assessment methods in observational studies nor intervention duration in experimental studies.
2.4.3. Type of Comparators
Experimental studies were considered eligible if the dietary intervention of interest was compared to (i) a placebo, (ii) another dietary intervention, or (iii) no intervention.
2.4.4. Type of Outcomes
Outcomes were limited to unipolar major and persistent depressive disorder with or without current treatment, as well as to depressive symptoms. No restrictions were applied as to the methods and tools used to assess depression and depressive symptoms. Studies focusing exclusively on depressive symptoms as part of the symptomatology of another physical (e.g., hypothyroid, anemia, cardiometabolic disorders, etc.) or mental health disorders (e.g., schizophrenia, eating disorders, personality disorders, declined cognitive functions, etc.) were excluded.
2.4.5. Type of Study Designs
Primary experimental (i.e., randomized controlled parallel and crossover trials with individual and cluster randomization), quasi-experimental (e.g., non-equivalent groups designs, pretest–posttest non-equivalent groups designs (NEGD), difference-in-differences designs, etc.) and observational (e.g., cohort, case-control, and cross-sectional studies) studies were considered eligible. Preclinical trials, case studies, and case series were excluded.
2.4.6. Selection of Studies
All records identified through the database search were imported into Covidence (https://www.covidence.org) and duplicates were removed. All remaining records were screened against the title and abstract independently by two authors (A.M.B. and M.D.). At this stage, articles were only excluded if it was clearly determined by the title or abstract that they did not meet the inclusion criteria. Articles deemed eligible based on the title and abstract underwent full-text reviewing by the same two assessors. Discrepancies between authors assessments were resolved through discussion and consensus.
2.5. Step 4 – Charting the Data
One author (A.M.B.) performed data extraction from papers of eligible studies. The following data was extracted: (i) authors, (ii) publication year, (iii) protocol registration number (where applicable), (vi) protocol publication reference (where applicable), (v) study location, (vi) study design, (vii) study duration (where applicable), (viii) participant recruitment type, (ix) type of randomization (where applicable), (x) number of participants, (xi) age, (xii) menopause stage(s), (xiii) dietary variable(s) name(s), (xiv) tools used to assess dietary variables, (xv) variables types, (xvi) outcome name, (xvii) tools used to assess depression or depressive symptoms, (xviii) quantitative results with description of statistical analysis type, and (xix) statistical analysis adjustments (where applicable).
2.6. Step 5 – Collating, Summarizing and Reporting Results
Three summary tables were produced to present the main characteristics and findings of the studies included in the review. A narrative summary of the general characteristics of included studies was performed, encompassing aspects related to the types of participants, exposures and interventions, outcomes, study types, and methodological quality. The main findings of the included studies were narratively summarized by type of nutritional exposure or intervention. Research gaps are highlighted and discussed in the discussion section of the manuscript.
2.7. Step 6 – Methodological Quality Appraisal
The risk of bias in randomized trials, cohort and cross-sectional studies, and case-control studies was assessed using the revised Cochrane risk-of-bias (RoB-2) tool [55], the National Heart, Lung, and Blood Institute (NHLBI) Quality Assessment Tool for Observational Cohort and Cross-Sectional Studies [56], and the NHLBI Quality Assessment Tool for Case-Control studies [57], respectively.
The Cochrane RoB-2 tool assesses five bias domains known to affect the results of randomized and quasi-randomized trials, namely, (i) bias arising from the randomization process, (ii) bias due to deviations from intended interventions, (iii) bias due to missing outcome data, (iv) bias in the measurement of the outcomes, and (v) bias in the selection of the reported results. Each of these domains contains guiding questions, which were answered by “yes”, “probably yes”, “no”, “probably no”, or “no information”. Using the judgements reached for each domain, the studies themselves were rated as:
- Being at low risk of bias when all domains were rated as such;
- Raising some concerns when at least one domain was rated as such, but no domain was rated as being at high risk of bias;
- Being at high risk of bias when at least one domain was rated as such, or when multiple domains were rated as raising some concerns.
The NHLBI Quality Assessment Tool for Observational Cohort and Cross-Sectional Studies and the NHLBI Quality Assessment Tool for Case-Control Studies consist of 14 and 12 items, respectively, assessing common sources of bias in observational studies, namely, (i) bias from participants’ recruitment or selection methods and sample size; (ii) bias in the measurement of the exposures; (iii) bias in the measurement of the outcomes; (iv) bias due to the handling of potential confounders; and (v) bias in the selection of the reported results. Each item included in the NHLBI Quality Assessment Tools was answered by “yes”, “no”, or “no information”. Cohort and cross-sectional studies were considered as being at a “low risk of bias” when the answer to ≥ 13 items was “yes”; at a “moderate risk of bias” when the answer to 10, 11, or 12 items was “yes”; and at a “high risk of bias” when the answer to <10 items was “yes”. Case-control studies were considered to be at a “low risk of bias” when the answer to ≥ 11 items was “yes”; at a “moderate risk of bias” when the answer to 8, 9, or 10 items was “yes”; and at a “high risk of bias” when the answer to < 8 items was “yes”.
3. Results
Figure 1 illustrates the study identification and selection process. The initial database searches yielded 1,928 records, with one additional record found through backward citation tracking. From this total, 880 duplicates were removed, leaving 1,049 unique records. From this total, 993 records were eliminated based on title and abstract, leaving 56 records to be retrieved for full-text review. During the full-text review, 18 papers were excluded for wrong language (n = 2, [58,59]), wrong publication type (n = 2, [60,61]), wrong population (n = 7, [62,63,64,65,66,67,68]), wrong exposure or intervention (n = 4, [69,70,71,72]), and wrong outcome (n = 3, [73,74,75]) (see Supplementary Table 7), leaving 38 papers to be included in this review. Out of this total, 10 papers reported results from the Studies of Women’s Health Across the Nation (SWAN) [76,77,78,79,80,81,82,83,84,85] and five reported results from the Women’s Health Initiative (WHI) studies [86,87,88,89,90]. Unless otherwise stated, all reported numbers and percentages are out of a total of 38 papers.
3.1. Study Characteristics
3.1.1. Type of Participants
Sample sizes were [91] highly variable, with the smallest being 20 [92] and the largest 81,189 [86]. Participating women were aged between 40 and 85 years and were generally healthy. The majority of included papers reported on studies conducted among post-menopausal women (n=21, 55.2%, [86,87,88,89,90,93,94,95,96,97,98,99,100,101,102,103,104,105,106,107,108]), six (15.8%, [76,78,79,80,81,83]) reported on studies conducted among peri-menopausal women, six (15.8%, [92,109,110,111,112,113]) reported on studies conducted among peri- and post-menopausal women, and five (13.2%, [77,82,83,84,85]) reported on studies conducted among pre- and post-menopausal women.
Across all studies that included post-menopausal women, post-menopause was defined as the absence of menses for at least 12 months and women's menopause stage categorization was made based on self-reported duration since the last menses or the date of last menses [86,87,88,89,90,92,93,94,95,96,97,98,99,100,101,102,103,104,105,106,107,108,109,110,111,112,113]. In most studies, peri-menopause was defined as menstrual irregularities or an absence of menses for less than 12 months, accompanied by the presence of peri-menopausal symptoms (e.g., vasomotor symptoms, urogenital symptoms) [77,82,83,84,85,92,109,110,112,113]. One study determined peri-menopausal status based on women's age (45 to 55 years), as data on peri-menopausal symptoms and amenorrhea were not collected as part of the larger national survey (National Health and Nutrition Examination Survey) used for study analyses [111]. In the SWAN cohort study, early peri-menopause was specifically defined as menstrual bleeding in the past three months accompanied by changes in cycle regularity [77,82,83,84,85].
3.1.2. Type of Exposures, Interventions, and Comparators
Among included papers, the most frequent nutritional exposures and interventions were nutrients and other food components (n=30, 78.9%, [76,77,78,79,80,81,82,83,84,85,86,87,88,92,95,96,99,101,102,103,104,105,106,107,109,110,112,113,114]), followed by dietary patterns (n=7, 18.4%, [87,90,93,94,97,98,108]), and foods and food groups (n=2, 5.3%, [100,111]). Several studies focusing on nutrients and other food components assessed intakes or provided more than one nutrient or food component as an intervention (n=7, 23.3%, [99,101,102,103,105,109,110]). One study focused on both nutrients and other food components, as well as dietary patterns [87].
Dietary patterns were whole-diet interventions in experimental studies (n=2, [90,108]) and dietary patterns, defined either a priori (n=2, [87,94]) or a posteriori (n=3, [93,97,98]), in observational studies. Whole-diet interventions included the low-fat diet (n=2, [90,108]) and the Dietary Approach to Stop Hypertension (DASH) (n=1, [108]). Dietary patterns defined a priori were the Dietary Inflammatory Index (DII) (n=1, [94]) and the glycemic index (n=1, [87]). Dietary patterns defined a posteriori included the Dietary Total Antioxidant Capacity (DTAC) (n=1, [93]), as well as healthy (i.e., “healthy” and “whole-plant food”) (n=2, [97]) and highly processed (i.e., “processed food”, “sweets”, and “traditional Tianjin”) (n=2, [97]) dietary patterns.
Food and food groups included legumes (n=2, [110,111]), vegetables (n=1, [110]), fruit (n=1, [110]), milk and plain yogurt (n=1, [110]), ultra-processed foods (n=1, [110]), sweet foods (n=1, [110]), sugar-sweetened beverages (n=1, [110]), and saffron (n=1, [106]).
Most frequently assessed nutrients were dietary fiber (n=6, [80,87,96,110,113]), vitamin D3 (n=5, [86,89,107,110,114]), eicosapentaenoic acid (EPA) + docosahexaenoic acid (DHA) (n=4, [88,92,104,112]), magnesium (n=4, [99,102,103,110]), zinc (n=4, [99,102,103,110]), vitamin A and vitamin A precursors (n=3, [81,82,109]), vitamin E (n=3, [105,109,110]), vitamin B9 (n=3, [101,109,110]), EPA (n=2, [88,104]), DHA (n=2, [88,104]), total omega-3 fatty acids (n=2, [95,110]), saturated fatty acids (SFAs) (n=2, [84,110]), trans fatty acids (TFAs) (n=2, [85,110]), vitamin B12 (n=2, [101,110]), vitamin C (n=2, [83,110]), copper (n=2, [103,110]), selenium (n=2, [103,110]), total carbohydrates (n=1, [110]), added sugar (n=1, [87]), total lipids (n=1, [110]), monounsaturated fatty acids (MUFAs) (n=1, [110]), total omega-6 fatty acids (n=1, [110]), linoleic acid (n=1, [77]), oleic acid (n=1, [77]), total proteins (n=1, [110]), manganese (n=1, [79]), and curcumin (n=1, [105]).
3.1.3. Type of Outcomes
Depressive symptoms were assessed using various validated tools, namely the Centre for Epidemiologic Studies Depression Scale (CES-D) (n=16, [76,77,78,79,80,81,82,83,84,85,90,98,101,104,110,111]), the Beck’s Depression Inventory (BDI) (n=4, [99,102,103,114]), the 9-item Patient Health Questionnaire (PHQ) (n=3, [94,96,109]), the 8-item Burnam Scale (BS) (n=3, [88]), the 22-item Depression Anxiety Stress Scale (DASS) (n=2, [93]), the 21-item Hamilton Depression Rating Scale (HDRS) (n=1, [106]), the Montgomery–Åsberg Depression Rating Scale (MADRS) (n=1, [92]), the 20-Item Hopkins Symptoms Checklist Depression Scale (HSCL-D) (n=1, [112]), the 18-item Brief Symptom Inventory (BSI) (n=1, [107]), the Zung Self-Rating Depression Scale (ZSRDS) (n=1, [97]), the Women’s Health Questionnaire (WHQ) (n=1, [100]), the Greene Climacteric Scale (GCS) (n=1, [105]), the depression subscale of the 37-item Profile of Mood State (POMS) (n=1, [108]), and a non-reported scale (n=1, [95]). In addition to the use of a questionnaire to identify depressive symptoms, some studies considered participants taking antidepressants as having depressive symptoms (n=6, [89]), and one study used self-reported depression diagnosis as indicative of depressive symptoms [95].
3.1.4. Type of Study Designs
Out of the 38 studies included in this review, 29 (76.3%, [72,76,77,78,79,80,81,82,83,84,85,86,87,88,93,94,95,96,97,98,100,101,102,103,104,109,110,111,114]) were observational, eight (21.1%, [89,90,105,106,107,108,112,113]) were randomized-controlled trials (RCTs), and one (2.6%, [92]) was a quasi-experimental pretest-posttest NEGD study. Observational studies were cross-sectional (n=21, 72.4%, [72,76,77,78,79,80,81,82,83,93,94,95,96,97,98,100,101,102,103,109,110,114]), prospective cohort (n=7, 24.1%, [84,85,86,87,88,104,111]), or case-control (n=1, 3.4%, [99]) studies.
Articles included in this review were all published between 2009 and 2024. More specifically, 19 papers (50.0%, [72,76,77,78,79,80,81,82,83,84,85,94,95,96,103,105,109,110,113,114]), were published between 2020 and 2024, 10 papers (26.3%, [87,90,93,97,98,99,100,104,106,107]) were published between 2015 and 2019, eight papers (21.1%, [86,88,89,92,101,102,108,111]) were published between 2010 and 2014, and one paper (2.6%, [112]) was published in 2009. Over half (n=22, 57.9%, [72,76,77,78,79,80,81,82,83,84,85,86,87,88,89,90,92,94,96,104,107,111,112]) of included papers reported on studies conducted in North America, 10 papers (26.3%, [93,95,97,98,99,101,105,106,109,113]) reported on studies conducted in Asia, three papers (7.9%, [102,103,114]) reported on studies conducted in Europe, two papers (5.3%, [100,110]) reported on studies conducted in South America, and one (2.6%, [108]) reported on a study conducted in Australia.
3.1.5. Methodological Quality
Out of the 29 observational studies, three (10.3%, [86,87,88]) were at low risk of bias, five (17.2%, [84,85,96,104,111]) were at moderate risk of bias, while the remaining 21 (72.4%, [72,75,76,77,78,79,80,81,82,83,93,94,95,97,98,99,100,101,102,103,109,110,114]) were at high risk of bias (See Supplementary Table 8 and 9). Out of the nine (quasi)-experimental studies, five (55.5%, [105,106,107,112,113]) were at low risk of bias, while the remaining four (44.5%, [89,90,92,108]) were at high risk of bias (See Supplementary Table 10).
3.2. Study of Study Findings
3.2.1. Dietary Patterns
Healthy Dietary Patterns
The associations between healthy dietary patterns and depression were assessed in three cross-sectional studies [93,97,98] and two RCTs [90,108], all conducted among post-menopausal women. One cross-sectional study of 222 women by Abshirini et al. (2019) reported a significant negative association between DTAC and depressive symptoms [93]. Similarly, two other cross-sectional studies with sample sizes of 953 [97] and 906 [98] women, respectively, found significant negative associations between adherence to a “healthy” [97] or a “whole-plant food” [98] diet and depressive symptoms. Both RCTs provided further support for the beneficial effect of healthy dietary patterns on depressive symptoms [90,108]. Specifically, a one-year open-label RCT involving 48,834 women found that participants following a low-fat diet experienced significant reductions in depressive symptoms compared to those receiving no intervention [90]. Similarly, a 14-week open-label RCT comparing the effects of the DASH diet and a low-fat diet in a sample of 95 women found that, although no significant differences were observed between the two diets, both interventions significantly decreased depressive symptoms from pre- to post-intervention [108].
Unhealthy Dietary Patterns
The associations between unhealthy dietary patterns and depression were assessed in three cross-sectional studies [94,97,98] and one prospective cohort study [87], all conducted among post-menopausal women. One cross-sectional study of 393 women, Azarmanesh et al. (2022) identified a significant positive association between DII and depressive symptoms [94]. Similarly, two other cross-sectional studies, involving 953 participants [97] and 906 participants [98], respectively, reported significant positive associations between adherence to a “sweets” diet [97], a “traditional Tianjin” diet [97], a “processed food” diet [98], or an “animal food” diet [98] and depressive symptoms. Additionally, a prospective cohort study involving 87,618 women reported a significant positive association between dietary glycemic index at baseline and depressive symptoms at the three-year follow-up [87].
3.2.2. Food and Food Groups
The associations between foods and food groups and depressive symptoms were assessed in one cross-sectional study [100], one prospective cohort study [111], and one RCT [106]. In a cross-sectional study of 213 post-menopausal women, Noll et al. (2019) found a significant negative association between vegetable intake and depressive symptoms, while intakes of ultra-processed food, fruit, legumes, milk and plain yogurt, sugar-sweetened beverages, and sweet foods were not signficantly associated with depressive symptoms [100]. Li et al.’s (2010) prospective cohort study involving 3,302 women reported a U-shaped association between legume intake and severe depressed mood among peri-menopausal women (n=1,657), but not among post-menopausal women (n=1,645) [111]. Specifically, in peri-menopausal women, moderate (1-2x/wk) legume intake was associated with a lower risk of severely depressed mood as compared to infrequent (<1x/wk) intake, while no significant differences were observed when comparing frequent (>2x/wk) and infrequent (<1x/wk) legume intake [111]. Finally, Kashani et al.’s (2018) triple-blind RCT involving 60 post-menopausal women showed that daily supplementation with 30 mg of saffron for six weeks significantly reduced depressive symptoms compared to a placebo [106].
3.2.3. Macronutrients
Total Carbohydrate Intake
The association between between total carbohydrate intake and depressive symptoms was assessed in one cross-sectional study involving 1,906 peri- and post-menopausal women [110]. No significant association was observed between these variables [110].
Added Sugar Intake
The association between added sugar intake and depressive symptoms was investigated in one prospective cohort study of 69,954 post-menopausal women [87]. Specifically, Gangwisch et al. (2015) reported that baseline consumption of added sugars was positively associated with depressive symptoms at the three-year follow-up [87].
Dietary Fiber Intake
The association between dietary fiber intake and depressive symptoms was assessed in three cross-sectional studies [80,96,110], one prospective cohort study [87], and one RCT [113]. Among the cross-sectional studies conducted in peri- and post-menopausal women, two studies involving 6,060 and 393 women, respectively, found no significant associations between dietary fiber intake and depressive symptoms [80,96], while one study involving 1,906 women reported a significant negative association between these variables [110]. Similarly, Gangwisch et al.’s (2015) prospective cohort study involving 69,954 post-menopausal women observed a significant negative association between baseline dietary fiber intake and depressive symptoms at the three-year follow-up [87]. In contrast, a 6-week triple-blind RCT including 81 peri- and post-menopausal women comparing the effects of daily consumption of prebiotic-enriched yogurt to that of regular yogurt found no significant effects on depressive symptoms [113].
Total Fat Intake
The association between total fat intake and depressive symptoms was assessed in one cross-sectional study conducted in a sample of 1,906 peri- and post-menopausal women [110]. No significant association was observed between these variables [110].
MUFA Intake
The association between MUFA intake and depressive symptoms was assessed in two cross-sectional studies [77,110]. In a study involving 1,906 peri- and post-menopausal women, Oldra et al. (2020) found no significant association between total MUFA intake and depressive symptoms [110]. Conversely, in a sample of 3,305 pre- and peri-menopausal women, , Li et al. (2020b) found that oleic acid and linoleic acid intakes were both positively associated with depressive symptoms, independent of menopause status [77].
PUFA Intake
Total PUFA Intake: The association between total PUFA intake and depressive symptoms was assessed in one cross-sectional study involving including 1,906 peri- and post-menopausal women [110]. No significant association was observed between these variables [110].
Total Omega-3 PUFA Intake: The association between total omega-3 PUFA intake and depressive symptoms was assessed in two cross-sectional studies [76,110] and one prospective cohort study [88]. In a cross-sectional study involving 1,305 peri-menopausal women, Li et al. (2020a) found a significant negative association between total omega-3 PUFA intake and depressive symptoms [76]. In contrast, in a sample of 1,906 peri- and post-menopausal women, Oldra et al. (2020) found no significant association between these variables [110]. Supporting Oldra et al. (2020) findings, in a cohort of 1,746 post-menopausal women, Persons et al. (2014) found no significant association between total omega-3 PUFA intake at study baseline and depressive symptoms at the three-year follow-up [88].
DHA Intake: The association between DHA intake and depressive symptoms was assessed in two prospective cohort studies conducted among post-menopausal women [88,104]. In a cohort of 1,746 women, Persons et al. (2014) found that DHA intake at study baseline was not associated with depressive symptoms at the three-year follow-up [88]. Conversely, examining data from 2,157 women, Colangelo et al. (2017) found that DHA intake at study baseline was positively associated with depressive symptoms at the three-year follow-up [104].
EPA Intake: The association between EPA intake and depressive symptoms was assessed in two prospective cohort studies conducted among post-menopausal women [88,104]. In a cohort of 1,746 women, Persons et al. (2014) found that EPA intake at study baseline was not associated with depressive symptoms at the three-year follow-up [88]. Conversely, examining data from 2,157 women, Colangelo et al. (2017) found that DHA intake at study baseline was positively associated with depressive symptoms at the three-year follow-up [104].
DHA+EPA Intake: The association between DHA+EPA intake and depressive symptoms was assessed in two prospective cohort studies [88,104], one quasi-experimental pretest-posttest NEGD study [92], and one RCT [112]. In a cohort of 1,746 women, Persons et al. (2014) found that DHA+EPA intake at study baseline was negatively associated with depressive symptoms at the three-year follow-up [88]. Conversely, examining data from 2,157 women, Colangelo et al. (2017) found that DHA+EPA intake at study baseline was positively associated with depressive symptoms at the three-year follow-up [104]. In a one quasi-experimental pretest-posttest NEGD study involving 20 peri- and post-menopausal women, Freeman et al. (2011) observed significant reductions in depressive symptoms following eight weeks of daily supplementation with DHA (375 mg) and EPA (465 mg) [92]. Similarly, in a 8-week RCT involving 120 peri- and post-menopausal women, Lucas et al. (2009) found that daily supplementation with DHA (150 mg) and EPA (1,005 mg) was associated with a significantly greater reduction in depressive symptoms compared to placebo, but this effect was only evident when analyses were restricted to women without a major depressive episode at baseline, who comprised approximately 75% of the study sample [112].
Total Omega-6 PUFA Intake: The association between total omega-3 PUFA intake and depressive symptoms was assessed in one cross-sectional study involving 1,906 peri- and post-menopausal women [110]. No significant association was observed between these variables [110].
SFA Intake
The association between SFA intake and depressive symptoms was assessed in one cross-sectional study [110] and one prospective cohort study [84], both conducted in peri- and post-menopausal women. In a cross-sectional study involving 1,906 women, Oldra et al. (2020) found no significant association between these two variables [110]. Conversely, in a cohort of 1,579 women, Li et al. (2020f) found that SFA intake at study baseline was positively associated with depressive symptoms at the four-year follow-up, independent of menopause status [84].
TFA Intake
The association between TFA intake and depressive symptoms was assessed in one cross-sectional study [78] and one prospective cohort study [85]. In a cross-sectional study involving 1,416 peri-menopausal women, Li et al. (2020c) found no significant association between these two variables [78]. Conversely, in a cohort of 3,004 pre- and peri-menopausal women, Li et al. (2020g) found that TFA intake at study baseline was positively associated with depressive symptoms at the five-year follow-up, independent of menopause status [85].
Total Protein Intake
3.2.4. Micronutrients
Vitamin A and Vitamin A Precursors Intake or Plasma Levels
The association between plasma vitamin A levels, provitamin A intake, and β-carotene intake were assessed in one cross-sectional study involving 1,770 peri- and postmenopausal women [109], in one cross-sectional study involving 3,054 pre- and peri-menopausal women [83], and in one cross-sectional study involving 1,400 peri-menopausal women [81], respectively. All three studies observend no significant associations between the dietary variables and depressive symptoms [81,82,109].
Vitamin C Intake
The association between vitamin C intake and depressive symptoms was assessed in two cross-sectional studies [83,110]. In a sample of 1,906 peri- and post-menopausal women, Oldra et al. (2020) found a negative association vitamin C intake and depressive symptoms [110]. Similarly, assessing a sample of 3,043 pre- and peri-menopausal women, Li et al. (2022b) found that vitamin C intake was negatively associated with depressive symptoms, independent of menopause status [83].
Vitamin D3 Intake or Status
The association between vitamin D3 intake or status and depressive symptoms was assessed in two cross-sectional studies [110,114], one prospective cohort study [86], and two RCTs [89,107]. For studies with cross-sectional designs, Oldra et al. (2020) found a negative association between vitamin D3 intake and depressive symptoms in a sample of 1,906 peri- and post-menopausal women [110], while Kostecka et al. (2022) found no significant association between vitamin D3 status and depressive symptoms in a sample of 56 peri-menopausal women [114]. Supporting Oldra et al. (2020) findings, Bertone-Johnson et al. (2011) observed, in a cohort study of 81,189 post-menopausal women, a negative association between vitamin D3 intake at study baseline and depressive symptoms at the three-year [86]. However, two triple-blind RCTs assessing daily supplementation with 1,000 IU of vitamin D3 for three years [89] and daily supplementation with 2,000 IU of vitamin D3 for one year [107] in samples of 36,282 and 218 post-menopausal women, respectively, reported no significant effects on depressive symptoms compared to placebo.
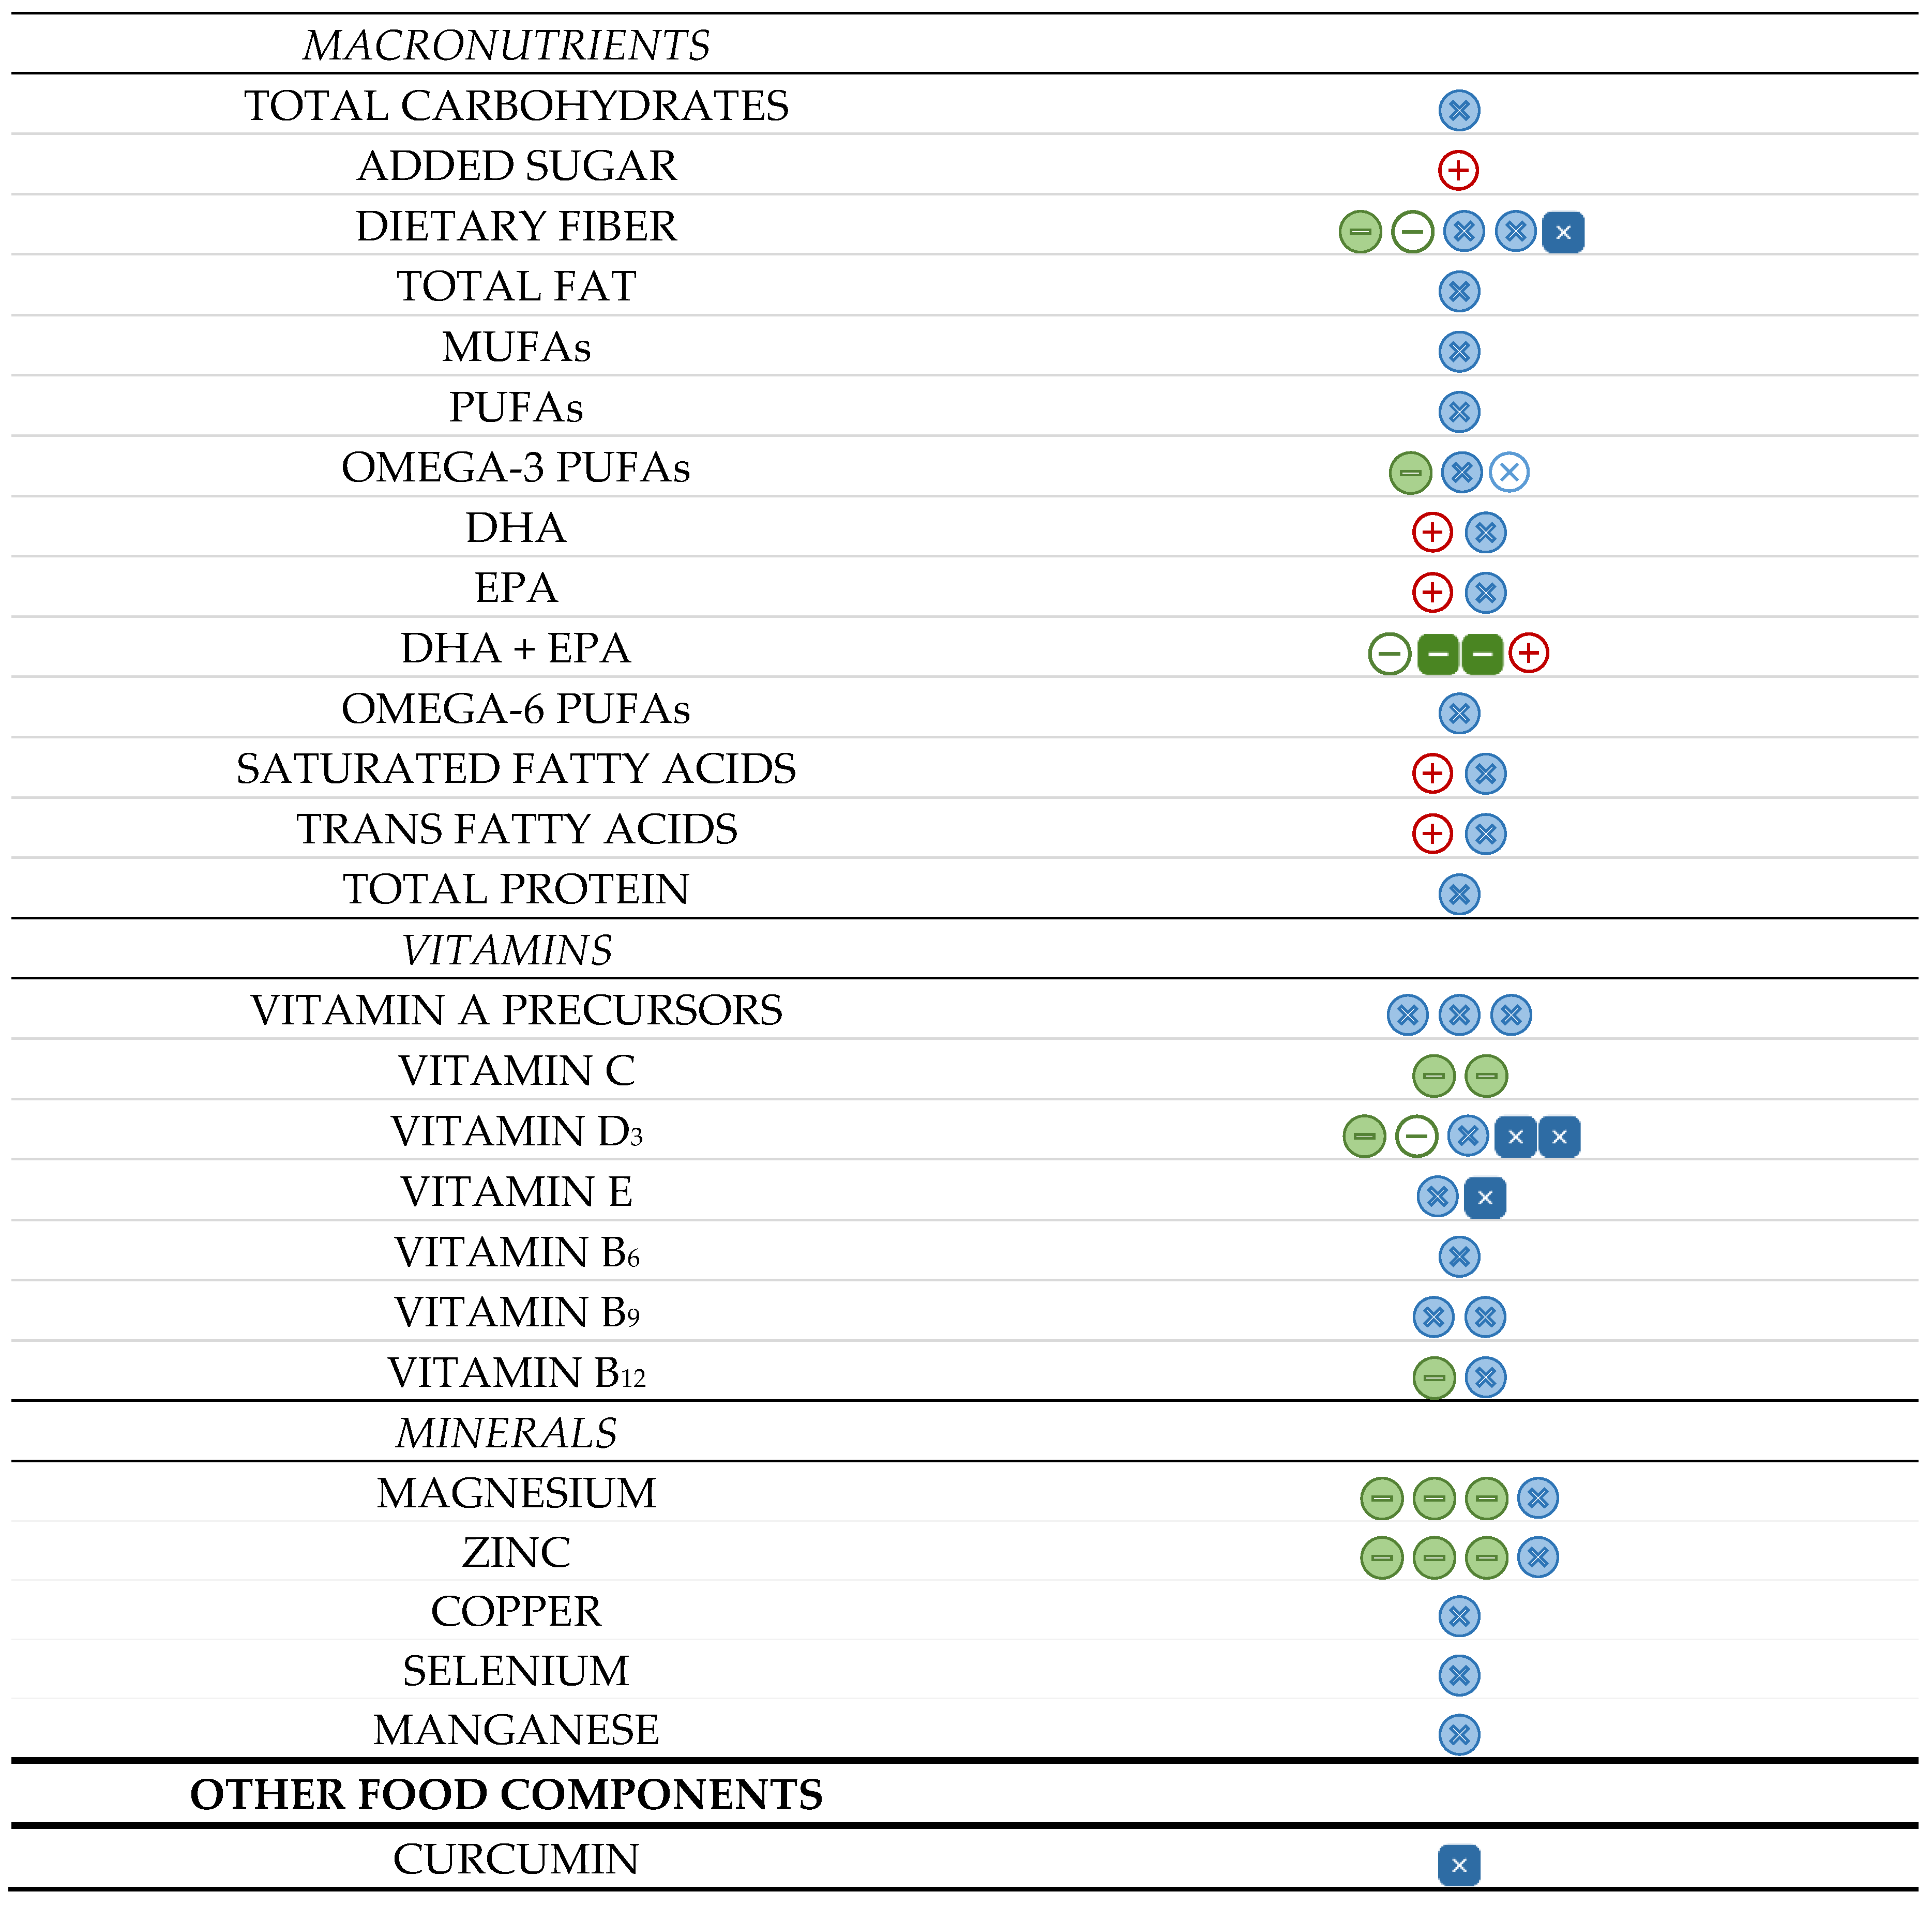
Figure 2.
Summary of the direction and significance of associations between dietary-related variables and depressive symptoms among peri- and post-menopausal women. Each icon represents one paper.  (full circles) represent cross-sectional studies,
  (empty circles) represent prospective cohort studies, and
  (full squares) represent experimental studies. The colours green, red and blue indicate negative (-), positive (+), and null (x) associations, respectively.
(full circles) represent cross-sectional studies, (empty circles) represent prospective cohort studies, and (full squares) represent experimental studies. The colours green, red and blue indicate negative (-), positive (+), and null (x) associations, respectively.
Figure 2.
Summary of the direction and significance of associations between dietary-related variables and depressive symptoms among peri- and post-menopausal women. Each icon represents one paper. (full circles) represent cross-sectional studies, (empty circles) represent prospective cohort studies, and (full squares) represent experimental studies. The colours green, red and blue indicate negative (-), positive (+), and null (x) associations, respectively.
(full circles) represent cross-sectional studies, (empty circles) represent prospective cohort studies, and (full squares) represent experimental studies. The colours green, red and blue indicate negative (-), positive (+), and null (x) associations, respectively.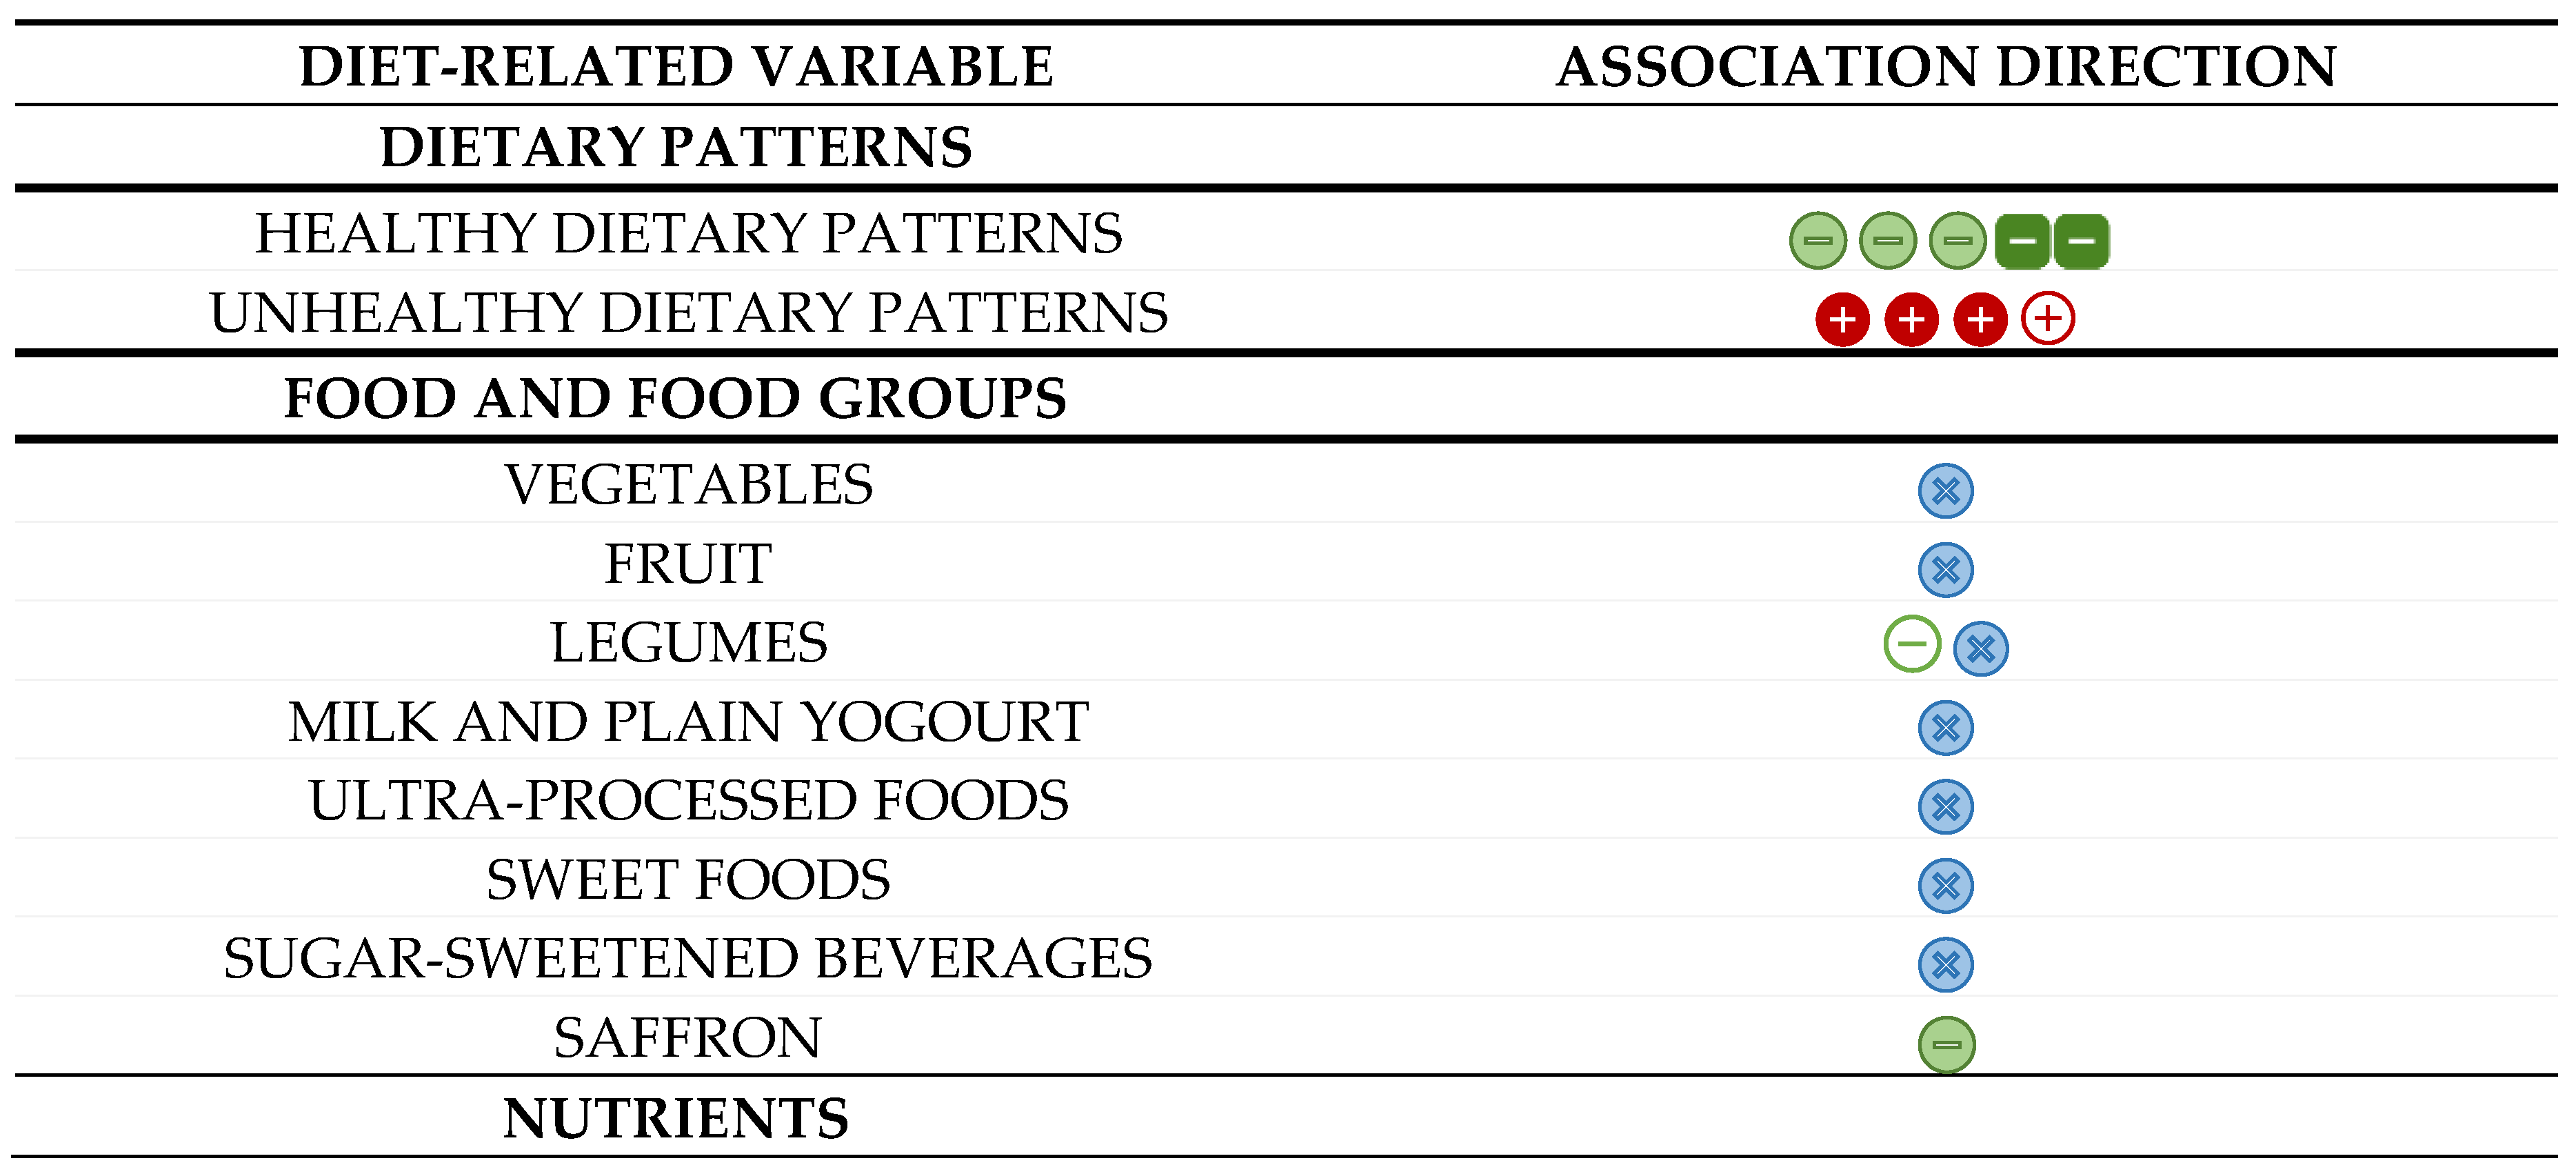
Vitamin E Intake or Plasma Levels
The association between plasma vitamin E levels or intake and depressive symptoms was assessed in one cross-sectional study involving 1,770 peri- and postmenopausal women [109] and one triple-blind RCT involving 81 post-menopausal women [105]. In their cross-sectional study, Lee et al. (2023) reported no significant association between plasma vitamin E levels and depressive symptoms [109]. Similarly, in their triple-blind RCT of daily supplementation with 1,000 mg of vitamin E for a 8-week period, Farshbaf-Khalili et al. (2022) observend no significant effect of the intervention as compared to placebo [105].
Vitamin B6 Intake
The association between vitamin B6 intake and depressive symptoms was assessed in one cross-sectional study involving 1,906 peri- and post-menopausal women [110]. No significant association was observed between these variables [110].
Vitamin B9 Intake or Plasma/Serum Levels
The association between vitamin B9 intake and depressive symptoms was assessed in one cross-sectional study involving 1,906 peri- and post-menopausal women [110], while the association between plasma vitamin B9 levels and depressive symptoms was assessed in one cross-sectional study involving 1,770 peri- and post-menopausal women [109] and one cross-sectional study involving 96 post-menopausal women [101]. All three studies observed no significant associations between the dietary variables and depressive symptoms [101,109,110].
Vitamin B12 Intake or Plasma Levels
The association between vitamin B12 intake and depressive symptoms was assessed in one cross-sectional study involving 1,906 peri- and post-menopausal women [110], while the association between plasma vitamin B12 levels and depressive symptoms was assessed in one cross-sectional study involving 96 post-menopausal women [101]. While Oldra et al. (2020) found a negative association between vitamin B12 intake and depressive symptoms [110], Lee et al. (2023) observed no significant associations between plasma vitamin B12 levels and depressive symptoms [101].
Magnesium Intake or Plasma/Serum Levels
The association between magnesium intake and depressive symptoms was assessed in one cross-sectional study involving 1,906 peri- and post-menopausal women [110], while the association between magnesium plasma or serum levels and depressive symptoms was assessed in two cross-sectional studies involving 323 [102] and 298 [103] post-menopausal women, respectively, and one case-control study involving 171 [99] post-menopausal women. Oldra et al. (2020) reported a significant negative association between magnesium intake and depressive symptoms [110]. Similarly, Stanislawska et al. (2014) [102] and Nazari et al. (2019) [99] also both found negative association between plasma or serum magnesium levels and depressive symptoms. In contrast, Wieder-Huszla et al. (2020) found no significant association between serum magnesium levels and depressive symptoms [103].
Zinc Intake or Plasma/Serum Levels
The association between zinc intake and depressive symptoms was assessed in one cross-sectional study involving 1,906 peri- and post-menopausal women [110], while the association between plasma or serum sinc levels and depressive symptoms was assessed in was assessed in two cross-sectional studies involving 323 [102] and 298 [103] post-menopausal women, respectively, and one case-control study involving 171 [99] post-menopausal women. Oldra et al. (2020) reported a significant negative association between zinc intake and depressive symptoms [110]. Similarly, Stanislawska et al. (2014) [102] and Nazari et al. (2019) [99] also both found negative association between plasma or serum zinc levels and depressive symptoms. In contrast, Wieder-Huszla et al. (2020) found no significant association between serum zinc levels and depressive symptoms [103].

Table 2.
Study characteristics and findings summary from cross-sectional (n=21) and case-control* (n=1) studies on diet and depressive symptoms in peri- and post-menopausal women.
Table 2.
Study characteristics and findings summary from cross-sectional (n=21) and case-control* (n=1) studies on diet and depressive symptoms in peri- and post-menopausal women.
| Authors (year) Country |
Population | Exposure | Outcome | Statistical adjustments | Results | RoB |
|---|---|---|---|---|---|---|
| Abshirini et al. (2019) [93] Iran |
n=175 Post-MP |
DTAC Method: FFQ (147 items) and PCA |
Depressive symptoms Method: DASS-42 |
SEC; MPS | • DTAC was negatively associated with depressive symptoms (β=-0.11, p=0.03). | 9/15
|
| Azarmanesh et al. (2022) [94] United States |
n=2,392 Post-MP |
DII Method: 24h dietary recall and DII |
Depressive symptoms Method: PHQ-9 |
SEC; Anthropometrics; Health behaviors | • DII was positively associated with depressive symptoms (Q4 vs. Q1, OR: 2.1, 95%CI: 1.1–4.3). | 9/15
|
| Chae et al. (2021) [95] South Korea |
n=4,150 Post-MP |
Omega-3 PUFA intake Method: 24h dietary recall |
Depression dx or symptoms Method: Dx or NR questionnaire |
SEC; Anthropometrics; Health behaviors; Diet | • Omega-3 PUFA intake was negatively associated with depression dx or symptoms (Q5 vs. Q1, OR: 0.52, 95%CI: 0.33–0.83). | 9/15
|
| Kim et al. (2021) [96] United States |
n=2,858 Post-MP |
Dietary fiber intake Method: 24h dietary recall |
Depressive symptoms Method: PHQ-9 |
SEC; Anthropometrics; Health behaviors; Chronic diseases | • Dietary fiber intake was not associated with depressive symptoms. | 10/15
|
| Kostecka et al. (2022) [114] Poland |
n=191 Peri-MP |
Vit. D3 status Method: NR |
Depressive symptoms Method: BDI |
None reported | • Vit. D3 status was not associated with depressive symptoms. | 8/15
|
| Lee et al. (2023) [109] South Korea |
n=1,770 Peri/Post-MN |
Vit. B9, A and E serum levels Method: NR |
Depressive symptoms Method: PHQ-9 |
SEC; Health behaviors | • Vit. B9, A and E serum levels were not associated with depressive symptoms. | 9/15
|
| Li et al. (2020a) [76] United States |
n=1,406 Peri-MN |
Omega-3 PUFA intake Method: FFQ (103 items) |
Depressive symptoms Method: CES-D |
SEC; Anthropometrics; Health behaviors; Diet; SH | • Omega-3 PUFA intake was negatively associated with depressive symptoms (Q4 vs. Q1, OR: 0.06, 95%CI: 0.01–0.46). | 9/15
|
| Li et al. (2020b) [77] United States |
n=2,793 Pre/peri-MN |
Oleic and linoleic acid intakes Method: FFQ (103 items) |
Depressive symptoms Method: CES-D |
SEC; MPS; Anthropometrics; Health behaviors | • Oleic (Q4 vs. Q1, OR: 2.00, 95%CI: 1.30–3.06) and linoleic (Q4 vs. Q1, OR: 1.59, 95%CI: 1.05–2.42) acid intakes were positively associated with depressive symptoms, even when adjusted for MPS. | 9/15
|
| Li et al. (2020c) [78] United States |
n=1,403 Peri-MN |
TFA intake Method: FFQ (103 items) |
Depressive symptoms Method: CES-D |
SEC; Anthropometrics; Health behaviors; Diet | • TFA intake was not associated with depressive symptoms. | 9/15
|
| Li et al. (2020d) [79] United States |
n=1,359 Peri-MN |
Mn intake Method: FFQ (103 items) |
Depressive symptoms Method: CES-D |
SEC; Anthropometrics; Health behaviors; Diet; VMS | • Mn intake was not associated with depressive symptoms. | 9/15
|
| Li et al. (2020e) [80] United States |
n=1,403 Peri-MN |
Dietary fiber intake Method: FFQ (103 items) |
Depressive symptoms Method: CES-D |
SEC; Anthropometrics; Health behaviors; Diet; SH | • Dietary fiber intake was not associated with depressive symptoms. | 9/15
|
| Li et al. (2021) [81] United States |
n=1,400 Peri-MN |
β-carotene intake Method: FFQ (103 items) |
Depressive symptoms Method: CES-D |
SEC; Anthropometrics; Health behaviors; Diet; SH, VMS | • β-carotene intake was not associated with depressive symptoms. | 9/15
|
| Li et al. (2022a) [82] United States |
n=3,054 Pre/peri-MN |
Provit. A intake Method: FFQ (103 items) |
Depressive symptoms Method: CES-D |
SEC; Anthropometrics; Health behaviors; Diet; SH | • Provit. A intake was not associated with depressive symptoms, even when adjusted for MPS. | 9/15
|
| Li et al. (2022b) [83] United States |
n=3,088 Pre/peri-MN |
Vit. C intake Method: FFQ (103 items) |
Depressive symptoms Method: CES-D |
SEC; Health behaviors; Diet; Chronic diseases | • Vit. C intake was negatively associated with depressive symptoms (OR: 0.70, 95%CI: 0.52–0.93), even when adjusted for MPS. | 9/15
|
| Liao et al. (2019) [97] China |
n=2,051 Post-MP |
Dietary patterns a posteriori Method: FFQ (100 items) and PCA |
Depressive symptoms Method: ZSRDS |
SEC; Health behaviors; Diet; Chronic diseases | • The “healthy” dietary pattern was negatively associated with depressive symptoms (Q4 vs. Q1, OR: 0.57, 95%CI: 0.33–0.97). The “sweets” (Q4 vs. Q1, OR: 1.66, 95%CI: 1.03–2.71) and “traditional Tianjin” (Q4 vs. Q1, OR: 2.53, 95%CI: 1.58–4.16) dietary pattern were positively associated with depressive symptoms. |
9/15
|
| Liu et al. (2016) [98] China |
n=1,125 Post-MP |
Dietary patterns a posteriori Method: FFQ (85 items) and PCA |
Depressive symptoms Method: CES-D |
SEC; Health behaviors; Diet; Chronic diseases | • The “whole-plant food" processed food dietary pattern was positively associated with depressive symptoms (T3 vs. T1, OR: 1.79, 95%CI: 1.18–2.72). The “processed food” dietary pattern was positively associated with depressive symptoms (T3 vs. T1, OR: 1.79, 95%CI: 1.18–2.72). The “animal food” dietary pattern was not associated with depressive symptoms. |
9/15
|
| Nazari et al. (2019)* [99] Iran |
n=136 Post-MP |
Mg and Zn serum levels Method: AAS |
Depressive symptoms Method: BDI |
NR | • Zn (OR: 0.97, 95%CI: 0.96–0.99) and Mg (OR: 0.30, 95%CI: 0.15–0.61) serum levels were negatively associated with depressive symptoms. | 7/15
|
| Noll et al. (2019) [100] Brazil |
n=225 Post-MP |
Intake of 7 food groups Method: 24h dietary recall |
Depressive symptoms Method: WHQ |
SEC; MPS | • Vegetable intake was negatively associated with depressive symptoms (T2-3 vs. T1, PR: 0.65, 95%CI: 0.43–0.98). Ultra-processed food, sweet food, sugar sweetened beverage, fruit, legume, and milk and plain yogurt intakes were not associated with depressive symptoms. |
9/15
|
| Oldra et al. (2020) [110] Brazil |
n=400 Peri/post-MP |
Intake of 19 nutrients Method: 3d food diary |
Depressive symptoms Method: CES-D |
NR | • Dietary fiber, PUFA, Mg, Zn, vit. C, D3, and B12 intakes were negatively associated with depressive symptoms (p<0.05). Carbohydrate, protein, lipid, SFA, MUFA, omega-3 and omega-6 PUFA, Se, vit. B6 and B9 intakes were not associated with depressive symptoms. |
9/15
|
| Sengul et al. (2014) [101] Turkey |
n=96 Post-MP |
Serum vit. B9 and B12 levels Method: Autoanalyzer |
Depressive symptoms Method: CES-D |
NR | • Serum vit. B9 and B12 levels did not differ between women with and without depressive symptoms. | 7/15
|
| Stanislawska et al. (2014) [102] Pomeranian region |
n=171 Post-MN |
Plasma Mg and Zn levels Method: AAS |
Depressive symptoms Method: BDI |
NR | • Mg plasma levels were lower in women with mild depressive symptoms than women without (p<0.05). Zn plasma levels were lower in women with moderate depressive symptoms than women without (p<0.05). |
7/15
|
| Wieder-Huszla et al. (2020) [103] Pomeranian region |
n=102 Post-MP |
Mg, Zn, Cu, and Se serum levels Method: Mannovette system |
Depressive symptoms Method: BDI-II |
NR | • Mg, Zn, Cu, and Se serum levels were not associated with depressive symptoms. | 7/15
|
*Case-control study. AAS: Atomic Absorption Spectrometry; BDI: Beck’s Depression Inventory; CES-D: Centre for Epidemiologic Studies Depression Scale; CI: Confidence Interval; Cu: Copper; D: Day; DII: Dietary Inflammatory Index; DASS: Depression Anxiety Stress Scale; DTAC: Dietary Total Antioxidant Capacity; Dx: Diagnosis; FFQ: Food Frequency Questinaire; h: Hour(s); MRS: Menopause Rating Scale; Mg: Magnesium; Mn: Manganese; MP: Menopause; MPS: Menopausal Symptoms; MRS: Menopause Rating Scale; MUFA(s): Monounsaturated Fatty Acid(s); NR: Non/Not/None Reported; OR: Odds Ratio; ORAC: Oxygen Radical Absorbance Capacity; Mn: Manganese; PCA: Principal Component Analysis; PHQ: Patient Health Questionnaire; PR: Prevalence Ratio; PUFA(s): Polyunsaturated Fatty Acid(s); Q(1-4): Quartile 1-4; Q(1-5): Quintile 1-5; SFA(s): RoB: Risk of Bias; Se: Selenium; SEC: Socioeconomic Characteristics; SFA(s): Saturated Fatty Acid(s); SH: Sex Hormones; T(1-3): Tertile 1-3; TFA(s): Trans Fatty Acid(s); Vit; Vitamin; VMS: Vasomotor Symptoms; Vs: Versus; WHQ: Women Health Questionnaire; Zn: Zinc; ZSRDS: Zung Self-Rating Depression Scale.
Table 3.
Study characteristics and findings summary from prospective cohort studies (n=7) on diet and depressive symptoms in peri- and post-menopausal women.
Table 3.
Study characteristics and findings summary from prospective cohort studies (n=7) on diet and depressive symptoms in peri- and post-menopausal women.
| Authors (year) Country |
Population | Exposure | Outcome | Statistical adjustments | Results | RoB |
|---|---|---|---|---|---|---|
| Bertone-Johnson et al. (2011) [86] United States Study duration: 3 y |
n=81,189 Post-MP |
Vit. D3 intake Method: FFQ (122 items) |
Depressive symptoms Method: 8-BS/AD use |
SEC; Anthropometrics; Health behaviors; HT use; Diet; Chronic diseases; Solar irradiance | • Compared to vit. D3 intakes < 100 IU, vit. D3 intakes ≥ 400 IU and < 800 IU were associated with a lower risk of depressive symptoms (OR: 0.88, 95%CI: 0.79–0.97). | 13/15
|
| Colangelo et al. (2017) [104] United States Study duration: 3.2 y |
n=1,616 Post-MP |
DHA, EPA, and DHA+EPA intakes Method: FFQ (120 items) |
Depressive symptoms Method: CES-D/AD use |
SEC; Anthropometrics; Health Behaviors; Diet; Chronic Diseases | • DHA (Q4 vs. Q1, RR: 2.39, 95%CI: 1.45–3.39), EPA (Q4 vs. Q1, RR: 2.10, 95%CI: 1.27–3.48), and EPA+DHA (Q4 vs. Q1, RR: 2.04, 95%CI: 1.24–3.37) intakes were positively associated with depressive symptoms. | 12/15
|
| Gangwisch et al. (2015) [87] United States Study duration: 3 y |
n=69,954 Post-MP |
Dietary glycemic index Added sugar intake Dietary fiber intake Method: FFQ (145 items) |
Depressive symptoms Method: 8-BS/AD use |
SEC; Anthropometrics; Health behaviors; Social support; Stressful life events; HT use; Diet; Chronic diseases | • Dietary glycemic index (Q5 vs. Q1, OR: 1.22, 95%CI: 1.09–1.37) and added sugar intake (Q5 vs. Q1, OR: 1.23, 95%CI: 1.07–1.41) were positively associated with depressive symptoms. Dietary fiber intake was negatively associated with depressive symptoms (Q5 vs. Q1, OR: 0.86, 95%CI: 0.76–0.98). |
13/15
|
| Li et al. (2010) [102,111] United States Study duration: 10.6 y |
n=1,005 Peri/Post-MP |
Weekly legume intake Method: FFQ |
Severe depressed mood Method: CES-D/AD use |
SEC; Anthropometrics; Health behaviors; Diet; Food Allergies; Chronic diseases | • In peri-MP women, only moderate (1-2x/wk) vs. infrequent (<1x/wk) legume intake was associated with a lower risk of severe depressed mood (RR: 0.52, 95%CI: 0.27–1.00). In post-MP women, weekly legume consumption was not associated with severe depressed mood. |
12/15
|
| Li et al. (2020f) [84] United States Study duration: 5 y |
n=2,376 Pre/Post-MP |
SFA intake Method: FFQ (103 items) |
Depressive symptoms Method: CES-D |
SEC; Anthropometrics; Health behaviors; Chronic stress; AD use; Diet; VMS; SH | • SFA intake was positively associated with depressive symptoms (Q4 vs. Q1, OR: 2.61, 95%CI: 1.15 – 5.93), even when adjusted for MPS. | 12/15
|
| Li et al. (2020g) [85] United States Study duration: 5 y |
n=2,376 Pre/Post-MP |
TFA intake Method: FFQ (103 items) |
Depressive symptoms Method: CES-D |
Anthropometrics; Health behaviors; Chronic stress; AD use; Diet; SH | • TFA intake was positively associated with depressive symptoms (Q4 vs. Q1, OR: 1.64, 95%CI: 1.09–2.47), even when adjusted for MPS. | 12/15
|
| Persons et al. (2014) [88] United States Study duration: 3 y |
n=7,066 Post-MP |
Omega-3 PUFA intake DHA, EPA, DHA+EPA intakes RBC omega-3 PUFAs, DHA, and EPA Methods: FFQ (120 items; intake) NR (RBC) |
Depressive symptoms Method: 8-BS/AD use |
SEC; Health behaviors; HT use; Bilateral oophorectomy; Chronic diseases | • Omega-3 PUFA, DHA, and EPA intakes were not associated with depressive symptoms. DHA+EPA intakes were negatively associated with depressive symptoms (T3 vs. T1, OR: 0.71, 95%CI: 0.50–0.99). RBC omega-3 PUFA, DHA, EPA, and DHA+EPA levels were not associated with depressive symptoms. |
13/15
|
AD: Antidepressant; BS: Burnam Scale; CES-D: Centre for Epidemiologic Studies Depression Scale; CI: Confidence Interval; DHA: Docosahexaenoic Acid; EPA: Eicosapentaenoic Acid eicosapentaenoic; FFQ: Food Frequency Questinaire; HT: Hormone Therapy; IU: International Units; MP: Menopause; MPS: Menopausal Status; OR: Odds Ratio; PUFA(s): Polyunsaturated Fatty Acid(s); Q(1-4): Quartile 1-4; RBC: Red Blood Cell; RoB: Risk of bias; RR: Risk Ratio; SEC: Socioeconomic Characteristics; SH:: Sex Hormones; SFA(s): Saturated Fatty Acid(s); T(1-3): Tertile; TFA(s): Trans Fatty Acid(s); Vit(s).: Vitamin(s); VMS: Vasomotor Symptoms; Vs: Versus; Wk: Week; Y: Year(s).
Table 4.
Study characteristics and findings summary from (quasi)-experimental studies (n=9) on diet and depressive symptoms in peri- and post-menopausal women.
Table 4.
Study characteristics and findings summary from (quasi)-experimental studies (n=9) on diet and depressive symptoms in peri- and post-menopausal women.
| Authors (year) Country |
Study design | Population | Interventions | Outcome | Results | RoB | |
|---|---|---|---|---|---|---|---|
| Experimental | Control | ||||||
| Assaf et al. (2016) [90] United States |
Open-label RCT Duration: 1 y n=48,834 |
Post-MP | Low-fat diet | No intervention | Depressive symptoms Method: Modified CES-D |
• The low-fat diet (vs. no intervention) significant decreased depressive symptoms (MD: 0.07, 95%CI: 0.02 – 0.12). | High
|
| Bertone-Johnson et al. (2012) [89] United States |
TB-RCT Duration: 3 y n=36,282 |
Post-MP | Daily vit. D3 (400 IU) + Ca (1,000 mg) supplement capsules | Placebo capsule | Depressive symptoms Method: 8-BS/AD use |
• No significant difference was observed between the effects of the experimental and the control interventions. | High
|
| Farshbaf-Khalili et al. (2022) [105] Iran |
TB-RCT Duration: 8 wks n=81 |
Post-MP |
Experimental intervention #1: Daily curcumin (1,000 mg) supplement capsules Experimental intervention #2: Daily vit. E (1,000 mg) supplement capsules |
Placebo capsule | Depressive symptoms Method: GCS |
• While all interventions decreased depressive symptoms from pre- to post-intervention, no significant differences were observed between their individual effects. | Low
|
| Freeman et al. (2011) [92] United States |
Pre-Post NEGD Duration: 8 wks n=20 |
Peri/Post-MP | Daily ethyl-DHA (375 mg) + EPA (465 mg) supplement capsules | None | Depressive symptoms Method: MADRS |
• The intervention decreased depressive symptoms from pre- to post-intervention (MD: -12.0, SD: 8.3, p<0.0001). | High
|
| Kashani et al. (2018) [106] Iran |
DB-RCT Duration: 6 wks n=56 |
Post-MP | Daily saffron (30 mg) supplement capsules | Placebo capsule | Depressive symptoms Method: HDRS |
• The experimental intervention (vs. control) significantly decreased depressive symptoms (SMD: 19.6, 95%CI: 9.00–30.28, p=0.001). | High
|
| Lucas et al. (2009) [112] Canada |
TB-RCT Duration: 8 wks n=120 |
Peri/Post-MP | Daily ethyl-DHA (150 mg) + EPA (1,005 mg) supplement capsules | Placebo capsule | Depressive symptoms Method: HSCL-D-2 and HDRS-21 |
• The experimental intervention (vs. control) significantly decreased depressive symptoms when assessed with the HSCL-D-20 (SMD: -0.85 vs. -0.50 with placebo, p<0.05) and the HDRS-21 (SMD: -0.74 vs. -0.38 with placebo, p<0.05). These effects were however restricted to women without a major depressive episode at baseline (n=91). | Low
|
| Mason et al. (2016) [107] United States |
TB-RCT Duration: 1 y n=218 |
Post-MP | Daily vit. D3 (2,000 IU) supplement capsules | Placebo capsule | Depressive symptoms Method: BSI-18 |
• No significant difference was observed between the effects of the experimental and the control interventions. | Low
|
| Shafie et al. (2022) [73] Iran |
TB-RCT Duration: 6 wks n=60 |
Peri/Post-MP | Prebiotic-enriched yoghurt | Regular yoghurt placebo | Depressive symptoms Method: DASS-21 |
• No significant difference was observed between the effects of the experimental and the control interventions. | Low
|
| Torres et al. (2012) [108] Australia |
Open-label RCT Duration: 14 wks n=95 |
Post-MP |
Experimental intervention #1: DASH diet Experimental intervention #2: Low-fat diet |
None | Depressive symptoms Method: 37-item POMS |
• Both the DASH diet (MD: -1.1, SEM: 0.8, p<0.01) and the low-fat diet (MD: -0.6, SEM: 0.4, p<0.01) decreased depressive symptoms from pre- to post-intervention, but no significant difference was observed between their individual effects. | High |
AD: Antidepressant; BS: Burnam Scale; BSI: Brief Symptom Inventory; Ca: Calcium; CES-D: Centre for Epidemiologic Studies Depression Scale; CI: Confidence Interval; DASH: Dietary Approach to Stop Hypertension; DASS: Depression Anxiety Stress Scale; DB-RCT: Double-Blind Randomized Controlled Trial; DHA: Docosahexaenoic Acid; EPA: Eicosapentaenoic Acid; Exp.: Experimental Intervention; GCS: Greene Climacteric Scale; HDRS: Hamilton Depression Rating Scale; HSCL: Hopkins Symptoms Checklist Depression Scale; IU: International Units; MADRS: Montgomery–Åsberg Depression Rating Scale; MD: Mean Difference; MP: Menopause; NEGD: Non-Equivalent Groups Design; POMS: Profile of Mood State; RoB: Risk of Bias; RT: Randomized Trial; SD: Standard Deviation; SEM: Standard Error of the Mean; SMD: Standard Mean Difference; TB-RCT: Triple-Blind Randomized Controlled Trial; Vit(s).: Vitamin(s); Wk(s); Week(s); Y: Year(s).Selenium Intake or Plasma Levels.
The association between selenium intake and depressive symptoms was assessed in one cross-sectional involving 1,906 peri- and post-menopausal women, which found no significant results [110]. Similarly, no significant results were found when the association between plasma selenium levels and depressive symptoms was assessed in a cross-sectional involving 298 post-menopausal women [101].
Copper Serum Levels
The association between serum copper levels and depressive symptoms was assessed in one cross-sectional study involving 298 post-menopausal women [103]. No significant association was observed between these variables [103].
Manganese Intake
3.2.5. Other Food Components
Curcumin
4. Discussion
4.1. Summary of Study Findings
This scoping review identified and synthesized currently available evidence on the association between diet and depression in peri- and post-menopausal women. A total of 38 studies were included, encompassing both observational and interventional designs. Most studies were either cross-sectional or cohort in nature and published within the past decade. These studies primarily explored the relationship between dietary patterns, nutrient intake, or specific foods and depressive symptoms. A smaller number of RCTs evaluated the effects of nutritional interventions.
A consistent pattern emerged across the literature: adherence to “healthy” dietary patterns, characterized by higher intakes of fruits, vegetables, whole grains, and lean proteins, was associated with a lower risk of depressive symptoms, while “unhealthy” dietary patterns, characterized by higher consumption of processed foods, added sugars, and saturated fats, were associated with a higher risk of depressive symptoms.
In contrast to dietary patterns, findings related to individual nutrients, food components, and specific foods or food groups were more heterogeneous and inconclusive. For example, studies examining specific omega-3 fatty acids, B vitamins, magnesium, zinc, and other micronutrients yielded mixed results, with many reporting a combination of positive, negative, and null associations with depressive symptoms. Similarly, studies on specific foods and food groups (e.g. fruit, vegetables, dairy) did not reveal any clear or consistent patterns of association with depressive symptoms.
4.2. Findings in Relation to Other Studies
The findings of this scoping review on peri- and post-menopausal women generally align with the broader nutritional psychiatry literature in adult populations. Numerous prior reviews and meta-analyses in predominantly general adult samples have shown diets abundant in plant foods (vegetables, fruits, legumes, whole grains) and fish, often characterized as “Mediterranean”, “anti-inflammatory”, or other “healthy” patterns, are associated with a significantly lower risk of depression or depressive symptoms [28,29,30,31,32], whereas highly-processed “Western-style” diets are associated with higher depression risk [33,34,35,36]. For instance, a recent systematic review and meta-analysis of RCTs reported that Mediterranean diet interventions significantly reduced depressive symptoms among young and middle-aged adults with major depression or mild-to-moderate depressive symptoms [31]. Similarly, an umbrella review reported significant inverse associations between adherence to Mediterranean and anti-inflammatory dietary patterns (reflected by low DII scores) and depression risk [115]. Our scoping review corroborates that these pattern-level associations are similarly observed in women undergoing the menopausal transition. This alignment is particularly noteworthy, as it suggests that the core associations between diet and depressive symptoms persist despite the distinct hormonal and metabolic changes characteristic of women’s midlife. The inconsistencies noted for individual foods and nutrients also mirror some of the findings reported in broader adult populations [116,117], and may, in part, be attributable to the limited ability of reductionist approaches to capture the complex interactions between nutrients and the overall dietary context.
Despite these similitudes, our review adds meaningful nuance to the existing literature, with our results also identifying patterns and inconsistencies that might be less visible in the overall adult population data. While some associations observed in general populations appear to hold true in peri- and post-menopausal women, others may manifest differently. For example, one cohort study reported that moderate legume intake was negatively associated with depressed mood in peri-menopausal women, but not in their post-menopausal counterparts [111]. Similarly, data from the SWAN study indicated that higher omega-3 fatty acid intake was associated with fewer depressive symptoms in peri-menopausal, but not pre-menopausal, women [76]. Although the number of studies that have specifically focused on peri- and post-menopausal women remains limited, these findings suggest that menopausal status may act as a modifier of certain diet–depression associations. Thus, while our results reinforce some past findings on the benefits of healthy diets for the prevention and management of depression, they also brought to light inconsistencies that may be more prevalent among peri- and post-menopausal women, supporting the need for more tailored research in this demographic.
4.3. Strenghts and Limitations of the Evidence
While the risk of bias within the body of evidence included in this scoping review was moderate-to-high, some methodological aspects can still be considered strengths. For example, most studies employed validated dietary assessment instruments and depression scales, supporting the reliability of exposure and outcome measurements. Additionally, some studies adjusted their analyses for a wide array of confounding variables, enhancing the internal validity of their findings.
Still, significant limitations overshadow these methodological strengths. Most included studies were observational, inherently limiting causal inference. Among the relatively few RCTs, many employed open-label designs without active comparators, reducing internal validity. Definitions of peri- and post-menopause varied considerably, with some studies relying solely on age-based thresholds rather than standardized clinical staging criteria, thereby increasing the risk of misclassification. Dietary exposures were predominantly assessed using self-reported methods, such as food frequency questionnaires or 24-hour recalls, which are known to be prone to recall bias and measurement error. Similarly, depressive symptoms were measured using a range of instruments, contributing to outcome heterogeneity. Residual confounding remains a critical concern, particularly in relation to unmeasured or insufficiently adjusted variables such as physical activity, severity of menopausal symptoms, and psychosocial stressors. These challenges are especially pertinent to the nutrition research field, where exposures are complex, error-prone, and strongly interrelated with other lifestyle and behavioral factors.
4.4. Strenghts and Limitations of the Review
To date, this review represents the most comprehensive synthesis on diet and depression among peri- and post-menopausal women. It was conducted using rigorous methodology, including prospective protocol registration, comprehensive database searches, and dual independent screening. Additionally, while not a mandatory step in the scoping review methodology, a formal risk of bias assessment of the included studies was conducted, enhancing the ability to identify key methodological limitations and have an overall portrait of the quality of the evidence. Adherence to the PRISMA-ScR reporting guidelines further strengthened the methodological transparency, reproducibility, and credibility of the review process.
However, certain limitations also warrant consideration. The inclusion of only English- and French-language publications may have introduced language bias and excluded relevant studies published in other languages. Additionally, due to the wide variability in populations and dietary exposures across studies, our synthesis was necessarily descriptive rather than quantitative.
4.5. Research Gaps and Future Directions
This scoping review highlights several critical gaps in the current literature that warrant further investigation:
Limited interventional research: Few RCTs have specifically examined dietary interventions in peri- and post-menopausal women. Future RCTs are needed to evaluate the effectiveness of dietary strategies for preventing or managing depressive symptoms during and after the menopausal transition.
Lack of standardization in exposure and outcome measures: Greater consistency is needed in how dietary exposures (e.g., specific dietary patterns, nutrient intake) and depressive outcomes (e.g., validated symptom scales, diagnostic criteria) are defined and measured. Standardization would improve the comparability and synthesis of findings across studies.
Inadequate consideration of menopause-specific factors: Many studies overlook important contextual variables such as hormonal status, severity of menopausal symptoms, and hormone therapy use. These factors may act as effect modifiers and should be systematically considered in future research to better understand the diet–depression relationship in this population.
Limited population diversity: Existing studies are often restricted to specific geographic regions or demographically homogeneous cohorts. There is a need for research in more diverse populations to capture how cultural, socioeconomic, and racial/ethnic factors influence dietary intakes and mental health outcomes among midlife women.
Insufficient investigation of biological mechanisms: Although mechanisms such as sub-chronic inflammation, oxidative stress, and gut microbiota dysbiosis have been proposed, few studies have directly assessed these pathways in peri- and post-menopausal women. Incorporating biomarker analyses and mechanistic approaches into future studies could provide critical insights into how diet influences mental health during midlife.
4.6. Implications for Research and Practice
As the burden of depression continues to rise among midlife women, and given the limitations of current pharmacological treatments, there is a crucial need to explore effective non-pharmacological strategies. Dietary modifications represent a promising avenue, with preliminary evidence suggesting that healthy dietary patterns may help protect against depression during the peri- and post-menopausal periods. However, the current evidence base remains limited by its predominantly observational design, heterogeneity in dietary assessment methods, variability in outcome measures, and a lack of standardized definitions of menopausal status. Longitudinal studies with rigorous methodologies and high-quality RCTs, are crucially needed to establish causal relationships, clarify underlying biological mechanisms, and develop specific, evidence-based dietary recommendations for this population.
In clinical settings, healthcare providers working with peri- and post-menopausal women should consider diet as one component of a broader, integrative approach to mental health promotion. While acknowledging the limitations of the existing evidence, encouraging dietary patterns known to benefit physical health may also provide ancillary mental health benefits. Similarly, public health initiatives aimed at promoting healthy eating habits among midlife women could yield the dual advantage of improving both mental and cardiometabolic health outcomes, thereby simultaneously addressing multiple health priorities.
5. Conclusions
This scoping review offers a comprehensive overview of the current evidence linking diet-related factors to depression in peri- and post-menopausal women. While emerging findings suggest that dietary patterns may influence depression during this critical life period, the overall evidence remains limited and methodologically diverse. Bridging these gaps will require well-designed, high-quality studies that employ standardized methodologies, clearly define menopausal status, and ensure the inclusion of diverse populations. Such efforts are essential to deepen the current understanding of the diet–depression relationship and to develop evidence-informed clinical and public health strategies that support the mental well-being of peri- and post-menopausal women.
Supplementary Materials
The following supporting information can be downloaded at the website of this paper posted on Preprints.org, Table S1: Preferred Reporting Items for Systematic Reviews and Meta-Analyses Checklist’s Extension for Scoping Review (PRISMA-ScR); Table S2: Full Search Strategy for Medline; Table S3: Full Search Strategy for Embase; Table S4: Full Search Strategy for PsycInfo; Table S5: Full Search Strategy for CENTRAL; Table S6: Full Search Strategy for Web of Science; Table S7: Paper Excluded After Full-Text Review; Table S8: Risk of Bias Assessment for Cross-Sectional (n=22) and Prospective Cohort (n=7) Studies; Table S9: Risk of Bias Assessment for Case-Control Studies (n=1); Table S10: Risk of Bias Assessment for Experimental Studies (n=9).
Author Contributions
Conceptualization, A.M.B.; methodology, A.M.B.; investigation, A.M.B., M.D.; visualization, A.M.B.; data curation, A.M.B.; writing—original draft preparation, A.M.B.; writing—review and editing, A.M.B., M.D., D.P., I.G.; project administration, A.M.B.; supervision, A.M.B., D.P., I.G.; funding acquisition, A.M.B., D.P., I.G. All authors have read and agreed to the published version of the manuscript.
Funding
This research was funded by Institut du Savoir Montfort, Pilot project team grant 2020–2023.
Institutional Review Board Statement
Not applicable.
Informed Consent Statement
Not applicable.
Data Availability Statement
All available data is provided as supplementary materials.
Conflicts of Interest
The authors declare no conflicts of interest. The funders had no role in the design of the study; in the collection, analyses, or interpretation of data; in the writing of the manuscript; or in the decision to publish the results.
Abbreviations
The following abbreviations are used in this manuscript:
| BDI | Beck’s Depression Inventory |
| BS | Burnam Scale |
| BSI | Brief Symptom Inventory |
| CENTRAL | Cochrane Central Register of Controlled Trials |
| CES-D | Centre for Epidemiologic Studies Depression Scale |
| DASH | Dietary Approach to Stop Hypertension |
| DASS | Depression Anxiety Stress Scale |
| DHA | Docosahexaenoic Acid |
| DII | Dietary Inflammatory Index |
| DTAC | Dietary Total Antioxidant Capacity |
| EPA | Eicosapentaenoic Acid |
| GCS | Greene Climacteric Scale |
| HDRS | Hamilton Depression Rating Scale |
| HPA | Hypothalamic-pituitary-adrenal |
| HSCL-D | Hopkins Symptoms Checklist Depression Scale |
| MADRS | Montgomery–Åsberg Depression Rating Scale |
| MUFA(s) | Monounsaturated Fatty Acid(s) |
| NEGD | Non-Equivalent Groups Design |
| NHLBI | National Heart, Lung, and Blood Institute |
| PHQ-9 | Patient Health Questionnaire |
| POMS | Profile of Mood State |
| PRISMA | Preferred Reporting Items for Systematic Reviews Meta-Analyses |
| PRISMA-ScR | PRISMA Checklist’s Extension for Scoping Reviews |
| PUFA(s) | Polyunsaturated Fatty Acid(s) |
| RCT(s) | Randomized controlled trial(s) |
| RoB | Risk of Bias |
| SFA(s) | Saturated Fatty Acid(s) |
| SWAN | Studies of Women’s Health Across the Nation |
| TFA(s) | Trans Fatty Acid(s) |
| WHI | Women’s Health Initiative |
| WHQ | Women’s Health Questionnaire |
| ZSRDS | Zung Self-Rating Depression Scale |
References
- GBD 2019 Mental Disorders Collaborators Global, Regional, and National Burden of 12 Mental Disorders in 204 Countries and Territories, 1990–2019: A Systematic Analysis for the Global Burden of Disease Study 2019. Lancet Psychiatry 2022, 9, 137–150. [CrossRef] [PubMed]
- Atlantis, E.; Fahey, P.; Cochrane, B.; Smith, S. Bidirectional Associations Between Clinically Relevant Depression or Anxiety and COPD: A Systematic Review and Meta-Analysis. Chest 2013, 144, 766–777. [Google Scholar] [CrossRef] [PubMed]
- Luppino, F.S.; de Wit, L.M.; Bouvy, P.F.; Stijnen, T.; Cuijpers, P.; Penninx, B.W.J.H.; Zitman, F.G. Overweight, Obesity, and Depression: A Systematic Review and Meta-Analysis of Longitudinal Studies. Arch Gen Psychiatry 2010, 67, 220–229. [Google Scholar] [CrossRef]
- Rotella, F.; Mannucci, E. Depression as a Risk Factor for Diabetes: A Meta-Analysis of Longitudinal Studies. J Clin Psychiatry 2013, 74, 4231. [Google Scholar] [CrossRef] [PubMed]
- Seabury, S.A.; Axeen, S.; Pauley, G.; Tysinger, B.; Schlosser, D.; Hernandez, J.B.; Heun-Johnson, H.; Zhao, H.; Goldman, D.P. Measuring The Lifetime Costs Of Serious Mental Illness And The Mitigating Effects Of Educational Attainment. 2019, 38, 652–659. [Google Scholar] [CrossRef]
- Insel, T.R. Assessing the Economic Costs of Serious Mental Illness. American Journal of Psychiatry 2008, 165, 663–665. [Google Scholar] [CrossRef]
- Salk, R.H.; Hyde, J.S.; Abramson, L.Y. Gender Differences in Depression in Representative National Samples: Meta-Analyses of Diagnoses and Symptoms. Psychol Bull 2017, 143, 783–822. [Google Scholar] [CrossRef]
- Douma, S.L.; Husband, C.; O’Donnell, M.E.; Barwin, B.N.; Woodend, A.K. Estrogen-Related Mood Disorders: Reproductive Life Cycle Factors. Advances in Nursing Science 2005, 28, 364–375. [Google Scholar] [CrossRef]
- Sohn, J.H.; Ahn, S.H.; Seong, S.J.; Ryu, J.M.; Cho, M.J. Prevalence, Work-Loss Days and Quality of Life of Community Dwelling Subjects with Depressive Symptoms. J Korean Med Sci 2013, 28, 280–286. [Google Scholar] [CrossRef]
- Alonso, J.; Petukhova, M.; Vilagut, G.; Chatterji, S.; Heeringa, S.; Üstün, T.B.; Alhamzawi, A.O.; Viana, M.C.; Angermeyer, M.; Bromet, E.; et al. Days out of Role Due to Common Physical and Mental Conditions: Results from the WHO World Mental Health Surveys. Molecular Psychiatry 2011 16:12 2010, 16, 1234–1246. [Google Scholar] [CrossRef]
- Lerner, D.; Adler, D.A.; Chang, H.; Lapitsky, L.; Hood, M.Y.; Perissinotto, C.; Reed, J.; McLaughlin, T.J.; Berndt, E.R.; Rogers, W.H. Unemployment, Job Retention, and Productivity Loss among Employees with Depression. Psychiatric Services 2004, 55, 1371–1378. [Google Scholar] [CrossRef] [PubMed]
- Beck, A.; Crain, L.A.; Solberg, L.I.; Unützer, J.; Maciosek, M. v.; Whitebird, R.R.; Rossom, R.C. Does Severity of Depression Predict Magnitude of Productivity Loss? Am J Manag Care 2014, 20, e294. [Google Scholar] [PubMed]
- Woods, N.F.; Smith-DiJulio, K.; Percival, D.B.; Tao, E.Y.; Mariella, A.; Mitchell, E.S. Depressed Mood during the Menopausal Transition and Early Postmenopause: Observations from the Seattle Midlife Women’s Health Study. Menopause 2008, 15, 223–232. [Google Scholar] [CrossRef]
- Hickey, M.; Schoenaker, D.A.J.M.; Joffe, H.; Mishra, G.D. Depressive Symptoms across the Menopause Transition: Findings from a Large Population-Based Cohort Study. Menopause 2016, 23, 1287–1293. [Google Scholar] [CrossRef]
- Cohen, L.S.; Soares, C.N.; Vitonis, A.F.; Otto, M.W.; Harlow, B.L. Risk for New Onset of Depression During the Menopausal Transition: The Harvard Study of Moods and Cycles. Arch Gen Psychiatry 2006, 63, 385–390. [Google Scholar] [CrossRef] [PubMed]
- Freeman, E.W. Associations of Depression with the Transition to Menopause. Menopause 2010, 17, 823–827. [Google Scholar] [CrossRef]
- Freeman, E.W.; Sammel, M.D.; Lin, H.; Nelson, D.B. Associations of Hormones and Menopausal Status With Depressed Mood in Women With No History of Depression. Arch Gen Psychiatry 2006, 63, 375–382. [Google Scholar] [CrossRef]
- Bromberger, J.T.; Schott, L.; Kravitz, H.M.; Joffe, H. Risk Factors for Major Depression during Midlife among a Community Sample of Women with and without Prior Major Depression: Are They the Same or Different? Psychol Med 2015, 45, 1653–1664. [Google Scholar] [CrossRef]
- Bromberger, J.T.; Kravitz, H.M.; Chang, Y.F.; Cyranowski, J.M.; Brown, C.; Matthews, K.A. Major Depression during and after the Menopausal Transition: Study of Women’s Health Across the Nation (SWAN). Psychol Med 2011, 41, 1879–1888. [Google Scholar] [CrossRef] [PubMed]
- de Kruif, M.; Spijker, A.T.; Molendijk, M.L. Depression during the Perimenopause: A Meta-Analysis. J Affect Disord 2016, 206, 174–180. [Google Scholar] [CrossRef]
- Joffe, H.; De Wit, A.; Coborn, J.; Crawford, S.; Freeman, M.; Wiley, A.; Athappilly, G.; Kim, S.; Sullivan, K.A.; Cohen, L.S.; et al. Impact of Estradiol Variability and Progesterone on Mood in Perimenopausal Women With Depressive Symptoms. J Clin Endocrinol Metab 2020, 105, e642–e650. [Google Scholar] [CrossRef] [PubMed]
- Gibbs, Z.; Lee, S.; Kulkarni, J. The Unique Symptom Profile of Perimenopausal Depression. 2020, 19, 76–84. [Google Scholar] [CrossRef]
- Kulkarni, J.; Gavrilidis, E.; Hudaib, A.R.; Bleeker, C.; Worsley, R.; Gurvich, C. Development and Validation of a New Rating Scale for Perimenopausal Depression—the Meno-D. Translational Psychiatry 2018 8:1 2018, 8, 1–9. [Google Scholar] [CrossRef]
- Thase, M.E.; Entsuah, R.; Cantillon, M.; Kornstein, S.G. Relative Antidepressant Efficacy of Venlafaxine and SSRIs: Sex-Age Interactions. https://home.liebertpub.com/jwh 2005, 14, 609–616. [Google Scholar] [CrossRef] [PubMed]
- Sell, S.L.; Craft, R.M.; Seitz, P.K.; Stutz, S.J.; Cunningham, K.A.; Thomas, M.L. Estradiol–Sertraline Synergy in Ovariectomized Rats. Psychoneuroendocrinology 2008, 33, 1051–1060. [Google Scholar] [CrossRef] [PubMed]
- Récamier-Carballo, S.; Estrada-Camarena, E.; Reyes, R.; Fernández-Guasti, A. Synergistic Effect of Estradiol and Fluoxetine in Young Adult and Middle-Aged Female Rats in Two Models of Experimental Depression. Behavioural Brain Research 2012, 233, 351–358. [Google Scholar] [CrossRef]
- Graziottin, A.; Serafini, A. Depression and the Menopause: Why Antidepressants Are Not Enough? 2009, 15, 76–81. [Google Scholar] [CrossRef]
- Firth, J.; Marx, W.; Dash, S.; Carney, R.; Teasdale, S.B.; Solmi, M.; Stubbs, B.; Schuch, F.B.; Carvalho, A.F.; Jacka, F.; et al. The Effects of Dietary Improvement on Symptoms of Depression and Anxiety: A Meta-Analysis of Randomized Controlled Trials. Psychosom Med 2019, 81, 265. [Google Scholar] [CrossRef]
- Iguacel, I.; Huybrechts, I.; Moreno, L.A.; Michels, N. Vegetarianism and Veganism Compared with Mental Health and Cognitive Outcomes: A Systematic Review and Meta-Analysis. Nutr Rev 2021, 79, 361–381. [Google Scholar] [CrossRef]
- Li, X.; Chen, M.; Yao, Z.; Zhang, T.; Li, Z. Dietary Inflammatory Potential and the Incidence of Depression and Anxiety: A Meta-Analysis. J Health Popul Nutr 2022, 41, 1–13. [Google Scholar] [CrossRef]
- Bizzozero-Peroni, B.; Martínez-Vizcaíno, V.; Fernández-Rodríguez, R.; Jiménez-López, E.; Núñez de Arenas-Arroyo, S.; Saz-Lara, A.; Díaz-Goñi, V.; Mesas, A.E. The Impact of the Mediterranean Diet on Alleviating Depressive Symptoms in Adults: A Systematic Review and Meta-Analysis of Randomized Controlled Trials. Nutr Rev 2024, 83, 29–39. [Google Scholar] [CrossRef] [PubMed]
- Soltani, S.; Sangsefidi, Z.S.; Asoudeh, F.; Torabynasab, K.; Zeraattalab-Motlagh, S.; Hejazi, M.; Khalighi Sikaroudi, M.; Meshkini, F.; Razmpoosh, E.; Abdollahi, S. Effect of Low-Fat Diet on Depression Score in Adults: A Systematic Review and Meta-Analysis of Randomized Controlled Clinical Trials. Nutr Rev 2025, 83, e741–e750. [Google Scholar] [CrossRef]
- Lane, M.M.; Gamage, E.; Travica, N.; Dissanayaka, T.; Ashtree, D.N.; Gauci, S.; Lotfaliany, M.; O’neil, A.; Jacka, F.N.; Marx, W. Ultra-Processed Food Consumption and Mental Health: A Systematic Review and Meta-Analysis of Observational Studies. Nutrients 2022, 14, 2568. [Google Scholar] [CrossRef] [PubMed]
- Mazloomi, S.N.; Talebi, S.; Mehrabani, S.; Bagheri, R.; Ghavami, A.; Zarpoosh, M.; Mohammadi, H.; Wong, A.; Nordvall, M.; Kermani, M.A.H.; et al. The Association of Ultra-Processed Food Consumption with Adult Mental Health Disorders: A Systematic Review and Dose-Response Meta-Analysis of 260,385 Participants. Nutr Neurosci 2023, 26, 913–931. [Google Scholar] [CrossRef] [PubMed]
- Werneck, A.O.; Steele, E.M.; Delpino, F.M.; Lane, M.M.; Marx, W.; Jacka, F.N.; Stubbs, B.; Touvier, M.; Srour, B.; Louzada, M.L.; et al. Adherence to the Ultra-Processed Dietary Pattern and Risk of Depressive Outcomes: Findings from the NutriNet Brasil Cohort Study and an Updated Systematic Review and Meta-Analysis. Clinical Nutrition 2024, 43, 1190–1199. [Google Scholar] [CrossRef]
- Ejtahed, H.S.; Mardi, P.; Hejrani, B.; Mahdavi, F.S.; Ghoreshi, B.; Gohari, K.; Heidari-Beni, M.; Qorbani, M. Association between Junk Food Consumption and Mental Health Problems in Adults: A Systematic Review and Meta-Analysis. BMC Psychiatry 2024, 24, 1–17. [Google Scholar] [CrossRef]
- Köhler, C.A.; Freitas, T.H.; Maes, M.; de Andrade, N.Q.; Liu, C.S.; Fernandes, B.S.; Stubbs, B.; Solmi, M.; Veronese, N.; Herrmann, N.; et al. Peripheral Cytokine and Chemokine Alterations in Depression: A Meta-Analysis of 82 Studies. Acta Psychiatr Scand 2017, 135, 373–387. [Google Scholar] [CrossRef]
- Goldsmith, D.R.; Rapaport, M.H.; Miller, B.J. A Meta-Analysis of Blood Cytokine Network Alterations in Psychiatric Patients: Comparisons between Schizophrenia, Bipolar Disorder and Depression. Mol Psychiatry 2016, 21, 1696–1709. [Google Scholar] [CrossRef]
- Enache, D.; Pariante, C.M.; Mondelli, V. Markers of Central Inflammation in Major Depressive Disorder: A Systematic Review and Meta-Analysis of Studies Examining Cerebrospinal Fluid, Positron Emission Tomography and Post-Mortem Brain Tissue. Brain Behav Immun 2019, 81, 24–40. [Google Scholar] [CrossRef]
- Liu, T.; Zhong, S.; Liao, X.; Chen, J.; He, T.; Lai, S.; Jia, Y. A Meta-Analysis of Oxidative Stress Markers in Depression. PLoS One 2015, 10, e0138904. [Google Scholar] [CrossRef]
- Jimenez-Fernandez, S.; Gurpegui, M.; Diaz-Atienza, F.; Perez-Costillas, L.; Gerstenberg, M.; Correll, C.U. Oxidative Stress and Antioxidant Parameters in Patients With Major Depressive Disorder Compared to Healthy Controls Before and After Antidepressant Treatment: Results From a Meta-Analysis. J Clin Psychiatry 2015, 76, 13705. [Google Scholar] [CrossRef] [PubMed]
- Black, C.N.; Bot, M.; Scheffer, P.G.; Cuijpers, P.; Penninx, B.W.J.H. Is Depression Associated with Increased Oxidative Stress? A Systematic Review and Meta-Analysis. Psychoneuroendocrinology 2015, 51, 164–175. [Google Scholar] [CrossRef]
- Stetler, C.; Miller, G.E. Depression and Hypothalamic-Pituitary-Adrenal Activation: A Quantitative Summary of Four Decades of Research. Psychosom Med 2011, 73, 114–126. [Google Scholar] [CrossRef]
- Lopez-Duran, N.L.; Kovacs, M.; George, C.J. Hypothalamic–Pituitary–Adrenal Axis Dysregulation in Depressed Children and Adolescents: A Meta-Analysis. Psychoneuroendocrinology 2009, 34, 1272–1283. [Google Scholar] [CrossRef] [PubMed]
- Lin, P.Y.; Tseng, P.T. Decreased Glial Cell Line-Derived Neurotrophic Factor Levels in Patients with Depression: A Meta-Analytic Study. J Psychiatr Res 2015, 63, 20–27. [Google Scholar] [CrossRef]
- Sen, S.; Duman, R.; Sanacora, G. Serum Brain-Derived Neurotrophic Factor, Depression, and Antidepressant Medications: Meta-Analyses and Implications. Biol Psychiatry 2008, 64, 527–532. [Google Scholar] [CrossRef] [PubMed]
- Amirkhanzadeh Barandouzi, Z.; Starkweather, A.R.; Henderson, W.A.; Gyamfi, A.; Cong, X.S. Altered Composition of Gut Microbiota in Depression: A Systematic Review. Front Psychiatry 2020, 11, 1–10. [Google Scholar] [CrossRef]
- Simpson, C.A.; Diaz-Arteche, C.; Eliby, D.; Schwartz, O.S.; Simmons, J.G.; Cowan, C.S.M. The Gut Microbiota in Anxiety and Depression – A Systematic Review. Clin Psychol Rev 2021, 83, 101943. [Google Scholar] [CrossRef]
- van Zonneveld, S.M.; van den Oever, E.J.; Haarman, B.C.M.; Grandjean, E.L.; Nuninga, J.O.; van de Rest, O.; Sommer, I.E.C. An Anti-Inflammatory Diet and Its Potential Benefit for Individuals with Mental Disorders and Neurodegenerative Diseases—A Narrative Review. Nutrients 2024, 16, 2646. [Google Scholar] [CrossRef]
- Yin, Y.; Ju, T.; Zeng, D.; Duan, F.; Zhu, Y.; Liu, J.; Li, Y.; Lu, W. “Inflamed” Depression: A Review of the Interactions between Depression and Inflammation and Current Anti-Inflammatory Strategies for Depression. Pharmacol Res 2024, 207, 107322. [Google Scholar] [CrossRef]
- Tricco, A.C.; Lillie, E.; Zarin, W.; O’Brien, K.K.; Colquhoun, H.; Levac, D.; Moher, D.; Peters, M.D.J.; Horsley, T.; Weeks, L.; et al. PRISMA Extension for Scoping Reviews (PRISMA-ScR): Checklist and Explanation. Ann Intern Med 2018, 169, 467–473. [Google Scholar] [CrossRef] [PubMed]
- Arksey, H.; O’Malley, L. Scoping Studies: Towards a Methodological Framework. International Journal of Social Research Methodology 2007, 8, 19–32. [Google Scholar] [CrossRef]
- Peters, M.D.J.; Godfrey, C.M.; Khalil, H.; McInerney, P.; Parker, D.; Soares, C.B. Guidance for Conducting Systematic Scoping Reviews. Int J Evid Based Healthc 2015, 13, 141–146. [Google Scholar] [CrossRef] [PubMed]
- Bodnaruc, A.M.; Duquet, M.; Prud’homme, D.; Giroux, I. Diet and Depression during Peri- and Post-Menopause: A Scoping Review Protocol. Methods Protoc 2023, 6, 91. [Google Scholar] [CrossRef]
- Higgins, J.; Savovic, J.; Page, M.; Elbers, R. Chapter 8: Assessing Risk of Bias in a Randomized Trial [Last Updated 19]. In Cochrane Handbook for Systematic Reviews of Interventions version 6.5; Higgins, J., Thomas, J., Chandler, J., Cumpston, M., Li, T., Page, M., Welch, V., Eds.; Cochrane, 2024. [Google Scholar]
- National Heart Lung and Blood Institute National Heart Lung and Blood Institute (NHLBI) Quality Assessment Tool for Observational Cohort and Cross-Sectional Studies. 2014.
- National Heart Lung and Blood Institute National Heart Lung and Blood Institute (NHLBI) Quality Assessment of Case-Control Studies.
- Jokar, A.; Farahi, F. Effect of Vitamin C on Depression in Menopausal Women with Balanced Diet: A Randomized Clinical Trial. The Iranian Journal of Obstetrics, Gynecology and Infertility 2014, 17, 18–23. [Google Scholar] [CrossRef]
- Shahraeini, M.; Shourab, N.J.; Javan, R.; Shakeri, M.T. Effect of Food-Based Strategies of Iranian Traditional Medicine on Women’s Quality of Life during Menopause. The Iranian Journal of Obstetrics, Gynecology and Infertility 2021, 23, 67–75. [Google Scholar] [CrossRef]
- Chocano-Bedoya, P.; O’Reilly, E.; Lucas, M.; Mirzaei, F.; Okereke, O.; Fung, T.; Hu, F.; Ascherio, A. Dietary Patterns and Depression in the Nurses’ Health Study. Am J Epidemiol 2012, 175, S75. [Google Scholar] [CrossRef]
- Pasco, J.A.; Williams, L.J.; Brennan-Olsen, S.L.; Berk, M.; Jacka, F.N. Milk Consumption and the Risk for Incident Major Depressive Disorder. Psychother Psychosom 2015, 84, 384–386. [Google Scholar] [CrossRef]
- Crawford, G.B.; Khedkar, A.; Flaws, J.A.; Sorkin, J.D.; Gallicchio, L. Depressive Symptoms and Self-Reported Fast-Food Intake in Midlife Women. Prev Med (Baltim) 2011, 52, 254–257. [Google Scholar] [CrossRef]
- Bae, Y.J.; Kim, S.K. Low Dietary Calcium Is Associated with Self-Rated Depression in Middle-Aged Korean Women. Nutr Res Pract 2012, 6, 527–533. [Google Scholar] [CrossRef]
- Shivappa, N.; Schoenaker, D.A.J.M.; Hebert, J.R.; Mishra, G.D. Association between Inflammatory Potential of Diet and Risk of Depression in Middle-Aged Women: The Australian Longitudinal Study on Women’s Health. British Journal of Nutrition 2016, 116, 1077–1086. [Google Scholar] [CrossRef] [PubMed]
- Odai, T.; Terauchi, M.; Suzuki, R.; Kato, K.; Hirose, A.; Miyasaka, N. Depressive Symptoms in Middle-Aged and Elderly Women Are Associated with a Low Intake of Vitamin B6: A Cross-Sectional Study. Nutrients 2020, 12, 3437. [Google Scholar] [CrossRef] [PubMed]
- Park, S.J.; Lee, D.K.; Kim, B.; Na, K.S.; Lee, C.H.; Son, Y.D.; Lee, H.J. The Association between Omega-3 Fatty Acid Intake and Human Brain Connectivity in Middle-Aged Depressed Women. Nutrients 2020, 12, 2191. [Google Scholar] [CrossRef]
- Shon, J.; Seong, Y.; Choi, Y.; Kim, Y.; Cho, M.S.; Ha, E.; Kwon, O.; Kim, Y.; Park, Y.J.; Kim, Y. Meal-Based Intervention on Health Promotion in Middle-Aged Women: A Pilot Study. Nutrients 2023, Vol. 15, Page 2108 2023, 15, 2108. [Google Scholar] [CrossRef]
- Choi, J.Y.; Park, S.J.; Lee, H.J. Healthy and Unhealthy Dietary Patterns of Depressive Symptoms in Middle-Aged Women. Nutrients 2024, 16, 776. [Google Scholar] [CrossRef] [PubMed]
- Carels, R.A.; Darby, L.A.; Cacciapaglia, H.M.; Douglass, O.M. Reducing Cardiovascular Risk Factors in Postmenopausal Women through a Lifestyle Change Intervention. J Womens Health 2004, 13, 412–426. [Google Scholar] [CrossRef]
- Palacios, S.; Mustata, C.; Rizo, J.M.; Regidor, P.A. Improvement in Menopausal Symptoms with a Nutritional Product Containing Evening Primrose Oil, Hop Extract, Saffron, Tryptophan, Vitamins B6, D3, K2, B12, and B9. European Review of Medical and Pharmacological Sciences 2023, 27, 8180–8189. [Google Scholar] [CrossRef]
- Kachko, V.A.; Shulman, L.P.; Kuznetsova, I. V.; Uspenskaya, Y.B.; Burchakov, D.I. Clinical Evaluation of Effectiveness and Safety of Combined Use of Dietary Supplements Amberen® and Smart B® in Women with Climacteric Syndrome in Perimenopause. Adv Ther 2024, 41, 3183–3195. [Google Scholar] [CrossRef]
- Liu, X.; Li, J.; He, D.; Zhang, D.; Liu, X. Association between Different Triglyceride Glucose Index-Related Indicators and Depression in Premenopausal and Postmenopausal Women: NHANES, 2013–2016. J Affect Disord 2024, 360, 297–304. [Google Scholar] [CrossRef]
- Shafie, M.; Homayouni Rad, A.; Mirghafourvand, M. Effects of Prebiotic-Rich Yogurt on Menopausal Symptoms and Metabolic Indices in Menopausal Women: A Triple-Blind Randomised Controlled Trial. Int J Food Sci Nutr 2022, 73, 693–704. [Google Scholar] [CrossRef]
- Haghshenas, N.; Baharanchi, F.H.; Melekoglu, E.; Sohouli, M.H.; Shidfar, F. Comparison of Predictive Effect of the Dietary Inflammatory Index and Empirically Derived Food-Based Dietary Inflammatory Index on the Menopause-Specific Quality of Life and Its Complications. BMC Womens Health 2023, 23, 1–13. [Google Scholar] [CrossRef] [PubMed]
- Abshirini, M.; Siassi, F.; Koohdani, F.; Qorbani, M.; Khosravi, S.; Hedayati, M.; Aslani, Z.; Soleymani, M.; Sotoudeh, G. Dietary Total Antioxidant Capacity Is Inversely Related to Menopausal Symptoms: A Cross-Sectional Study among Iranian Postmenopausal Women. Nutrition 2018, 55–56, 161–167. [Google Scholar] [CrossRef] [PubMed]
- Li, D.; Liang, H.; Tong, Y.; Li, Y. Association of Dietary N-3 Polyunsaturated Fatty Acids Intake with Depressive Symptoms in Midlife Women. J Affect Disord 2020, 261, 164–171. [Google Scholar] [CrossRef] [PubMed]
- Li, D.; Tong, Y.; Li, Y. Associations between Dietary Oleic Acid and Linoleic Acid and Depressive Symptoms in Perimenopausal Women: The Study of Women’s Health Across the Nation. Nutrition 2020, 71, 110602. [Google Scholar] [CrossRef]
- Li, D.; Tong, Y.; Li, Y. Associations of Dietary Trans Fatty Acid Intake with Depressive Symptoms in Midlife Women. J Affect Disord 2020, 260, 194–199. [Google Scholar] [CrossRef]
- Li, D.; Wu, Q.; Xu, W.; Zheng, H.; Tong, Y.; Li, Y. Dietary Manganese Intake Is Inversely Associated with Depressive Symptoms in Midlife Women: A Cross-Sectional Study. J Affect Disord 2020, 276, 914–919. [Google Scholar] [CrossRef]
- Li, D.; Tong, Y.; Li, Y. Dietary Fiber Is Inversely Associated With Depressive Symptoms in Premenopausal Women. Front Neurosci 2020, 14. [Google Scholar] [CrossRef]
- Li, D.; Wu, Q.; Tong, Y.; Zheng, H.; Li, Y. Dietary Beta-Carotene Intake Is Inversely Associated with Anxiety in US Midlife Women. J Affect Disord 2021, 287, 96–100. [Google Scholar] [CrossRef]
- Li, D.; Zheng, H.; Tong, Y.; Li, Y. Associations of Dietary Provitamin A Carotenoid Intake with Depressive Symptoms in Midlife Women: Results from the Study of Women’s Health Across the Nation. J Affect Disord 2022, 317, 91–97. [Google Scholar] [CrossRef]
- Li, D.; Xu, W.; Wu, Q.; Zheng, H.; Li, Y. Ascorbic Acid Intake Is Inversely Associated with Prevalence of Depressive Symptoms in US Midlife Women: A Cross-Sectional Study. J Affect Disord 2022, 299, 498–503. [Google Scholar] [CrossRef]
- Li, D.; Liang, H.; Tong, Y.; Zheng, H.; Li, Y. Association between Saturated Fatty Acid Intake and Depressive Symptoms in Midlife Women: A Prospective Study. J Affect Disord 2020, 267, 17–22. [Google Scholar] [CrossRef] [PubMed]
- Li, D.; Zheng, H.; Tong, Y.; Li, Y. Prospective Association between Trans Fatty Acid Intake and Depressive Symptoms: Results from the Study of Women’s Health across the Nation. J Affect Disord 2020, 264, 256–262. [Google Scholar] [CrossRef]
- Bertone-Johnson, E.R.; Powers, S.I.; Spangler, L.; Brunner, R.L.; Michael, Y.L.; Larson, J.C.; Millen, A.E.; Bueche, M.N.; Salmoirago-Blotcher, E.; Liu, S.; et al. Vitamin D Intake from Foods and Supplements and Depressive Symptoms in a Diverse Population of Older Women. Am J Clin Nutr 2011, 94, 1104–1112. [Google Scholar] [CrossRef]
- Gangwisch, J.E.; Hale, L.; Garcia, L.; Malaspina, D.; Opler, M.G.; Payne, M.E.; Rossom, R.C.; Lane, D. High Glycemic Index Diet as a Risk Factor for Depression: Analyses from the Women’s Health Initiative. Am J Clin Nutr 2015, 102, 454–463. [Google Scholar] [CrossRef]
- Persons, J.E.; Robinson, J.G.; Ammann, E.M.; Coryell, W.H.; Espeland, M.A.; Harris, W.S.; Manson, J.E.; Fiedorowicz, J.G. Omega-3 Fatty Acid Biomarkers and Subsequent Depressive Symptoms. Int J Geriatr Psychiatry 2014, 29, 747–757. [Google Scholar] [CrossRef]
- Bertone-Johnson, E.R.; Powers, S.I.; Spangler, L.; Larson, J.; Michael, Y.L.; Millen, A.E.; Bueche, M.N.; Salmoirago-Blotcher, E.; Wassertheil-Smoller, S.; Brunner, R.L.; et al. Vitamin D Supplementation and Depression in the Women’s Health Initiative Calcium and Vitamin D Trial. Am J Epidemiol 2012, 176, 1–13. [Google Scholar] [CrossRef]
- Assaf, A.R.; Beresford, S.A.A.; Risica, P.M.; Aragaki, A.; Brunner, R.L.; Bowen, D.J.; Naughton, M.; Rosal, M.C.; Snetselaar, L.; Wenger, N. Low-Fat Dietary Pattern Intervention and Health-Related Quality of Life: The Women’s Health Initiative Randomized Controlled Dietary Modification Trial. J Acad Nutr Diet 2016, 116, 259–271. [Google Scholar] [CrossRef]
- Pieper, D.; Antoine, S.L.; Mathes, T.; Neugebauer, E.A.M.; Eikermann, M. Systematic Review Finds Overlapping Reviews Were Not Mentioned in Every Other Overview. J Clin Epidemiol 2014, 67, 368–375. [Google Scholar] [CrossRef] [PubMed]
- Freeman, M.P.; Hibbeln, J.R.; Silver, M.; Hirschberg, A.M.; Wang, B.; Yule, A.M.; Petrillo, L.F.; Pascuillo, E.; Economou, N.I.; Joffe, H.; et al. Omega-3 Fatty Acids for Major Depressive Disorder Associated with the Menopausal Transition: A Preliminary Open Trial. Menopause 2011, 18, 279–284. [Google Scholar] [CrossRef] [PubMed]
- Abshirini, M.; Siassi, F.; Koohdani, F.; Qorbani, M.; Mozaffari, H.; Aslani, Z.; Soleymani, M.; Entezarian, M.; Sotoudeh, G. Dietary Total Antioxidant Capacity Is Inversely Associated with Depression, Anxiety and Some Oxidative Stress Biomarkers in Postmenopausal Women: A Cross-Sectional Study. Ann Gen Psychiatry 2019, 18, 1–9. [Google Scholar] [CrossRef]
- Azarmanesh, D.; Bertone-Johnson, E.R.; Pearlman, J.; Liu, Z.; Carbone, E.T. Association of the Dietary Inflammatory Index with Depressive Symptoms among Pre-and Post-Menopausal Women: Findings from the National Health and Nutrition Examination Survey (NHANES) 2005–2010. Nutrients 2022, 14. [Google Scholar] [CrossRef] [PubMed]
- Chae, M.; Park, K. Association between Dietary Omega-3 Fatty Acid Intake and Depression in Postmenopausal Women. Nutr Res Pract 2021, 15, 468–478. [Google Scholar] [CrossRef] [PubMed]
- Kim, Y.; Hong, M.; Kim, S.; Shin, W.Y.; Kim, J.H. Inverse Association between Dietary Fiber Intake and Depression in Premenopausal Women: A Nationwide Population-Based Survey. Menopause 2021, 28, 150–156. [Google Scholar] [CrossRef] [PubMed]
- Liao, K.; Gu, Y.; Liu, M.; Fu, J.; Wang, X.; Yang, G.; Zhang, Q.; Liu, L.; Meng, G.; Yao, Z.; et al. Association of Dietary Patterns with Depressive Symptoms in Chinese Postmenopausal Women. British Journal of Nutrition 2019, 122, 1168–1174. [Google Scholar] [CrossRef]
- Liu, Z.M.; Ho, S.C.; Xie, Y.J.; Chen, Y.J.; Chen, Y.M.; Chen, B.; Yeung-Shan Wong, S.; Chan, D.; Ka Man Wong, C.; He, Q.; et al. Associations between Dietary Patterns and Psychological Factors: A Cross-Sectional Study among Chinese Postmenopausal Women. Menopause 2016, 23, 1294–1302. [Google Scholar] [CrossRef]
- Nazari, F.; Hekmat, K.; Iravani, M.; Haghighizadeh, M.H.; Boostani, H. The Relationship Between Serum Zinc and Magnesium Levels and Depression in Postmenopausal Women. J Biochem Technol 2019, 109–114. [Google Scholar]
- Noll, P.R. e. S.; Noll, M.; Zangirolami-Raimundo, J.; Baracat, E.C.; Louzada, M.L. da C.; Soares Júnior, J.M.; Sorpreso, I.C.E. Life Habits of Postmenopausal Women: Association of Menopause Symptom Intensity and Food Consumption by Degree of Food Processing. Maturitas 2022, 156, 1–11. [Google Scholar] [CrossRef]
- Şengül, Ö.; Uygur, D.; Güleç, M.; Dilbaz, B.; Şimşek, E.M.; Göktolga, Ü. The Comparison of Folate and Vitamin B12 Levels between Depressive and Nondepressive Postmenopausal Women. Turk J Med Sci 2014, 44, 611–615. [Google Scholar] [CrossRef]
- Stanisławska, M.; Szkup-Jabłońska, M.; Jurczak, A.; Wieder-Huszla, S.; Samochowiec, A.; Jasiewicz, A.; Noceń, I.; Augustyniuk, K.; Brodowska, A.; Karakiewicz, B.; et al. The Severity of Depressive Symptoms vs. Serum Mg and Zn Levels in Postmenopausal Women. Biol Trace Elem Res 2014, 157, 30–35. [Google Scholar] [CrossRef]
- Wieder-Huszla, S.; Zabielska, P.; Kotwas, A.; Owsianowska, J.; Karakiewicz-Krawczyk, K.; Kowalczyk, R.; Jurczak, A. The Severity of Depressive and Anxiety Symptoms in Postmenopausal Women Depending on Their Magnesium, Zinc, Selenium and Copper Levels. J Elem 2020, 25, 1305–1317. [Google Scholar] [CrossRef]
- Colangelo, L.A.; Ouyang, P.; Golden, S.H.; Szklo, M.; Gapstur, S.M.; Vaidya, D.; Liu, K. Do Sex Hormones or Hormone Therapy Modify the Relation of N-3 Fatty Acids with Incident Depressive Symptoms in Postmenopausal Women? The MESA Study. Psychoneuroendocrinology 2017, 75, 26–35. [Google Scholar] [CrossRef] [PubMed]
- Farshbaf-Khalili, A.; Ostadrahimi, A.; Mirghafourvand, M.; Ataei-Almanghadim, K.; Dousti, S.; Iranshahi, A.M. Clinical Efficacy of Curcumin and Vitamin e on Inflammatory-Oxidative Stress Biomarkers and Primary Symptoms of Menopause in Healthy Postmenopausal Women: A Triple-Blind Randomized Controlled Trial. J Nutr Metab 2022, 2022, 1–12. [Google Scholar] [CrossRef]
- Kashani, L.; Esalatmanesh, S.; Eftekhari, F.; Salimi, S.; Foroughifar, T.; Etesam, F.; Safiaghdam, H.; Moazen-Zadeh, E.; Akhondzadeh, S. Efficacy of Crocus Sativus (Saffron) in Treatment of Major Depressive Disorder Associated with Post-Menopausal Hot Flashes: A Double-Blind, Randomized, Placebo-Controlled Trial. Arch Gynecol Obstet 2018, 297, 717–724. [Google Scholar] [CrossRef]
- Mason, C.; de Dieu Tapsoba, J.; Duggan, C.; Wang, C.Y.; Korde, L.; McTiernan, A. Repletion of Vitamin D Associated with Deterioration of Sleep Quality among Postmenopausal Women. Prev Med (Baltim) 2016, 93, 166–170. [Google Scholar] [CrossRef] [PubMed]
- Torres, S.J.; Nowson, C.A. A Moderate-Sodium DASH-Type Diet Improves Mood in Postmenopausal Women. Nutrition 2012, 28, 896–900. [Google Scholar] [CrossRef] [PubMed]
- Lee, S.M.; Baek, J.C. Serum Vitamin Levels, Cardiovascular Disease Risk Factors, and Their Association with Depression in Korean Women: A Cross-Sectional Study of a Nationally Representative Sample. Medicina (B Aires) 2023, 59, 2183. [Google Scholar] [CrossRef]
- Oldra, C.M.; Benvegnú, D.M.; Silva, D.R.P.; Wendt, G.W.; Vieira, A.P. Relationships between Depression and Food Intake in Climacteric Women. Climacteric 2020, 23, 474–481. [Google Scholar] [CrossRef]
- Li, Y.; Dai, Q.; Tedders, S.H.; Arroyo, C.; Zhang, J. Legume Consumption and Severe Depressed Mood, the Modifying Roles of Gender and Menopausal Status. Public Health Nutr 2010, 13, 1198–1206. [Google Scholar] [CrossRef]
- Lucas, M.; Asselin, G.; Mérette, C.; Poulin, M.J.; Dodin, S. Ethyl-Eicosapentaenoic Acid for the Treatment of Psychological Distress and Depressive Symptoms in Middle-Aged Women: A Double-Blind, Placebo-Controlled, Randomized Clinical Trial. Am J Clin Nutr 2009, 89, 641–651. [Google Scholar] [CrossRef]
- Shafie, M.; Homayouni Rad, A.; Mohammad-Alizadeh-Charandabi, S.; Mirghafourvand, M. The Effect of Probiotics on Mood and Sleep Quality in Postmenopausal Women: A Triple-Blind Randomized Controlled Trial. Clin Nutr ESPEN 2022, 50, 15–23. [Google Scholar] [CrossRef]
- Kostecka, D.; Schneider-Matyka, D.; Barczak, K.; Starczewska, M.; Szkup, M.; Ustianowski, P.; Brodowski, J.; Grochans, E. The Effect of Vitamin D Levels on Lipid, Glucose Profiles and Depression in Perimenopausal Women. Eur Rev Med Pharmacol Sci 2022, 26, 3493–3505. [Google Scholar] [CrossRef] [PubMed]
- Gianfredi, V.; Dinu, M.; Nucci, D.; Eussen, S.J.P.M.; Amerio, A.; Schram, M.T.; Schaper, N.; Odone, A. Association between Dietary Patterns and Depression: An Umbrella Review of Meta-Analyses of Observational Studies and Intervention Trials. Nutr Rev 2023, 81, 346–359. [Google Scholar] [CrossRef] [PubMed]
- Appleton, K.M.; Boxall, L.R.; Adenuga-Ajayi, O.; Seyar, D.F. Does Fruit and Vegetable Consumption Impact Mental Health? Systematic Review and Meta-Analyses of Published Controlled Intervention Studies. British Journal of Nutrition 2024, 131, 163–173. [Google Scholar] [CrossRef] [PubMed]
- Aslam, H.; Lotfaliany, M.; So, D.; Berding, K.; Berk, M.; Rocks, T.; Hockey, M.; Jacka, F.N.; Marx, W.; Cryan, J.F.; et al. Fiber Intake and Fiber Intervention in Depression and Anxiety: A Systematic Review and Meta-Analysis of Observational Studies and Randomized Controlled Trials. Nutr Rev 2024, 82, 1678–1695. [Google Scholar] [CrossRef]
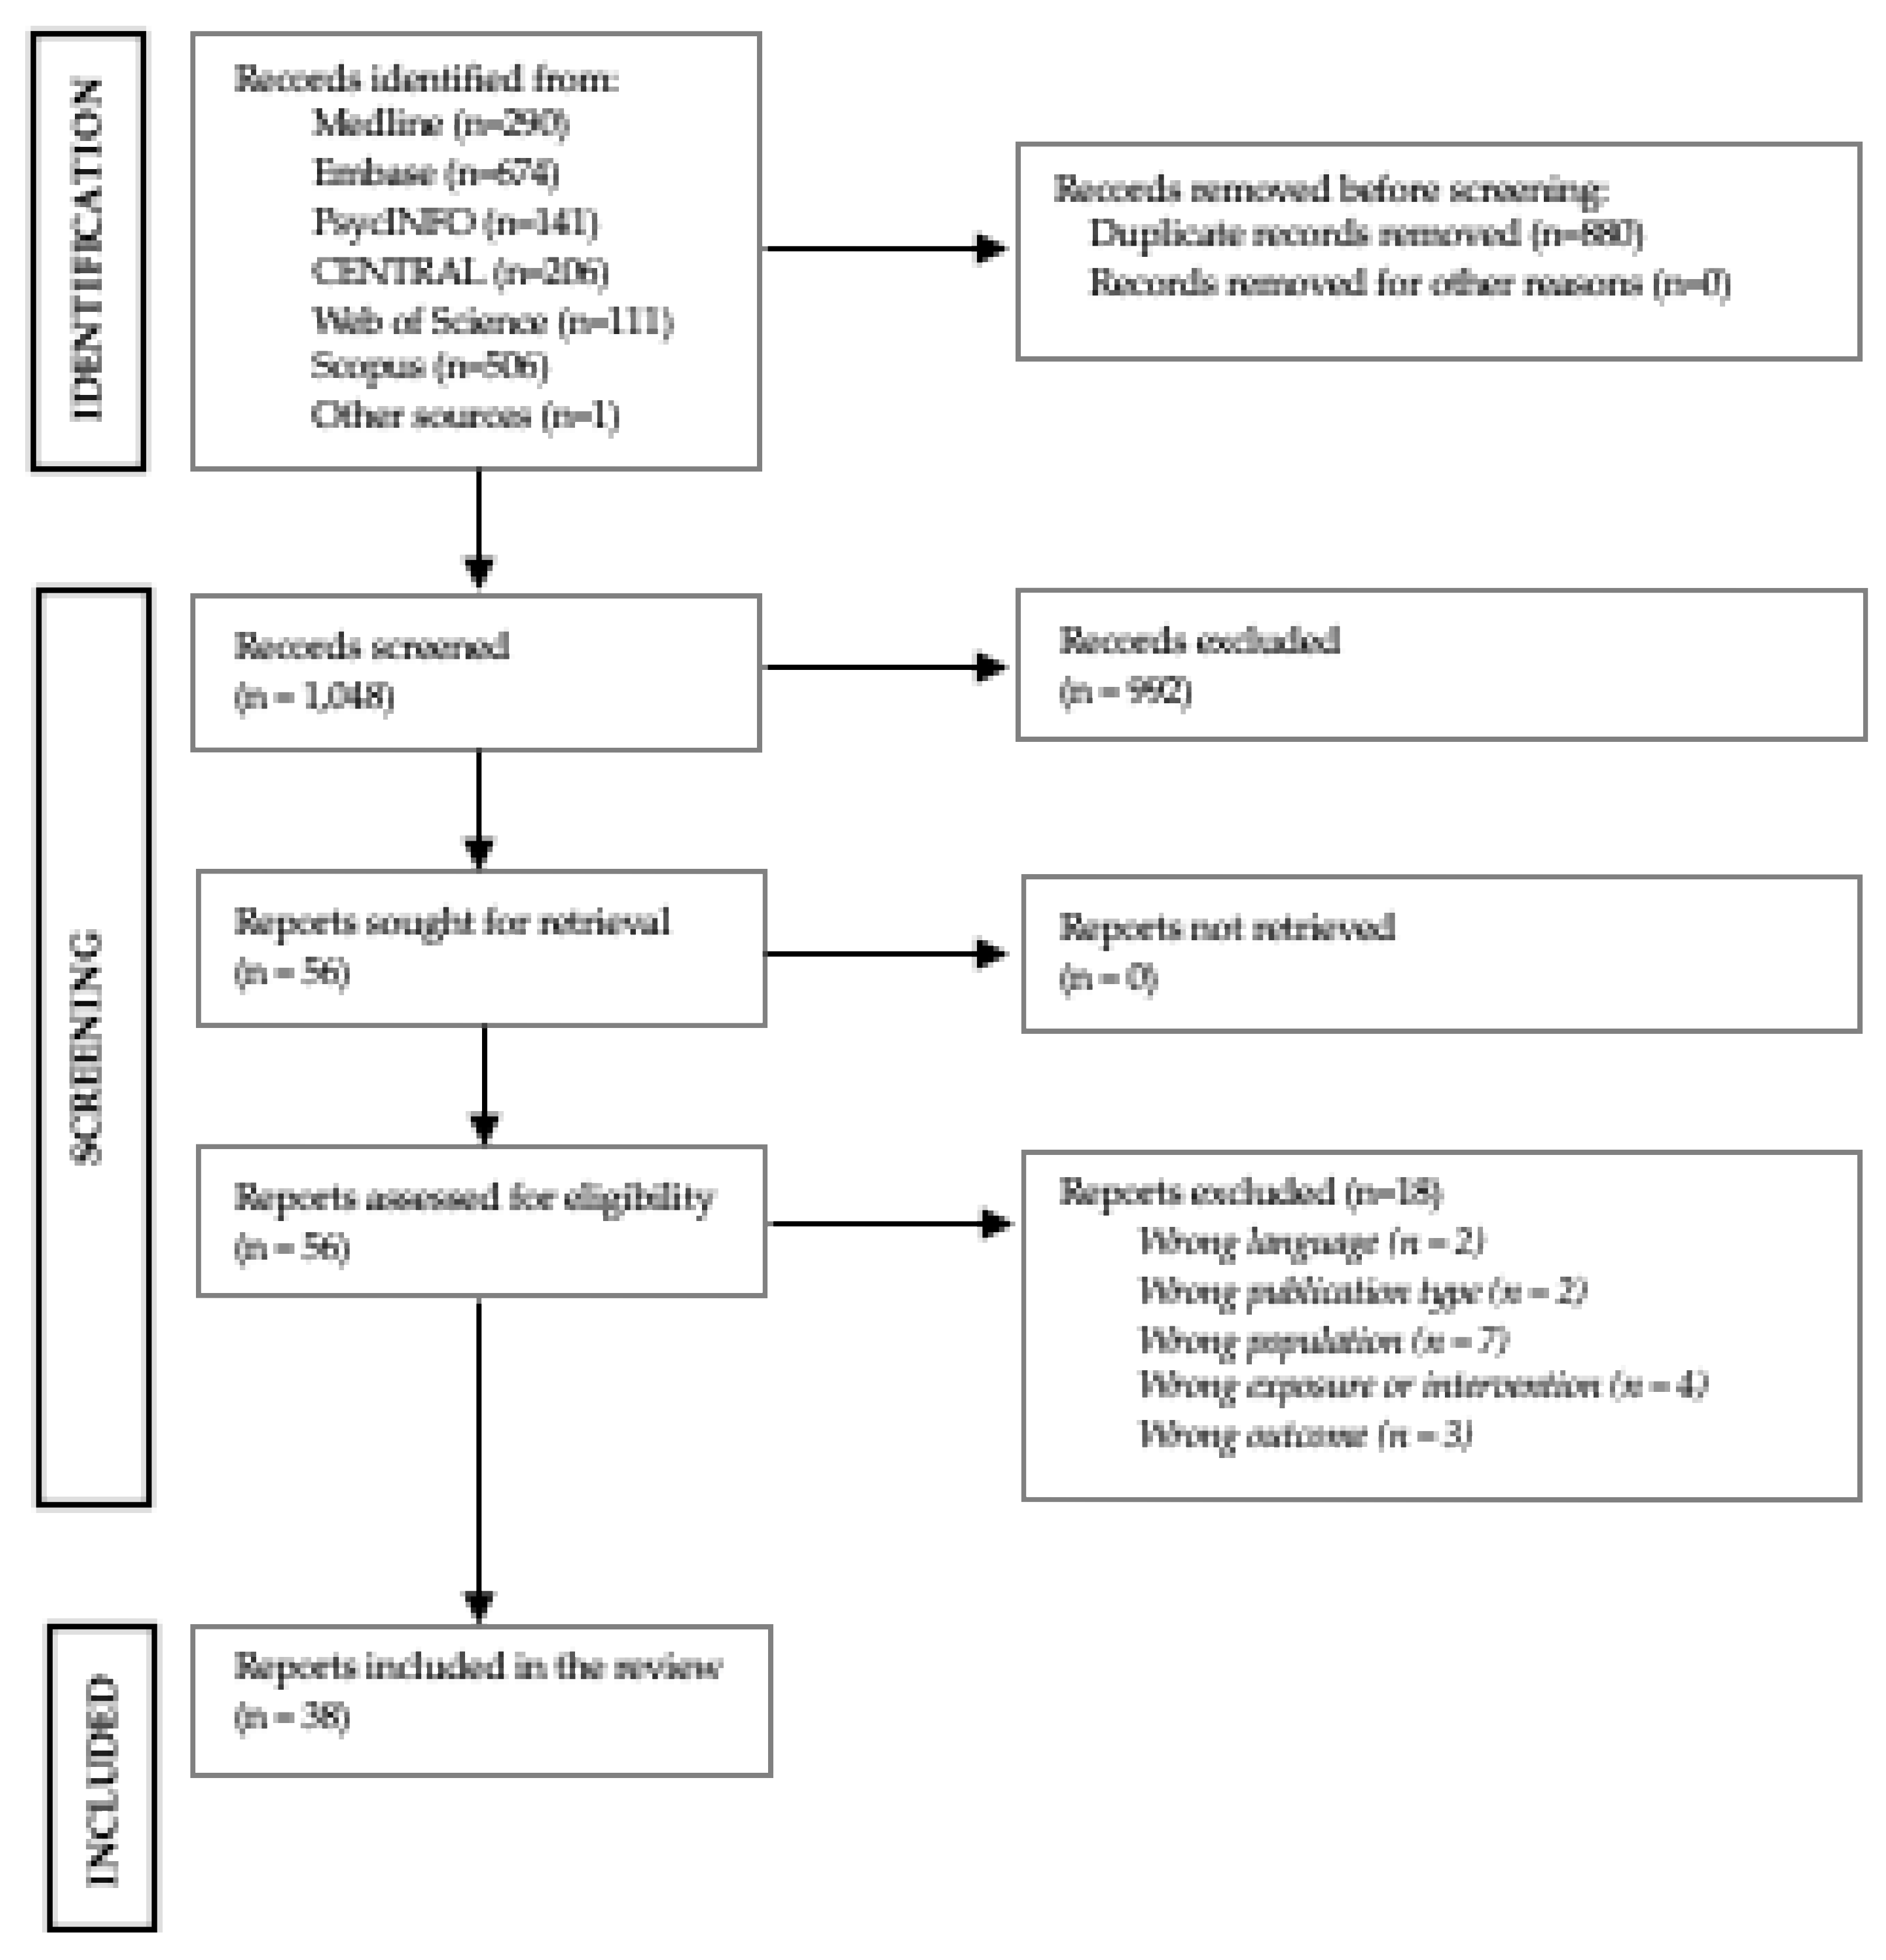
Disclaimer/Publisher’s Note: The statements, opinions and data contained in all publications are solely those of the individual author(s) and contributor(s) and not of MDPI and/or the editor(s). MDPI and/or the editor(s) disclaim responsibility for any injury to people or property resulting from any ideas, methods, instructions or products referred to in the content. |
© 2025 by the authors. Licensee MDPI, Basel, Switzerland. This article is an open access article distributed under the terms and conditions of the Creative Commons Attribution (CC BY) license (http://creativecommons.org/licenses/by/4.0/).
Copyright: This open access article is published under a Creative Commons CC BY 4.0 license, which permit the free download, distribution, and reuse, provided that the author and preprint are cited in any reuse.


