
Submitted:
07 July 2025
Posted:
08 July 2025
You are already at the latest version
Abstract
Background/Objectives: Considering the negative consequences of widespread online misinformation, there is a need for valid tools to measure online misinformation susceptibility. Thus, our aim was to develop and validate a tool to measure susceptibility to online misinformation, i.e. the Online Misinformation Susceptibility Scale (OMISS). Methods: First, we conducted a complete and thorough literature review to create a preliminary list of items for our scale. Subsequently, a multidisciplinary expert panel evaluated the content validity of these initial items. To establish face validity, we conducted cognitive interviews and computed the item-level face validity index. Moreover, we performed both exploratory and confirmatory factor analyses to validate the underlying construct structure of the OMISS. We examined the concurrent validity of the OMISS by using the fake news detection scale, the Trust in Scientists Scale, the single-item trust in scientists scale, the Conspiracy Mentality Questionnaire, and the single-item conspiracy belief scale. Additionally, we used Cronbach’s alpha, McDonald’s Omega, Cohen’s kappa, and intraclass correlation coefficient to examine the reliability of the OMISS. Results: Psychometric evaluation through both exploratory and confirmatory factor analyses supported a one-factor 9-item model for the OMISS. The OMISS demonstrated strong concurrent validity, evidenced by statistically significant correlations with the fake news detection scale (r = -0.135), the Trust in Scientists Scale (r = -0.304), the single-item trust in scientists scale (r = -0.280), the Conspiracy Mentality Questionnaire (r = 0.159), and the single-item conspiracy belief scale (r = 0.095). Cronbach’s alpha and McDonald’s Omega for the OMISS were 0.920 and 0.921, respectively. Intraclass correlation coefficient for the OMISS was 0.994 (p < 0.001). Cohen’s kappa for the nine items ranged from 0.732 to 0.968 (p < 0.001 in all cases) in test-retest study. Conclusions: Our comprehensive psychometric evaluations confirm the OMISS as a valid tool for measuring online misinformation susceptibility. Our findings support a one-factor 9-item model for the OMISS. The OMISS holds promise as an effective tool for identifying susceptibility to misinformation and may support policymakers, health educators, healthcare professionals, and stakeholders in pinpointing high-risk groups.
Keywords:
misinformation
; susceptibility
; development
; validation
; scale
; tool
; questionnaire
; fake news
; social media
; websites
1. Introduction
As of February 2025, 5.56 billion people around the world were using the internet, representing 67.9% of the global population. Additionally, 5.24 billion individuals, or 63.9% of the world’s population, were active on social media [1]. Over the past 15 years, the number of internet users has steadily grown and is projected to reach 7 billion by 2029, setting a new record [2]. The internet plays a vital role in today’s information-driven society by connecting billions globally. For example, internet usage in countries like the Netherlands, Norway, and Saudi Arabia reached 99% of their populations as of February 2025 [1]. Numerous sources generate news that simultaneously reaches millions of people across the globe. With over 67% of the global population now connected to the internet, the spread of false and misleading information has become increasingly effortless. Especially on social media, the abundance of user-generated content enables people to gather around shared interests, beliefs, and narratives [3]. However, the web—particularly social media platforms—also provides fertile ground for the widespread circulation of unverified rumors [4,5,6].
Therefore, in this context, verifying information and recognizing misinformation are critical skills to improve our knowledge and make rational choices since misinformation can change perceptions and creates confusion about reality [7,8]. Misinformation is defined as any information that is demonstrably false or otherwise misleading, regardless of its source or intention [9]. In other words, misinformation is false or misleading information [10] and should be distinct from disinformation which refers to false information that deliberately deceptive and intentionally propagated [11,12].
While misinformation has existed for a long time, it drew significant attention in 2016 following the US Presidential Election and the UK's Brexit referendum, when completely false stories—disguised as credible news—were widely shared on social media [8]. The issue has since become even more prominent, particularly during the COVID-19 pandemic [13] and the Capitol Hill riot after the 2020 US Presidential Election [14]. Misinformation is troubling because it fosters incorrect beliefs and can deepen partisan divides, even on fundamental facts. Online, users may encounter content presented as factual that has not been verified or is simply incorrect. Just reading false news stories can make people more likely to believe them as true later on [15]. The impact of misinformation includes a decline in the accuracy of both general knowledge and specific event details [16]. When individuals are misinformed, they can express their views with confidence, potentially influencing public opinion and policy decisions. This form of misinformation often arises when a speaker appears to be “credible and authoritative” while disseminating falsehoods [17]. Therefore, the global spread of misinformation online has emerged as a major concern, carrying serious health, economic, political, and social implications. False and misleading content threatens both individual well-being and societal stability.
Special attention should be given to health-related online misinformation since this type of misinformation may affect rationale decision-making, health behaviors and health outcomes such as vaccination acceptance, delayed care provision and treatment adherence [18,19,20]. Recently, an umbrella review included 31 systematic reviews and found that the proportion of health-related misinformation on social media ranges from 0.2% to 28.8% [20]. According to this umbrella review, one of the most harmful effects of health misinformation is the rise in misinterpretations or incorrect understandings of existing evidence. It also affects mental health, leads to inefficient use of healthcare resources, and contributes to growing vaccine hesitancy. The spread of unreliable health information can delay medical care and fuel hateful or divisive discourse. Another recent example of direct and notable harm of misinformation to public health is the COVID-19 pandemic. For instance, studies conducted across various countries have found a strong link between belief in COVID-19 misinformation and a lower likelihood of adhering to public health guidelines, getting vaccinated, or recommending the vaccine to others [21,22,23,24]. Experimental data show that exposure to vaccine-related misinformation led to a roughly 6-percentage-point drop in vaccination intent among individuals who initially stated they would “definitely accept a vaccine”, thereby threatening the achievement of herd immunity [25]. Social network analyses predict that, without action, anti-vaccine content on platforms like Facebook could dominate online discussions over the next decade [26]. Additional research has connected exposure to COVID-19 misinformation with the consumption of dangerous substances [27] and a heightened risk of violent behavior [28]. Naturally, health-related misinformation posed a public health threat well before the COVID-19 pandemic. For instance, the discredited claim linking the MMR vaccine to autism led to a notable decline in vaccination rates in the UK [29]. Additionally, misleading information about tobacco has shaped public perceptions of smoking [30], while in 2014; Ebola treatment centers in Liberia were attacked due to the widespread false belief that the virus was part of a government conspiracy [31].
So far, the only method available to assess individuals’ vulnerability to online misinformation is through news evaluation tasks [32,33,34,35,36,37]. In these tasks, participants are shown social media posts or news headlines—both real and fake—and are asked to judge their authenticity. Researchers typically either generate these items using common misinformation tactics [38,39] or select them from trusted fact-checking databases [13,32,40,41,42,43]. Participants then evaluate the reliability or accuracy of the content using a Likert scale or a binary scale (e.g., true vs. false) [44]. In some cases, the news is displayed as plain text [21], while in others, it is accompanied by elements such as an image, a source, and a lede sentence [32]. The ratio of true to false items varies across studies; some include only false news [21], while others present an unbalanced [45] or balanced [32] mix. Researchers often compute an index score by averaging all the ratings (to reflect general belief in true or false information) [38] or by calculating the difference between ratings of true and false items, which indicates a person’s ability to distinguish between accurate and inaccurate news (veracity discernment) [13]. Moreover, in misinformation research, it is common for scholars to assume—rather than know—that they are measuring the same underlying construct [36]. If this assumption proves incorrect, there is a risk of misrepresenting different psychological processes as a single mechanism, leading to an illusory essence bias [46]. Given the complexity of misinformation, responses to one set of items may stem from motivational influences, while responses to another may reflect critical thinking ability—suggesting these tools may not all be assessing the same “discernment skill” [36]. Currently, we lack a clear understanding of how various online misinformation susceptibility measures relate to each other, how different true-to-false ratios affect results [47], and to what extent observed effects stem from response biases rather than genuine skill differences [48]. The limited literature that has investigated scale-specific effects reveal significant item-related influences, raising concerns about the validity of conclusions regarding the effectiveness of interventions [45]. Additionally, issues such as the ecological validity of item selection, presentation format, and response methods are often overlooked [44,49]. As a result, it is challenging to determine whether differences between studies arise from variations in conceptual frameworks, measurement scales, or actual differences in susceptibility to misinformation. The substantial methodological diversity across studies hinders meaningful comparison and limits the generalizability of findings—highlighting the urgent need for a reliable and valid measurement instrument.
Moreover, news evaluation tasks directly assess a participant’s knowledge of fake news, but this focus also presents a drawback. These tasks rely on particular social media posts or online news headlines, which are inherently tied to their unique historical and cultural contexts. Consequently, the generalizability of findings may be limited, as performance on such tasks could vary across different temporal or socio-cultural settings. For instance, Maertens et al. [36] performed their study during 2022 with a sample of US residents and several items (e.g. “Reflecting a demographic shift, 109 US counties have become majority nonwhite since 2000”, “Republicans divided in views of Trump’s conduct, democrats are broadly critical”, and “Democrats more supportive than republicans of federal spending for scientific research”) are irrelevant to non-US citizens, who therefore require a different test. Additionally, several items may not be appropriate even for US residents after a few years since new data and information may emerge (e.g. “New study: left-wingers are more likely to lie to get a higher salary”, “US support for legal marijuana steady in past year” and “New study: clear relationship between eye color and intelligence”). Similarly, Arin et al. [35] collected their data in 2020 from citizens in German, United Kingdom, France, and Spain, but several items on their scale are not up to date such as “Pope Francis shocks world, endorses Donald Trump for president”, “Israeli Defense Minister: If Pakistan sends ground troops to Syria on any pretext, we will destroy this country with a nuclear attack”, “Ukraine will buy the Russian COVID-19 vaccine from Germany at an inflated price”, and “Macron allowed the use of Sputnik V vaccine in France”. Therefore, since each study uses different posts from various time periods, the built-in context of these items confines their relevance to particular locations, cultures, or timeframes making it difficult to compare results across studies.
Online misinformation endangers science, democracy, and rational behavior. Moreover, in clinical and community settings, misinformation is a great threat for public health, healthcare services and patient outcomes. In this context, we developed a new tool for assessing public susceptibility to online misinformation, i.e. the Online Misinformation Susceptibility Scale (OMISS). To the best of our knowledge, the OMISS is the first instrument that measures individuals’ behaviors toward online information verification. Although extensive research [32,33,34,35,36,37] has been conducted, no valid instrument currently exists to assess people’s behaviors toward online misinformation. In particular, until now, all other scales [32,33,34,35,36,37] have assessed individuals’ knowledge by measuring their ability to identify fake and true online news. We extend the current literature and improve our ability to verify valid online information and recognize misinformation, by developing the OMISS. Unlike other similar instruments [32,33,34,35,36,37], the OMISS is a self-report instrument designed for general application across diverse web user populations. The OMISS measures general behaviors toward online misinformation and not specific knowledge such other scales [32,33,34,35,36,37] on this field. Moreover, the OMISS is a general-context measure that can measure online misinformation susceptibility in all fields. Therefore, the OMISS is a new valid tool that we can use to fight online misinformation and fake news in every domain of our lives such as healthcare, science, politics and news media.
2. Materials and Methods
2.1. Development of the Scale
We applied the suggested guidelines [50,51,52] to develop and validate the Online Misinformation Susceptibility Scale. Figure 1 shows the development and validation of the OMISS.
First, we conducted a complete and thorough literature review on online misinformation, fake news, and disinformation (e.g. [4,32,33,34,35,36,53,54,55]). Our aim was to create a preliminary list of items for our scale. After all, we developed 26 items to measure susceptibility to online misinformation (Supplementary Table S1).
Then, a panel of 10 experts with diverse professional backgrounds—including social scientists, psychologists, journalists, and experts on political science, computer science, communication and media studies—was assembled to assess the content validity of the initial 26-item set. Each expert was instructed to evaluate the extent to which every item aligned with the concept of online misinformation susceptibility, using a three-point rating scale: not essential, useful but not essential, or essential. Following the experts’ assessments, the content validity ratio (CVR) was computed for each item using the following formula.
In the formula above, “n” represents the number of experts who classified an item as “essential”, whereas “N” denotes the total number of experts (=10). Consistent with literature suggestions, only items exhibiting a CVR exceeding 0.80 [56] were retained. Following this evaluation, seven items were eliminated, resulting in a refined scale comprising 19 items.
Subsequently, the face validity of the OMISS was assessed through cognitive interviews [57] with five participants. All participants interpreted the 19 items as intended, confirming their conceptual alignment with the study's objectives. To further evaluate item clarity, a pilot study was conducted with 15 participants (seven males and eight females, mean age; 36.7 years), who rated each item on a four-point Likert scale: 1 = item is not clear; 2 = item is somewhat clear; 3 = item is quite clear and 4 = item is highly clear. The item-level face validity index was then calculated, with only items exceeding the recommended threshold of 0.80 retained, in accordance with established guidelines [58]. The item-level face validity index ranged from 0.933 to 1.000, indicating high clarity across all items. Consequently, all 19 items were retained in the scale. Finally, 19 items (Supplementary Table S2) were remained after the assessment of the content and face validity of the OMISS.
2.2. Participants and Procedure
The study population comprised adults aged 18 years or older. Additionally, eligible participants were required to engage with social media platforms and/or browse websites for a minimum of 30 minutes per day. An anonymous online questionnaire was developed using Google Forms and disseminated across multiple digital platforms, including Facebook, Instagram, and LinkedIn. To further broaden participation, a promotional video was created and shared on TikTok, inviting users to take part in the study. Data collection was conducted from the 24th of June 2025 until the 1st of July 2025.
Our final sample included 522 participants. Among them, 79.7% (n=416) were females, and 20.3% (n=106) were males. Mean age of our participants was 37.8 years (standard deviation; 13.0), with a median value of 38 years (minimum age; 18, maximum age; 80). The mean daily usage time for social media/websites was 3.3 hours (standard deviation; 2.1), with a median value of 3 hours (minimum value; 30 minutes, maximum value; 10 hours).
2.3. Item Analysis
Following the initial development phase of the OMISS, an item analysis was conducted on the 19 generated items. The analysis was performed using the full sample (n=522) to assess inter-item correlations, corrected item-total correlations, floor and ceiling effects, skewness, kurtosis, and Cronbach’s alpha (when a single item was deleted) for our 19 items [59]. Inter-item correlations were evaluated against the recommended threshold of 0.15 to 0.75 [60]. Corrected item-total correlations were required to exceed 0.30 to ensure adequate discriminatory power [61].
We asked participants to think about what they do when they see a post or story that interests them on social media or websites. Example items were the following: (1) How often do you check the website domain and URL?, (2) How often do you check the publication date of the post?, (3) How often do you check if the post includes reliable links and references such as scientific articles?, and (4) How often do you check if the post includes the author’s name?
Participants rated each item on a five-point Likert scale with the following anchors: never, rarely, sometimes, very often, and always. Floor and ceiling effects were considered present if more than 85% of respondents selected the lowest (“never”) or highest (“always”) possible score on the five-point Likert scale [62]. Normality of distribution was assessed using skewness (acceptable range: -2 to +2) and kurtosis (acceptable range: -3 to +3) [63].
2.4. Construct Validity
To assess the construct validity of the OMISS, we conducted both exploratory factor analysis (EFA) and confirmatory factor analysis (CFA). Literature recommends minimum sample sizes of 50 observations or five observations per item for EFA [64], and at least 200 observations for CFA [59]. Our sample covered these requirements. In particular, we split randomly our participants into two groups to perform EFA and CFA with different samples. Specifically, we randomly divided our participants into two distinct groups: one sample of 261 participants for the EFA and another sample of 261 participants for the CFA. This strategy of employing separate samples for each analysis was implemented to enhance the robustness and validity of our psychometric evaluations. Both subsamples exceeded the established minimum sample size thresholds for our analyses.
First, we performed EFA to explore the underlying factor structure of the OMISS, and then we employed CFA to verify the results of EFA. In this step, we included the 12 items that emerged after the initial development of the OMISS and the item analysis.
Prior to conducting the EFA, we evaluated the suitability of our data through the Kaiser-Meyer-Olkin index of sampling adequacy, and Bartlett's test of sphericity. Following conventional psychometric standards, we established the following acceptability thresholds: Kaiser-Meyer-Olkin index exceeding 0.80 and Bartlett's test achieving statistical significance (p<0.05) [63]. For the EFA, we implemented oblique rotation (promax method in SPSS). Acceptable values for the EFA are the following: eigenvalues >1, factor loadings >0.60, communalities >0.40, and the total variance explained by the factors >65% [63]. Furthermore, we assessed the internal consistency of factors by computing Cronbach's alpha coefficients, with values above 0.70 considered indicative of acceptable reliability [65].
Following the EFA, we conducted a CFA to validate the factor structure of the OMISS. Given that the OMISS followed normal distribution, the maximum likelihood estimator was employed for the analysis. To assess model fit in the CFA, we evaluated multiple goodness-of-fit indices, including two absolute fit measures-the Root Mean Square Error of Approximation (RMSEA) and the Goodness of Fit Index (GFI)-along with two relative fit indices-the Normed Fit Index (NFI) and the Comparative Fit Index (CFI). Additionally, one parsimonious fit measure-the ratio of chi-square to degrees of freedom (x²/df)-was examined. The established thresholds for acceptable model fit are as follows: RMSEA < 0.10, GFI > 0.90, NFI > 0.90, CFI > 0.90, and x²/df < 5 [66,67]. Furthermore, we computed the standardized regression weights between items and factors.
2.5. Concurrent Validity
After examination of construct validity, we identified a one-factor 9-item model for the OMISS. Participants rated each item on a five-point Likert scale from never to always. We assigned a score on each response, so that a higher score indicates greater misinformation susceptibility. Thus, we assigned 1 to “always”, 2 to “very often”, 3 to “sometimes”, 4 to “rarely”, and 5 to “never”. Total score on the OMISS ranges from 9 to 45. Higher scores indicate higher misinformation susceptibility.
We measured concurrent validity of the OMISS through several ways. Since there no other scales that measure misinformation susceptibility, we employed several other scales to measure concurrent validity of the OMISS.
First, considering that higher levels of online misinformation susceptibility could be correlated with lower ability to detect fake news [21,32,44], we measured participants’ ability to detect fake news. Thus, we provided participants two fake news headlines and two true news headlines. Since we conducted our study in Greece, we selected news headlines that avoid any national bias for this country. Thus, we excluded headlines referring to domestic affairs in Greece and national policy stances. Moreover, we presented the headlines in text-form without any visual material, which might suggest the appearance in specific media outlets (social media or websites). We chose news headlines that were up to date at the time the study was conducted. We pre-tested the four headlines among 15 individuals to confirm the variability of the responses. We took the two fake news headlines from the DiSiNFO Database [68]. The DiSiNFO Database is part of the Diplomatic Service of the European Union [69] with experts in journalism, communications and social sciences. The objective of the DiSiNFO Database is to improve individuals’ awareness and understanding of the misinformation and fake news. In this context, the DiSiNFO Database uses media monitoring services and data analysis in 15 languages to identify, compile, and expose misinformation cases. The selected fake headlines are: (1) US intelligence services read the messages of WhatsApp users. (2) Western mass media and social media are controlled by the government. Additionally, we took one true news headline from “The Guardian” [70], and one from the “France 24” [71]. The Guardian is a British daily newspaper, and it is available online. The Guardian is a "newspaper of record", i.e. a newspaper with a prominent national publication with a wide readership, a wider for its authoritative and impartial journalism. "Newspapers of record" earn their status through reputation, often being among the oldest and most esteemed in the world [72]. The “France 24” is a Paris-based international news network funded by the French government. It broadcasts in French, English, Arabic, and Spanish, primarily targeting global audiences. The channel is accessible worldwide via satellite and offers live news streaming through its website, YouTube, and mobile/digital platforms [73]. The selected true news headlines are: (1) NASA data reveals dramatic rise in intensity of weather events. (2) French President Emmanuel Macron wants to ban social media for under-15s in France. We asked the participants “To the best of your knowledge, how likely is it that the claim in each headline is correct?”. Answers were on a five-point Likert scale: (a) extremely unlikely, (b) somewhat unlikely, (c) neither unlikely nor likely, (d) somewhat likely, and (e) extremely likely. For the two fake news headlines, we assigned a value of 4 for the answer “extremely unlikely”, 3 for “somewhat unlikely”, 2 for “neither unlikely nor likely”, 1 for “somewhat likely”, and 0 for “extremely likely”. We used the reversed coding for the two true news headlines. Then, we summed up answers on the four news headlines, and, thus, we calculated a total score from 0 to 16. Higher scores indicated better fake news detection. We expected a negative correlation between score on fake news detection and score on the OMISS.
Second, considering that low trust in scientists is related with negative behaviors such as vaccine hesitancy [25,74], views on climate change [75,76], and exposure to untrustworthy websites [77], we measured participants’ trust in scientists. We used the Trust in Scientists Scale [78] to measure levels of our participants’ trust in scientists. The Trust in Scientists Scale comprises 12 items and measures four dimensions of trust in scientists, i.e., integrity, competence, benevolence and openness. Since these four factors are highly correlated, we chose one of them (integrity) to use in our study. Integrity is measured with three items (i.e., How honest or dishonest are most scientists?, How ethical or unethical are most scientists?, and How sincere or insincere are most scientists?), and answers are on a five-point Likert scale from 1 (very [dishonest, unethical, insincere)]) to 5 (very [honest, ethical, sincere)]). Total score is calculated as a mean of the answers on the three items. Thus, total integrity score ranges from 1 to 5. Higher values indicate higher levels of trust in scientists. We used the valid Greek version of the Trust in Scientists Scale [78]. In our study, Cronbach’s alpha for the integrity scale was 0.897, and McDonald’s Omega was 0.904. We expected a negative correlation between score on the integrity scale and score on the OMISS.
Third, we used a single question (i.e., How much confidence do you have in the scientists to act in the best interests of the public?) taken from the Pew Research Center to further measure the participants’ level of confidence in scientists [79]. Answers are on a five-point Likert scale from 1 (no confidence at all) to 5 (a great deal of confidence). Higher scores indicate higher levels of trust in sciences. The Pew Research Center is an impartial research organization dedicated to providing objective information about global trends, public attitudes, and societal issues. Through comprehensive public opinion surveys, demographic studies, media content analysis, and other empirical social science research, the Pew Research Center delivers data-driven insights to inform public discourse. Maintaining strict neutrality, the organization refrains from advocating for any policy positions or political stances [80]. We expected a negative correlation between trust in scientists and score on the OMISS.
Fourth, literature suggests that conspiracy theories erode public trust in scientifically-validated positions, particularly regarding vaccination programs [81,82], climate change [83,84] and the COVID-19 pandemic [81,85]. Thus, we measured generic conspiracy beliefs of our participants with the Conspiracy Mentality Questionnaire (CMQ) [86]. The CMQ comprises five items, such as “I think that many very important things happen in the world, which the public is never informed about”, and “I think that politicians usually do not tell us the true motives for their decisions”. Answers are on an 11-point Likert scale from 0 (totally disagree) to 10 (totally agree). Total score on the CMQ is calculated by adding answers on the five items. Therefore, total score on the CMQ ranges from 0 to 50 with higher values indicate higher conspiracy beliefs. We used the valid Greek version of the CMQ [87]. In our study, Cronbach’s alpha for the CMQ was 0.865, and McDonald’s Omega was 0.880. We expected a positive correlation between score on the CMQ and score on the OMISS.
Fifth, we used the single-item conspiracy belief scale, i.e. “I think that the official version of the events given by the authorities very often hides the truth” [88]. Answers range on a nine-point Likert scale from 1 (completely false) to 9 (completely true). Higher scores indicate higher belief in conspiracy theories. We expected a positive correlation between score on the single-item conspiracy belief scale and score on the OMISS.
2.6. Reliability
We calculated Cronbach’s alpha and McDonald’s Omega for the OMISS to evaluate internal consistency of the scale. We used the overall sample (n=522) to calculate these indexes. Cronbach’s alpha and McDonald’s Omega higher than 0.7 are considered as acceptable values [65].
Moreover, we calculated corrected item-total correlations and Cronbach’s alpha when a single item was deleted for the final version with nine items of the OMISS. Corrected item-total correlations higher than 0.30 are considered as acceptable values [61].
Finally, we conducted a test-retest study with 40 participants that answered the OMISS twice in five days. We calculated Cohen’s kappa for the nine items of the OMISS since the answers were in a five-point ordinal scale. Additionally, we measured the two-way mixed intraclass correlation coefficient (absolute agreement) for the total OMISS score.
2.7. Ethical Considerations
The study employed an anonymous, voluntary data collection procedure. Prior to participation, all individuals received comprehensive information regarding the research objectives and methodology, after which they provided informed consent. Ethical approval for this study was obtained from the Institutional Review Board at the Faculty of Nursing, National and Kapodistrian University of Athens (Protocol Approval #55, June 23, 2025). The study was conducted in full compliance with the ethical principles outlined in the Declaration of Helsinki [89].
2.8. Statistical Analysis
Categorical variables are analyzed using absolute frequencies (n) and percentages. For continuous variables, we report measures of central tendency (mean, median) and dispersion (standard deviation, range). Also, we present minimum and maximum value. The normality of scale distributions was assessed through both statistical (Kolmogorov-Smirnov test) and graphical (Q-Q plots) methods. Scores on all scales followed normal distribution. Thus, correlations between scales were examined using Pearson's correlation coefficients. P-values less than 0.05 were considered statistically significant. We performed CFA with AMOS version 21 (Amos Development Corporation, 2018). All other analyses were conducted with IBM SPSS 28.0 (IBM Corp. Released 2012. IBM SPSS Statistics for Windows, Version 28.0. Armonk, NY: IBM Corp.).
3. Results
3.1. Item Analysis
Table 1 presents results from the item analysis. In particular, we present descriptive statistics, corrected item-total correlations, floor and ceiling effects, skewness, kurtosis, and Cronbach’s alpha (when a single item was deleted) for the 19 items that were produced after the initial development phase of the OMISS. Also, Supplementary Table S3 presents inter-item correlations between the 19 items that were produced after the initial development phase of the OMISS.
We deleted items #2, #3, #6, #11, #12, #18 and #19 due to unacceptable values in several criteria through item analysis. In particular, these items had corrected item-total correlations lower than 0.30 and showed floor effects (Table 1). Moreover, these items had several negative inter-item correlations with other items or inter-item correlations outside of the acceptable range of 0.15 to 0.75 (Supplementary Table S3). The items #2, #3, #6, #11, #12, #18 and #19 did not follow normal distribution considering that the skewness and kurtosis values were outside of the range -2 to +2, and -3 to +3, respectively (Table 1).
Additionally, Cronbach’s alpha for the 19 items was 0.888. After removal of each of items #2, #3, #6, #11, #12, #18 and #19, Cronbach’s alpha increased.
Thus, we deleted seven items (#2, #3, #6, #11, #12, #18 and #19, Table 1), and the remaining 12 items had acceptable corrected item-total correlations, inter-item correlations, floor and ceiling effects, skewness and kurtosis. Cronbach’s alpha for the 12 items was 0.920. Supplementary Table S4 shows the 12 items that were remained after the item analysis for the OMISS.
3.2. Exploratory Factor Analysis
The Kaiser-Meyer-Olkin index was 0.891, and p-value for Bartlett sphericity was <0.001 indicating that our sample was adequate to perform EFA. We employed oblique rotation (promax method) to perform our EFA including the 12 items mentioned above (items #1, #4, #5, #7, #8, #9, #10, #13, #14, #15, #16, and #17, Table 1).
Table 2 shows results from EFA. Three items (#1, #8 and #12) had unacceptable factor loadings and communalities. In particular, these three items had factor loadings lower than 0.60, and communalities lower than 0.40. The EFA identified one factor that explained 50.46% of the total variance. Thus, we conducted EFA again after removal of items #1, #8 and #12 to compare findings between the two models. The Kaiser-Meyer-Olkin index was 0.926, and p-value for Bartlett sphericity was <0.001 indicating that our sample was adequate to perform EFA. Table 3 shows results from the second EFA. Now, all items had factor loadings higher than 0.723, and communalities higher than 0.523. Moreover, the EFA identified one factor that explained 64.47% of the total variance. Thus, the second model in Table 3 was better than the first model in Table 2.
Cronbach’s alpha for the OMISS was 0.920, while McDonald’s Omega was 0.931.
Supplementary Table S5 shows the 9 items that were remained after the exploratory factor analysis for the OMISS.
3.3. Confirmatory Factor Analysis
Then, we performed CFA to verify the one-factor structure of the OMISS that obtained from the EFA. Thus, we performed CFA of nine items across one factor. Our CFA suggested that the one-factor model with nine items of the CFA had very good fit to data since x2/df was 1.437, RMSEA was 0.041, GFI was 0.976, NFI was 0.979, and CFI was 0.993. Moreover, the standardized regression weights between the nine items and the one factor ranged from 0.63 to 0.84 (p<0.001 in all cases). Figure 2 shows the CFA for the OMISS.
In conclusion, our factor analysis identified a one-factor 9-item model for the OMISS (Supplementary Table S6).
3.4. Concurrent Validity
We found a negative correlation between the fake news detection scale and the OMISS, suggesting that participants with lower levels of ability to detect fake news have higher levels of misinformation susceptibility (r = -0.135, p-value = 0.002).
Also, we found a negative correlation between the Trust in Scientists Scale and OMISS, suggesting that participants with lower levels of trust in scientists may have higher levels of misinformation susceptibility (r = -0.304, p-value < 0.001). Similarly, there was a negative correlation between the single-item trust in scientists scale and OMISS (r = -0.280, p-value < 0.001).
Moreover, we found a positive correlation between the Conspiracy Mentality Questionnaire and OMISS, suggesting that participants with higher conspiracy beliefs have also higher levels of misinformation susceptibility (r = 0.159, p-value < 0.001). Similarly, the single-item conspiracy belief scale was positively associated with the OMISS (r = 0.095, p-value = 0.030).
Thus, the concurrent validity of the OMISS was excellent. Table 4 shows the correlations between the OMISS, and the fake news detection scale, the Trust in Scientists Scale, the single-item trust in scientists scale, the CMQ, and the single-item conspiracy belief scale.
3.5. Reliability
Cronbach’s alpha and McDonald’s Omega for the one-factor model with nine items for the OMISS was 0.920 and 0.921, respectively.
Moreover, corrected item-total correlations for the nine items ranged between 0.625 and 0.815, while removal of each single item did not increase Cronbach’s alpha for the OMISS (Supplementary Table S7).
Intraclass correlation coefficient for the OMISS was 0.994 (95% confidence interval; 0.989 to 0.997, p < 0.001). Cohen’s kappa for the nine items ranged from 0.732 to 0.968 (p < 0.001 in all cases), (Supplementary Table S8).
Thus, the reliability of the OMISS was excellent.
4. Discussion
In our study, we developed and validated the Online Misinformation Susceptibility Scale to assess online misinformation susceptibility. Our thorough validity and reliability analyses suggest that the OMISS is a reliable and valid tool to measure susceptibility to misinformation. Moreover, the OMISS includes nine items and requires a few minutes to be completed. Therefore, the OMISS is a brief and easy-to-use tool with robust psychometric properties.
Until now, there is only one approach to measure individuals’ vulnerability to online misinformation, namely “news evaluation tasks” [32,33,34,35,36,37]. Briefly, by applying “news evaluation tasks”, researchers create instruments that evaluate individuals’ ability to detect true and fake social media posts or online news headlines. Participants evaluate the accuracy of social media posts or online news headlines through a Likert scale or a binary scale (e.g., true vs. false) [44]. Then, researchers compute a total knowledge score by averaging all the ratings for the social media posts or news headlines that an instrument includes [13,21,38,45]. However this approach has several limitations: (1) Misinformation is a complex issue and answers to one instrument may stem from motivational influences, while responses to another instrument may reflect critical thinking ability—suggesting these instruments may not all be assessing the same “discernment skill” [36]. (2) Low ecological validity of the scales due to item selection, presentation format, and response methods [44,49]. (3) Scales that based on “news evaluation tasks” include social media posts or online news headlines, which are inherently tied to their unique historical and cultural contexts [35,36]. (4) Substantial methodological diversity across studies hinders meaningful comparison and limits the generalizability of findings [32,33,34,35,36,37].
To overcome these limitations we developed the OMISS. To the best of our knowledge, the OMISS is the first self-report instrument that measures individuals’ behaviors toward online information verification. We consider that the OMISS could improve our ability to verify valid online information and recognize misinformation. Unlike similar other scales [32,33,34,35,36,37], the OMISS is a tool designed for general application across diverse web user populations. Our scale measures general behaviors toward online misinformation and not specific knowledge such other scales [32,33,34,35,36,37].
Moreover, the OMISS has another significant property. As we discussed before, the OMISS is a general-context measure that can measure online misinformation susceptibility in all fields. Additionally, with a very slight adaptation, scholars can use the OMISS to measure online misinformation in specific domains. In particular, the introductory note in the OMISS is the following: “Please think about what you do when you see a post or story that interests you on social media or websites”. In this way we can measure misinformation susceptibility in all fields. In a study where researchers want to measure health-related misinformation susceptibility they have to adjust the introductory note by adding two simple words, i.e. “Please think about what you do when you see a health-related post or story that interests you on social media or websites”. After this slight adjustment, the OMISS refers now only in health-related online misinformation and not in online misinformation in general. Similarly, if the aim of a study is to assess science-related misinformation susceptibility, then the introductory note in the OMISS should be “Please think about what you do when you see a science-related post or story that interests you on social media or websites”. Another frequent type of misinformation refers to political misinformation. In this case, scholars should adjust the OMISS as follows: “Please think about what you do when you see a political-related post or story that interests you on social media or websites”.
Measurement of misinformation susceptibility with valid scales such as the OMISS could offer several important scientific, social, and practical benefits. It may help individuals, organizations, and governments respond more effectively to one of the most pressing challenges in the information age. In particular, the OMISS may help us to improve our ability to identify who is more likely to believe misinformation. In other words, we can measure who is most susceptible to misinformation (e.g., by age, education, political identity, or social media use). After that, policy makers can develop and apply evidence-based campaigns to reduce online misinformation (e.g. vaccine safety and effectiveness, election integrity, and health behaviors) by creating interventions to specific personality traits, thinking styles or emotional triggers [54,90]. For instance, the World Health Organization uses susceptibility metrics to prioritize health misinformation responses through its infodemic management campaign [91]. Also, governments, health agencies, and media can adjust messaging strategies to minimize misunderstanding. For instance, design targeted media literacy programs from authoritative organizations such as the European Commission has proven to be effective by reducing health-related misinformation on several issues such as the COVID-19 pandemic and vaccine hesitancy [92]. Moreover, researchers could use the OMISS to assess whether interventions and education actually reduce belief in false information. Furthermore, the OMISS may enable interdisciplinary research in healthcare sciences, communication, political science, and public health since researchers could use the same valid tool to measure misinformation susceptibility.
We followed the suggested guidelines [50,51,52] to develop and validate the OMISS. After a thorough literature review on online misinformation, fake news, and disinformation [4,32,33,34,35,36,53,54,55], we created 26 items that measure online misinformation susceptibility. Then we examined the content validity of these 26 items by calculating the content validity ratio [56]. In this step, seven items were removed resulting in 19 items to further be examined. Face validity included cognitive interviews and calculation of item-level face validity index [58], and 19 items proceeded to the next step for evaluation. Then, we conducted item analysis and seven items were deleted due to unacceptable inter-item correlations, corrected item-total correlations, floor and ceiling effects, skewness values, and kurtosis values [59,60,61].
Therefore, we used 12 items to examine the construct validity of the OMISS. EFA showed that three items had unacceptable factor loadings and communalities, and, thus, we removed them from the OMISS. After this removal, the remaining nine items showed acceptable values in the EFA [63,64]. Moreover, the EFA identified one factor for the OMISS that explained 64.47% of the total variance. The CFA supported the construct structure of the EFA [66,67]. Therefore, our reliability and validity analyses identified a one-factor 9-item model for the OMISS.
Additionally, we used five valid scales (i.e., fake news detection scale, the Trust in Scientists Scale, the single-item trust in scientists scale, the Conspiracy Mentality Questionnaire, and the single-item conspiracy belief scale) to examine the construct validity of the OMISS. We found statistically significant correlations between the OMISS and the five scales, and thus, the construct validity of the OMISS is strong. In particular, we found a negative correlation between online misinformation susceptibility and ability of participants to detect fake news detection, and participants’ trust in scientists. In other words, we found that participants with lower levels of ability to detect fake news have higher levels of misinformation susceptibility. Also, our findings showed that participants with lower levels of trust in scientists have higher levels of misinformation susceptibility. Moreover, we found a positive correlation between online misinformation susceptibility and conspiracy beliefs. Thus, in our study participants with higher conspiracy beliefs have also higher levels of misinformation susceptibility.
Our study had several limitations. First, we used five scales to examine the concurrent validity of the OMISS: (1) fake news detection scale, (2) Trust in Scientists Scale, (3) single-item trust in scientists scale, (4) Conspiracy Mentality Questionnaire, and (5) single-item conspiracy belief scale. The concurrent validity of the OMISS can be further explored by using measures of cognitive effort (i.e., analytical reasoning [93]) since there is a link between analytical reasoning and critical thinking [33]. Moreover, scholars could use measures of motivation to engage in cognitive activities since literature suggests an association between engagement in cognitive activities and scientific interest [94], partisan evaluations [95] and innovation [96]. Second, the OMISS as well as the other scales we used in our study were self-report instruments, and, thus, information bias is probable due to some participant subjectivity. Third, our study was carried out in a specific country using a convenience sample. For example, the percentage of male participants was relatively low compared to the general population. As a result, the findings cannot be broadly generalized, and future research should aim to use more representative samples and diverse populations to further evaluate the validity of the OMISS. Nevertheless, the psychometric analysis remains robust, as the sample size fulfilled all necessary criteria. In any case, scholars should examine the psychometric properties of the OMISS in different populations and cultural settings. Fourth, we used a cross-sectional study to assess the validity of the OMISS. However, because participants’ behaviors may vary over time, longitudinal research is needed to explore how susceptibility to misinformation evolves. Fifth, we performed a thorough examination of the psychometric properties of the OMISS, but scholars may also use other approaches to examine the reliability and validity of the scale, such as divergent validity, criterion validity and known-groups validity. Finally, as this was the first assessment of the validity of the OMISS, we did not aim to determine a cut-off score. Future research could conduct cut-off analyses to identify threshold values for distinguishing between participants
5. Conclusions
Online users are increasingly exposed to misinformation at an accelerating pace. To separate fact from falsehood, today’s audiences need strong information literacy skills that enable them to verify the content they encounter. Although the importance of verifying online information is widely recognized, there are currently no established tools to assess this ability. Additionally, researchers lack a consistent definition of misinformation susceptibility and often rely on invalid measurement tools. To address this gap, our study developed and validated the Online Misinformation Susceptibility Scale. We believe our findings offer valuable insights into misinformation susceptibility and provide relevant guidance for policymakers aiming to limit the spread of misinformation and lower public vulnerability to it.
Following a comprehensive analysis of its reliability and validity, we found that the OMISS is a brief, user-friendly tool with robust psychometric properties. Our findings suggest that the OMISS is a one-factor 9-item scale that measures public misinformation susceptibility. As such, it serves as a timely instrument for measuring susceptibility levels and identifying individuals at higher risk. Given the study's limitations, we recommend translating and validating the OMISS across different languages and populations to further assess its reliability and validity. The OMISS holds promise as an effective tool for identifying susceptibility to misinformation and may support policymakers, health educators, healthcare professionals, and stakeholders in pinpointing high-risk groups. For example, both researchers and practitioners can use the OMISS to evaluate the effectiveness of media literacy interventions by comparing scores before and after interventions. Furthermore, researchers in all disciplines (e.g., healthcare scientists, social scientists, political scientists and journalists) may now use a valid tool such as the Online Misinformation Susceptibility Scale to identify predictors and consequences of misinformation susceptibility
Supplementary Materials
The following supporting information can be downloaded at the website of this paper posted on Preprints.org. Table S1: The 26 items that were produced after the initial development phase of the Online Misinformation Susceptibility Scale; Table S2: The 19 items that were remained after the assessment of the content and face validity of the Online Misinformation Susceptibility Scale; Table S3: Inter-item correlations between the 19 items that were produced after the initial development phase of the Online Misinformation Susceptibility Scale (n=522); Table S4: The 12 items that were remained after the item analysis for the Online Misinformation Susceptibility Scale; Table S5: The 9 items that were remained after the exploratory factor analysis for the Online Misinformation Susceptibility Scale; Table S6: The final version of the Online Misinformation Susceptibility Scale; Table S7: Corrected item-total correlations and Cronbach’s alpha (when a single item was deleted) for the one-factor model with nine items for the Online Misinformation Susceptibility Scale (n=522); Table S8: Cohen’s kappa for the one-factor model with nine items for the Online Misinformation Susceptibility Scale (n=40).
Author Contributions
Conceptualization, A.K., I.M. and Pe.G.; methodology, A.K., I.M. and Pe.G.; software, P.M., O.K. and Pa.G.; validation, P.M., O.K., M.C. and Pa.G.; formal analysis, O.K. AND Pe.G.; investigation, P.M., M.C. and Pa.G.; resources, A.K., I.M. and Pe.G.; data curation, P.M., M.C. and Pa.G.; writing—original draft preparation, A.K., I.M., P.M., O.K., M.C., Pa.G. and Pe.G.; writing—review and editing, A.K., I.M., P.M., O.K., M.C., Pa.G. and Pe.G.; visualization, Pe.G.; supervision, Pe.G.; project administration, Pe.G. All authors have read and agreed to the published version of the manuscript.
Funding
This research received no external funding.
Institutional Review Board Statement
The study was conducted in accordance with the Declaration of Helsinki, and approved by the Institutional Review Board of the Faculty of Nursing, National and Kapodistrian University of Athens (Protocol Approval #55, June 23, 2025).
Informed Consent Statement
Informed consent was obtained from all subjects involved in the study.
Data Availability Statement
The original data presented in the study are openly available in FigShare at https://doi.org/10.6084/m9.figshare.29432735.
Acknowledgments
None.
Conflicts of Interest
The authors declare no conflicts of interest.
Abbreviations
The following abbreviations are used in this manuscript:
| CFA | Confirmatory factor analysis |
| CFI | Comparative Fit Index |
| CMQ | Conspiracy mentality questionnaire |
| CVR | Content validity ratio |
| EFA | Exploratory factor analysis |
| NFI | Normed Fit Index |
| GFI | Goodness of Fit Index |
| RMSEA | Root Mean Square Error of Approximation |
| SPSS | Statistical package for social sciences |
| UK | United Kingdom |
| US | United States |
References
- Statista. Number of Internet and Social Media Users Worldwide as of February 2025. Available online: https://www.statista.com/statistics/617136/digital-population-worldwide/.
- Statista. Number of Internet Users Worldwide from 2014 to 2029. Available online: https://www.statista.com/forecasts/1146844/internet-users-in-the-world.
- Meng, F.; Xie, J.; Sun, J.; Xu, C.; Zeng, Y.; Wang, X.; Jia, T.; Huang, S.; Deng, Y.; Hu, Y. Spreading Dynamics of Information on Online Social Networks. Proc. Natl. Acad. Sci. U.S.A. 2025, 122, e2410227122. [CrossRef]
- Ceylan, G.; Anderson, I.A.; Wood, W. Sharing of Misinformation Is Habitual, Not Just Lazy or Biased. Proc. Natl. Acad. Sci. U.S.A. 2023, 120, e2216614120. [CrossRef]
- Brady, W.J.; McLoughlin, K.; Doan, T.N.; Crockett, M.J. How Social Learning Amplifies Moral Outrage Expression in Online Social Networks. Sci. Adv. 2021, 7, eabe5641. [CrossRef]
- Anderson, I.A.; Wood, W. Social Motivations’ Limited Influence on Habitual Behavior: Tests from Social Media Engagement. Motivation Science 2023, 9, 107–119. [CrossRef]
- Molina, M.D.; Sundar, S.S.; Le, T.; Lee, D. “Fake News” Is Not Simply False Information: A Concept Explication and Taxonomy of Online Content. American Behavioral Scientist 2021, 65, 180–212. [CrossRef]
- Pennycook, G.; Epstein, Z.; Mosleh, M.; Arechar, A.A.; Eckles, D.; Rand, D.G. Shifting Attention to Accuracy Can Reduce Misinformation Online. Nature 2021, 592, 590–595. [CrossRef]
- Van Der Linden, S.; Albarracín, D.; Fazio, L.; Freelon, D.; Roozenbeek, J.; Swire-Thompson, B.; Van Bavel, J. Using Psychological Ccience to Understand and Fight Health Misinformation; American Psychological Association: Washington, DC, 2023;
- Fetzer, J.H. Information: Does It Have To Be True? Minds and Machines 2004, 14, 223–229. [CrossRef]
- Diaz Ruiz, C. Disinformation on Digital Media Platforms: A Market-Shaping Approach. New Media & Society 2025, 27, 2188–2211. [CrossRef]
- Fallis, D. What Is Disinformation? lib 2015, 63, 401–426. [CrossRef]
- Pennycook, G.; McPhetres, J.; Zhang, Y.; Lu, J.G.; Rand, D.G. Fighting COVID-19 Misinformation on Social Media: Experimental Evidence for a Scalable Accuracy-Nudge Intervention. Psychol Sci 2020, 31, 770–780. [CrossRef]
- Pennycook, G.; Rand, D.G. Research Note: Examining False Beliefs about Voter Fraud in the Wake of the 2020 Presidential Election. HKS Misinfo Review 2021. [CrossRef]
- Pennycook, G.; Cannon, T.D.; Rand, D.G. Prior Exposure Increases Perceived Accuracy of Fake News. Journal of Experimental Psychology: General 2018, 147, 1865–1880. [CrossRef]
- Bodner, G.E.; Musch, E.; Azad, T. Reevaluating the Potency of the Memory Conformity Effect. Memory & Cognition 2009, 37, 1069–1076. [CrossRef]
- Global Health Security: Recognizing Vulnerabilities, Creating Opportunities; Masys, A.J., Izurieta, R., Reina Ortiz, M., Eds.; Advanced Sciences and Technologies for Security Applications; Springer International Publishing: Cham, 2020; ISBN 978-3-030-23490-4.
- Wandless, D. The Effect of Web-Based Clinical Misinformation on Patient Interactions. Medicine 2025, 53, 407–410. [CrossRef]
- Van Der Linden, S. Misinformation: Susceptibility, Spread, and Interventions to Immunize the Public. Nat Med 2022, 28, 460–467. [CrossRef]
- Borges Do Nascimento, I.J.; Beatriz Pizarro, A.; Almeida, J.; Azzopardi-Muscat, N.; André Gonçalves, M.; Björklund, M.; Novillo-Ortiz, D. Infodemics and Health Misinformation: A Systematic Review of Reviews. Bull World Health Organ 2022, 100, 544–561. [CrossRef]
- Roozenbeek, J.; Schneider, C.R.; Dryhurst, S.; Kerr, J.; Freeman, A.L.J.; Recchia, G.; Van Der Bles, A.M.; Van Der Linden, S. Susceptibility to Misinformation about COVID-19 around the World. R. Soc. open sci. 2020, 7, 201199. [CrossRef]
- Romer, D.; Jamieson, K.H. Conspiracy Theories as Barriers to Controlling the Spread of COVID-19 in the U.S. Social Science & Medicine 2020, 263, 113356. [CrossRef]
- Imhoff, R.; Lamberty, P. A Bioweapon or a Hoax? The Link Between Distinct Conspiracy Beliefs About the Coronavirus Disease (COVID-19) Outbreak and Pandemic Behavior. Soc Psychol Personal Sci 2020, 11, 1110–1118. [CrossRef]
- Freeman, D.; Waite, F.; Rosebrock, L.; Petit, A.; Causier, C.; East, A.; Jenner, L.; Teale, A.-L.; Carr, L.; Mulhall, S.; et al. Coronavirus Conspiracy Beliefs, Mistrust, and Compliance with Government Guidelines in England. Psychol. Med. 2022, 52, 251–263. [CrossRef]
- Loomba, S.; De Figueiredo, A.; Piatek, S.J.; De Graaf, K.; Larson, H.J. Measuring the Impact of COVID-19 Vaccine Misinformation on Vaccination Intent in the UK and USA. Nat Hum Behav 2021, 5, 337–348. [CrossRef]
- Johnson, N.F.; Velásquez, N.; Restrepo, N.J.; Leahy, R.; Gabriel, N.; El Oud, S.; Zheng, M.; Manrique, P.; Wuchty, S.; Lupu, Y. The Online Competition between Pro- and Anti-Vaccination Views. Nature 2020, 582, 230–233. [CrossRef]
- Aghababaeian, H.; Hamdanieh, L.; Ostadtaghizadeh, A. Alcohol Intake in an Attempt to Fight COVID-19: A Medical Myth in Iran. Alcohol 2020, 88, 29–32. [CrossRef]
- Jolley, D.; Paterson, J.L. Pylons Ablaze: Examining the Role of 5G COVID-19 Conspiracy Beliefs and Support for Violence. British J Social Psychol 2020, 59, 628–640. [CrossRef]
- Dubé, E.; Vivion, M.; MacDonald, N.E. Vaccine Hesitancy, Vaccine Refusal and the Anti-Vaccine Movement: Influence, Impact and Implications. Expert Review of Vaccines 2015, 14, 99–117. [CrossRef]
- Albarracin, D.; Romer, D.; Jones, C.; Hall Jamieson, K.; Jamieson, P. Misleading Claims About Tobacco Products in YouTube Videos: Experimental Effects of Misinformation on Unhealthy Attitudes. J Med Internet Res 2018, 20, e229. [CrossRef]
- Krishna, A.; Thompson, T.L. Misinformation About Health: A Review of Health Communication and Misinformation Scholarship. American Behavioral Scientist 2021, 65, 316–332. [CrossRef]
- Pennycook, G.; Rand, D.G. Lazy, Not Biased: Susceptibility to Partisan Fake News Is Better Explained by Lack of Reasoning than by Motivated Reasoning. Cognition 2019, 188, 39–50. [CrossRef]
- Pennycook, G.; Rand, D.G. Who Falls for Fake News? The Roles of Bullshit Receptivity, Overclaiming, Familiarity, and Analytic Thinking. Journal of Personality 2020, 88, 185–200. [CrossRef]
- Bronstein, M.V.; Pennycook, G.; Bear, A.; Rand, D.G.; Cannon, T.D. Belief in Fake News Is Associated with Delusionality, Dogmatism, Religious Fundamentalism, and Reduced Analytic Thinking. Journal of Applied Research in Memory and Cognition 2019, 8, 108–117. [CrossRef]
- Arin, K.P.; Mazrekaj, D.; Thum, M. Ability of Detecting and Willingness to Share Fake News. Sci Rep 2023, 13, 7298. [CrossRef]
- Maertens, R.; Götz, F.M.; Golino, H.F.; Roozenbeek, J.; Schneider, C.R.; Kyrychenko, Y.; Kerr, J.R.; Stieger, S.; McClanahan, W.P.; Drabot, K.; et al. The Misinformation Susceptibility Test (MIST): A Psychometrically Validated Measure of News Veracity Discernment. Behav Res 2023, 56, 1863–1899. [CrossRef]
- Sparks, J.R.; Katz, I.R.; Beile, P.M. Assessing Digital Information Literacy in Higher Education: A Review of Existing Frameworks and Assessments With Recommendations for Next-Generation Assessment. ETS Research Report Series 2016, 2016, 1–33. [CrossRef]
- Maertens, R.; Roozenbeek, J.; Basol, M.; Van Der Linden, S. Long-Term Effectiveness of Inoculation against Misinformation: Three Longitudinal Experiments. Journal of Experimental Psychology: Applied 2021, 27, 1–16. [CrossRef]
- Roozenbeek, J.; Van Der Linden, S. Fake News Game Confers Psychological Resistance against Online Misinformation. Palgrave Commun 2019, 5, 65. [CrossRef]
- Cook, J.; Lewandowsky, S.; Ecker, U.K.H. Neutralizing Misinformation through Inoculation: Exposing Misleading Argumentation Techniques Reduces Their Influence. PLoS ONE 2017, 12, e0175799. [CrossRef]
- Guess, A.M.; Lerner, M.; Lyons, B.; Montgomery, J.M.; Nyhan, B.; Reifler, J.; Sircar, N. A Digital Media Literacy Intervention Increases Discernment between Mainstream and False News in the United States and India. Proc. Natl. Acad. Sci. U.S.A. 2020, 117, 15536–15545. [CrossRef]
- Swire, B.; Berinsky, A.J.; Lewandowsky, S.; Ecker, U.K.H. Processing Political Misinformation: Comprehending the Trump Phenomenon. R. Soc. open sci. 2017, 4, 160802. [CrossRef]
- Van Der Linden, S.; Roozenbeek, J.; Maertens, R.; Basol, M.; Kácha, O.; Rathje, S.; Traberg, C.S. How Can Psychological Science Help Counter the Spread of Fake News? Span. J. Psychol. 2021, 24, e25. [CrossRef]
- Roozenbeek, J.; Maertens, R.; Herzog, S.M.; Geers, M.; Kurvers, R.; Sultan, M.; Van Der Linden, S. Susceptibility to Misinformation Is Consistent across Question Framings and Response Modes and Better Explained by Myside Bias and Partisanship than Analytical Thinking. Judgm Decis Mak 2022, 17, 547–573. [CrossRef]
- Roozenbeek, J.; Maertens, R.; McClanahan, W.; Van Der Linden, S. Disentangling Item and Testing Effects in Inoculation Research on Online Misinformation: Solomon Revisited. Educational and Psychological Measurement 2021, 81, 340–362. [CrossRef]
- Brick, C.; Hood, B.; Ekroll, V.; de-Wit, L. Illusory Essences: A Bias Holding Back Theorizing in Psychological Science. Perspect Psychol Sci 2022, 17, 491–506. [CrossRef]
- Aird, M.J.; Ecker, U.K.H.; Swire, B.; Berinsky, A.J.; Lewandowsky, S. Does Truth Matter to Voters? The Effects of Correcting Political Misinformation in an Australian Sample. R. Soc. open sci. 2018, 5, 180593. [CrossRef]
- Batailler, C.; Brannon, S.M.; Teas, P.E.; Gawronski, B. A Signal Detection Approach to Understanding the Identification of Fake News. Perspect Psychol Sci 2022, 17, 78–98. [CrossRef]
- Dhami, M.K.; Hertwig, R.; Hoffrage, U. The Role of Representative Design in an Ecological Approach to Cognition. Psychological Bulletin 2004, 130, 959–988. [CrossRef]
- DeVellis, R.F.; Thorpe, C.T. Scale Development: Theory and Applications; Fifth edition.; SAGE Publications, Inc: Thousand Oaks, California, 2022; ISBN 978-1-5443-7934-0.
- Johnson, R.L.; Morgan, G.B. Survey Scales: A Guide to Development, Analysis, and Reporting; The Guilford Press: New York, 2016; ISBN 978-1-4625-2696-3.
- Saris, W.E. Design, Evaluation, and Analysis of Questionnaires for Survey Research; Second Edition.; Wiley: Hoboken, New Jersey, 2014; ISBN 978-1-118-63461-5.
- Denniss, E.; Lindberg, R. Social Media and the Spread of Misinformation: Infectious and a Threat to Public Health. Health Promotion International 2025, 40, daaf023. [CrossRef]
- Sultan, M.; Tump, A.N.; Ehmann, N.; Lorenz-Spreen, P.; Hertwig, R.; Gollwitzer, A.; Kurvers, R.H.J.M. Susceptibility to Online Misinformation: A Systematic Meta-Analysis of Demographic and Psychological Factors. Proc. Natl. Acad. Sci. U.S.A. 2024, 121, e2409329121. [CrossRef]
- Wang, Y.; McKee, M.; Torbica, A.; Stuckler, D. Systematic Literature Review on the Spread of Health-Related Misinformation on Social Media. Social Science & Medicine 2019, 240, 112552. [CrossRef]
- Ayre, C.; Scally, A.J. Critical Values for Lawshe’s Content Validity Ratio: Revisiting the Original Methods of Calculation. Meas Eval Counsel Dev 2014, 47, 79–86. [CrossRef]
- Meadows, K. Cognitive Interviewing Methodologies. Clin Nurs Res 2021, 30, 375–379. [CrossRef]
- Yusoff, M.S.B. ABC of Response Process Validation and Face Validity Index Calculation. EIMJ 2019, 11, 55–61. [CrossRef]
- Costello, A.B.; Osborne, J. Best Practices in Exploratory Factor Analysis: Four Recommendations for Getting the Most from Your Analysis. Pract Assess Res Eval 2005, 10, 1–9. [CrossRef]
- DeVon, H.A.; Block, M.E.; Moyle-Wright, P.; Ernst, D.M.; Hayden, S.J.; Lazzara, D.J.; Savoy, S.M.; Kostas-Polston, E. A Psychometric Toolbox for Testing Validity and Reliability. J Nurs Scholarsh 2007, 39, 155–164. [CrossRef]
- De Vaus, D. Surveys in Social Research; 5th ed.; Routledge: London, 2004;
- Yusoff, M.S.B.; Arifin, W.N.; Hadie, S.N.H. ABC of Questionnaire Development and Validation for Survey Research. EIMJ 2021, 13, 97–108. [CrossRef]
- Hair, J.; Black, W.; Babin B; Anderson, R. Multivariate Data Analysis; 7th ed.; Prentice Hall: New Jersey, 2017;
- De Winter, J.C.F.; Dodou, D.; Wieringa, P.A. Exploratory Factor Analysis With Small Sample Sizes. Multivariate Behav Res 2009, 44, 147–181. [CrossRef]
- Bland, J.M.; Altman, D.G. Statistics Notes: Cronbach’s Alpha. BMJ 1997, 314, 572–572. [CrossRef]
- Hu, L.; Bentler, P.M. Fit Indices in Covariance Structure Modeling: Sensitivity to Underparameterized Model Misspecification. Psychol Methods 1998, 3, 424–453. [CrossRef]
- Baumgartner, H.; Homburg, C. Applications of Structural Equation Modeling in Marketing and Consumer Research: A Review. Int J Res Mark 1996, 13, 139–161. [CrossRef]
- DiSiNFO Database Available online: https://euvsdisinfo.eu/disinformation-cases/.
- Diplomatic Service of the European Union Available online: https://www.eeas.europa.eu/_en.
- Nasa Data Reveals Dramatic Rise in Intensity of Weather Events Available online: https://www.theguardian.com/world/2025/jun/17/nasa-data-reveals-dramatic-rise-in-intensity-of-weather-events.
- France Mulls Social Media Ban for Under-15s after Fatal School Stabbing Available online: https://www.france24.com/en/live-news/20250611-france-eyes-social-media-ban-for-under-15s-after-school-stabbing.
- The Guardian Available online: https://en.wikipedia.org/wiki/The_Guardian.
- France 24 Available online: https://en.wikipedia.org/wiki/France_24.
- Santirocchi, A.; Spataro, P.; Alessi, F.; Rossi-Arnaud, C.; Cestari, V. Trust in Science and Belief in Misinformation Mediate the Effects of Political Orientation on Vaccine Hesitancy and Intention to Be Vaccinated. Acta Psychologica 2023, 237, 103945. [CrossRef]
- Cologna, V.; Kotcher, J.; Mede, N.G.; Besley, J.; Maibach, E.W.; Oreskes, N. Trust in Climate Science and Climate Scientists: A Narrative Review. PLOS Clim 2024, 3, e0000400. [CrossRef]
- Bogert, J.M.; Buczny, J.; Harvey, J.A.; Ellers, J. The Effect of Trust in Science and Media Use on Public Belief in Anthropogenic Climate Change: A Meta-Analysis. Environmental Communication 2024, 18, 484–509. [CrossRef]
- Guess, A.M.; Nyhan, B.; Reifler, J. Exposure to Untrustworthy Websites in the 2016 US Election. Nat Hum Behav 2020, 4, 472–480. [CrossRef]
- Cologna, V.; Mede, N.G.; Berger, S.; Besley, J.; Brick, C.; Joubert, M.; Maibach, E.W.; Mihelj, S.; Oreskes, N.; Schäfer, M.S.; et al. Trust in Scientists and Their Role in Society across 68 Countries. Nat Hum Behav 2025, 9, 713–730. [CrossRef]
- Funk, C.; Heferon, M.; Kennedy, B.; Johnson, C. Trust and Mistrust in Americans’ Views of Scientific Experts; Pew Research Center: USA, 2019; pp. 1–96;.
- About Pew Research Center Available online: https://www.pewresearch.org/about/.
- Douglas, K.M. Are Conspiracy Theories Harmless? Span. J. Psychol. 2021, 24, e13. [CrossRef]
- Yang, Z.; Luo, X.; Jia, H. Is It All a Conspiracy? Conspiracy Theories and People’s Attitude to COVID-19 Vaccination. Vaccines (Basel) 2021, 9, 1051. [CrossRef]
- Biddlestone, M.; Azevedo, F.; Van Der Linden, S. Climate of Conspiracy: A Meta-Analysis of the Consequences of Belief in Conspiracy Theories about Climate Change. Current Opinion in Psychology 2022, 46, 101390. [CrossRef]
- Tam, K.-P.; Chan, H.-W. Conspiracy Theories and Climate Change: A Systematic Review. Journal of Environmental Psychology 2023, 91, 102129. [CrossRef]
- Jolley, D.; Marques, M.D.; Cookson, D. Shining a Spotlight on the Dangerous Consequences of Conspiracy Theories. Current Opinion in Psychology 2022, 47, 101363. [CrossRef]
- Bruder, M.; Haffke, P.; Neave, N.; Nouripanah, N.; Imhoff, R. Measuring Individual Differences in Generic Beliefs in Conspiracy Theories Across Cultures: Conspiracy Mentality Questionnaire. Front. Psychol. 2013, 4, 1–15. [CrossRef]
- Katsiroumpa, A.; Moisoglou, I.; Lamprakopoulou, K.; Galani, O.; Tsiachri, M.; Konstantakopoulou, O.; Galanis, P. Conspiracy Mentality Questionnaire: Translation and Validation in Greek. International Journal of Caring Sciences 2025, Under press.
- Lantian, A.; Muller, D.; Nurra, C.; Douglas, K.M. Measuring Belief in Conspiracy Theories: Validation of a French and English Single-Item Scale. rips 2016, 29, 1. [CrossRef]
- World Medical Association World Medical Association Declaration of Helsinki: Ethical Principles for Medical Research Involving Human Subjects. JAMA 2013, 310, 2191. [CrossRef]
- Scherer, L.D.; Pennycook, G. Who Is Susceptible to Online Health Misinformation? Am J Public Health 2020, 110, S276–S277. [CrossRef]
- World Health Organization Infodemic Management: An Overview of Infodemic Management During COVID-19, January 2020-May 2021; 1st ed.; World Health Organization: Geneva, 2021; ISBN 978-92-4-003596-6.
- Bruns, H.; Dessart, F.J.; Krawczyk, M.; Lewandowsky, S.; Pantazi, M.; Pennycook, G.; Schmid, P.; Smillie, L. Investigating the Role of Source and Source Trust in Prebunks and Debunks of Misinformation in Online Experiments across Four EU Countries. Sci Rep 2024, 14, 20723. [CrossRef]
- Frederick, S. Cognitive Reflection and Decision Making. Journal of Economic Perspectives 2005, 19, 25–42. [CrossRef]
- Feist, G.J. Predicting Interest in and Attitudes toward Science from Personality and Need for Cognition. Personality and Individual Differences 2012, 52, 771–775. [CrossRef]
- Arceneaux, K.; Vander Wielen, R.J. The Effects of Need for Cognition and Need for Affect on Partisan Evaluations. Political Psychology 2013, 34, 23–42. [CrossRef]
- Wu, C.-H.; Parker, S.K.; De Jong, J.P.J. Need for Cognition as an Antecedent of Individual Innovation Behavior. Journal of Management 2014, 40, 1511–1534. [CrossRef]
Figure 1.
Development and validation of the Online Misinformation Susceptibility Scale.
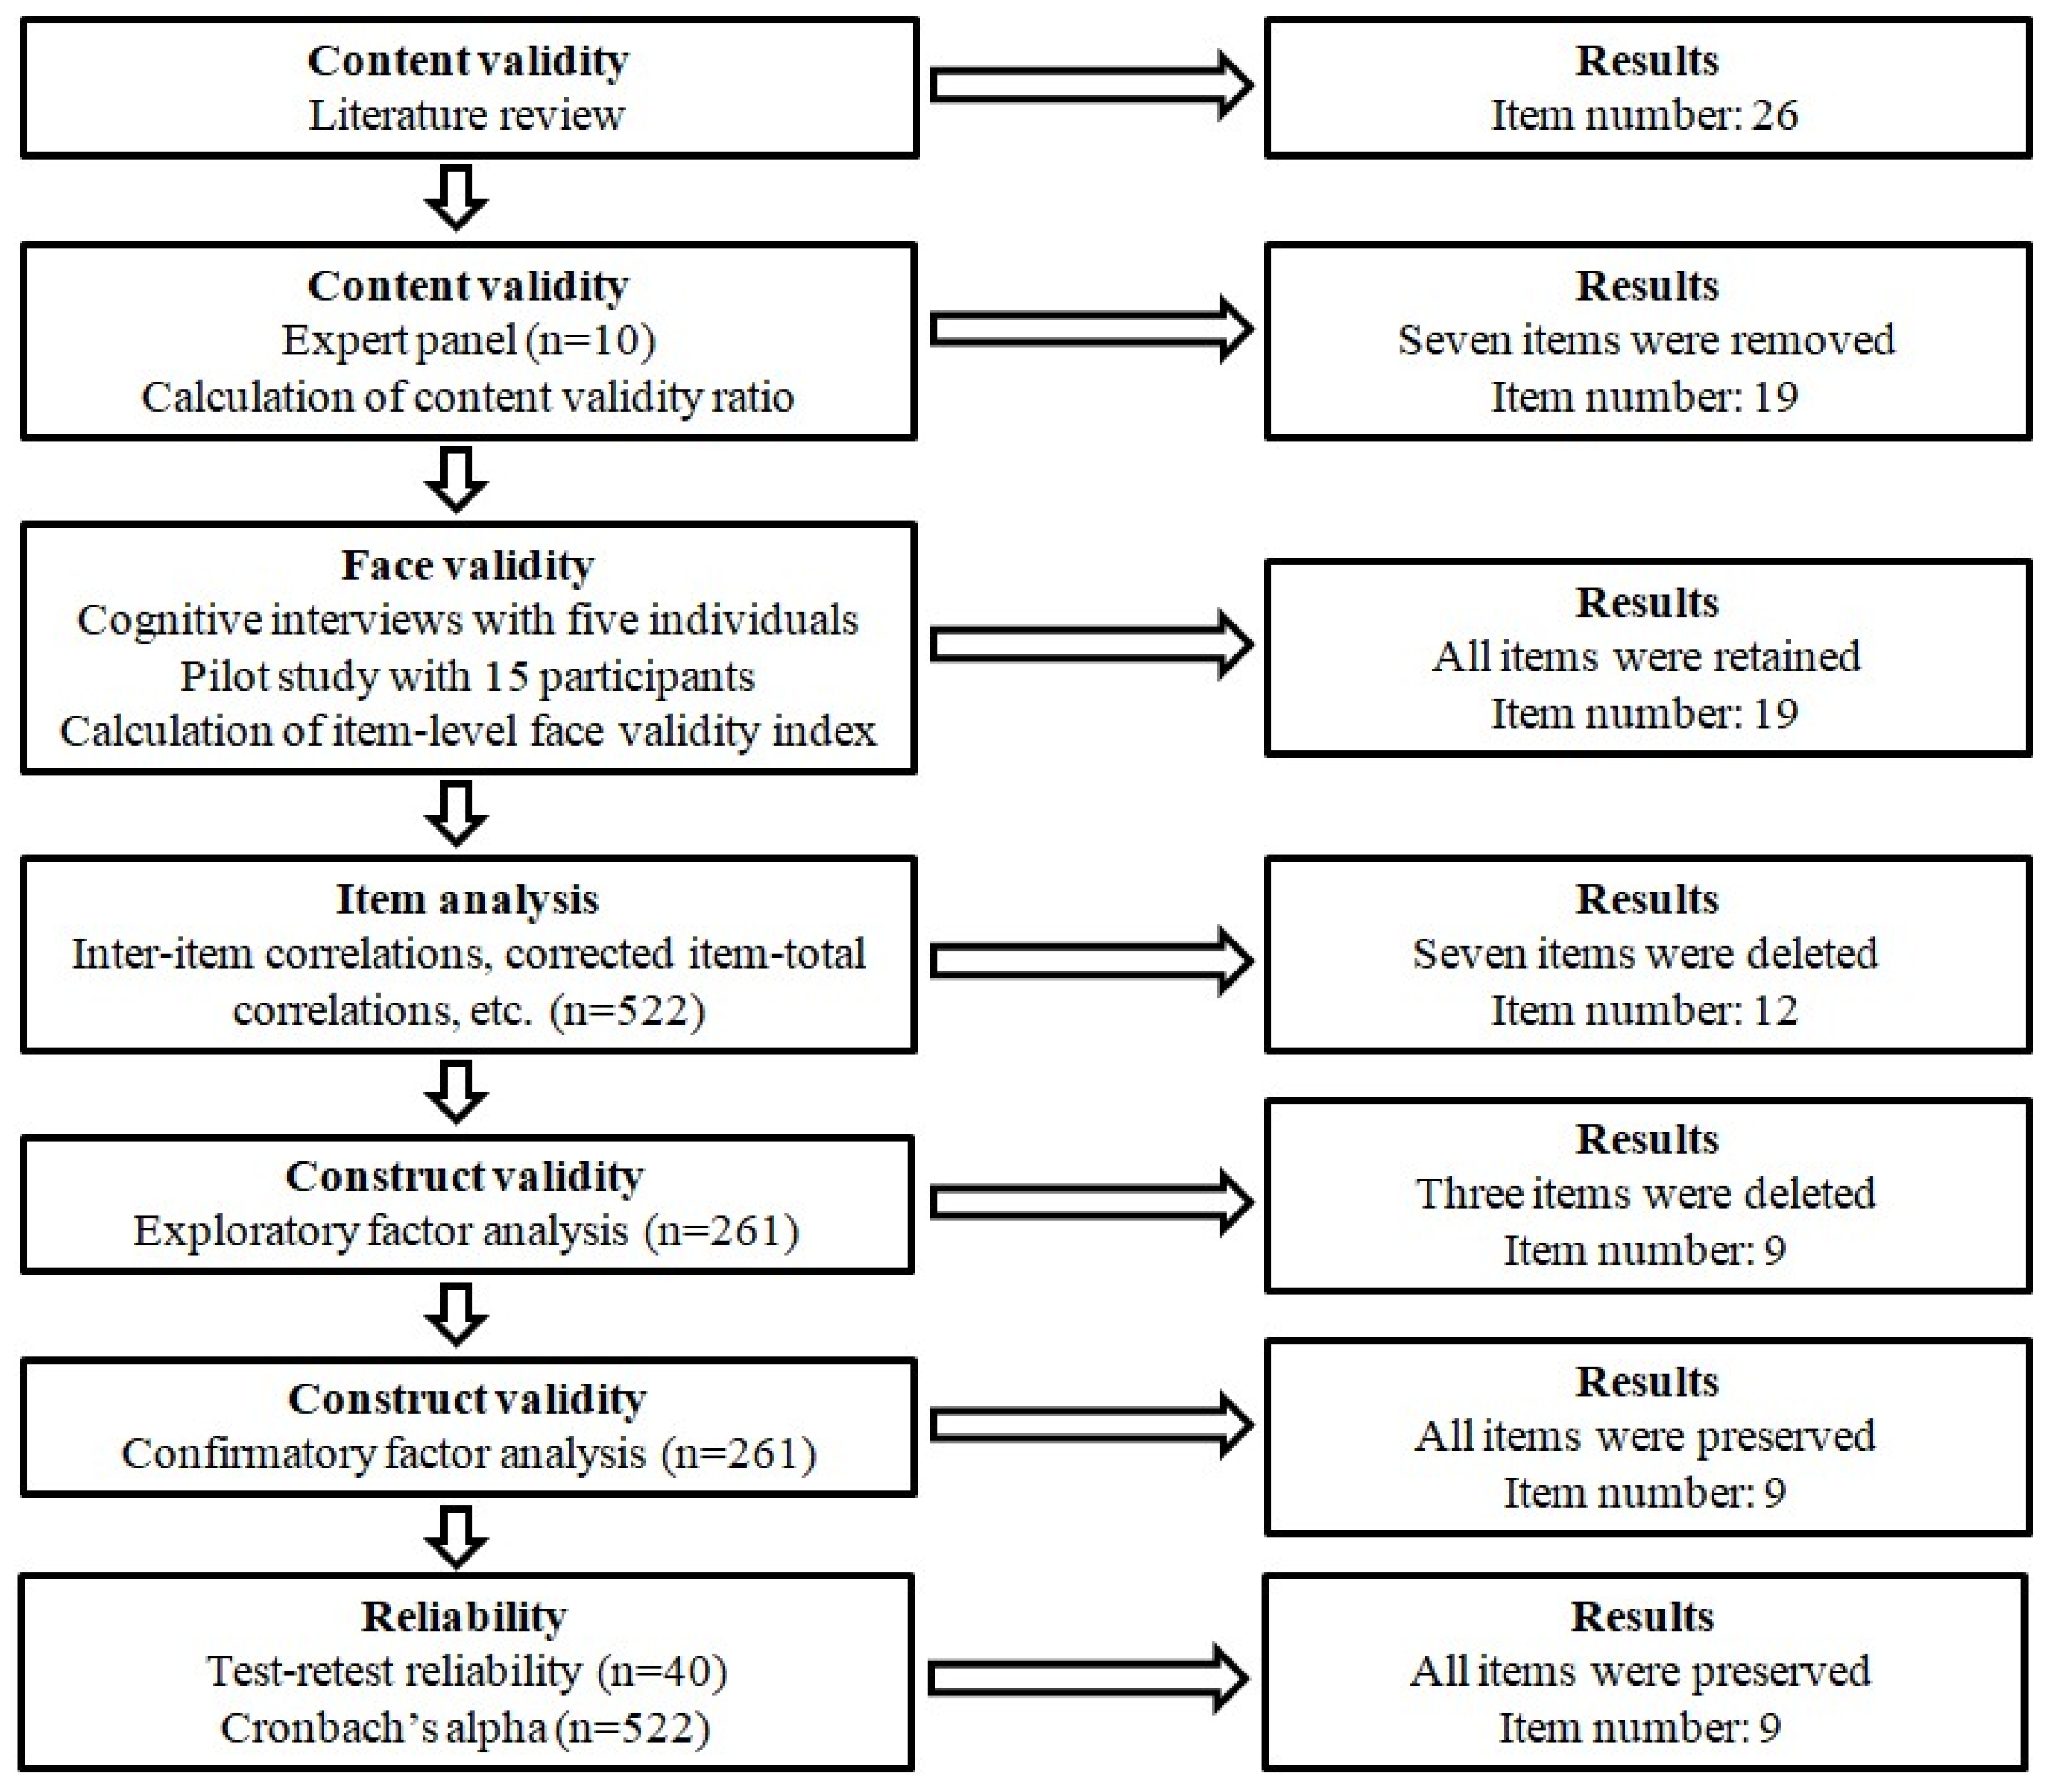
Figure 2.
Confirmatory factor analysis of the Online Misinformation Susceptibility Scale.
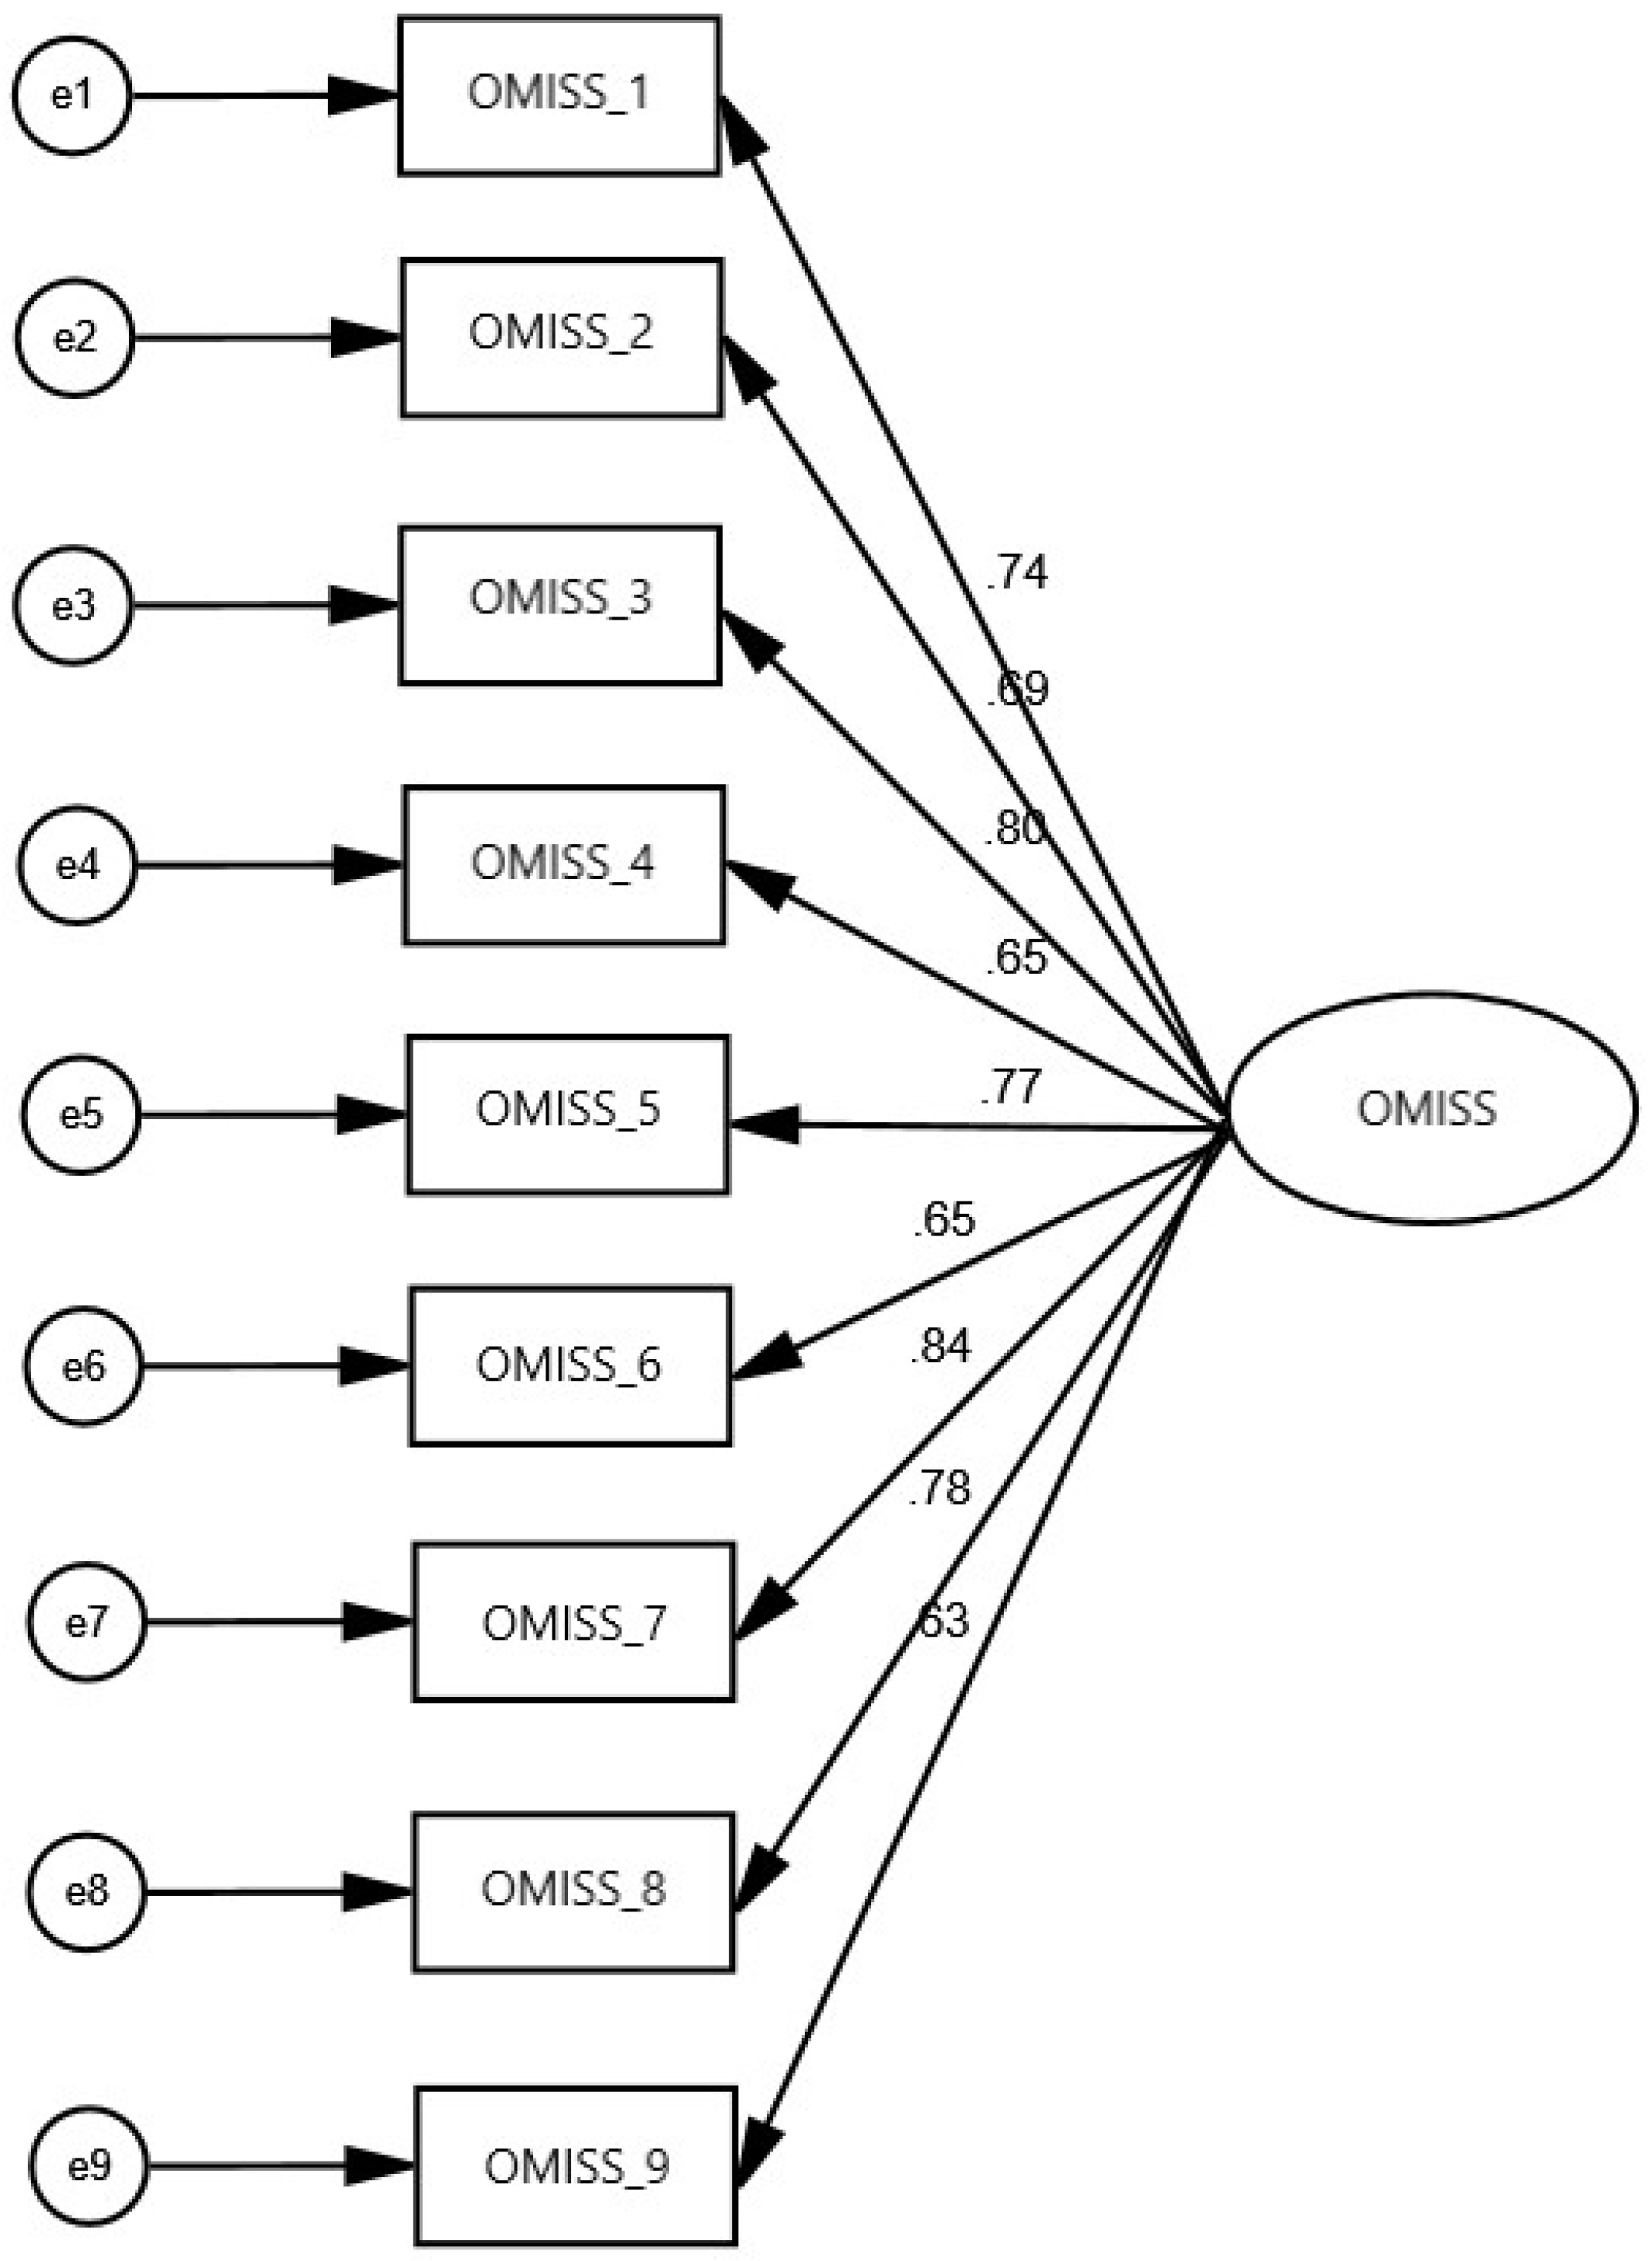

Table 1.
Descriptive statistics, corrected item-total correlations, floor and ceiling effects, skewness, kurtosis, and Cronbach’s alpha (when a single item was deleted) for the 19 items that were produced after the initial development phase of the Online Misinformation Susceptibility Scale (n=522).
Table 1.
Descriptive statistics, corrected item-total correlations, floor and ceiling effects, skewness, kurtosis, and Cronbach’s alpha (when a single item was deleted) for the 19 items that were produced after the initial development phase of the Online Misinformation Susceptibility Scale (n=522).
| Please think about what you do when you see a post or story that interests you on social media or websites. How often do you … |
Mean (standard deviation) | Corrected item-total correlation | Floor effect (%) | Ceiling effect (%) | Skewness | Kurtosis | Cronbach’s alpha if item deleted | Item exclusion or retention |
|---|---|---|---|---|---|---|---|---|
|
2.64 (0.94) | 0.430 | 12.6 | 1.0 | -0.06 | -0.62 | 0.885 | Retained |
|
1.25 (0.67) | 0.245 | 85.1 | 0.6 | 3.01 | 9.36 | 0.889 | Excluded |
|
1.21 (0.58) | 0.226 | 85.4 | 0.2 | 3.17 | 10.82 | 0.890 | Excluded |
|
3.19 (1.34) | 0.665 | 14.9 | 19.7 | -0.23 | -1.12 | 0.877 | Retained |
|
2.69 (1.24) | 0.664 | 21.5 | 8.2 | 0.19 | -0.98 | 0.877 | Retained |
|
1.22 (0.64) | 0.260 | 86.4 | 0.6 | 3.33 | 11.76 | 0.889 | Excluded |
|
2.90 (1.25) | 0.769 | 15.9 | 12.3 | 0.07 | -0.99 | 0.873 | Retained |
|
2.69 (1.30) | 0.640 | 25.3 | 9.8 | 0.17 | -1.09 | 0.878 | Retained |
|
2.93 (1.25) | 0.728 | 15.7 | 11.7 | 0.01 | -1.03 | 0.875 | Retained |
|
3.55 (1.14) | 0.600 | 5.2 | 23.0 | -0.48 | -0.61 | 0.880 | Retained |
|
1.19 (0.56) | 0.234 | 87.7 | 0.2 | 3.43 | 12.52 | 0.889 | Excluded |
|
1.14 (0.45) | 0.234 | 89.5 | 0.0 | 3.50 | 12.75 | 0.889 | Excluded |
|
2.64 (1.15) | 0.433 | 19.2 | 5.6 | 0.19 | -0.79 | 0.886 | Retained |
|
2.62 (1.19) | 0.790 | 20.9 | 6.7 | 0.27 | -0.85 | 0.872 | Retained |
|
2.87 (1.17) | 0.705 | 12.6 | 9.8 | 0.15 | -0.81 | 0.876 | Retained |
|
3.51 (1.23) | 0.590 | 7.1 | 25.9 | -0.43 | -0.83 | 0.880 | Retained |
|
3.41 (1.15) | 0.504 | 5.0 | 20.5 | -0.23 | -0.83 | 0.883 | Retained |
|
1.23 (0.61) | 0.277 | 86.0 | 1.1 | 2.75 | 6.79 | 0.889 | Excluded |
|
1.16 (0.50) | 0.236 | 89.5 | 0.4 | 3.27 | 10.15 | 0.889 | Excluded |
Table 2.
Exploratory factor analysis using oblique rotation (promax method) for the 12 items that were produced after the item analysis for the Online Misinformation Susceptibility Scale (n=261).
Table 2.
Exploratory factor analysis using oblique rotation (promax method) for the 12 items that were produced after the item analysis for the Online Misinformation Susceptibility Scale (n=261).
| Please think about what you do when you see a post or story that interests you on social media or websites. How often do you ... |
One factor | |
|---|---|---|
| Factor loadings | Communalities | |
|
0.513 | 0.264 |
|
0.770 | 0.593 |
|
0.721 | 0.520 |
|
0.801 | 0.642 |
|
0.682 | 0.466 |
|
0.781 | 0.611 |
|
0.692 | 0.479 |
|
0.545 | 0.297 |
|
0.849 | 0.721 |
|
0.799 | 0.638 |
|
0.693 | 0.480 |
|
0.588 | 0.345 |
Table 3.
Exploratory factor analysis using oblique rotation (promax method) for the nine items that were produced after the first exploratory factor analysis for the Online Misinformation Susceptibility Scale (n=261).
Table 3.
Exploratory factor analysis using oblique rotation (promax method) for the nine items that were produced after the first exploratory factor analysis for the Online Misinformation Susceptibility Scale (n=261).
| Please think about what you do when you see a post or story that interests you on social media or websites. How often do you ... |
One factor | |
|---|---|---|
| Factor loadings | Communalities | |
|
0.771 | 0.595 |
|
0.778 | 0.606 |
|
0.887 | 0.770 |
|
0.761 | 0.580 |
|
0.841 | 0.707 |
|
0.748 | 0.559 |
|
0.884 | 0.781 |
|
0.824 | 0.679 |
|
0.724 | 0.524 |
Table 4.
Correlations between the Online Misinformation Susceptibility Scale, and the fake news detection scale, the Trust in Scientists Scale, the single-item trust in scientists scale, the Conspiracy Mentality Questionnaire, and the single-item conspiracy belief scale (n=522).
Table 4.
Correlations between the Online Misinformation Susceptibility Scale, and the fake news detection scale, the Trust in Scientists Scale, the single-item trust in scientists scale, the Conspiracy Mentality Questionnaire, and the single-item conspiracy belief scale (n=522).
| Scale | Online Misinformation Susceptibility Scale | |
|---|---|---|
| Pearson’s correlation coefficient | P-value | |
| Fake news detection scale | -0.135 | 0.002 |
| Trust in Scientists Scale | -0.304 | <0.001 |
| Single-item trust in scientists scale | -0.280 | <0.001 |
| Conspiracy Mentality Questionnaire | 0.159 | <0.001 |
| Single-item conspiracy belief scale | 0.095 | 0.030 |
Disclaimer/Publisher’s Note: The statements, opinions and data contained in all publications are solely those of the individual author(s) and contributor(s) and not of MDPI and/or the editor(s). MDPI and/or the editor(s) disclaim responsibility for any injury to people or property resulting from any ideas, methods, instructions or products referred to in the content. |
© 2025 by the authors. Licensee MDPI, Basel, Switzerland. This article is an open access article distributed under the terms and conditions of the Creative Commons Attribution (CC BY) license (http://creativecommons.org/licenses/by/4.0/).
Copyright: This open access article is published under a Creative Commons CC BY 4.0 license, which permit the free download, distribution, and reuse, provided that the author and preprint are cited in any reuse.


