Submitted:
07 July 2025
Posted:
08 July 2025
You are already at the latest version
Abstract
Blind image quality assessment (BIQA) in the ultra-high-definition (UHD) domain is challenging due to the high dimensionality of UHD images, which exceeds the input capacity of deep networks. Motivated by the visual discrepancies observed between high- and low-quality images after down-sampling and super-resolution (SR) reconstruction, we propose a SUper-Resolved Pseudo References In Dual-branch Embedding (SURPRIDE) framework tailored for UHD image quality prediction. SURPRIDE employs one branch to capture intrinsic quality features from the original patch input and the other to encode comparative perceptual cues from the SR-reconstructed pseudo-reference. The fusion of the complementary representation, guided by a novel hybrid loss function, enhances the network ability to model both absolute and relational quality cues. All key components of the framework are optimized through extensive ablation studies. Experimental results demonstrate that SURPRIDE achieves competitive performance not only on two UHD benchmarks but also on high- and standard-definition datasets, validating its effectiveness across diverse image resolutions. Future work may explore the integration of positional encoding, advanced representation learning, and adaptive dual-/multi-branch fusion strategies to align model predictions with human perceptual judgment in real-world UHD scenarios. The source code is publicly available at https://github.com/LoudLove/SURPRIDE.
Keywords:
blind image quality assessment
; ultra-high-definition image
; super-resolved pseudo reference
; dual-branch embedding
; deep learning
1. Introduction
Blind Image Quality Assessment (BIQA) plays a critical role in a wide range of applications, including device benchmarking and image-driven pattern analysis. Its influence spans multiple domains such as image quality assurance, data compression, signal transmission, media quality of service, user experience evaluation, image enhancement, object recognition, and high-level content understanding [1,2,3]. Unlike full- or reduced-reference methods [4,5,6,7], BIQA aims to estimate perceptual image quality solely based on the distorted image itself, without access to any corresponding reference image or related metadata. This no-reference characteristic makes BIQA especially well-suited for large-scale, real-world deployments in industrial and consumer-level scenarios where reference images are typically unavailable. BIQA is not only foundational for improving automated visual systems but also essential for ensuring quality consistency in the era of ubiquitous imaging.
With the rapid advancement of imaging hardware and the widespread deployment of high-performance chips, ultra-high-definition (UHD) images have become increasingly accessible in everyday life, not only through professional imaging equipment but also via consumer-grade mobile devices. This surge in image resolution presents significant challenges for the BIQA task in the UHD domain. The resolution of realistic images in public BIQA datasets has increased dramatically, from ≈ 500 × 500 pixels in early datasets such as LIVE Challenge (CLIVE) [8] to 3,840 × 2,160 pixels in recent benchmarks [9]. Despite this progress in data availability, effectively handling UHD images in BIQA remains an open and unresolved problem, due to the high computational cost, increased visual complexity, and scale sensitivity of existing models.
To address these challenges of BIQA in the UHD domain, several kinds of existing approaches offer valuable insights into modeling perceptual quality under high-resolution conditions. These methods could be broadly categorized based on their methodological foundations, architectural designs, and feature extraction strategies.
- Handcrafted feature-based methods. An input image can be quantified by a compact feature vector, which serves as the input to a regression model for quality score prediction. For example, Chen . extract handcrafted features by computing maximum gradient variations and local entropy across multiple image channels, which are then combined to assess image sharpness [10]. Yu . treat the outputs of multiple indicators as mid-level features and explore various regression models for predicting perceptual quality [11]. Wu . extract multi-stage semantic features from a pre-trained deep network and refine them using a multi-level channel attention module to improve prediction accuracy [12]. Similarly, Chen and Yu utilize a pre-trained deep network as a fixed feature extractor and evaluate a range of regression models on the BIQA task [13]. These feature-based approaches [10,11,12,13,14] are computationally efficient and can compress an UHD image into a low-dimensional representation, enabling fast quality prediction. However, their reliance on handcrafted or shallow features often limits their representational capacity, making it challenging to capture the rich visual structures and complex distortions present in UHD images.
- Patch-based deep learning methods. Many deep learning-based approaches adopt a patch-based strategy, where numerous sub-regions (patches) are sampled from an input image and fed into a neural network. The image quality score is then predicted through an end-to-end learning process that jointly optimizes hierarchical feature representations and network parameters. For instance, Yu . develop a shallow convolutional neural network (CNN), where randomly cropped patches from each image are used to train the network by minimizing a cost function with respect to the corresponding global image quality score [15,16]. Bianco . explore the use of features extracted from pre-trained networks, as well as fine-tuning strategies tailored for the BIQA task, and the final image quality score is obtained by average-pooling the predicted scores across multiple patches [17]. Ma . propose a multi-task, end-to-end framework that simultaneously predicts distortion types and image quality using two sub-networks [18]. Su . introduce a hyper-network architecture that divides the BIQA process into three stages, content understanding, perception rule learning, and self-adaptive score regression [19]. While these patch-based methods [15,16,17,18,19] offer an effective means to learn visual features in a data-efficient manner, they typically assign the same global quality score to all patches regardless of local variation. This simplification overlooks the spatial heterogeneity and region-specific distortions that are especially pronounced in UHD images.
- Transformer-based methods. To fully exploit image content and mitigate the negative effects of cropping or resizing, BIQA based on Transformer and their variants has been proposed [20,21,22]. These models leverage the strength of self-attention mechanisms to capture both global and local dependencies, which is especially important for handling the complex structures in high-resolution images. For instance, Ke . introduce a multi-scale image quality Transformer, which takes full-resolution images as input. The model represents image quality at multiple granularities with varying sizes and aspect ratios, and incorporates a hash-based spatial and scale-aware embedding to support positional encoding in the multi-scale representation [23]. Qin . fine-tune a pre-trained vision backbone and introduce a Transformer decoder to extract quality-aware features. They further propose an attention panel that enhances performance and reduces prediction uncertainty [24]. Yang . design a model that uses image patches for feature extraction, applies channel-wise self-attention, and incorporates a scale factor to model the interaction between global context and local details. The final quality score is computed as a weighted aggregation of patch-level scores [25]. Pan . design a semantic attention module for refining quality perceptual features and introduce a perceptual rule learning module tailed to image content, leveraging image semantics into the BIQA process [26]. Despite their superior performance, these Transformer-based models [23,24,25,26] often require substantial computational resources for training and fine-tuning. This high computational cost poses a barrier to their widespread application, particularly in real-time or resource-constrained environments.
- Large multi-modal model-based methods. Large multi-modal models (LMMMs) offer promising opportunities for advancing BIQA by integrating both visual and textual information for rich image quality representation. By leveraging language understanding alongside visual perception, these models can incorporate subjective reasoning, descriptive feedback, and contextual knowledge into the assessment process. For example, You . construct a multi-functional BIQA framework that includes both subjective scoring and comparison tasks. They develop a LMMM capable of interpreting user-provided explanations and reasoning to inform the final quality predictions [27]. Zhu . train a LMMM across diverse datasets to enable it to compare the perceptual quality of multiple anchor images. The final quality scores are derived via maximum a posteriori estimation from a predicted comparison probability matrix [28]. Chen . further extend the capabilities of LMMMs by incorporating detailed visual quality analysis from multiple modalities, including the image itself, quality-related textual descriptions, and distortion segmentation. They utilize multi-scale feature learning to support image quality answering and region-specific distortion detection via text prompts [29]. Kwon . generate a large number of attribute-aware pseudo-labels by using LMMM and allow to learn rich representative attributes of image quality by fine-tuning on large image datasets, and these quality-related knowledge enables several applications in real-world scenarios [30]. While these LMMM-based frameworks significantly enhance the flexibility and interpretability of BIQA systems, they come with substantial costs. Training such models requires massive amounts of annotated image-text data and high-performance computational resources [27,28,29,30]. In addition, the inference time of LMMMs is often longer compared to conventional deep learning models, which limits their practical deployment in real-time or resource-constrained scenarios.
To the best of our knowledge, a limited number of studies have attempted to address the challenges of handling UHD images in the BIQA task. These pioneering efforts have explored various strategies to adapt deep learning models for the high computational and perceptual complexity of UHD content. Huang . propose a patch-based deep network that integrates ResNet [31], Vision Transformer (ViT) [21], and recurrent neural network (RNN) [32] to benchmark their curated high-resolution image database [33]. This hybrid architecture is designed to combine spatial feature extraction, global context modeling, and sequential processing. Sun . develop a multi-branch framework that leverages a pre-trained backbone to extract features corresponding to global aesthetic attributes, local technical distortions, and salient content. These diverse feature representations are fused and regressed into final quality scores, enabling the model to account for multiple dimensions of perceptual quality in UHD images [34]. Tan . explore Swin Transformer [22] to process full-resolution images efficiently. Their approach mimics human visual perception by assigning adaptive weights to different sub-regions and incorporates fine-grained frequency-domain information to enhance prediction accuracy [35]. Collectively, these studies mark significant progress in extending BIQA methods to UHD content. However, the approaches in [33,34,35] rely on complex multi-branch architectures and Transformer-based pyramid perception mechanisms, which demand substantial computational resources and incur high processing times. These limitations hinder their scalability and practicality in real-world UHD applications.
In this study, we propose a novel framework, SUper-resolved Pseudo References In Dual-branch Embedding (SURPRIDE), to address the challenges of BIQA in the UHD domain. The core idea is to leverage super-resolution (SR) as a lightweight and deterministic transformation to generate pseudo-reference from the distorted input. Although SR is not intended to restore ground-truth quality, it introduces structured and distortions that provide informative visual contrasts. Further, by pairing each distorted image with its corresponding SR version, we construct a dual-branch network architecture that simultaneously learns intrinsic quality representations from the original input and comparative quality cues from the pseudo-reference. This design enables the model to better capture fine-grained differences that are especially critical in UHD images.
The main contributions of this work are summarized as follows,
- A novel BIQA framework, namely SUper-resolved Pseudo References In Dual-branch Embedding (SURPRIDE), is proposed, that leverages SR reconstruction as a self-supervised transformation to generate external quality representations.
- A dual-branch network with a hybrid loss function is implemented. It jointly models intrinsic quality features from the distorted image and comparative cues from the generated pseudo-reference. The hybrid loss function combines the cosine similarity and mean squared error (MSE), allowing to learn from both absolute quality indicators and relational differences between the input patch pairs.
- Comprehensive experiments are conducted on multiple BIQA benchmarks, including UHD, high-definition (HD), and standard-definition (SD) image datasets. The results demonstrate that SURPRIDE achieves superior or competitive performance compared to state-of-the-art (SOTA) works.
The structure of this paper is organized as follows. Section 2 details the proposed SURPRIDE framework, including the motivation behind the dual-branch architecture and descriptions of its core components, patch preparation, the dual-branch network design, and the proposed hybrid loss function. Section 3 outlines the experimental setup, including the datasets used, baseline BIQA models for comparison, implementation details, and the evaluation protocol. Section 4 presents a comprehensive analysis of the experimental results across UHD, HD, and SD image databases, along with supporting ablation studies on the UHD-IQA database [9]. Section 5 discusses the key findings, practical implications, and current limitations of the proposed SURPRIDE framework. Finally, Section 6 summarizes the study and highlights potential directions for future research in BIQA for UHD imagery.
2. The Proposed SURPRIDE Framework
2.1. One Phenomenon Observed in Image Quality Degradation
Figure 1 illustrates two images before and after SR reconstruction. The image on the left has a subjective mean opinion score (MOS) of 3.92, indicating high perceived visual quality, while the image on the right has a MOS of 1.50, reflecting significantly lower quality. In this example, each original image is first down-sampled to one-quarter of its original resolution, and then a SR algorithm is employed to upscale the low-resolution version by a factor of four. The original image and its SR-reconstructed one are shown side by side for visual perception and comparison.
A notable phenomenon observed in Figure 1 is that, a higher-quality image tends to exhibit more visible degradation after SR reconstruction. These degradations manifest in altered colors, distorted shapes, and loss of structural details. In contrast, lower-quality images undergo comparatively minor perceptual changes when reconstructed, making them visually more consistent with their original versions. This observation suggests that SR reconstruction can serve as a meaningful auxiliary signal, as they introduce distortion patterns that align well with human visual sensitivity to quality differences.
This phenomenon is closely related to the concept of just noticeable difference [36], which describes the smallest perceptible change that can be detected by the human visual system. In the context of image processing, the concept typically refers to the minimum level of distortion or variation, such as changes in brightness, color, or texture, that a viewer can perceive. By identifying the threshold at which visual differences become noticeable, it serves as a perceptual boundary for distinguishing between imperceptible and perceivable distortions. This concept has been widely applied in image quality assessment and content analysis to develop perceptually driven models and metrics [37,38,39].
Inspired by this insight, we propose leveraging both the original distorted image and its SR reconstructed image within a dual-branch architecture. This design enables the model to simultaneously capture intrinsic quality characteristics from the input image and extract comparative perceptual cues from the reconstructed image, thereby enhancing the overall performance of BIQA in the UHD domain.
2.2. The Proposed Framework
Figure 2 illustrates the proposed dual-branch framework, SURPRIDE, designed for BIQA in the UHD domain. The framework comprises three main components: patch preparation, feature manipulation, and score prediction. Specifically, in the dual-branch structure, one branch processes the original distorted image, while the other processes its SR reconstruction. For each branch, a fixed segment (or patch) is passed through a visual foundation model (VFM) to extract high-level representations. This results in two feature vectors, from the original image and from the SR-reconstructed image. These two vectors are then weighted and concatenated to form a comprehensive feature embedding that captures both intrinsic and comparative quality cues. Finally, the concatenated feature vector is passed through a simple two-layer full connection (FC) network to predict the final image quality score. This architecture is lightweight yet effective, enabling the model to leverage both content and restoration differences for improved quality estimation.
2.2.1. Patch Preparation
The patch-based sampling is effective in preserving spatial relationship and texture structures in images [9,34]. Inspired by these approaches, a fixed-position patch-based reassembly method is employed. For instance, it can yield a segment with size [384, 384] from a successive patches with typical size [16, 16]. As shown in Figure 3, an adaptive fixed-position patch segmentation strategy is designed which extracts patches uniformly along the horizontal and vertical directions of the images. These patches are reassembled into a square image while preserving their spatial relationships, ensuring that both the original and super-resolved images undergo the same patch segmentation process. This consistency preserves meaningful comparative information and enhances the model’s ability to capture fine-grained local details. Notably, this kind of patch segment could be extracted many times randomly or strategically.
To improve the receptive field of the network, a two-stage sampling strategy is used. In other words, the image is sampled twice at different locations, generating two pairs of patches. One is , and the other is , The presence of an apostrophe (’) indicates the SR reconstructed image, while its absence refers to the original image. In a single training loop, these two pairs of images flow sequentially through the network, yielding model outputs two times. The final model output is the average of these two outputs.
2.3. A Dual-Branch Network Architecture
The dual-branch network architecture consists of a branch that receives the original image patch as input, and a branch that receives the SR reconstructed image patch as input. This proposal is distinctive to those models that exclusively employ VFM backbones as the backbone, circumventing the extraction of intermediate feature layers and the addition of various specialized modules to alter the model architecture. This methodology fully capitalizes on the inherent capabilities of the VFM backbone, ensuring computational efficiency and ease of reproducibility, while avoiding the complexity and potential over-engineering associated with extensive architectural modifications. By preserving the integrity of the VFM backbone’s original structure, we anticipate that the model’s performance will naturally advance in tandem with the evolution of the VFM backbone.
Specifically, for the original image patch , it is firstly resized to the specified size to obtain by using Bi-cubic interpolation. Next, is magnified by a SR reconstruction technique at the specified scaling factor, and the resulting image is denoted as . Eq. 1 shows the entire process.
Then, the fixed segments, and , are fed into its sequential VFM, generating two feature vectors, and , correspondingly. After that, features are weighted and concated to generate a longer feature vector, , as shown in Eq. 2, where is the weighting parameter.
Finally, a two FC layer MLP network is designed to regress the feature to get a predicted image quality score, .
2.4. The Proposed Hybrid Loss Function
The MSE is commonly used as a loss function to minimize the difference between the predicted quality score and the subjective ground truth score in IQA regression tasks. When using m segments for model optimization, the MSE loss function can be formulated as in Eq. 3 where j stands for the segment from the j-th image.
As shown in Figure 1, a higher-quality image tends to exhibit more visible degradation after SR reconstruction. Therefore, we introduce another loss function that measures the dissimilarity between the i-th features from the original branch () and the SR branch () by using the cosine similarity. Eq. 4 shows the loss function in which stands for the vector similarity measure by using the cosine function.
Subsequently, the hybrid loss function is defined as the weighting of and as shown in Eq. 5,
where is a weighting parameter to well balance the two loss functions. Therefore, a hybrid loss function concerning both prediction difference and feature dissimilarity is proposed for BIQA in the UHD domain.
3. Materials and methods
3.1. Databases
Six databases with authentic distortions are analyzed which encompass a wide range of contents, distortions, and imaging devices. Image resolution ranges from SD of CLIVE [8] and BIQ2021 [40], to HD of CID [41] and KonIQ-10k [42], and to UHD of HRIQ [33] and UHD-IQA [9]. Due to the requirement of input sizes for sequential analysis, the images are resized to specific resolutions using B-cubic interpolation. The database configurations are summarized in Table 1.
3.2. Involved BIQA Models
On the databases, the proposed SURPRIDE method is evaluated and compared to those SOTA works. On the HRIQ [33] and BIQ [40] datasets, the best-performing methods are summarized. On the UHD-IQA dataset [9], the top-ranking teams in the AIM 2024 challenge [43] are presented. On the CID dataset [41], the works include MetaIQA [44], DACNN [45], GCN-IQD [46], and MFFNet [47]. On the KonIQ-10k [42] and CLIVE [8] datasets, the methods are HyperIQA [19], ReIQA [48], TReS [49], QCN [50], ATTIQA [30], GMC-IQA [51], Prompt-IQA [52], and SGIQA [26].
3.3. Experimental Design
The proposed framework consists of two branches. Firstly, the VFMs of the branches are explored to use the pre-trained models, including the DeiT model [53] and the ConvNeXt model [54]. Then, the input image sizes of 384 × 384 as well as 224 × 224 are evaluated. Thirdly, to the SR method, SwinFIR [55] and HAT [56] are considered, and the scaling factors cover × 2, × 3, and × 4 for comparison. Meanwhile, the patch sizes of 8 × 8, 16 × 16, and 32 × 32 are tested. Finally, the parameters of and are determined by grid searching ( and ).
The key parameters of the framework are set as follows. The batch size is set 4, the AdamW optimizer [57] is used with a learning rate of 10−4 and a weight decay of 10−5, and a number of 15 epochs are considered. The best-performing model on the validation set is saved for testing. The experiments are conducted on a 3090 GPU with 24 GB of VRAM.
In each experiment, the BIQA performance is evaluated by using Pearson’s Linear Correlation Coefficient (PLCC) and Spearman Rank-order Correlation Coefficient (SRCC) for identifying the best-performing models.
4. Results
This section presents the BIQA performance of SOTA methods and the proposed SURPRIDE algorithm across several public databases. Given the diversity of these databases, a wide range of SOTA methods are selected for comprehensive comparison. Notably, to each database, the highest metric values are underlined.
4.1. Performance on the UHD-IQA Image Database
Table 2 presents the top-performing results from participant teams in the AIM 2024 Challenge [43] on the UHD-IQA database [9]. Using the officially fixed subsets, the proposed SURPRIDE algorithm demonstrates competitive performance that achieves a PLCC of 0.7755 and SRCC of 0.8133 on the testing set, and a PLCC of 0.7983 and SRCC of 0.7930 on the validation set. It can rank top five among the achievements on the UHD-IQA database, which is slightly inferior to the top-ranking models. Notably, as the team SJTU designs three branches of feature extraction for image quality rating [34], and in each branch, Swin Transformer [22] pre-trained on a large-scale aesthetic image dataset [58] performs as the backbone for quality representation. Because of high-computational backbones and massive fine-tuning, the model cost massive time and computing resources, even if the top performance is achieved.
Figure 4 illustrates the relationship between the predicted scores and subjective MOS values on the UHD-IQA officially fixed testing split. Each plot includes a quadratic polynomial fit with a gray confidence band, and a yellow-highlighted region via the Gaussian kernel density estimation. It is observed that the proposed SURPRIDE model, as shown in Figure 4(a), achieves a good correlation comparable to that of the top-performing UIQA model [34], as shown in Figure 4(b).
4.2. Ablation Studies on the UHD-IQA Image Database
On the UHD-IQA database, the ablation studies examine the effects of various factors in the proposed SURPRIDE framework on BIQA performance, including different SR methods, scaling factors, parameter configurations ( and ), patch sizes, dual-branch network settings, input image sizes, and loss functions.
4.2.1. Setting of the Dual-Branch Networks
Both ViT and CNN architectures are explored as the candidate VFM backbones [21,31]. For the ViT-based approach, DeiT [53] is employed, which produces a 768-dimensional (d) feature vector1. For the CNN-based approach, ConvNeXt [54] is used, generating a 1024-d output2. To ensure compatibility between different backbone outputs, the 768-d feature from DeiT is passed through a fully connected layer to project it into a 1024-d space, matching the output of ConvNeXt. When both branches use DeiT, their outputs naturally have the same dimensionality, and no additional FC layers are needed. On the UHD-IQA dataset, the backbone networks of the dual-branch framework are determined by comparing the different combinations of DeiT [53] and ConvNeXt [54].
As shown in Table 3, the BIQA performance reaches the highest values when both the original and the SR branch use ConvNeXt [54]. When ConvNeXt performs as the original branch, its prediction results are much higher than that using DeiT as the original branch. Therefore, the dual branches, i.e., the original branch and the SR branch, are settled with the pre-trained ConvNeXt [54] in this study.
4.2.2. Determination of the Input Image Sizes
Table 4 summarizes the performance of the VFMs both using the ConvNeXt model at two different input resolutions (224 × 224 and 384 × 384) on the UHD-IQA dataset. It is found that increasing the resolution from 224 × 224 to 384 × 384 results in a noticeable improvement in both PLCC (+2.45%) and SRCC (+2.86%). It suggests that higher resolution inputs enable ConvNeXt to capture more detailed information for better performance.
4.2.3. Effect of SR Methods and Scaling Factors
Different SR reconstruction methods and scaling factors are investigated on the UHD-IQA dataset. The SR methods include SwinFIR [55] and HAT [56], and the scaling factors are considered as × 2 and × 4, and the BIQA results are shown in Table 5.
The proposed SURPRIDE framework demonstrates stable performance across different SR methods and scaling factors. Overall, both SR methods tend to perform best with a scaling factor of × 4 on the UHD-IQA dataset, and the difference of metric values is small. To balance BIQA performance, inference time, and computational cost, SwinFIR and a scaling factor of × 4 are selected as the final setting due to its favorable overall performance and limited computational request.
4.2.4. Optimization of Parameter and Configurations
Optimization of parameters and are configured by grid searching, and corresponding BIQA results are shown in Table 6. Generally, the proposed SURPRIDE framework achieves PLCC/SRCC values with minimal fluctuation when the parameters change. The best result is obtained when and , and the PLCC value is 0.784 and the SRCC value is 0.819, both of which are slightly higher than those of other pairs of parameters.
4.2.5. Effect of the Basic Patch Sizes
Table 7 shows the effect of patch sizes for the fixed input segments sized [384, 384]. On the UHD-IQA database, it is found that increasing patch sizes slightly improves the PLCC and SRCC values, and the patch size of 16 × 16 can well balance local texture embedding and prediction performance.
4.2.6. Effect of the SR Branch
The SURPRIDE framework consists of dual branches and both branches use the ConvNeXt model as the backbone. Table 8 shows the BIQA performance with regard to input image sizes and with (w) or without (w/o) the SR branch on three databases.
Several findings are observed. First, when improving the image resolution from 224 × 224 to 384 × 384, the metric values are correspondingly increased, with or without the SR branch. Second, when using an image segment sized 384 × 384 as input, an additional branch further improve the BIQA performance on the three databases. Specifically, the dual-branch network with higher input resolution leads to better BIQA performance.
4.2.7. Effect of the Loss Function
The effect of the loss function is investigated on the BIQA performance by using different input image sizes. The results are shown in Table 9. It is observed that, additionally using the loss function corresponds to the increase of metric values regardless of input image sizes except for the KonIQ-10k database. Meanwhile, increasing input image sizes from 224 × 224 to 384 × 384 positively improves the metric values, and ≈ 0.02 value increase is observed on the databases.
4.3. Performance on Several other Image Databases
The proposed dual-branch network, SURPRIDE, is further evaluated on one additional UHD image database (HRIQ [33]), two HD image databases (CID [41] and KonIQ-10k [42] ), and two SD image databases (CLIVE [8] and BIQ2021 [40]). The performance of corresponding SOTA models are also introduced.
4.3.1. Results on Another UHD Image Database
As shown in Table 10, SURPRIDE is slightly below the top-performing algorithm HR-BIQA [33], with 0.041 lower PLCC and 0.047 lower SRCC values, while it is better than the other three SOTA methods.
Interestingly, HR-IQA [33] consists of two streams for the original and down-sampled resolution, patch-based feature extraction, and spatial pooling and score regression. The two streams are the pre-trained ResNet50 [31] fine-tuned for image quality representation and the ViT model [21] used for semantic content embedding, and RNN [32] is modified for score prediction.
4.3.2. Results on two HD Image Database
Performance on the CID Database. As shown in Table 11, SURPRIDE is the best, followed by several strong baselines, including MFFNet [47], GCN-IQD [46], and DACNN [45]. It establishes a new benchmark on this dataset by achieving the highest values in both PLCC and SRCC, indicating superior consistency with human perceptual judgments.
Notably, MFFNet [47] employs a dual-branch multi-layer feature fusion architecture, where the primary branch is responsible for extracting and integrating fine-grained semantic features, while the secondary sub-branch focuses on capturing local visual cues at the super-pixel level.
Performance on the KonIQ-10k dataset. As shown in Table 12, SURPRIDE achieves comparable performance to the ATTIQA model [30], and outperforms several other prominent BIQA methods, including HyperIQA [19], TReS [49], and ReIQA [48].
Notably, ATTIQA [30] leverages a vision-language pre-trained large model and selectively extracts quality-relevant features using attention-based mechanisms. In addition, carefully crafted text prompts are incorporated to guide the network in focusing on key perceptual attributes associated with image quality.
4.3.3. Results on Two SD Image Database
Performance on the CLIVE dataset. As shown in Table 13, SURPRIDE demonstrates competitive performance compared to several SOTA works, including Prompt-IQA [52], GMC-IQA [51], ATTIQA [30], and SGIQA [26], with minor differences in evaluation metrics. At the same time, SURPRIDE consistently outperforms other methods such as HyperIQA [19], TReS [49], and ReIQA [48].
In particular, Prompt-IQA [52] benefits from being trained on a combination of multiple databases with extensive data augmentation, enabling rapid generalization to new datasets without the need for fine-tuning. Moreover, it employs image-score pairings that are tailored for the specific characteristics of the target datasets.
Performance on the BIQ2021 dataset. As shown in Table 14, SURPRIDE achieves the highest SRCC of 0.895, outperforming the second-best model, IQA-NRTL [60], by a margin of 0.045. While its PLCC is slightly lower than that of the top-performing method, SURPRIDE shows consistent overall performance across the metrics.
It is worth noting that IQA-NRTL [60] captures multi-scale semantic features to model complex perceptual quality, and these features are adaptively fused and regressed to generate final image quality scores.
5. Discussion
BIQA in the UHD domain remains challenging. Most existing BIQA approaches rely on handcrafted features [10,11,12,13,14], patch-based learning [15,16,17,18,19,51], self-attention mechanisms [23,24,25,26,49], or multi-modal large-model representations [27,28,29,30]. A limited number of models have been specifically tailored for UHD images [33,34,35], and these typically involve complex architectures and computationally intensive modules such as Transformers [20,21,22,26]. While effective, such designs are often impractical for real-world deployment due to their high resource requirements and limited scalability. To address these limitations, we propose a lightweight dual-branch framework, SURPRIDE, to represent image quality by learning from both the original input and a super-resolved pseudo-reference. Specifically, ConvNeXt [54] is employed as the VFM for efficient feature extraction, and SwinFIR [55] is used for fast SR reconstruction. Inspired by the visual differences observed between high- and low-quality images after down-sampling and SR reconstruction, a hybrid loss function is introduced that balances prediction accuracy with feature similarity. This design enables the network to effectively learn both absolute and comparative quality cues.
The SURPRIDE framework demonstrates top-tier BIQA performance on the UHD-IQA (Table 2, Figure 4) and HR-IQA (Table 10) databases, both of which contain authentic UHD images. The effectiveness of the proposed method can be attributed to several key factors. First, the use of ConvNeXt [54] as the VFM backbone in both branches allows for the extraction of intrinsic characteristics from the original input and comparative embeddings from the SR-reconstructed patch (Table 3). While the primary branch plays the dominant role in BIQA performance, the SR branch provides valuable complementary information, leading to further improvements (Table 8). Motivated by the observed phenomenon that higher-quality images often exhibit more noticeable degradation after SR reconstruction (Figure 1), the features from both branches are weighted and concatenated to form a more robust representation for quality prediction. Second, critical parameters, including input image size, patch size, SR method, and scaling factor, are systematically optimized through extensive ablation studies (Table 4, Table 5, Table 6, Table 7 and Table 8). These settings enable the framework to achieve optimal performance, with additional applications across HD and SD databases. Third, the proposed hybrid loss function encourages the learning of comparative embeddings by leveraging differences introduced through SR reconstruction. This loss formulation enhances the network’s ability to model perceptual quality more accurately (Table 6 and Table 9). In summary, SURPRIDE combines a lightweight architecture with strategically tuned components and loss design to deliver superior or competitive results on UHD image databases, while remaining efficient and scalable for real-world deployment.
The proposed SURPRIDE framework demonstrates strong performance not only on UHD image databases (Table 2, Table 10), but also on HD (Table 11, Table 12) and SD (Table 13, Table 14) image databases. Falling under the category of patch-based deep learning methods, SURPRIDE randomly samples patches from the original images and reconstructs corresponding SR patches [55]. These pairs of patches are used to extract deep representative features, which are weighted and concatenated for robust quality representation and score prediction. Unlike earlier approaches that use small patches of size 16×16 or 32×32 [15,16,60], SURPRIDE adopts a much larger patch size of 384×384 (Table 4), which better captures contextual and structural information. Prior studies suggest that larger patch sizes contribute positively to performance in BIQA tasks [17,34,46,50,51]. Notably, SURPRIDE avoids reliance on high-computation modules or complex attention-based mechanisms. Its use of ConvNeXt [54] as the feature extraction backbone proves effective across a wide range of image resolutions. The success of SURPRIDE across databases with varying resolutions (Table 4) could be attributed to several key factors. (a) Large patch sizes (384×384 or 224×224) retain sufficient local information while also capturing broader spatial context. These patches represent meaningful regions of the image, enabling the model to learn fine-grained distortion patterns that are often consistent within high-resolution content [50,59]. (b) Training with multiple patches per image increases data diversity and supports better generalization [48,51,59,60]. By sampling image patches either randomly or strategically, the model is exposed to a diverse range of distortions and scene content, helping to compensate for the unavailability of full-resolution images during training. (c) Patch-level features tend to be scale-invariant, allowing models trained on high-resolution patches to generalize well across different image sizes [48,51,59]. Local distortions in UHD images often exhibit characteristics similar to those in HD or SD images. (d) Moreover, processing entire UHD images directly is computationally prohibitive in terms of memory and training time. Patch-based learning provides a practical alternative, enabling the reuse of deep networks [20,21,22,30,31,46,51,54] without compromising batch size or training stability. In conclusion, patch-based learning strategies remain highly effective for BIQA in the UHD domain, offering a favorable balance between computational efficiency and model accuracy.
Dual- and multi-branch network architectures have become increasingly prominent in advancing BIQA tasks [33,34,35,46,47]. This trend reflects the growing demand for richer and more nuanced modeling of perceptual image quality that single-branch models often struggle to achieve effectively. First, these architectures enable the separation and specialization of complementary information [46,48,59,60]. Dual-branch networks typically extract different feature types, such as global semantics (or quality-aware encoding) in one branch and local distortions (or content-aware encoding) in the other. Multi-branch networks may explicitly model multiple perceptual dimensions, including aesthetic quality, data fidelity, object saliency, and content structure. This separation facilitates better feature disentanglement, allowing the network to handle the complex, multidimensional characteristics of human visual perception effectively [46,48]. Second, robustness and adaptability across distortion types are enhanced. Real-world images often exhibit mixed or unknown distortion types, and no single representation is sufficient to capture all relevant quality variations [51,58]. Branching allows each sub-network to specialize in detecting specific distortions or perceptual cues, leading to improved generalization and performance across diverse scenarios. Third, dual- and multi-branch architectures provide flexibility for adaptive fusion [46,47,48,59,60]. By incorporating attention mechanisms, gating functions, or learned weighting schemes, these models can dynamically integrate information from multiple branches. This enables the network to emphasize the most relevant features at inference time, which is particularly important for UHD content or images with complex structures, where different regions may contribute unequally to perceived quality. Ultimately, the popularity of dual- and multi-branch networks is driven by their superior ability to align with human perceptual processes. Their modular and interpretable design supports the modeling of multi-scale, multi-type distortions in a way that more closely reflects how humans assess image quality. As a result, such architectures have consistently demonstrated strong performance on challenging, distortion-rich datasets in both synthetic and authentic environments.
Several limitations exist in the current study. First, the design and exploration of loss functions are not comprehensive. Alternative loss functions, such as marginal cosine similarity loss [63], may offer additional benefits for enhancing feature similarity learning and improving quality prediction accuracy. Second, the feature fusion strategy employed is relatively simplistic. More advanced fusion techniques, including feature distribution matching [64] and cross-attention-based fusion [65], could be explored to enrich the representational power of the dual-branch framework. Third, the choices of backbone and SR architectures are not exhaustively evaluated. Integrating other promising modules, such as MobileMamba [66], arbitrary-scale SR [67], or uncertainty-aware models [68], may further boost performance. Finally, the proposed framework lacks fine-grained optimization of hyperparameters and architectural configurations. A more systematic exploration of design choices could lead to additional performance gains in BIQA for UHD images.
6. Conclusions
The SURPRIDE framework is proposed to address the challenges of BIQA in the UHD domain. Key components of the framework, including the VFM backbone, SR algorithm, scaling factor, weighting parameters ( and ), input size, and patch size, are determined through comprehensive ablation studies. The effectiveness of SURPRIDE is demonstrated on two UHD image databases and further validated on two HD and two SD databases, confirming its robustness across varying image resolutions. Motivated by the observed visual discrepancies between high- and low-quality images after down-sampling and SR reconstruction, the framework employs a dual-branch architecture. One branch extracts intrinsic quality features from the original input image, while the other captures comparative perceptual cues from the SR-reconstructed counterpart. The fusion of these two complementary streams enables richer and more discriminative quality representations, leading to improved BIQA performance. In the future work, attention could be paid to the integration of positional encoding, advanced representation learning, and adaptive dual- or multi-branch fusion to better align algorithmic predictions with human visual perception in real-world UHD scenarios.
Author Contributions
Conceptualization, J.G., Q.M. and Q.S.; Data curation, J.G. and Q.M.; Formal analysis, S.Y. and Q.S.; Funding acquisition, S.Y. and Q.S.; Investigation, S.Y. and Q.S.; Methodology, J.G., Q.M., S.Z. and Y.W.; Project administration, Q.S.; Software, J.G., Q.M., S.Z. and Y.W.; Supervision, Q.S.; Validation, S.Z. and Y.W.; Visualization, J.G., S.Z. and Y.W.; Writing - original draft, J.G. and S.Y.; Writing - review & editing, S.Y. and Q.S. All authors have read and agreed to the published version of the manuscript.
Funding
The work was in part supported by the National Key Research and Develop Program of China (Grant No. 2022ZD0115901), the National Natural Science Foundation of China (Grant No. 62177007), the China-Central Eastern European Countries High Education Joint Education Project (Grant No. 202012), the Application of Trusted Education Digital Identity in the Construction of Smart Campus in Vocational Colleges (Grant No. 2242000393), the Knowledge Blockchain Research Fund (Grant No. 500230), and the Medium- and Long-term Technology Plan for Radio, Television and Online Audiovisual (Grant No. ZG23011).
Institutional Review Board Statement
Not applicable.
Informed Consent Statement
Not applicable.
Data Availability Statement
The datasets supporting the current study are available online: the CLIVE database at https://live.ece.utexas.edu/research/ChallengeDB/, the BIQ2021 database at https://github.com/nisarahmedrana/BIQ2021, the CID database at https://qualinet.github.io/databases/image/cid2013_camera_image_database/, the KonIQ-10k database at https://database.mmsp-kn.de/koniq-10k-database.html, the HRIQ database at https://github.com/jarikorhonen/hriq, and the UHD-IQA database at https://database.mmsp-kn.de/uhd-iqa-benchmark-database.html. The pre-trained VFM used in this study are publicly available at https://huggingface.co/facebook/convnext-base-384-22k-1k and https://huggingface.co/facebook/deit-base-distilled-patch16-384. The SR models are obtained from https://github.com/Zdafeng/SwinFIR and https://github.com/XPixelGroup/HAT. (all accessed on 1 July 2025).
Conflicts of Interest
The authors declare no conflicts of interest. The funders had no role in the design of the study; in the collection, analyses, or interpretation of data; in the writing of the manuscript; or in the decision to publish the results.
Abbreviations
The following abbreviations are used in this manuscript:
| BIQA | blind image quality assessment |
| UHD | ultra-high-definition |
| SR | super-resolution |
| SURPRIDE | SUper-resolved Pseudo References In Dual-branch Embedding |
| CNN | convolutional neural network |
| LMMM | Large multi-modal model |
| ViT | Vision Transformer |
| RNN | recurrent neural network |
| MSE | mean squared error |
| SOTA | state-of-the-art |
| HD | high-definition |
| SD | standard-definition |
| MOS | mean opinion score |
| FC | full connection |
| PLCC | Pearson’s linear correlation coefficient |
| SRCC | Spearman rank-order correlation coefficient |
References
- Dai, G.; Wang, Z.; Li, Y.; Chen, Q.; Yu, S.; Xie, Y. Evaluation of no-reference models to assess image sharpness. In Proceedings of the 2017 IEEE International Conference on Information and Automation (ICIA). IEEE, 2017, pp. 683–687. [CrossRef]
- Zhai, G.; Min, X. Perceptual image quality assessment: A survey. Science China Information Sciences 2020, 63(11), 1–52. [CrossRef]
- Yang, P.; Sturtz, J.; Qingge, L. Progress in blind image quality assessment: A brief review. Mathematics 2023, 11, 2766. [CrossRef]
- Chen, L.; Jiang, F.; Zhang, H.; Wu, S.; Yu, S.; Xie, Y. Edge preservation ratio for image sharpness assessment. In Proceedings of the 2016 12th World Congress on Intelligent Control and Automation (WCICA). IEEE, 2016, pp. 1377–1381. [CrossRef]
- Lang, S.; Liu, X.; Zhou, M.; Luo, J.; Pu, H.; Zhuang, X.; Wang, J.; Wei, X.; Zhang, T.; Feng, Y.; et al. A full-reference image quality assessment method via deep meta-learning and conformer. IEEE Transactions on Broadcasting 2023, 70, 316–324. [CrossRef]
- Soundararajan, R.; Bovik, A.C. RRED indices: Reduced reference entropic differencing for image quality assessment. IEEE Transactions on Image Processing 2011, 21, 517–526. [CrossRef]
- Wu, J.; Lin, W.; Shi, G.; Liu, A. Reduced-reference image quality assessment with visual information fidelity. IEEE Transactions on Multimedia 2013, 15, 1700–1705. [CrossRef]
- Ghadiyaram, D.; Bovik, A.C. Massive online crowdsourced study of subjective and objective picture quality. IEEE Transactions on Image Processing 2015, 25, 372–387. [CrossRef]
- Hosu, V.; Agnolucci, L.; Wiedemann, O.; Iso, D.; Saupe, D. Uhd-iqa benchmark database: Pushing the boundaries of blind photo quality assessment. In Proceedings of the European Conference on Computer Vision. Springer, 2025, pp. 467–482. [CrossRef]
- Chen, J.; Li, S.; Lin, L. A no-reference blurred colourful image quality assessment method based on dual maximum local information. IET Signal Processing 2021, 15(9), 597–611. [CrossRef]
- Yu, S.; Wang, J.; Gu, J.; Jin, M.; Ma, Y.; Yang, L.; Li, J. A hybrid indicator for realistic blurred image quality assessment. Journal of Visual Communication and Image Representation 2023, 94, 103848. [CrossRef]
- Wu, W.; Huang, D.; Yao, Y.; Shen, Z.; Zhang, H.; Yan, C.; Zheng, B. Feature rectification and enhancement for no-reference image quality assessment. Journal of Visual Communication and Image Representation 2024, 98, 104030. [CrossRef]
- Chen, Z.; Yu, S. Taylor expansion-based Kolmogorov-Arnold network for blind image quality assessment. arXiv preprint arXiv:2505.21592 2025. [CrossRef]
- Yu, S.; Chen, Z.; Yang, Z.; Gu, J.; Feng, B.; Sun, Q. Exploring Kolmogorov-Arnold networks for realistic image sharpness assessment. In Proceedings of the ICASSP 2025-2025 IEEE International Conference on Acoustics, Speech and Signal Processing (ICASSP). IEEE, 2025, pp. 1–5. [CrossRef]
- Yu, S.; Jiang, F.; Li, L.; Xie, Y. CNN-GRNN for image sharpness assessment. In Proceedings of the Asian Conference on Computer Vision, 2016, pp. 50–61. [CrossRef]
- Yu, S.; Wu, S.; Wang, L.; Jiang, F.; Xie, Y.; Li, L. A shallow convolutional neural network for blind image sharpness assessment. PloS one 2017, 12(5), e0176632. [CrossRef]
- Bianco, S.; Celona, L.; Napoletano, P.; Schettini, R. On the use of deep learning for blind image quality assessment. Signal, Image and Video Processing 2018, 12, 355–362. [CrossRef]
- Ma, K.; Liu, W.; Zhang, K.; Duanmu, Z.; Wang, Z.; Zuo, W. End-to-end blind image quality assessment using deep neural networks. IEEE Transactions on Image Processing 2017, 27, 1202–1213. [CrossRef]
- Su, S.; Yan, Q.; Zhu, Y.; Zhang, C.; Ge, X.; Sun, J.; Zhang, Y. Blindly assess image quality in the wild guided by a self-adaptive hyper network. In Proceedings of the Proceedings of the IEEE/CVF conference on computer vision and pattern recognition, 2020, pp. 3667–3676.
- Vaswani, A.; Shazeer, N.; Parmar, N.; Uszkoreit, J.; Jones, L.; Gomez, A.N.; Kaiser, Ł.; Polosukhin, I. Attention is all you need. Advances in neural information processing systems 2017, 30.
- Dosovitskiy, A.; Beyer, L.; Kolesnikov, A.; Weissenborn, D.; Zhai, X.; Unterthiner, T.; Dehghani, M.; Minderer, M.; Heigold, G.; Gelly, S.; et al. An image is worth 16x16 words: Transformers for image recognition at scale. arXiv preprint arXiv:2010.11929 2020.
- Liu, Z.; Lin, Y.; Cao, Y.; Hu, H.; Wei, Y.; Zhang, Z.; Lin, S.; Guo, B. Swin transformer: Hierarchical vision transformer using shifted windows. In Proceedings of the Proceedings of the IEEE/CVF international conference on computer vision, 2021, pp. 10012–10022.
- Ke, J.; Wang, Q.; Wang, Y.; Milanfar, P.; Yang, F. Musiq: Multi-scale image quality transformer. In Proceedings of the Proceedings of the IEEE/CVF international conference on computer vision, 2021, pp. 5148–5157.
- Qin, G.; Hu, R.; Liu, Y.; Zheng, X.; Liu, H.; Li, X.; Zhang, Y. Data-efficient image quality assessment with attention-panel decoder. In Proceedings of the Proceedings of the AAAI Conference on Artificial Intelligence, 2023, Vol. 37, pp. 2091–2100. [CrossRef]
- Yang, S.; Wu, T.; Shi, S.; Lao, S.; Gong, Y.; Cao, M.; Wang, J.; Yang, Y. Maniqa: Multi-dimension attention network for no-reference image quality assessment. In Proceedings of the Proceedings of the IEEE/CVF conference on computer vision and pattern recognition, 2022, pp. 1191–1200.
- Pan, L.; Zhang, X.; Xie, F.; Zhang, H.; Zheng, Y. SGIQA: semantic-guided no-reference image quality assessment. IEEE Transactions on Broadcasting 2024. [CrossRef]
- You, Z.; Gu, J.; Li, Z.; Cai, X.; Zhu, K.; Dong, C.; Xue, T. Descriptive image quality assessment in the wild. arXiv preprint arXiv:2405.18842 2024. [CrossRef]
- Zhu, H.; Wu, H.; Li, Y.; Zhang, Z.; Chen, B.; Zhu, L.; Fang, Y.; Zhai, G.; Lin, W.; Wang, S. Adaptive Image Quality Assessment via Teaching Large Multimodal Model to Compare. arXiv preprint arXiv:2405.19298 2024. [CrossRef]
- Chen, C.; Yang, S.; Wu, H.; Liao, L.; Zhang, Z.; Wang, A.; Sun, W.; Yan, Q.; Lin, W. Q-ground: Image quality grounding with large multi-modality models. In Proceedings of the Proceedings of the 32nd ACM International Conference on Multimedia, 2024, pp. 486–495. [CrossRef]
- Kwon, D.; Kim, D.; Ki, S.; Jo, Y.; Lee, H.E.; Kim, S.J. ATTIQA: Generalizable Image Quality Feature Extractor using Attribute-aware Pretraining. In Proceedings of the Proceedings of the Asian Conference on Computer Vision, 2024, pp. 4526–4543.
- He, K.; Zhang, X.; Ren, S.; Sun, J. Deep residual learning for image recognition. In Proceedings of the Proceedings of the IEEE conference on computer vision and pattern recognition, 2016, pp. 770–778.
- Bengio, Y.; Simard, P.; Frasconi, P. Learning long-term dependencies with gradient descent is difficult. IEEE transactions on neural networks 1994, 5, 157–166. [CrossRef]
- Huang, H.; Wan, Q.; Korhonen, J. High resolution image quality database. ICASSP 2024-2024 IEEE International Conference on Acoustics, Speech and Signal Processing (ICASSP) 2024. [CrossRef]
- Sun, W.; Zhang, W.; Cao, Y.; Cao, L.; Jia, J.; Chen, Z.; Zhang, Z.; Min, X.; Zhai, G. Assessing UHD image quality from aesthetics, distortions, and saliency. In Proceedings of the European Conference on Computer Vision. Springer, 2025, pp. 109–126. [CrossRef]
- Tan, X.; Zhang, J.; Quan, Y.; Li, J.; Wu, Y.; Bian, Z. Highly efficient no-reference 4k video quality assessment with full-pixel covering sampling and training strategy. In Proceedings of the Proceedings of the 32nd ACM International Conference on Multimedia, 2024, pp. 9913–9922. [CrossRef]
- Stern, M.K.; Johnson, J.H. Just noticeable difference. The corsini encyclopedia of psychology 2010, pp. 1–2. [CrossRef]
- Yu, A.; Grauman, K. Just noticeable differences in visual attributes. In Proceedings of the Proceedings of the IEEE International Conference on Computer Vision, 2015, pp. 2416–2424.
- Wu, J.; Li, L.; Dong, W.; Shi, G.; Lin, W.; Kuo, C.C.J. Enhanced just noticeable difference model for images with pattern complexity. IEEE Transactions on Image Processing 2017, 26, 2682–2693. [CrossRef]
- Ferzli, R.; Karam, L.J. A no-reference objective image sharpness metric based on the notion of just noticeable blur (JNB). IEEE transactions on image processing 2009, 18, 717–728. [CrossRef]
- Ahmed, N.; Asif, S. BIQ2021: a large-scale blind image quality assessment database. Journal of Electronic Imaging 2022, 31, 053010–053010. [CrossRef]
- Virtanen, T.; Nuutinen, M.; Vaahteranoksa, M.; Oittinen, P.; Häkkinen, J. CID2013: A database for evaluating no-reference image quality assessment algorithms. IEEE Transactions on Image Processing 2014, 24, 390–402. [CrossRef]
- Hosu, V.; Lin, H.; Sziranyi, T.; Saupe, D. KonIQ-10k: An ecologically valid database for deep learning of blind image quality assessment. IEEE Transactions on Image Processing 2020, 29, 4041–4056. [CrossRef]
- Hosu, V.; Conde, M.V.; Agnolucci, L.; Barman, N.; Zadtootaghaj, S.; Timofte, R.; Sun, W.; Zhang, W.; Cao, Y.; Cao, L.; et al. AIM 2024 challenge on UHD blind photo quality assessment. In Proceedings of the European Conference on Computer Vision. Springer, 2025, pp. 261–286. [CrossRef]
- Zhu, H.; Li, L.; Wu, J.; Dong, W.; Shi, G. MetaIQA: Deep meta-learning for no-reference image quality assessment. In Proceedings of the Proceedings of the IEEE/CVF conference on computer vision and pattern recognition, 2020, pp. 14143–14152.
- Pan, Z.; Zhang, H.; Lei, J.; Fang, Y.; Shao, X.; Ling, N.; Kwong, S. DACNN: Blind image quality assessment via a distortion-aware convolutional neural network. IEEE Transactions on Circuits and Systems for Video Technology 2022, 32, 7518–7531. [CrossRef]
- Gao, Y.; Min, X.; Cao, Y.; Liu, X.; Zhai, G. No-Reference Image Quality Assessment: Obtain MOS from Image Quality Score Distribution. IEEE Transactions on Circuits and Systems for Video Technology 2024. [CrossRef]
- Zhao, W.; Li, M.; Xu, L.; Sun, Y.; Zhao, Z.; Zhai, Y. A Multi-Branch Network with Multi-Layer Feature Fusion for No-Reference Image Quality Assessment. IEEE Transactions on Instrumentation and Measurement 2024. [CrossRef]
- Saha, A.; Mishra, S.; Bovik, A.C. Re-iqa: Unsupervised learning for image quality assessment in the wild. In Proceedings of the Proceedings of the IEEE/CVF conference on computer vision and pattern recognition, 2023, pp. 5846–5855.
- Golestaneh, S.A.; Dadsetan, S.; Kitani, K.M. No-reference image quality assessment via transformers, relative ranking, and self-consistency. In Proceedings of the Proceedings of the IEEE/CVF winter conference on applications of computer vision, 2022, pp. 1220–1230.
- Shin, N.H.; Lee, S.H.; Kim, C.S. Blind image quality assessment based on geometric order learning. In Proceedings of the Proceedings of the IEEE/CVF Conference on Computer Vision and Pattern Recognition, 2024, pp. 12799–12808.
- Chen, Z.; Wang, J.; Li, B.; Yuan, C.; Hu, W.; Liu, J.; Li, P.; Wang, Y.; Zhang, Y.; Zhang, C. Gmc-iqa: Exploiting global-correlation and mean-opinion consistency for no-reference image quality assessment. arXiv preprint arXiv:2401.10511 2024. [CrossRef]
- Chen, Z.; Qin, H.; Wang, J.; Yuan, C.; Li, B.; Hu, W.; Wang, L. Promptiqa: Boosting the performance and generalization for no-reference image quality assessment via prompts. In Proceedings of the European Conference on Computer Vision. Springer, 2024, pp. 247–264. [CrossRef]
- Touvron, H.; Cord, M.; Douze, M.; Massa, F.; Sablayrolles, A.; Jégou, H. Training data-efficient image transformers & distillation through attention. In Proceedings of the International conference on machine learning. PMLR, 2021, pp. 10347–10357.
- Liu, Z.; Mao, H.; Wu, C.Y.; Feichtenhofer, C.; Darrell, T.; Xie, S. A convnet for the 2020s. In Proceedings of the Proceedings of the IEEE/CVF conference on computer vision and pattern recognition, 2022, pp. 11976–11986.
- Zhang, D.; Huang, F.; Liu, S.; Wang, X.; Jin, Z. Swinfir: Revisiting the swinir with fast fourier convolution and improved training for image super-resolution. arXiv preprint arXiv:2208.11247 2022. [CrossRef]
- Chen, X.; Wang, X.; Zhang, W.; Kong, X.; Qiao, Y.; Zhou, J.; Dong, C. Hat: Hybrid attention transformer for image restoration. arXiv preprint arXiv:2309.05239 2023. [CrossRef]
- Loshchilov, I.; Hutter, F. Decoupled weight decay regularization. arXiv preprint arXiv:1711.05101 2017. [CrossRef]
- Murray, N.; Marchesotti, L.; Perronnin, F. AVA: A large-scale database for aesthetic visual analysis. In Proceedings of the 2012 IEEE conference on computer vision and pattern recognition. IEEE, 2012, pp. 2408–2415. [CrossRef]
- Huang, Z.; Liu, H.; Jia, Z.; Zhang, S.; Zhang, Y.; Liu, S. Texture dominated no-reference quality assessment for high resolution image by multi-scale mechanism. Neurocomputing 2025, 636, 130003. [CrossRef]
- Yang, Y.; Liu, C.; Wu, H.; Yu, D. A quality assessment algorithm for no-reference images based on transfer learning. PeerJ Computer Science 2025, 11, e2654. [CrossRef]
- Valicharla, S.K.; Li, X.; Greenleaf, J.; Turcotte, R.; Hayes, C.; Park, Y.L. Precision detection and assessment of ash death and decline caused by the emerald ash borer using drones and deep learning. Plants 2023, 12, 798. [CrossRef]
- König, M.; Seeböck, P.; Gerendas, B.S.; Mylonas, G.; Winklhofer, R.; Dimakopoulou, I.; Schmidt-Erfurth, U.M. Quality assessment of colour fundus and fluorescein angiography images using deep learning. British Journal of Ophthalmology 2024, 108, 98–104. [CrossRef]
- Yao, J.; Yang, B.; Wang, X. Reconstruction vs. generation: Taming optimization dilemma in latent diffusion models. In Proceedings of the Proceedings of the Computer Vision and Pattern Recognition Conference, 2025, pp. 15703–15712.
- Zhou, Y.; Ye, Y.; Zhang, P.; Wei, X.; Chen, M. Exact fusion via feature distribution matching for few-shot image generation. In Proceedings of the Proceedings of the IEEE/CVF Conference on Computer Vision and Pattern Recognition, 2024, pp. 8383–8392.
- Yu, S.; Meng, J.; Fan, W.; Chen, Y.; Zhu, B.; Yu, H.; Xie, Y.; Sun, Q. Speech emotion recognition using dual-stream representation and cross-attention fusion. Electronics 2024, 13, 2191. [CrossRef]
- He, H.; Zhang, J.; Cai, Y.; Chen, H.; Hu, X.; Gan, Z.; Wang, Y.; Wang, C.; Wu, Y.; Xie, L. Mobilemamba: Lightweight multi-receptive visual mamba network. In Proceedings of the Proceedings of the Computer Vision and Pattern Recognition Conference, 2025, pp. 4497–4507.
- Yue, Z.; Liao, K.; Loy, C.C. Arbitrary-steps image super-resolution via diffusion inversion. In Proceedings of the Proceedings of the Computer Vision and Pattern Recognition Conference, 2025, pp. 23153–23163.
- Zhang, L.; You, W.; Shi, K.; Gu, S. Uncertainty-guided Perturbation for Image Super-Resolution Diffusion Model. In Proceedings of the Proceedings of the Computer Vision and Pattern Recognition Conference, 2025, pp. 17980–17989.
| 1 | Pre-trained DeiT model: https://huggingface.co/facebook/deit-base-distilled-patch16-384
|
| 2 | Pre-trained ConvNeXt model: https://huggingface.co/facebook/convnext-base-384-22k-1k
|
Figure 1.
Original images with varying MOS values and their corresponding SR reconstructed images (side by side). Interestingly, higher-quality images tend to exhibit more noticeable distortions after SR reconstruction.
Figure 1.
Original images with varying MOS values and their corresponding SR reconstructed images (side by side). Interestingly, higher-quality images tend to exhibit more noticeable distortions after SR reconstruction.
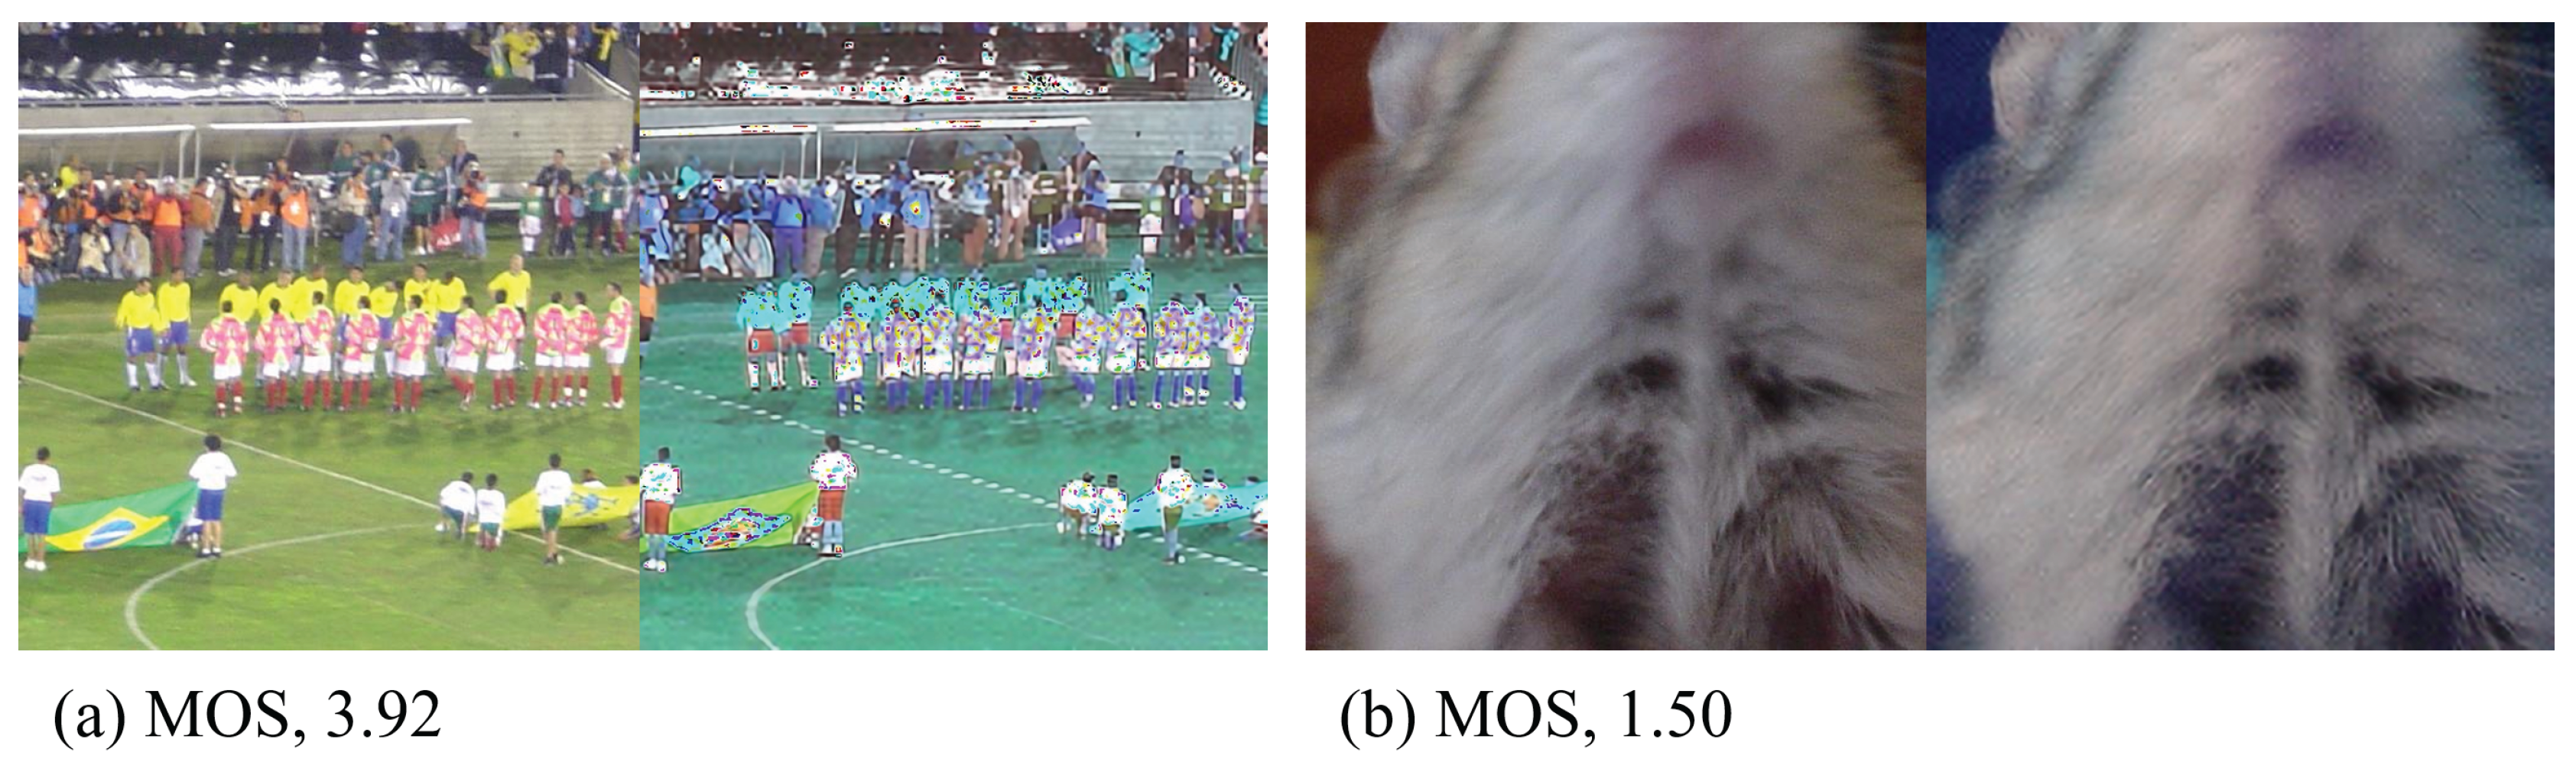
Figure 2.
The framework consists of two branches, each followed by a VFM backbone for feature extraction. Then, the output features are weighted and concatated as the input of a module with two FC layers. In model training, added to forms a hybrid loss function for guiding the model toward improved performance.
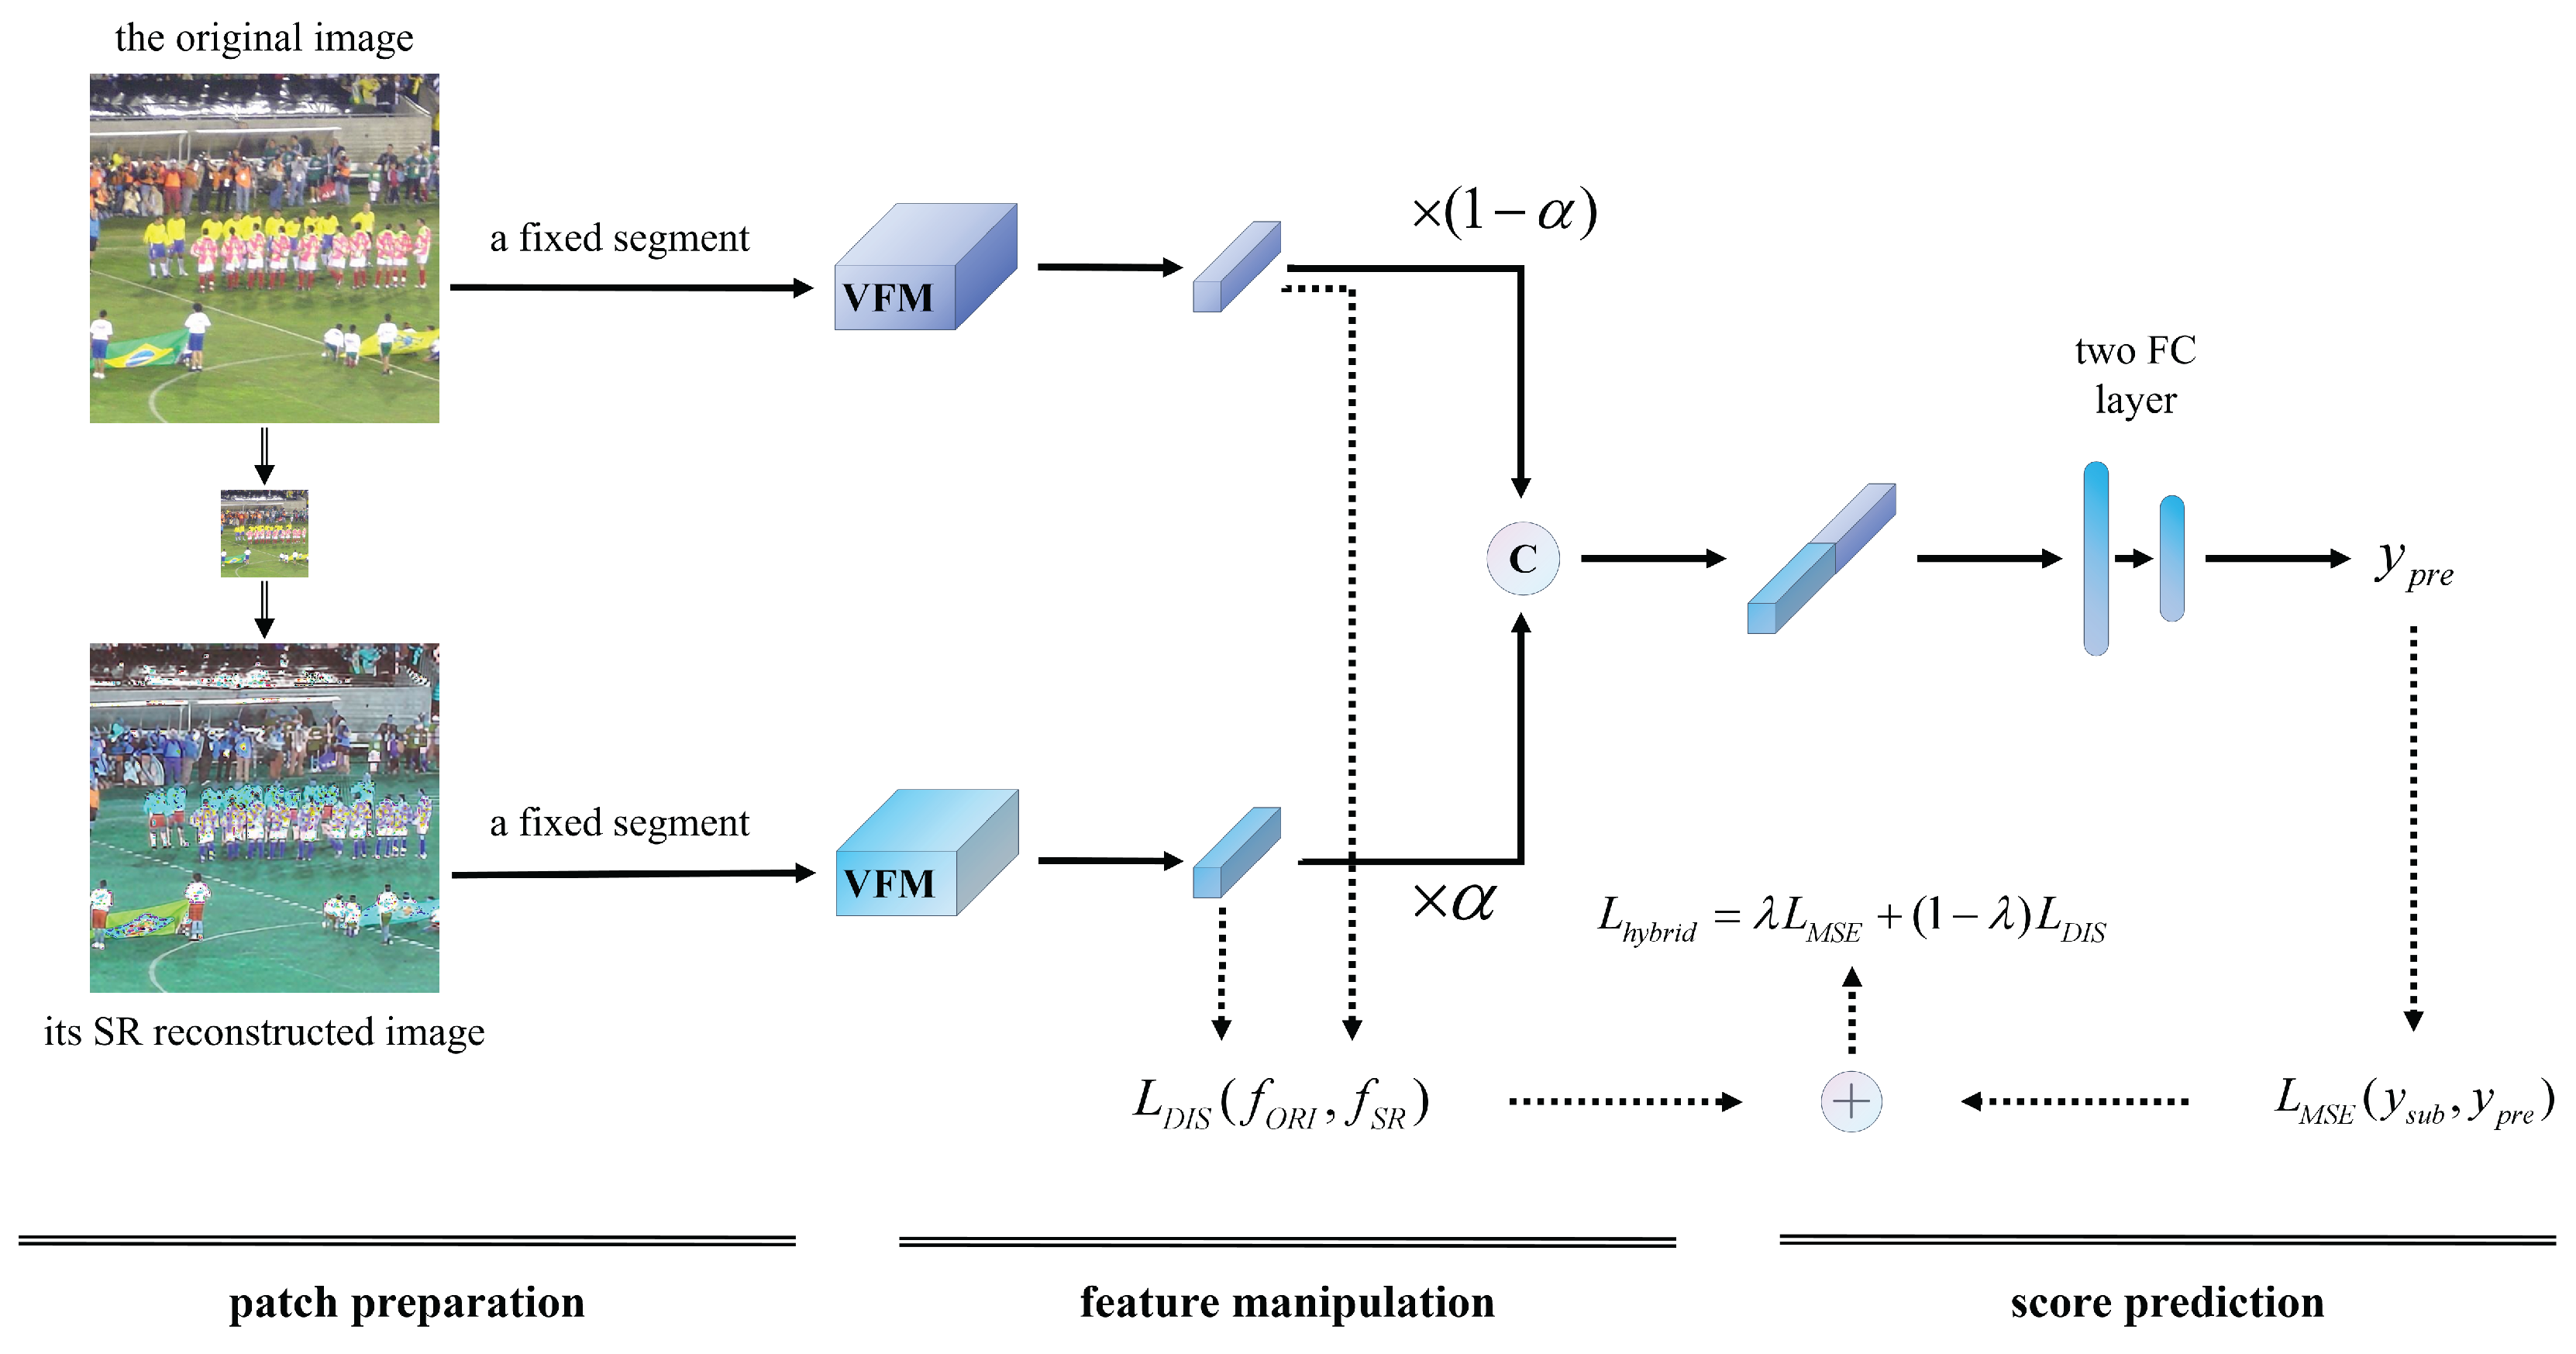
Figure 3.
Illustration of patch preparation. (a) An exemplary image with a resolution of 2560 × 1440, red squares and green squares denote the basic patches sized 16 × 16. (b) An image patch sized 384 × 384 composed of successive red patches. (c) An image patch sized 384 × 384 formed by successive green patches. Notably, these patches are uniformly sampled across the entire image. Throughout the training process, both the original and SR reconstructed images are subjected to an identical and fixed sampling strategy.
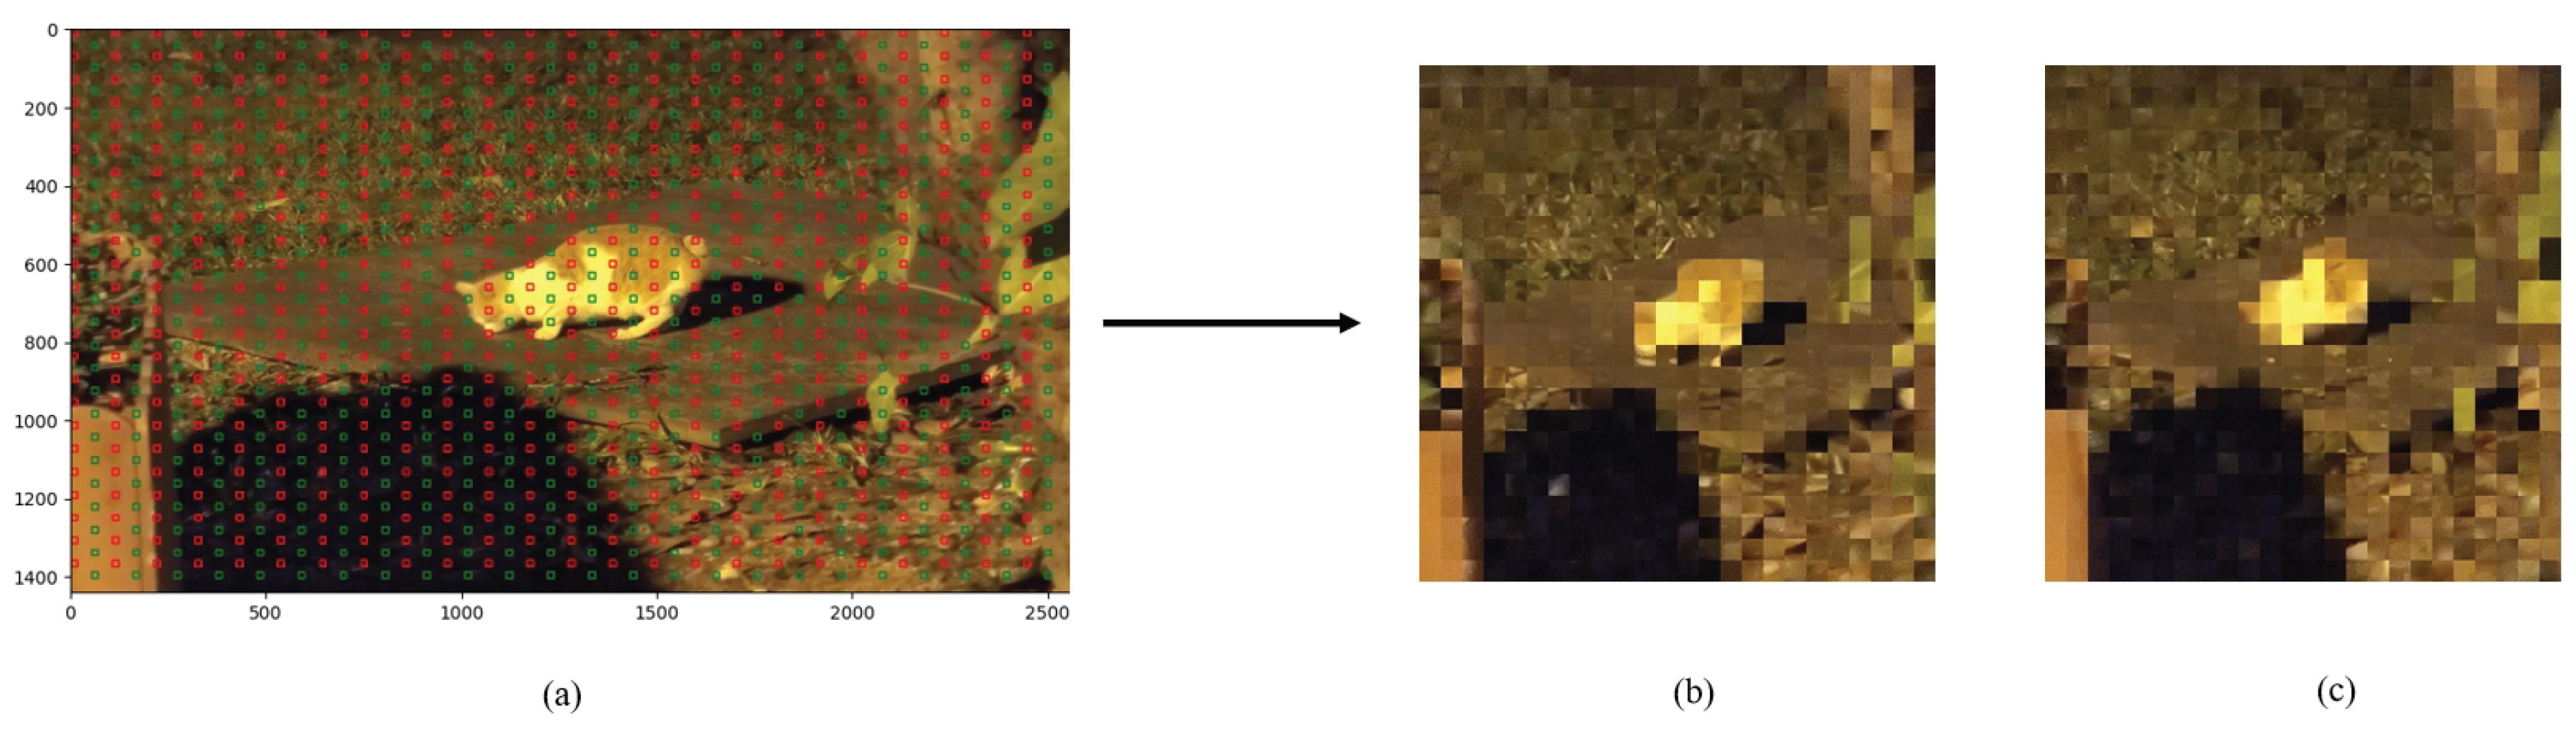
Figure 4.
Scatter plots of predicted MOS versus subjective MOS values: (a) The proposed SURPRIDE algorithm; (b) the SOTA model, UIQA. Each plot includes a quadratic fit line with confidence bands through Gaussian kernel density estimation.
Figure 4.
Scatter plots of predicted MOS versus subjective MOS values: (a) The proposed SURPRIDE algorithm; (b) the SOTA model, UIQA. Each plot includes a quadratic fit line with confidence bands through Gaussian kernel density estimation.
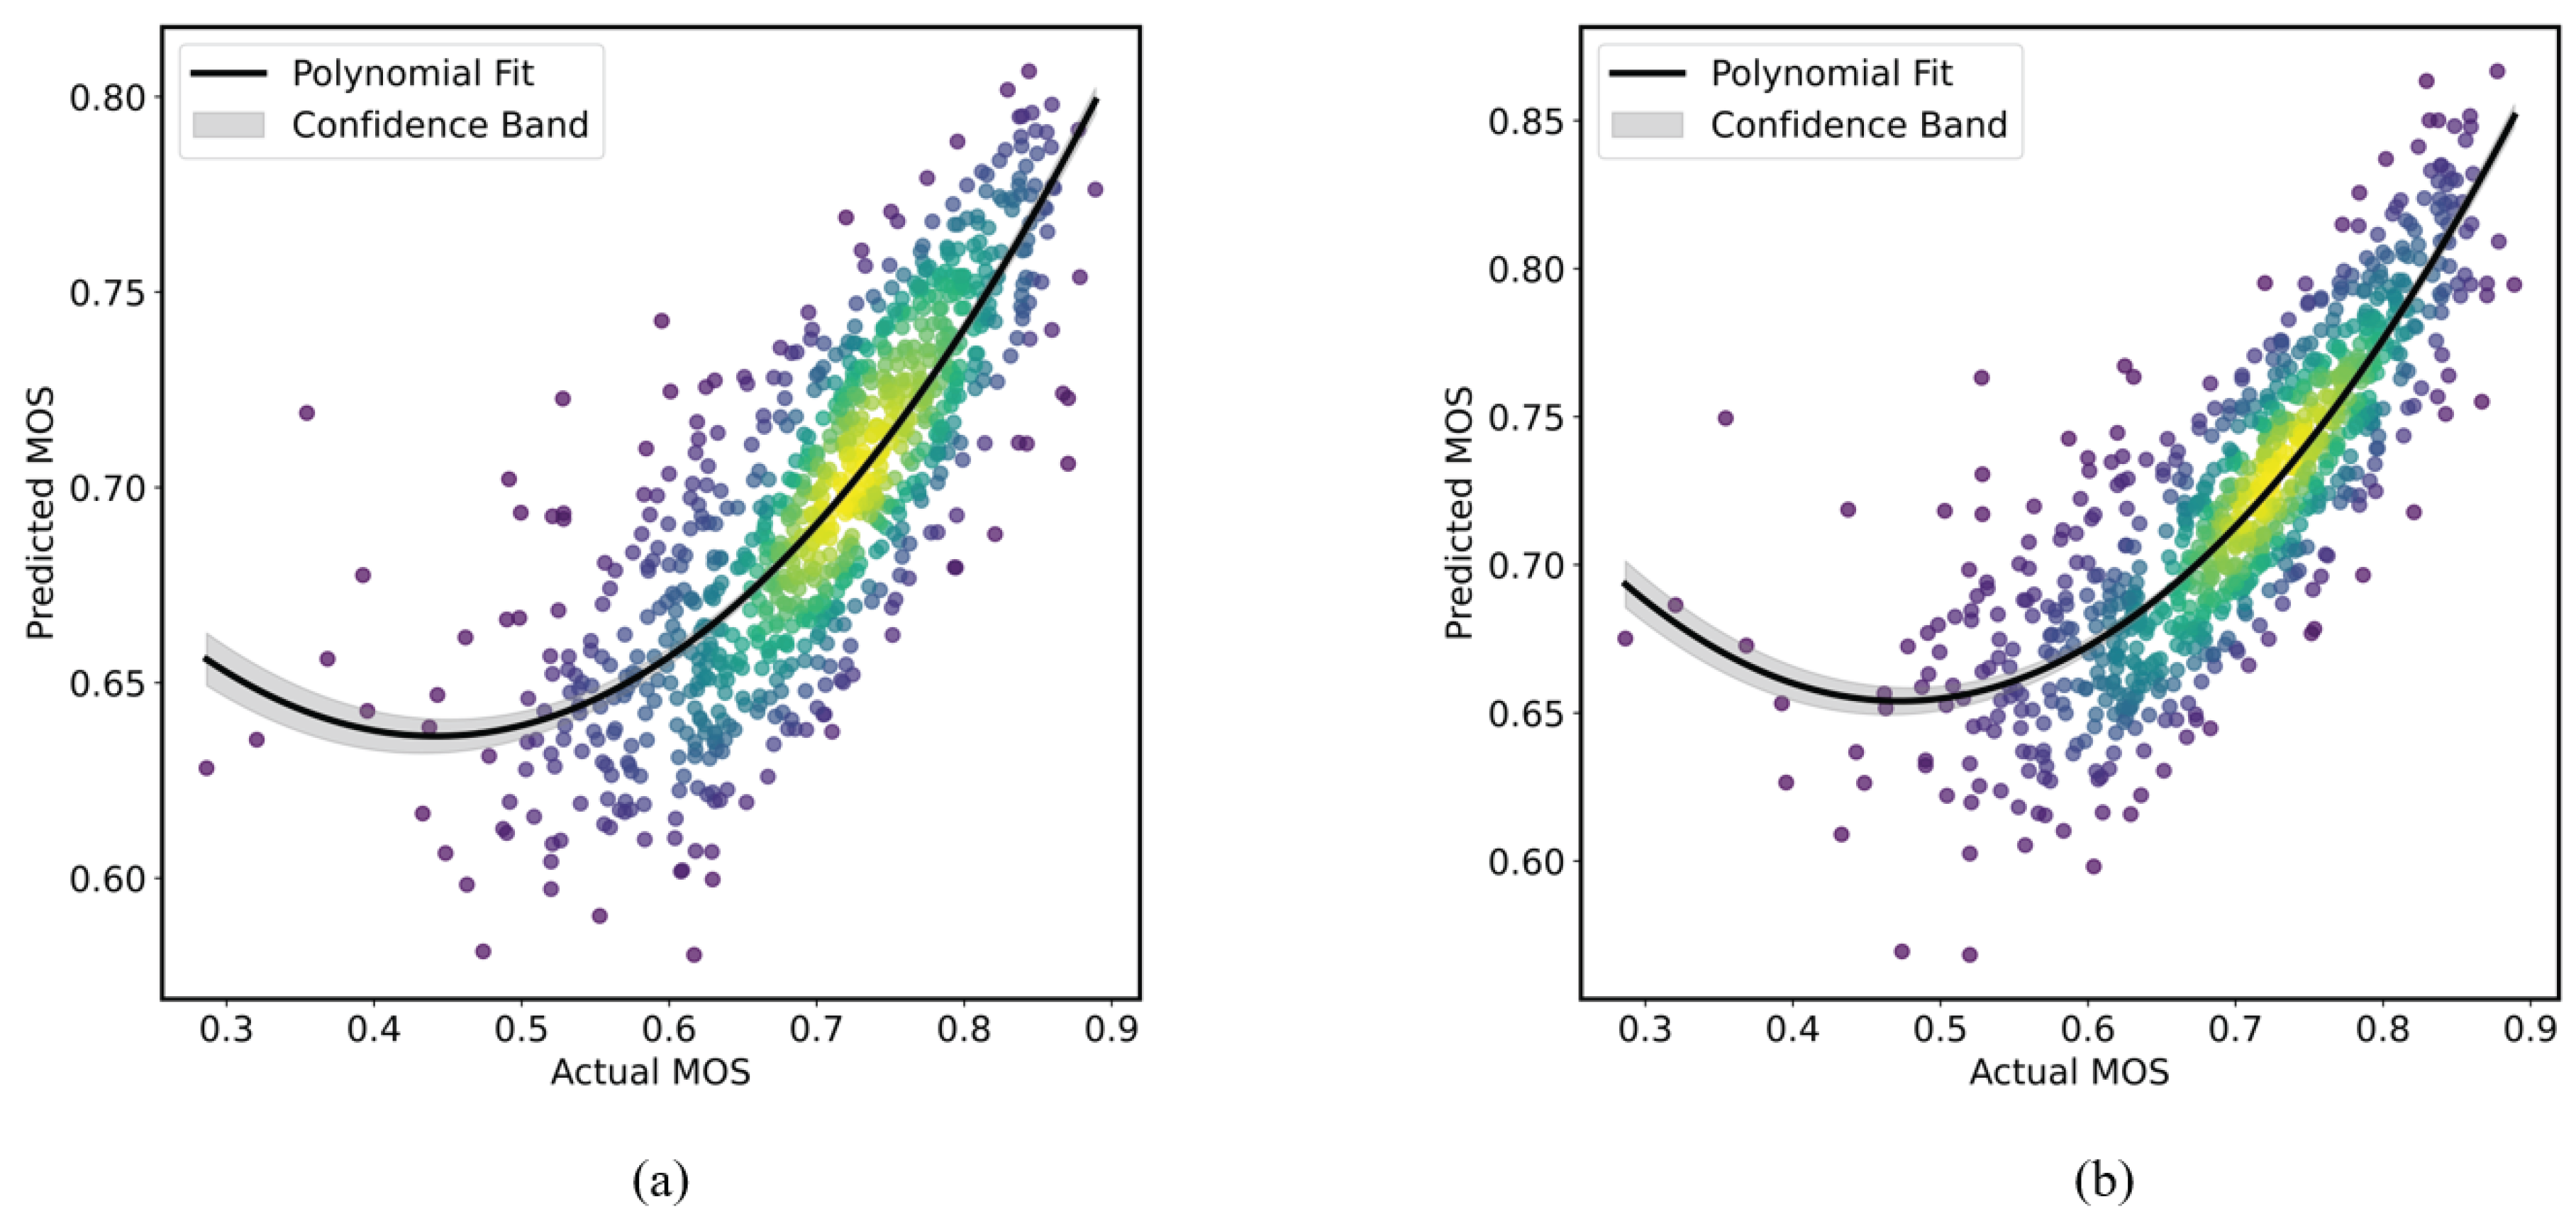

Table 1.
Summary of dataset configurations.
| Year | No. of images | Resolution | MOS range | Cropped resolution | |
| UHD-IQA [9] | 2024 | 6,073 | ≈ 3840×2160 | [0,1] | 2560×1440 |
| HRIQ [33] | 2024 | 1,120 | 2880×2160 | [0,5] | 2560×1440 |
| CID [41] | 2014 | 474 | 1600×1200 | [0,100] | 1600×1200 |
| KonIQ-10k [42] | 2020 | 10,073 | 1024×768 | [0,5] | 1024×768 |
| CLIVE [8] | 2015 | 1,162 | ≈ 500×500 | [0,100] | 496×496 |
| BIQ2021 [40] | 2021 | 12,000 | ≈ 512×512 | [0,1] | 512×512 |
Table 2.
Achievement on the AIM 2024 Challenge using official data splitting.
| on the testing set | on the validation set | |||
| PLCC | SRCC | PLCC | SRCC | |
| SJTU | 0.7985 | 0.8463 | 0.8238 | 0.8169 |
| GS-PIQA | 0.7925 | 0.8297 | 0.8192 | 0.8092 |
| CIPLAB | 0.7995 | 0.8354 | 0.8136 | 0.8063 |
| EQCNet | 0.7682 | 0.7954 | 0.8285 | 0.8234 |
| MobileNet-IQA | 0.7558 | 0.7883 | 0.7831 | 0.7757 |
| NF-RegNets | 0.7222 | 0.7715 | 0.7968 | 0.7897 |
| CLIP-IQA | 0.7116 | 0.7305 | 0.7069 | 0.6918 |
| ICL | 0.5206 | 0.5166 | 0.5217 | 0.5101 |
| SURPRIDE (ours) | 0.7755 | 0.8133 | 0.7983 | 0.7930 |
Table 3.
Dual-branch settings on the UHD-IQA database.
| PLCC | SRCC | PLCC | SRCC | |
| Original branch | SR branch | |||
| DeiT [53] | ConvNeXt [54] | |||
| DeiT [53] | 0.7188 | 0.7390 | 0.6769 | 0.7054 |
| ConvNeXt [54] | 0.7695 | 0.8073 | 0.7755 | 0.8133 |
Table 4.
Effect of input image sizes on the UHD-IQA database.
| dual branches | input size | UHD-IQA [9] | |
| PLCC | SRCC | ||
| ConvNeXt | 224 × 224 | 0.7510 | 0.7847 |
| 384 × 384 | 0.7755 | 0.8133 | |
Table 5.
Selection of SR reconstruction methods and scaling factors.
| SR method | scaling factors | UHD-IQA [9] | |
| PLCC | SRCC | ||
| SwinFIR [55] | × 2 | 0.7722 | 0.8098 |
| × 4 | 0.7755 | 0.8133 | |
| HAT [56] | × 2 | 0.7665 | 0.8111 |
| × 4 | 0.7765 | 0.8095 | |
Table 6.
Effect of parameter configurations of and on the UHD-IQA database.
| 0.766/0.801 | 0.781/0.823 | 0.776/0.813 | 0.762/0.799 | 0.774/0.813 | |
| 0.751/0.793 | 0.763/0.804 | 0.769/0.807 | 0.774/0.811 | 0.773/0.816 | |
| 0.758/0.796 | 0.778/0.811 | 0.781/0.816 | 0.784/0.819 | 0.774/0.818 |
Table 7.
Effect of patch sizes for the fixed input segments.
| patch sizes | UHD-IQA [9] | |
| PLCC | SRCC | |
| 8 × 8 | 0.7741 | 0.8039 |
| 16 × 16 | 0.7755 | 0.8133 |
| 32 × 32 | 0.7720 | 0.8140 |
Table 8.
Effect of input resolution and SR branch.
| input size | SR branch | UHD-IQA [9] | CLIVE [8] | KonIQ-10k [42] | |||
| PLCC | SRCC | PLCC | SRCC | PLCC | SRCC | ||
| 224 × 224 | w/o | 0.7514 | 0.7855 | 0.8241 | 0.7993 | 0.9200 | 0.9082 |
| w | 0.7510 | 0.7847 | 0.8764 | 0.8431 | 0.9234 | 0.9113 | |
| 384 × 384 | w/o | 0.7682 | 0.8029 | 0.8948 | 0.8551 | 0.9358 | 0.9258 |
| w | 0.7755 | 0.8133 | 0.9024 | 0.8662 | 0.9360 | 0.9269 | |
Table 9.
Effect of the loss function.
| input size | UHD-IQA [9] | CLIVE [8] | KonIQ-10k [42] | ||||
| PLCC | SRCC | PLCC | SRCC | PLCC | SRCC | ||
| 224 × 224 | w/o | 0.7002 | 0.7327 | 0.8492 | 0.8255 | 0.9232 | 0.9104 |
| w | 0.7510 | 0.7847 | 0.8764 | 0.8431 | 0.9234 | 0.9113 | |
| 384 × 384 | w/o | 0.7701 | 0.8077 | 0.8990 | 0.8642 | 0.9389 | 0.9299 |
| w | 0.7755 | 0.8133 | 0.9024 | 0.8662 | 0.9360 | 0.9269 | |
Table 10.
Achievement on the HRIQ database.
| year | HRIQ [33] | ||
| PLCC | SRCC | ||
| HyperIQA [19] | 2020 | 0.848 | 0.848 |
| MANIQA [25] | 2022 | 0.824 | 0.824 |
| HR-BIQA [33] | 2024 | 0.925 | 0.920 |
| TD-HRNet [59] | 2025 | 0.856 | 0.861 |
| SURPRIDE (ours) | 2025 | 0.882 | 0.873 |
Table 11.
Achievement on the CID database.
| year | CID [41] | ||
| PLCC | SRCC | ||
| MetaIQA [44] | 2020 | 0.7840 | 0.7660 |
| DACNN [45] | 2022 | 0.9280 | 0.9060 |
| GCN-IQD [46] | 2023 | 0.9211 | 0.9095 |
| MFFNet [47] | 2024 | 0.9560 | 0.9530 |
| SURPRIDE (ours) | 2025 | 0.9635 | 0.9647 |
Table 12.
Performance on the KonIQ-10k database.
| year | KonIQ-10k [42] | ||
| PLCC | SRCC | ||
| HyperIQA [19] | 2020 | 0.9170 | 0.9060 |
| TReS [49] | 2022 | 0.9280 | 0.9150 |
| ReIQA [48] | 2023 | 0.9230 | 0.9140 |
| QCN [50] | 2024 | 0.9450 | 0.9340 |
| ATTIQA [30] | 2024 | 0.9520 | 0.9420 |
| GMC-IQA [51] | 2024 | 0.9471 | 0.9325 |
| Prompt-IQA [52] | 2024 | 0.9430 | 0.9287 |
| SGIQA [26] | 2024 | 0.9510 | 0.9420 |
| SURPRIDE (ours) | 2025 | 0.9360 | 0.9269 |
Table 13.
Performance on the CLIVE database.
| year | CLIVE [8] | ||
| PLCC | SRCC | ||
| HyperIQA [19] | 2020 | 0.8820 | 0.8590 |
| TReS [49] | 2022 | 0.8770 | 0.8460 |
| ReIQA [48] | 2023 | 0.8540 | 0.8400 |
| ATTIQA [30] | 2024 | 0.9160 | 0.8980 |
| GMC-IQA [51] | 2024 | 0.9225 | 0.9062 |
| Prompt-IQA [52] | 2024 | 0.9280 | 0.9125 |
| SGIQA [26] | 2024 | 0.9160 | 0.8940 |
| QCN [50] | 2024 | 0.8930 | 0.8750 |
| SURPRIDE (ours) | 2025 | 0.9024 | 0.8662 |
Disclaimer/Publisher’s Note: The statements, opinions and data contained in all publications are solely those of the individual author(s) and contributor(s) and not of MDPI and/or the editor(s). MDPI and/or the editor(s) disclaim responsibility for any injury to people or property resulting from any ideas, methods, instructions or products referred to in the content. |
© 2025 by the authors. Licensee MDPI, Basel, Switzerland. This article is an open access article distributed under the terms and conditions of the Creative Commons Attribution (CC BY) license (http://creativecommons.org/licenses/by/4.0/).
Copyright: This open access article is published under a Creative Commons CC BY 4.0 license, which permit the free download, distribution, and reuse, provided that the author and preprint are cited in any reuse.


