Submitted:
04 July 2025
Posted:
07 July 2025
Read the latest preprint version here
Abstract
The development of the epidermis plays a central role in driving the morphogenesis of the Caenorhabditis elegans embryo. This is a four-dimensional process, tightly regulated by developmental timing. Research on epidermal morphogenesis has often emphasized the analysis of defective embryos to uncover the underlying mechanisms. However, current research may place disproportionate focus on overt phenotypic abnormalities, potentially overlooking the crucial role of developmental timing. Consequently, existing methods are limited in the early screening of genes involved in epidermal morphogenesis, as the inactivation of certain genes does not produce visible morphological defects but instead leads to subtle delays during specific embryonic stages. This highlights the need to incorporate developmental timing into conventional phenotype-based analyses. In this study, we developed a deep learning–based image analysis pipeline that combines ResU-Net for noise reduction and ResNet for embryonic stage prediction. Time-lapse differential interference contrast (DIC) microscopy was used to dynamically track the timeline of epidermal morphogenesis. Stage-specific developmental delays were observed in RNAi-treated embryos targeting ajm-1, tes-1, and leo-1, which was clearly reflected in the temporal dimension. This temporal perspective offers a novel framework for understanding the dynamics of morphogenesis and reveals subtle developmental processes.
Keywords:
temporal analysis
; deep learning
; Caenorhabditis elegans
; epidermal morphogenesis
1. Introduction
The development of the epidermis plays a central role in driving the morphogenesis of the Caenorhabditis elegans (C. elegans) embryo. Epidermal morphogenesis is a complex and dynamic process that requires the collaboration of multiple features such as mechanical forces and signaling [1]. The epidermis is the outer cellular layer of an organism and plays an important role in embryogenesis as this tissue regulates the shape of the animal during the developmental process [2]. Understanding this process is crucial for uncovering the mechanisms of morphogenesis and has significant implications for studying developmental diseases and related gene function [3]. C. elegans is a useful model to study morphogenesis and provides insights into various human diseases due to its fixed cell number, stereotypical cell division pattern, rapid developmental process, and the ease and economy with which genetic experiments such as RNA interference (RNAi) can be performed [2,4,5,6,7].
Epidermal morphogenesis involves complex cell-to-cell interactions and coordination between multiple genes. The intricate process of epidermal development in embryos is often described by classifying it into distinct phenotypic stages, which provide a valuable framework (Figure 1A). This facilitates the analysis of phenotypic embryonic images, thereby elucidating the underlying mechanisms. Several influential studies have reported the critical role of epidermal morphogenesis using defective embryonic images to elucidate aspects such as epidermal cell fate junctions, interactions, and regulatory mechanisms [8,9,10,11,12]. Incorporating a temporal perspective is essential to developmental studies of this process. A pioneering study successfully used RNA-sequencing analysis to explore linkages in developmental timing and provide comprehensive insights into temporal and spatial dynamics [13]. Recently, a novel, large-scale study used RNAi and four-dimensional imaging of specialized strains tagged with fluorescent proteins to systematically characterize embryonic development [14]. However, current image-based research methods focus heavily on defective phenotypes. Although certain genes are involved in epidermal development, their inactivation does not cause obvious morphological abnormalities, and the epidermal developmental process can still be completed. Instead, the progression through specific embryonic stages is prolonged (Figure 1B). This often requires complex experimental designs aimed at converting developmental delays into observable defects. One such method entails combining weak-allele mutant strains with RNAi to induce more severe developmental defects than with single mutants. This highlights the need for a novel approach emphasizing the developmental timing and addressing the omissions in traditional approaches during the epidermal development process.
Recent advancements in deep learning-based image analysis have led to substantial breakthroughs across various research fields, particularly in medical imaging, where automated analysis enables more accurate and efficient diagnoses [15,16,17,18,19]. This method has also transformed the approach to developmental biology, expanding our understanding of morphogenesis, embryogenesis, behavior, and even aging in C. elegans. For instance, image segmentation models have been used to analyze the “morphodynamics” of early embryos [20], and object detection models have characterized multiple features of C. elegans in microfluidic devices, including size, movement, speed, and fluorescence [21], apart from aiding the study of worm behavior [22]. Furthermore, image similarity analysis models have been applied to identify cell divisions in early embryos automatically [23], and classification models have been employed to study lifespan [24]. However, most studies have focused on early embryos, tracking cell lineage or behavior, while studies focusing on epidermal morphogenesis are lacking.
This study introduces a deep learning-based image analysis approach, offering a more direct and temporally focused methodology compared to traditional methods. This approach is particularly capable of highlighting cases where the effects on development are not severe enough to cause detectable changes in the phenotype but are manifested as developmental delays. Time-lapse differential interference contrast (DIC) microscopy was used to monitor the developmental timing of each stage of epidermal morphogenesis in C. elegans. Our approach combined two classic deep learning models: ResU-Net [25,26] was used for noise reduction, thereby facilitating focus on embryonic regions, and ResNet [27] was employed to predict embryonic stages and generate a developmental timeline to facilitate real-time-tracking of the process.
This approach was successfully applied to experiments screening three genes, namely, ajm-1, tes-1, and leo-1. These genes are known to be involved in epidermal morphogenesis in C. elegans but RNAi treatment targeting them does not exhibit noticeable phenotypic defects until the late elongation phase. Temporal analysis indicated that RNAi treatment revealed the impacts of these genes on developmental timing at specific embryonic stages.
This study posits that the time taken by each specific epidermal developmental stage can provide critical insights into the regulation of epidermal morphogenesis. Therefore, in the absence of apparent phenotypic defects, temporally assessing embryogenesis offers an effective approach to detect subtle developmental changes. Shifting the focus from visible phenotypic defects to developmental timing is expected to provide a platform for identifying genes that contribute to epidermal morphogenesis. This approach may also have broad applicability to other image-based studies, such as embryogenesis in various organisms and the early diagnosis of certain developmental disorders that arise during embryogenesis but remain subtle and difficult to detect by conventional methods.
2. Results
2.1. Embryo Segmentation and Classification Using ResU-Net and ResNet
2.1.1. ResU-Net
ResU-Net was utilized to reduce the noise around the embryo, which may have resulted from some E. coli, parts of worm tissue fluid or other embryos being mixed into the image frame.
Intact embryos in the images were successfully segmented and processed, regardless of the embryo orientation. Of the 765 images, 80% were collected for training and 20% were used for validation. The ResU-Net model achieved a recall (sensitivity) of 99.14% and a specificity of 97.98%, indicating its reliability to distinguish between segmented and non-segmented areas. The overall accuracy reached 98.47%. The model also attained a precision (positive predictive value) of 97.24% and an F1-score of 98.18%. Furthermore the Intersection over Union (IoU) was calculated to be 96.43%, reflecting the model’s effectiveness in accurately localizing relevant regions (Figure 2. ResU-Net performance diagram (A) ResU-Net IoU results diagram. The IoU scores are used to evaluate accuracy. The green line represents the IoU score for the validation set, while the red line indicates the IoU score for the training set. (B) ResU-Net loss diagram. The green line represents the loss for the validation set, while the red line indicates the loss for the training set. (C) ResU-Net also performs well in deliberately prepared images with severe noise. from left to right, mixed with other embryos in the frame, focus issues, presence of bubbles around the embryo, and presence of tissue debris around the embryo. The top row shows the original images, whereas the bottom row displays the processed results.
2.1.2. ResNet
ResNet was employed to predict the embryo stages from the time-lapse images denoised by ResU-Net.
70% of each label was randomly selected as training data, and the remaining 30% for validation. The ResNet model achieved recall (sensitivity) of 96.87%, precision (positive predictive value) of 96.93%, and F1-score of 96.83%. The overall classification accuracy reached 96.86% (Table 2, Figure 3A).
Grad-CAM heatmap analysis confirmed that the model captured the key features of each embryonic stage, particularly of the outline at the embryo’s boundary (Figure 3B). Uniform Manifold Approximation and Projection (UMAP) visualization demonstrated that the model effectively separated the different embryonic stages in the feature space. Notably, the spatial arrangement of the stages was not random in UMAP projection, but rather followed a trajectory consistent with C. elegans embryonic development (Figure 3C).
2.2. Analysis of Temporal Prediction Accuracy in Time-Lapse Data
To construct the timeline of embryonic epidermal development, denoised time-lapse images were input into ResNet. The predicted probabilities for each developmental stage were then plotted over time, with each stage visualized using a distinct color, to show the dynamic progression.
Given that worm epidermal development follows a fixed developmental process, any insertion of differently colored points within a continuous period of a single color in the predicted timeline was considered a misclassification (Figure 4A). In this study, among the 16 time-lapse datasets in the control group, only 1 misclassified image was found out of a total of 681 images. In the RNAi group, 7 misclassified images were identified among 1465 images from 30 time-lapse datasets. Moreover, neither the control group nor the RNAi group showed continuous insertion of differently colored points within a single stage’s duration (i.e., no consecutive misclassification was detected) (Table 3). These misclassified points were considered as the corresponding correct embryonic stage when calculating the duration of each stage in the subsequent analysis.
Additionally, epidermal development is a continuous process, with a transition period between two adjacent stages. Our current method revealed two pattern types during the transition period. In the first type, oscillations were observed between the two embryonic stages (Figure 4B). In the second type, two stages were mixed with a 40-60% probability (Figure 4C).
2.3. Analysis of Embryonic Stage Durations in Control (RNAi) Time-Lapse Data
To calculate the time required for each stage, the misclassification images were manually corrected based on their positions relative to the preceding and subsequent embryonic stages. Subsequently, the duration of each embryonic stage was calculated. The average durations for the dorsal intercalation, ventral enclosure, rotation, 1.5-fold, and 2-fold were 53.74 ± 1.85 min, 28.43 ± 2.02 min, 15.93 ± 1.38 min, 20.93 ± 1.04 min, 10.62 ± 0.89 min. Additionally, the duration of all transition periods from dorsal intercalation to the 2-fold stage was mostly stable at around 5 min (Figure 5, Table 4).
2.4. Application in RNAi Knockdown Time-Lapse Data
To assess the applicability of our approach to gene function analysis, we used our pipeline to predict embryonic stages of RNAi animals and analyzed performance of timeline predictions. We selected three genes, leo-1, ajm-1, and tes-1 to test our model. LEO-1, a component of PAF1 complex (PAF1C), is involved in cell localization and cell shape [28]. In contrast, AJM-1, localized at the epidermal apical junctions, is involved in the elongation stages of epidermal development [29]. TES-1 is involved in epidermal elongation from the 2-fold stage through its interaction with the cell junction protein, HMP-1 [30].
Ten time-lapse datasets were analyzed for each RNAi-knockdown embryo to characterize gene function. In total, 541, 467, and 457 images were obtained from leo-1(RNAi), ajm-1(RNAi), and tes-1(RNAi) animals, respectively.
Next, after manually correcting the misclassifications, the average duration of each RNAi-treated embryonic stage was calculated to evaluate the potential of the proposed approach for temporal gene function analysis. Additionally, owing to the effects of gene knockdown on embryos, a few instances of highly unstable predicted timelines were observed within the RNAi group (The calculation example of the duration of each embryonic stage in some unstable timelines; Supplementary Materials).
The results for the developmental stages of each RNAi strain are listed in Table 4. Compared to the control(RNAi), the leo-1(RNAi) exhibited marked developmental delays in the dorsal intercalation stage (delayed by 20.00%; p < 0.05), ventral enclosure stage (delayed by 56.53%; p < 0.001), and rotation stages (delayed by 44.11%; p < 0.01) (Figure 6A,B,C). In contrast, developmental delay was not observed in the 1.5-fold and 2-fold stages. This marked developmental delay of the early epidermal stages is indicative of LEO-1 as a component of PAF1C and its involvement in early epidermal development.
Compared to the control(RNAi), the ajm-1(RNAi) exhibited marked developmental delays in the elongation period: 1.5-fold stage (delayed by 31.40%; p < 0.01) and 2-fold stage (delayed by 50.66%; p < 0.01) (Figure 6D,E). In contrast, developmental delays were not observed in early epidermal developmental stages. These results are consistent with a previous report stating that AJM-1 is required for the correct rate and completion of elongation in the C. elegans embryo.
Compared to the control(RNAi), the tes-1(RNAi) exhibited marked developmental delays only in the 2-fold stage (delayed by 93.06%, p < 0.0001) (Figure 6E). This result confirms a previous report documenting that TES-1 is recruited to junctions in cells that generate sufficient tension to elongate to the 2-fold stage.
We also analyzed and compared the duration of all transition periods from dorsal intercalation to the 2-fold stage within the generated timeline but did not observe any significant developmental delay.
3. Discussion
In this study, we proposed a deep learning-based approach for analyzing C. elegans epidermal morphogenesis. Unlike traditional approaches that focus on defective phenotypes, our approach for gene function analysis focused on the time required for completion of each developmental stage.
3.1. Deep Learning-Based Diagnostic Tool for Temporal Analysis
We implemented a new diagnostic approach for epidermal morphogenesis. Two classic deep learning models were used. First, we used ResU-Net to process the raw images. Next, we continuously predicted the stage from time-lapse images using ResNet. The time required for each stage completion was then calculated.
What sets our approach apart is the way these two models were integrated. By using ResU-Net for denoising, we retained only the pixel values corresponding to regions of interest, thereby enabling the subsequent stage prediction to focus more specifically on the meaningful areas of the image. This design also highlights the potential applicability of our method to other types of noisy microscopy images or other medical images, as it identifies and separates important regions in advance.
For ResNet, softmax function’s ability to assign probabilities to classification labels was used to dynamically visualize the embryonic development process and transitional periods. Furthermore, the UMAP projection of the predicted labels after training showed that the classified stages clustered sequentially along the correct embryonic developmental trajectory rather than being randomly distributed, indicating that the model had learned semantically meaningful features aligned with the temporal progression of morphogenesis.
3.2. Calculations of Time Required for Each Stage in Control(RNAi) Group
In this study, we defined the strict 0-min time point at the 2-cell stage of the embryo. Time-lapse images were then captured every 5 min, starting from 150 min, until the completion of the 2-fold stage. Using time as the horizontal axis and the predicted probability of each stage as the vertical axis, we created a timeline from the dorsal intercalation stage to the 2-fold stage, with different colors representing each stage. By measuring the duration of different colored segments in the predicted timeline, we were able to estimate the duration of each embryonic stage.
Although the current approach occasionally misclassified individual images within the entire time-lapse dataset, the fixed epidermal development process made such errors easily identifiable. For example, misclassified images appeared as isolated points of a different color within a continuous segment on the predicted timeline, making them visually distinguishable. Therefore, when images were misclassified (i.e., appeared as a different stage within a segment of a single predicted color on the timeline) they were assigned to the corresponding embryonic stage for the purpose of calculating the duration of each stage.
During the model training phase, no specific constraints were imposed on embryo orientation. As a result, when applying the model to actual time-lapse data, the method could process images unrestrictedly as long as the entire embryo fit within the 256×256 pixels frame. In the control(RNAi) group, the standard error of the mean for each stage was within 2 min, indicating low variability in our measurements. However, the measurement of duration for the dorsal intercalation and ventral enclosure stages showed greater individual variability compared to later stages. This variability might be due to the embryos within the eggshell not aligning their ventral or dorsal side toward the microscope, or to some embryos being positioned at an angle to the eggshell. This could introduce inconsistency in the duration measurements during these stages. Further analyses with angle correction may improve measurement accuracy in future studies.
3.3. Trial to Temporal Analysis of the Gene Function in RNAi Knockdown Animals
This study employed a diagnostic approach that applies computer vision to analyze temporal patterns. Specifically, it divided epidermal morphogenesis into five stages and calculated the duration of each stage. Using this method, we detected developmental delays in three selected genes at specific embryonic stage, clarifying the stages of epidermal development to which each gene specifically contributed.
In the analysis of leo-1(RNAi) animals, developmental delays were observed in three early embryonic stages: dorsal intercalation: (delayed by 20.00%), ventral enclosure (delayed by 56.53%), rotation (delayed by 44.11%). No delays were detected at the 1.5-fold and 2-fold stages. This suggests that leo-1 was primarily involved in early epidermal development and did not contribute substantially to later stages. leo-1, as a component of the PAF1C complex, collaborated with the other four components to regulate cell migration and cell positioning, which are critical for epidermal development [28]. In the current study, the delays observed from the dorsal intercalation to the rotation stage in leo-1(RNAi) animals likely resulted from reduced LEO-1 expression in early epidermal development, impairing the timely progression of normal cell migration and positioning. Since no delays were observed at the 1.5-fold and 2-fold stages, it is hypothesized that the reduced leo-1 expression permitted cell positioning to proceed with delays but without major disruption. Consequently, late-stage epidermal development could proceed on schedule. This further suggests that leo-1 had weak or no contribution to later stages of epidermal development.
In the analysis of ajm-1(RNAi) animals, developmental delays were observed at two late embryonic stages: 1.5-fold (delayed by 31.40%) and 2-fold (delayed by 50.66%). No delays were detected from dorsal intercalation to the rotation stage. This suggests that ajm-1 contributed primarily during the elongation phase of late epidermal development, with minimal involvement in earlier stages. ajm-1 is essential for the integrity of epithelial junctions and embryonic elongation [29]. Our temporally detailed analysis is consistent with these findings. Although previous research reported developmental delays in ajm-1 embryos [29], the reported timing spanned a broad period from enclosure to the 2-fold stage. Using our approach, we clarified that delays specifically occurred at the 1.5-fold and 2-fold stages, providing complementary insights into previous findings.
In the analysis of tes-1(RNAi) animals, developmental delays were observed only at the 2-fold stage (delayed by 93.06%). This suggests that tes-1 played a specific role in embryonic elongation starting from the 2-fold stage, with minimal contribution to early epidermal development and the elongation process prior to the 2-fold stage. tes-1 localizes to junctions in a tension-dependent manner from the 2-fold stage, stabilizing the junctional actin cytoskeleton during embryonic morphogenesis [30]. Therefore, the observed 2-fold stage delay in tes-1(RNAi) animals likely reflects the critical role of tes-1 in maintaining cell–cell contacts necessary for subsequent embryonic elongation. Our findings confirm previous studies and provide new insights based on a different analytical approach.
3.4. Contributions and Limitations of the Current Approach
The proposed approach successfully diagnoses the specific developmental stages to which the three genes contributed to embryonic epidermal development. Using this approach, genes identified through a genome-wide RNAi screen can be further analyzed to determine their specific contributions to developmental progression. This is particularly relevant for genes where development timing as demonstrated with tes-1(RNAi) in this study, needs to be considered. By applying this approach to a secondary screening using C. elegans homologs of genes associated with epidermal-related diseases or developmental delay in other model organisms, it could serve as a complementary analytical approach to existing methods.
Furthermore, this approach holds potential for detecting certain developmental abnormality related diseases that arise during embryogenesis but remain undetected by conventional methods. In contrast to traditional studies that primarily focus on postnatal pathogenesis [31], our method emphasizes early screening, when subtle developmental defects occur.
However, the current approach exhibits instability during the transition period, where two distinct patterns were observed. This may be because transition periods exhibit characteristics of mixed stages, and the model has not been specifically trained to recognize these periods, leading to uncertainty in predictions. While misclassifications occasionally occurred during the non-transition period, they can be corrected after considering the temporal context. Nevertheless, the model is not yet fully reliable and further optimization is required to improve its accuracy and reliability.
Another limitation is that the current approach produced several unstable timelines when predicting time-lapse data from the RNAi group. We suspect that this instability arose because the model detected subtle defects in the embryos following RNAi treatment that are often imperceptible to the human eye. Exploring how deep learning can further leverage its ability to discern these subtle defects and uncover their underlying causes could be intriguing for future research.
4. Materials and Methods
4.1. Caenorhabditis Elegans Strains
C. elegans strains used in this study were derived from the wild-type Bristol strain N2 [32]. SU93: jcls1[ajm-1::GFP] was obtained from the Caenorhabditis Genetics Center (CGC). SU93 was used to characterize various stages of epidermal development but was not used for training and timeline prediction experiments. All strains were cultured at 20°C on Nematode Growth Medium plates with Escherichia coli OP50 as the food source.
4.2. RNA Interference Assay
The RNAi assay was performed as previously described [33]. The leo-1(RNAi) cells were a gift from a previous study [34]. To construct the RNAi vectors, total RNA was extracted from C. elegans using the RNeasy Mini Kit (QIAGEN, Germany) and RNase-Free DNase Set (QIAGEN, Germany) to eliminate genomic DNA contamination. Complementary DNA (cDNA) was subsequently synthesized using the PrimeScript 1st Strand cDNA Synthesis Kit (Takara, RR037A, Japan). Full-length tes-1, elt-1, lin-26, and let-413 cDNA, and 978bp ajm-1 (1st-978th coding region) were amplified from this library and inserted into the L4440 vector. The vector was then transformed into E. coli HT115 (DE3) cells. The control group utilized the L4440 vector that was transformed into HT115 cells without any cDNA insertion. To ensure that worms subjected to RNAi were stage-synchronized, L1 worms were first transferred to a new plate with OP50 and cultured at 20°C for 24 h. Next, two to three healthy worms were randomly selected and transferred to RNAi feeding plated and cultured at 20°C for 24 h with HT115.
4.3. Epidermal Morphogenesis Stages
The epidermal morphogenesis of C. elegans embryos was divided into six distinct stages (“before intercalation,” “dorsal intercalation,” “ventral enclosure,” “rotation,” “1.5-fold,” and “2-fold”) from the mid-embryo gastrulation stage to the early elongation phase. Before collecting the training data, the specific characteristics of these stages were identified using strain SU93: jcls1[ajm-1::GFP] (see Supplementary Materials S1).
4.3.1. Before Intercalation
In this stage, the cells on the dorsal side of the embryo had not yet specialized into epidermal cells; therefore, many undifferentiated cells were observed (see Supplementary Materials S1). The correlation between this stage and epidermal development is weak. Although this stage is included in the timeline prediction, it is excluded from the subsequent comparative analysis of the time required for each embryonic stage due to its weak relevance.
4.3.2. Dorsal Intercalation
By adjusting the focus, the insertion of epidermal cells on the dorsal side was observed in this stage [2,35] (see Supplementary Materials S1).
4.3.3. Ventral Enclosure
By adjusting the focus, the ventral pocket on the ventral side of the embryo was observed [2] (see Supplementary Materials S1).
4.3.4. Rotation
In most research, this period of embryogenesis is referred to as the "comma" stage owing to the comma-like shape of the embryo. However, after epidermal cells enclose the entire posterior portion of the embryo, an imbalance along the anteroposterior axis causes the embryo to rotate within the egg [2]. Therefore, we abandoned the use of the term "comma" for this stage and used "rotation" instead. This terminology aligns with the focus on the dynamic changes in the embryo.
4.3.5. 1.5-Fold and 2-Fold
In these two stages, the elongation of the embryo was quantified by observing its fold length; if the tail had elongated to align with the head, the embryo was considered to be at the 2-fold stage; otherwise, it was classified as 1.5-fold.
The embryo is considered to have completed the 2-fold stage when the worm’s head had overlapped the tail due to elongation, or conversely, if the tail has overlapped the head. The collection of time-lapse images is concluded once this stage is observed.
4.4. Microscope and Image Acquisition
A DIC Olympus BX63 microscope with a UPlanXApo X40 NA 0.95 objective lens was used to capture images of embryos (Olympus, Japan). The microscope system was operated using in-house CellSens Dimension 3.1 software (Olympus, Japan). Images were saved in the JPEG format at a resolution of 256×256 pixels. Automatic exposure was set for each image acquisition. The experimental environmental temperature was maintained at 23°C.
The worms were dissected onto a coverslip with 2 μL of M9 buffer and mounted on glass slides with 3% agarose pads. All images were taken with the DIC microscope focused on the clearest dimension of the egg; however, no specific requirements were placed on embryo orientation (e.g., front, back, or angled) as long as the entire embryo fitted within the 256×256-pixel frame.
Time-lapse imaging was used to predict the developmental timeline of embryos and was not included in the training of the deep learning models. First, a Vaseline ring was applied around the coverslip to retain moisture facilitating long-term observation. To ensure accuracy, the timeline was initialized (0 min) after the first cleavage [36]. when the AB cell attained round shape and the P1 cell was compressed into a crescent shape (see Supplementary Materials S2), thus minimizing timing errors. Images were collected at 5-min intervals using the 40x objective lens, with an axial (z) resolution of 0.8 μm. At each time point, the clearest image of the egg was selected from a series of images captured along the z-axis. Data collection began at 150 min focusing on the epidermal development phase and to avoid unnecessary computational overhead. Imaging was continued until the end of the 2-fold stage or until 500 min for embryos exhibiting developmental defects, ensuring sufficient observation of both defective and delayed development.
4.5. Models Training and Evaluation
4.5.1. ResU-Net
The segmentation model used in this study was a modified U-Net [25,26]architecture, referred to here as a ResU-Net, which integrates residual connections into both the encoder and decoder blocks, thereby improving gradient flow and training stability. The model takes single-channel grayscale images of size 256×256 pixels as input. Each encoder and decoder stage consists of two residual blocks, with each block comprising two 3×3 convolutional layers, followed by batch normalization and ReLU activation. Max pooling layers were employed for spatial downsampling, and transposed convolutions were used for upsampling. Skip connections were applied between corresponding encoder and decoder layers to preserve spatial information. The number of feature maps doubled after each downsampling and halved during upsampling. A final 1×1 convolution layer was used to project the output to a single-channel segmentation mask (Figure 7).
ResU-Net was implemented in PyTorch (v2.0.0) and trained for 80 epochs with a batch size of 20. The Adam optimizer was used with a learning rate of 0.002 and a dropout rate of 0.2. As the task was binary segmentation (embryo vs. background), the loss function used was BCEWithLogitsLoss, which combines a sigmoid layer and the binary cross-entropy loss in a numerically stable formulation.
where represents the number of samples; represents the th true tensor of the sample; represents the th predicted tensor of sample.
All input images were converted to single-channel grayscale images (via torchvision.transforms). The corresponding ground truth segmentation masks were annotated using LabelMe (v5.1.1), where the embryo’s outer contours (eggshell) were manually outlined to generate binary masks. The dataset was randomly split into training and validation sets with an 80:20 ratio. During training, model performance was evaluated the Intersection over Union (IoU) metric. The best-performing model was selected based on the highest validation IoU.
where represents the number of samples; represents the th true tensor of the sample; represents the predicted binary mask obtained by thresholding the model raw output, the binarization corresponds to applying a threshold of 0.5 to the sigmoid output .
4.5.2. ResNet
The classification model was based on ResNet-18 [27]. from torchvison (v0.15.0). The input images were 256×256 pixels single-channel grayscale images obtained from the ResU-Net. The classification task involved six distinct developmental stages of the embryo, with 400 labeled images per stage, yielding a total of 2,400 annotated images. Each image corresponded to a precisely staged embryo (Figure 8).
The model was trained from scratch without using any pretrained weights. Training was performed using the CrossEntropyLoss function and optimized with the Adam optimizer. A step learning rate scheduler (StepLR) was applied, reducing the learning rate by a factor of 0.5 every 10 epochs to facilitate convergence. Training was conducted for 80 epochs. Model performance was evaluated using classification accuracy on the validation set.
4.6. Timeline
To obtain a timeline of embryonic epidermal development, the two deep learning architectures were integrated. First, the segmentation network processed the selected time-lapse images. The output of the segmentation network assigned a tensor value of 1 to the embryo (within the egg) and 0 to the background. By multiplying the predicted tensor (segmented result) with the input tensor (original image), a processed image was generated, retaining only the pixel values of the embryonic part (Figure 9). Because only the embryonic part of the processed image retained the pixel values, the classification network in the next phase focused on the features of the embryonic region.
The processed images were then passed to the classification network, which predicted the probability of each labeled developmental stage from the softmax layer. Finally, the predicted probabilities were plotted on the Y-axis and the embryonic development time was plotted on the X-axis. This produced a dynamic timeline where embryonic epidermal development was visualized in chronological order (Figure 10).
where represents the parameters of th avgpool; denotes the number of labels.
4.7. Image Interpretability Analysis
4.7.1. Grad-CAM
Gradient-weighted class activation mapping (Grad-CAM) was used to verify the accuracy of image predictions. Briefly, this technique verified that the deep learning network had focused on the relevant regions of the embryo during prediction. Grad-CAM highlights the important features in an image by analyzing the gradients flowing into the last convolutional layer, thus generating an activation map that identifies the most discriminative areas contributing to the classification decision.
4.7.2. UMAP
UMAP was used the distribution of semantic features. The ResNet model was first trained on the image dataset, and semantic features were extracted from the output of the AvgPool layer of each validation image using the create_feature_extractor function from torchvision (v0.15.0). These high-dimensional features were then projected into a two-dimensional space using UMAP with Euclidean distance as the metric. The resulting UMAP embedding provided an interpretable visualization of how images were distributed in the feature space, reflecting the temporal progression learned by the model.
5. Conclusions
In this study, a deep learning-based diagnostic approach was developed to evaluate and analyze the temporal perspective of C. elegans epidermal morphogenesis. We aimed to address the gap generated in traditional methods, which often overlook the importance of temporal aspects during development, particularly in cases where the inactivation of certain genes does not result in apparent phenotypic defects. Temporal analysis indicated stage-specific delays in embryonic development, emphasizing the importance of developmental timing as a critical parameter when analyzing epidermal morphogenesis and providing a new perspective for studying developmental processes.
Despite some limitations, the current study undoubtedly augments traditional methods and plays an important role in epidermal morphogenesis research. Moreover, it offers unique temporal insights and provides an accessible and cost-effective tool for studying morphogenesis and developmental timing. This strategy may also have broad applications in other image-based studies of morphogenesis, such as embryogenesis in various organisms or early diagnosis of developmental disorders that are not readily apparent during embryogenesis.
Supplementary Materials
The following supporting information can be downloaded at the website of this paper posted on Preprints.org.
Author Contributions
Conceptualization, F.L.; methodology, F.L.; software, F.L.; validation, F.L., P.L.; formal analysis, F.L., P.L.; investigation, F.L.; resources, F.L., M.O. and L.K.C.; data curation, F.L. and P.L.; writing—original draft preparation, F.L.; writing—review and editing, L.K.C., Y.K., and M.I.; supervision, Y.K. and M.I.; project administration, Y.K. and M.I. All authors have read and agreed to the published version of the manuscript.
Data Availability Statement
All programs and data used in this study are publicly available on GitHub (https://github.com/Fangzheng-py/worm_0.git).
Acknowledgments
Authors thank all members of the Information Biology Laboratory for their support and discussions.
Conflicts of Interest
The authors declare no conflicts of interest.
References
- Vuong-Brender, T.T.K.; Yang, X.; Labouesse, M.C. Elegans Embryonic Morphogenesis. In Current Topics in Developmental Biology; Wassarman, P.M., Ed.; Essays on Developmental Biology, Part A; Academic Press, 2016; Vol. 116, pp. 597–616.
- Chisholm, A.D.; Hardin, J. Epidermal morphogenesis. In WormBook: The Online Review of C. elegans Biology [Internet]; WormBook, 2005.
- Apfeld, J.; Alper, S. What Can We Learn About Human Disease from the Nematode C. Elegans. In Disease Gene Identification: Methods and Protocols; DiStefano, J.K., Ed.; Springer: New York, NY, 2018; ISBN 978-1-4939-7471-9. [Google Scholar]
- Sulston, J.E.; Schierenberg, E.; White, J.G.; Thomson, J.N. The Embryonic Cell Lineage of the Nematode Caenorhabditis Elegans. Developmental Biology 1983, 100, 64–119. [Google Scholar] [CrossRef] [PubMed]
- Fire, A.; Xu, S.; Montgomery, M.K.; Kostas, S.A.; Driver, S.E.; Mello, C.C. Potent and Specific Genetic Interference by Double-Stranded RNA in Caenorhabditis Elegans. Nature 1998, 391, 806–811. [Google Scholar] [CrossRef] [PubMed]
- Gönczy, P.; Echeverri, C.; Oegema, K.; Coulson, A.; Jones, S.J.; Copley, R.R.; Duperon, J.; Oegema, J.; Brehm, M.; Cassin, E.; et al. Functional Genomic Analysis of Cell Division in C. Elegans Using RNAi of Genes on Chromosome III. Nature 2000, 408, 331–336. [Google Scholar] [CrossRef]
- Fraser, A.G.; Kamath, R.S.; Zipperlen, P.; Martinez-Campos, M.; Sohrmann, M.; Ahringer, J. Functional Genomic Analysis of C. Elegans Chromosome I by Systematic RNA Interference. Nature 2000, 408, 325–330. [Google Scholar] [CrossRef] [PubMed]
- Williams-Masson, E.M.; Malik, A.N.; Hardin, J. An Actin-Mediated Two-Step Mechanism Is Required for Ventral Enclosure of the C. Elegans Hypodermis. Development 1997, 124, 2889–2901. [Google Scholar] [CrossRef]
- Quintin, S.; Michaux, G.; McMahon, L.; Gansmuller, A.; Labouesse, M. The Caenorhabditis Elegans Gene Lin-26 Can Trigger Epithelial Differentiation without Conferring Tissue Specificity. Dev Biol 2001, 235, 410–421. [Google Scholar] [CrossRef]
- Labouesse, M.; Sookhareea, S.; Horvitz, H.R. The Caenorhabditis Elegans Gene Lin-26 Is Required to Specify the Fates of Hypodermal Cells and Encodes a Presumptive Zinc-Finger Transcription Factor. Development 1994, 120, 2359–2368. [Google Scholar] [CrossRef]
- Pettitt, J.; Cox, E.A.; Broadbent, I.D.; Flett, A.; Hardin, J. The Caenorhabditis Elegans P120 Catenin Homologue, JAC-1, Modulates Cadherin-Catenin Function during Epidermal Morphogenesis. J Cell Biol 2003, 162, 15–22. [Google Scholar] [CrossRef]
- George, S.E.; Simokat, K.; Hardin, J.; Chisholm, A.D. The VAB-1 Eph Receptor Tyrosine Kinase Functions in Neural and Epithelial Morphogenesis in C. Elegans. Cell 1998, 92, 633–643. [Google Scholar] [CrossRef]
- Meeuse, M.W.; Hauser, Y.P.; Morales Moya, L.J.; Hendriks, G.; Eglinger, J.; Bogaarts, G.; Tsiairis, C.; Großhans, H. Developmental Function and State Transitions of a Gene Expression Oscillator in Caenorhabditis Elegans. Mol Syst Biol 2020, 16, e9975. [Google Scholar] [CrossRef]
- Green, R.A.; Khaliullin, R.N.; Zhao, Z.; Ochoa, S.D.; Hendel, J.M.; Chow, T.-L.; Moon, H.; Biggs, R.J.; Desai, A.; Oegema, K. Automated Profiling of Gene Function during Embryonic Development. Cell 2024, 187, 3141–3160.e23. [Google Scholar] [CrossRef] [PubMed]
- Shaikh, M.A.; Al-Rawashdeh, H.S.; Sait, A.R.W. A Review of Artificial Intelligence-Based Down Syndrome Detection Techniques. Life 2025, 15, 390. [Google Scholar] [CrossRef] [PubMed]
- Chang, C.-H.; Lin, C.-H.; Lane, H.-Y. Machine Learning and Novel Biomarkers for the Diagnosis of Alzheimer’s Disease. Int J Mol Sci 2021, 22, 2761. [Google Scholar] [CrossRef]
- Lin, E.; Lin, C.-H.; Lane, H.-Y. Deep Learning with Neuroimaging and Genomics in Alzheimer’s Disease. Int J Mol Sci 2021, 22, 7911. [Google Scholar] [CrossRef]
- Song, Y.; Zheng, S.; Li, L.; Zhang, X.; Zhang, X.; Huang, Z.; Chen, J.; Wang, R.; Zhao, H.; Chong, Y.; et al. Deep Learning Enables Accurate Diagnosis of Novel Coronavirus (COVID-19) With CT Images. IEEE/ACM Trans Comput Biol Bioinform 2021, 18, 2775–2780. [Google Scholar] [CrossRef]
- Reddy, P.; J, A. Diagnosis of Autism in Children Using Deep Learning Techniques by Analyzing Facial Features. Engineering Proceedings 2024, 59, 198. [Google Scholar] [CrossRef]
- Azuma, Y.; Okada, H.; Onami, S. Systematic Analysis of Cell Morphodynamics in C. Elegans Early Embryogenesis. Front Bioinform 2023, 3, 1082531. [Google Scholar] [CrossRef]
- Zhang, J.; Liu, S.; Yuan, H.; Yong, R.; Duan, S.; Li, Y.; Spencer, J.; Lim, E.G.; Yu, L.; Song, P. Deep Learning for Microfluidic-Assisted Caenorhabditis Elegans Multi-Parameter Identification Using YOLOv7. Micromachines (Basel) 2023, 14, 1339. [Google Scholar] [CrossRef]
- Bates, K.; Le, K.N.; Lu, H. Deep Learning for Robust and Flexible Tracking in Behavioral Studies for C. Elegans. PLoS Comput Biol 2022, 18, e1009942. [Google Scholar] [CrossRef]
- Toulany, N.; Morales-Navarrete, H.; Čapek, D.; Grathwohl, J.; Ünalan, M.; Müller, P. Uncovering Developmental Time and Tempo Using Deep Learning. Nat Methods 2023, 20, 2000–2010. [Google Scholar] [CrossRef]
- Pan, Y.; Huang, Z.; Cai, H.; Li, Z.; Zhu, J.; Wu, D.; Xu, W.; Qiu, H.; Zhang, N.; Li, G.; et al. WormCNN-Assisted Establishment and Analysis of Glycation Stress Models in C. Elegans: Insights into Disease and Healthy Aging. Int J Mol Sci 2024, 25, 9675. [Google Scholar] [CrossRef]
- Ronneberger, O.; Fischer, P.; Brox, T. U-Net: Convolutional Networks for Biomedical Image Segmentation 2015.
- Diakogiannis, F.I.; Waldner, F.; Caccetta, P.; Wu, C. ResUNet-a: A Deep Learning Framework for Semantic Segmentation of Remotely Sensed Data. ISPRS Journal of Photogrammetry and Remote Sensing 2020, 162, 94–114. [Google Scholar] [CrossRef]
- He, K.; Zhang, X.; Ren, S.; Sun, J. Deep Residual Learning for Image Recognition 2015.
- Kubota, Y.; Tsuyama, K.; Takabayashi, Y.; Haruta, N.; Maruyama, R.; Iida, N.; Sugimoto, A. The PAF1 Complex Is Involved in Embryonic Epidermal Morphogenesis in Caenorhabditis Elegans. Dev Biol 2014, 391, 43–53. [Google Scholar] [CrossRef] [PubMed]
- Köppen, M.; Simske, J.S.; Sims, P.A.; Firestein, B.L.; Hall, D.H.; Radice, A.D.; Rongo, C.; Hardin, J.D. Cooperative Regulation of AJM-1 Controls Junctional Integrity in Caenorhabditis Elegans Epithelia. Nat Cell Biol 2001, 3, 983–991. [Google Scholar] [CrossRef]
- Lynch, A.M.; Zhu, Y.; Lucas, B.G.; Winkelman, J.D.; Bai, K.; Martin, S.C.T.; Block, S.; Slabodnick, M.M.; Audhya, A.; Goldstein, B.; et al. TES-1/Tes and ZYX-1/Zyxin Protect Junctional Actin Networks under Tension during Epidermal Morphogenesis in the C. Elegans Embryo. Curr Biol 2022, 32, 5189–5199.e6. [Google Scholar] [CrossRef]
- Reiss, A.L. Childhood Developmental Disorders: An Academic and Clinical Convergence Point for Psychiatry, Neurology, Psychology and Pediatrics. J Child Psychol Psychiatry 2009, 50, 87–98. [Google Scholar] [CrossRef]
- Brenner, S. The Genetics of Caenorhabditis Elegans. Genetics 1974, 77, 71–94. [Google Scholar] [CrossRef]
- Maeda, I.; Kohara, Y.; Yamamoto, M.; Sugimoto, A. Large-Scale Analysis of Gene Function in Caenorhabditis Elegans by High-Throughput RNAi. Curr Biol 2001, 11, 171–176. [Google Scholar] [CrossRef]
- Kubota, Y.; Ota, N.; Takatsuka, H.; Unno, T.; Onami, S.; Sugimoto, A.; Ito, M. The PAF1 Complex Cell Autonomously Promotes Oogenesis in Caenorhabditis Elegans. Genes Cells 2022, 27, 409–420. [Google Scholar] [CrossRef]
- Hardin, J.; Serre, J.; King, R.; Walck-Shannon, E.; Reiner, D. Imaging Epidermal Cell Rearrangement in the C. Elegans Embryo. Methods Mol Biol 2022, 2438, 345–376. [Google Scholar] [CrossRef]
- Oegema, K.; Hyman, T. Cell Division. In WormBook: The Online Review of C. elegans Biology [Internet]; WormBook, 2006.
Figure 1.
Key events in Caenorhabditis elegans embryonic epidermal development process. (A) Six stages of embryonic epidermal development in C. elegans, which were predicted using deep learning models. (B) Embryos exhibiting developmental impacts temporally following RNA interference treatment. All images were processed by the ResU-Net model trained in this study.
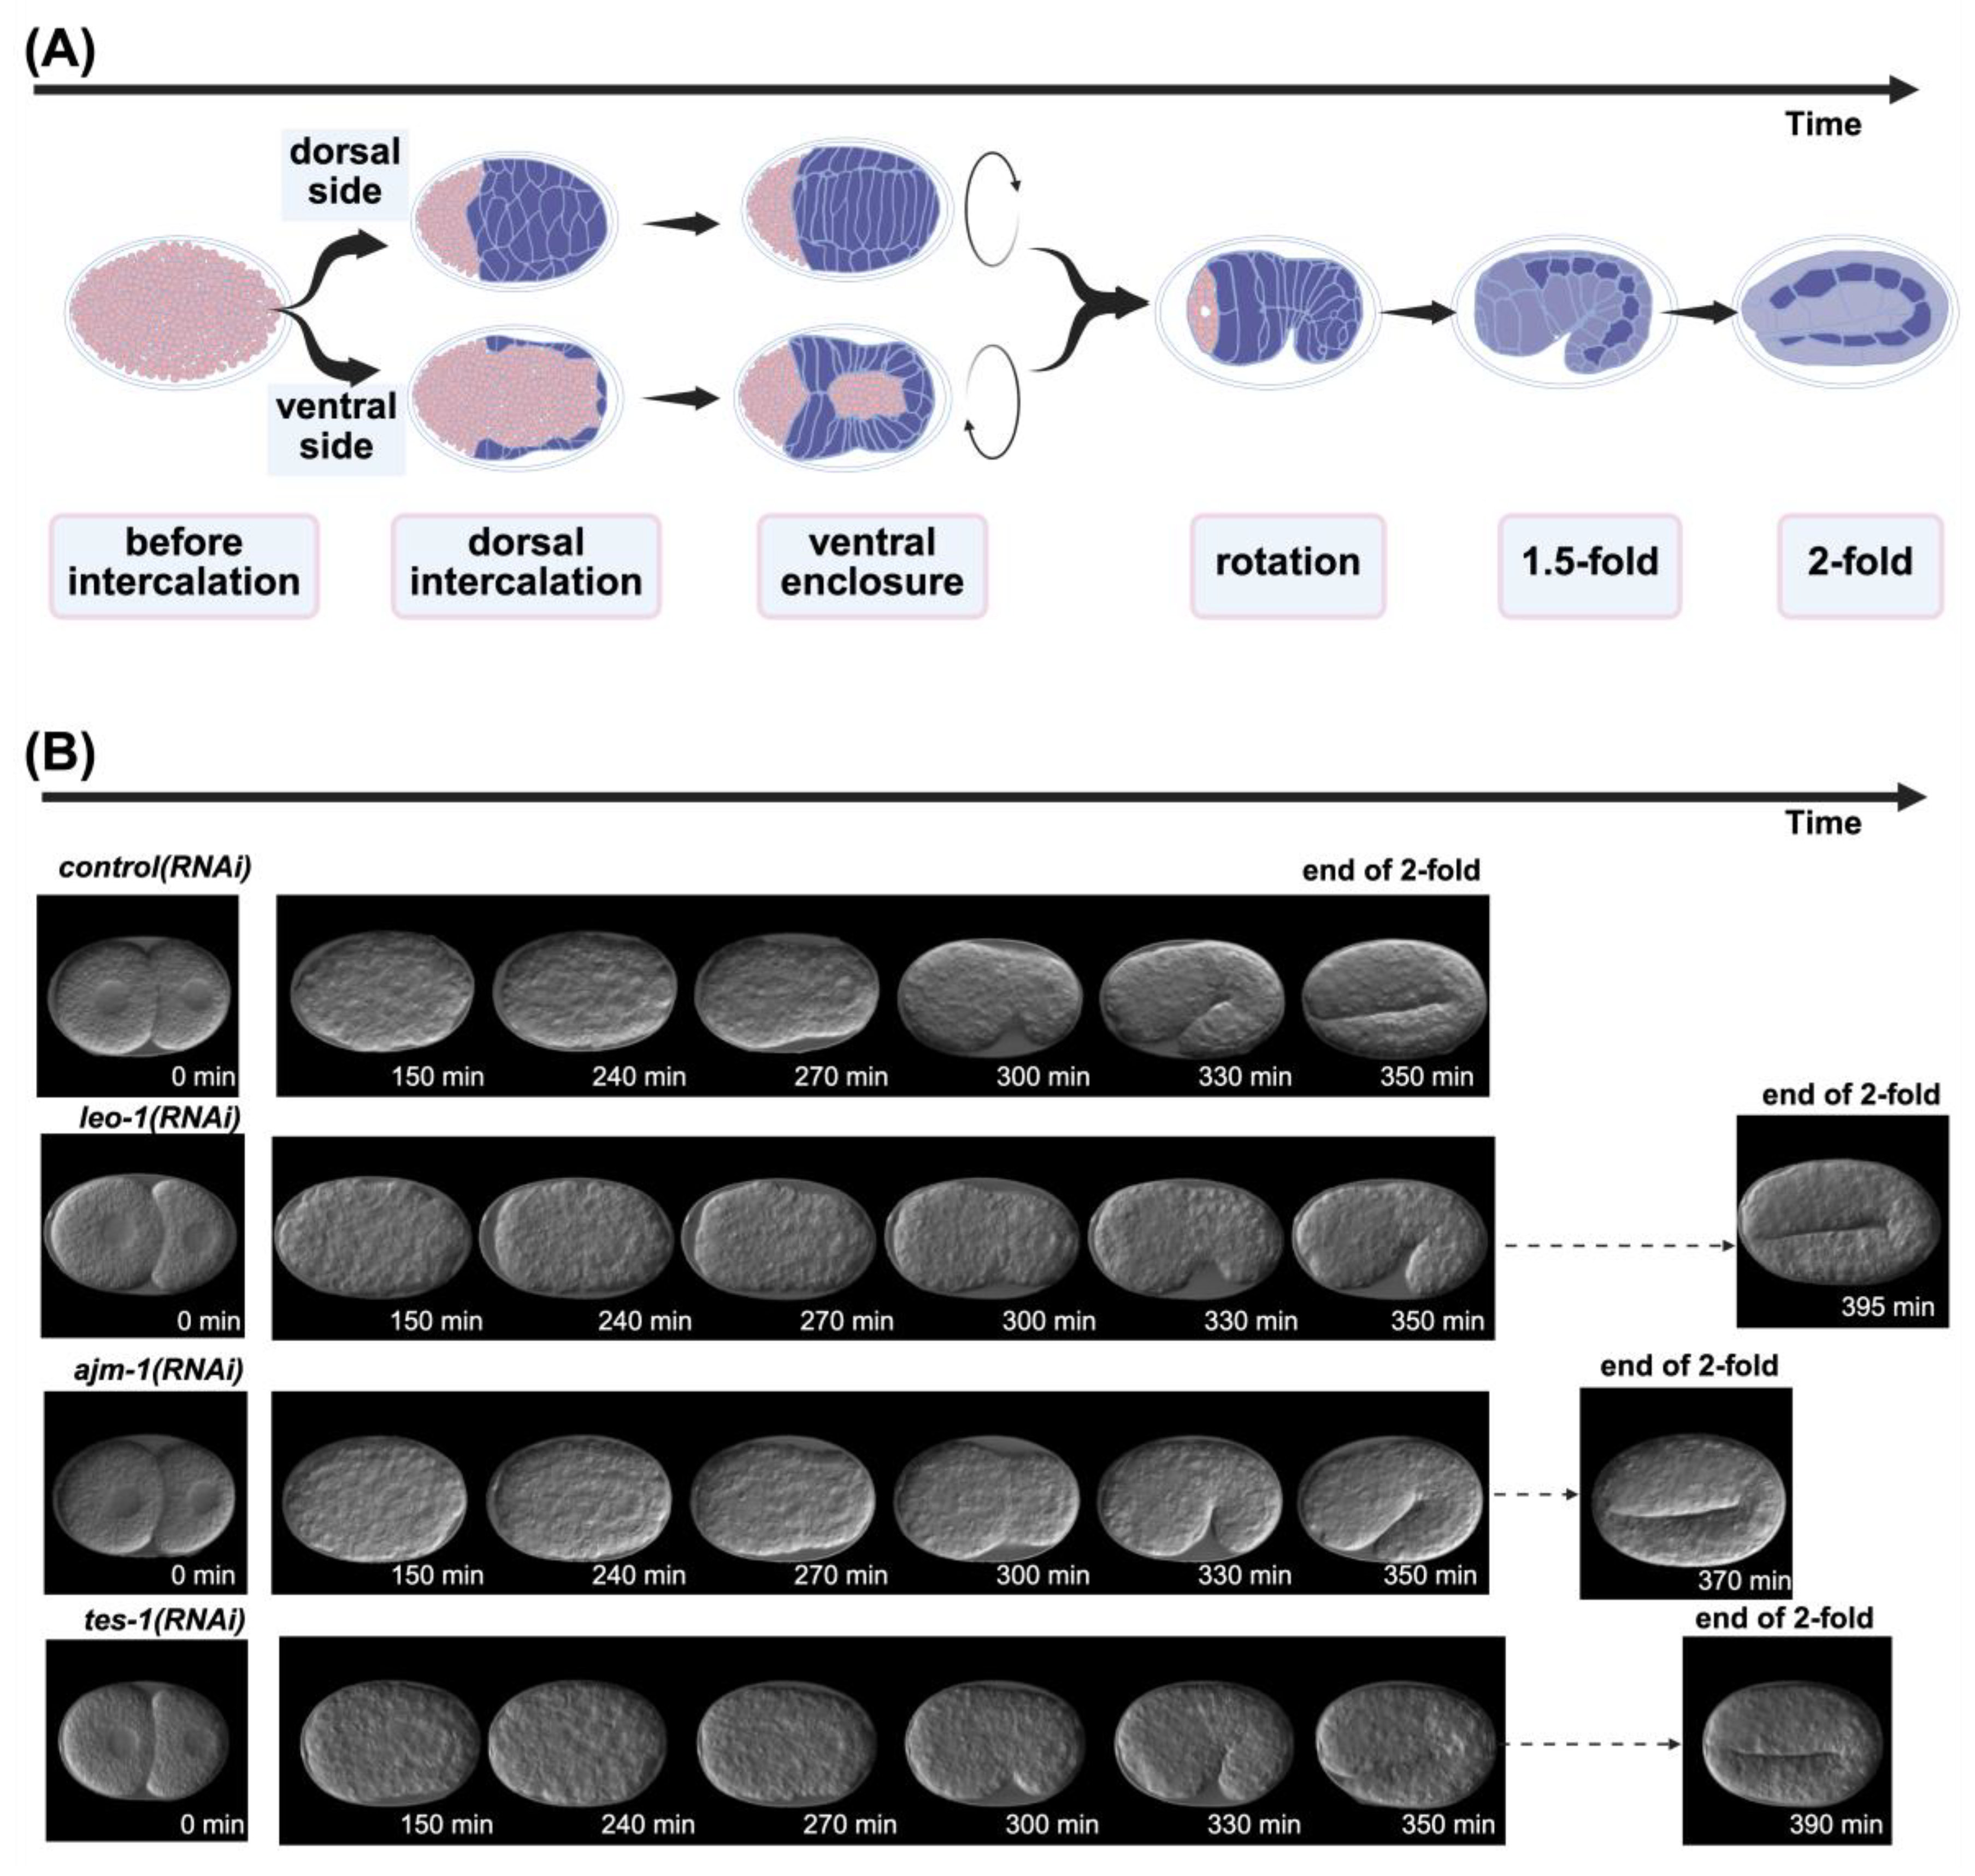
Figure 2.
ResU-Net performance diagram (A) ResU-Net IoU results diagram. The IoU scores are used to evaluate accuracy. The green line represents the IoU score for the validation set, while the red line indicates the IoU score for the training set. (B) ResU-Net loss diagram. The green line represents the loss for the validation set, while the red line indicates the loss for the training set. (C) ResU-Net also performs well in deliberately prepared images with severe noise. from left to right, mixed with other embryos in the frame, focus issues, presence of bubbles around the embryo, and presence of tissue debris around the embryo. The top row shows the original images, whereas the bottom row displays the processed results.
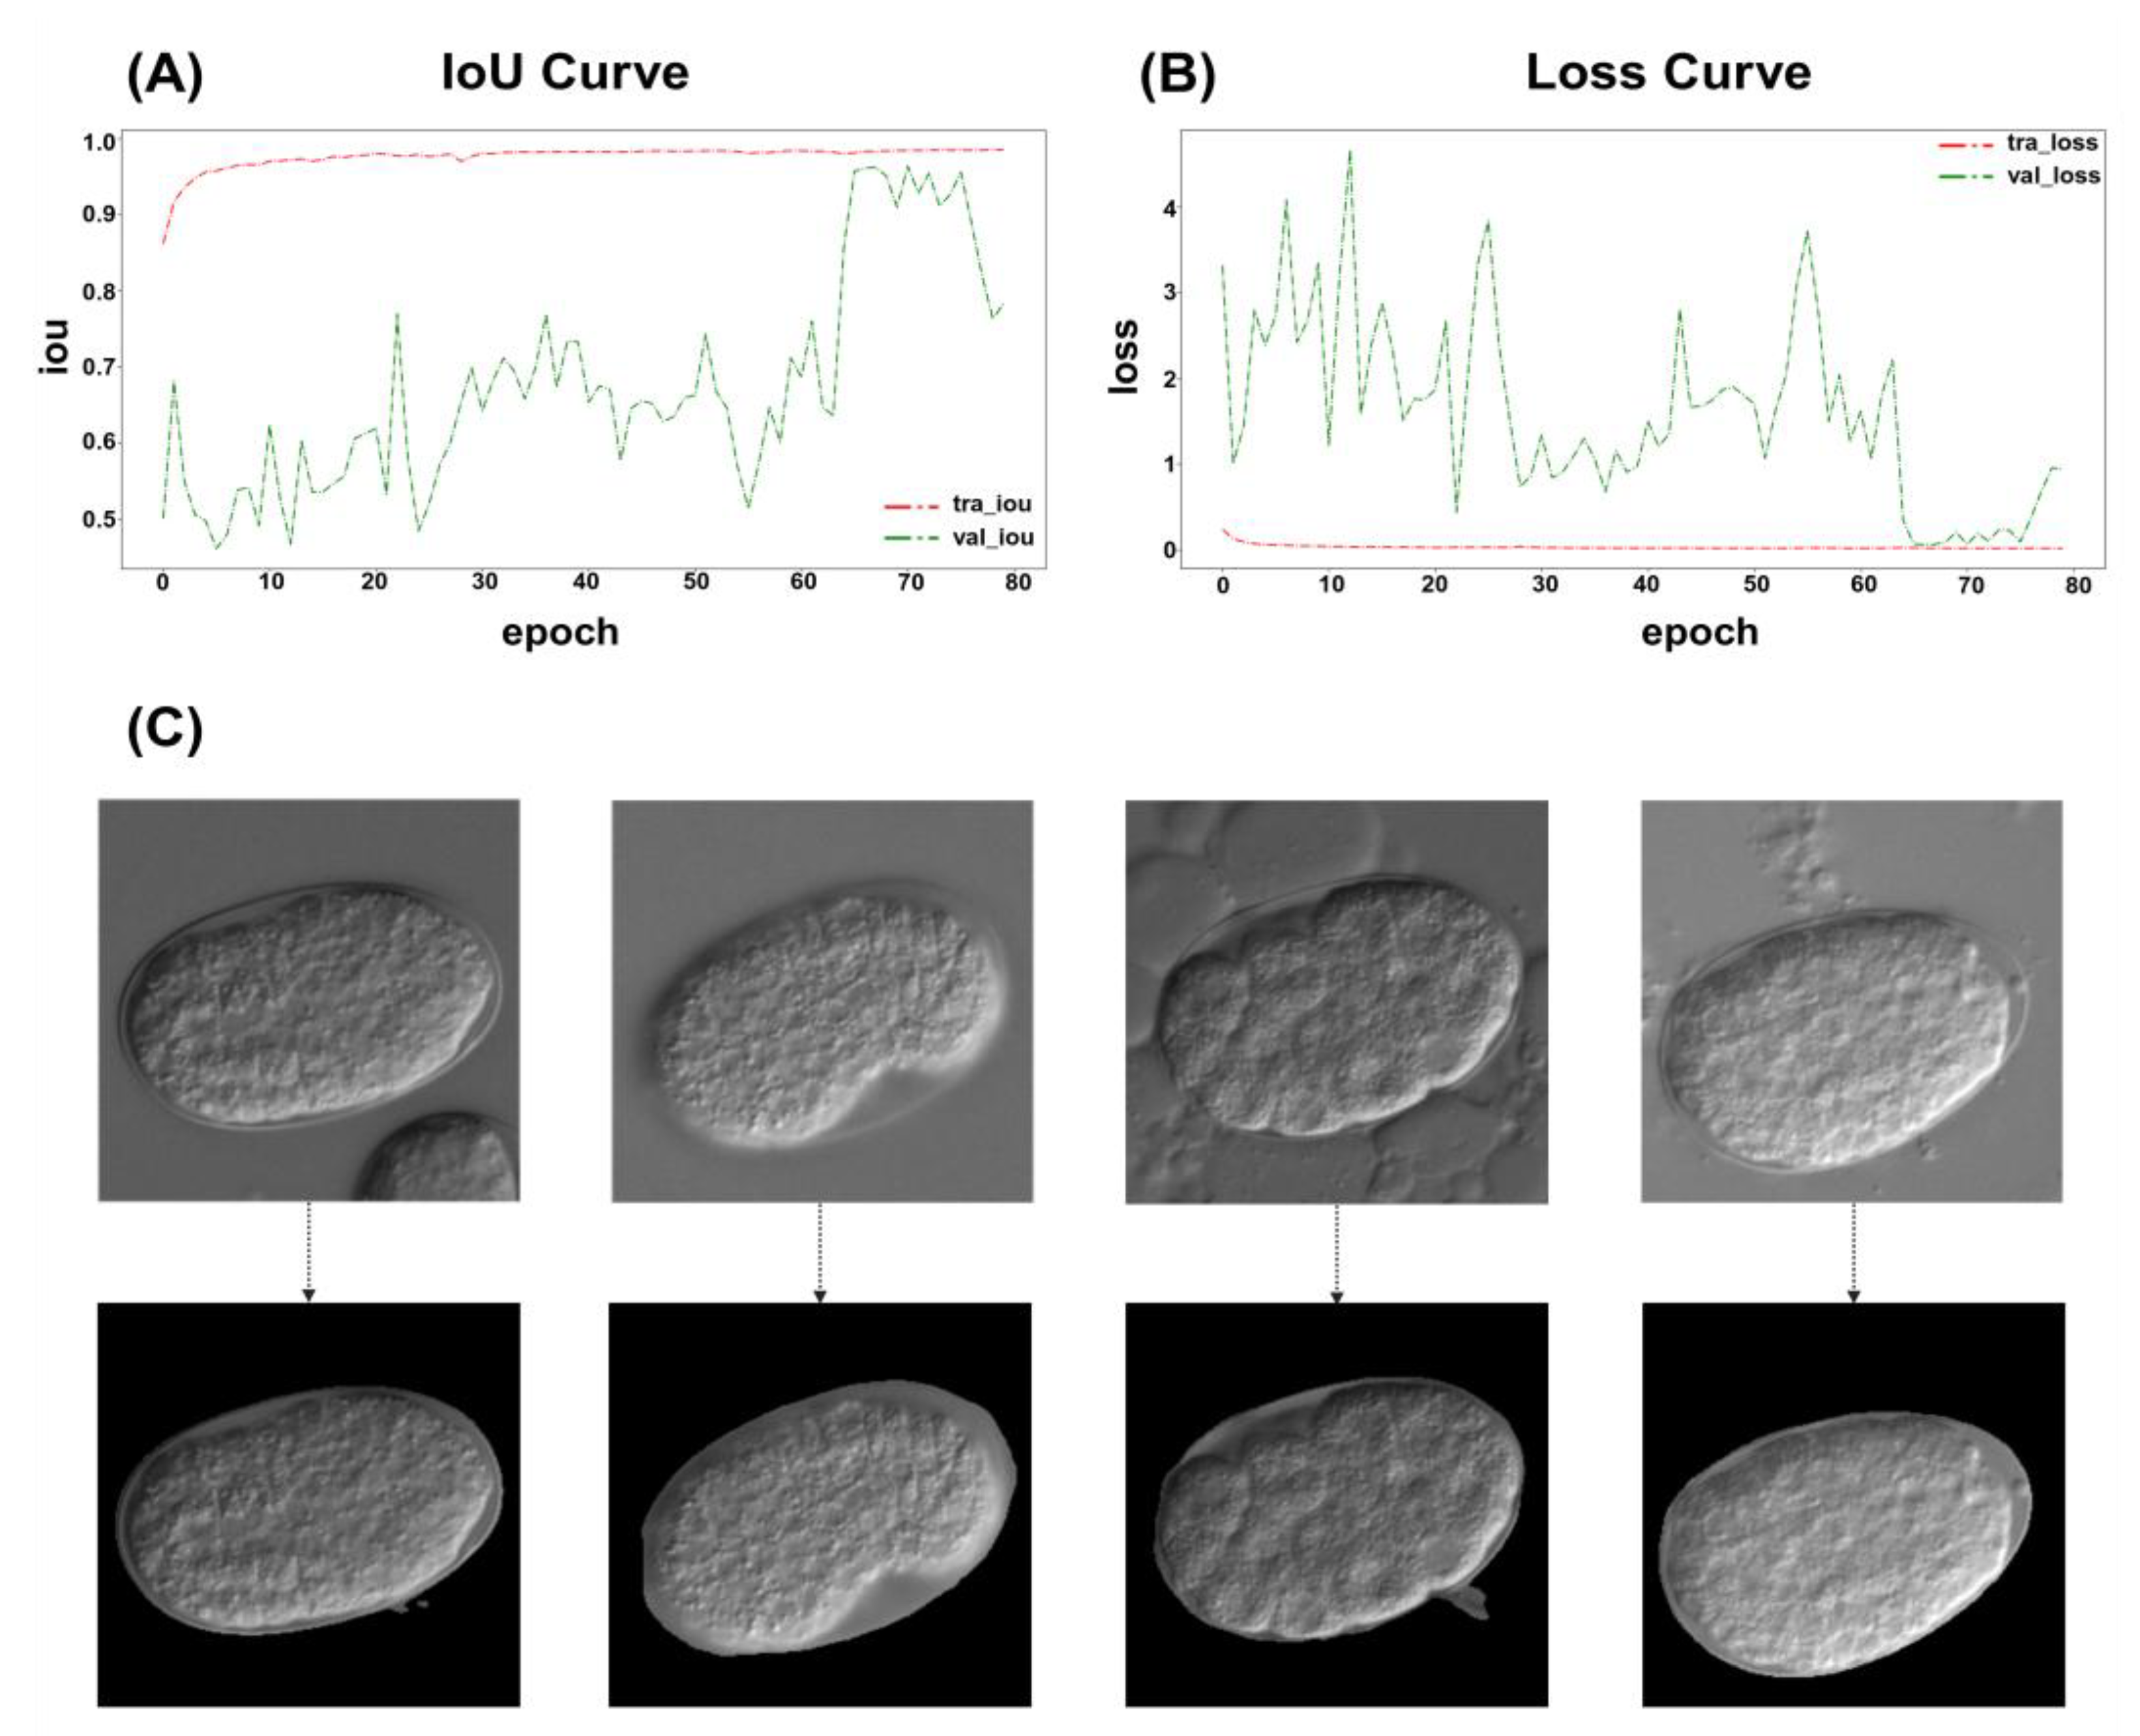
Figure 3.
ResNet performance diagram. (A) ResNet validation performance diagram. Different colors of blue, orange, green, and red, represent “Accuracy,””Precision,””Recall,” and ”F1-Score,” respectively. (B) Gradient-weighted Class Activation Mapping (Grad-CAM) reveals that the image classification model can accurately capture the key semantic features of each embryonic stage. On the left side of each subcategory is the embryo image after ResU-Net processing, whereas the right side displays the image following Grad-CAM analysis. Red arrows indicate areas with high weightings (C) UMAP visualization of feature representations from the validation dataset using the ResNet model. Each point represents a single embryo image, colored according to its predicted developmental stage. Black lines indicate the correct developmental trajectory of C. elegans, illustrating the temporal order of embryogenesis.
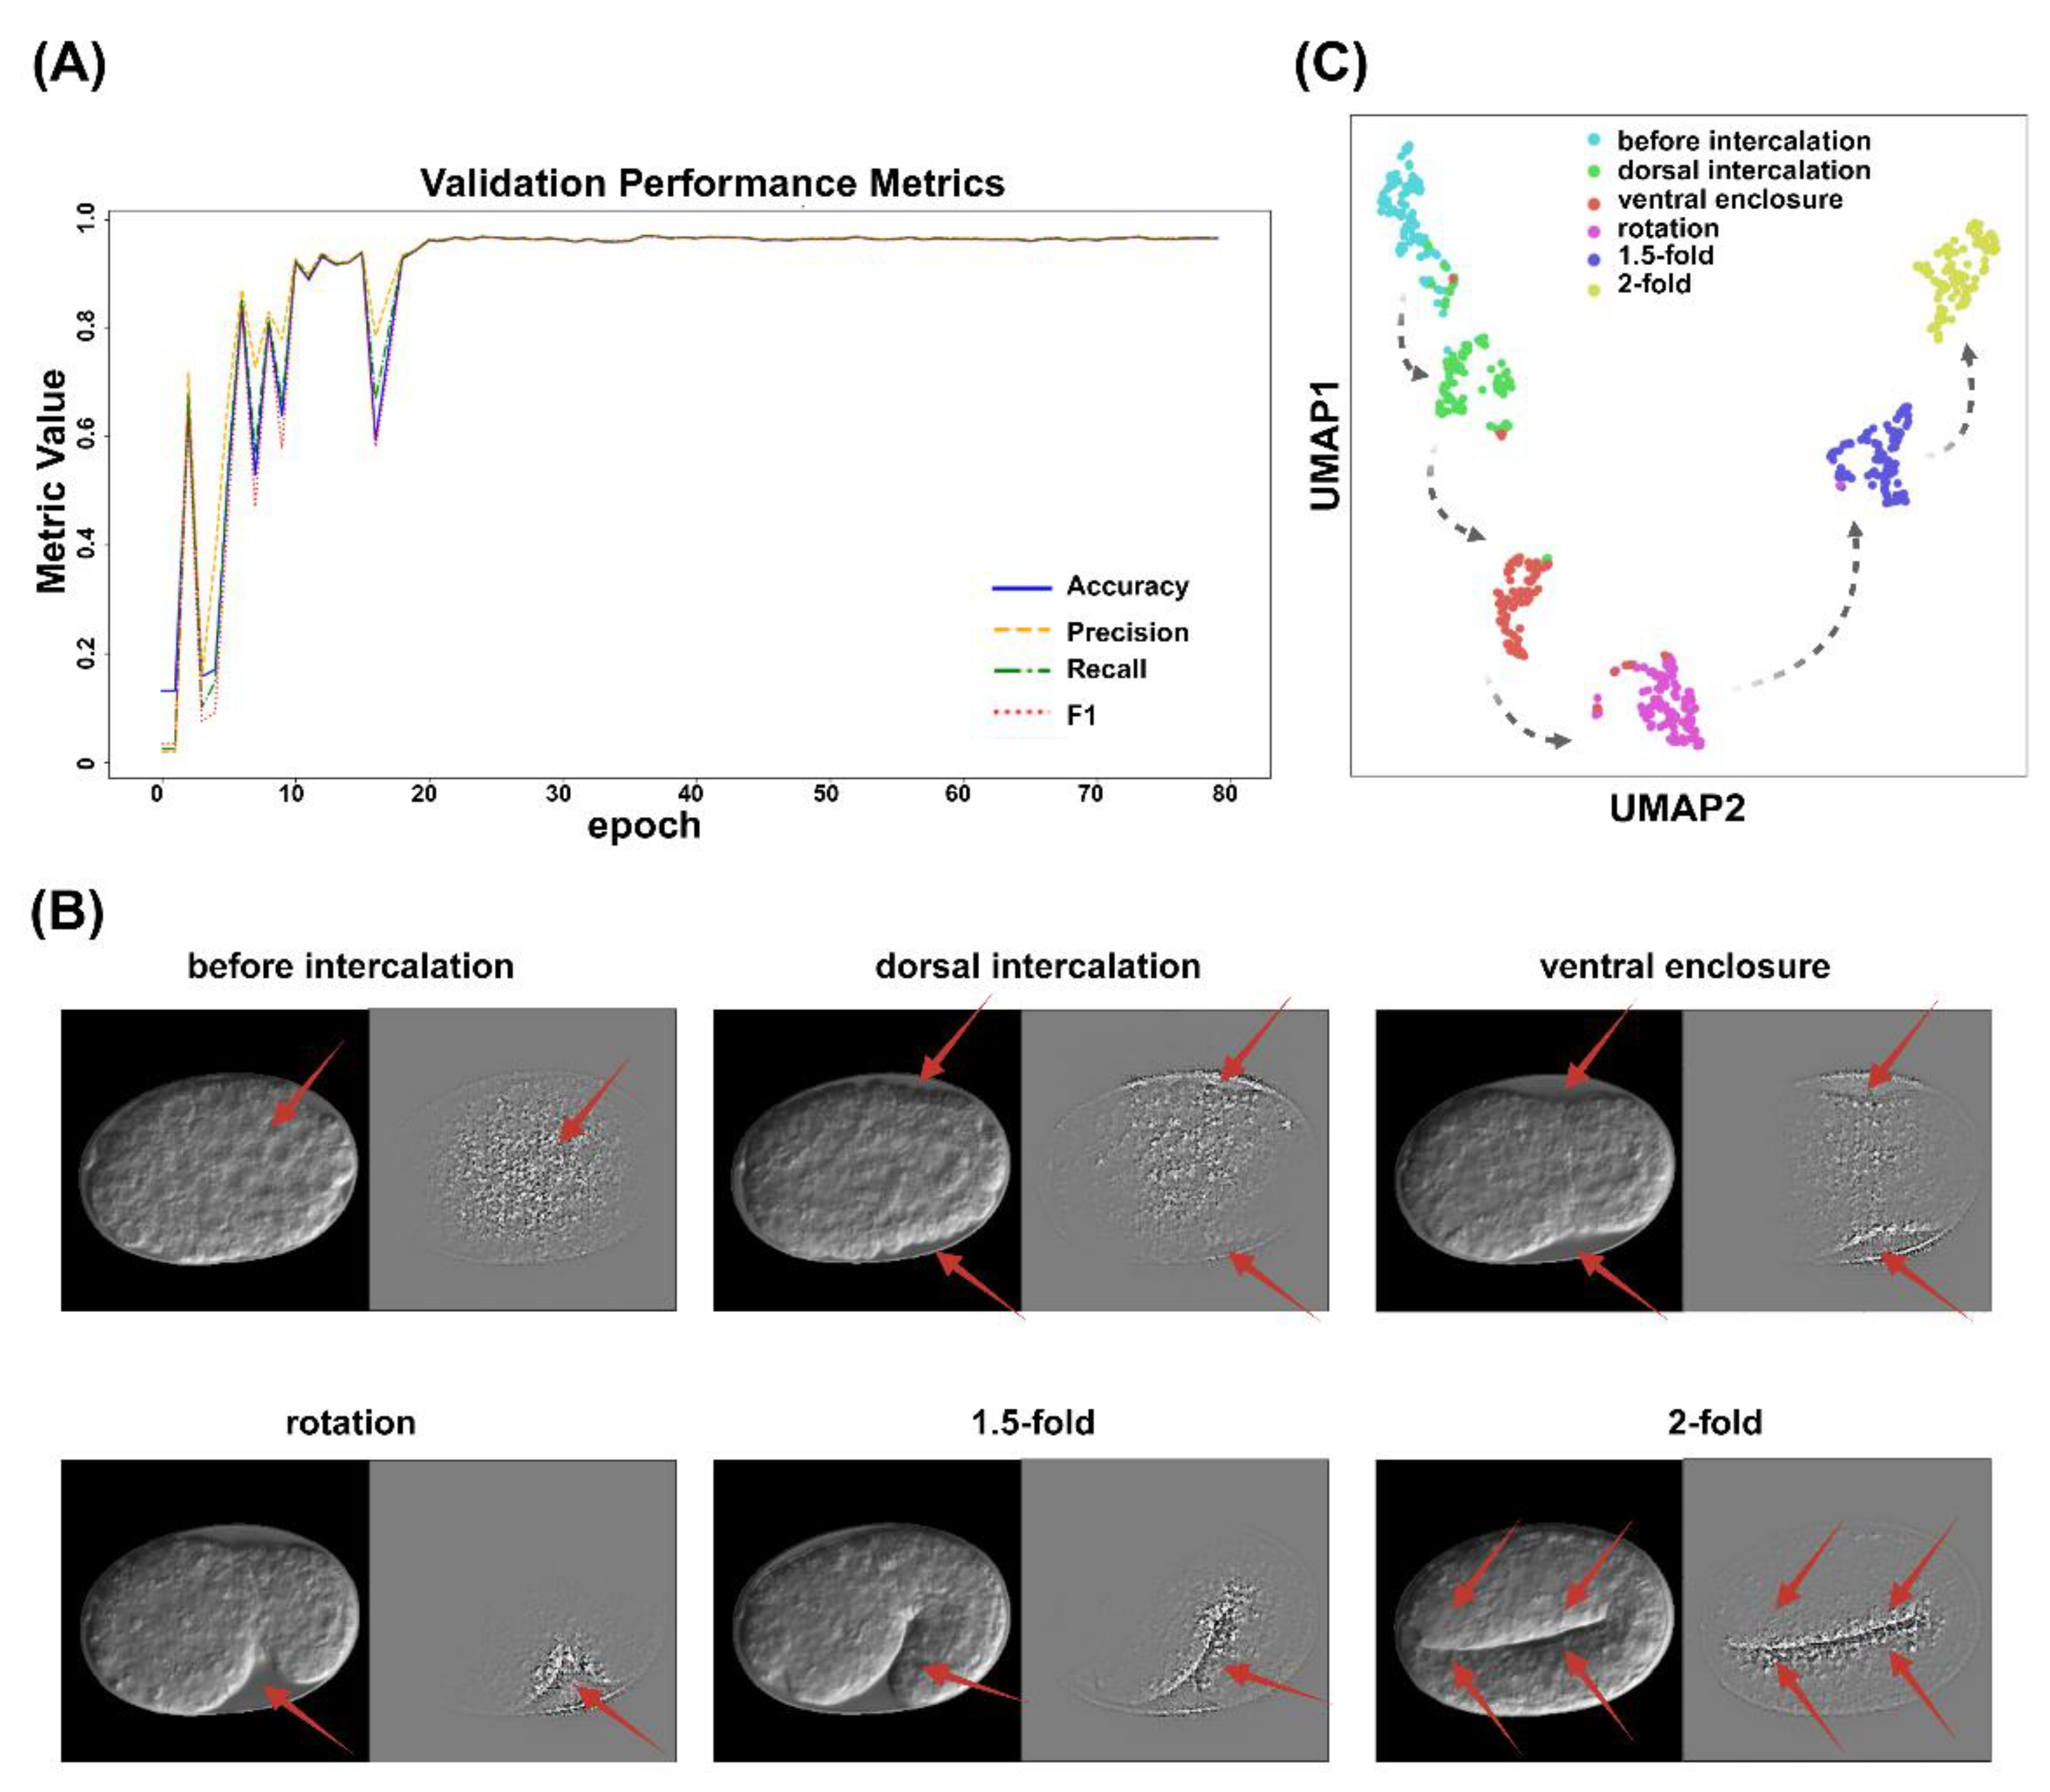
Figure 4.
Screened timeline examples that show misclassification and the two observed patterns of transition periods. Different colors of black, green, yellow, sky blue, purple, and dark blue represent “before intercalation,” “dorsal intercalation,” “ventral enclosure,” “rotation,” “1.5-fold,” and “2-fold” stages: (A) Misclassification in the timeline. (B) Oscillating between high probabilities for two different stages during transition period. (C) Maintaining a low probability during transition period.
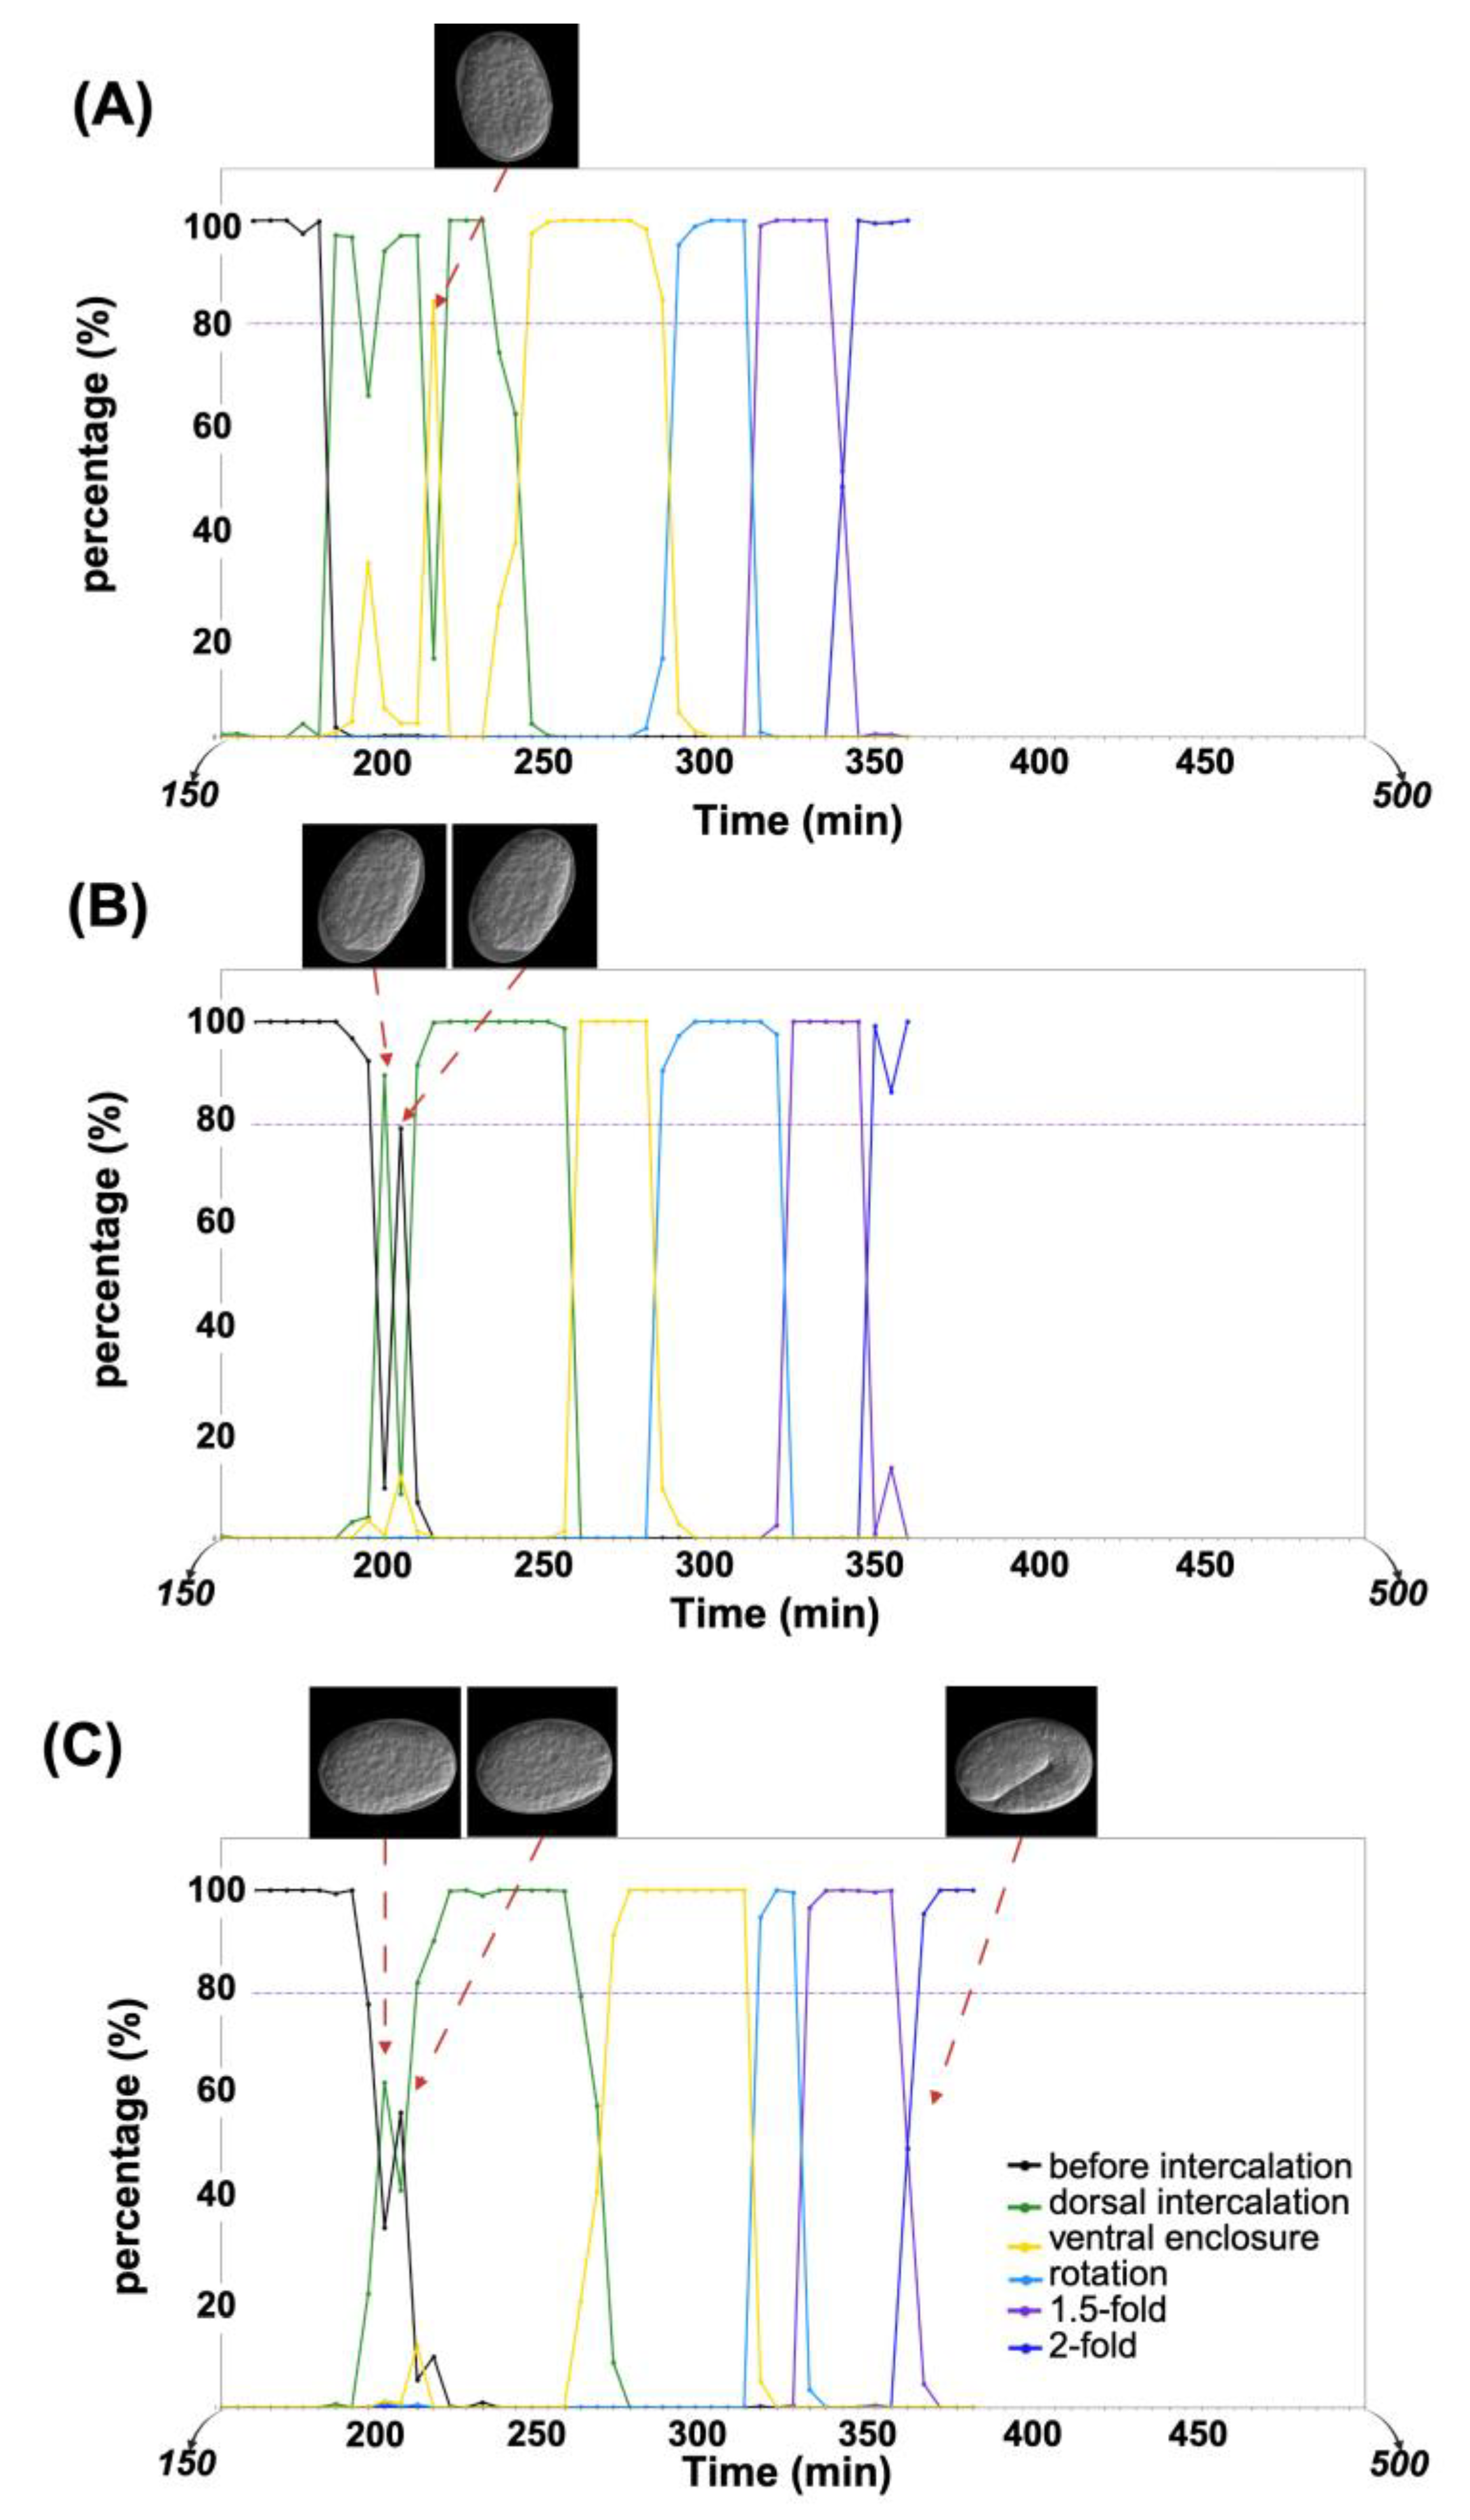
Figure 5.
Time requirements for control(RNAi) embryonic development in each stage. Different colors of black, green, yellow, sky blue, purple, dark blue, and grey represent “before intercalation”, “dorsal intercalation,” “ventral enclosure,” “rotation,” “1.5-fold,” and “2-fold”, “transition” stages, respectively. Each dot represents the time required by a single embryo to undergo each specific embryonic stage.
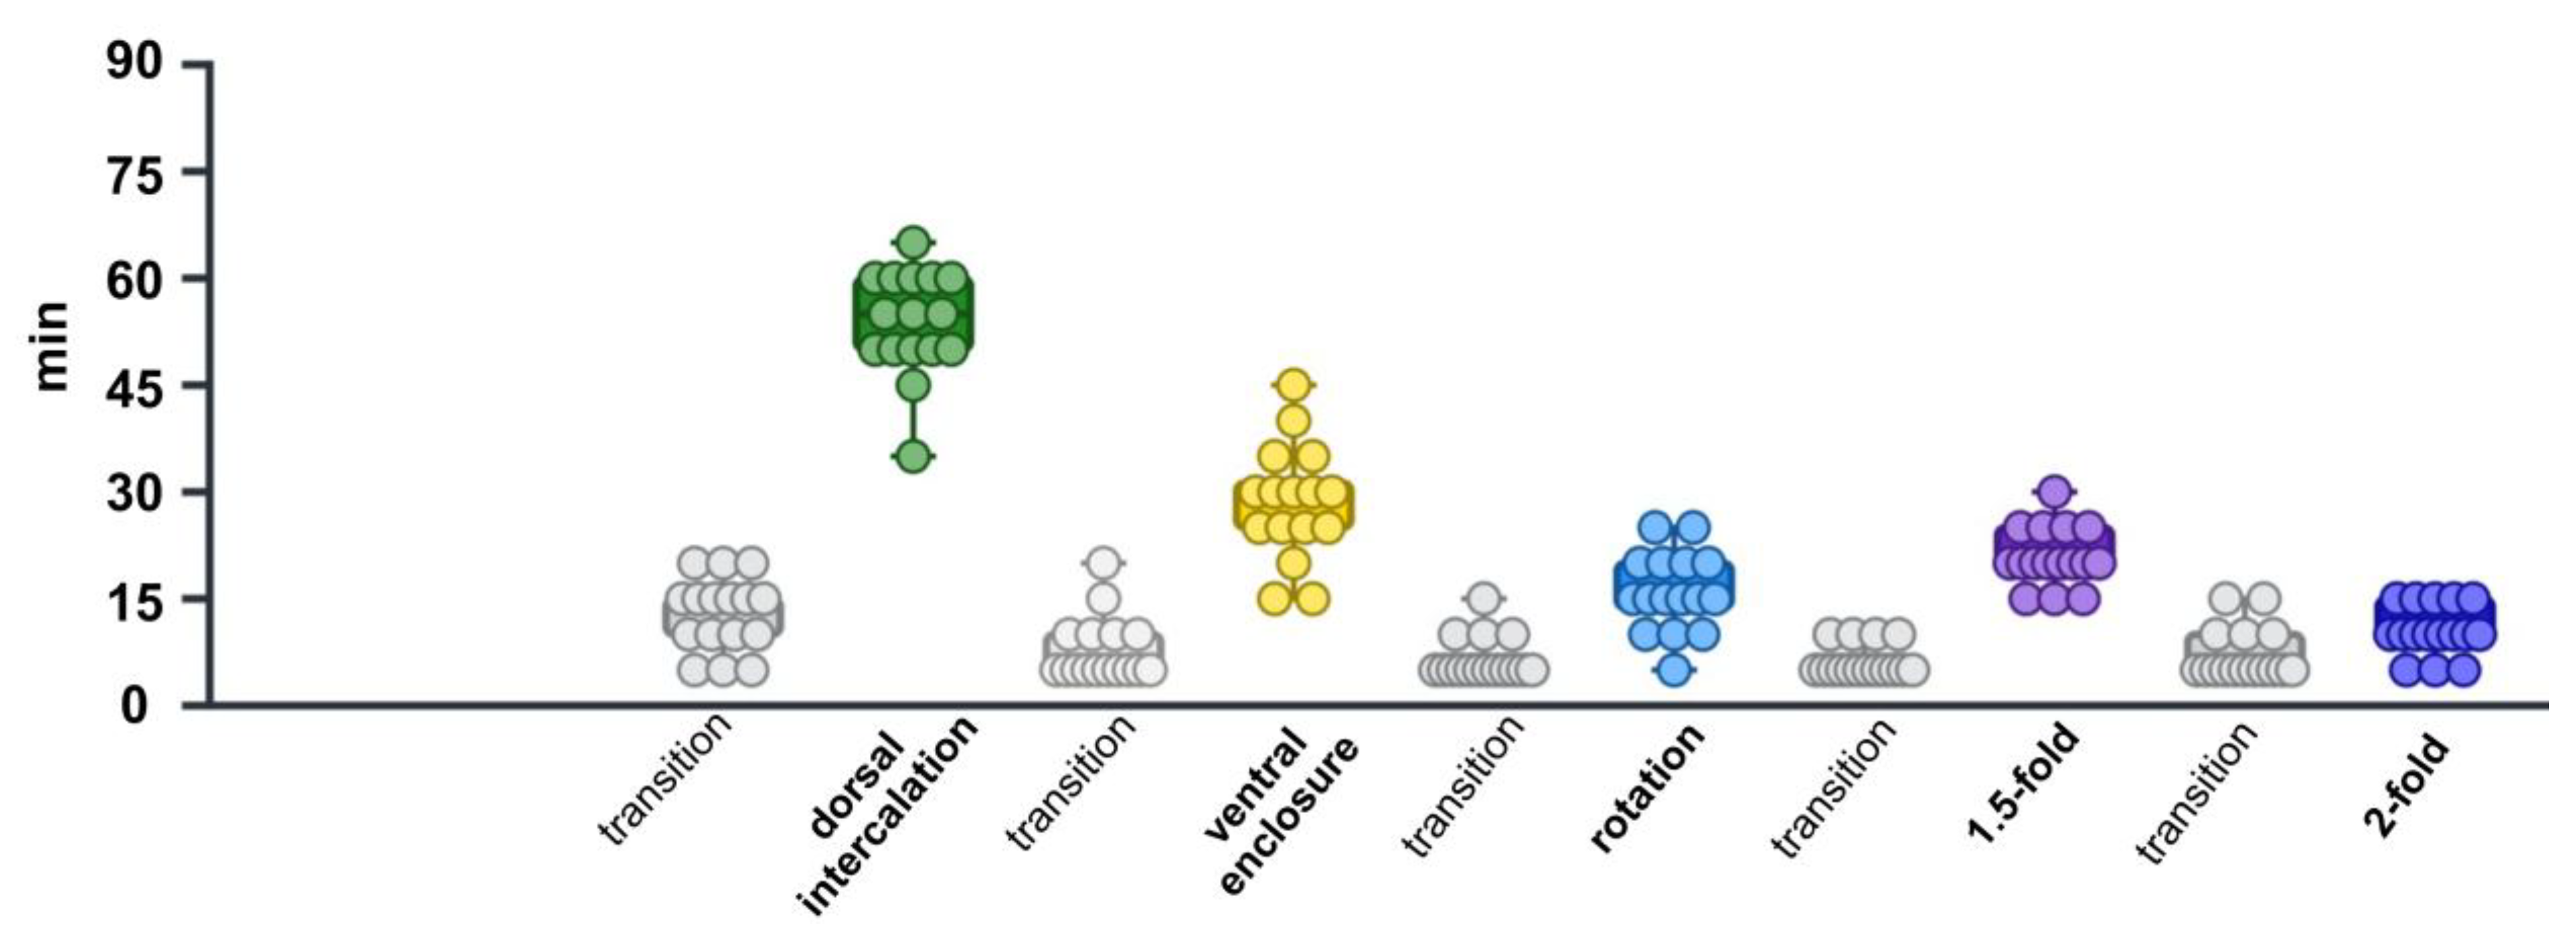
Figure 6.
Calculated and compared duration of embryonic development in each stage and, successfully defined specific embryonic stages affected by RNAi treatment of ajm-1, tes-1, and leo-1; ajm-1(RNAi) was delayed in the 1.5-fold, 2-fold stages and, transition periods; tes-1(RNAi) was delayed in the 2-fold stage; leo-1(RNAi) was delayed in dorsal intercalation, ventral enclosure, and rotation stages. control: n = 16; ajm-1(RNAi), tes-1(RNAi), and leo-1(RNAi): n = 10; * p < 0.05; ** p < 0.01; *** p < 0.001; **** p < 0.0001; unpaired Student’s T-test. (a) dorsal intercalation. (b) ventral enclosure. (c) rotation. (d) 1.5-fold. (e) 2-fold. Each dot represents the time required by a single embryo to undergo each specific embryonic stage.
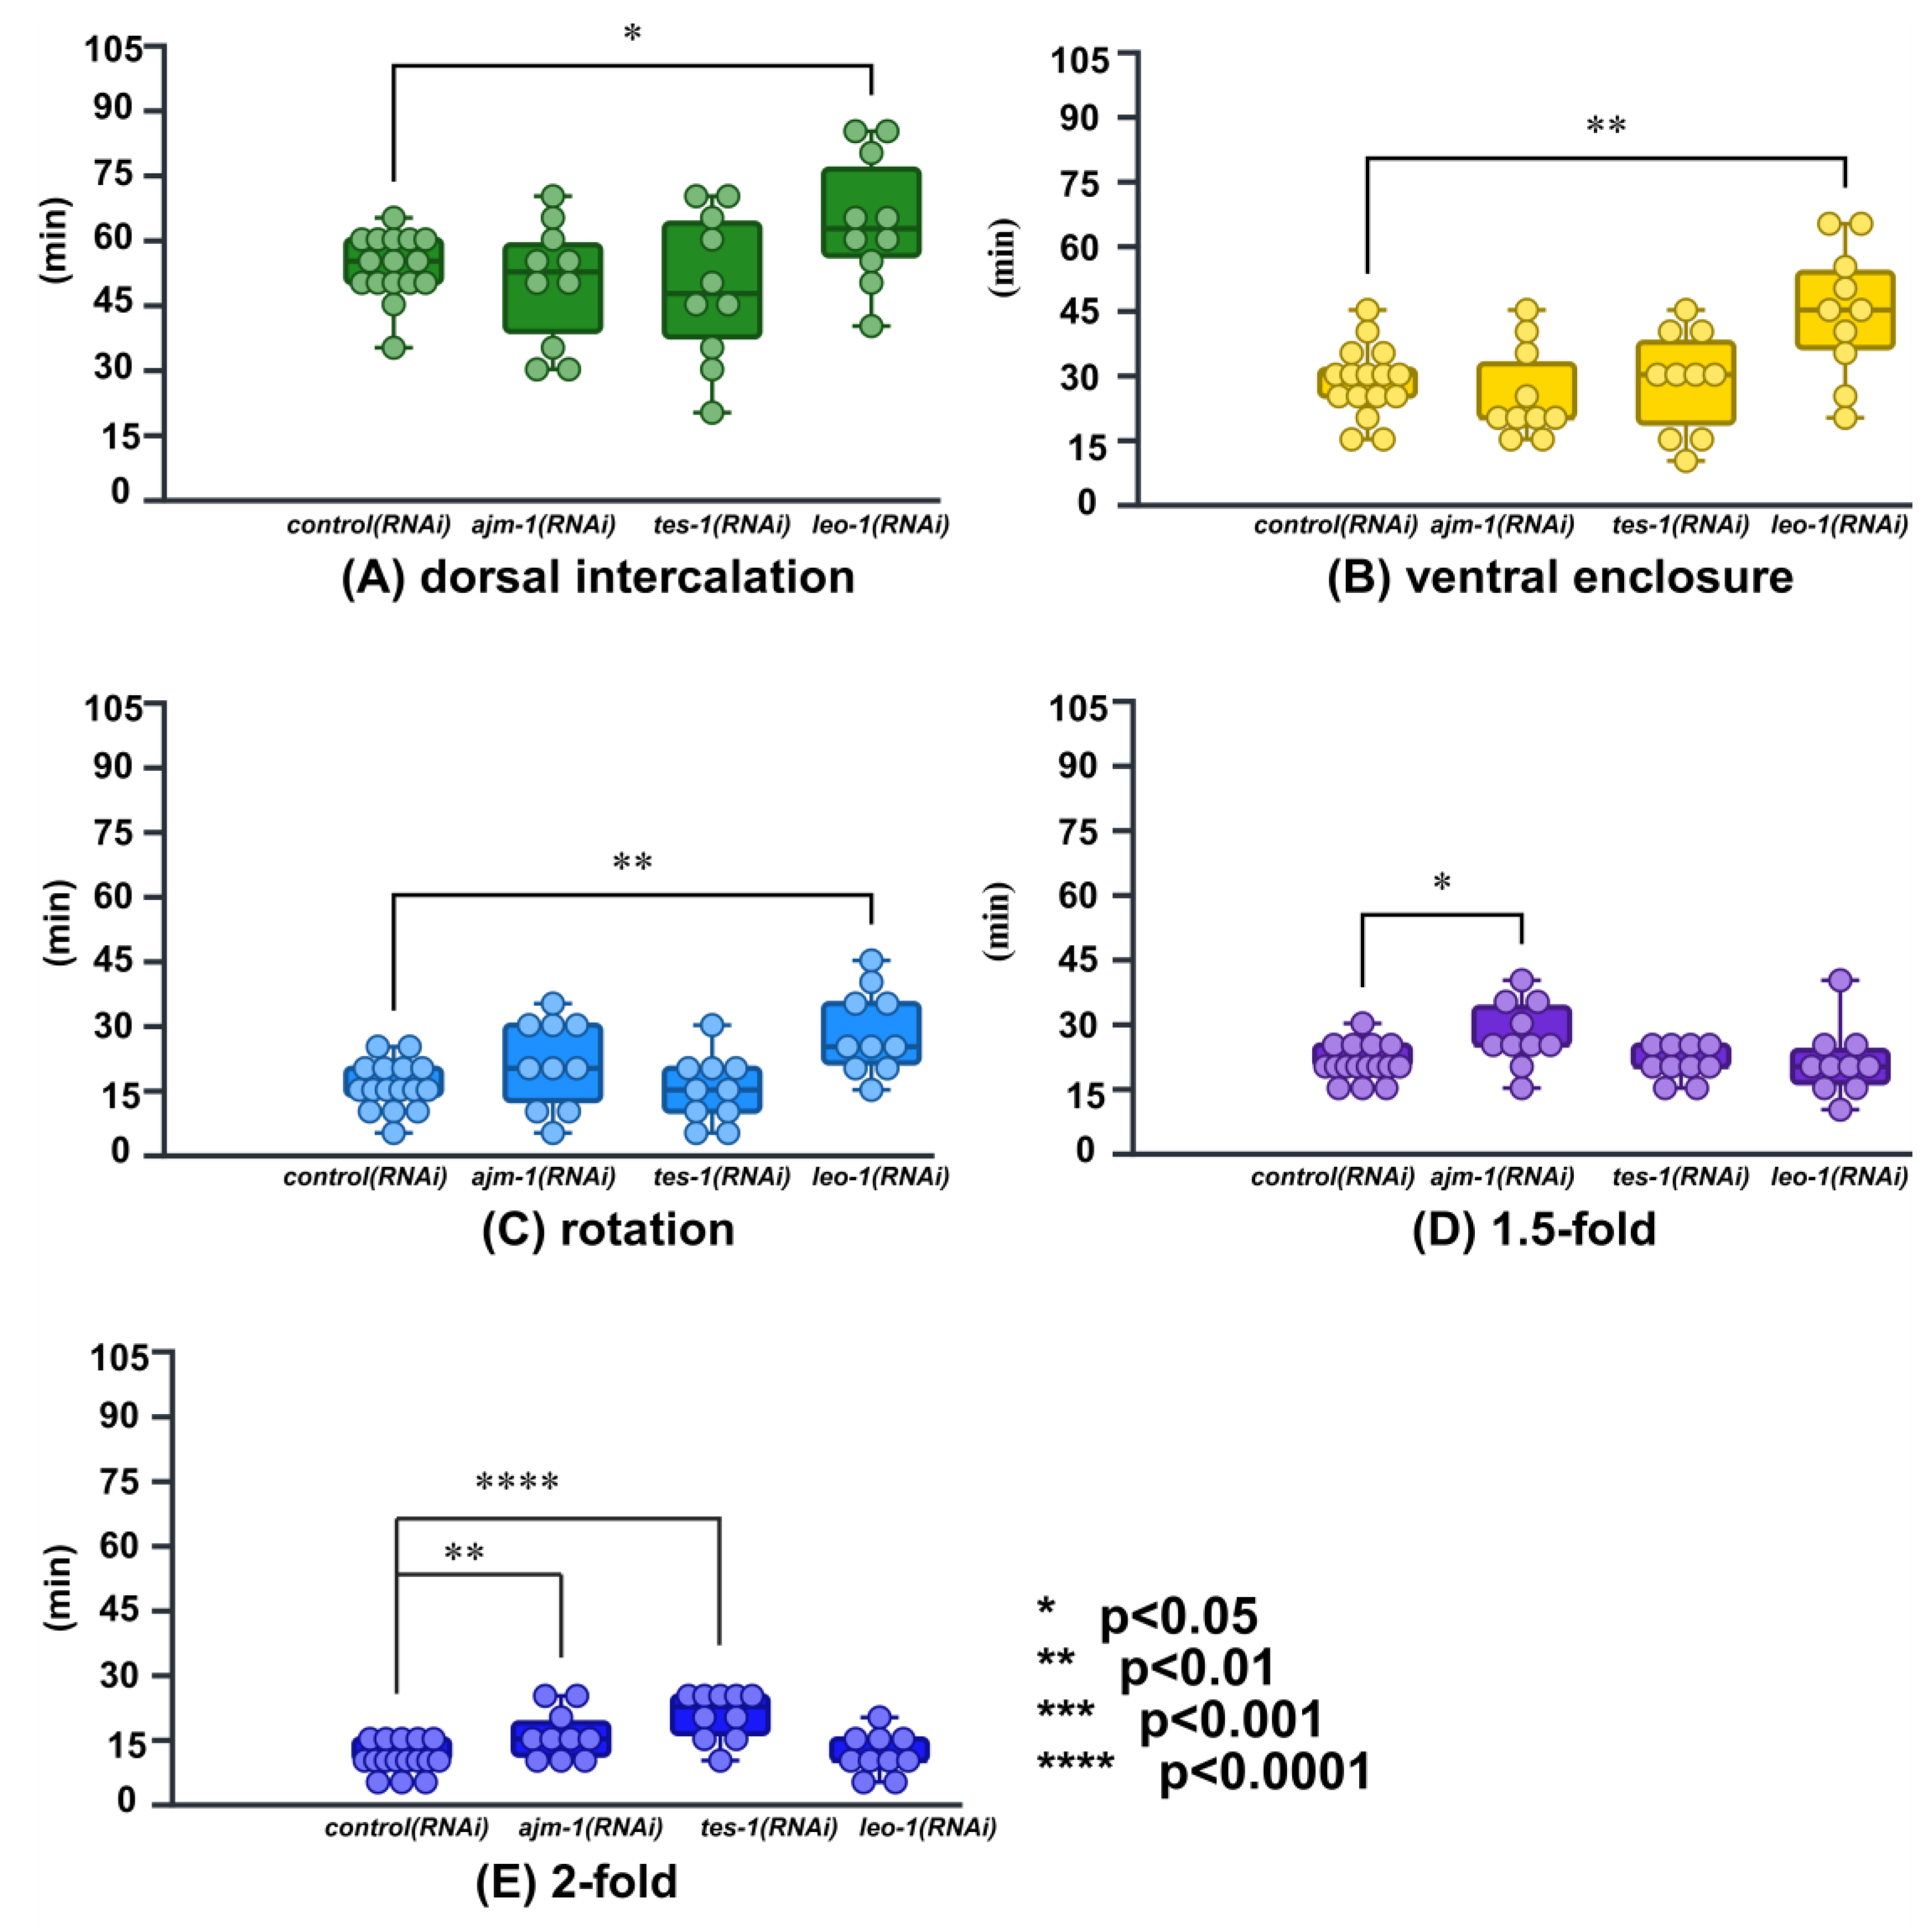
Figure 7.
ResU-Net architecture. Residual blocks are incorporated into each encoder and decoder layer. The number of channels is indicated above each box. Different arrows represent different operations, and the plus sign indicates tensor addition.
Figure 7.
ResU-Net architecture. Residual blocks are incorporated into each encoder and decoder layer. The number of channels is indicated above each box. Different arrows represent different operations, and the plus sign indicates tensor addition.
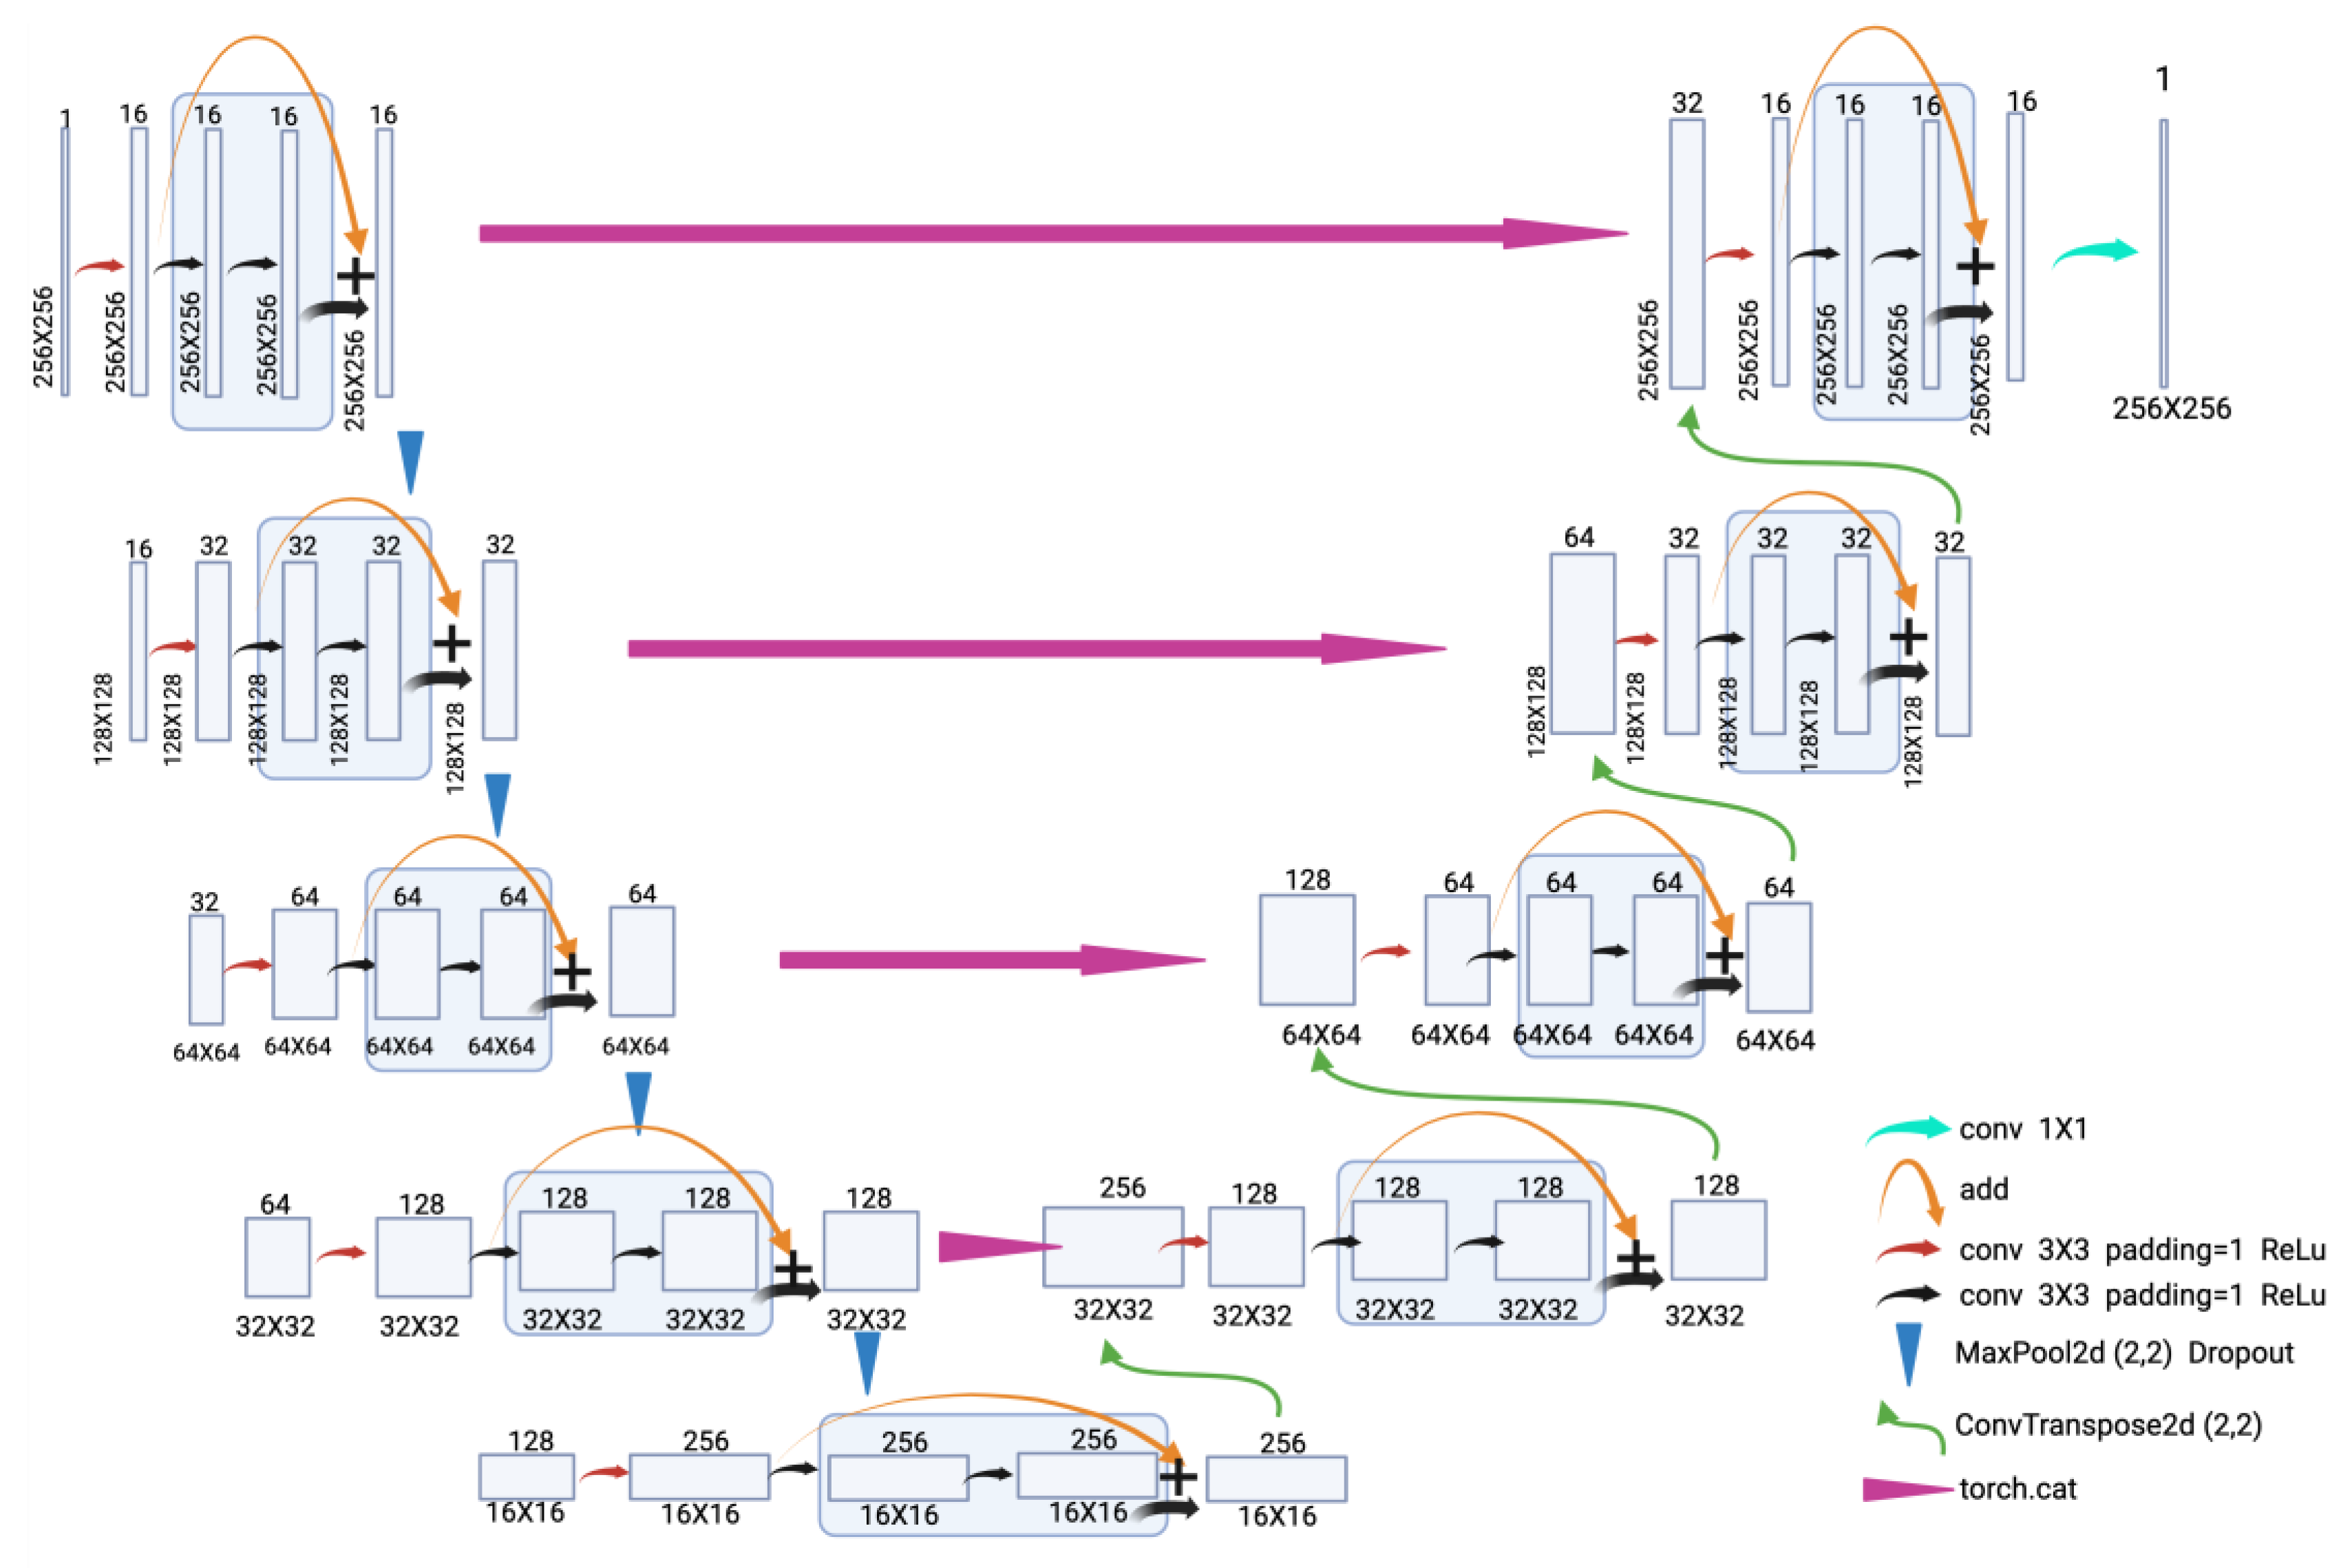
Figure 8.
ResNet architecture. After the convolution operation in the residual blocks, softmax is applied to assign probability values to the images being predicted. Boxes represent different operations; the bottom shows the predicted labels from left to right: “before intercalation”; “dorsal intercalation”; “ventral enclosure”; “rotation”; “1.5-fold”; “2-fold”.
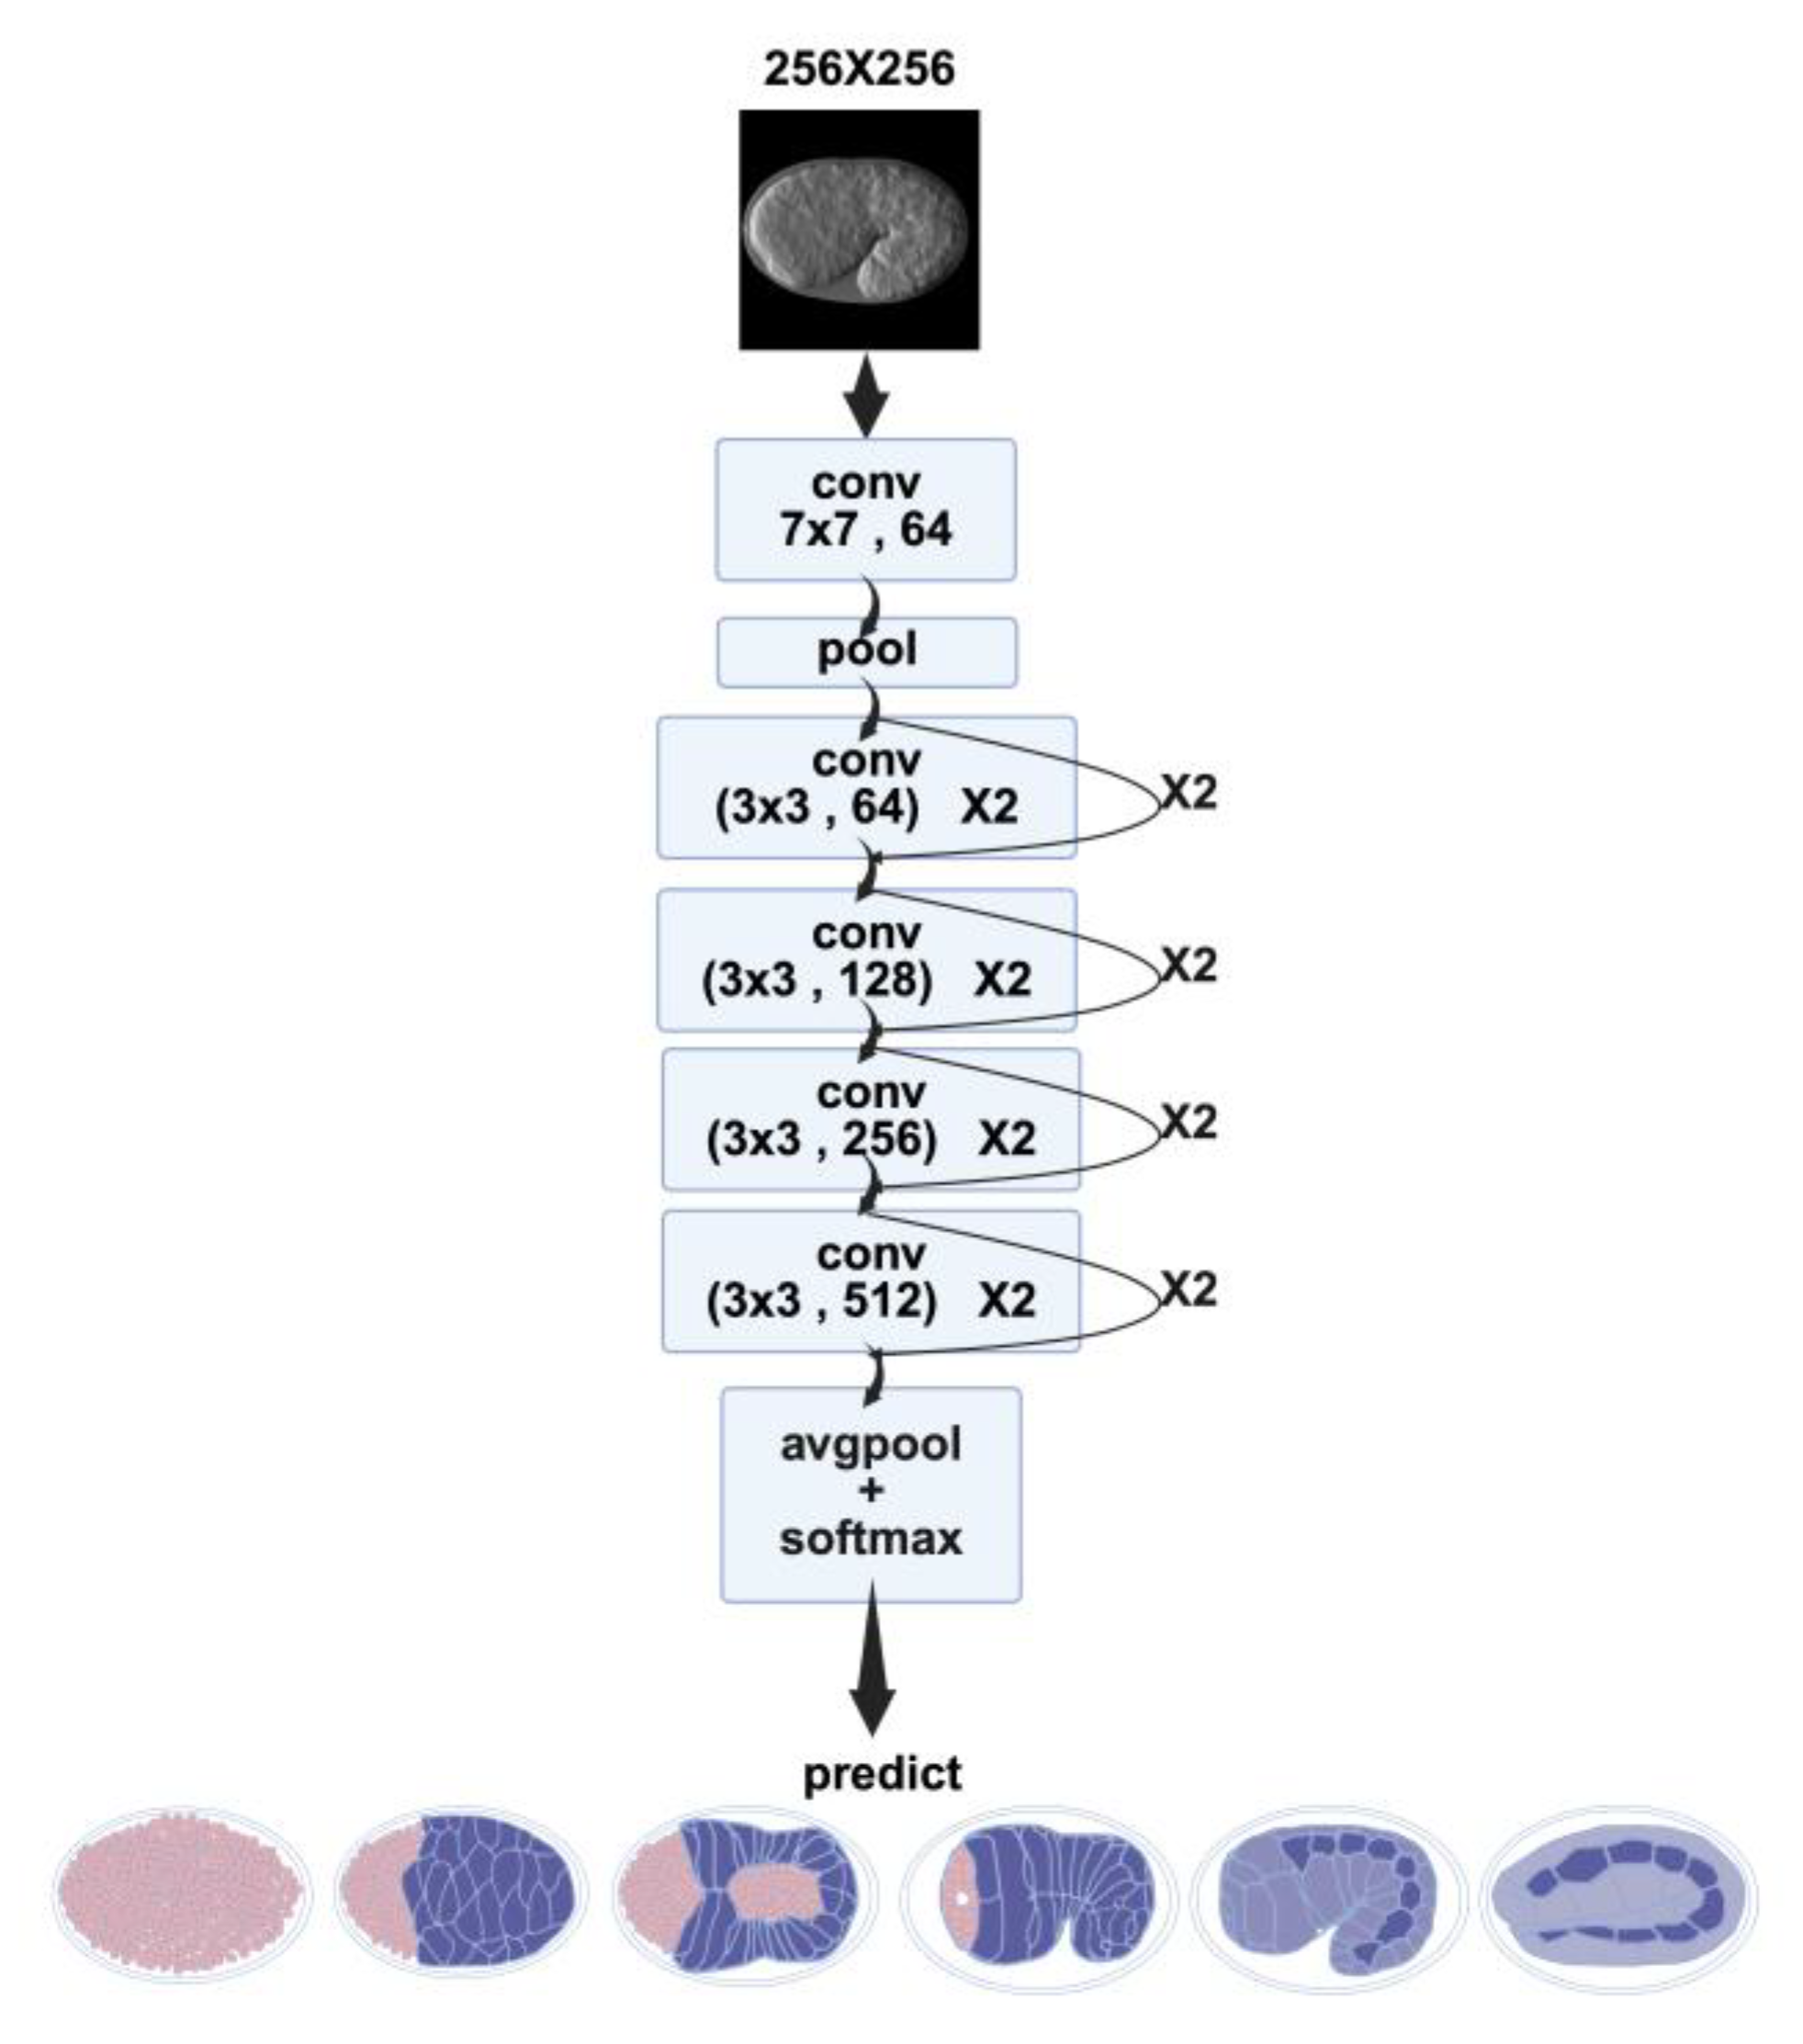
Figure 9.
Schematic diagram of using ResU-Net processing to extract the embryonic region in the image. After passing through ResU-Net, a tensor containing only 0 s and 1 s is produced. This predicted tensor is then multiplied by the original image tensor to produce the processed image.
Figure 9.
Schematic diagram of using ResU-Net processing to extract the embryonic region in the image. After passing through ResU-Net, a tensor containing only 0 s and 1 s is produced. This predicted tensor is then multiplied by the original image tensor to produce the processed image.
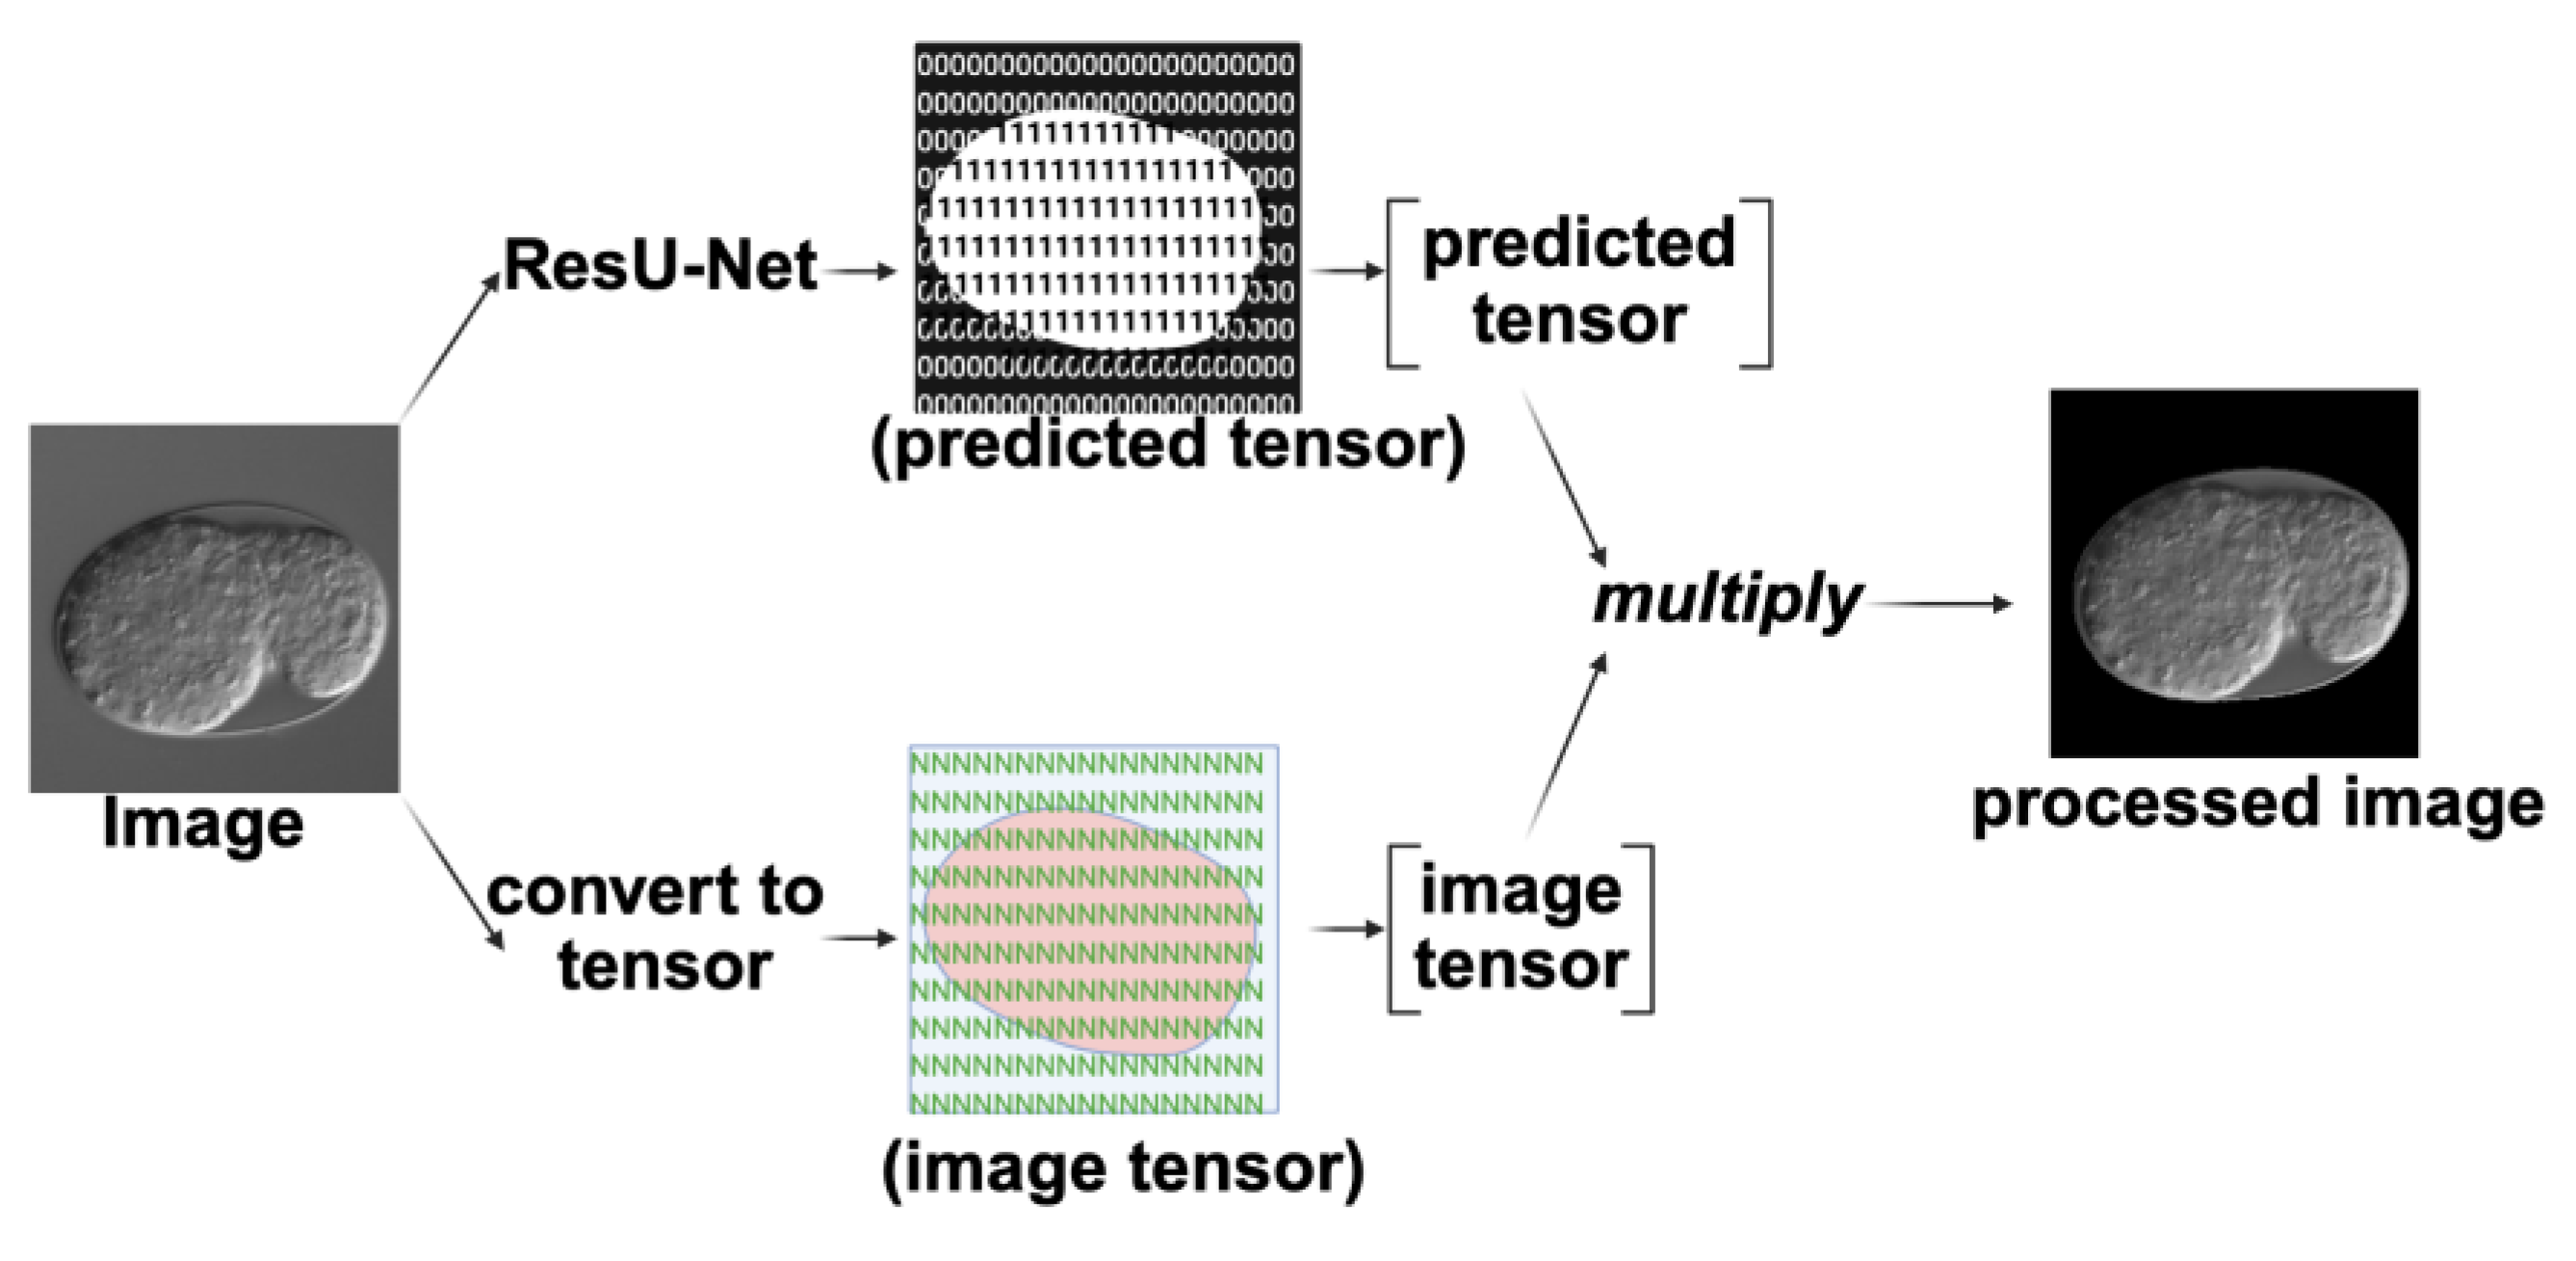
Figure 10.
Key temporal analysis experimental workflow. The time-lapse image dataset is first processed by ResU-Net, followed by input into ResNet for embryonic stage prediction. Finally, the predicted timeline results are visualized.
Figure 10.
Key temporal analysis experimental workflow. The time-lapse image dataset is first processed by ResU-Net, followed by input into ResNet for embryonic stage prediction. Finally, the predicted timeline results are visualized.
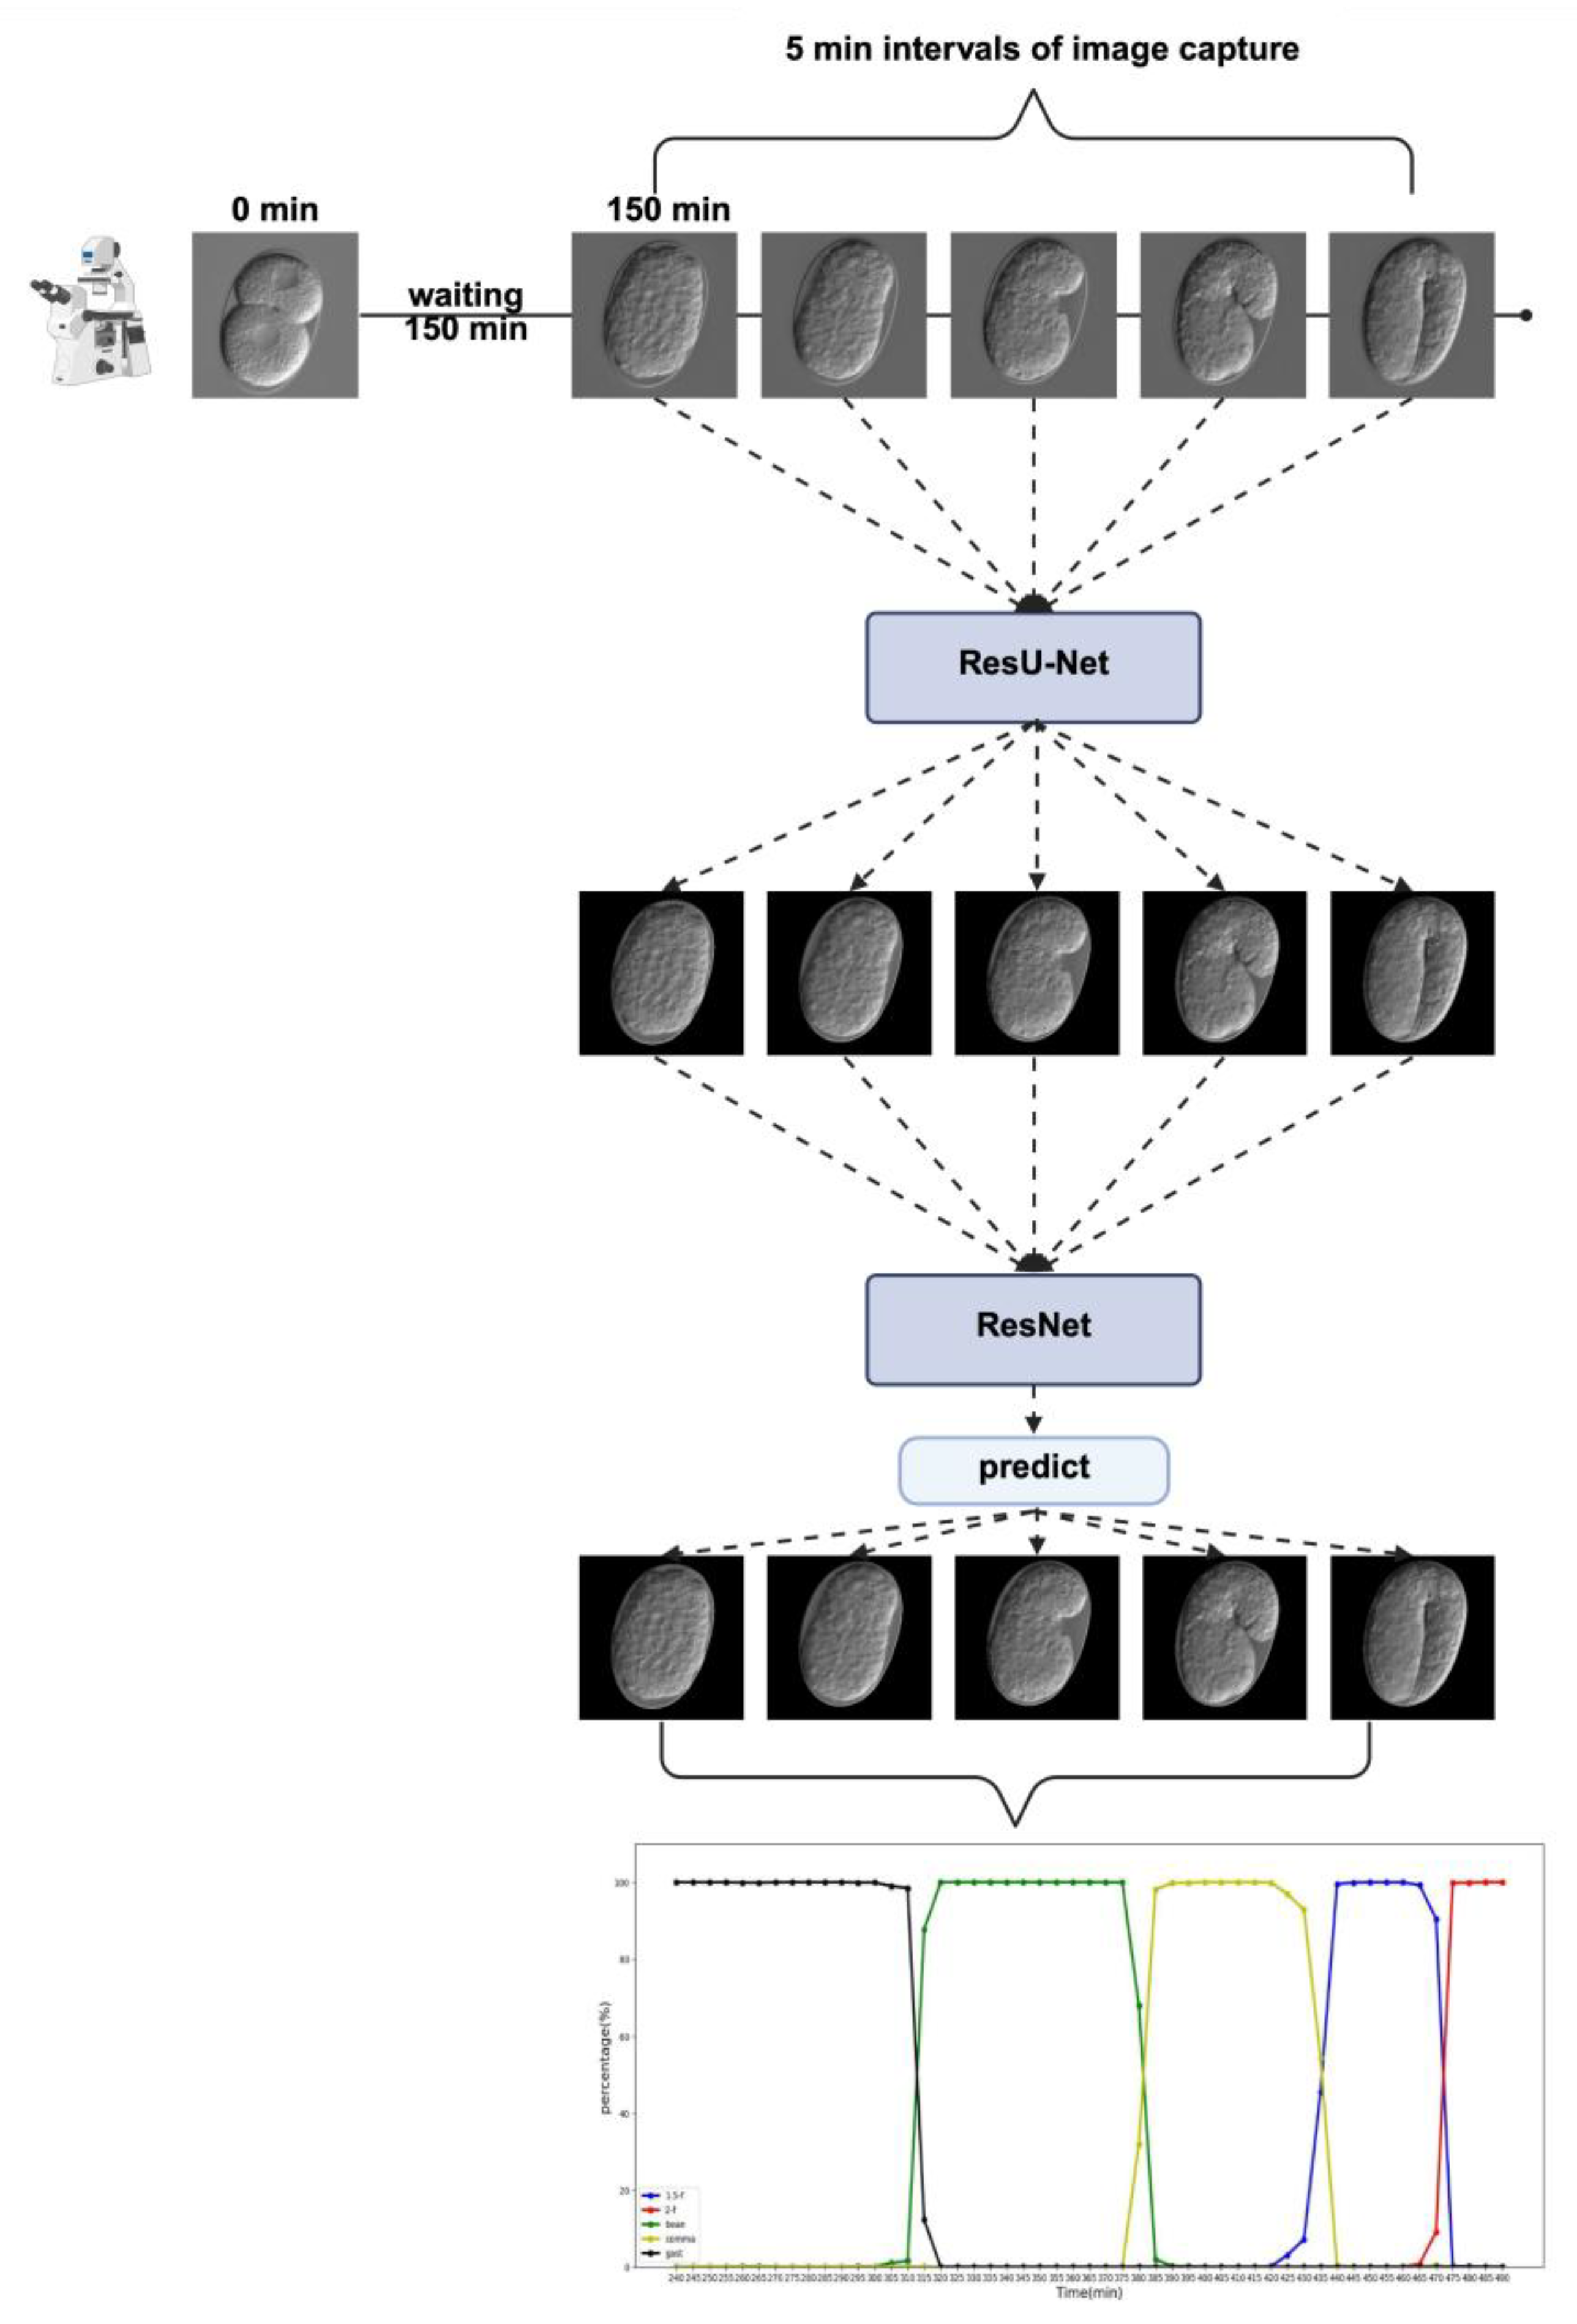

Table 1.
ResU-Net performance metrics.
| Metric | Value |
|---|---|
| True Positive (TP) | 519,293 |
| False Positive (FP) | 14,760 |
| True Negative (TN) | 714,840 |
| False Negative (FN) | 4,483 |
| Sensitivity (TPR) | 99.14% |
| Specificity (TNR) | 97.98% |
| Overall Accuracy | 98.47% |
| Precision (PPV) | 97.24% |
| F1-Score | 98.18% |
| Intersection over Union (IoU) | 96.43% |
Table 2.
ResNet performance metrics.
| Metric | Value |
|---|---|
| Sensitivity (TPR) | 96.87% |
| Specificity (TNR) | 97.98% |
| Overall Accuracy | 96.86% |
| Precision (PPV) | 96.93% |
| F1-Score | 96.83% |
Table 3.
Statistics of the timelines and number of images collected using different interference RNA.
Table 3.
Statistics of the timelines and number of images collected using different interference RNA.
| RNAi | Number of timelines | Timeline number with misclassification | Total images | Images number with misclassification | Continuous misclassification |
|---|---|---|---|---|---|
| control(RNAi) | 16 | 1 | 681 | 0.15% (N=1) | 0 |
| leo-1(RNAi) | 10 | 2 | 541 | 0.37%(N=2) | 0 |
| ajm-1(RNAi) | 10 | 2 | 467 | 0.64%(N=3) | 0 |
| tes-1(RNAi) | 10 | 3 | 457 | 0.66%(N=3) | 0 |
Table 4.
The average time required for each stage of epidermal development.
| RNAi | Dorsal intercalation (min) | Ventral enclosure (min) | Rotation (min) |
1.5-fold (min) |
2-fold (min) |
|---|---|---|---|---|---|
| control(RNAi) | 53.75±1.85 | 28.43±2.02 | 15.93±1.38 | 20.93±1.04 | 10.62±0.89 |
| leo-1(RNAi) | 64.50 ± 4.74 * | 44.50 ± 4.80 ** | 28.50±3.08 ** | 21.00 ± 2.56 | 11.50 ± 1.50 |
| ajm-1(RNAi) | 50.50 ± 4.47 | 25.50 ± 3.37 | 21.00 ± 3.23 | 27.50 ± 2.39 * | 16.00 ± 1.80 ** |
| tes-1(RNAi) | 49.50 ± 5.46 | 28.50 ± 3.73 | 15.00 ± 2.47 | 21.00 ± 1.25 | 20.50 ± 1.74 **** |
| * P < 0.05; ** P < 0.01; *** P < 0.001; **** P < 0.0001 | |||||
Disclaimer/Publisher’s Note: The statements, opinions and data contained in all publications are solely those of the individual author(s) and contributor(s) and not of MDPI and/or the editor(s). MDPI and/or the editor(s) disclaim responsibility for any injury to people or property resulting from any ideas, methods, instructions or products referred to in the content. |
© 2025 by the authors. Licensee MDPI, Basel, Switzerland. This article is an open access article distributed under the terms and conditions of the Creative Commons Attribution (CC BY) license (http://creativecommons.org/licenses/by/4.0/).
Copyright: This open access article is published under a Creative Commons CC BY 4.0 license, which permit the free download, distribution, and reuse, provided that the author and preprint are cited in any reuse.


