
Submitted:
03 July 2025
Posted:
04 July 2025
You are already at the latest version
Abstract
Olive production holds a significant position in global agricultural trade. In addition to being influenced by seasonal climatic conditions, agricultural diseases are another factor that affects olive yield. Peacock spot disease and olive bud mites are the primary agri-cultural diseases affecting olive production. These two diseases cause specific lesions in the leaves of the olive trees. It has been observed that artificial intelligence approaches such as deep learning and machine learning are used for early detection of such adverse conditions. However, the need for high computational processing in the classification and detection processes of deep learning models limits the accessibility of these algo-rithms to all businesses. Based on this problem, this study analyzes the results that can be achieved by combining the feature extraction capability of deep learning models with the low computational load and classification ability of machine learning algorithms, comparing them with deep learning studies in the literature. As feature extraction deep learning models, MobileNetV2, DenseNet121, EfficientNetV2B0, and ConvNext Tiny were selected, while AdaBoost, XGBoost, LightGBM, CatBoost, and Gradient Boosting algorithms from the Boosting family were included as classifiers. In the model training, a dataset consisting of 3,400 images of olive leaves belonging to three classes—healthy, olive_peack_spot, and aculus_olearius—was used. The experimental results showed that the DenseNet121 + XGBoost combination achieved 92% accuracy, 92.66% precision, 92% recall, and an F1-Score of 92.33% in multiclass classification. A Wilcoxon Signed-Rank test conducted between the best second result, MobileNetV2 + XGBoost, and DenseNet121 + XGBoost revealed that the DenseNet121 + XGBoost combination statistically outperformed MobileNetV2 + XGBoost. This study demonstrated that a higher number of parameters does not always lead to better performance. DenseNet121 achieved the best results and outperformed the ConvNextTiny model, which had the highest number of parameters.
Keywords:
olive leaf diseases
; transfer learning
; machine learning
; hybrid classification model
; plant disease detection
1. Introduction
Olive is one of the primary agricultural products exported by countries in the Mediterranean basin. Globally, the majority of olive groves and olive production is concentrated in this region. Unlike many other agricultural products, olive production is highly concentrated geographically. Data published by the Food and Agriculture Organization (FAO) and International Olive Council (IOC) indicate that over 90% of global production is carried out by countries located in the Mediterranean basin [1]. Spain is the world leader in terms of both the size of cultivated area and production volume. Following Spain, Italy, Greece, Tunisia, and Turkey are the leading olive-producing countries [2]. Turkey ranks among the top three in world table olive production and among the top five in olive oil production. Currently, the number of olive trees in the country exceeds 190 million [3].
The yield obtained from olive production largely depends on the climatic conditions during the production season and the severity of agricultural diseases that affect olive trees. Among these, Olive Leaf Spot (Spilocaea oleagina) and Olive Bud Mite (Aculus olearius) are the most prominent. Olive Leaf Spot, which commonly occurs in mild and rainy climates, is a plant disease that creates circular spots on the leaves. Because of this feature, it is also popularly known as “Olive Peacock Spot.” An example of this disease is shown in Figure 1. By covering the surface of the leaves and narrowing the photosynthetic area, this disease disrupts the physiological balance of olive trees and indirectly reduces yield. This physiological disturbance can cause severe yield losses in subsequent production years [4]. On the other hand, the Olive Bud Mite directly damages the buds, flowers, and young fruits of the tree, causing blackening of buds, flower drop, and fruit deformities [5].
Because plant diseases directly affect the quality and yield of agricultural products, early detection of these diseases is of great importance. Currently, artificial intelligence-supported decision support systems are effectively utilized to address such issues. Alshammari et al. (2023) proposed a hybrid model combining the Whale Optimization Algorithm (WOA) with Artificial Neural Networks, achieving an accuracy rate of 98.9% on a dataset consisting of 950 healthy, 890 olive bud mite (Aculus olearius) infected, and 1460 peacock spot disease (Cycloconium oleaginum)-infected olive leaves [7]. Raouhi and his team conducted an experimental study by hybridly integrating various Convolutional Neural Network (CNN) algorithms with optimization methods on a dataset containing 5571 images of six different olive leaf diseases. By combining the MobileNet and Rmsprop algorithms, they achieved an accuracy of 98.48% [8]. Sinha et al. compared histogram equalization and k-means clustering techniques to isolate disease regions and found that the k-means method provided higher accuracy [9]. Dikici et al. trained deep learning models, AlexNet, SqueezeNet, ShuffleNet, and GoogleNet, to classify olive leaf diseases and compared these models. The best result was obtained using the ShuffleNet algorithm, with an accuracy rate of 98.52% [10]. Sarantakos and his team comparatively examined the CNN, Vision Transformer (ViT), and Amazon Web Services (AWS) Rekognition systems, and found that the highest accuracy, 99.6%, was achieved with AWS Rekognition [11]. In another study, Ksibi et al. developed a model called MobiRes, which is a combination of MobileNet and ResNet, by collecting 5400 images with an unmanned aerial vehicle from an olive grove in Saudi Arabia. The model produced successful results with an accuracy rate of 97.08% [12]. In another study by Alshammari, a hybrid approach combining the VGG16 and Vision Transformer algorithms was proposed, achieving 96% accuracy in a multiclass classification task [13]. In a study conducted by Huaquipaco et al., an architecture called SSl-XceVnet, combining the Xception and VGG16 algorithms, was proposed for detecting peacock spots, and an accuracy rate of 95.22% was reported [14]. Uğuz and Uysal compared their self-developed CNN-based model with VGG16 and VGG19; in tests performed on a dataset of 3400 images, they achieved 88% accuracy with the normal dataset and 95% with the augmented dataset, outperforming competing models [15]. The FLVAEGWO-CNN model proposed by Majikumna et al.. presented a hybrid structure combining a variational autoencoder (VAE), grey wolf optimization (GWO), and convolutional neural networks. The experiments achieved an accuracy of 99.2% [16]. Dammak et al. developed a two-stage model: the first stage detected leaves, while the second stage classified the disease type. The proposed system achieved high success rates in classification tasks [17].
In this study, a novel hybrid approach is proposed for the detection of olive leaf diseases by combining the automatic feature extraction capability of deep learning models, which offer high accuracy rates, with the low computational cost advantage of machine learning algorithms. Owing to this hybrid structure, the high hardware requirements of deep learning are reduced, while preserving its capacity to learn meaningful features from data. The developed approach aims to facilitate access to technology for farmers operating at different scales, and to provide cost-effective solutions.
During the testing phase of the proposed hybrid model, ConvNextTiny, DenseNet121, MobileNetV2, and EfficientNetV2B0 were used as feature-extracting deep learning models, whereas the AdaBoost, LightGBM, XGBoost, CatBoost, and GradientBoosting algorithms were utilized as classifiers. Each deep learning model was paired with each machine learning algorithm, creating a total of 20 different combinations, which were experimentally compared. The two most successful model combinations were also evaluated through statistical tests, which demonstrated that the high accuracy rates obtained were statistically significant.
The developed hybrid approach has the potential to detect common diseases in olive groves, such as Peacock Spot (Spilocaea oleagina) and Olive Bud Mite (Aculus olearius), before they spread. Early diagnosis of diseases helps limit environmental impacts by reducing pesticide use and supports the economic sustainability of small- and medium-sized producers. Moreover, minimizing product loss increases the yield volume.
In line with the successful results, the development of a user-friendly mobile application for small- and medium-sized producers is considered feasible. For large-scale olive producers, smart scanning systems integrated with unmanned aerial vehicles are recommended to enable monitoring of larger areas. Thus, it is aimed at offering a scalable, flexible, and technologically accessible solution for producers of various sizes.
2. Materials and Methods
In this study, a hybrid classification approach that combines deep learning and machine learning algorithms is proposed for the detection of diseases observed in the leaves of olive plants, which hold a significant place in global agricultural trade. During the feature extraction phase, the deep learning-based models ConvNextTiny, DenseNet121, MobileNetV2, and EfficientNetV2B0 were used. The feature matrices obtained using these models were evaluated in the classification process using methods from the boosting algorithm family, including AdaBoost, LightGBM, XGBoost, CatBoost, and GradientBoosting. The testing process of the proposed hybrid approach was conducted within the framework of a workflow diagram, where the modeling steps were systematically followed. The overall flow and modeling steps related to this process are presented in detail in Figure 2.
2.1. Data Set
The dataset used in this study was obtained from the open-access data science platform, Kaggle. The images were based on real field data collected from an olive orchard located in Denizli, Turkey [18]. The dataset consists of 3,400 images belonging to three different classes. These classes were categorized as healthy leaves, olive peacock spots, and olive bud mites (Aculus olearius). The number of sample images for each class was 1,050, 1,460, and 890. Sample images from the dataset are presented separately for each class in Figure 3, while detailed numerical information regarding the class distribution is provided in Table 1.
Data Preprocessing Step
Before proceeding to the feature extraction phase with deep learning models, a standard preprocessing procedure was applied to all images in the dataset. In the first step, each image is resized according to the input requirements of the respective deep learning model. The recommended input sizes, parameter counts, and layer depths of the models are listed in Table 2 [19]. During the resizing process, the LANCZOS interpolation filter is preferred to preserve image quality and structural integrity [20]. This filter determines the target pixel value by calculating the weighted average of the surrounding pixels, thereby preserving edge sharpness and fine details in the image. Following the resizing operation, all images were converted into numerical matrices, and normalization was applied to increase the stability of the model training and accelerate the learning process. In this context, each pixel value initially ranging from 0 to 255 was divided by 255 to reduce it to the 0-1 range. Thus, we aimed to ensure that each pixel contributed equally to the model and balanced the gradients. After all preprocessing steps, the dataset consisting of 3400 samples was split into two parts with an 80% training (20% test) ratio: 2720 images were used for training and 680 images for testing.
2.2. Proposed Hybrid Approach
The proposed hybrid approach is based on a two-stage model architecture that combines deep learning-based feature extraction with machine learning-based classification processes. The main goal of this approach is to leverage the automatic feature extraction capability of Convolutional Neural Networks (CNNs) from visual data using transfer learning and to classify these features with machine learning algorithms whose accuracy has been scientifically validated. Thus, by eliminating the need for traditional feature engineering, a more efficient, generalizable, and low-cost solution was provided. The proposed hybrid approach consists of two stages: feature extraction and classification, which are configured using deep learning-based models and machine learning algorithms, respectively.
2.2.1. Feature Extractor Deep Learning Models
In the initial stage of the model architecture, a transfer learning approach was adopted to automatically extract meaningful and distinctive features from the images of olive tree leaves. This method allows CNN-based models that have been pre-trained on large-scale datasets containing millions of images, such as ImageNet [21], to be used not only for classification purposes but also for feature extraction. In this way, while avoiding the high computational cost that would arise from training a model from scratch, more stable and faster learning processes have been achieved by utilizing general-purpose visual representations of the models. Within this scope, four CNN models that stand out in the literature owing to their high accuracy rates and architectural diversity were chosen as feature extractors: MobileNetV2 [22], EfficientV2B0 [23], DenseNet121 [24], and ConvNextTiny [25]. The weights trained on ImageNet for these models were preserved, and only the fully connected layers specific to classification were removed. Thus, for each input image, high-dimensional feature vectors are obtained through the convolutional layers of the models. These features were then used as input data for the machine learning algorithms to be employed in the next step. The role of the selected models in the study and the reasons for their selection are summarized below.
- MobileNetV2: The MobileNetV2 model was primarily included in this study to evaluate its computational efficiency and fast feature extraction performance. The depth-wise separable convolutional blocks used in its architecture significantly reduce the number of parameters and the computational cost of the model. This structural advantage makes the model an ideal candidate for testing its potential in scenarios such as real-time mobile agricultural applications, drone-based image processing, or embedded systems with limited hardware.
- EfficientNetV2B0: The EfficientV2B0 model has been included, as it represents a modern architecture that offers an optimal balance between model size, inference speed, and classification accuracy. The compound scaling principle, which forms the foundation of this model family, enables the network to achieve high performance and efficiency by systematically scaling together key parameters, such as depth, width, and input resolution. Because of this balanced structure, it is a strong candidate, particularly for general-purpose and cloud-based agricultural analysis services that do not focus on a single metric. Therefore, EfficientNetV2B0 is considered an ideal architecture, especially for general-purpose use cases, such as cloud-based agricultural decision support systems.
- DenseNet121: The DenseNet121 model was included in this study to analyze the performance of an architecture with high parameter efficiency. The distinguishing feature of this model is its densely connected structure in which each layer is directly connected to all preceding layers. This architecture encourages the effective reuse of features across layers, while also allowing gradients to flow through the network without vanishing, thus enhancing the learning process. As a result, DenseNet121 has the potential to offer strong learning capacity with fewer parameters, making it a notable option, especially for systems with memory constraints but high accuracy requirements.
- ConvNextTiny: The ConvNextTiny model is a modernized version of the traditional Convolutional Neural Network architecture inspired by transformer-based structures. In this model, 7×7 large kernels were used instead of standard small kernels, allowing for a larger receptive field at each layer. Consequently, the model can learn broader contextual relationships within an image. Supported by contemporary structural components, such as layer normalization, GELU activation, and depthwise convolution, the architecture delivers strong results in both training stability and accuracy performance. Despite its compact structure, ConvNextTiny demonstrates high classification success, making it a suitable candidate for applications, such as offline decision support systems, where accuracy is critical and inference speed is of secondary importance.
After feature extraction was completed with each of the four models, each of the 2,720 training images was represented by a 1,280-dimensional feature vector, resulting in a training matrix of size (2720 × 1280). Similarly, each of the 680 test images was represented by vectors of the same size, yielding a test matrix of size (680 × 1280). These feature matrices were then used as inputs for the classifier machine-learning algorithms in the next stage.
2.2.2. Classifier Machine Learning Models
In the second stage of the hybrid approach, five gradient boosting algorithms based on the ensemble learning principle were chosen to classify the numerical representations obtained through feature extraction. These algorithms include AdaBoost [30], CatBoost [31], GradientBoosting [32], LightGBM [33], and XGBoost [34], which are known for their high accuracy, strong generalization capacity, and ability to work with large datasets. Each classifier model was trained with vectors obtained from the deep learning-based feature extraction models (e.g., DenseNet121 and MobileNetV2) used in the previous stage. The main aim of this comprehensive configuration is to identify the feature extractor-classifier pairing that demonstrates the highest classification performance. The reasons for selecting the preferred algorithms are as follows.
- Adaptive Boosting (AdaBoost) is a pioneer of ensemble learning algorithms that enables the transformation of weak classifiers into strong classifiers by training them sequentially. In each iteration, the learning process of the model was guided by assigning more weights to the examples misclassified by the previous classifier. Owing to this dynamic weight-updating structure, the model achieved a high generalization capacity. In our study, AdaBoost was considered the primary reference model and served as a benchmark for comparatively evaluating the performance of other modern boosting methods. Owing to its simplicity, interpretability, and low requirements for parameter tuning, it has been positioned as an initial benchmark in the modeling process.
- Gradient Boosting The (GB) algorithm aims to increase prediction accuracy through sequentially added weak classifiers that seek to minimize errors. Each new model focuses on improving the error terms produced by the previous model in the gradient direction. This gradient-based optimization mechanism stands out for its flexibility in guiding the learning process according to the loss function. In this respect, GB have a more powerful and flexible structure than AdaBoost. In our study, it has been included as a comparative reference to classical boosting approaches, as it forms the basis for modern and faster variants, such as XGBoost and LightGBM.
- Extreme Gradient Boosting (XGBoost) is an optimized version of the Gradient Boosting algorithm and is frequently preferred in industrial applications. Among its most notable features are support for parallel computation, support for sparse data, resilience against missing data, and integrated L1 and L2 regularization techniques to prevent overfitting. Consequently, it was possible to achieve both high classification accuracy and improved model generalization. In addition, features such as early stopping, tree pruning, and column subsampling make the training process more stable and efficient. Owing to this robust structure, it was considered a high-performance classifier candidate in our study.
- A light-gradient boosting machine (LightGBM) is a boosting algorithm developed specifically to achieve high-speed training with lower memory usage, especially on large datasets. One of the key features that plays an important role in the model’s performance is its use of a leaf-wise strategy instead of the traditional level-wise tree-growing strategy. This method provides a faster convergence by expanding the branch, which reduces the largest loss at each step of the tree. In addition, owing to histogram-based decision splitting, both processing time and memory consumption are significantly reduced. In this study, LightGBM was used to determine whether it provided an optimal balance between the classification accuracy and training time.
- Categorical Boosting (CatBoost) was developed to provide high accuracy in datasets with categorical features. However, it also demonstrates highly effective performance in data structures with numerical features. A notable aspect of CatBoost is its use of the ordered boosting technique, which reduces variance depending on the order of training, and its symmetric tree structure, which helps maintain the structural stability of the model. This approach enables the generation of results that are resistant to overfitting. Additionally, the structure of the model, which exhibits low sensitivity to hyperparameter settings, offers ease of use in practice. In our study, the classification success of numerically derived feature matrices from images was tested experimentally.
The outputs of all training processes conducted with these models were analyzed using evaluation metrics, such as accuracy, precision, recall, and F1-Score. By examining the obtained results, the best-performing feature extractor-classifier pairings were identified and the significance levels were assessed through statistical tests.
2.3. Statistical Tests
The success levels of the two models with the highest accuracy rates, obtained as a result of combinations of the feature extractor and classifier models, were statistically compared. The purpose of this test is to determine whether the observed performance difference is due to chance, and to establish whether the superiority between the models is statistically significant. To determine whether the difference between the classification performance of the two different feature extractor–classifier combinations is statistically significant, a comprehensive analysis process was carried out. In this context, the bootstrap resampling method was applied to each model combination, and 2,000 accuracy values were generated for each model. Using this method, statistical robustness was ensured for a reliable comparison of the accuracy performance distributions without relying on parametric assumptions. In the first stage, the Shapiro-Wilk normality test was applied to examine the distribution characteristics of the obtained accuracy differences prior to the statistical test. The test results indicated that the accuracy differences did not conform to a normal distribution. Because this finding limits the validity of classic parametric tests, the analysis process continued with non-parametric tests to preserve the statistical reliability. Accordingly, the Wilcoxon Signed-Rank test was applied to evaluate the difference between the accuracy of the two paired model groups. This test was preferred, particularly because of its capacity to reliably evaluate even small differences when the distribution assumptions are not met. As a result of the analysis, a statistically significant difference was found between the performances of the two models (p < 0.05). This demonstrates that the hybrid model proposed in this study is superior not only observationally but also from a statistical perspective.
This statistical validation process proves that the obtained classification performances are not the result of random chance but that the proposed model architecture genuinely offers a more effective and reliable solution. Detailed statistical findings, along with comparison metrics, are comprehensively presented under the "Results" section.
2.4. Computational Environment and Implementation Details
All experimental processes were carried out on the cloud-based Google Colab platform, which offers researchers broad access. As for the computational infrastructure, approximately 25% of the system's provided 12 GB RAM capacity was utilized for the studies. The Python programming language was chosen for the modeling stages, and the TensorFlow and Keras libraries were used for deep learning-based feature extraction. On average, the training and testing processes of each feature extractor–classifier model combination ranged from 55 to 65 min. These durations varied depending on factors such as the model architecture, feature dimension, and dataset size. The experimental environment chosen in this study offers a low-cost, sustainable, and easily accessible research infrastructure as it does not require high-end hardware. In this respect, the proposed hybrid approach presents valuable potential not only in terms of technical accuracy, but also in terms of applicability and scalability.
3. Results
In this section, the results of the experimental studies conducted within the scope of the hybrid model approach are presented in detail. First, combinations of four different feature extraction deep learning models and five different machine learning classifiers, as listed in Table 3, were evaluated. In line with this structure, 20 different model combinations were created, and the classification performance of each was comparatively analyzed using various metrics (accuracy, sensitivity, specificity, F1-score, etc.).
When the experimental findings were examined, it was observed that among the proposed hybrid structures, the model combinations MobileNetV2 + XGBoost and DenseNet121 + XGBoost exhibited the highest classification performance. These two structures stood out in key performance metrics, such as accuracy, precision, recall, and F1-score, producing balanced results for all classes. The detailed class-level results achieved by these two models are presented in Table 4 and Table 5, respectively. In particular, the DenseNet121 + XGBoost combination emerged as the most successful structure in this study, with 92% accuracy and an F1-score of 92.33%. Additionally, to visualize the error patterns during the classification process, the confusion matrices for both models are presented in Figure 8 and Figure 9.
Statistical Evaluation
When the overall classification results were evaluated, the combination of the MobileNetV2 + XGBoost model achieved an accuracy rate of 91%, whereas the DenseNet121 + XGBoost combination demonstrated the highest success with an accuracy rate of 92%. The similarly high performance exhibited by these two models necessitated the question of whether the difference between them was statistically significant. In this context, the statistical tests detailed under the “2. The Materials and Methods” section was applied. As a result of the analyses conducted, the p-value obtained at the 0.05 significance level revealed that the DenseNet121 + XGBoost combination was significantly superior to the MobileNetV2 + XGBoost combination. This result indicates that the observed performance difference is not coincidental but rather a structural superiority arising from the model architecture. Thus, it was statistically validated that the DenseNet121-based hybrid model was the most robust classification approach proposed in this study.
4. Discussion
The classification results obtained within the scope of the proposed hybrid approach demonstrated performance comparable to the success rates reported in deep-learning-based disease detection studies in the literature. In experimental analyses based on model comparisons, the DenseNet121 + XGBoost combination yielded the best results across all metrics and was also found to be statistically significant. This finding is important not only in terms of observational evidence but also for model selection based on statistical reliability.
When examining the deep-learning models used for feature extraction in this study, it was observed that the results were not directly related to the number of parameters in the model. For example, ConvNextTiny, which has one of the lowest classification performances, has approximately 28.6 million parameters and 50 layers, while the DenseNet121 model, which showed the highest success, operates with 8.1 million parameters yet consists of a much deeper structure with 242 layers. Similarly, the second most successful model, MobileNetV2, consists of only 3.5 million parameters and 105 layers. On the other hand, another model with low performance, EfficientNetV2B0, comprises 7.2 million parameters and approximately 55–60 layers. These findings suggest that model performance may be closely related not only to parameter size but also to architectural depth and layer connectivity. This underscores the need for a detailed examination of the factors affecting model performance, particularly on imbalanced datasets, and highlights the necessity for further studies in this context.
Another important point is that the model was trained solely on raw data with only basic preprocessing steps applied, and no data augmentation techniques were used. This shows that the proposed method is suitable for a straightforward and direct application scenario, and that satisfactory results can be achieved even without steps such as data augmentation, which could artificially enhance the performance. This feature also ensures that the model is more directly transferable to real-world scenarios without data manipulation.
Additionally, all training and testing processes for the proposed system were carried out on the Google Colab platform with limited resources; all stages were successfully completed using only 25% of the 12 GB RAM. This demonstrates that the model, with its low computational requirements, has the potential to be a cost-effective, accessible, and practical decision-support system. Given that deep-learning-based approaches are usually limited by high hardware requirements, the capacity of this study to offer a practical solution, particularly for small- and medium-sized producers, is noteworthy. In this regard, it is considered that the proposed model should be evaluated as a sustainable artificial intelligence solution not only in terms of accuracy but also in terms of hardware independence, computational efficiency, and easy accessibility.
These results indicate that the developed hybrid model has the potential to detect diseases commonly found in olive groves, such as Olive Peacock Spot and Olive Bud Mite, before they spread. Early detection of these diseases not only limits the environmental impact by reducing pesticide use but also increases productivity and supports economic sustainability by preventing crop loss. In this context, a roadmap is proposed for the integration of the model into the field: mobile application-based solutions should be developed for small producers, whereas integrated remote sensing systems with unmanned aerial vehicles are recommended for large producers.
5. Conclusions
Within the scope of this study, the proposed hybrid model approach offers an effective, accessible, and low-cost solution for the early detection of common diseases observed in olive leaves by combining deep-learning-based feature extraction with machine learning classifiers. In particular, the success rates obtained by combining highly parameter-efficient models, such as DenseNet121 and MobileNetV2, with the XGBoost algorithm are comparable to many high-end systems reported in the literature. The experimental findings regarding the model performance supported the reliability of the proposed system not only in terms of basic metrics, such as accuracy, but also by demonstrating statistically significant differences. Moreover, the fact that the model was able to achieve satisfactory results without the application of data augmentation using only basic preprocessing steps strengthens the direct applicability of the proposed method in real-world scenarios. Owing to its advantage of being operable with limited hardware resources, the system has the potential to appeal to a wide range of users, particularly small- and medium-sized producers. In this respect, one of the main contributions of this study is the design of a decision support system that is applicable in the field, requires few system resources, and supports environmental and economic sustainability.
In future studies, we plan to adapt the proposed model to different agricultural products and larger datasets, comparatively examine the effects of data augmentation techniques, and implement integration with field-specific mobile or drone-based applications.
Author Contributions
Conceptualization, U.Ş. and F.S.A.; methodology, U.Ş.; software, F.S.A.; validation, U.Ş. and F.S.A.; formal analysis, U.Ş.; investigation, U.Ş.; resources, F.S.A.; data curation, U.Ş.; writing—original draft preparation, U.Ş.; writing—review and editing, F.S.A.; visualization, F.S.A.; supervision, U.Ş.; project administration, U.Ş. All the authors have read and agreed to the published version of the manuscript.
Funding
This study received no external funding.
Data Availability Statement
The data presented in this study are openly available in the Olive Leaf Image Dataset at https://www.kaggle.com/datasets/habibulbasher01644/olive-leaf-image-dataset
Acknowledgments
During the preparation of this manuscript, the authors used OpenAI’s ChatGPT-4 (June 2024 version) for academic writing assistance, language refinement, and technical content organization. The authors have reviewed and edited the output and take full responsibility for the content of this publication
Conflicts of Interest
The authors declare no conflict of interest.
References
- World Market of Olive Oil and Table Olives - Data From December 2024 - International Olive Council. Available online: https://www.internationaloliveoil.org/world-market-of-olive-oil-and-table-olives-data-from-december-2024/ (accessed on 2 July 2025).
- Yörükoğlu, T.; Dayısoylu, K.S.; Ançel, T.; Özdemir, Y. Dünyada Zeytin ve Zeytinyağı Üretimi ve Türkiye’deki Zeytinlerin ve Zeytinyağlarının Coğrafi İşaret Tescili Açısından Değerlendirilmesi. Bahçe 2025, 54, 17–24. [Google Scholar] [CrossRef]
- Özözen, S. Türkiye’nin Zeytin ve Zeytinyağı Sektöründe Küresel Rekabet Gücünün Değerlendirilmesi. Yönetim Bilimleri Dergisi 2024, 22, 1084–1117. [Google Scholar] [CrossRef]
- Najafi, S.; Saremi, H.; Jafary, H.; Dadras, A. Evaluation of the Relative Resistance of Different Olive Cultivars to Olive Peacock Spot Disease Caused by Venturia Oleaginea. Journal of Plant Diseases and Protection 2023, 130, 361–369. [Google Scholar] [CrossRef]
- Ersin, F.; Kaptan, S.; Erten, L.; Köktürk, H.; Gümüşay, B.; Denizhan, E.; Çakmak, İ. Mite Diversity and Population Dynamics of Eriophyid Mites on Olive Trees in Western Turkey. Turkish Journal of Entomology 2020, 44, 123–132. [Google Scholar] [CrossRef]
- Estudillo, C.; Pérez-Rial, A.; Guerrero-Páez, F.A.; Díez, C.M.; Moral, J.; Die, J. V. Characterization of Olive-Resistant Genes Against Spilocaea Oleagina, the Causal Agent of Scab. Agronomy 2025, 15, 452. [Google Scholar] [CrossRef]
- Alshammari, H.H.; Taloba, A.I.; Shahin, O.R. Identification of Olive Leaf Disease through Optimized Deep Learning Approach. Alexandria Engineering Journal 2023, 72, 213–224. [Google Scholar] [CrossRef]
- Raouhi, E.M.; Lachgar, M.; Hrimech, H.; Kartit, A. Optimization Techniques in Deep Convolutional Neuronal Networks Applied to Olive Diseases Classification. Artificial Intelligence in Agriculture 2022, 6, 77–89. [Google Scholar] [CrossRef]
- Sinha, A.; Shekhawat, R.S. Olive Spot Disease Detection and Classification Using Analysis of Leaf Image Textures. Procedia Comput Sci 2020, 167, 2328–2336. [Google Scholar] [CrossRef]
- Dikici, B.; Bekçioğulları, M.F.; Açıkgöz, H.; Korkmaz, D. Zeytin Yaprağındaki Hastalıkların Sınıflandırılmasında Ön Eğitimli Evrişimli Sinir Ağlarının Performanslarının İncelenmesi. Konya Journal of Engineering Sciences 2022, 10, 535–547. [Google Scholar] [CrossRef]
- Sarantakos, T.; Gutierrez, D.M.J.; Amaxilatis, D. Olive Leaf Infection Detection Using the Cloud-Edge Continuum. In; 2024; pp. 25–37.
- Ksibi, A.; Ayadi, M.; Soufiene, B.O.; Jamjoom, M.M.; Ullah, Z. MobiRes-Net: A Hybrid Deep Learning Model for Detecting and Classifying Olive Leaf Diseases. Applied Sciences 2022, 12, 10278. [Google Scholar] [CrossRef]
- Alshammari, H.; Gasmi, K.; Ben Ltaifa, I.; Krichen, M.; Ben Ammar, L.; Mahmood, M.A. Olive Disease Classification Based on Vision Transformer and CNN Models. Comput Intell Neurosci 2022, 2022, 1–10. [Google Scholar] [CrossRef]
- Huaquipaco, S.; Vera, O.; Yana-Mamani, V.; Mamani, W.; Calsina, H.; Puma, F.; Morales-Rojas, E.; Beltran, N.; Cruz, J. Peacock Spot Detection in Olive Leaves Using Self Supervised Learning in an Assembly Meta-Architecture. IEEE Access 2024, 12, 192828–192839. [Google Scholar] [CrossRef]
- Uğuz, S.; Uysal, N. Classification of Olive Leaf Diseases Using Deep Convolutional Neural Networks. Neural Comput Appl 2021, 33, 4133–4149. [Google Scholar] [CrossRef]
- Majikumna, K.U.; Zineddine, M.; Alaoui, A.E.H. FLVAEGWO-CNN: Grey Wolf Optimisation-Based CNN for Classification of Olive Leaf Disease via Focal Loss Variational Autoencoder. Journal of Phytopathology 2024, 172. [Google Scholar] [CrossRef]
- Dammak, M.; Makhloufi, A.; Louati, B.; Kallel, A. Detection and Classification of Olive Leaves Diseases Using Machine Learning Algorithms. In; 2024; pp. 292–304.
- Olive Leaf Image Dataset. Available online: https://www.kaggle.com/datasets/habibulbasher01644/olive-leaf-image-dataset (accessed on 2 July 2025).
- Keras Applications. Available online: https://keras.io/api/applications/ (accessed on 2 July 2025).
- Duchon, C.E. Lanczos Filtering in One and Two Dimensions. Journal of Applied Meteorology (1962-1982) 1979, 18, 1016–1022. [Google Scholar] [CrossRef]
- Krizhevsky, A.; Sutskever, I.; Hinton, G.E. ImageNet Classification with Deep Convolutional Neural Networks. Commun ACM 2017, 60, 84–90. [Google Scholar] [CrossRef]
- Dong, K.; Zhou, C.; Ruan, Y.; Li, Y. MobileNetV2 Model for Image Classification. In Proceedings of the 2020 2nd International Conference on Information Technology and Computer Application (ITCA); IEEE, December 2020; pp. 476–480. [Google Scholar]
- Singh, G.; Guleria, K.; Sharma, S. A Pre-Trained EfficientNetV2B0 Model for the Accurate Classification of Fake and Real Images. In Proceedings of the 2024 8th International Conference on Electronics, November 6 2024, Communication and Aerospace Technology (ICECA); IEEE; pp. 1082–1086.
- Arulananth, T.S.; Prakash, S.W.; Ayyasamy, R.K.; Kavitha, V.P.; Kuppusamy, P.G.; Chinnasamy, P. Classification of Paediatric Pneumonia Using Modified DenseNet-121 Deep-Learning Model. IEEE Access 2024, 12, 35716–35727. [Google Scholar] [CrossRef]
- Rachmawan Atmaji Perdana; Aniati Murni Arimurthy; Risnandar Remote Sensing Scene Classification Using ConvNeXt-Tiny Model with Attention Mechanism and Label Smoothing. Jurnal RESTI (Rekayasa Sistem dan Teknologi Informasi) 2024, 8, 389–400. [CrossRef]
- Shahoveisi, F.; Taheri Gorji, H.; Shahabi, S.; Hosseinirad, S.; Markell, S.; Vasefi, F. Application of Image Processing and Transfer Learning for the Detection of Rust Disease. Sci Rep 2023, 13, 5133. [Google Scholar] [CrossRef]
- Ahmed, T.; Sabab, N.H.N. Classification and Understanding of Cloud Structures via Satellite Images with EfficientUNet. SN Comput Sci 2022, 3, 99. [Google Scholar] [CrossRef]
- Dalvi, P.P.; Edla, D.R.; Purushothama, B.R. DenseNet-121 Model for Diagnosis of COVID-19 Using Nearest Neighbour Interpolation and Adam Optimizer. Wirel Pers Commun 2024, 137, 1823–1841. [Google Scholar] [CrossRef]
- Sun, J.; Yuan, B.; Sun, Z.; Zhu, J.; Deng, Y.; Gong, Y.; Chen, Y. MpoxNet: Dual-Branch Deep Residual Squeeze and Excitation Monkeypox Classification Network with Attention Mechanism. Front Cell Infect Microbiol 2024, 14. [Google Scholar] [CrossRef] [PubMed]
- Cao, Y.; Miao, Q.-G.; Liu, J.-C.; Gao, L. Advance and Prospects of AdaBoost Algorithm. Acta Automatica Sinica 2013, 39, 745–758. [Google Scholar] [CrossRef]
- Hancock, J.T.; Khoshgoftaar, T.M. CatBoost for Big Data: An Interdisciplinary Review. J Big Data 2020, 7, 94. [Google Scholar] [CrossRef]
- Bentéjac, C.; Csörgő, A.; Martínez-Muñoz, G. A Comparative Analysis of Gradient Boosting Algorithms. Artif Intell Rev 2021, 54, 1937–1967. [Google Scholar] [CrossRef]
- Zeng, H.; Yang, C.; Zhang, H.; Wu, Z.; Zhang, J.; Dai, G.; Babiloni, F.; Kong, W. A LightGBM-Based EEG Analysis Method for Driver Mental States Classification. Comput Intell Neurosci 2019, 2019, 1–11. [Google Scholar] [CrossRef]
- Chen, T.; Guestrin, C. XGBoost. In Proceedings of the Proceedings of the 22nd ACM SIGKDD International Conference on Knowledge Discovery and Data Mining; ACM: New York, NY, USA, August 13, 2016; pp. 785–794. [Google Scholar]
Figure 1.
Ring Spot Disease observed on the leaves and fruit of the olive tree [6].
Figure 1.
Ring Spot Disease observed on the leaves and fruit of the olive tree [6].
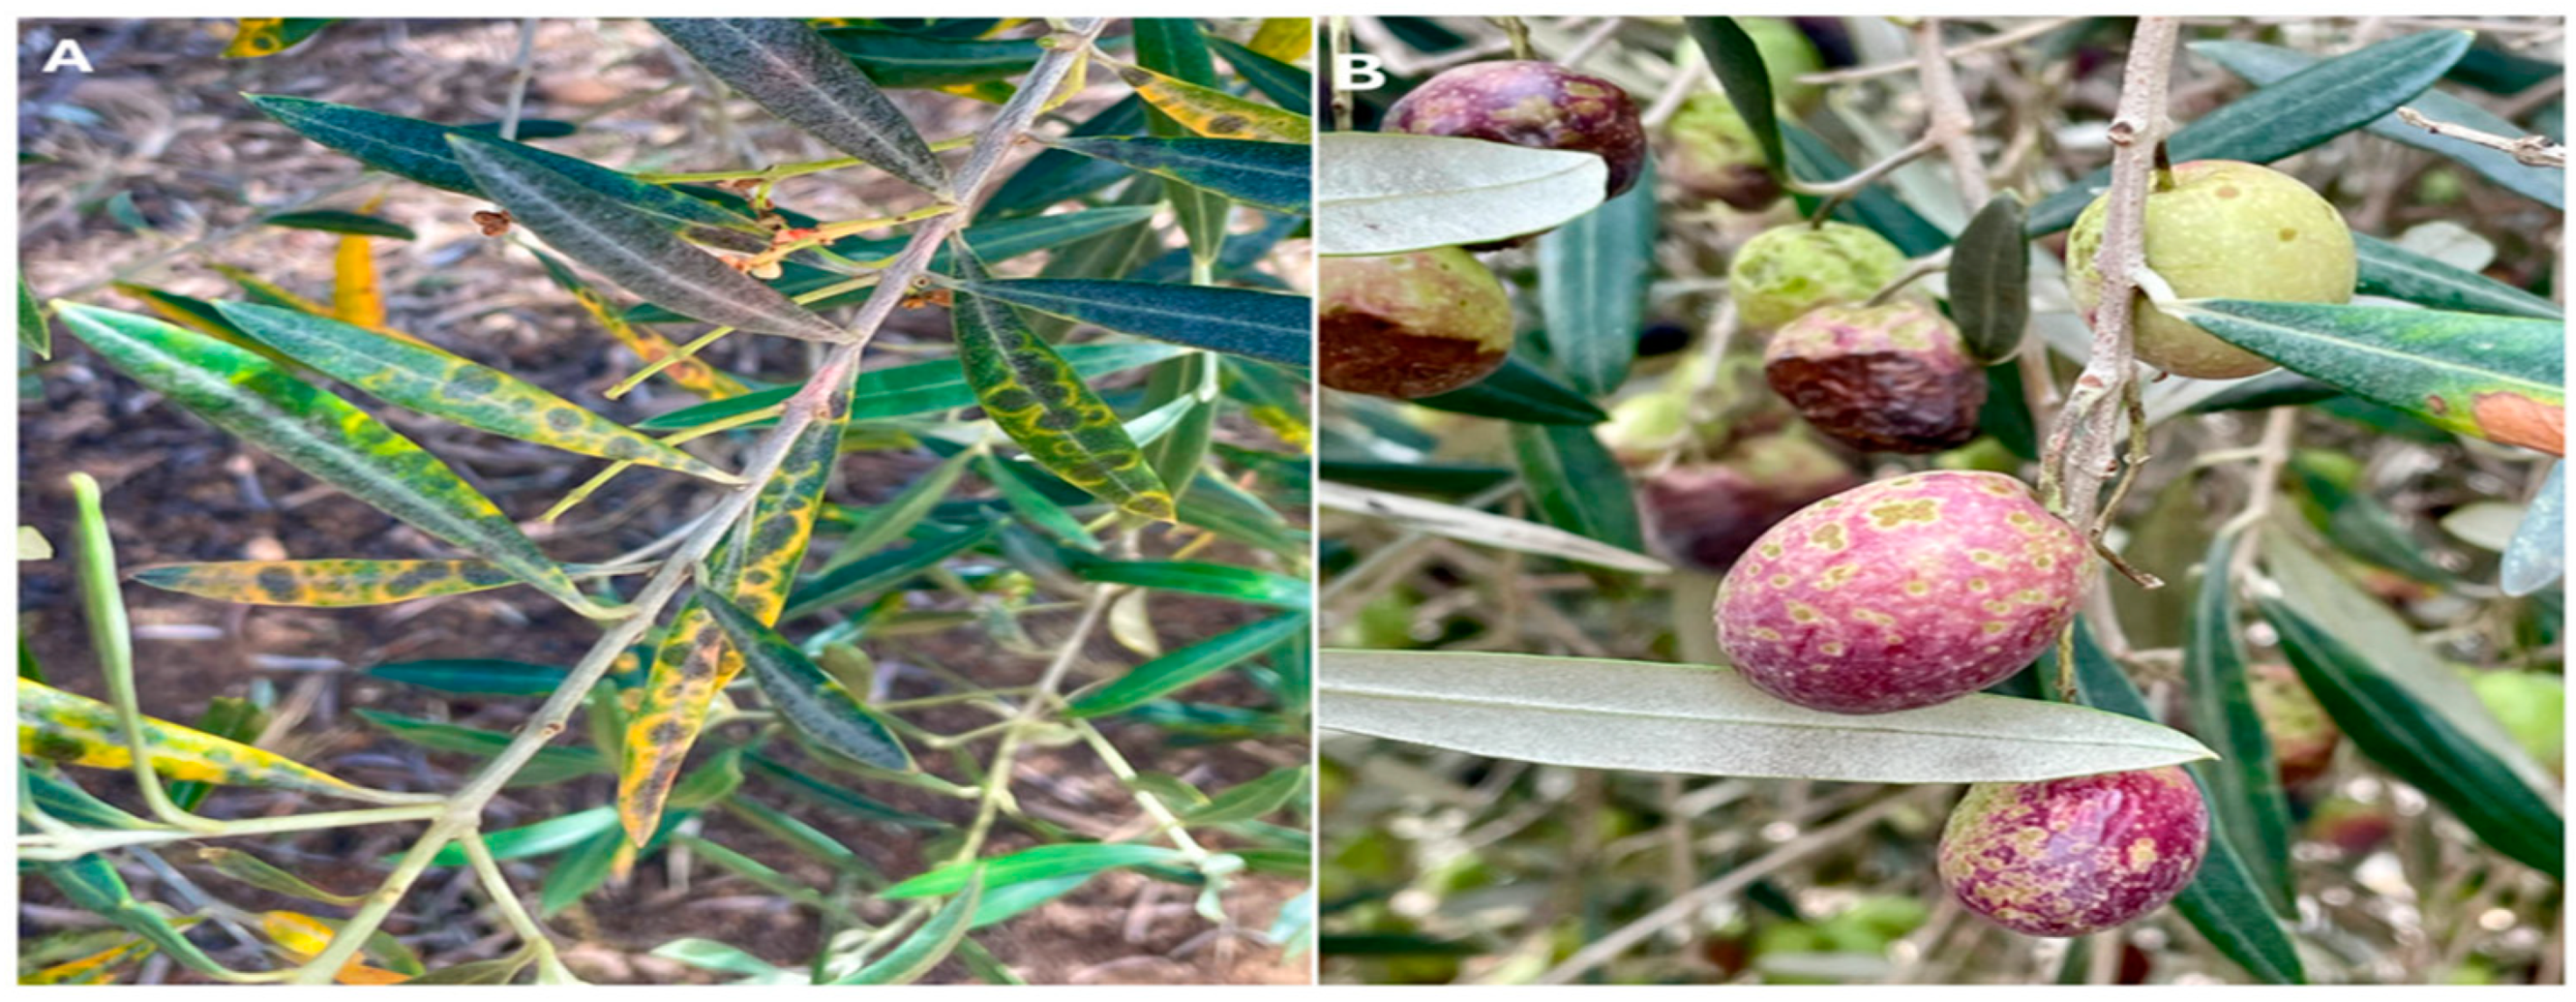
Figure 2.
Workflow of the Proposed Deep Learning-Based Feature Extraction and Gradient Boosting Classification Model.
Figure 2.
Workflow of the Proposed Deep Learning-Based Feature Extraction and Gradient Boosting Classification Model.

Figure 3.
Sample images from each class in the dataset.
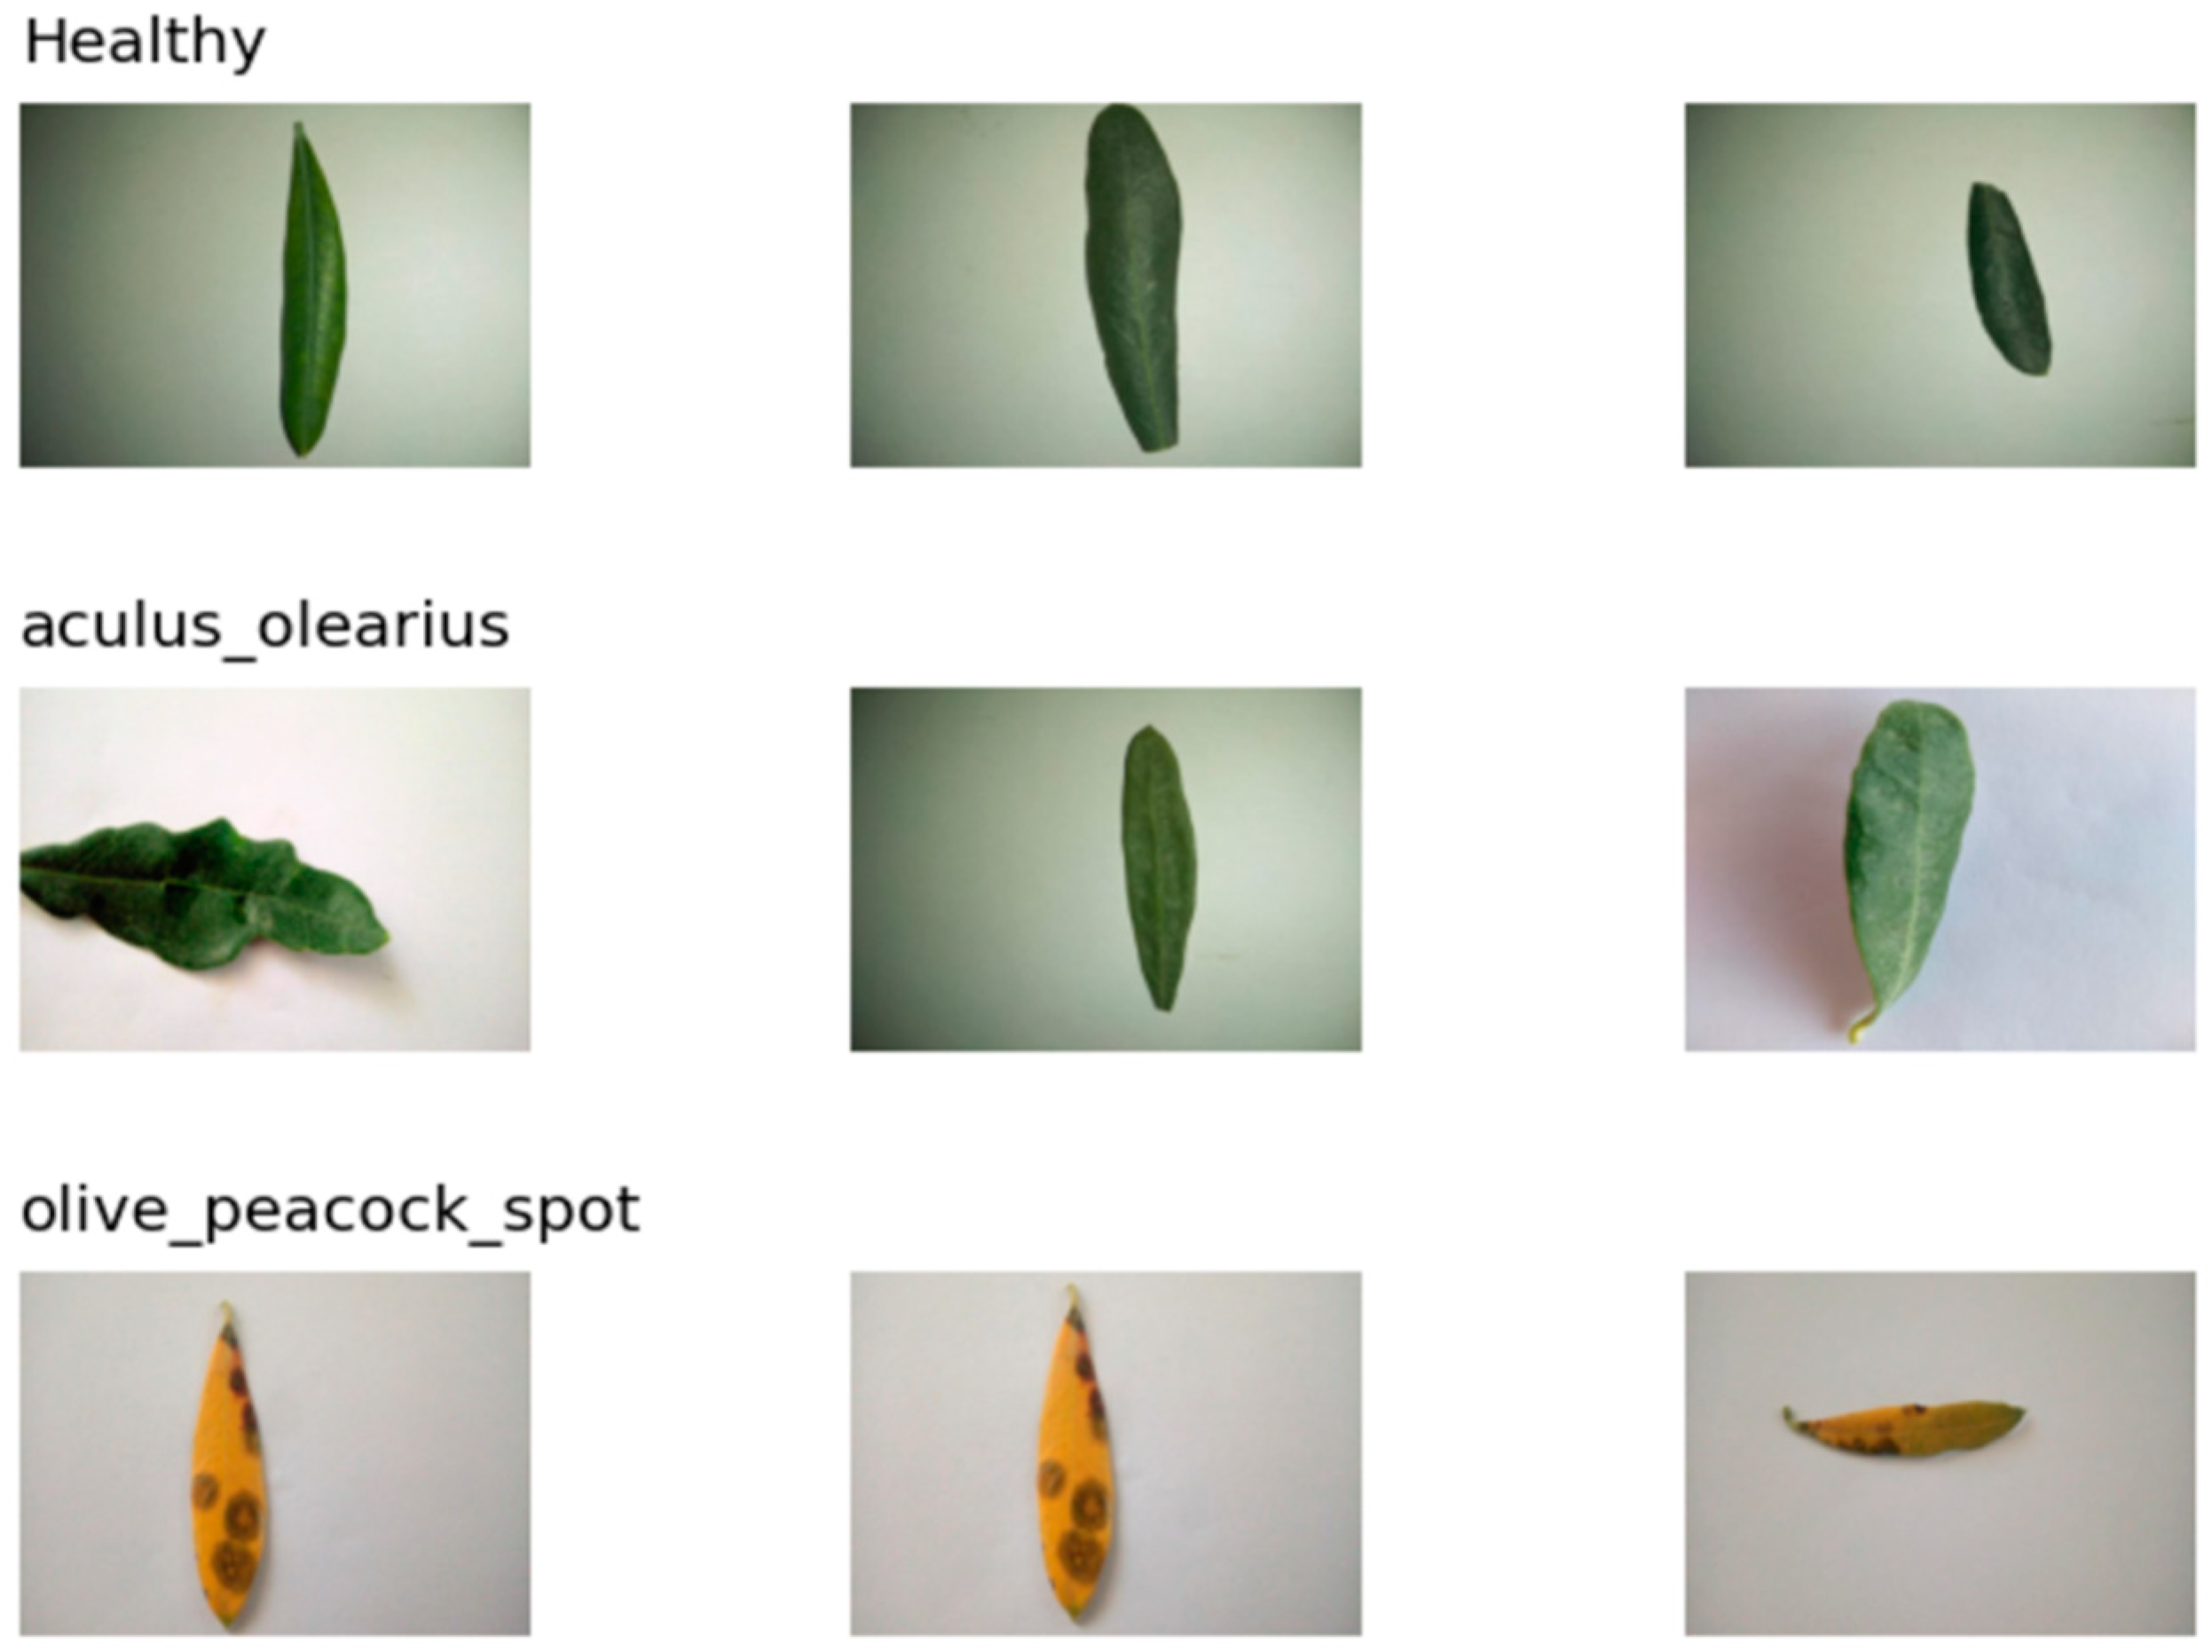
Figure 4.
MobileNetV2 Architecture [26].
Figure 4.
MobileNetV2 Architecture [26].

Figure 5.
EfficientNetV2B0 Architecture [27].
Figure 5.
EfficientNetV2B0 Architecture [27].
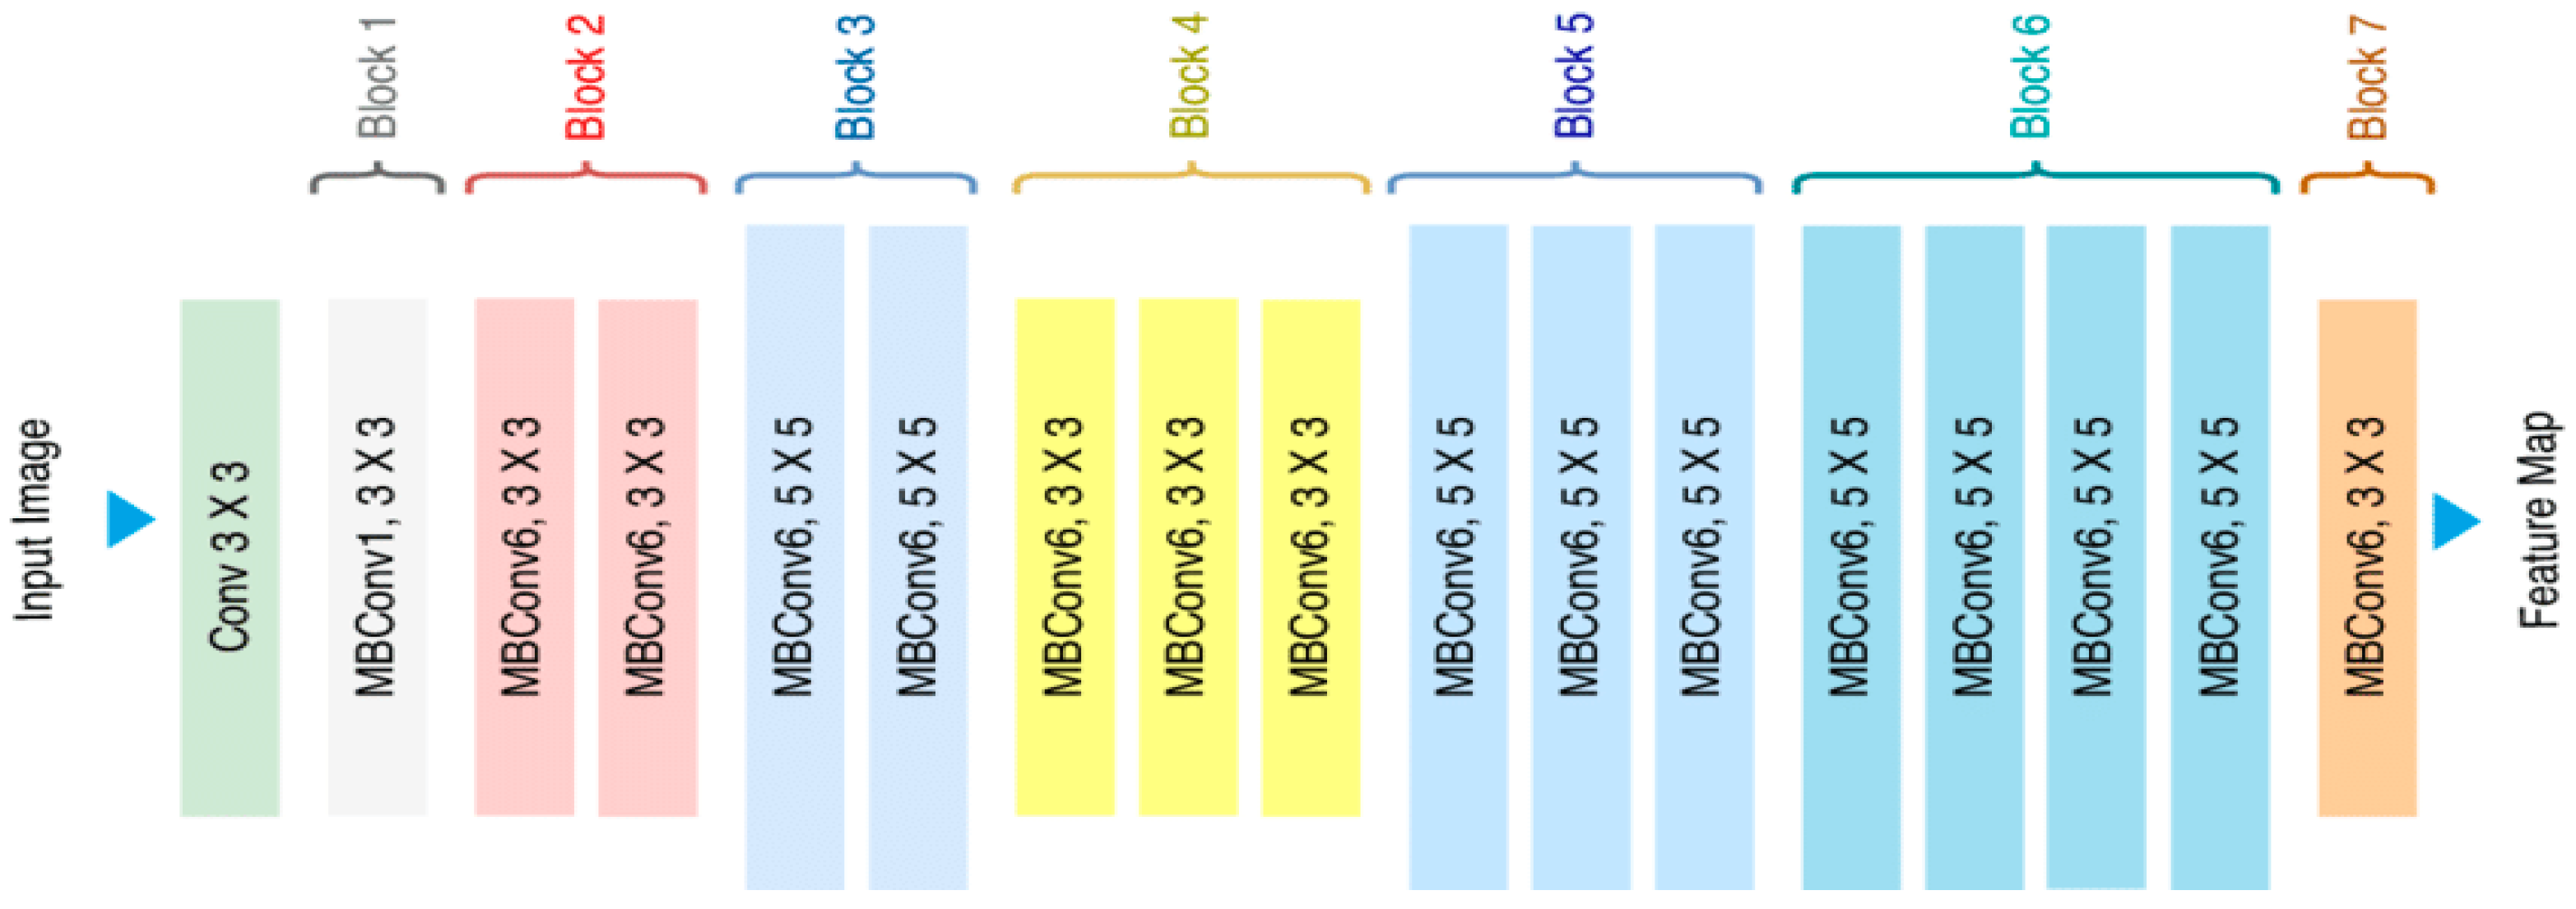
Figure 6.
DenseNet121 Architecture [28].
Figure 6.
DenseNet121 Architecture [28].
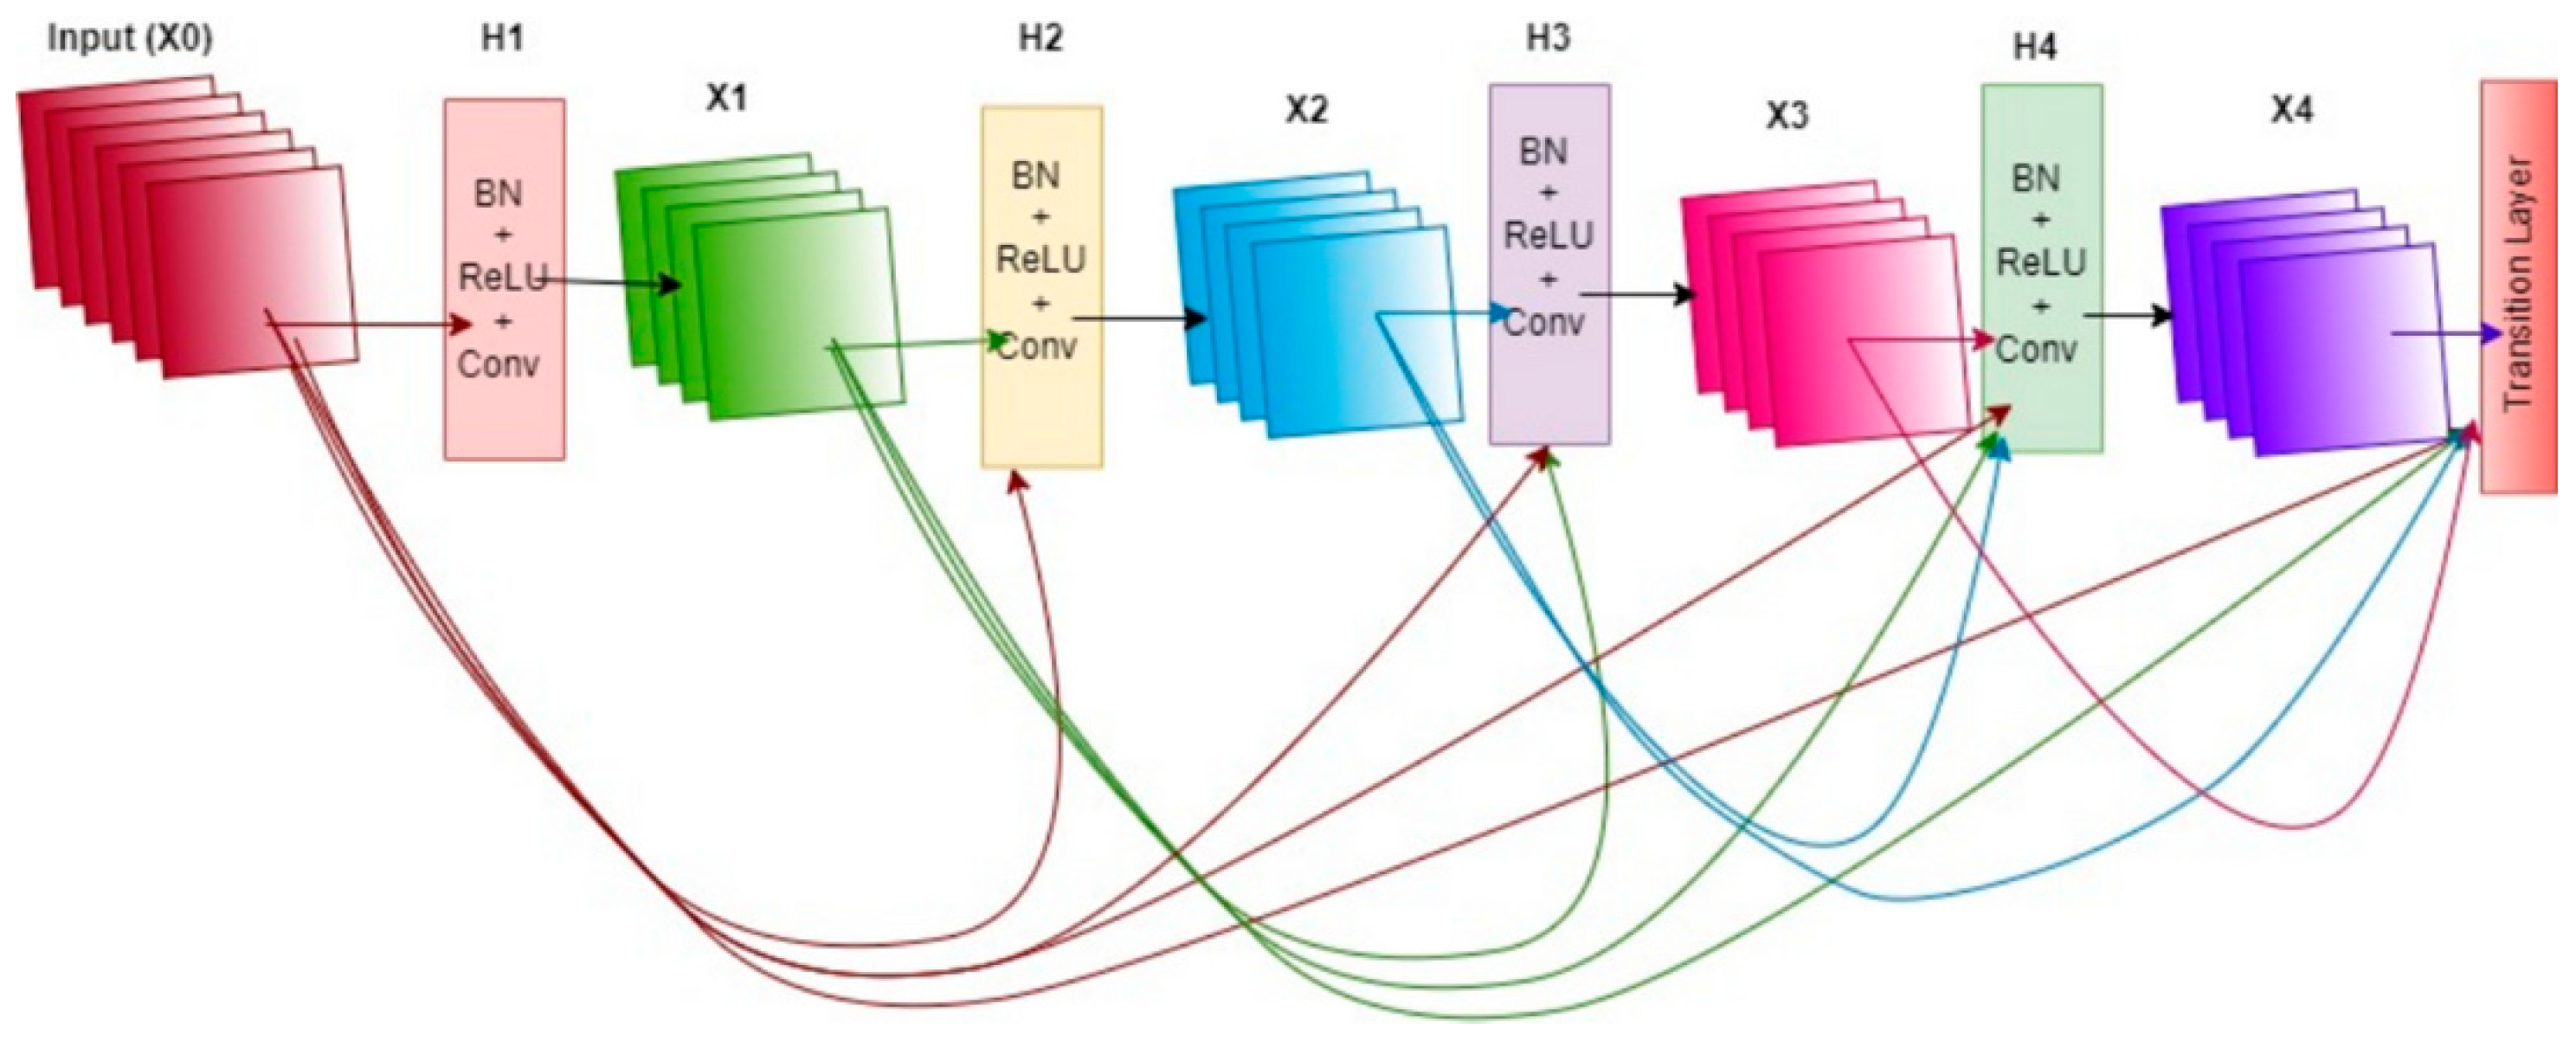
Figure 7.
ConvNext-Tiny Architecture [29].
Figure 7.
ConvNext-Tiny Architecture [29].
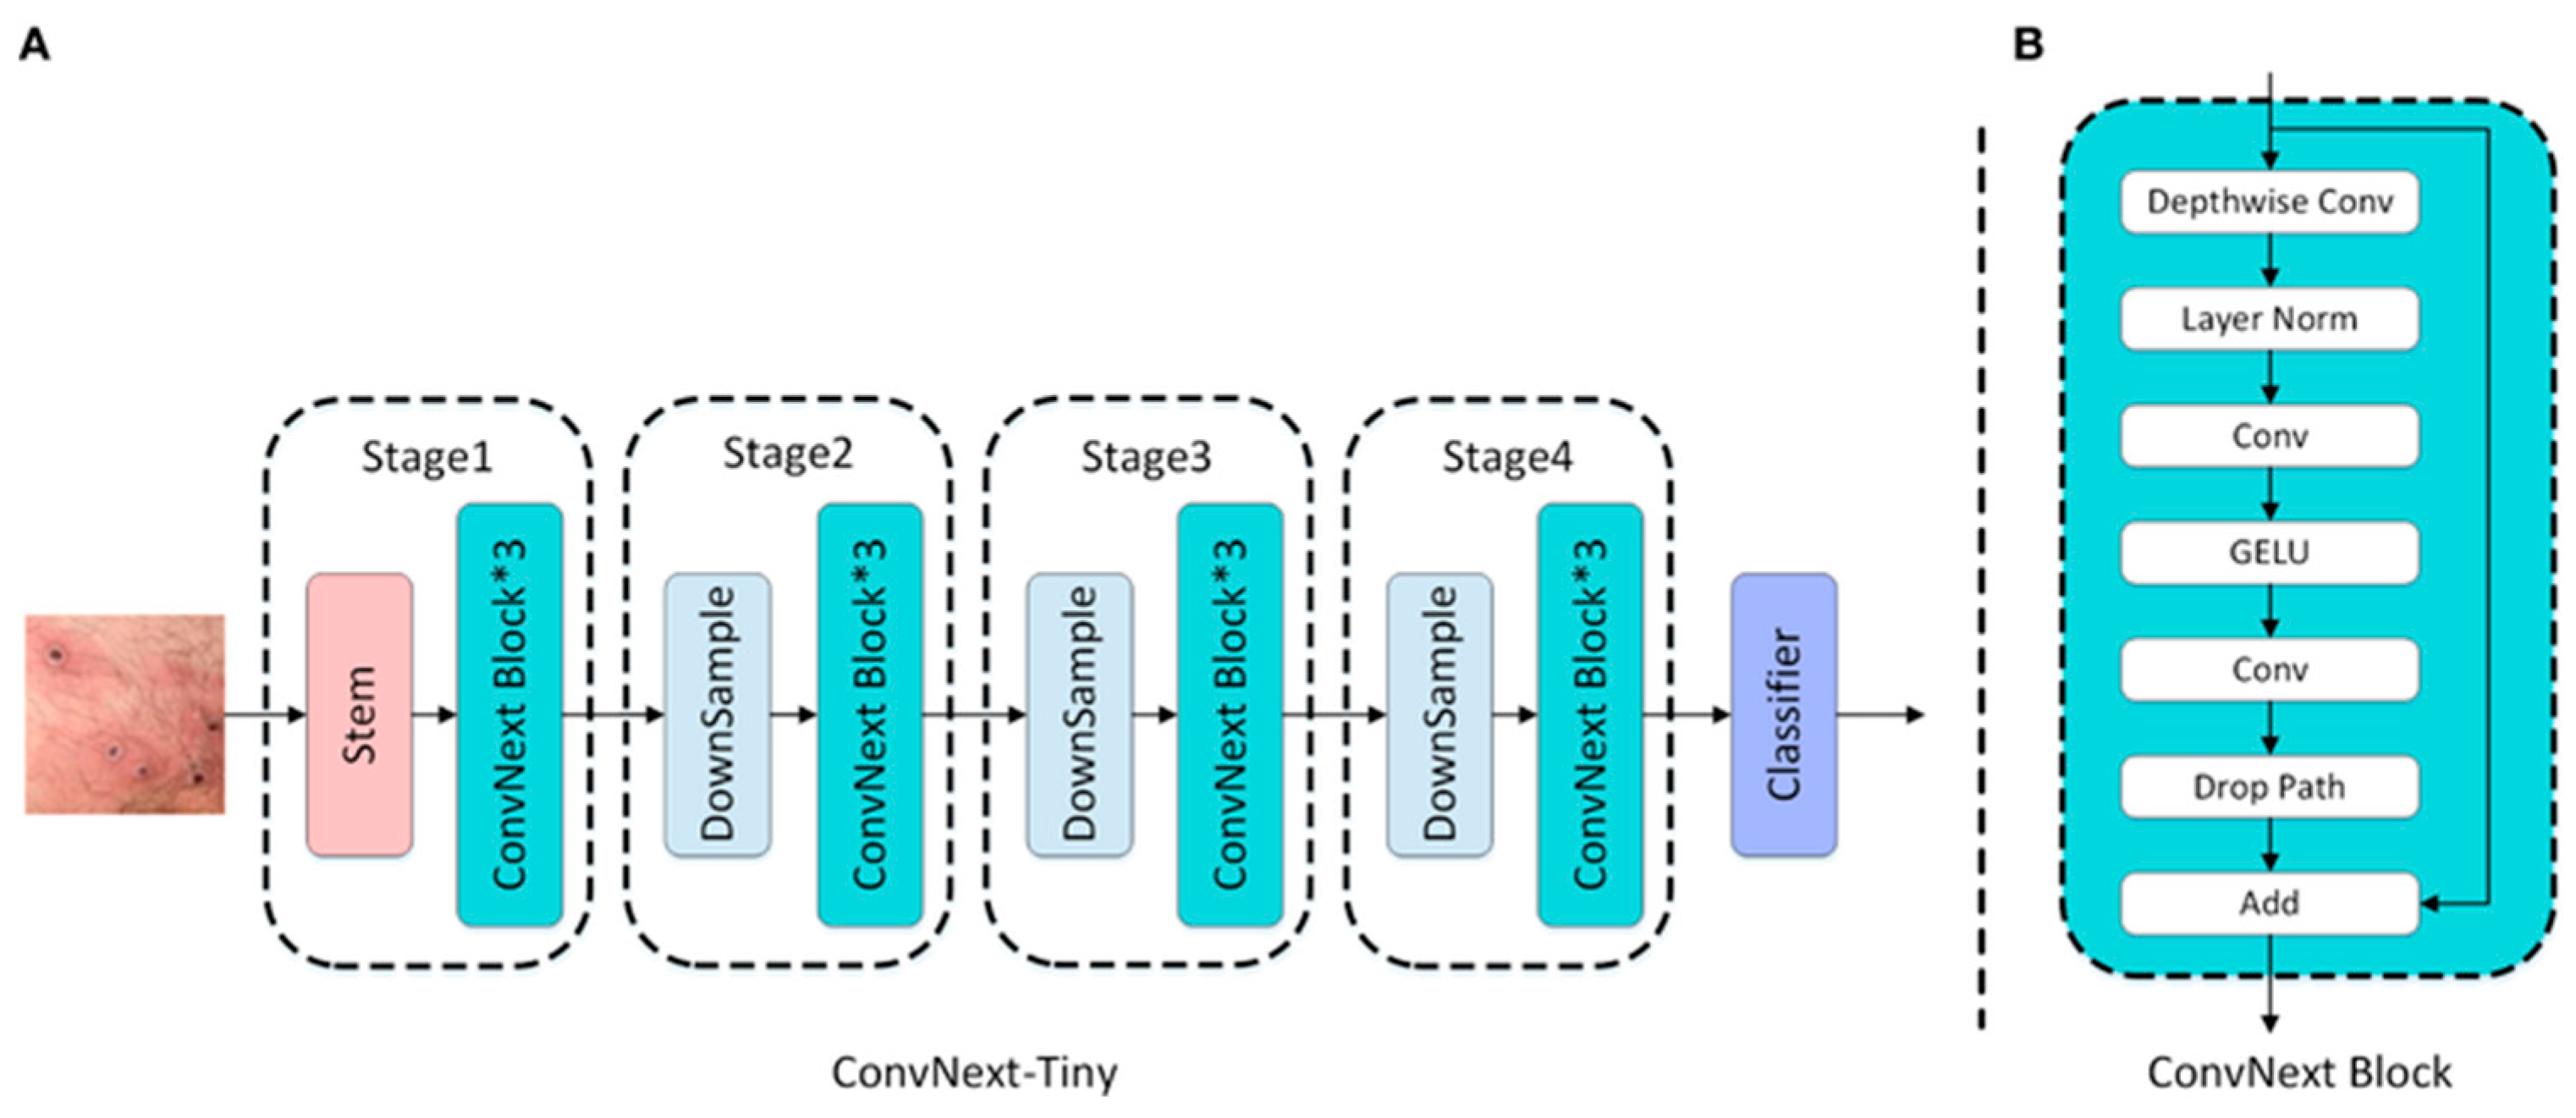
Figure 8.
Confusion matrix of the MobileNetV2 + XGBoost hybrid model for class-level prediction performance.
Figure 8.
Confusion matrix of the MobileNetV2 + XGBoost hybrid model for class-level prediction performance.
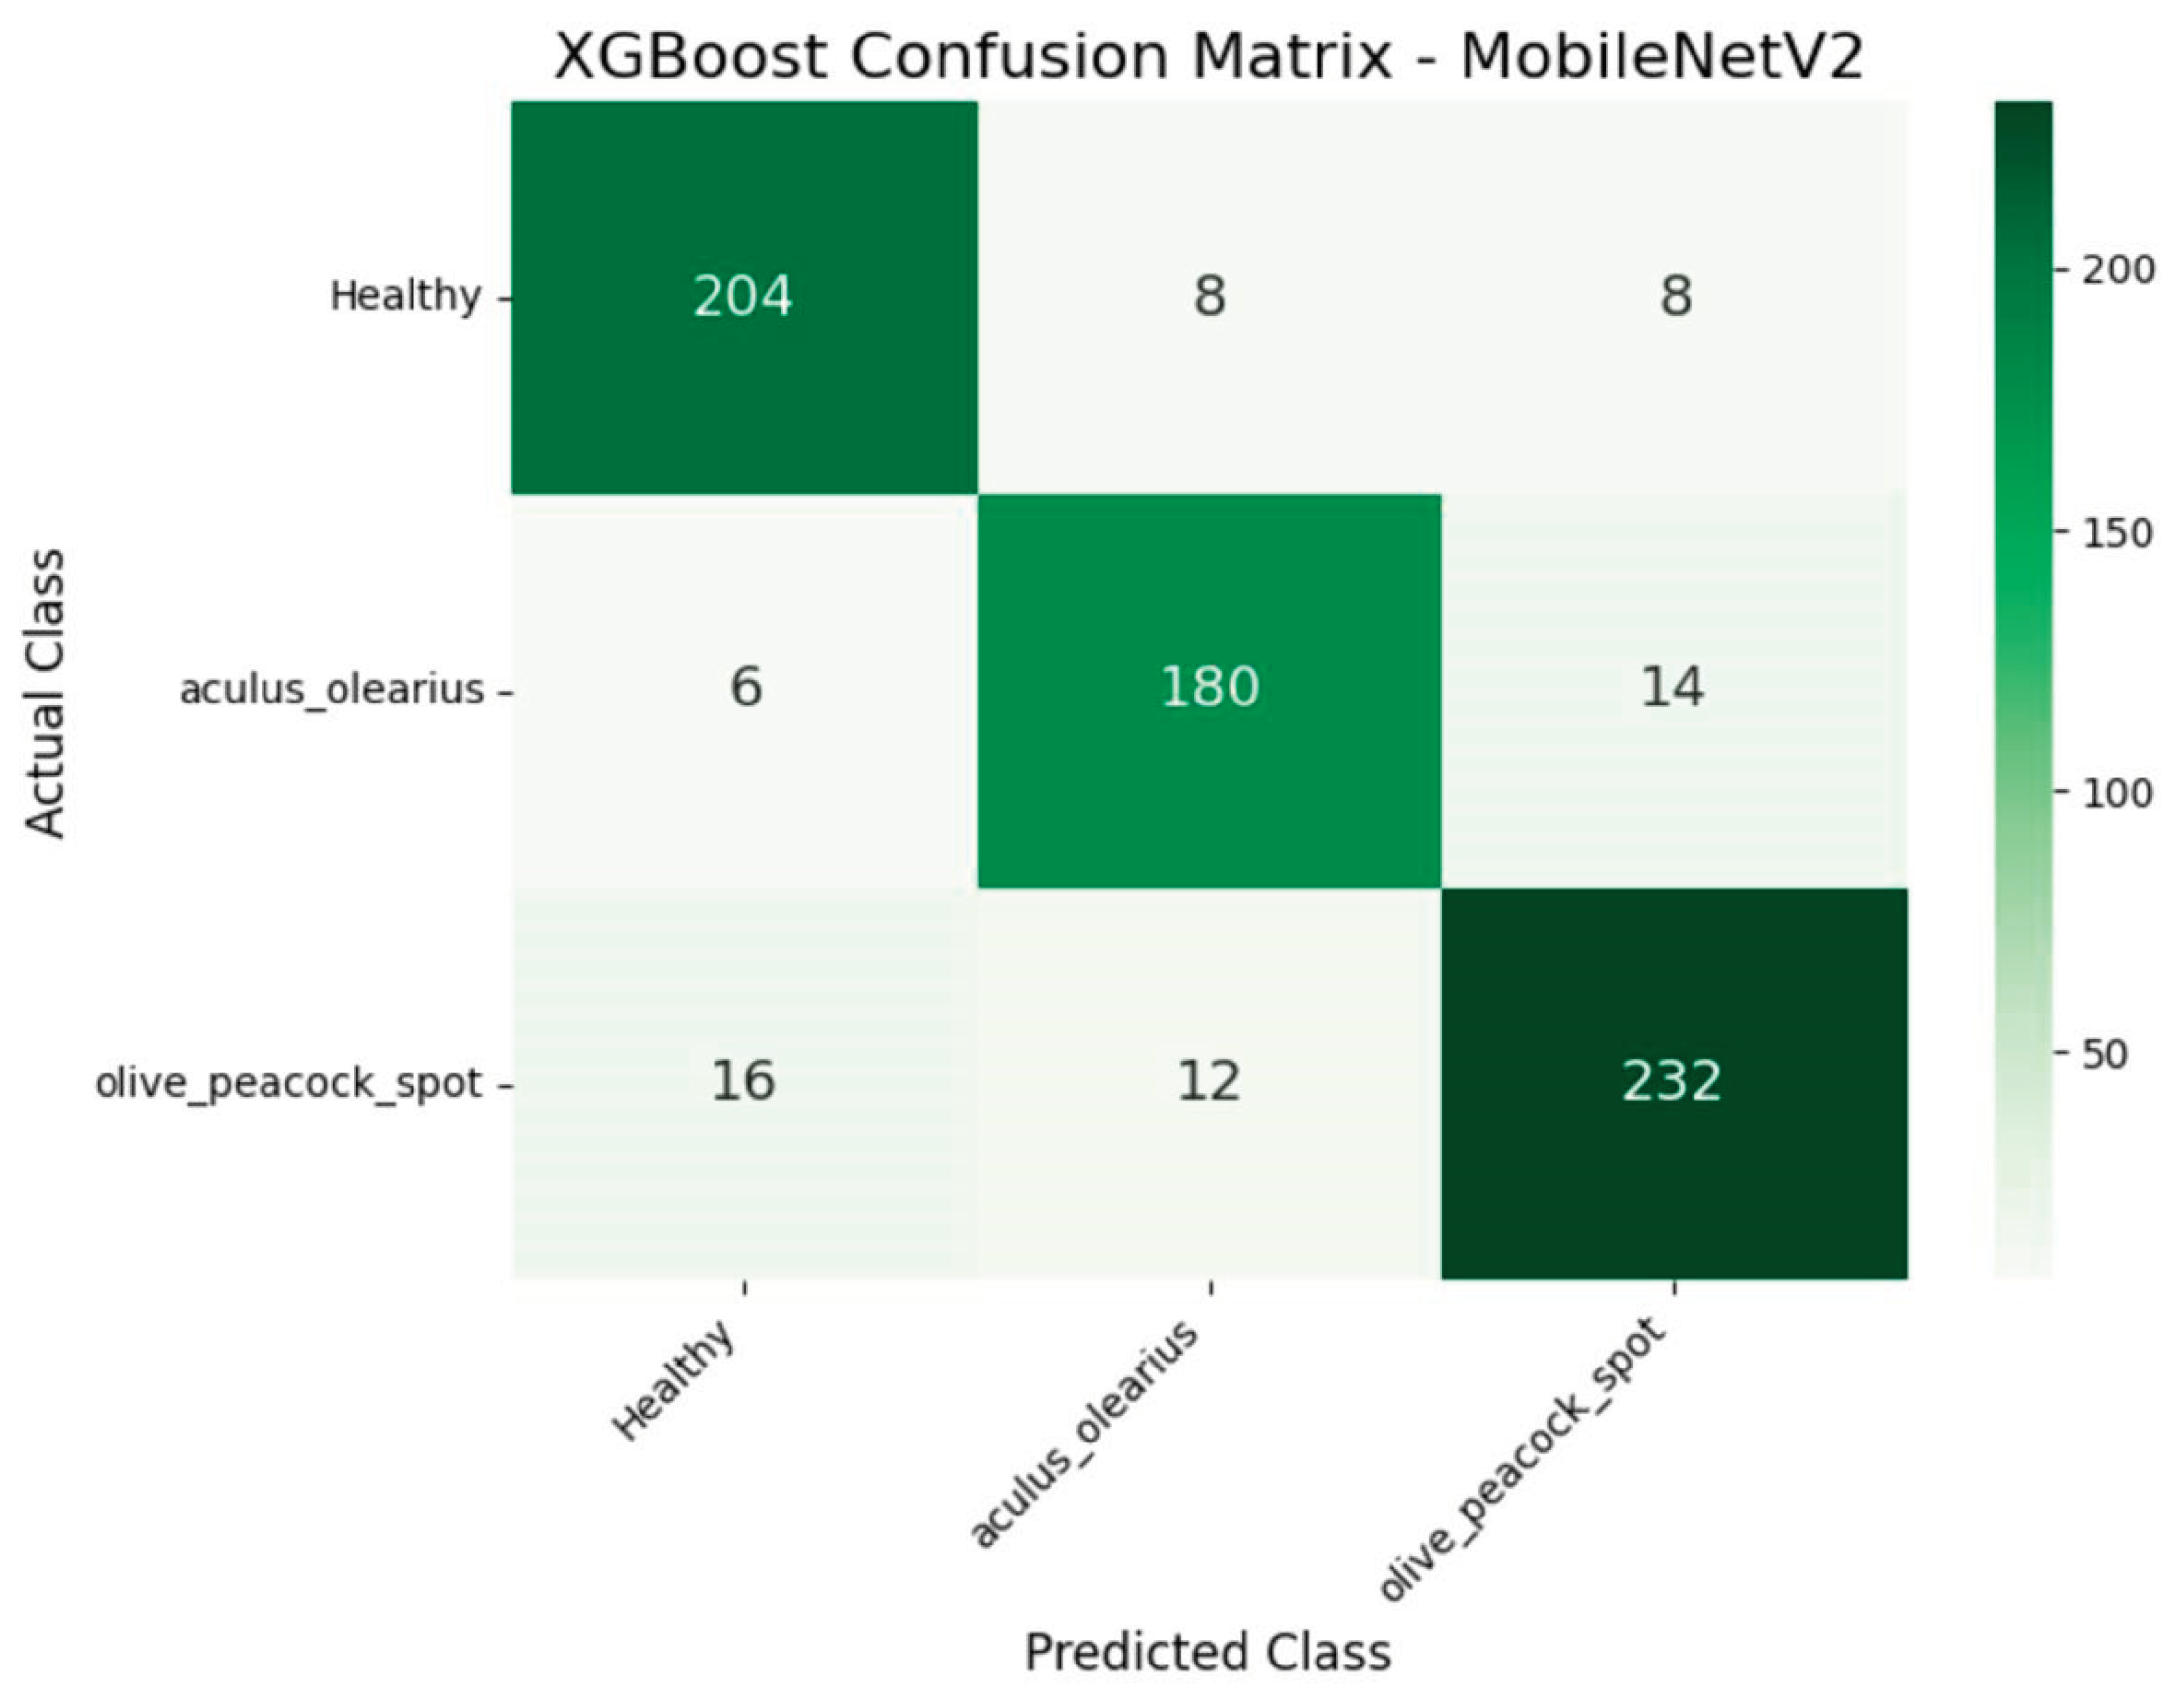
Figure 9.
Confusion matrix of the DenseNet121 + XGBoost hybrid model for class-level prediction performance.
Figure 9.
Confusion matrix of the DenseNet121 + XGBoost hybrid model for class-level prediction performance.
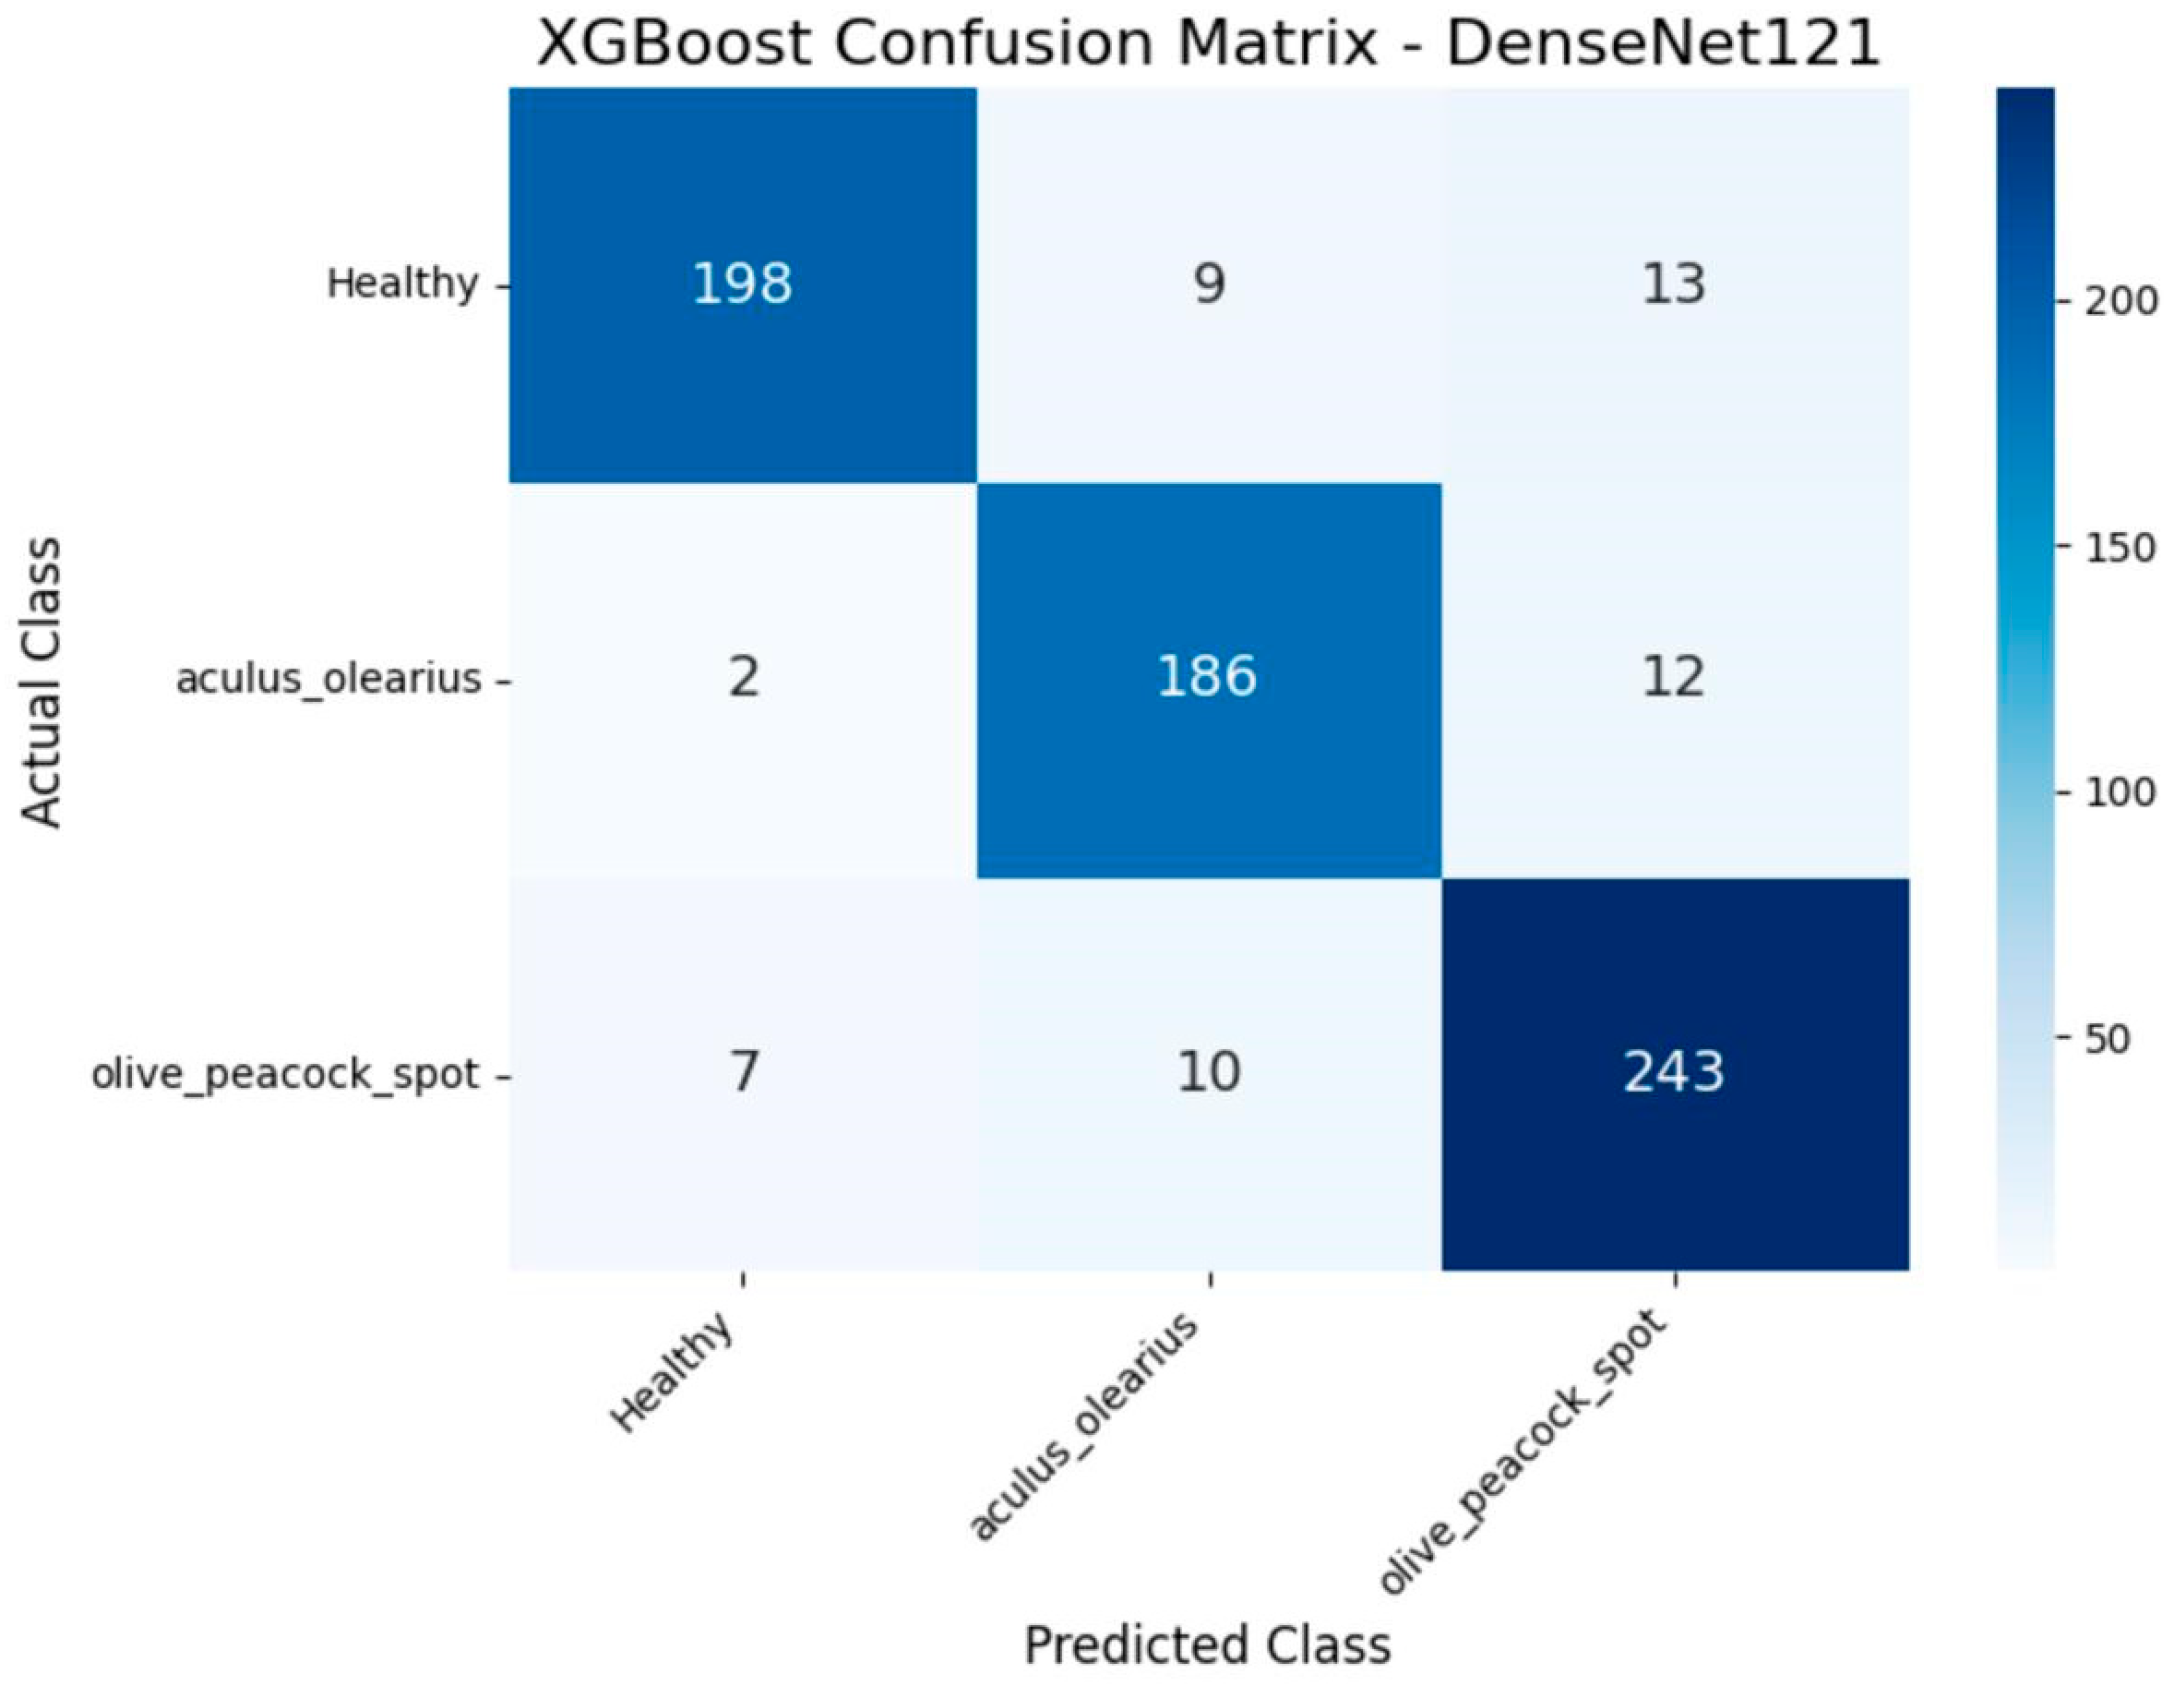

Table 1.
Distribution of images belonging to each class in the dataset.
| Class Name | Number of Images |
| Healthy | 1050 |
| Olive Peacock Spot | 1460 |
| Aculus Olearius | 890 |
| Total | 3400 |
Table 2.
Number of parameters, number of layers, and input size of models used.
| Model Name | Number of Parameters | Number of Layers | Input Size |
| ConvNextTiny | 28.6 Million | 50 | 224×224 |
| DenseNet121 | 8.1 Million | 242 | 224×224 |
| MobileNetV2 | 3.5 Million | 105 | 150×150 |
| EfficientNetV2B0 | 7.2 Million | 55–60 | 224×224 |
Table 3.
Performance results of the 20 model combinations formed by four feature extractors and five classifiers.
Table 3.
Performance results of the 20 model combinations formed by four feature extractors and five classifiers.
| Feature Extractor | Classifier | Accuracy | Precision | Recall | F1-Score |
|---|---|---|---|---|---|
| MobileNetV2 | AdaBoost | 89% | 90.33% | 89% | 89.33% |
| MobileNetV2 | LightGBM | 91% | 90.33% | 90.33% | 90.33% |
| MobileNetV2 | XGBoost | 91% | 90.33% | 90.66% | 90.33% |
| MobileNetV2 | CatBoost | 90% | 90% | 90.33% | 90.33% |
| MobileNetV2 | Gradient Boosting | 90% | 89.33% | 89.66% | 89.66% |
| DenseNet121 | AdaBoost | 91% | 91% | 90.33% | 90.66% |
| DenseNet121 | LightGBM | 91% | 91.66% | 91.66% | 91% |
| DenseNet121 | XGBoost | 92% | 92.66% | 92% | 92.33% |
| DenseNet121 | CatBoost | 91% | 91.33% | 91% | 91% |
| DenseNet121 | Gradient Boosting | 92% | 92% | 91.66% | 91.66% |
| EfficientNetV2B0 | AdaBoost | 65% | 68% | 63.33% | 62.66% |
| EfficientNetV2B0 | LightGBM | 72% | 76.66% | 71.33% | 72% |
| EfficientNetV2B0 | XGBoost | 73% | 77.33% | 71.66% | 72.33% |
| EfficientNetV2B0 | CatBoost | 69% | 73.33% | 68% | 67.66% |
| EfficientNetV2B0 | Gradient Boosting | 73% | 76.66% | 72.33% | 72.66% |
| ConvNextTiny | AdaBoost | 64% | 66% | 62.33% | 62% |
| ConvNextTiny | LightGBM | 72% | 73.66% | 71% | 71.33% |
| ConvNextTiny | XGBoost | 72% | 73.33% | 71% | 71.33% |
| ConvNextTiny | CatBoost | 69% | 70.66% | 67% | 67.66% |
| ConvNextTiny | Gradient Boosting | 71% | 72.66% | 70.33% | 70.66% |
Table 4.
Class-based classification performance metrics for the MobileNetV2 + XGBoost hybrid model.
| Class Name | Precision | Recall | F1-Score | Support Count |
|---|---|---|---|---|
| Healthy | 90% | 93% | 91% | 220 |
| Olive Peacock Spot | 91% | 89% | 90% | 260 |
| Aculus Olearius | 90% | 90% | 90% | 200 |
| Average/Total | 90.33% | 90.66% | 90.33% | 680 |
Table 5.
Class-based classification performance metrics for the DenseNet121 + XGBoost hybrid model.
| Class Name | Precision | Recall | F1-Score | Support Count |
|---|---|---|---|---|
| Healthy | 96% | 90% | 93% | 220 |
| Olive Peacock Spot | 91% | 93% | 92% | 260 |
| Aculus Olearius | 91% | 93% | 92% | 200 |
| Average / Total | 92.66% | 92% | 92.33% | 680 |
Disclaimer/Publisher’s Note: The statements, opinions and data contained in all publications are solely those of the individual author(s) and contributor(s) and not of MDPI and/or the editor(s). MDPI and/or the editor(s) disclaim responsibility for any injury to people or property resulting from any ideas, methods, instructions or products referred to in the content. |
© 2025 by the authors. Licensee MDPI, Basel, Switzerland. This article is an open access article distributed under the terms and conditions of the Creative Commons Attribution (CC BY) license (http://creativecommons.org/licenses/by/4.0/).
Copyright: This open access article is published under a Creative Commons CC BY 4.0 license, which permit the free download, distribution, and reuse, provided that the author and preprint are cited in any reuse.


