Submitted:
03 July 2025
Posted:
04 July 2025
You are already at the latest version
Abstract
This study introduces a No-Code educational platform created to introduce Internet of Things (IoT) to university students that lack programming experience. The platform allows users to set IoT sensor nodes, and create a wireless sensor network through a simple graphical interface. Sensors’ data can be sent to cloud services but they can also be stored locally, which makes our platform particularly useful in fieldwork settings where internet access may be limited. The platform was tested in a pilot activity within a university course that previously covered IoT only in theory and was evaluated using the Technology Acceptance Model (TAM). Results showed strong student engagement and high ratings for ease of use, usefulness, and future use intent. These findings suggest that a No-Code approach can effectively bridge the gap between IoT technologies and learners in non-engineering fields.
Keywords:
Arduino
; IoT
; no-code
; agricultural education
; sensor network
1. Introduction
The ability to achieve algorithmic processing without the need to write code is becoming increasingly popular [26]. Today, specialized tools enable non-technical individuals to visually develop software applications without relying on traditional coding, following the Low-Code (LC) and No-Code (NC) frameworks [40]. This is why LC/NC platforms are increasingly being integrated into critical aspects of our daily lives [29,32], such as the healthcare industry and the financial sector, providing numerous advantages (for example, reduced dependency on coders and lower app development costs). These platforms utilize drag-and-drop interfaces and pre-built components, facilitating rapid application development [21]. The differences between Low-Code and No-Code are not entirely clear, but it suffices to say that in the Low-Code framework, most of the code is provided by the platform, though some coding is still expected from the user, whereas in the No-Code framework, no code is written by the user at all.
As this groundbreaking approach transforms software development, its potential in education is particularly intriguing, with objectives that may vary depending on the educational field. For Computer Science (CS) students, the introduction to programming involves a range of challenges, as beginner programmers often struggle with syntax errors and debugging complexities. This issue can undermine learning objectives such as understanding algorithmic concepts, mastering fundamental programming language skills, and effectively applying algorithms [30]. In this context, a Low-Code approach can provide a gentler introduction to computational concepts [12,24].
For non CS studies, teaching programming is even more challenging as students may struggle to transfer programming knowledge to their field [14]. Again, a Low-Code approach can be used if teaching programming continues to be the learning objective, hoping that over time, some students may feel confident enough to make the transition into full coding environments. However, for some science fields it may be decided that programming is not a needed skill [13] and in this context, a No-Code approach can be used aiming to empower students to create algorithmic functionality and services that previously required technical expertise beyond the scope of their studies.
The present paper introduces a No-Code approach in the form of an innovative educational platform that enables students to explore the Internet of Things (IoT). It also evaluates the application of this approach in the field of agricultural sciences. Through this platform, students are able to create wireless sensor networks, a key feature of IoT applications. The sensors are located at the end-nodes, where each end-node is based on a microcontroller running a piece of code known as firmware [38]. The end-nodes transmit data to a central station, which receives, stores, and (if decided by the student) forwards it to IoT cloud platforms. Such networks are particularly relevant to precision agriculture [27], a modern farming method based on observing, measuring and responding to inter- and intra-field variability in crops. The objective is to ensure that crops and soil receive exactly what they need for optimum health and productivity. This approach minimizes the environmental footprint of farming, enhances sustainability, and increases both crop yields and profitability.
2. Approaches for Teaching CS to Non-CS Students
Teaching introductory CS courses to non-CS students presents several challenges. Many students struggle with conceptual learning due to differing levels of prior experience [6], while difficulties with syntax and a lack of problem-solving strategies [30] often lead to weaknesses in both conceptual and strategic knowledge. Additionally, a lack of motivation and an unbalanced emphasis on programming components may further hinder learning [42]. To address these issues, two primary approaches are suggested in the literature.
The first approach focuses on improving teaching strategies. Following this approach, the importance of addressing common misconceptions and strengthening instructors’ pedagogical content knowledge is stressed in [30]. Problem-solving-based teaching strategies are proposed by Riley [33]. A similar approach is supported in [42], where the authors also emphasize the importance of tailoring teaching methods to the specific needs of non-CS students and incorporating programming as a tool within their respective domains to promote effective learning.
The second approach involves shifting the focus from programming techniques to functionality, allowing students to develop applications within a Low-Code/No-Code (LC/NC) context. This approach is supported by recent studies examining the integration of LC/NC development into university curricula and its impact on student learning outcomes. The results appear to be positive, as the next subsection highlights.
3. Why Use a No-Code Approach to Teach?
We have chosen the No-Code approach because the level of expertise required to create such a sensor network typically comes only after completing a full programming course, whereas our focus is on an introductory CS course that assumes no prior programming experience. Furthermore, in some university departments, the introductory CS course is the only computer science course offered, meaning that students are not expected to acquire programming skills at all [13]. As a result, this course serves as the sole opportunity to deliver relevant knowledge and digital skills to these students.
Furthermore, the LC/NC framework offers several advantages from an educational perspective, as recent literature demonstrates promising outcomes. For example, a No-Code business app development module that can be integrated into various information systems courses was introduced in [43], showing positive preliminary results in terms of student learning outcomes. Similarly, a modularized Data Science curriculum using No-Code tools is presented in [25], which led to increased student motivation and improved conceptual understanding among non-CS majors.
In addition to learning outcomes, LC/NC approaches have been shown to enhance students’ self-confidence. In [44] it was found that incorporating LC/NC tools in a Management Information Systems (MIS) course boosted students’ self-efficacy and interest in further skill development. Likewise, in [39] it was reported that students perceived LC/NC platforms as easier to learn than traditional programming approaches. In [23] it was reported that using a No-Code platform increased students’ comfort levels. Building self-confidence is particularly important, as studies show a positive correlation between self-confidence and academic performance. For instance, in [1] it was demonstrated that students exposed to confidence-boosting stimuli exhibited higher academic self-confidence and cognitive performance compared to those exposed to negative stimuli. This effect appears to be even stronger among middle- and lower-performing students [11].
4. LC/NC Approaches in Agriculture
In regard to agricultural education, on which we focus, it is reported in [17] that there is no existing research on Low-Code development platforms specifically tailored to the unique challenges and requirements of agricultural software development. While Low-Code solutions are still underexplored in this context, a few open-source No-Code approaches do exist.
Within the open-source framework, a platform for Geographic Information Systems (GIS) data management in precision agriculture was presented in [31]. This platform facilitates the collection, visualization, and analysis of soil data from various sources. While it is an interesting tool, it does not address the hardware aspect -specifically, it assumes that the end-nodes transmitting data already exist. Moreover, no information is provided regarding the type of communication between the end-nodes and the central station that processes the data. The only logical inference is that communication relies on the Global System for Mobile Communications (GSM), which is costly and depends on external service providers. For educational purposes, however, there is a need for a simple, low-cost solution that integrates hardware, software, and communication, without relying on external entities.
Another interesting approach is the grapesAgri1 collection of Shiny apps [15], available on GitHub [16]. This platform addresses the need for user-friendly statistical tools in agricultural research and can certainly be used by students to analyze agricultural data. However, it is not applicable to teaching IoT, as it does not cover aspects such as data transmission, cloud platforms, hardware integration, or solutions for programming the hardware.
It is important to note that some IoT cloud platforms follow the No-Code approach, enabling users to create wireless sensor networks without programming the end-nodes. These platforms also offer free usage up to a certain limit. While they provide a convenient option for teaching IoT, they do have some limitations. A first obvious limitation is that they are not completely free. Furthermore, they typically rely on communication through Wireless Fidelity (WiFi) or Long Range (LoRa) technologies, neither of which is particularly cost-effective. In contrast, we have chosen Bluetooth for its affordability and suitability for scenarios requiring low power consumption and short-range communication [2]. For our purposes, long-range communication is unnecessary, as the course takes place either in a lab or in an outdoor field within the campus. Furthermore, to establish a basic wireless sensor network using Bluetooth, only end-nodes and a laptop or PC with a Bluetooth dongle are needed. This setup, although limited in range and scalability, is inexpensive and contains the essential components for achieving all the needed educational scenarios.
In conclusion, compared to the aforementioned No-Code platforms that can be used for teaching IoT, our approach, based on our own No-Code educational platform, is designed to be flexible, cost-effective in terms of hardware, free to use in software, and lightweight in infrastructure requirements. It also covers the hardware of the end-nodes, enabling students to interact with microcontrollers and sensors. In this context, we believe our approach will be highly valuable to both educators and students.
5. Materials and Methods
5.1. Educational Platform Design
The proposed No-Code educational platform leverages open-source hardware and software to enable students to easily construct and interact with a wireless sensor network. The end-node hardware consists of an Arduino Uno board integrated with agricultural-related sensors, including temperature, humidity, soil moisture, and light sensors.
To simplify the hardware interaction for beginners, the end-node is embedded in a newly developed 3D-printable educational robotics kit called Odysseus [22]. This kit was designed specifically for teaching programming and algorithmic thinking to students with no prior experience, while maintaining a low production cost.
Sensor data is transmitted from each end-node to a central station via either wired (USB) or wireless (Bluetooth) communication. The central station may consist of a Raspberry Pi, a laptop, or a desktop computer equipped with a Bluetooth dongle. The software component includes a Node.js-based web server. Students are able to build the network and visualize the data through a graphical interface that supports “click-on-button” interactions, eliminating the need for writing code. Students are also able to send the data to IoT cloud platforms.
5.2. Educational Implementation
The platform was introduced as part of an introductory informatics course offered by the Department of Natural Resources Development and Agricultural Engineering at the Agricultural University of Athens. The primary aim was to assess the usability and educational value of the No-Code platform in a real classroom setting.
5.3. Evaluation Methodology
The evaluation followed the Technology Acceptance Model (TAM) [9], which is widely used to predict user acceptance of information systems, and has been previously applied to similar engineering education projects [3,5].
A total of 39 undergraduate students participated in the pilot study. The evaluation instrument was a structured questionnaire based on the Technology Acceptance Model (TAM) developed by Davis [8]. It was designed to measure four key constructs: Perceived Usefulness, Perceived Ease of Use, Attitude Towards Use, andBehavioral Intention to Use. The questionnaire included 14 items in total, with each item rated on a 5-point Likert scale ranging from “Strongly Disagree” (1) to “Strongly Agree” (5). The questionnaire was adapted from previous validated TAM studies [3,9], and minor wording modifications were made to align the items with the context of the No-Code IoT educational platform. The students were asked to complete the questionnaire after completing a hands-on educational scenario using the No-Code platform.
Although the sample size was relatively small due to the pilot nature of the study, the responses indicated a high level of acceptance. In particular, students reported strong agreement that the platform was easy to use, believed it would enhance their academic performance, and expressed a strong intention to use it in the future. A detailed breakdown of the evaluation results is provided in Section 9.
6. No-Code Introduction to IoT
6.1. The No-Code Educational Platform Architecture
Our No-Code educational platform approach utilizes open hardware and software, enabling students to easily create a wireless sensor network. The architecture of this network, shown in Figure 1, follows a typical IoT structure. Specifically, a number of end-nodes, equipped with sensors of agricultural interest (e.g., temperature, humidity, soil moisture, and light sensors), transmit their data to a central station. The hardware part of the central station can be any computer able to connect the end-nodes via Bluetooth and to the web and capable of running the code to collect, store, and forward data to IoT cloud platforms. For example, the central station’s hardware could be a Raspberry Pi, a laptop, or a desktop computer equipped with a Bluetooth dongle.
6.2. The End-Nodes
The end-node consists of a microcontroller board equipped with sensors relevant to agriculture, such as temperature, humidity, soil moisture, and light sensors. While many microcontrollers can be used for this purpose, we have chosen the Arduino Uno, primarily due to its strong community support, which enhances its effectiveness in educational settings [34]. To connect to the IoT, the end-node must be able to transmit data, typically through Bluetooth, GSM, WiFi, or LoRa. Figure 2 illustrates the hardware of the end-node and various options for wireless communication. As discussed in Subsection 4, we have selected Bluetooth for this implementation.
6.3. Decisions on the Level of Abstraction
When introducing software and hardware to non-CS students, it is essential to carefully consider the level of technical detail required for effective use. Our approach was developed based on the following guidelines:
- Software based on “click on button” actions. Any programming concept is hidden from the students, allowing them to focus on concepts of their scientific field instead. This is an obvious decision since our intention was to create a No-Code platform.
- Abstract hardware. The students get in touch with the hardware of the end-node in a controlled way that hides some technical details that could consume time and discourage them.
Software abstraction is achieved through the No-Code application we developed. Hardware abstraction is achieved by implementing the end-nodes using the programmable component of a newly developed educational robotics kit named Odysseus [22]. Odysseus (or Ody, for short) was created as part of this research and offers several features that make it particularly suitable for educational scenarios where hardware complexity must be minimized. In particular, students do not deal with individual cables; instead, each sensor has a dedicated plug designed to fit only its corresponding socket of Odysseus, eliminating the possibility of incorrect connections or short circuits.
Figure 3 shows the top view of the programmable component of Odysseus. Slots 1-8 contain the outputs (motors and LEDs) which are not used in the current version of our IoT educational platform but they will be used in the future for supporting actuators. Slots 12, 13, 14 and 15 are used for 3-pin sensors, slot 16 is used for the ultrasonic sensor (also not applicable in our case study) and slot 17 is used for any sensor that can be connected to the I2C bus. In the middle of the programmable component there exists an OLED display (9), a power switch (10) and a switch for the Bluetooth (11). It follows that Odysseus can handle up to 4 3-pin sensors and many I2C sensors by adding more sockets to the I2C bus. The right part of the figure shows the sensors currently supported in our case study i.e., the (3-pin) obstacle sensor (18), the (3-pin) DHT11 temperature and humidity sensor (19), the (I2C) SI1151 sunlight sensor that returns visible light and IR light (20) and the (3-pin) soil moisture sensor (21).
The Bluetooth module of Odysseus is configured to operate at 57,600 bits per second; however, this detail is intentionally hidden from the students. This decision aligns with our guideline of minimizing exposure to low-level technical tasks (such as configuring communication modules) which could distract students from their primary focus on precision agriculture.
Let us now discuss the abstraction on the code running in the Arduino (i.e., the firmware). Presenting the firmware as plain source code would serve little purpose, as students lack the background to interpret or understand it meaningfully. However, it is common practice in introductory Computer Science courses to use flowcharts as a way to visualize logical structures [36]. Figure 4 presents an abstract flowchart illustrating the logic implemented in the firmware. The core structure is an infinite loop, within which data are transmitted to the central station at regular intervals of S seconds. This is achieved by checking whether the elapsed time since the last transmission exceeds S seconds. Whether this abstract flowchart is shown to students depends on the extent to which basic algorithmic concepts are included in the specific course curriculum.
6.4. The Central Station’s Software
6.4.1. Architecture and Possible Educational Scenarios
The software used by students to create their wireless sensor network (as depicted in Figure 1) is accessible via a web interface, implemented as the client side of a web server built using the Node.js framework. The server component, which runs in the central station, is responsible for collecting and storing the data transmitted by the end-nodes. This server can be executed on any computer running Windows, Linux, macOS, or Raspbian. For data storage, we have employed SQLite, a lightweight Relational Database Management System (RDBMS). Through this web server and its integrated database, students are provided with a dashboard that allows them to visualize sensor data through plots or perform SQL queries. This architecture offers significant flexibility in terms of the educational scenarios that can be supported and the underlying infrastructure required. The possible educational scenarios are outlined as follows:
- Isolated Node Mode (One-to-One): In this setup, the educational activity takes place in the lab, where the web server runs independently on each computer. As a result, each execution of the web server forms its own isolated network. Each student creates and tests a single end-node within a private network, allowing him or her to query and plot data from only that node. This scenario can be implemented even without Bluetooth, by connecting the end-node directly to the computer via a USB cable. While this method only simulates wireless communication, it is sufficient for familiarizing students with end-node hardware and cloud IoT platform integration. Additionally, this setup enables students to continue working independently from home, provided they have an end-node and the central station’s software installed on their personal computer.
- Lab Network Mode (Many to One): The educational activity takes place in the lab and the web-server runs in a computer accessible by all the lab’s computers. Each student again handles one end-node and accesses the central station through one of the lab’s computers thus each end-node is connected to a different computer. This time all the end-nodes enter the same network and all students can plot and query data from all end-nodes. Again, the end-nodes can be wired to the computers (in which case we have a wired simulation of a wireless network) or connected with the computers via Bluetooth (in which case we have a wireless network).
- Field Deployment Mode (Many to One): The educational activity takes place in an outdoor setting, such as a greenhouse within the university campus. The educator brings a laptop to serve as the central station, running the server code. The sensors, positioned at close range, connect to the central station via Bluetooth and transmit their data.
6.4.2. User Interface
Figure 5 shows the buttons available to the students. The leftmost button is used for uploading the firmware to the Arduino wired to the student’s computer, transforming this way the Arduino to an end-node. Moving to the right we see the button to calibrate the end-node, then the button to “start” the end-node i.e., to instruct the end-node to start sending data to the central station under Isolated Node Mode and Lab Network Mode, where each student handles one sensor. The “Database” button allows for writing SQL queries and the “Dashboard” allows for plotting the stored data. Finally, the “start sensor network” button will initiate Field Deployment Mode i.e., the central station will command all the end-nodes connected to the computer to start sending their data which then the central station collects. Let us now explain the functionality of each button in more detail.
The leftmost button requires no action from the student, except from connecting the Arduino to the computer via a USB cable. A simple click uploads the firmware to the Arduino, converting it into an end-node. For the calibration button, the student must again connect the end-node to the computer via USB and then complete several configuration steps. The first step is selecting the target IoT platform to which the server will forward the data, or choosing the “local storage only” option (see Figure 6). If an IoT platform is selected, the student must provide the required parameters to enable successful data transmission to that platform.
For example, inFigure 6, the student selects the IoT cloud platform Ubidots [41]. After clicking OK, the student is prompted to enter the necessary parameters for sending data to Ubidots. This requires prior setup: the student must create an account on Ubidots and define a virtual device to receive data from the physical end-node. Figure 7 shows the HTML page for a virtual device named “my_end_node”, which includes a variable called “random_number”, indicating that the device is configured to accept values labeled with that name. Students may define multiple variables per virtual device and create multiple virtual devices as needed.
On the left side of the page, the parameters associated with this virtual device are displayed. To enable our No-Code platform to send data from the end-node to this virtual device, the user must copy the token and API label and paste them into the corresponding input fields on the right side of Figure 6. It is worth noting that all supported IoT cloud platforms offer limited free access, which helps to simplify the educational process.
The next step is to define the sensors connected to the Arduino. For each type of physical measure (e.g., temperature, humidity) provided by a sensor, the user must specify the Arduino pin to which the corresponding sensor is connected. The interface for entering this information is shown in Figure 8. To ensure compatibility with the virtual device shown in Figure 7 i.e., to send data labeled as “random_number”, the student must check the “Random number” option in Figure 8. The “Random number” option simulates a sensor by generating test values and can be used for experimentation or in cases where a real sensor is not available.
After configuring the sensors, the user defines the transmission policy that is, the interval (in minutes) between consecutive data transmissions. The next step is to assign a unique number to the end-node, which it includes with each data packet for identification purposes. Finally, the type of network connection must be selected; currently, the platform supports either a wired or Bluetooth connection (but the code is actually the same for both cases). Once all parameters are configured, the user is asked to choose the appropriate COM port (corresponding to the connected end-node), and then all settings are transmitted to the end-node and stored in its non-volatile memory. This calibration procedure is required only once. The end-node is now ready to transmit data, which can be initiated by clicking the “Start End-Node” button (for educational scenarios “Isolated Node Mode” and “Lab Network Mode”), or the “Start Sensor Network” button (for “Field Deployment Mode”).
As previously mentioned, the data are stored locally on the server side. Through a built-in dashboard (see Figure 9), students can visualize the data from a selected node and specific attribute over a chosen time range (including all data, the last 24 hours, or the last hour). This capability ensures that the educational scenarios remain fully functional even without the use of cloud platforms, which is particularly important in field settings where Internet access may not be available. In this context, our platform embraces the principles of edge computing, as data are processed and analyzed locally on the central station without reliance on external servers. This not only improves responsiveness but also introduces students to a computing paradigm that is increasingly important in modern IoT deployments.
The database scheme is simple and shown at the left part of Figure 10. The “Database” button in the main menu allows for writing SQL queries as shown at the right part of Figure 10.
Finally, the “Start Network” button in the main menu enables students to initiate and monitor the wireless sensor network from a single web interface. As illustrated in Figure 11, this feature provides a real-time overview of the network’s operation, allowing users to observe connected nodes and incoming data streams in a consolidated and user-friendly environment. For this network to start, all end-nodes must be connected to the same computer—a requirement that characterizes the “Field Deployment Mode” educational scenario. The student adds end-nodes to the network one by one by clicking the “Insert End-Node” button. Each end-node appears in a list on the left side of Figure 11, initially labeled as “unknown” since communication has not yet begun and the central station has not received the nodes’ identifying information. Once all end-nodes have been inserted, the student clicks the “Start Network” button to begin data transmission. The central area of the screen displays real-time information for each node that sends data. Specifically, for every active node, students can view its name, the timestamp of the most recent data packet received, and the total number of data packets transmitted. For example in Figure 11, the network currently consists of two end-nodes, named “Node 1” and “Node 2.”
7. Evaluation Framework
7.1. Overview
The No-Code platform approach was incorporated into the informatics introductory course of the department of Natural Sciences Development and Agricultural Engineering of the Agricultural University of Athens to evaluate its usability. According to the “Isolated Node Mode” educational scenario, the users (i.e., the students) created their end-nodes by plugging the sensors into the programmable component of Odysseus (see Figure 12). Then they created accounts in cloud platforms, uploaded the firmware into the Arduino and calibrated their end-node. Finally, they observed the sensor data either by plotting the locally stored ones or by plotting the same data in the cloud platform they chose to create accounts. On completion of the scenario they were asked to evaluate their experience with the No-Code platform approach by completing a questionnaire based on the Technology Acceptance Model presented in the next subsection.
Figure 12 An image of the programmable component of Odysseus, showing the sensors used in this case study. Highlighted within circles from bottom to top are: the DHT11 air temperature and humidity sensor (plugged into the bottommost 3-pin sensor slot), the SI1151 sunlight sensor for visible and IR light (plugged into the I2C slot), and the soil moisture sensor (plugged into the topmost 3-pin sensor slot).
7.2. The Technology Acceptance Model (TAM)
The platform’s evaluation was based on the Technology Acceptance Model (TAM) developed by Davis in 1989, which attempts to explain and predict the leading factors to the use of Information Systems [9] but has also been used to evaluate engineering projects [3,5] based on hardware/software. It is based on Ajzen and Fishbein’s Theory of Reasoned Action (TRA) which identifies all those appropriate variables that could be used on the Information Systems’ acceptance [19] as shown in Figure 13.
TAM consists of key factors such as i) External Variables (EV), ii) Perceived Ease of Use (PEOU), iii) Perceived Usefulness (PU), iv) Attitude Towards Use (ATU), v) Behavioral Intention to Use (BIU), and vi) Actual Usage (AU), that try to explain the technology acceptance of a system [5].
According to Davis [8], the user acceptance of an Information System is a prerequisite for its technology effectiveness [37]. User acceptance can be evaluated and assessed by measuring the TAM’s Perceived Ease of Use (PEOU) and Perceived Usefulness (PU) factors.
7.2.1. External Variables
7.2.2. Perceived Ease of Use (PEOU)
The Perceived Ease of Use (PEOU) factor is related to the user’s belief that the ease of using a system does not require too much effort and it is determined by the Information System’s External Variables.
7.2.3. Perceived Usefulness (PU)
The Perceived Usefulness (PU) factor is related to how the user believes that using the system will improve his/her performance and has a direct effect from PEOU and External Variables.
7.2.4. Attitude towards Use (ATU)
The Attitude Towards Use (ATU) factor reflects the user’s evaluation of the Information System and their disposition towards its use. According to [9], ATU is jointly influenced by Perceived Usefulness (PU) and Perceived Ease of Use (PEOU), with their relative weights typically determined through linear regression analysis.
7.2.5. Behavioural Intention to Use (BIU)
The Behavioural Intention to Use (BIU) factor refers to the user’s intention to use the Information System and it is directly affected by ATU and PU [9].
7.2.6. Actual Use
Lastly, Actual Use (AU) refers to the real-world utilization of the Information System, typically measured by metrics such as usage frequency or duration.
7.3. Research Methodology
7.3.1. Research Context and Participants
The acceptance of the No-Code platform was evaluated by 39 undergraduate students from the Department of Natural Sciences Development and Agricultural Engineering of the Agricultural University of Athens. Initially, the educational activity described in Isolated Node Mode scenario (see Subsection 6.4.1) was conducted in the lab, followed by the distribution of a questionnaire designed to assess the PU, PEOU, ATU, and BIU factors. Students were of the same age, background studies, and levels of graduate studies, so demographic information was not captured via the questionnaire.
Before the research, all ethical issues [7] were taken seriously. The researchers obtained the necessary permission to conduct the study from the university’s ethics department, and the students filled out a consent form that informed them of the study’s objectives and outlined the procedure and terms of the research.
7.3.2. Instrument Development
Particular attention was given to keeping the questionnaire concise, which is why it consists of a single section focusing exclusively on the TAM factors. To this end, an online form was developed using Microsoft 365 Forms, incorporating items derived from the TAM model. Empirical data were collected through 14 questionnaire items designed to measure the key TAM constructs.
According to [8], four items are sufficient to construct the PU and PEOU dimensions of the TAM model. Therefore, in this study, each of the PU and PEOU constructs was measured using four items, which were adapted to fit the specific context of the platform, as presented in Table 1.
TAM’s ATU and BIU factors were measured too as shown below in Table 2, but Actual Use was not measured as the No-Code platform was not available for mass production and distribution.
The above TAM items were based on the original Davis’ TAM items [8], but were adapted to the research’s needs, translated into Greek, and then translated back to English to ensure translation equivalence [45]. For all of these items a 5-point Likert scale from 1 to 5 was used to measure the TAM’s factors (Table 3).
The TAM’s independent variables were the PEOU and PU, and the dependent variables were the ATU and BIU (Table 4).
7.3.3. Research Hypotheses
The present study was a pilot one (the research’s sample was not significantly big) to obtain initial evaluation data, identify the platform’s strengths and weaknesses, and gather a preliminary indication of students’ intention to use the No-Code platform. Based on the TAM model, two hypotheses were formulated for this initial measurement, as illustrated in Figure 14. Future research will expand on this foundation by including additional hypotheses related to the Actual Use (AU) factor of the No-Code platform.
Hypothesis 1 (H1)
: Perceived Ease of Use (PEOU) will have a significant influence on students’ Perceived Usefulness (PU) towards No-Code platform’s use
Hypothesis 2 (H2)
: Perceived Usefulness (PU) will have a significant influence on students’ Behavioral Intention to Use (BIU) towards No-Code platform’s use.
8. Results
8.1. Validity and Reliability Analysis
At the beginning, the reliability and validity of the TAM variables (PU and PEOU) were checked. Reliability refers to the precision and consistency of a measurement, indicating its repeatability over time [3]. Validity, on the other hand, concerns the accuracy and correctness of the measurement [28]. To evaluate reliability, we employed both Cronbach’s Alpha (α) and McDonald’s Omega (ω) coefficients, which are widely accepted metrics for internal consistency [28,35].
To assess validity, Exploratory Factor Analysis (EFA) was conducted, following the guidelines of [18]. Additionally, the Average Variance Extracted (AVE) was calculated for each construct to evaluate convergent validity, which examines the degree to which multiple indicators of a given construct are correlated [45]. All statistical analyses were performed using Jamovi [20], an open-source statistical software built on the R programming language.
8.2. Reliability Analysis
The Perceived Ease of Use (PEOU) construct yielded an average score of 4.17 (SD = 0.654; see Table 5), indicating a generally high level of perceived ease of use among students. The internal consistency of the PEOU scale was acceptable, with a Cronbach’s alpha of 0.785, exceeding the commonly accepted threshold of 0.70 [10], and a McDonald’s Omega (ω) coefficient of 0.794. Furthermore, no improvement in reliability was observed when individual survey items were removed.
The Perceived Usefulness (PU) construct yielded an average score of 4.31 (SD = 0.671; see Table 6), indicating a high level of perceived usefulness among students. The scale demonstrated strong internal consistency, with a Cronbach’s alpha of 0.825, exceeding the accepted threshold of 0.70, and a McDonald’s Omega (ω) coefficient of 0.827. Additionally, the reliability of the scale would not be improved by removing any individual items.
ATU and BIU displayed an average score of 4.33 (SD = 0.749) and 4.00 (SD = 0.841), respectively (see Table 7), indicating that students showed a strong attitude towards and intention to use the No-Code platform.
8.3. Validity Analysis
To perform Exploratory Factor Analysis (EFA), two key assumptions must be verified: sphericity and sampling adequacy. We assessed sphericity using Bartlett’s Test of Sphericity and sampling adequacy using the Kaiser-Meyer-Olkin (KMO) Measure of Sampling Adequacy (MSA). Table 8 shows the results.
Bartlett’s test yielded a p-value < 0.001, indicating statistical significance (as p < 0.05 is required), and thus confirming that the correlation matrix is not an identity matrix. The overall KMO index was 0.826, suggesting a high level of sampling adequacy (with values closer to 1 indicating greater suitability for factor analysis). Therefore, both assumptions were satisfied, supporting the appropriateness of EFA for the dataset [28].
We then examined the Eigenvalues (with values greater than 1 indicating a significant factor) and analyzed the Scree Plot (see Figure 15) to identify the underlying data factors relevant to this research [28].
The factor loadings and statistics resulting from the Exploratory Factor Analysis (EFA) are presented in Table 9 and Table 10, respectively. Both the extracted factors and their loadings align well with the theoretical constructs specified in the research model. The uniqueness values of the variables (indicating the variance not explained by the extracted factors) ranged between 0.237 and 0.605. According to [28], these values are considered good to excellent, signifying that the variables contribute meaningfully to the factor model.
8.4. No-Code Platform’s Level of Acceptance
Spearman’s rank-order correlation was employed to evaluate the research hypotheses by measuring the strength and direction of the associations between the relevant variables [3]. Prior to conducting the test, we verified that all three underlying assumptions were satisfied: (i) both variables are ordinal, (ii) the variables represent paired observations, and (iii) there exists a monotonic relationship between them. The results indicated a statistically significant and positive correlation between Perceived Ease of Use (PEOU) and Perceived Usefulness (PU), with Spearman’s rho = 0.609 and p < 0.001 (Table 11).
Hypothesis 1
: Perceived Ease of Use (PEOU) will have a significant influence on students’ Perceived Usefulness (PU) towards No-Code platform’s use
To evaluate TAM’s Hypothesis 1 (H1), we conducted a linear regression analysis to examine whether Perceived Ease of Use (PEOU) significantly predicts Perceived Usefulness (PU). Prior to the analysis, we ensured that all seven assumptions of linear regression were met: (i) the dependent variable (PU) is measured at the continuous level, (ii) the independent variable (PEOU) is also measured at the continuous level, (iii) a linear relationship exists between PU and PEOU, (iv) the observations are independent, (v) there are no significant outliers, (vi) homoscedasticity is satisfied, and (vii) the residuals of the regression are normally distributed. The results showed that PEOU was a significant predictor of PU, R = 0.645, F(1, 37) = 26.4, p < 0.001 (Table 12).
Hypothesis 2 (H2):
Perceived Usefulness (PU) will have a significant influence on students’ Behavioral Intention to Use (BIU) the No-Code educational platform.
To evaluate Hypothesis 2 (H2), we performed a linear regression analysis to examine whether Perceived Usefulness (PU) significantly predicts students’ Behavioral Intention to Use (BIU) the No-Code platform. As with H1, we first confirmed that all seven assumptions of linear regression were satisfied: (i) the dependent variable (BIU) is continuous, (ii) the independent variable (PU) is continuous, (iii) there is a linear relationship between PU and BIU, (iv) observations are independent, (v) no significant outliers exist, (vi) homoscedasticity is present, and (vii) the residuals are normally distributed. The results indicated that PU was a significant predictor of BIU, R = 0.696, F(1, 37) = 34.7, p < 0.001 (Table 13).
9. Discussion
This study was a pilot effort, and while the research sample was not particularly large, the results indicate a promising level of use and acceptance of the No-Code platform by students. The collected data (Table 14) demonstrated that students:
- strongly agreed that the No-Code platform is easy to use (mean = 4.17 out of 5, SD = 0.654),
- strongly believed that using the platform would improve their performance (mean = 4.31, SD = 0.671),
- expressed a strong positive attitude towards using the platform (mean = 4.33, SD = 0.749), and
- showed a strong intention to use the No-Code platform in the future (mean = 4.00, SD = 0.841).
Furthermore, the TAM model’s hypothesis (H1, H2) was confirmed, and showed a significant correlation between (i) PU and PEOU, (ii) PU and BIU (Figure 15).
It seems that the platform enabled learners to engage with core IoT concepts and workflows, from sensor configuration to data visualization. This supports the view that No-Code platforms can lower barriers to entry and promote meaningful learning in interdisciplinary education.
Although the evaluation was limited to a single course with a relatively small sample size, the results highlight the potential of No-Code platforms to bridge the gap between technical content and non-technical learners. The positive reception suggests that such tools could be scaled to diverse educational settings, provided they maintain the balance between ease of use and exposure to real-world IoT principles.
10. Conclusions and Future Work
This paper presented the design, development, educational deployment and evaluation of a No-Code platform for teaching IoT in non-programming university courses. The platform enables students to configure sensor nodes, define transmission parameters, and visualize collected data through an intuitive graphical interface without writing code. Its modular structure supports different educational scenarios, ranging from isolated sensor activities to field-deployed sensor networks and allows for both local and cloud-based data management, providing flexibility in low-connectivity environments.
The platform was evaluated through a pilot study involving 39 undergraduate students in the Department of Agricultural Economics and Development. Based on the Technology Acceptance Model (TAM), students reported strong levels of perceived ease of use and usefulness, and expressed positive attitudes and behavioral intentions towards future use. These results support the platform’s potential as a viable learning tool for IoT concepts in non-technical academic contexts.
Although the evaluation was limited to a single course with a relatively small sample size, the platform’s design responds directly to the realities of the curriculum: students had no prior programming knowledge and no prior exposure to practical IoT activities. Keeping in mind that a programming course may not exist at all in the curriculum, it follows that the No-Code approach is not just beneficial, it is essential. Future work includes deploying the platform across different departments and institutions, increasing its openness for wider use, and extending the range of supported hardware and communication technologies. Further studies will also explore long-term usage and potentially integrate lightweight assessments of conceptual understanding and skill transfer in real-world problem-solving scenarios.
Author Contributions
methodology, G.L and A.C.; software, G. L; formal analysis, A. C.; data curation, A.C.; writing—original draft preparation, G. L. and A. C..; All authors have read and agreed to the published version of the manuscript.
Funding
This research received no external funding.
Data Availability Statement
The questionnaire and the results are presented in the study. Further inquiries can be directed to the corresponding author.
Conflicts of Interest
The authors declare no conflicts of interest.
Abbreviations
The following abbreviations are used in this manuscript:
| IoT | Internet of Things |
| LC | Low-Code |
| NC | No-Code |
| TAM | Technology Acceptance Model |
| CS | Computer Science |
| LC/NC | Low-Code/No-Code |
| EV | External Variables |
| PEOU | Perceived Ease of Use |
| PU | Perceived Usefulness |
| ATU | Attitude Towards Use |
| BIU | Behavioral Intention to Use |
| AU | Actual Usage |
| SD | Standard Deviation |
| EFA | Exploratory Factor Analysis |
References
- Alias, M., Aini, N. Mohd, H.H., & Hafir (2009). The relationship between academic self-confidence and cognitive performance among engineering students.
- Chang, K.-H. Bluetooth: A viable solution for IoT? IEEE Wirel. Commun. 2014, 21, 6–7. [Google Scholar] [CrossRef]
- Chatzopoulos, A.; Kalogiannakis, M.; Papadakis, S.; Papoutsidakis, M. A novel, modular robot for educational robotics developed using action research evaluated on technology acceptance model. Educ. Sci. 2022, 12, 274. [Google Scholar] [CrossRef]
- Chatzopoulos, A.; Kalovrektis, K.; Xenakis, A.; Chondrogiannis, E.; Papoutsidakis, M.; Kalogiannakis, M.; Psycharis, S. Design and evaluation of a novel and modular educational robot platform based on Technology Acceptance Model. In Proceedings of the Seventh International Congress on Information and Communication Technology; Yang, X., Sherratt, S., Dey, N., Joshi, A., Eds.; Springer: 2023; Vol. 447, pp. 1–11. [CrossRef]
- Chatzopoulos, A.; Kalovrektis, K.; Xenakis, A.; Papoutsidakis, M.; Kalogiannakis, M.; Psycharis, S. An advanced physical computing-based educational robot platform evaluated by Technology Acceptance Model. In Proceedings of the 10th International Conference on Information and Education Technology (ICIET 2022), Houston, TX, USA; 2022; pp. 6–10. [Google Scholar] [CrossRef]
- Cheong, N. Revitalizing introductory computer courses for non-CS majors: A comparative study. In Proceedings of the 2022 ACM Conference on Innovation and Technology in Computer Science Education, Dublin, Ireland, 2022; pp. 344–349. [CrossRef]
- Cohen, L.; Manion, L.; Morrison, K. Research Methods in Education, 8th ed.; Routledge: London, UK, 2018.
- Davis, F.D. Perceived usefulness, perceived ease of use, and user acceptance of information technology. MIS Q. 1989, 13, 319–340. [Google Scholar] [CrossRef]
- Davis, F.D.; Bagozzi, R.P.; Warshaw, P.R. User acceptance of computer technology: A comparison of two theoretical models. Manag. Sci. 1989, 35, 982–1003. [Google Scholar] [CrossRef]
- DeVellis, R.F. Scale Development: Theory and Applications, 5th ed.; SAGE Publications: Thousand Oaks, CA, USA, 2021.
- Espinosa, A.; Tikhonov, A.; Jorgenson, J. Increasing retention in mathematics courses: The role of self-confidence in mathematics on academic performance. 2016. [CrossRef]
- Evangelou, S.M.; Fotopoulos, A.; Minas, D.; Xenos, M. Exploring computer engineering students’ perceptions when introduced to low-code platforms: A study using inquiry methods and eye-tracking data. In Proceedings of the 2024 IEEE Global Engineering Education Conference (EDUCON), Berlin, Germany, 2024; pp. 1–7. IEEE. [CrossRef]
- Ferguson, R.C.; Leidig, P.; Reynolds, J.H. Including a programming course in general education: Are we doing enough? Inf. Syst. Educ. J. 2015, 13, 34–42. [Google Scholar]
- Fuchs, W.; McDonald, A.R.; Gautam, A.; Kazerouni, A.M. Recommendations for improving end-user programming education: A case study with undergraduate chemistry students. J. Chem. Educ. 2024, 101, 3085–3096. [Google Scholar] [CrossRef]
- Gopinath, P.; Parsad, R.; Joseph, B.; V S, A. grapesAgri1: Collection of Shiny Apps for data analysis in agriculture. J. Open Source Softw. 2021, 6, 3437. [Google Scholar] [CrossRef]
- Gopinath, P. grapesAgri1 GitHub repository. Available online: https://github.com/pratheesh3780/grapesAgri1 (accessed on 10 June 2025).
- Guresci, E.; Tekinerdogan, B.; Babur, Ö.; Liu, Q. Feasibility of low-code development platforms in precision agriculture: Opportunities, challenges, and future directions. Land 2024, 13, 1758. [Google Scholar] [CrossRef]
- Henson, R.K.; Roberts, J.K. Use of exploratory factor analysis in published research: Common errors and some comment on improved practice. Educ. Psychol. Meas. 2006, 66, 393–416. [Google Scholar] [CrossRef]
- Hill, R.J.; Fishbein, M.; Ajzen, I. Belief, attitude, intention and behavior: An introduction to theory and research. Contemp. Sociol. 1977, 6, 244. [Google Scholar] [CrossRef]
- Jamovi. The jamovi project, version 1.6. Available online: https://www.jamovi.org/ (accessed on 10 June 2025).
- Kulkarni, M. Deciphering low-code/no-code hype—study of trends, overview of platforms, and rapid application development suitability. Int. J. Sci. Res. Publ. 2021.
- Lagogiannis, G. Odysseus: A new 3D printable educational robotic kit for primary and secondary education. In press, 2025.
- Lebens, M.; Finnegan, R. Using a low code development environment to teach the Agile methodology. In Agile Processes in Software Engineering and Extreme Programming, XP 2021; Gregory, P., Lassenius, C., Wang, X., Kruchten, P., Eds.; Springer: Cham, Switzerland, 2021. [Google Scholar] [CrossRef]
- Lim, J.T.; Lee, C.K.; Lim, E.H.; Wong, P.V.; Yew, K.T.; Ooi, C.Y. Preliminary study on the accessibility and learning experience of low-code development platforms. In Proceedings of the 2024 5th International Conference on Artificial Intelligence and Data Sciences (AiDAS), Singapore; 2024; pp. 486–491. [Google Scholar] [CrossRef]
- Mafukidze, H.D.; Nechibvute, A.; Yahya, A.; Badruddin, I.A.; Kamangar, S.; Hussien, M. Development of a modularized undergraduate data science and big data curriculum using No-Code software development tools. IEEE Access 2024, 12, 100939–100956. [Google Scholar] [CrossRef]
- Masili, G. No-code development platforms: Breaking the boundaries between IT and business experts. Int. J. Econ. Behav. 2023, 13(1). [CrossRef]
- Musa, P.; Sugeru, H.; Wibowo, E.P. Wireless sensor networks for precision agriculture: A review of NPK sensor implementations. Sensors 2024, 24, 51. [Google Scholar] [CrossRef] [PubMed]
- Navarro, D.J.; Foxcroft, D.R. Learning Statistics with jamovi: A Tutorial for Beginners in Statistical Analysis; Open Book Publishers: Cambridge, UK, 2025. [Google Scholar] [CrossRef]
- Nimje, P. The rise of low-code/No-code development platforms. Int. J. Adv. Res. Sci. Commun. Technol. 2024, 4, 650–653. [Google Scholar] [CrossRef]
- Qian, Y.; Lehman, J. Students’ misconceptions and other difficulties in introductory programming: A literature review. ACM Trans. Comput. Educ. 2018, 18, 1. [Google Scholar] [CrossRef]
- Piccoli, F.; Locatelli, S.G.; Schettini, R.; Napoletano, P. An open-source platform for GIS data management and analytics. Sensors 2023, 23, 3788. [Google Scholar] [CrossRef]
- Pinho, D.; Aguiar, A.; Amaral, V. What about the usability in low-code platforms? A systematic literature review. J. Comput. Lang. 2022, 74, 101185. [Google Scholar] [CrossRef]
- Riley, D.D. Teaching problem solving in an introductory computer science class. SIGCSE Bull. 1981, 13, 244–251. [Google Scholar] [CrossRef]
- Using Arduino as a platform for programming, design, and measurement in a freshman engineering course. In Proceedings of the ASEE Annual Conference & Exposition; 2011; Vol. 22, pp. 1609.1–1609.23. [CrossRef]
- Şahin, M.; Aybek, E. Jamovi: An easy to use statistical software for the social scientists. Int. J. Assess. Tools Educ. 2019, 6, 670–692. [Google Scholar] [CrossRef]
- Sowa, J.F. Relating diagrams to logic. In Conceptual Graphs for Knowledge Representation (ICCS ’93); Springer-Verlag: Berlin, Germany, 1993; pp. 1–35. [Google Scholar]
- Sprenger, D.A.; Schwaninger, A. Technology acceptance of four digital learning technologies (classroom response system, classroom chat, e-lectures, and mobile virtual reality) after three months’ usage. Int. J. Educ. Technol. High. Educ. 2021, 18, 1. [Google Scholar] [CrossRef]
- Tan, C.J.; Mohamad-Saleh, J.; Zain, K.A.M.; Aziz, Z.A.A. Review on firmware. In Proceedings of the International Conference on Imaging, Signal Processing and Communication (ICISPC 2017); Association for Computing Machinery: 2017; pp. 50–54. [CrossRef]
- Lim, J.T.; Lee, C.K.; Lim, E.H.; Wong, P.V.; Yew, K.T.; Ooi, C.Y. Preliminary study on the accessibility and learning experience of low-code development platforms. In Proceedings of the 2024 5th International Conference on Artificial Intelligence and Data Sciences (AiDAS); 2024; pp. 486–491. [CrossRef]
- Tripathi, A. Low-code/No-code development platforms. Int. J. Comput. Appl. 2023, 4, 27–35. [Google Scholar]
- Ubidots. Ubidots: IoT development platform. Available online: https://ubidots.com/ (accessed on 28 April 2025).
- Villalobos, J.; Casallas, R. Teaching/learning a first object-oriented programming course outside the CS curriculum. In Proceedings of the 10th Workshop on Pedagogies and Tools for the Teaching and Learning of Object Oriented Concepts—ECOOP (European Conference on Object-Oriented Programming), 2006.
- Wang, S.; Wang, H. Teaching tip: A teaching module of no-code business app development. J. Inf. Syst. Educ. 2021, 32, 1–8. [Google Scholar]
- Wright, K.; Antonucci, Y.; Anderson, L.; Townsend, A. Engaging business students with “low-code” model driven development: Self-efficacy beliefs in an introductory MIS course. In Proceedings of the 56th Hawaii International Conference on System Sciences (HICSS 2023); 2023; Article 567. [CrossRef]
- Zacharis, G.K. Investigating the factors influencing pre-service teachers’ acceptance to use mobile devices for learning. In Mobile Learning Applications in Early Childhood Education; Papadakis, S., Kalogiannakis, M., Eds.; IGI Global: Hershey, PA, USA, 2020; pp. 183–208. [Google Scholar] [CrossRef]
Figure 1.
The architecture of the wireless network created by our No-Code approach.
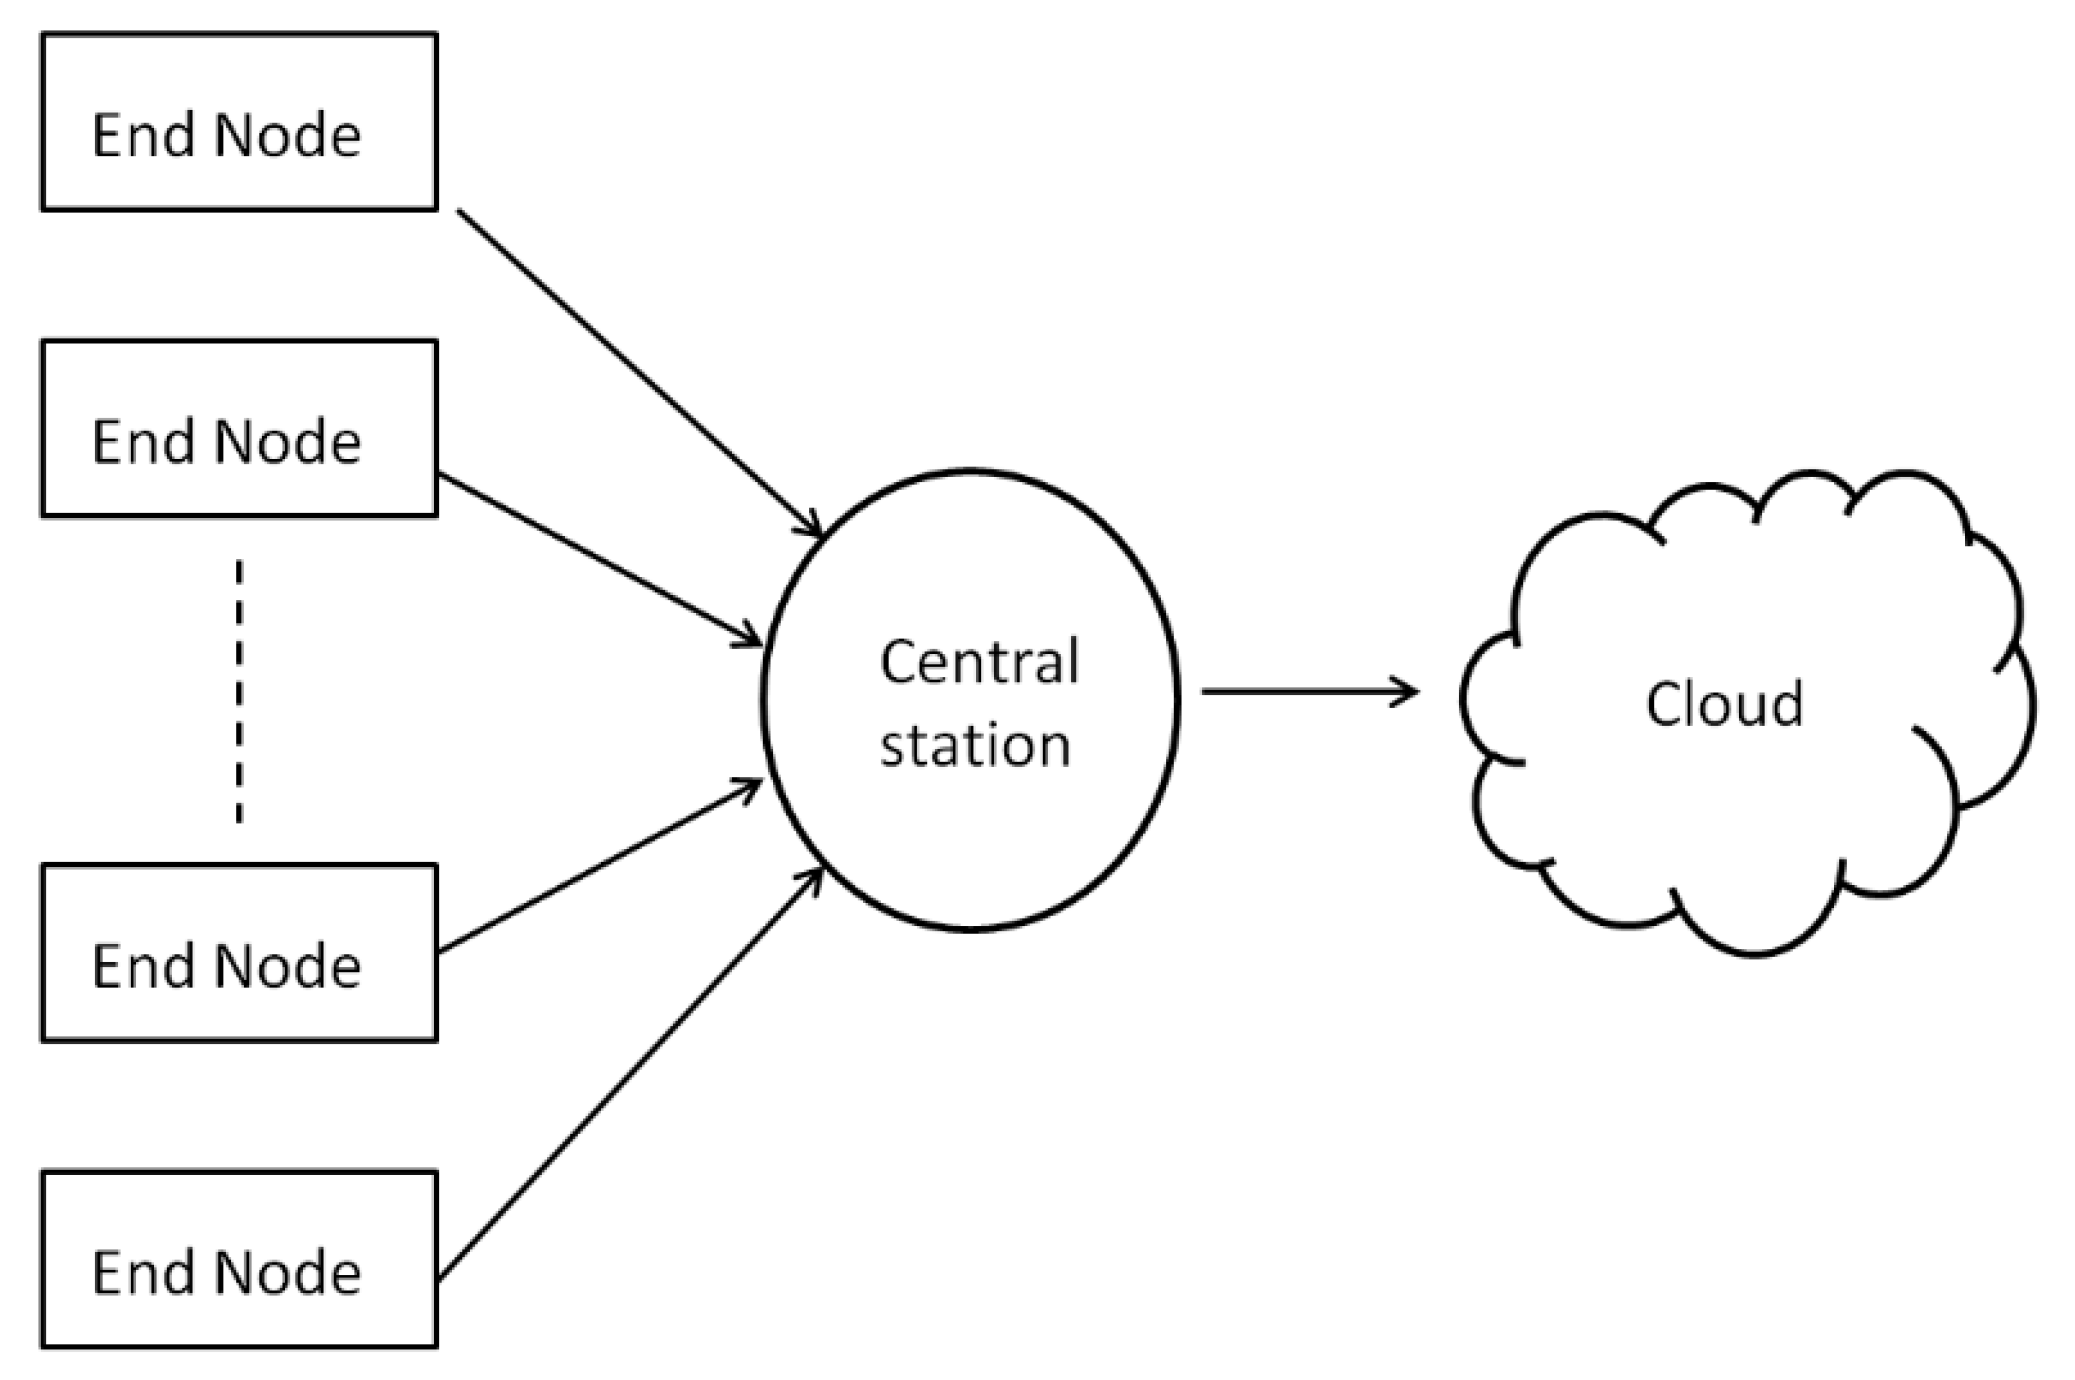
Figure 2.
The hardware parts of an Arduino-based end-node. The top part shows the alternative boards for creating the network. Such boards, mounted directly onto an Arduino (or compatible) microcontroller board to expand its functionality are called Arduino “shields”. From the available options we have chosen Bluetooth.
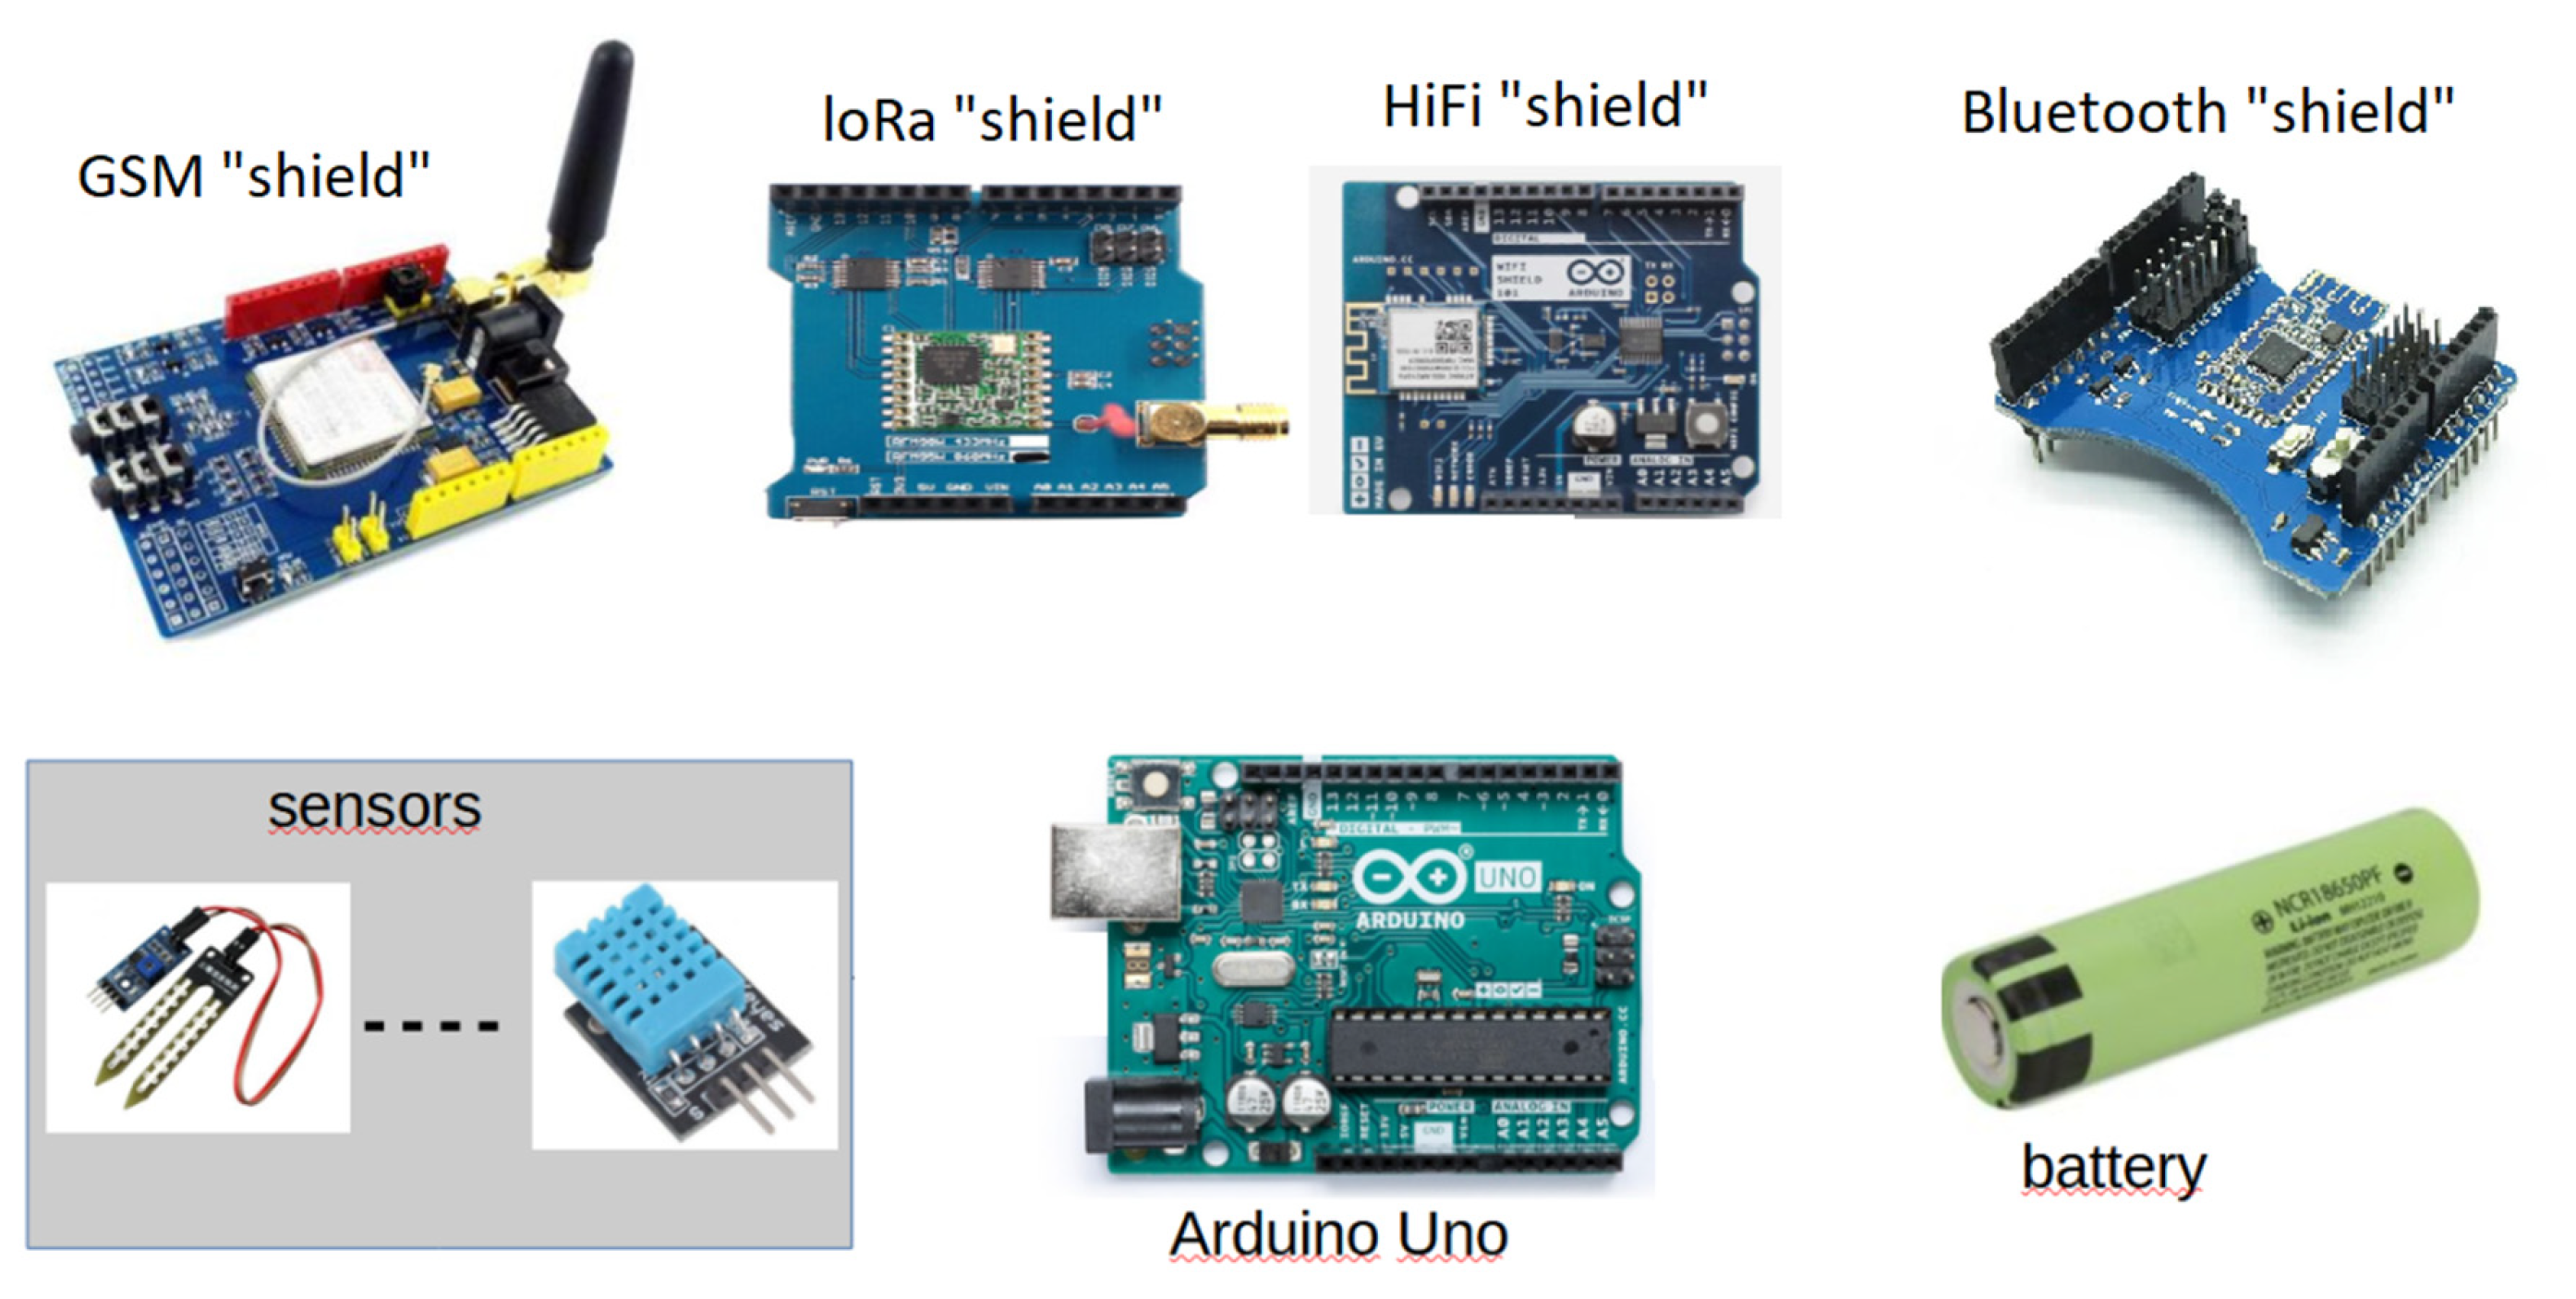
Figure 3.
The top view of the programmable component of Odysseus can be seen at the left side of the figure. The right part of the figure shows the sensors supported in our case study.
Figure 3.
The top view of the programmable component of Odysseus can be seen at the left side of the figure. The right part of the figure shows the sensors supported in our case study.
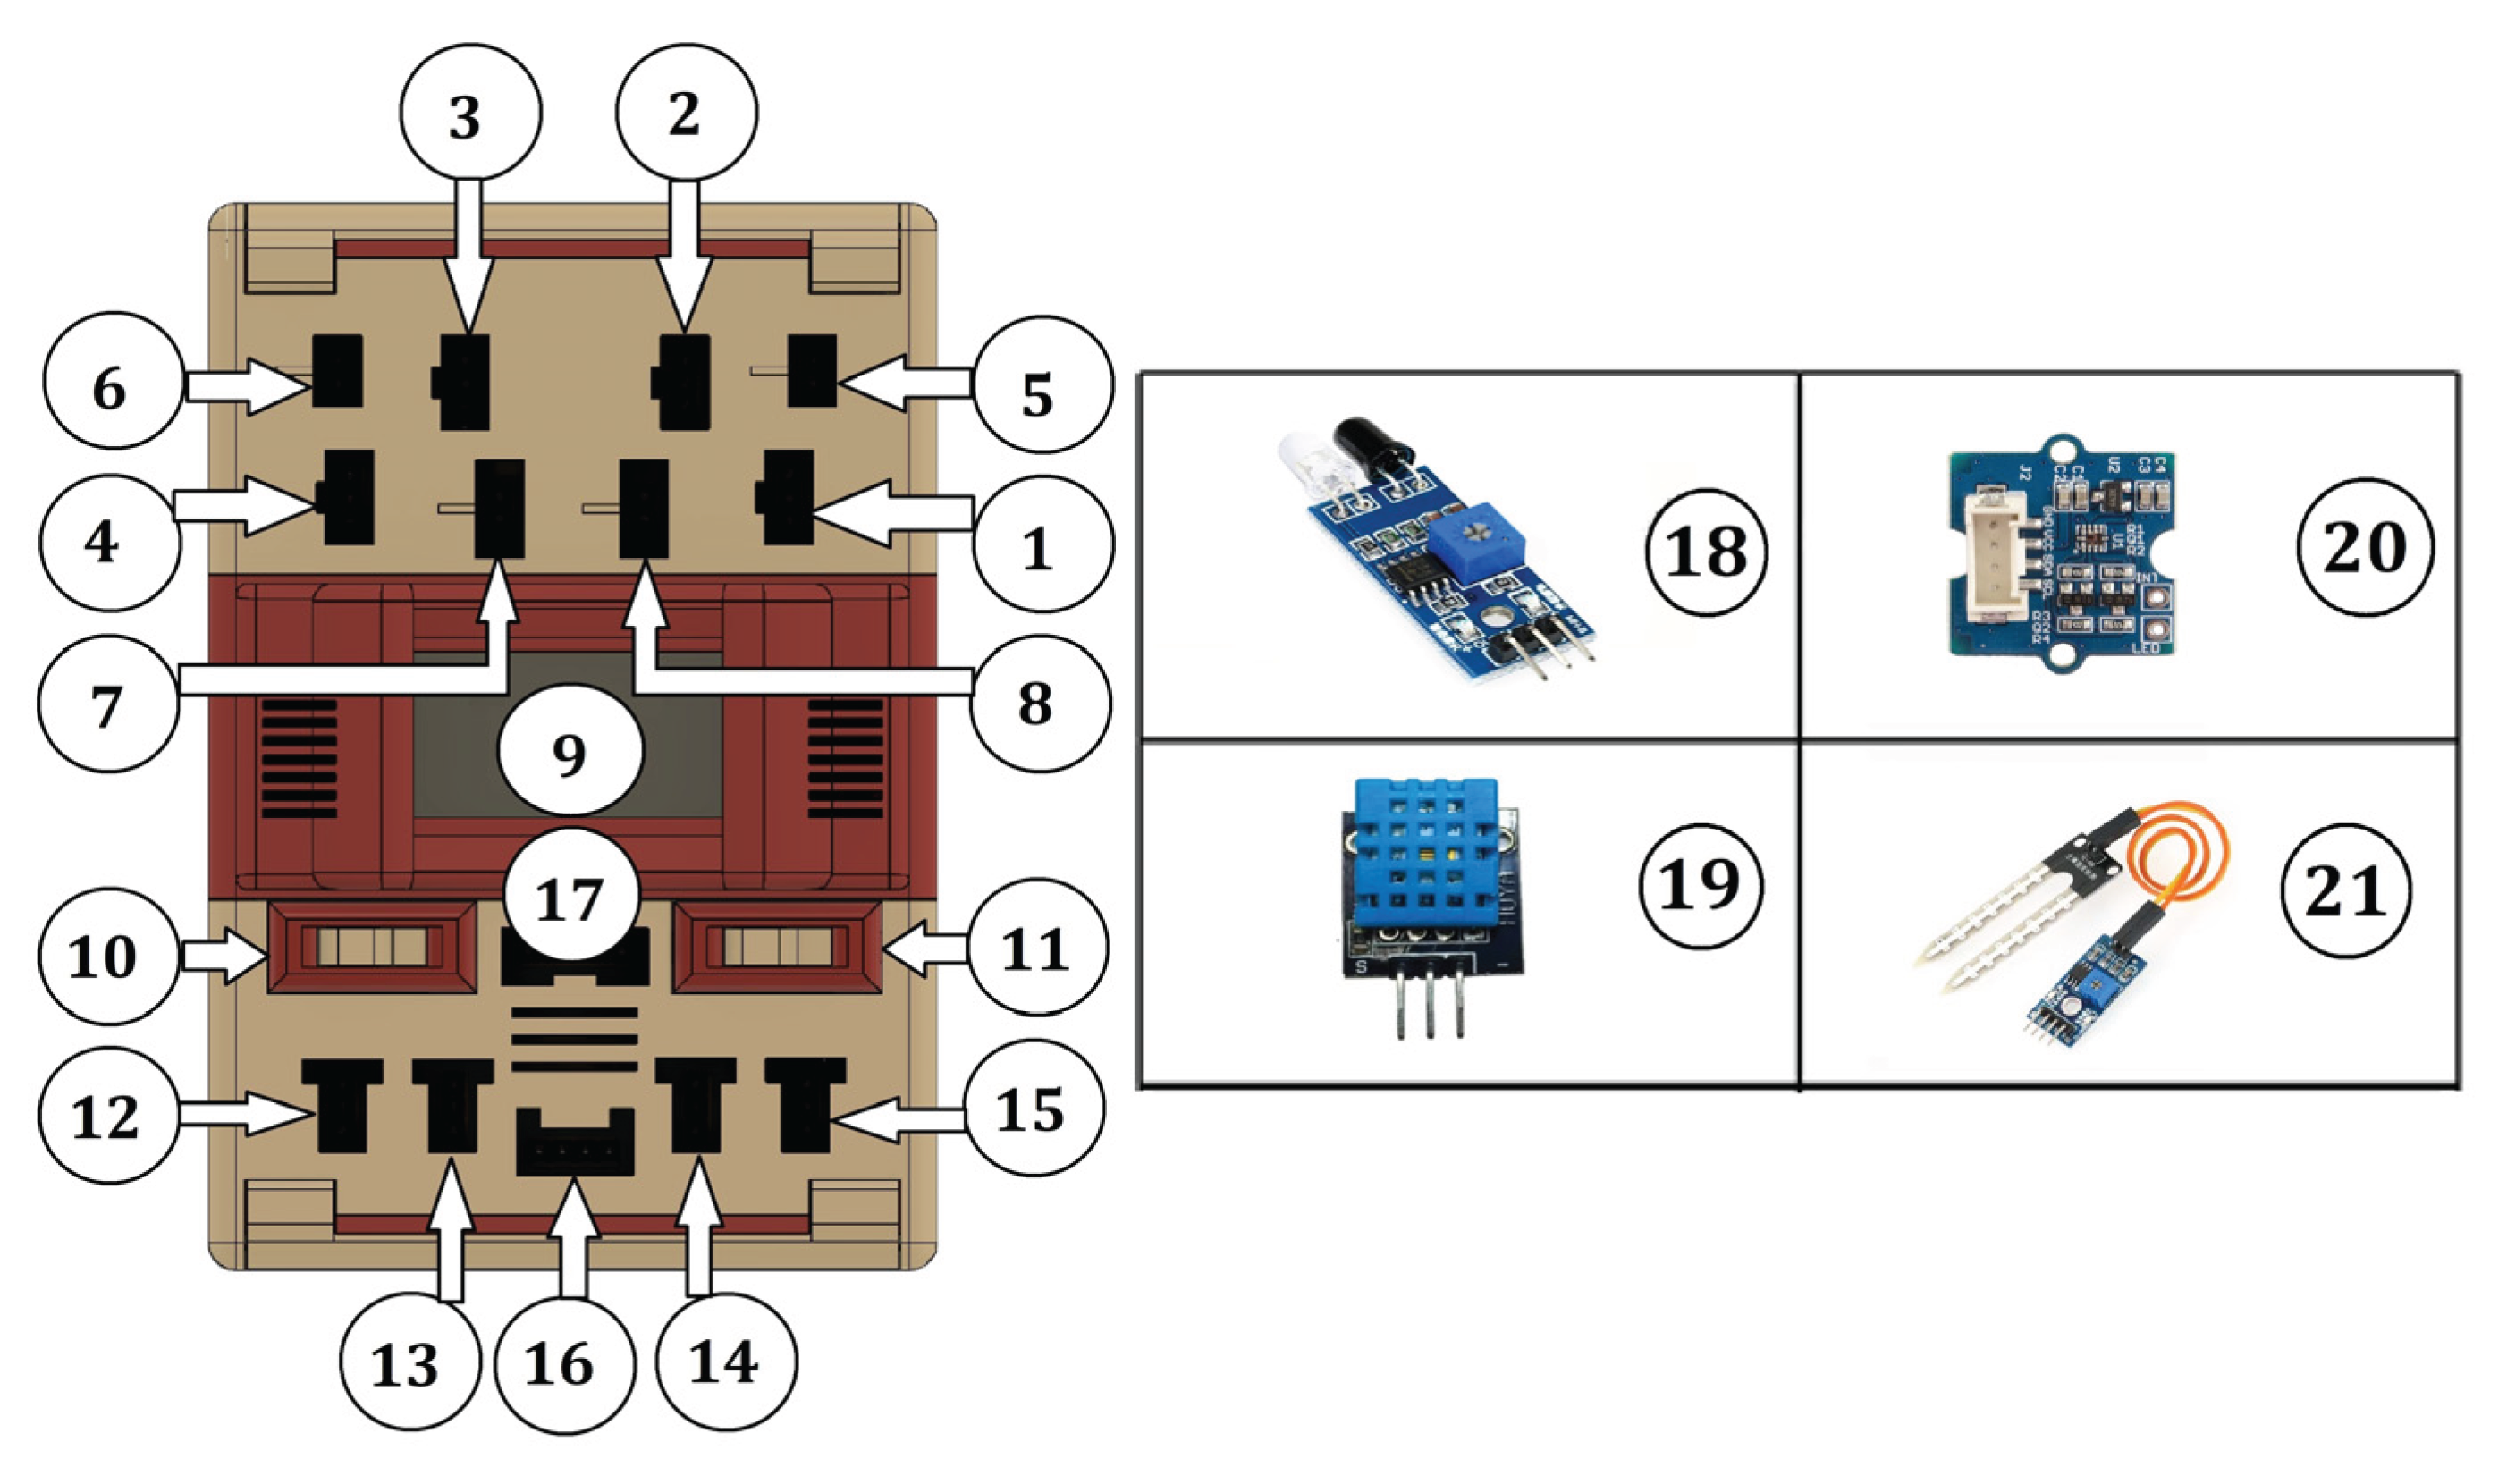
Figure 4.
The flowchart of the firmware running in the Arduino.
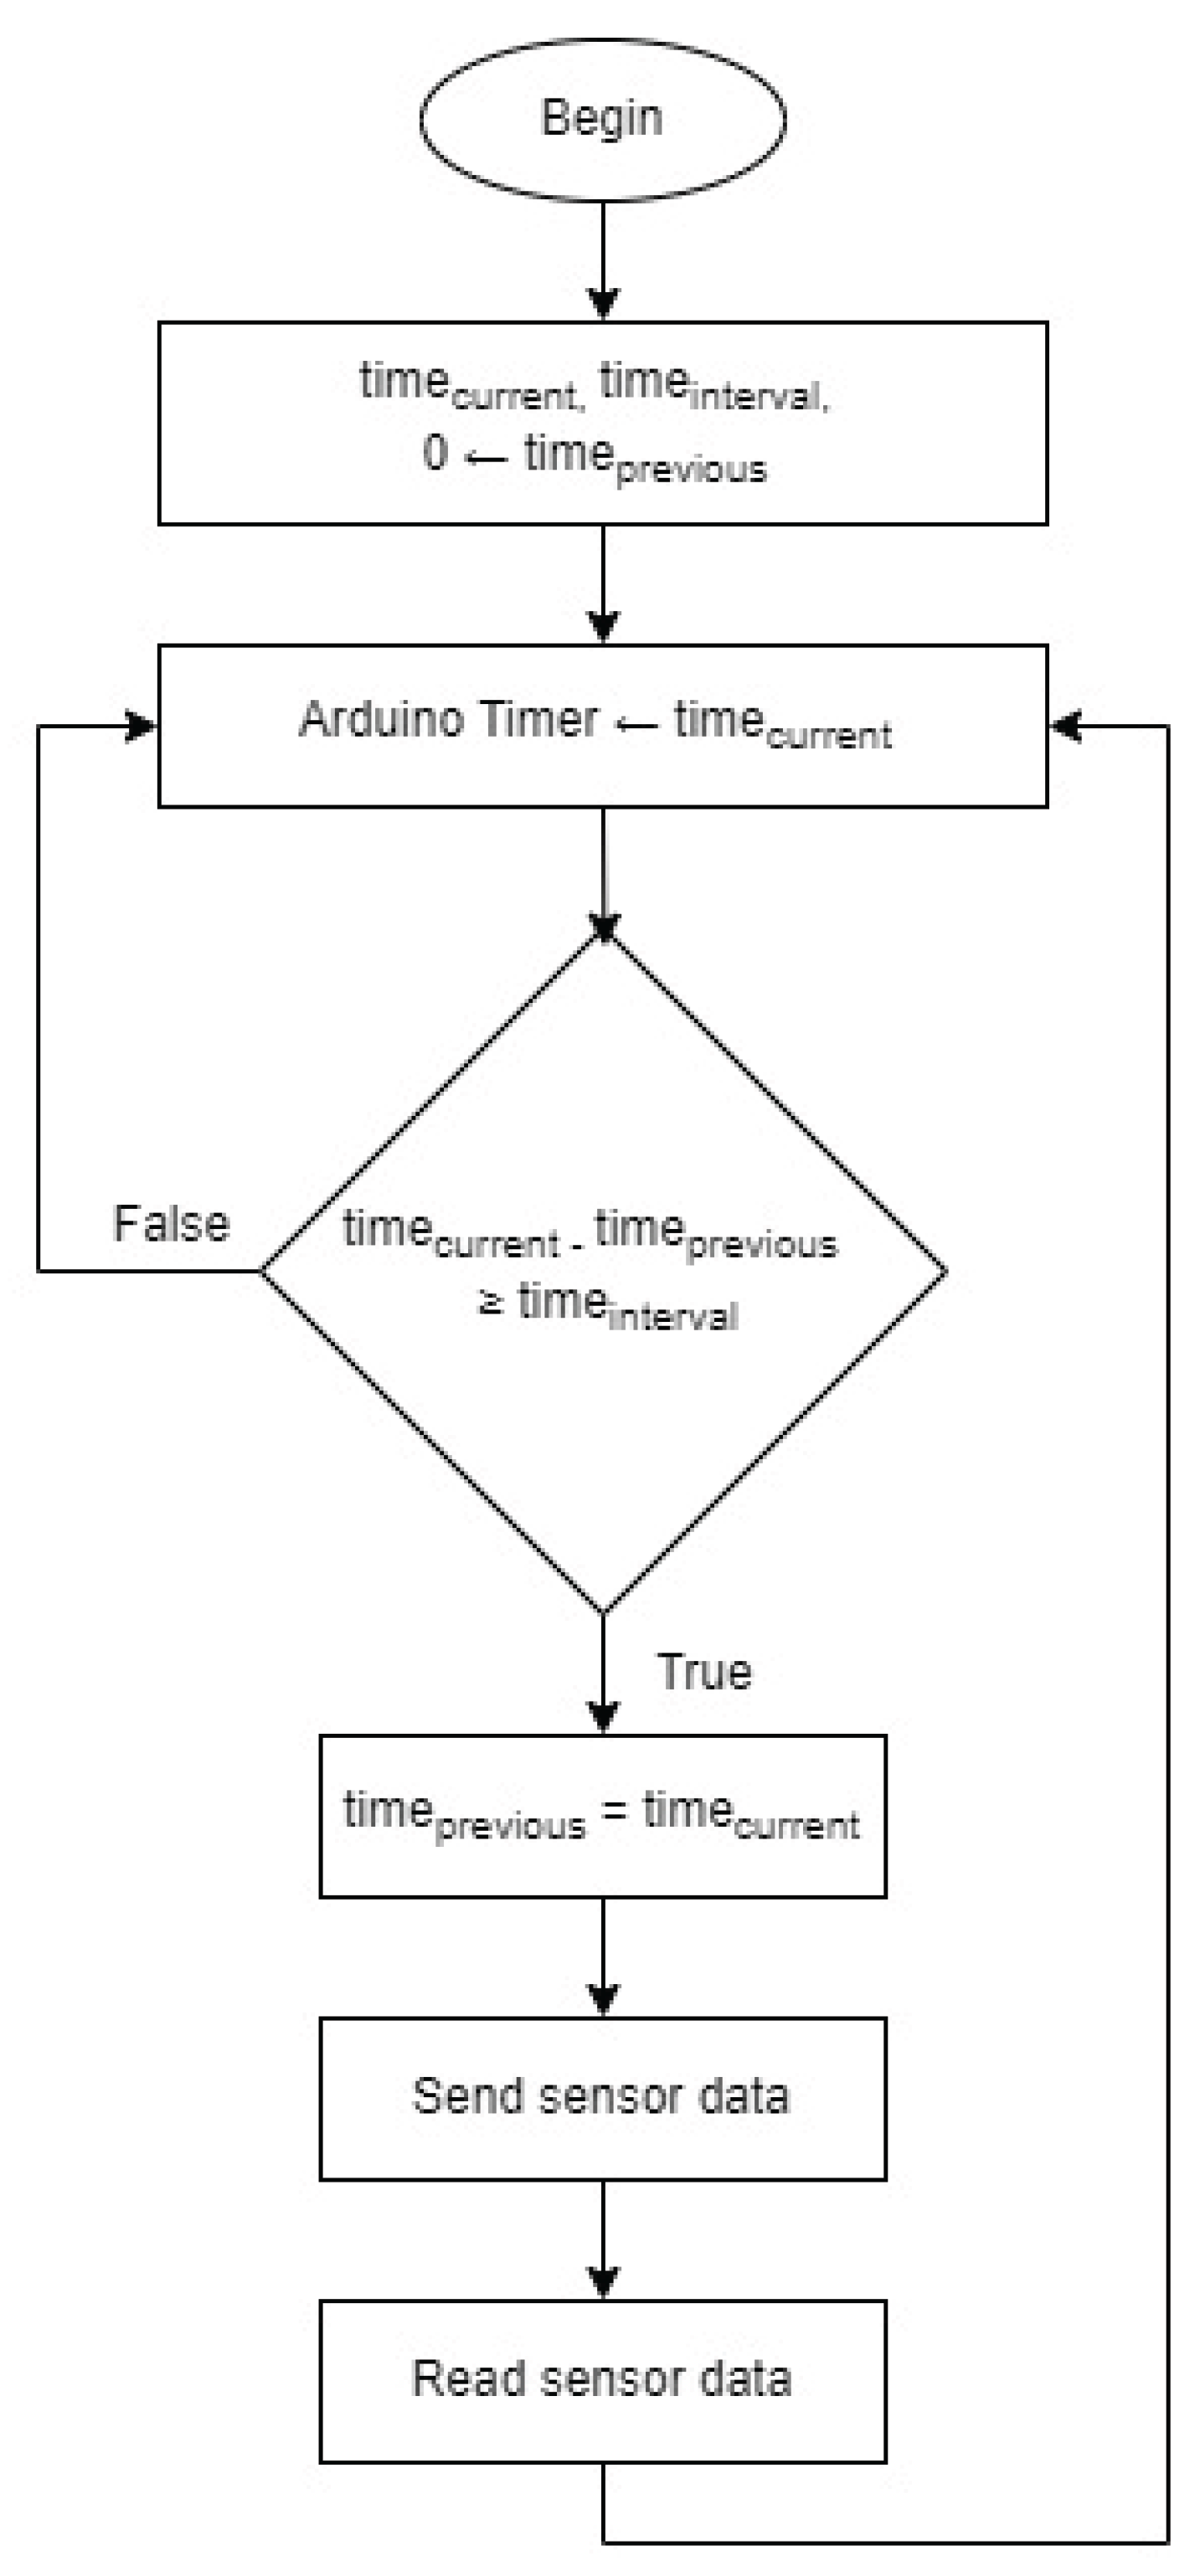
Figure 5.
The main menu of the user interface.

Figure 6.
Setting the IoT cloud platform.
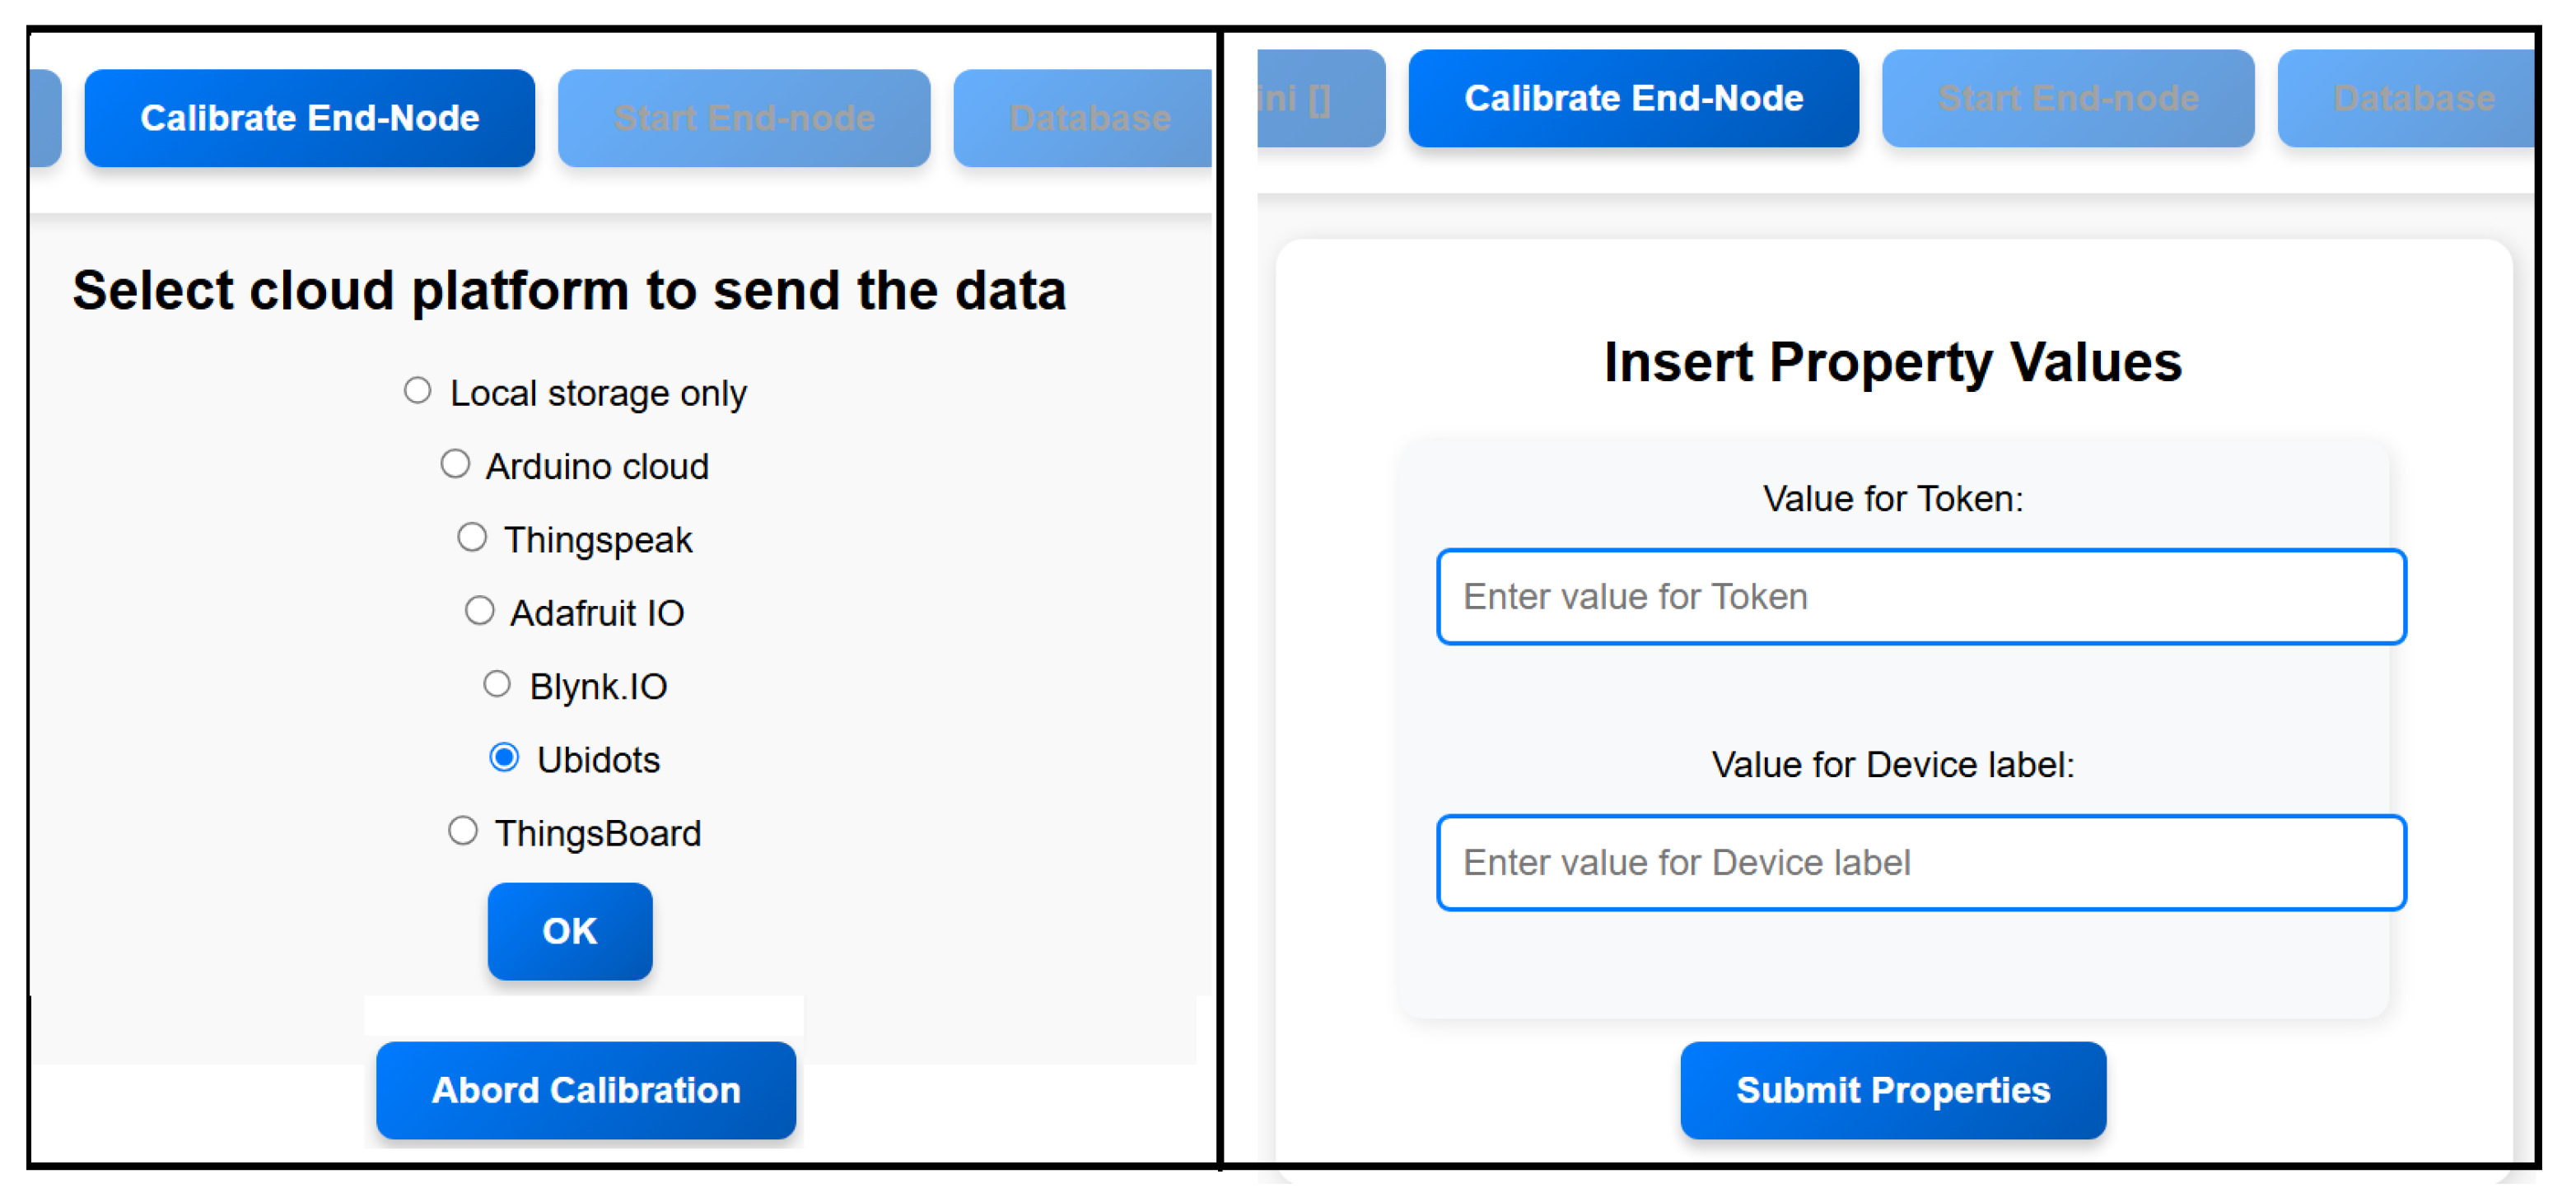
Figure 7.
A virtual device in Ubidots configured to receive data labeled as “random_number.” To successfully transmit data to this device, both the token and the API label (shown at the left) must be included with the data payload.
Figure 7.
A virtual device in Ubidots configured to receive data labeled as “random_number.” To successfully transmit data to this device, both the token and the API label (shown at the left) must be included with the data payload.
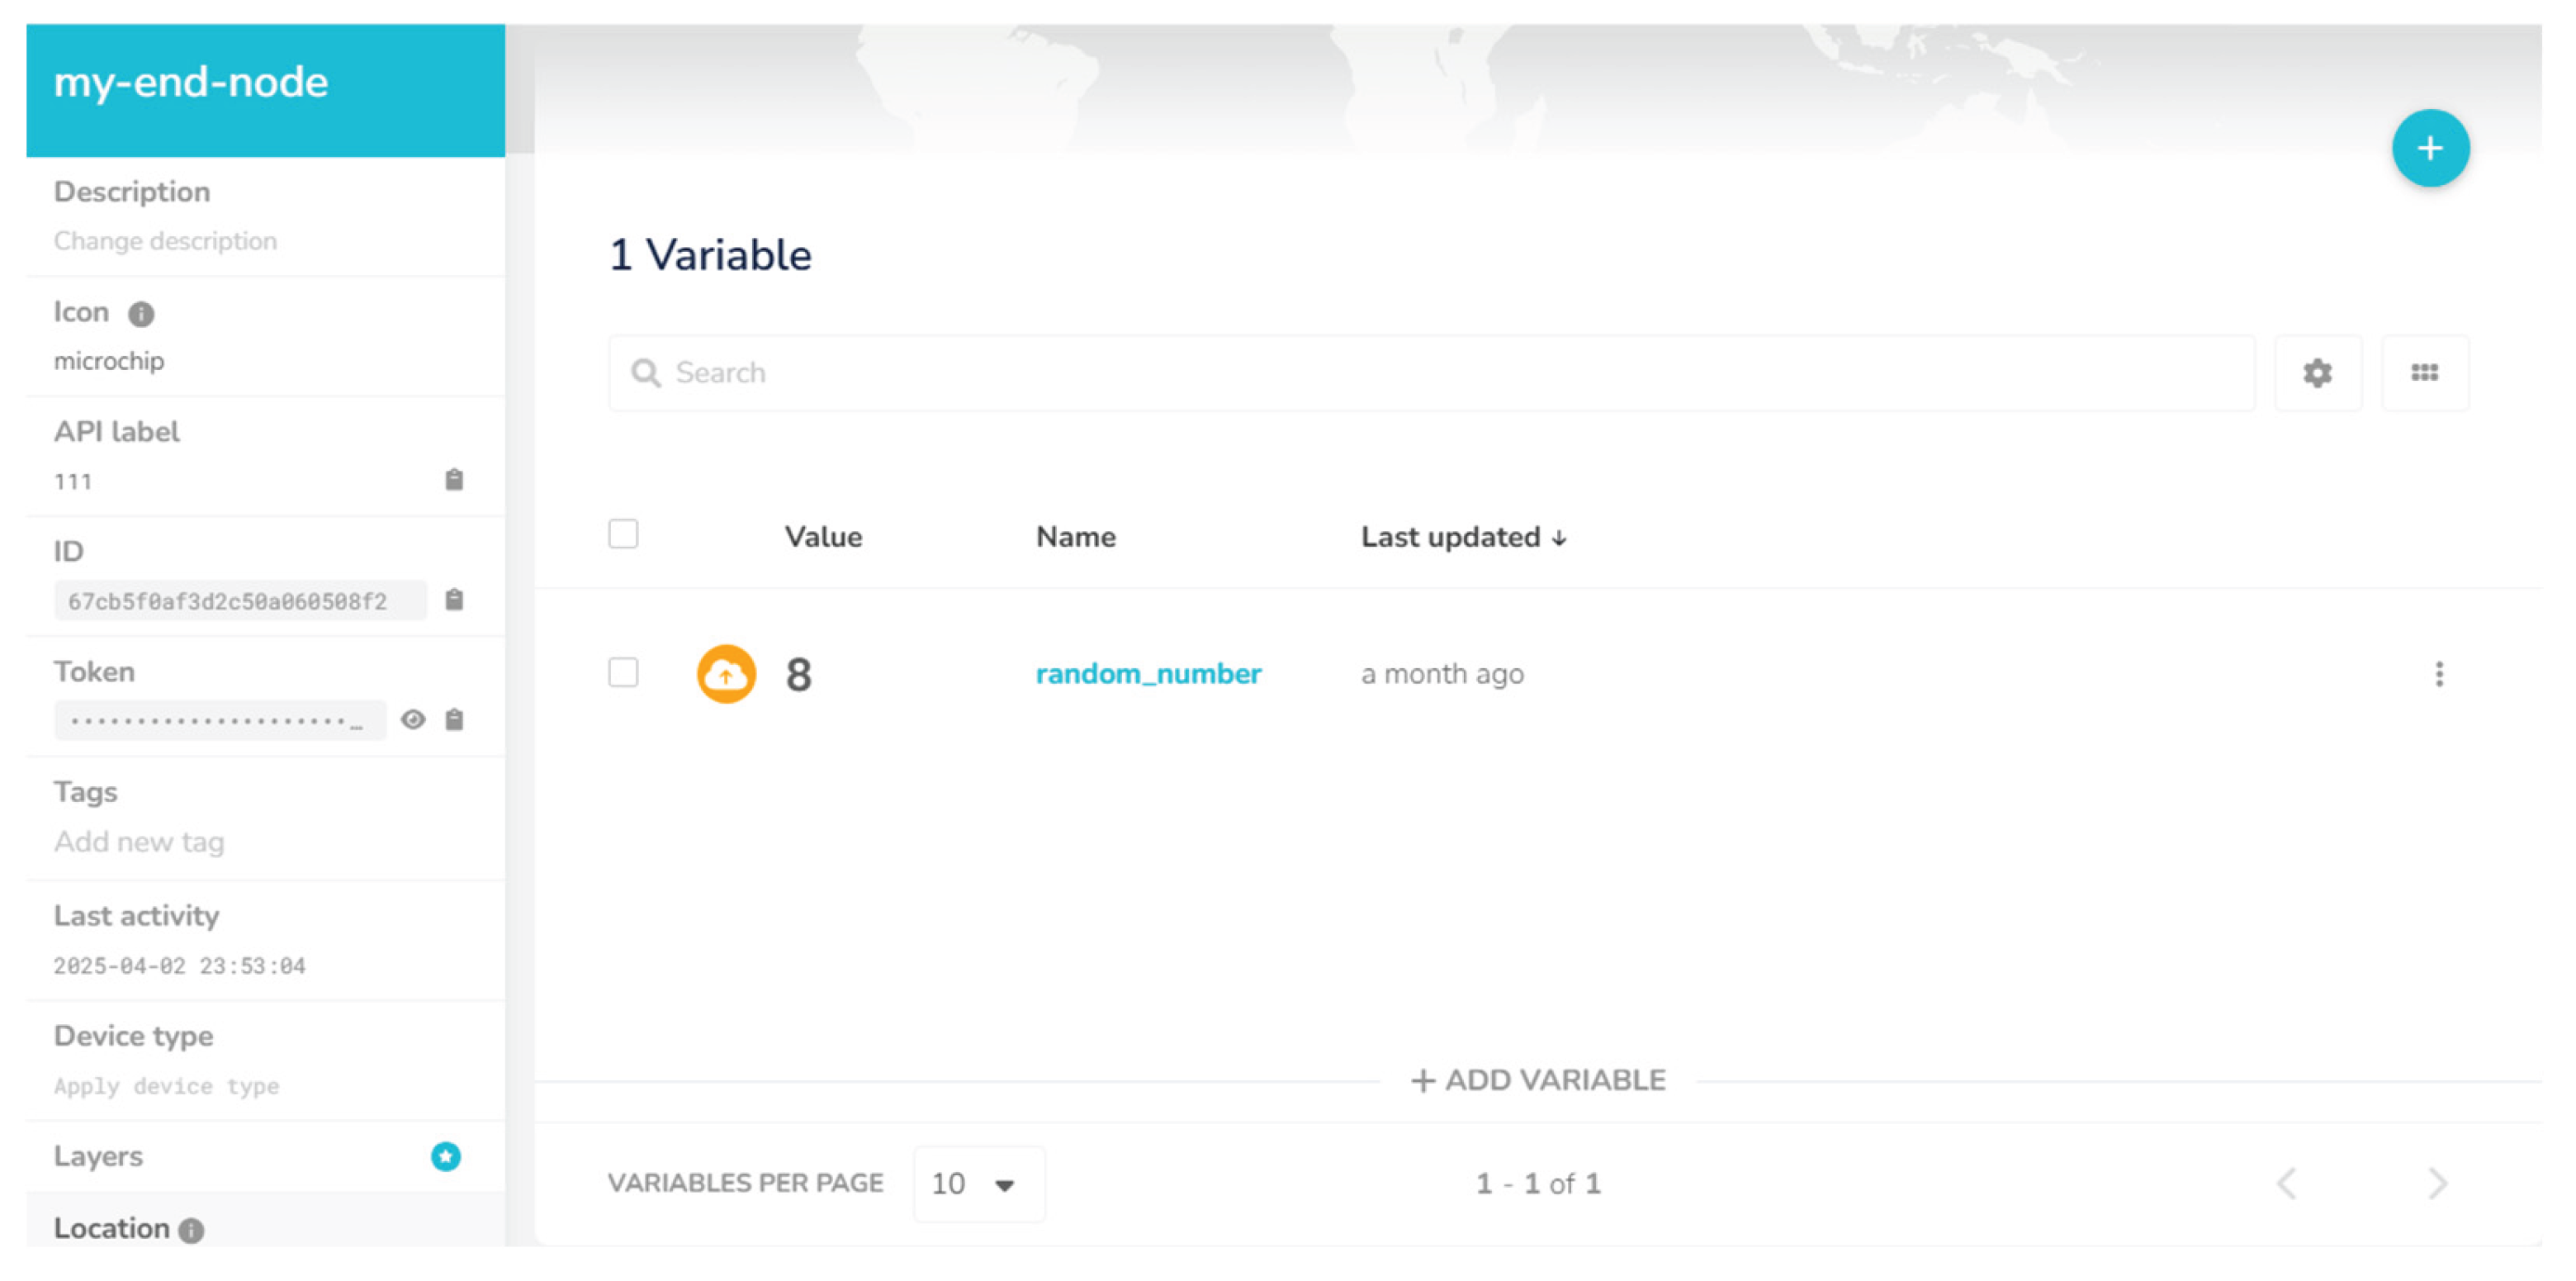
Figure 1.
Setting sensors.
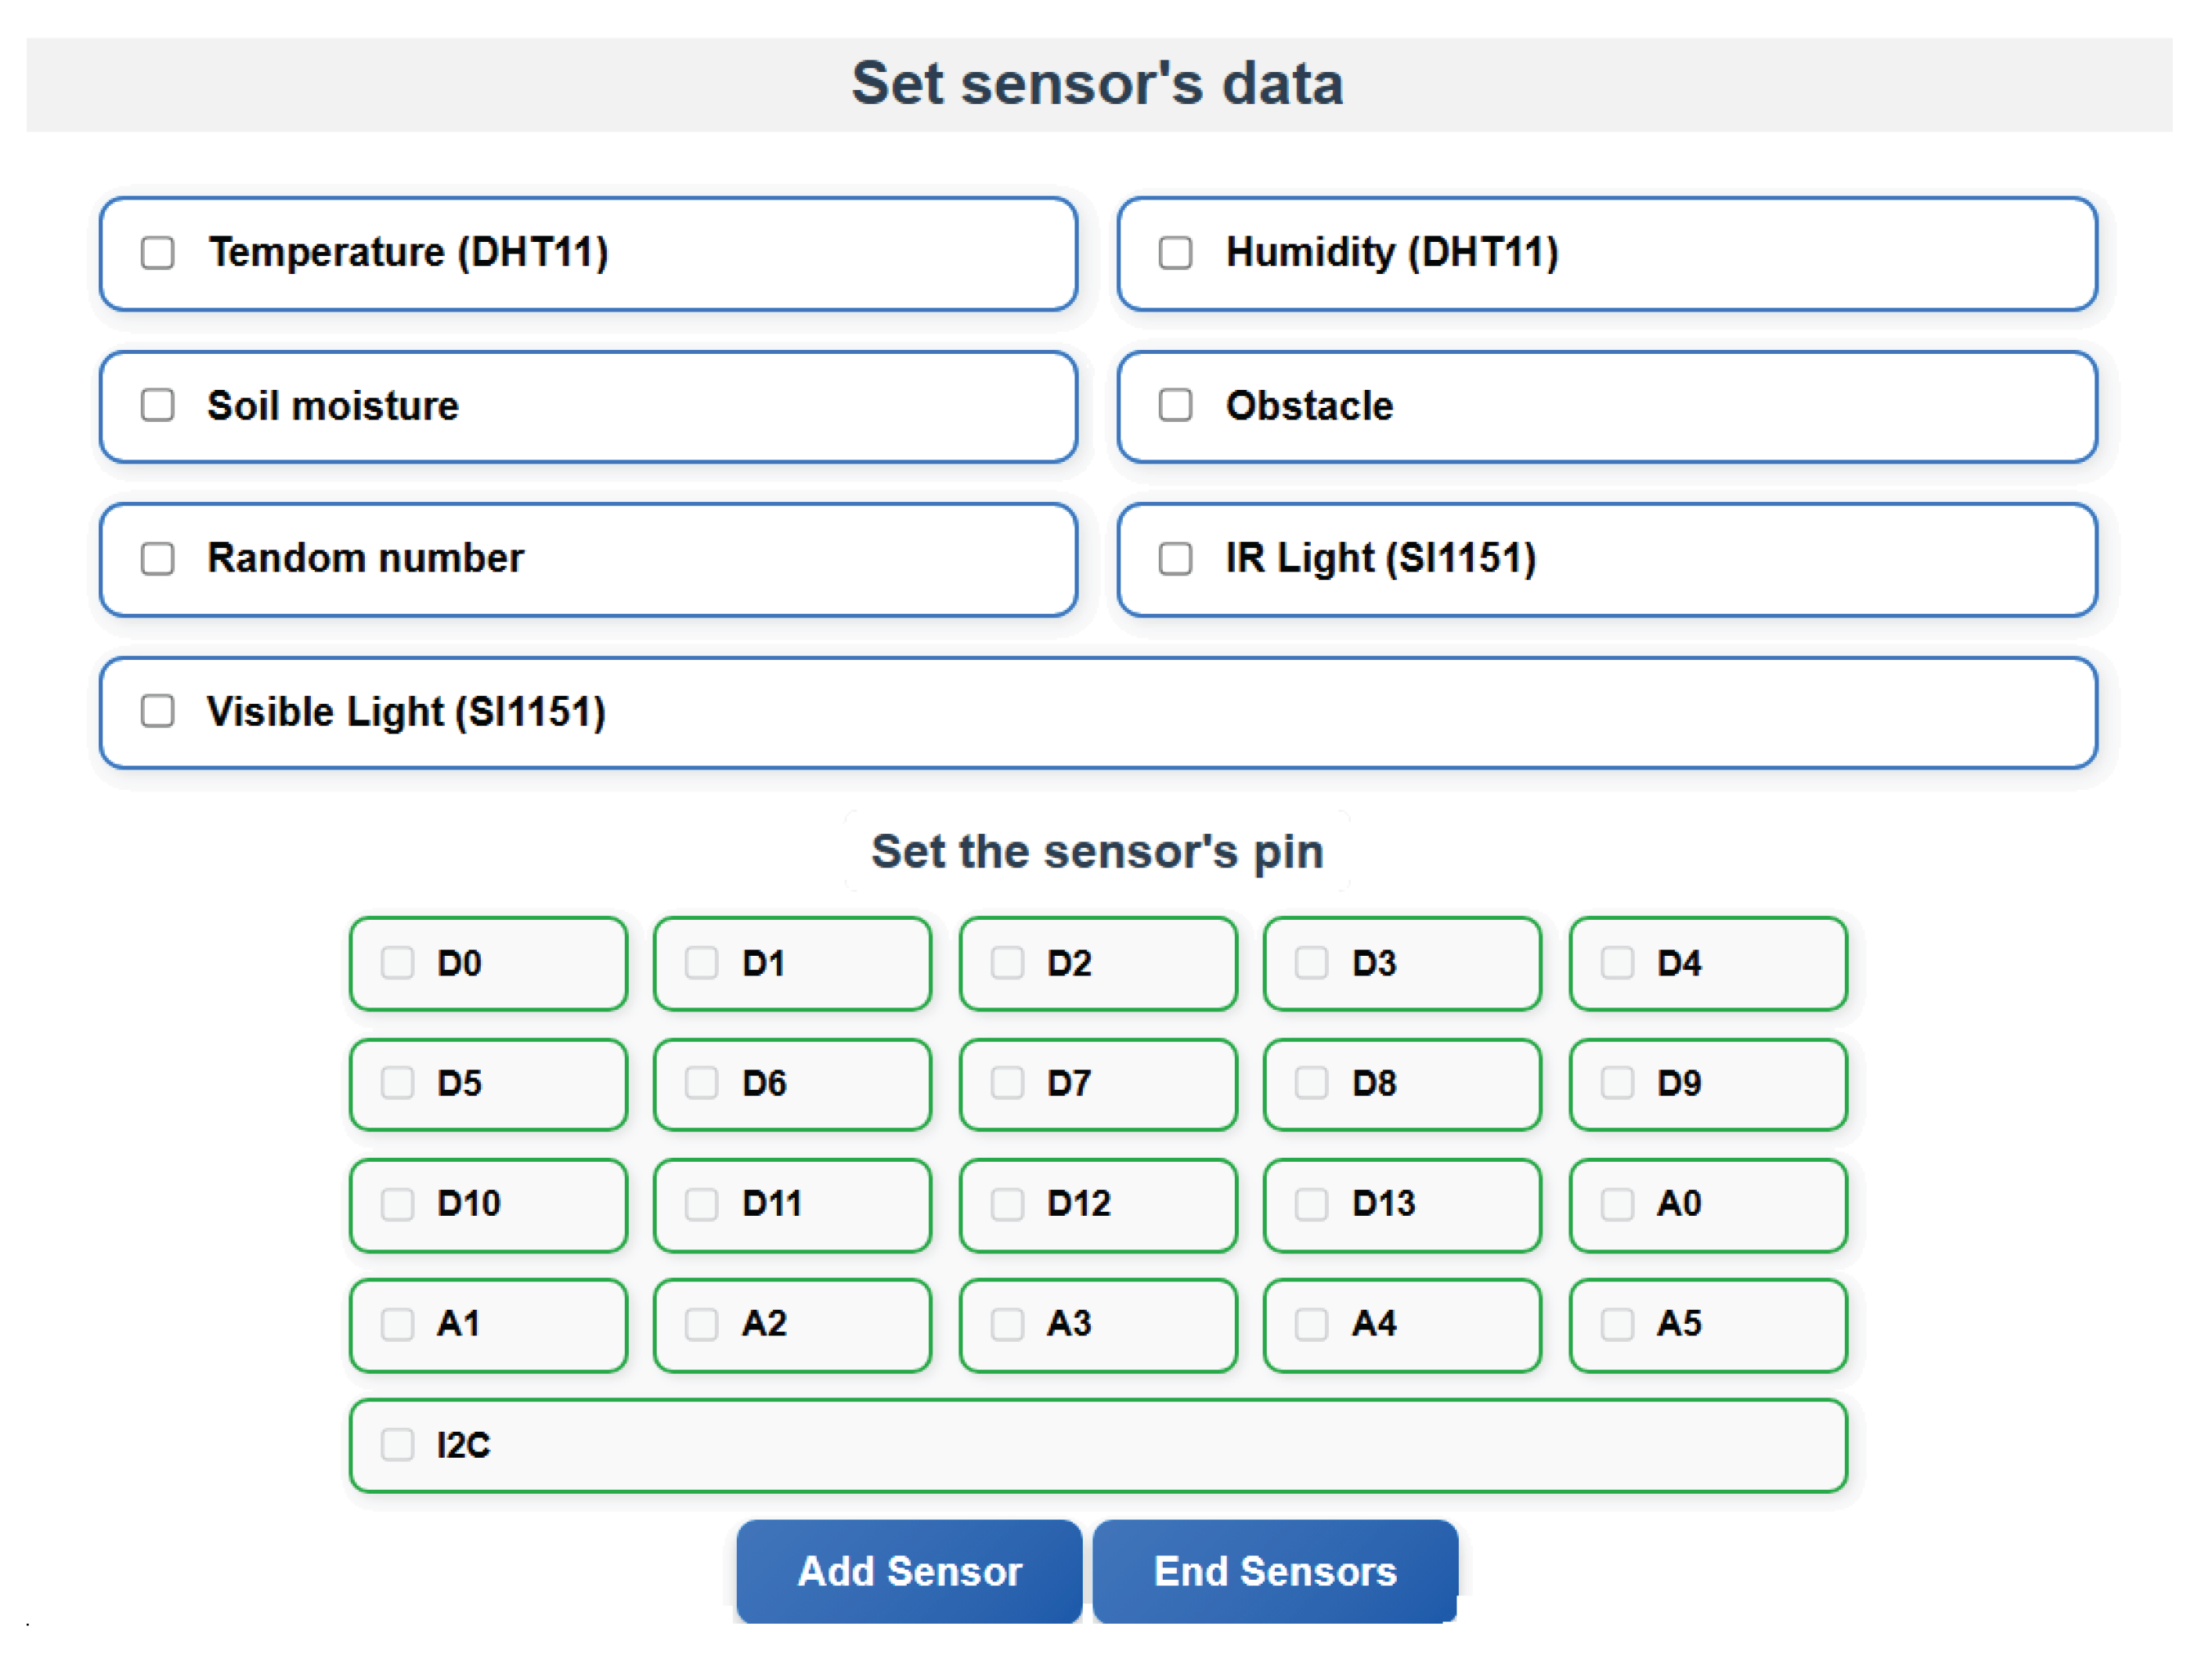
Figure 9.
The dashboard.
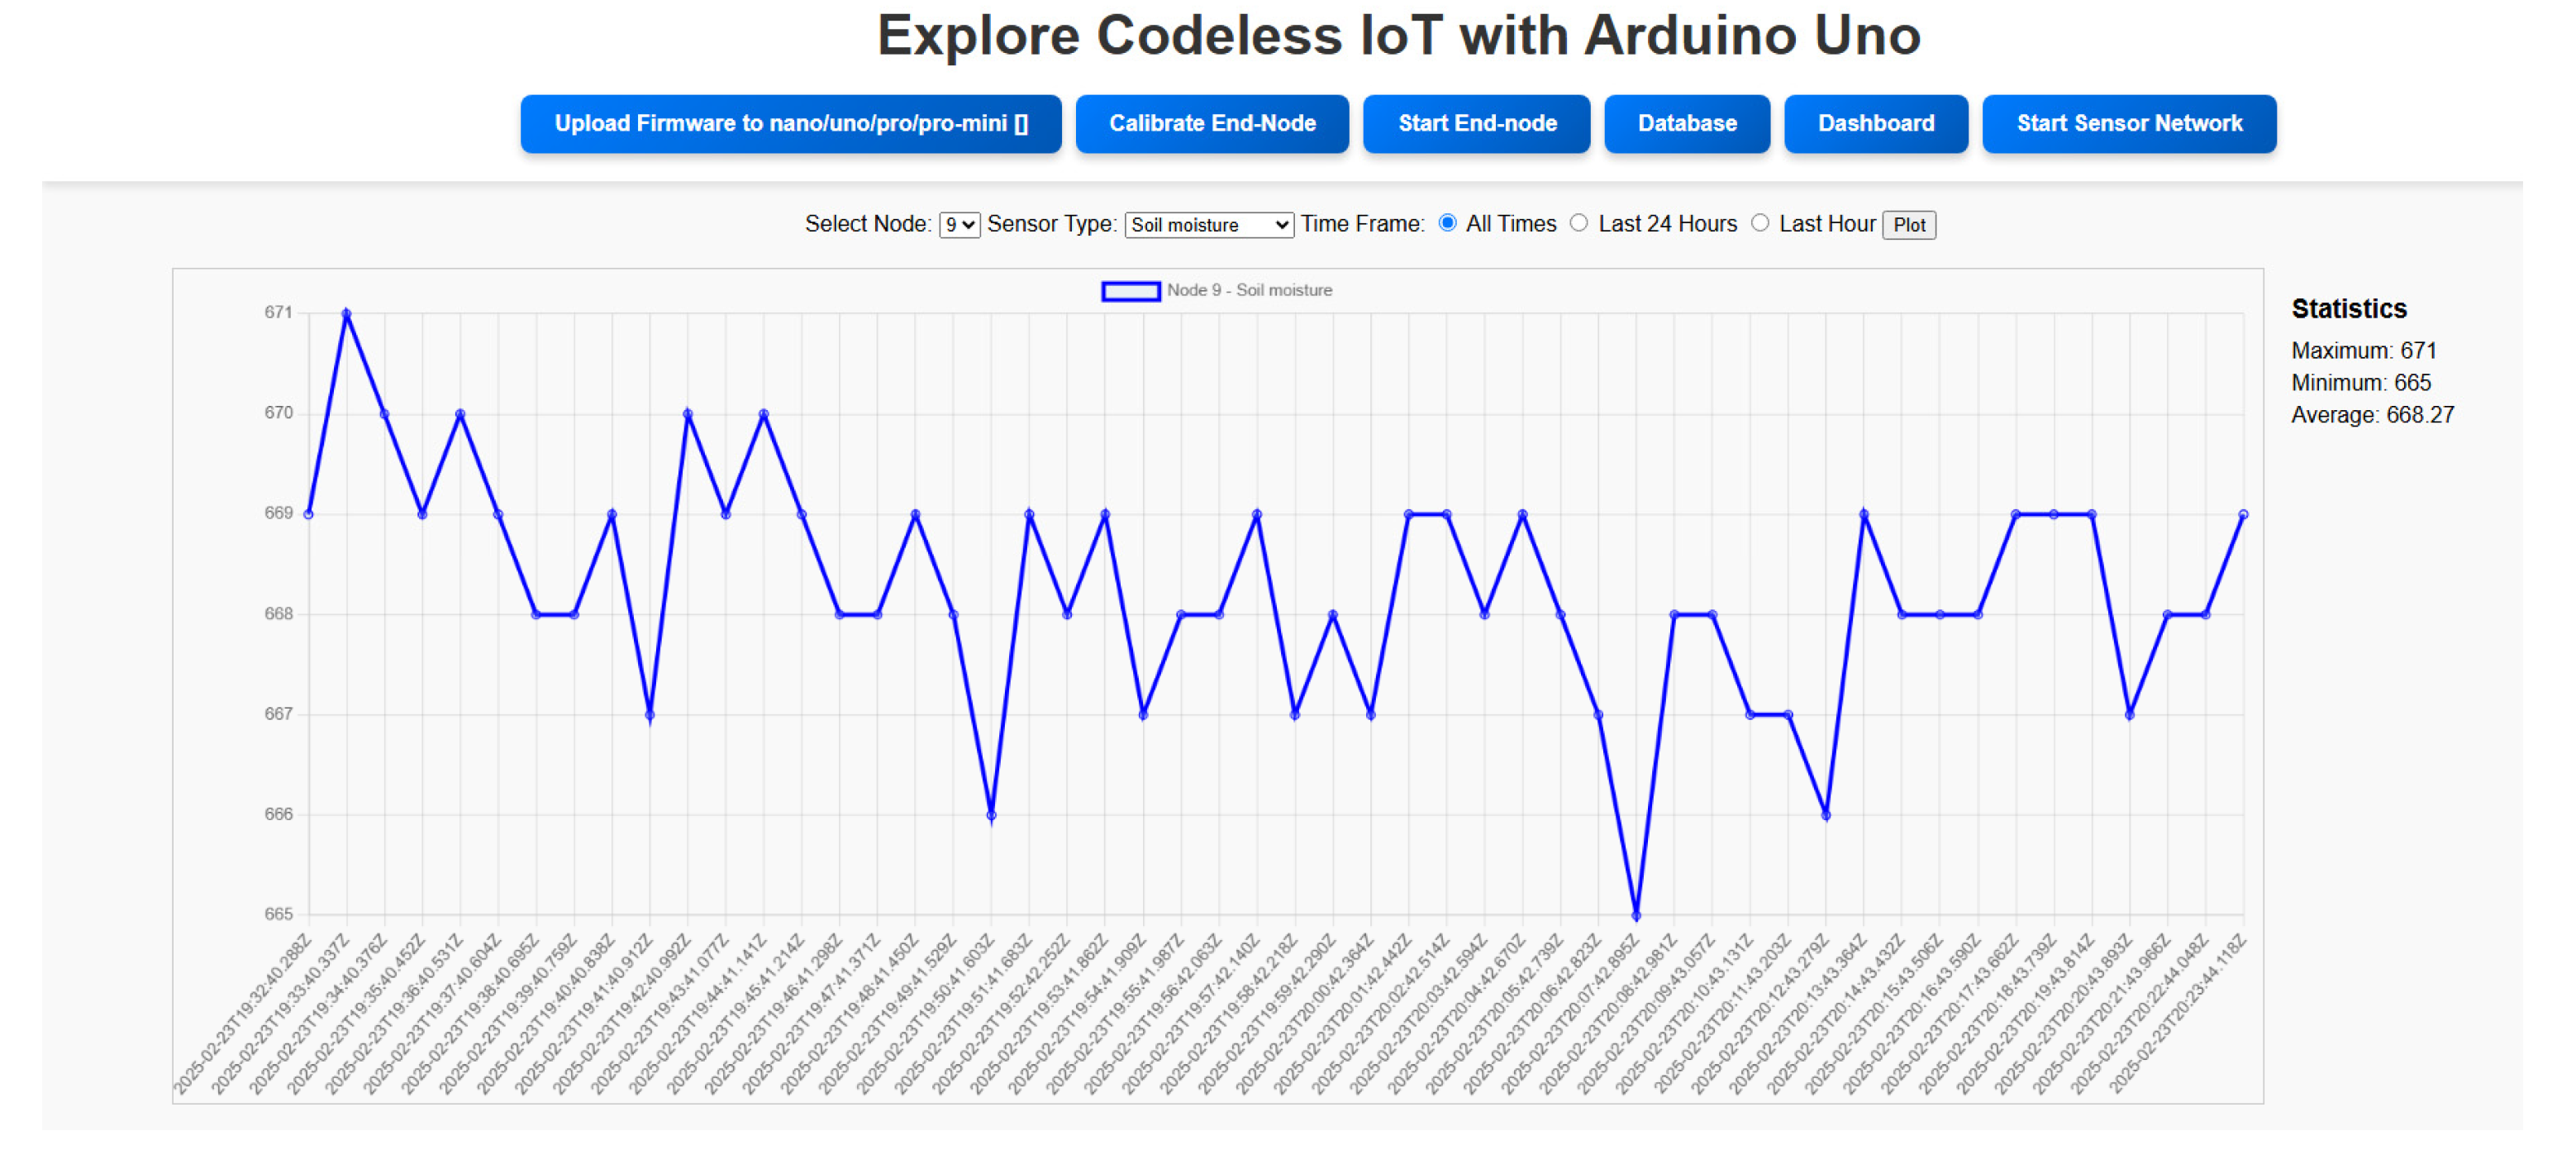
Figure 10.
Querying the data.
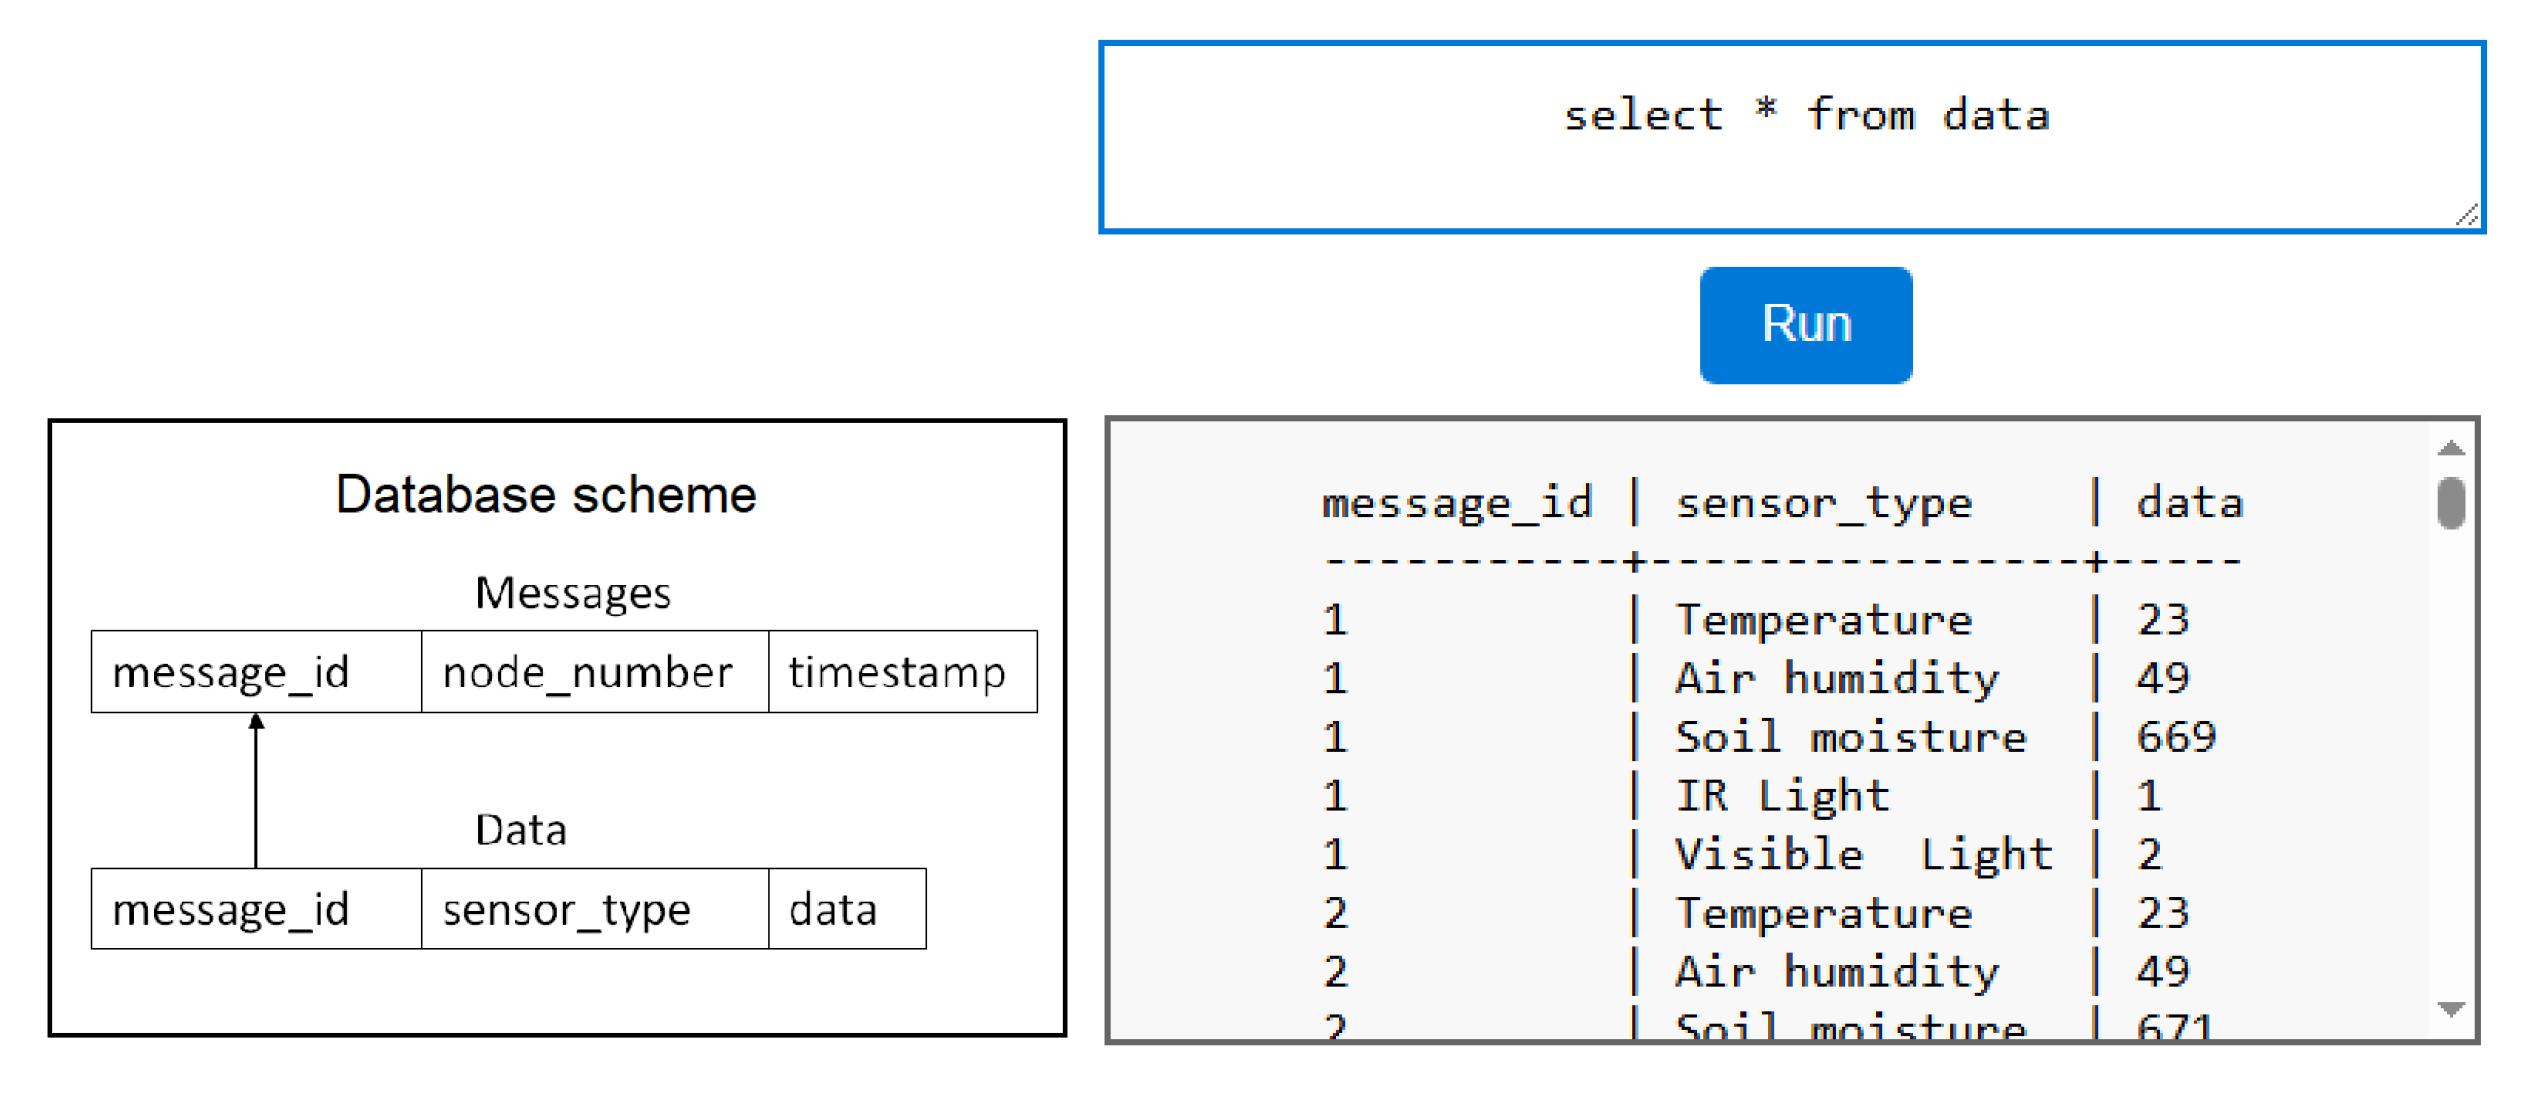
Figure 11.
Starting and inspecting a network with more than one end-nodes.
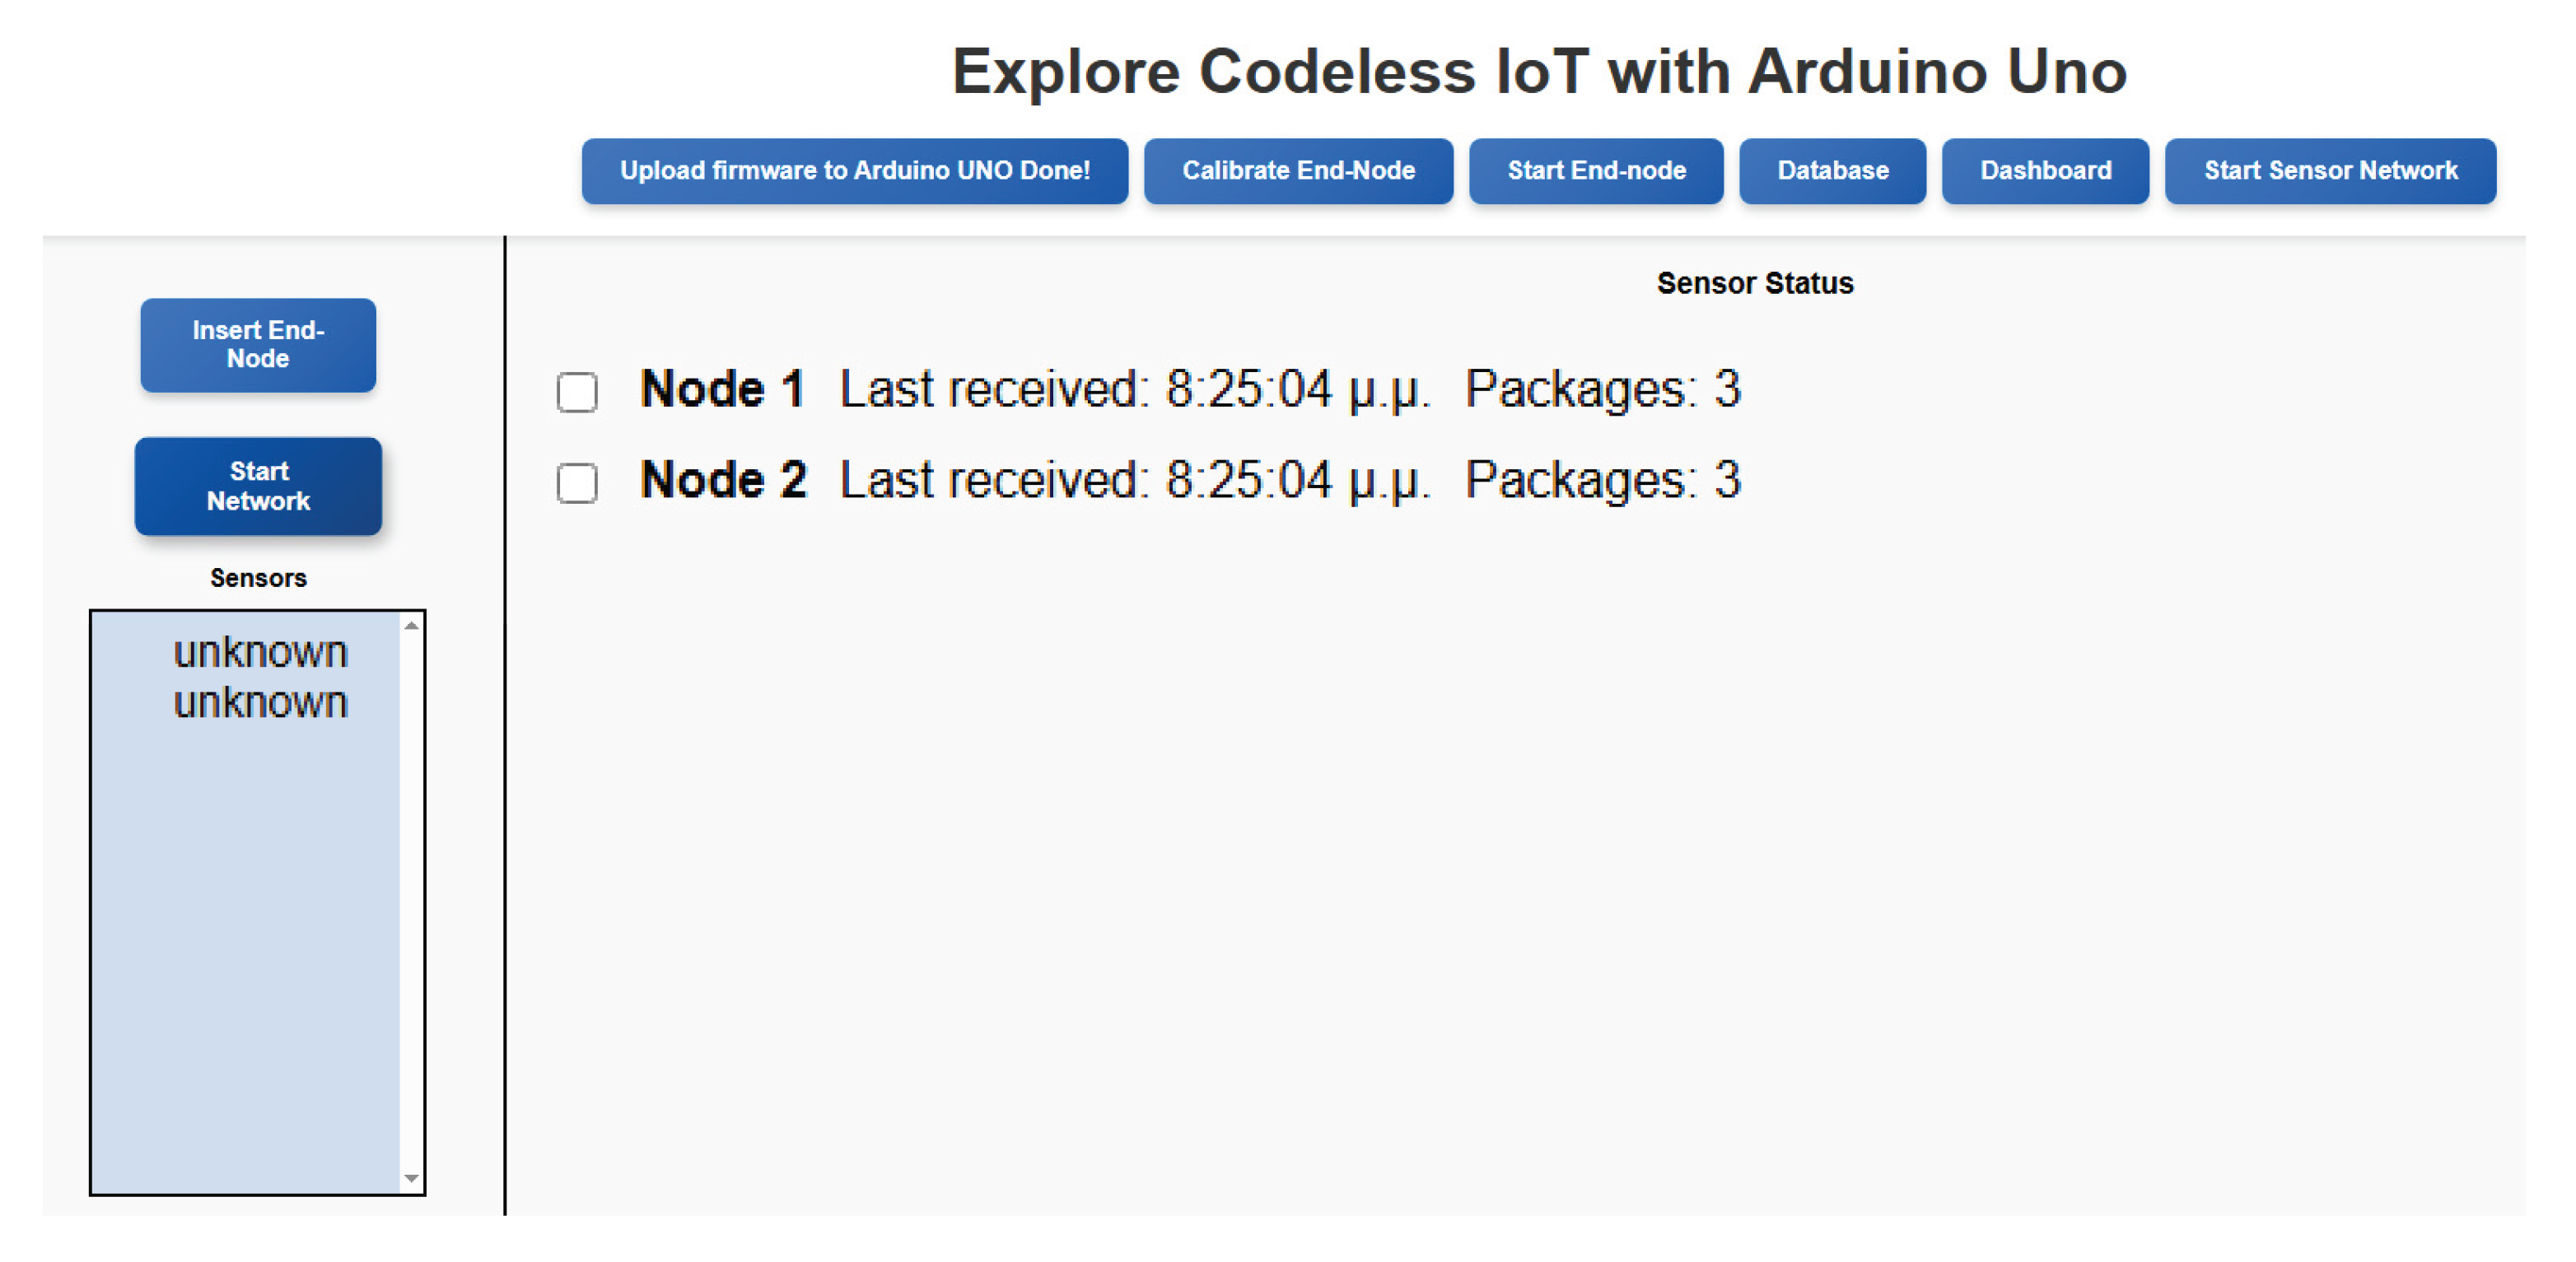
Figure 12.
An image of the programmable component of Odysseus, showing the sensors used in this case study. Highlighted within circles from bottom to top are: the DHT11 air temperature and humidity sensor (plugged into the bottommost 3‐pin sensor slot), the SI1151 sunlight sensor for visible and IR light (plugged into the I2C slot), and the soil moisture sensor (plugged into the topmost 3‐pin sensor slot).
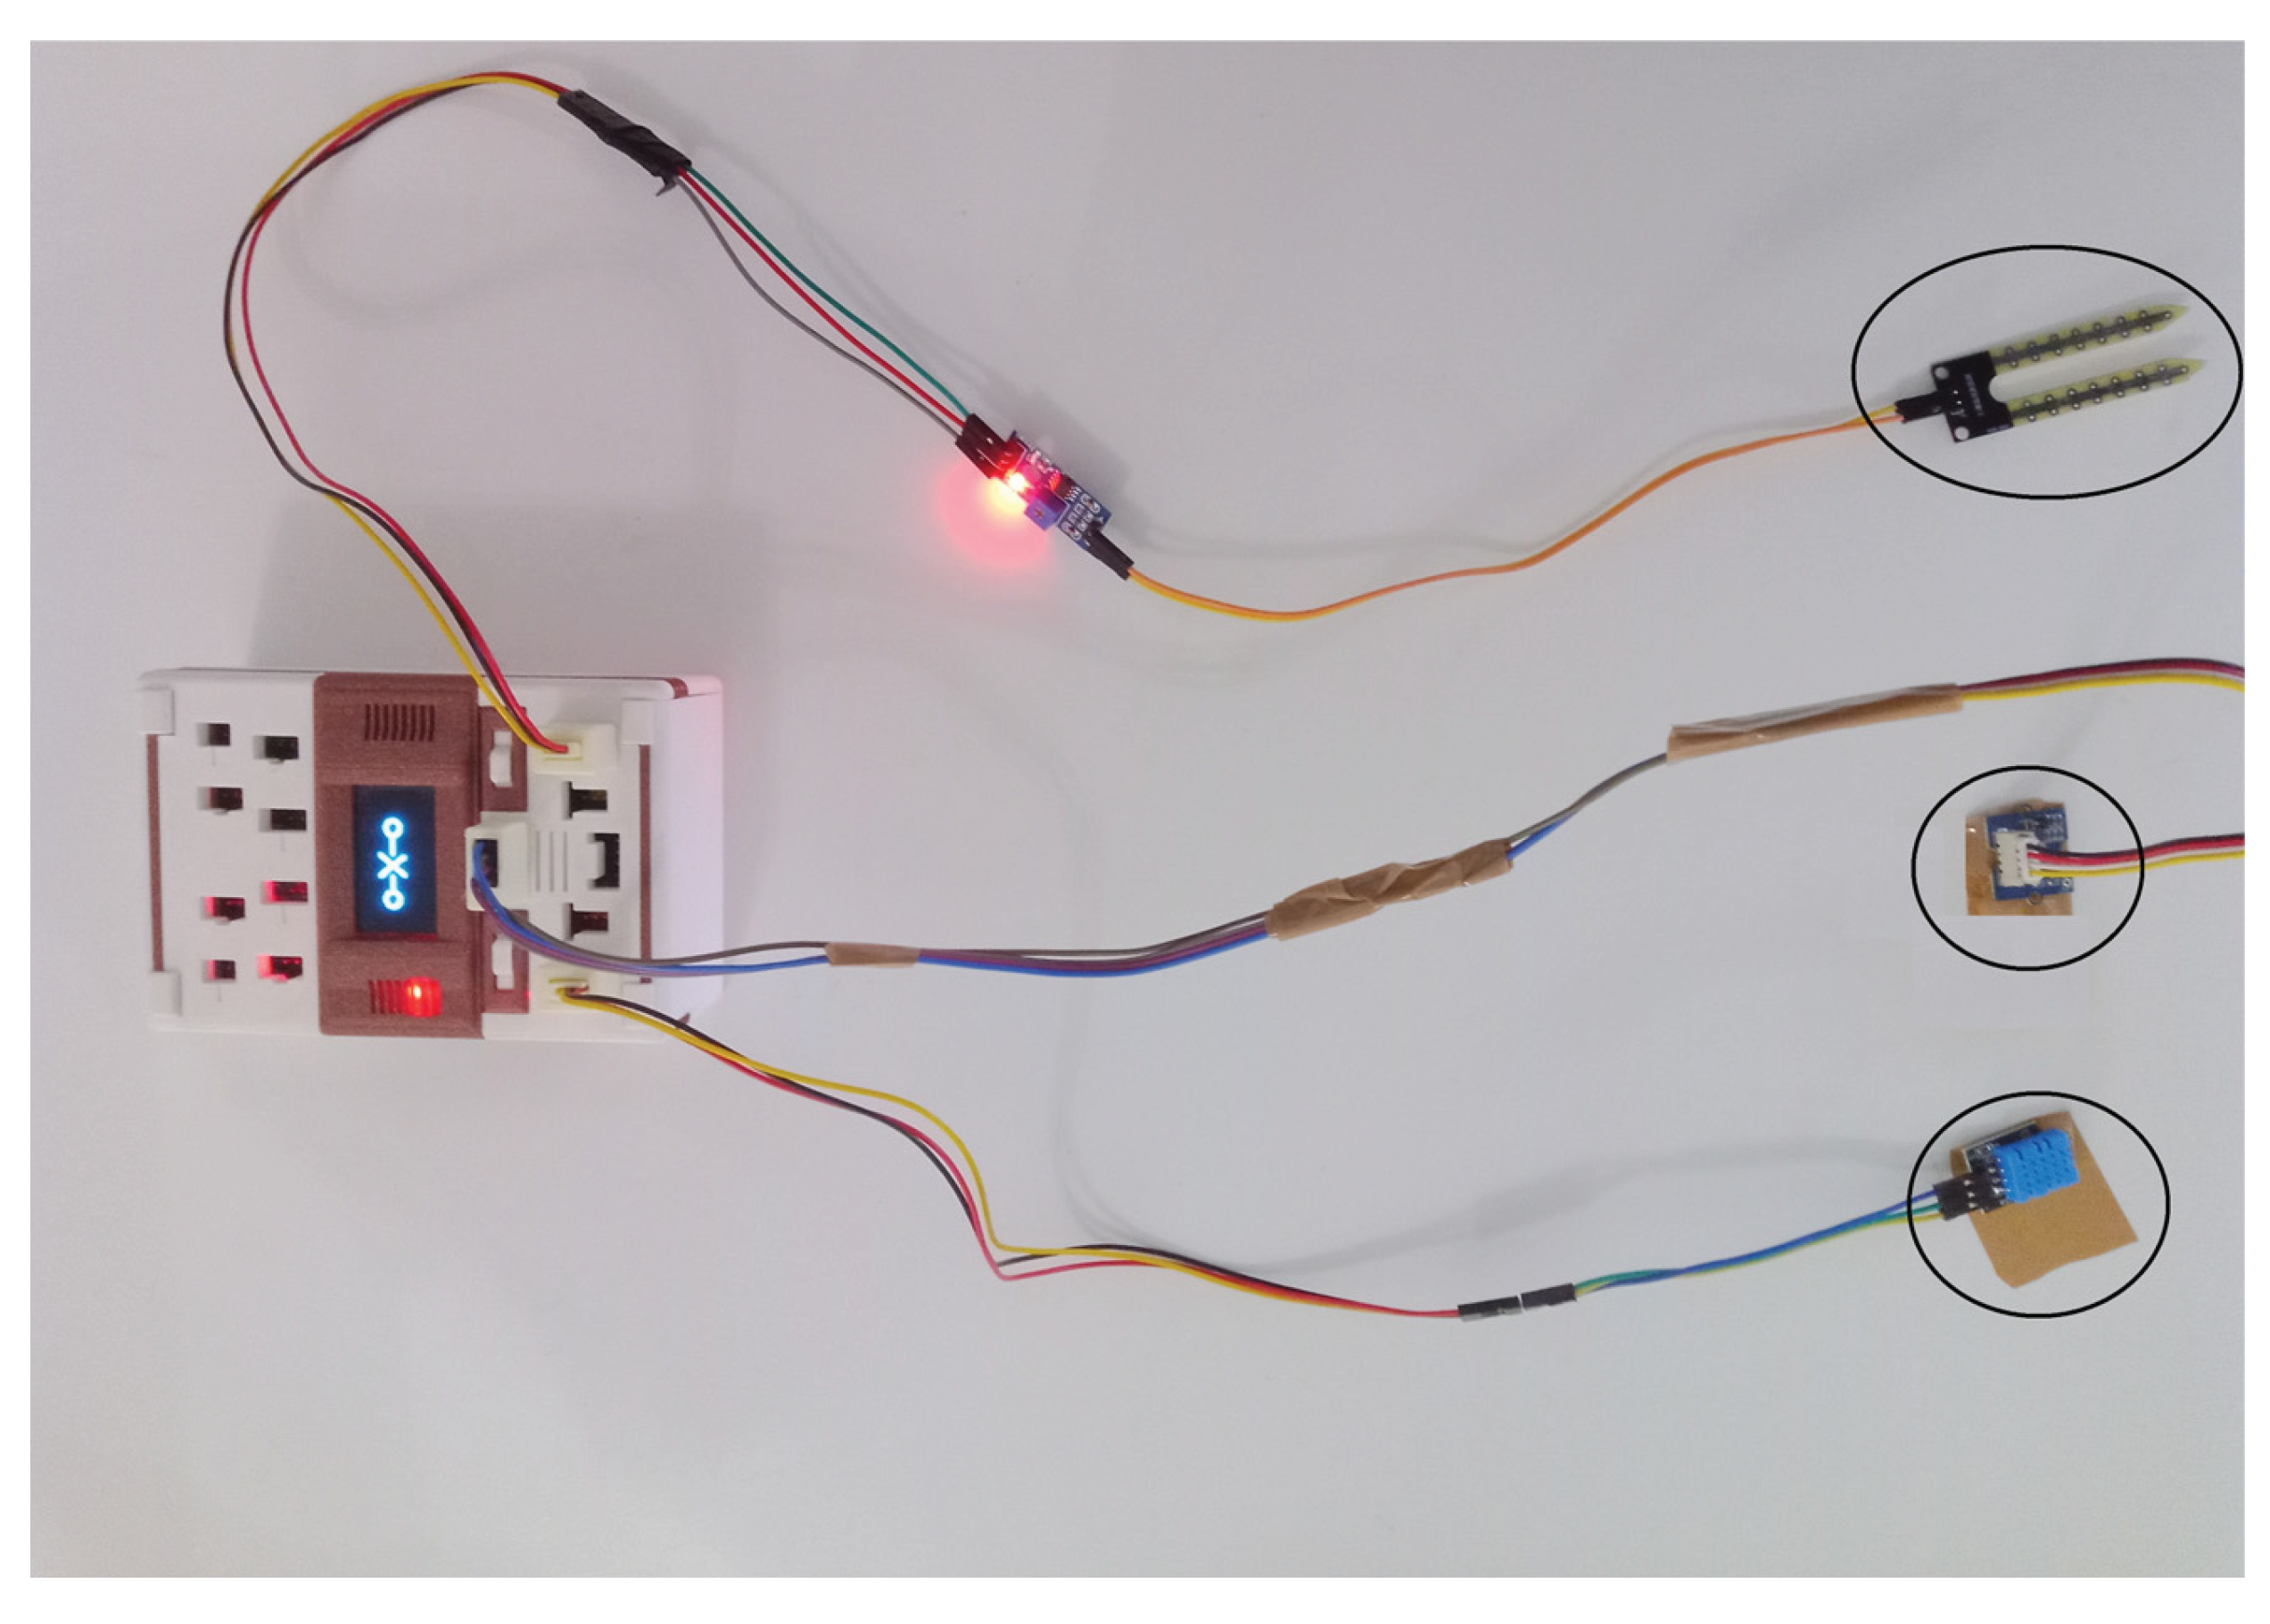
Figure 13.
The Technology Acceptance Model’s key factors [3].
Figure 13.
The Technology Acceptance Model’s key factors [3].
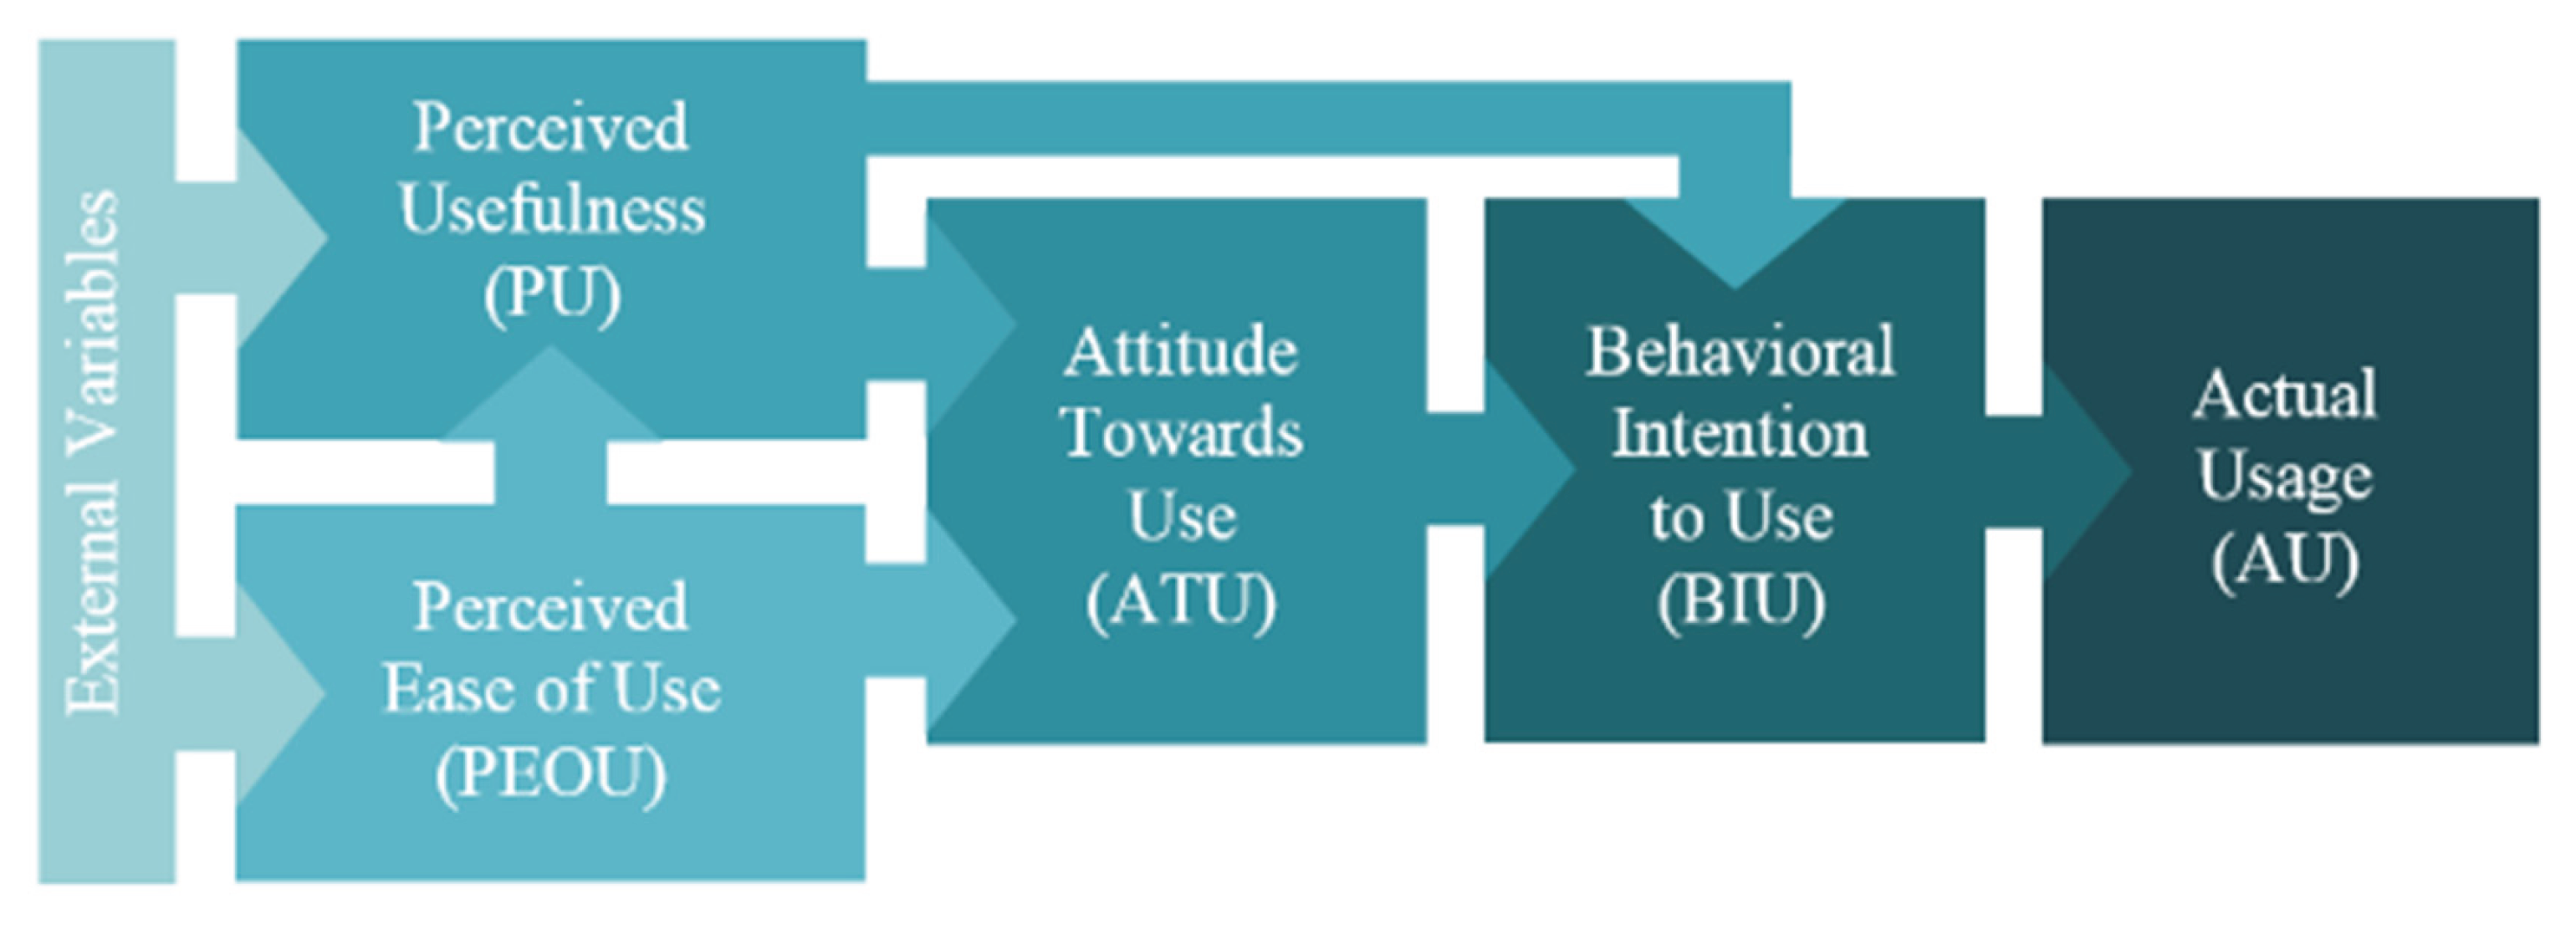
Figure 14.
Modified TAM model for measuring the No-Code platform’s intention for use.
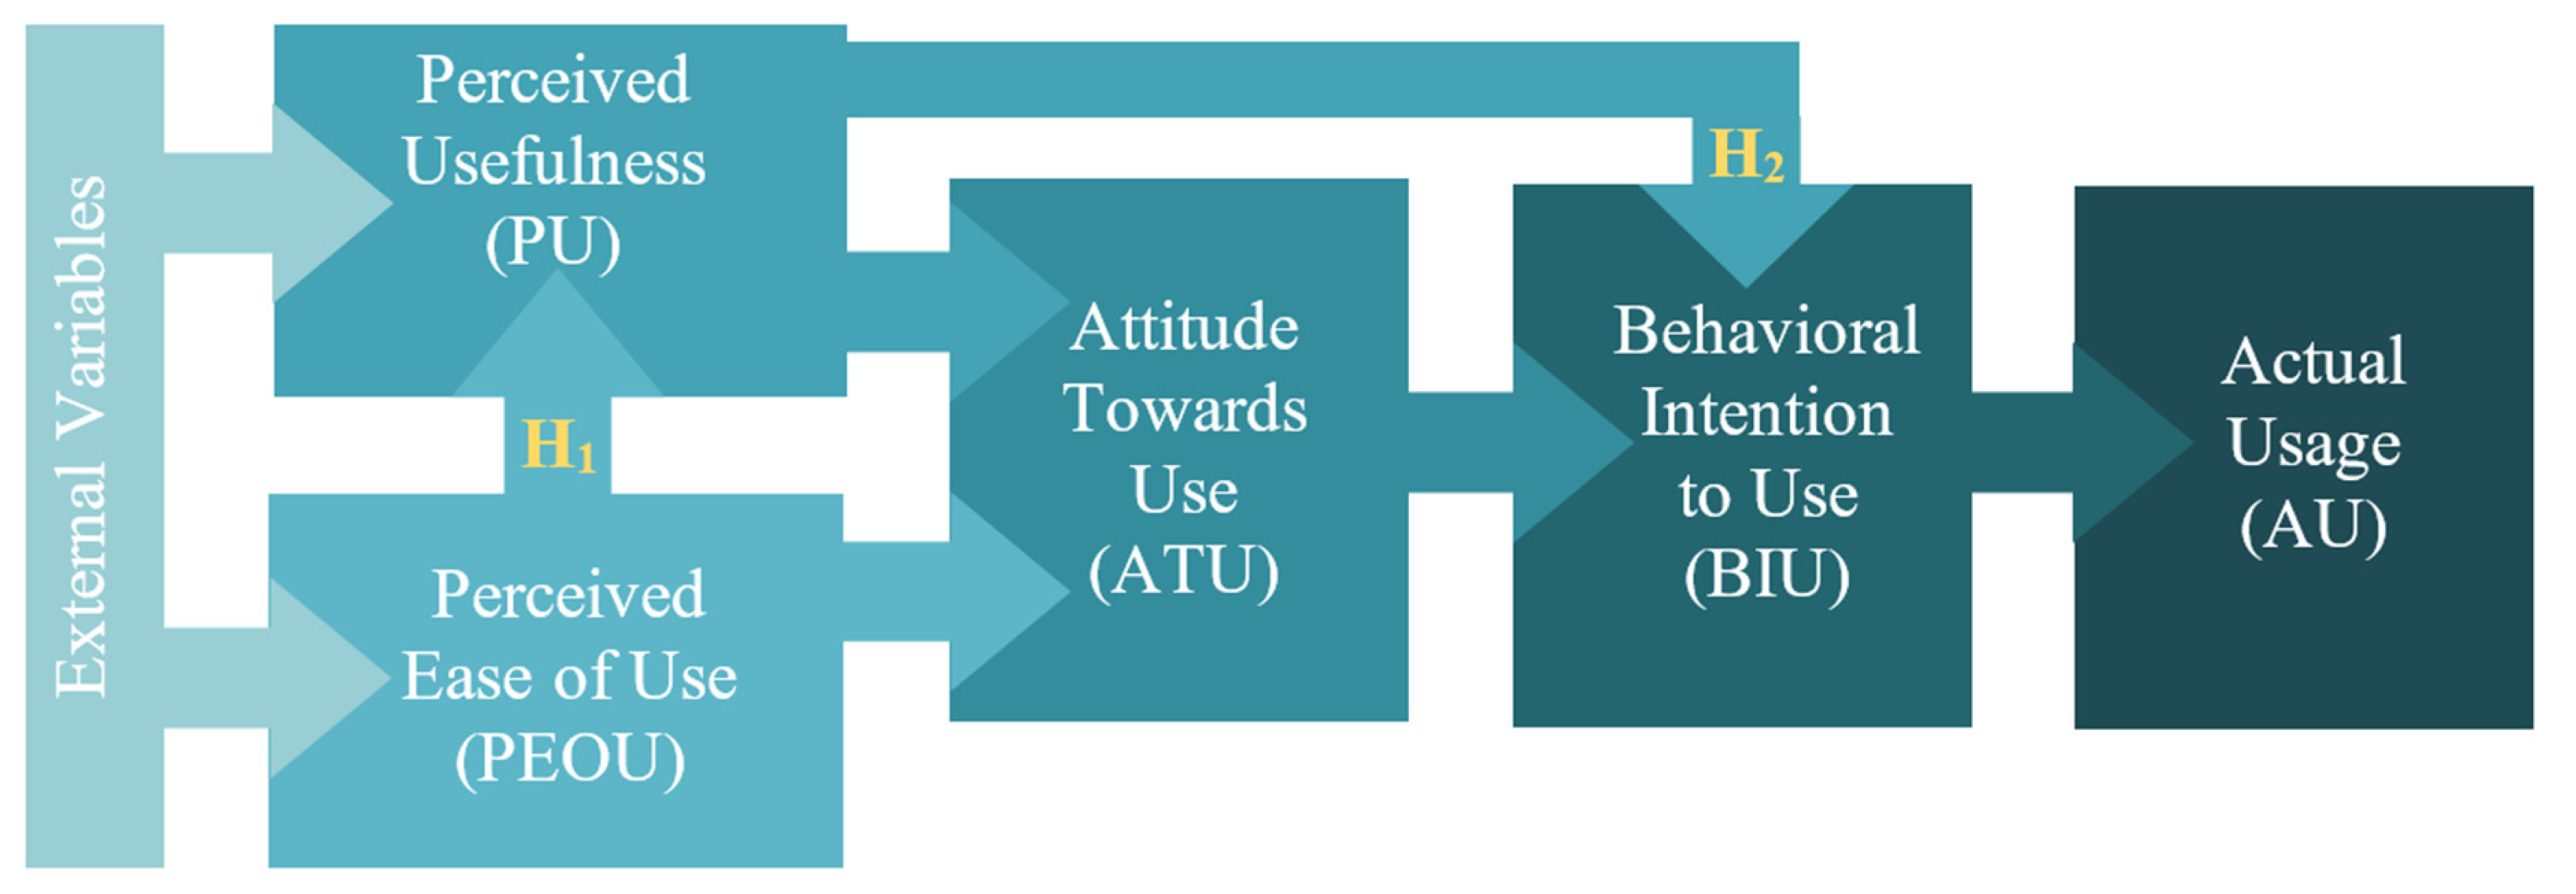
Figure 15.
The EFA’s Scree Plot.
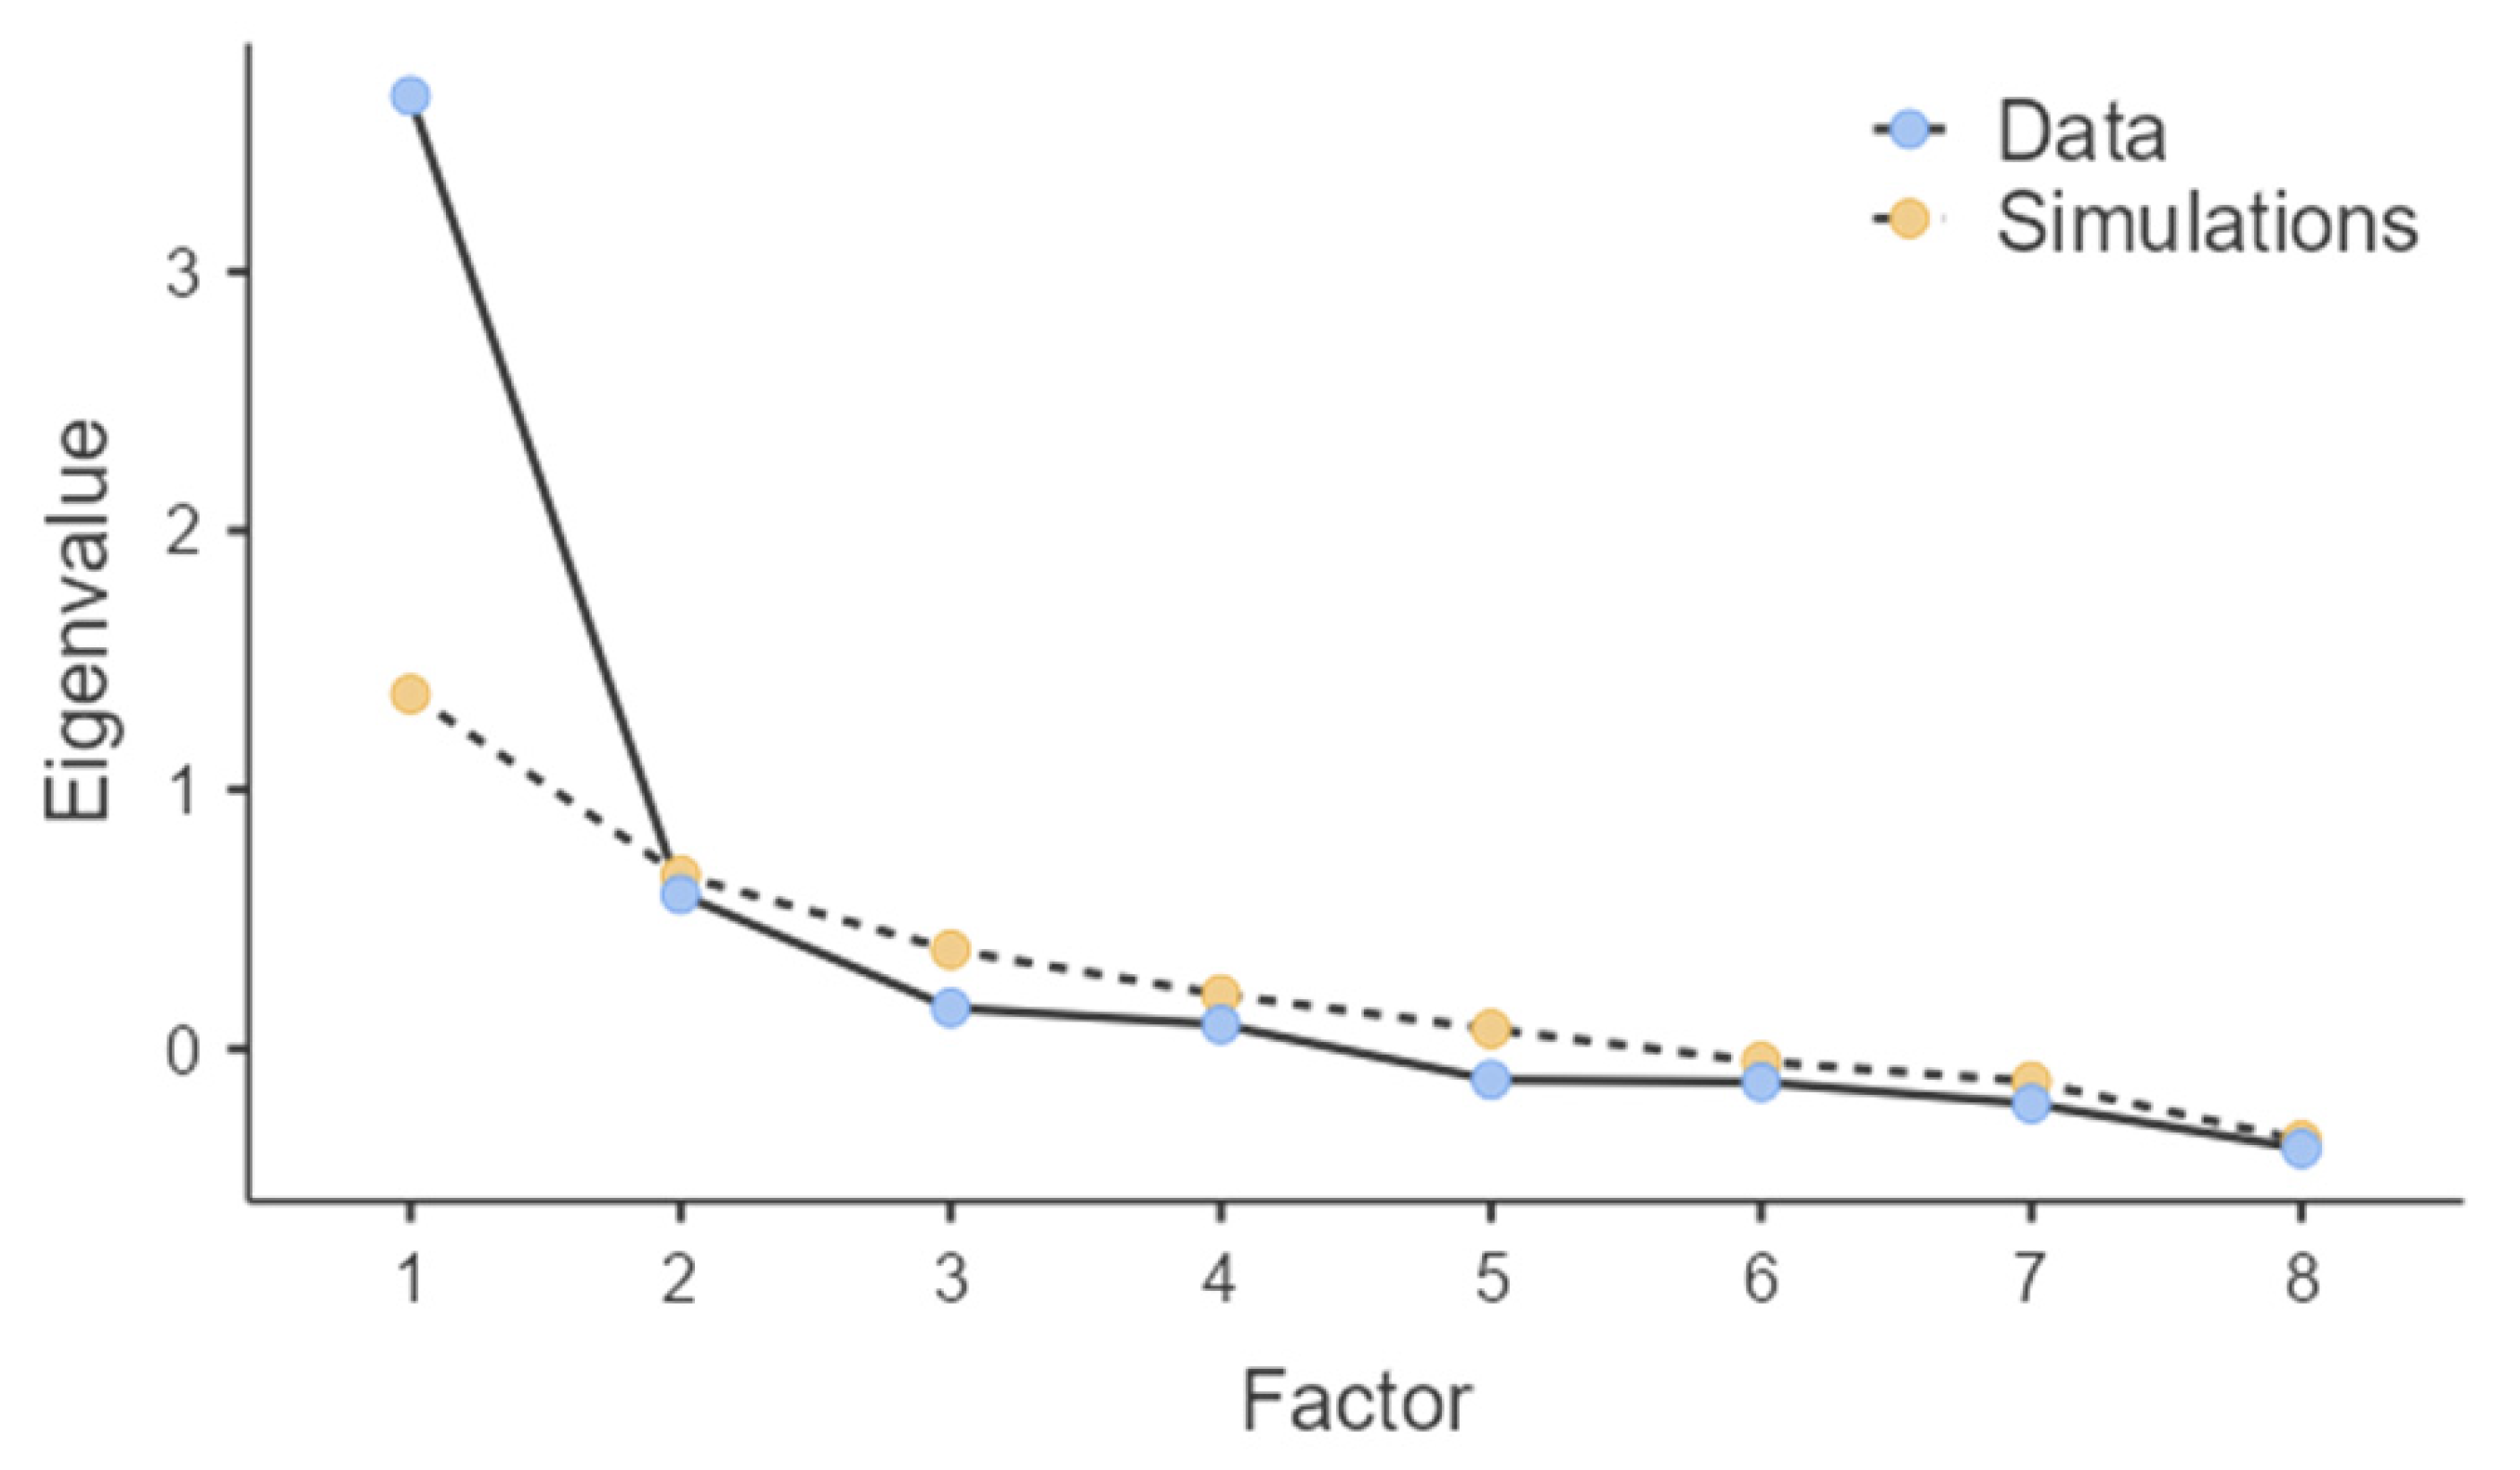
Figure 16.
Results of the TAM model for measuring the No-Code platform’s intention for use. Note: * p<0.05, ** p<0.01, *** p<0.001.
Figure 16.
Results of the TAM model for measuring the No-Code platform’s intention for use. Note: * p<0.05, ** p<0.01, *** p<0.001.
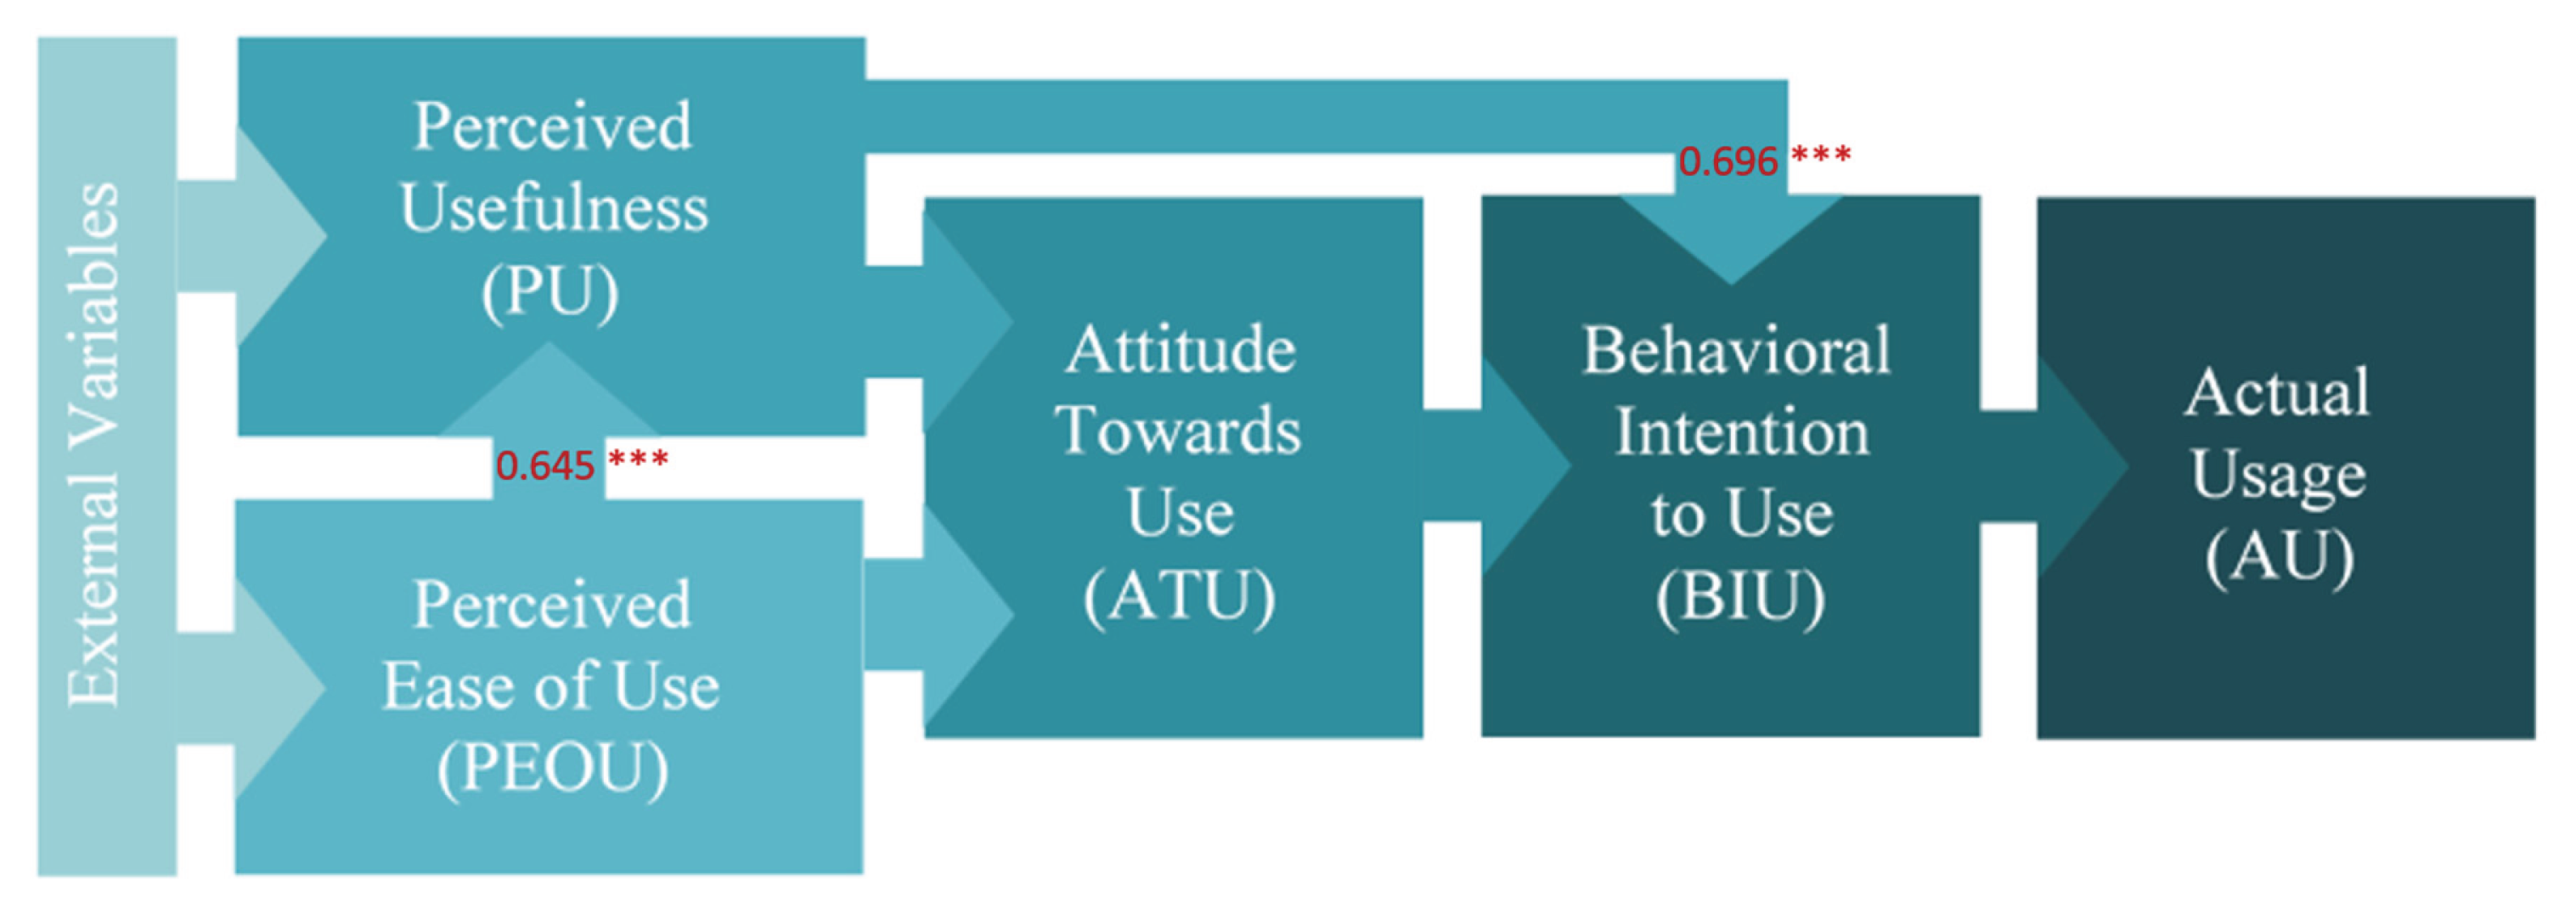

Table 1.
PEOU and PU items.
| PEOU and PU items: |
|---|
| PU items |
| A1. Using the no-code platform helped me to better understand the basic concepts of IoT and wireless sensor networks. |
| A2. The no-code platform helped me increase my efficiency in managing sensor data and sending it to the cloud. |
| A3. The use of the no-code platform enhanced my learning experience on practical IoT-related topics. |
| A4. By using the no-code platform, I can implement IoT-related exercises more quickly and efficiently. |
| PEOU items |
| A5. Learning to use the no-code platform was easy for me. |
| A6. I can easily use the no-code platform to design sensor networks and send data to the cloud. |
| A7. The user interface of the no-code platform is understandable and functional. |
| A8. I can easily acquire skills to use the no-code platform and apply my knowledge in the field of IoT. |
Table 2.
ATU and BIU items.
| ATU and BIU items: |
|---|
| ATU items |
| A9. Using the no-code platform is a positive experience in learning IoT technologies. |
| A10. I like the idea of using the no-code platform for my IoT training. |
| A11. Using the no-code platform is enjoyable and motivates me to learn more about the Internet of Things. |
| BIU items |
| A12. I plan to continue to use the no-code platform in the future for the development of IoT applications in Agriculture. |
| A13. I would recommend the no-code platform to other students who want to learn about wireless sensor networks and IoT. |
| A14. I plan to use the no-code platform in other educational or research activities related to IoT |
Table 3.
The 5-point Likert Scale used to measure the TAM’s items.
| 5-point Likert Scale |
|---|
| 1—Strongly disagree 2—Somewhat disagree 3—Neither agree nor disagree 4—Somewhat agree 5—Strongly agree |
Table 4.
Dependent and Independent Variables of the TAM’s research model.
| Variable Type | Variable Codes |
| Independent Variables | Perceived Ease of Use (PEOU) Perceived Usefulness (PU) |
| Dependent Variables | Attitude Towards Use (ATU) Behavioural Intention to Use (BIU) |
Table 5.
Reliability Analysis for PEOU.
| Scale Reliability Statistics | ||||
| Mean | SD | Cronbach’s α | McDonald’s ω | |
| scale | 4.17 | 0.654 | 0.785 | 0.794 |
| Item Reliability Statistics | ||||
| If item dropped | ||||
| Cronbach’s α | McDonald’s ω | |||
| PEOU1 | 0.694 | 0.701 | ||
| PEOU2 | 0.744 | 0.772 | ||
| PEOU3 | 0.727 | 0.728 | ||
| PEOU4 | 0.767 | 0.782 | ||
Table 6.
Reliability Analysis for PU.
| Scale Reliability Statistics | ||||
| Mean | SD | Cronbach’s α | McDonald’s ω | |
| scale | 4.31 | 0.671 | 0.825 | 0.827 |
| Item Reliability Statistics | ||||
| If item dropped | ||||
| Cronbach’s α | McDonald’s ω | |||
| PU1 | 0.805 | 0.805 | ||
| PU2 | 0.768 | 0.773 | ||
| PU3 | 0.756 | 0.760 | ||
| PU4 | 0.785 | 0.788 | ||
Table 7.
Descriptives for ATU, BIU.
| Attitude towards Use (ATU) | Behavioural Intention to Use (BIU) | |
| N | 39 | 39 |
| Missing | 0 | 0 |
| Mean | 4.33 | 4.00 |
| Standard deviation | 0.749 | 0.841 |
| Minimum | 2.00 | 1.33 |
| Maximum | 5.00 | 5.00 |
Table 8.
EFA’s Assumption Checks.
| Bartlett’s Test of Sphericity | ||
| χ2 | df | p |
| 133 | 28 | <.001 |
| KMO Measure of Sampling Adequacy | ||
| MSA | ||
| Overall | 0.826 | |
| PEOU1 | 0.840 | |
| PEOU2 | 0.867 | |
| PEOU3 | 0.730 | |
| PEOU4 | 0.866 | |
| PU1 | 0.696 | |
| PU2 | 0.862 | |
| PU3 | 0.830 | |
| PU4 | 0.885 | |
Table 9.
EFA’s Factor Loadings.
| Factor | |||
| 1 | 2 | Uniqueness | |
| PEOU1 | 0.776 | 0.406 | |
| PEOU2 | 0.617 | 0.605 | |
| PEOU3 | 0.868 | 0.328 | |
| PEOU4 | 0.493 | 0.342 | 0.518 |
| PU1 | 0.905 | 0.237 | |
| PU2 | 0.546 | 0.454 | 0.314 |
| PU3 | 0.355 | 0.517 | 0.472 |
| PU4 | 0.514 | 0.387 | 0.442 |
Note. ‘Minimum residual’ extraction method was used in combination with a ‘oblimin’ rotation.
Table 10.
EFA’s Factor Statistics.
| Factor | SS Loadings | % of Variance | Cumulative % |
| 1 | 2.88 | 36.0 | 36.0 |
| 2 | 1.80 | 22.5 | 58.5 |
Table 11.
Spearman’s Correlation Matrix PEOU—PU.
| Perceived Ease of Use (PEOU) | Perceived Usefulness (PU) | ||
| Perceived Ease of Use (PEOU) | Spearman’s rho | — | |
| df | — | ||
| p-value | — | ||
| N | — | ||
| Perceived Usefulness (PU) | Spearman’s rho | 0.609*** | — |
| df | 37 | — | |
| p-value | <.001 | — | |
| N | 39 | — |
Note. * p < .05, ** p < .01, *** p < .001.
Table 12.
H1—Linear Regression PU—PEOU.
| Model Fit Measures | ||||||
| Overall Model Test | ||||||
| Model | R | R2 | F | df1 | df2 | p |
| 1 | 0.645 | 0.416 | 26.4 | 1 | 37 | <.001 |
| Note. Models estimated using sample size of N=39 | ||||||
| Model Coefficients—Perceived Usefulness (PU) | ||||||
| Predictor | Estimate | SE | t | p | ||
| Intercept | 1.555 | 0.544 | 2.86 | 0.007 | ||
| Perceived Ease of Use (PEOU) | 0.661 | 0.129 | 5.13 | <.001 | ||
Table 13.
H2—Linear Regression BIU—PU.
| Model Fit Measures | |||||||||||
| Overall Model Test | |||||||||||
| Model | R | R2 | F | df1 | df2 | p | |||||
| 1 | 0.696 | 0.484 | 34.7 | 1 | 37 | <.001 | |||||
| Note. Models estimated using sample size of N=39 | |||||||||||
| Model Coefficients—Behavioural Intention to Use (BIU) | |||||||||||
| Predictor | Estimate | SE | t | p | |||||||
| Intercept | 0.234 | 0.646 | 0.363 | 0.719 | |||||||
| Perceived Usefulness (PU) | 0.873 | 0.148 | 5.894 | <.001 | |||||||
Table 14.
Descriptives PEOU—PU—ATU—BIU.
| Perceived Ease of Use (PEOU) | Perceived Usefulness (PU) | Attitude towards Use (ATU) | Behavioural Intention to Use (BIU) | |
| N | 39 | 39 | 39 | 39 |
| Missing | 0 | 0 | 0 | 0 |
| Mean | 4.17 | 4.31 | 4.33 | 4.00 |
| Standard deviation | 0.654 | 0.671 | 0.749 | 0.841 |
| Minimum | 2.75 | 1.50 | 2.00 | 1.33 |
| Maximum | 5.00 | 5.00 | 5.00 | 5.00 |
Disclaimer/Publisher’s Note: The statements, opinions and data contained in all publications are solely those of the individual author(s) and contributor(s) and not of MDPI and/or the editor(s). MDPI and/or the editor(s) disclaim responsibility for any injury to people or property resulting from any ideas, methods, instructions or products referred to in the content. |
© 2025 by the authors. Licensee MDPI, Basel, Switzerland. This article is an open access article distributed under the terms and conditions of the Creative Commons Attribution (CC BY) license (http://creativecommons.org/licenses/by/4.0/).
Copyright: This open access article is published under a Creative Commons CC BY 4.0 license, which permit the free download, distribution, and reuse, provided that the author and preprint are cited in any reuse.


