
Submitted:
02 July 2025
Posted:
03 July 2025
You are already at the latest version
Abstract
Morphine is an opioid extracted from poppy plant and highly effective for moderate to severe pain management. Development of techniques to measure the concentration of this highly addictive drug in various matrices is very important. This work was aimed at the development of a sensitive electrochemical method for detection of morphine in wastewater. Molecularly imprinted (MIP) electrodes were formed by elec-tro-polymerization process using pyrrole as a monomer. Electro-polymerization was performed on glassy carbon electrodes in the presence of morphine before the extraction of entrapped morphine molecules. Various techniques were employed to monitor the polymerization and response of the fabricated electrodes toward morphine. These techniques included Fourier transform infrared spectroscopy (FTIR), cyclic voltammetry (CV), square wave voltammetry (SWV), and electrochemical impedance spectroscopy (EIS). The morphine concentration was determined using SWV by measuring the change in the redox peak current of [Fe(CN)6]3−/4− in acetate buffer. These MIP electrode sensors were used to analyze morphine concentration between 0 to 80.0 nM solution. The SWV showed a wider linear response region than cyclic voltammetry. The detection limit using SWV was found to be 1.5 nM while using cyclic voltammetry, the detection limit was 2.75 nM. This MIP electrode sensor should specificity when other closely re-lated molecules are involved and hence has potential as cheap alternative technique for analysis of morphine.
Keywords:
morphine
; electro-polymerization
; square wave voltammetry
; cyclic voltammetry
; molecular imprinting
; polypyrrole
1. Introduction
Opioid dependence and overdose have contributed to the dramatic rise of fatalities in the world. Morphine, one of the opioids commonly used as analgesics for severe pain is used following surgery [1] and is highly effective for moderate to severe pain management. It is an alkaloid and a naturally occurring phenanthrene derivative directly extracted from poppy plant. Morphine overuse causes addiction and can also promotes breast tumor growth[2]. Heroin, a potent synthetic opiate analgesic, is obtained from morphine and is one of the most abused opioids. Morphine is the parent compound in the synthesis of other opioids including hydro-morphine and oxy-morphine drugs. There is renewed effort toward developing and improving methods to screen blood and urine samples from patients for opioids. Rapid analyses of opiates in biological specimens and in illicit samples is still a great challenge. Therefore, devices/tools that enable rapid measurements of these opioids are needed.
Morphine can be found in free form or conjugated to glucuronide forming active morphine-6-glucuronide. Another metabolite of morphine is inactive morphine-3-glucuronide[3]. Metabolism of morphine in-vivo proceeds through glucuronidation of 6-OH alcoholic group and 3-OH phenolic group. The molecular structure of morphine is shown on Figure 1. Several analytical methodologies have been described for the quantification of morphine on its own or in combination with other metabolites. Common methods for morphine quantification include HPLC [4], gas chromatography mass spectrometry [5], morphine-specific immunosorbents coupled to HPLC[6], high-performance liquid chromatography-tandem mass spectrometric (HPLC/MS-MS)[7], chemiluminescence[8], surface plasmon resonance [9] among other techniques. HPLC combined with electrochemical detection (HPLC–EC) is a sensitive and selective method achieving a sensitivity of less than 50 pg ⁄ mL[10]. Although the chromatographic based techniques are the traditional methods of opioid analyses, the long analysis time makes them quite expensive. Compared to these conventional chromatographic techniques for morphine determination, electrochemical based methods present significant advantages in terms of cost, simplicity and ease of operation. Searching for cheap, stable and sensitive alternatives for rapid opioid detection is very important. Morphine in serum or plasma is particularly difficult to measure due to the fact that the molecule itself is relatively hydrophobic[11]. Sensing platforms that use nanomaterials such as gold and silver for measuring morphine and other related opioids have been developed [12,13]. More importantly, biological-based chemical receptors such as immunoassays which utilize antibody-antigen affinity for detecting biological samples are another popular methods for morphine detection[14]. Molecular imprinting techniques in combination with electrochemical detection are powerful tools for morphine detection[15,16]. Morphine molecular imprints mimic binding activity of morphine to specific receptors. Morphine molecular imprints also known as the plastic antibodies are polymers capable of specific binding, akin to the “lock-and-key” mechanism. Therefore, these molecular imprints are cost-effective alternatives to biomolecule-based recognition techniques. Also, they are easy to prepare and have a high affinity for the targeted molecules and hence possess superior characteristics as compared to antibodies or enzymes. This is especially so if the measurements are to be carried out at extreme temperatures or other variable chemical conditions [17]. Nonspecific binding is usually a drawback for molecular printing technology. However, the extent of nonspecific binding is determined by the quality of MIP which is intern determined by the kind of polymer used in imprinting.
Molecular imprints are formed through polymerization in the presence of target molecules. The target molecule is mixed thoroughly with a monomer followed by copolymerization using either a chemical method or electro-polymerization [18,19]. The target molecule is then extracted from the polymer by dissolving it using a suitable solvent. The extraction of the target molecules/template results in the formation of three-dimensional cavities within a polymeric matrix. The three-dimensional cavities after extraction have size, shape, and functional group orientation of the target molecule. Therefore, the target molecules selectively occupy the cavity space. Pyrrole used here is a monomer easily electro-polymerized in acidic solution. Pyrrole is therefore suitable as a molecular mold to trap other hydrophobic target molecules. The advantage of using conducting polymers like the poly-pyrrole is the fact that it’s easy to control the deposition of the monomer providing a uniform growth[20] and hence easy to control target entrapment. Imprinted electrode based on pyrrole monomers have been developed for recognition and separation of chiral phenylalanine[21], methyl orange[22]. This is the first report of pyrrole monomers being used to make imprinted electrodes for morphine detection.
In the current work an electrochemical sensor method-based MIP poly pyrrole polymer for morphine detection is discussed. The analytical performance of this sensor in its application to the quantitative analysis of morphine in wastewater samples was accessed. Morphine is easily oxidized at 0.75 V against Ag/AgCl reference electrode using modified carbon electrodes as working electrode[23]. The oxidation current signal can interfere with the desired current signals in current work. The current interferences can be avoided using redox probes such as Fe(CN)6]3-/4-. The redox probe has much lower oxidation and reduction potentials compared to morphine and hence was used as a reporter molecule. Morphine competes with the redox probe for the imprinted recognition sites. A decrease in current is obtained when the sensor was immersed in morphine-containing solutions. The magnitude of the current decrease was a function of the concentration of morphine in the solution.
2. Materials and Methods
2.1. Chemicals
Morphine standards were purchased from VWR, while pyrrole was purchased from Sigma-Aldrich (St. Louis, USA). Potassium ferricyanide, potassium ferrocyanide, sodium acetate, acetic acid and sulfuric acid were also purchased from VWR. Wastewater samples were obtained from local municipality. All other aqueous solutions used here were prepared using deionized water.
2.2. Electrochemical Apparatus
Electrochemistry was conducted using an electrochemical workstation (CHI 660c, Austin TX, USA). This instrument was computer controlled and had its ohmic drop (IR) 98% compensated. Three techniques were carried out using this equipment namely, cyclic voltammetry (CV), square wave voltammetry (SWV) and electrochemical impedance spectrometry (EIS). The working electrode was glassy carbon while the reference electrode was Ag/AgCl. The auxiliary/counter electrode was a platinum electrode. The geometric area of working electrode was 16 mm2. The area was sufficient as a platform where imprinting using polymers was carried out. All the three electrodes were purchased from Bioanalytical Systems Inc. (West Lafayette, IN, USA).
2.3. Preparation of MIP Electrode Sensor
For proper adherence of the imprint on the glassy carbon electrodes, the electrodes were thoroughly polished using standard cleaning procedures. This cleaning procedures included ablating the electrode using a 1 µm diamond paste. The particles generated after using diamond past were removed by ultrasonication in ethanol for one minute. The electrode was also ultrasonicated in distilled water for another minute before drying in air. Polishing using alumina was carried out as a final polishing procedure. The alumina particles on the carbon electrodes were removed using water. Polymerization of the pyrrole monomer was carried out on the clean electrode by applying potential in MIP formation. In this method 2 µg/mL of morphine which was the template was mixed with 3.0 mM pyrrole which was used as the monomer. Cyclic voltammetry was used to polymerize the pyrrole. In this experiment the electrode potential was stepped from -0.4 V to 0.8 V (vs. Ag/AgCl-saturated KCl) potential window and with Pt wire used as a counter electrode. The cyclic voltammogram waves were obtained at varying scan rates from 30 to 100 mV/s. The thickness of the polymer obtained on the glassy carbon depended on several parameters. The main factors influencing the polymerization step include the number of cycles, pyrrole monomer concentration, aggregate voltage range and template morphine concentration.
After electro-polymerization, the electrode with morphine crosslinked in polymer matrix was rinsed with deionized water to remove any morphine not in the matrix and loosely hanging on the electrode. The electrode was then placed in a vial containing pure methanol solution for 30 min to extract the morphine trapped in the poly-pyrrole polymer network. Morphine dissolves easily in methanol solution. Removal of the template creates cavities with complementary size, shape of morphine. This electrode was referred to as MIP electrode. To make a comparison, another electrode was made following the same procedures only omitting morphine during the polymerization step. The electrode made was the non-imprinted polymer (NIP) electrode. The pictorial representation of MIP sensor electrode fabrication is shown in Figure 2 below.
3. Results
3.1. Electrochemical Characterization of the Imprinted Sensor Electrodes
Initially, the optimum number of cyclic voltammogram polymerization cycles was established as the thickness of the film depended on these cycles. [Fe(CN)6]-3/-4 in 0.5 M acetate buffer solution at pH 5 was used to probe the electro-chemical behavior of the crosslinked polymer. The concentration of [Fe(CN)6]-3/-4 was 0.5 mM. The electro polymerization of pyrrole monomer on glassy carbon is shown in Figure 3a. Cyclic voltammograms shows layered growth of the poly-pyrrole polymer during electro-polymerization step. Figure 3b shows typical point currents obtained from cyclic voltammograms between 0.2 to 0.4 V versus Ag/AgCl electrode. These point currents were plotted as a function of the member of scans. Poly-pyrrole is a conductive polymer and hence the peak current continuously increased with the number of scans until the thickness of the polymer started to affect [Fe(CN)6]-3/-4 solution electron transfer process in which case the current started to plateau. Electro polymerization of pyrrole was carried out at potential window of -0.4 to 0.8 V.
The thickness of poly-pyrrole layer was estimated using Faraday’s law following equation below.
I was the layer thickness while q was the charge in coulombs resulting from pyrrole electrooxidation and hence pyrrole electro polymerization. This charge was obtained by cyclic voltammogram integration to obtain the area under the curve and again dividing the area with the scan rate (0.1V/S). M is the molar mass of pyrrole (67.09g/mol), A is the electrode geometric area (0.07 cm2), Ƿ is the density of pyrrole (1.5 g/cm3), and F is the Faraday constant (96485 coulombs/mol). Using 0.1V/S scan rate the film thickness for the first cyclic voltammogram was estimated to be about 4 nm. Each subsequent voltammograms added another layer of a of polymer albeit smaller thickness as observed from the reduced charge.
From the voltammograms obtained, it was clear two regions emerged, between -0.4 to 0.8 V when the oxidation current increased and between 0.8 to 1.0 V when the current oxidation decreased. It can also be observed that changes in current were negligible after 20 cycles. The pyrrole monomer was maintained at 3.0 mM concentration during polymerization. It was important to have a proper thickness of the polymer to support a three-dimensional molecular imprint. To ensure this happens, we needed to manipulate both the concentration of the monomer as well as the number of voltametric scans. A very thin film would not effectively support a three-dimensional imprint while a very thick film would present difficulties in both the template extraction as well during the rebinding step. Therefore, we also needed to strike a balance between the two. Using 3.0 mM of the pyrrole monomer, 5 to 15 cycles were deemed as optimal conditions for electrochemical polymerization.
3.2. FTIR Spectroscopy
The extraction of morphine from the poly-pyrrole polymer was followed using FTIR. Morphine has well known stretching and vibrational spectroscopy signatures. It has a large O-H stretching band that is observed at 3300-3500 cm-1. Also, there are prominent C-H stretching vibrational bands at 2800-3000 cm-1 observed in pristine morphine. Other stretching vibrational modes include the C-O stretching observes at 1700 cm-1. FTIR spectroscopy for morphine was obtained while trapped in poly-pyrrole (Figure 4). The O-H stretch of morphine was quite broad while trapped in poly-pyrrole as the peak occurred at 3000 to 3500 cm-1. The vibrational bands because of poly-pyrrole are found way below 2000 cm-1 and therefore quite easy to distinguish between those bands. Extraction of morphine from the poly-pyrrole, the O-H stretching vibrational band disappeared from the spectra. This meant the extraction of morphine was successful.
3.3. Electrochemical Impedance Spectroscopy (EIS)
The thickness of the polymer was also monitored using electrochemical impedance spectroscopy (EIS). Changes in film thickness results in changes in the electron transfer resistance of the electrode and also in ESI of the surfaces [24,25]. The electron transfer resistance (Ret), which depends on the dielectric and insulating features of the electrode/electrolyte interface. The EIS technique was also carried out in a 0.5 mM [Fe(CN)6]-3/[Fe(CN)6]4- dissolved pH 5.0 acetate buffer. The Nyquist plot (Z′ versus Z″) obtained at frequency scan ranging from 100,000 to 1 Hz are shown in Figure 5. Clearly, increasing layers on the polymer film resulted in a disruption of the semicircle. The diameter of the semicircle in the Nyquist diagram does not necessarily change significantly, This particular region primarily reflects the interfacial electron transfer resistance (Rct). The Rct controls the electron transfer kinetics of [Fe(CN)6]-3/-4 at the electrode surface. We see a drastic change in the mass transfer control with increasing number of cycles. It appears the mass transfer limitations are more pronounced at lower frequencies than at higher frequencies. It is also reasonable to assume that charge transfer kinetics are slower on the thicker electrode compared to that with a smaller number of polymer scans on the glassy carbon electrode.
3.4. Analysis of Morphine and Calibration methods on MIP
Calibration plots were made using optimized MIP electrode sensors. The thickness of the MIP films was estimated using the cyclic voltammogram curves. Different thickness of the films were used to evaluate several morphine concentrations. Different concentration (nanomolar range) of morphine was made in methanol solution.
The MIP electrodes were incubated in morphine solution for a specific amount of time and then removed from morphine solution, rinsed with water then analyzed in a 0.5 mM [Fe(CN)6]-3/-4 probe solution. The current obtained using the MIP electrodes in [Fe(CN)6]-3/-4 probe solution was noted. Again, the same electrode was rinsed and placed in another morphine solution with a different concentration and again the process with the probe repeated. Figure S1a shows two MIP electrodes, on made using 5 cyclic voltammograms scans and another made using 20 cyclic voltammogram scans. It is clear, 5 scans were not enough to generate enough film thickness to bring out proper morphine response. The sensitivity of the MIP electrodes for the 5 cyclic voltammogram was much lower than that obtained using 20 voltammograms (Figure S1a). The MIP electrode had a limited linear range as compared to the twenty 20 voltammogram scans which had an extended linear range.
We therefore used the 20 cycle voltammogram to make final calibration plots for monitoring the response of the morphine on in wastewater. We also made NIP and repeated the same experiments. Another parameter that was optimized was the rebinding time. To optimize the rebinding time, a typical freshly made MIP electrode using the procedure above was immersed in a morphine solution to allow rebinding. The time of rebinding was varied each time noting the peak current from the probe solution. Figure S2a shows a plot of peak current of MIP electrode as a function of the rebinding time. The current started to plateau after 15 minutes. However, the highest rate of rebinding is at 5 minutes. Based on this result and also from our prior experiment[26] we used a 5 min incubation and used a in 0 to 80 nM morphine concentrations. The rebinding was caried our at ambient temperature. Every time the MIP electrode was removed from the morphine solution, it was thoroughly rinsed first with water and then with methanol to remove morphine not properly bound to the three-dimensional pocket on electrode surface. Cyclic voltammograms, as well as square wave voltammograms (SWV), of the electrode were obtained. To capture the highest sensitivity, both cyclic voltammetry and square wave voltametric techniques were used. As noted earlier, both MIP and NIP electrodes were placed in solutions containing different concentrations of morphine and analyzed in 0.5 mM [Fe(CN)6]-3/-4. Figure 6a shows SWV of imprinted electrodes in various concentrations of morphine. Before the MIP electrode is placed in a solution containing morphine, a large peak current is obtained. However, the peak current of the same probe solution gradually reduces as the concentration of morphine is increased. This implied that the morphine was responsible for the decrease of current through occupying the three-dimensional imprints hence the blocking efficient electron transfer of the probe solution.
Both the SWV and CV experiments showed the same tread with highest current with a zero-morphine concentration while highest morphine concentration resulted in lowest current for the probe. Figure 6a shows CV plots taken in different morphine concentration. Figure 6b is a plot of peak current from cyclic voltammetry plotted against the concentration of morphine. The calibration plot yielded the equation Y(Amps) = 25.44-0.248X × 10−6 [morphine] with R2 = 0.99. Figure 6c shows SWV of MIP electrodes in increasing concentration of morphine. Difference SWV plots are shown. Figure 6d is the plot of current obtained using SWV and plotted as a function of morphine concentration. The calibration plot obtained has a more expanded linear region as compared to CV plot. The calibration plot is linear from zero to 80 nM with the equation (Y(amps) = -1.27 – 0.045 × 10⁻⁵ [morphine], with R2 = 0.97. The limit of detection (LOD=3σ/m) for morphine with cyclic voltammetry detection was 2.75 nM while that obtained with SWV was 1.5 nM.
We used acetaminophen a common pain killer drug and also sold over the counter as control to test the effectiveness of the MIP sensors. Figure S 3 shows voltammograms of MIP electrodes incubated in acetaminophen. Both CV and SWV show that increasing concentration of this drug does not result to corresponding changes of the peak currents. The small changes observed do not follow a particular trend. Figure 7a shows a comparison of acetaminophen and morphine analyses using morphine MIP electrodes. The plots are made using currents obtained using same concentrations of morphine and acetaminophen. Presence of acetaminophen showed statistically insignificant changes in current over the whole range of the concentration (0 to 80 nM). This indicated imprinted polymer was specific towards morphine.
The most common interferants during the analysis of morphine in wastewater or in the blood include oxycodone or other metabolites such as Nor oxycodone and oxymorphone. Previously, analysis of oxycodone in the presence of morphine was found to not significantly affect the outcome of the results [26]. Other type of drugs likely interferes with the detection of morphine detection. One such drug is acetaminophen; an over-the-counter drug mainly used as a pain killer and a common fever reducer. The selectivity of the MIP sensor for morphine was determined by evaluating its response to acetaminophen. The structure morphine and acetaminophen are slightly different with acetaminophen being a slightly smaller molecule than morphine and hence can easily move in and out of the prints. As shown in Figure 7a, the current changes obtained with morphine are much higher compared to those from acetaminophen, indicating that the sensor is selective towards morphine.
Having established the specificity of this sensor toward morphine, we wanted to use the new MIP sensor electrodes to test a real field sample. To do this, we collected wastewater from a nearby city, filtered it and kept refrigerated until needed. The wastewater sample was split into two and to one of the samples, the wastewater was spiked with morphine and the other with distilled water. The volume of the two samples was essentially the same. MIP electrodes were analyzed in the two solutions by immersing the electrodes in these solutions for 10 minutes, rinsing with water and then analyzing in 0.5 mM [Fe(CN)6]-3/-4 probe solution as usual. Figure 7b shows the SWV of the imprinted electrodes comparing the two waste-water samples. Spiking wastewater with morphine results decreased current due to more blocking effect than the un-spiked one.
4. Discussion
The oxidation of morphine on electrode surface is mainly dependent on the pH of the buffer used as well as the type of materials used on the electrode. Oxidation of phenolic groups present in morphine is responsible for its electroactivity at pH 1. The oxidation potential using Ag/AgCl as a reference electrode and glassy carbon as working electrode, a potential of 0.7V was observed with buffer of pH 1 while the oxidation potential is at 0.5V at pH 5 [35]. In the current MIP sensor electrode, direct oxidation of morphine can interfere with the measurement of morphine. We used glassy carbon electrode as a platform where the imprints were made. Direct oxidation of morphine using bare glassy carbon electrode shows a peak current being quite distinguishable from the background at 25 nM morphine concentration[36]. This means the peak for morphine oxidation in the nano molar range would be negligible using glassy carbon electrode. In our work, we have used potassium ferrocyanide as a reporter probe with an oxidation potential of less than 0.4 V on glassy carbon. Therefore, we have avoided the potential of direct oxidation of morphine even at higher nano molar range. The polymer used in this work is conductive, but a very thick polymer can either enhance or inhibit the detection of morphine. Therefore, optimizing sensitivity by controlling the thickness of the polymer was a critical step. A three-dimensional polymer to support imprint formation at the same time allowing morphine molecules to easily rebind was desired. A higher concentration of morphine had the same effect as increasing the number of cyclic voltammogram scans. We used both large number of scans (20 scans) and 5 scans which was on the lower side and with 3.0 mM of pyrrole. The MIP electrodes and the NIP electrodes were compared and the results indicated that morphine was clearly specifically included in the prints. As shown in Figure S4, the NIP electrodes showed a complete block of electron transfer. The blocking of electron transfer using MIP electrodes showed a time dependent reaction when the electrode was placed in morphine solution at different times. From the plot of peak current as a function of time, it was clear the current started to plateau after 15 minutes and was almost completely blocked at 30 minutes when the current change was minimal. We have no reason to believe that morphine molecules are detached from the imprints in an equilibrium manner. The steepest slope of the Morphine binding cure was at 5 minutes. We also note that these MIP electrodes were more sensitive while analyzing lower morphine concentration indicating that rebinding was more efficient. This was probably due to higher availability of binding sites hence faster rebinding. We also note that it has a much lower detection limit (2.75 nm for CV and 1.5 nm for SWV) which is much lower than other electrode-based sensors for morphine. Moreover, this is the first time pyrrole monomer has ever been used to construct an imprint for morphine. This sensor can be useful in analysis of morphine in wastewater. There was no morphine found in wastewater samples analyzed probably due to low concentration because of dilution from point sources. Sensors based on chromatographic methods can detect nano molar range and below and are in general preferred in the kind of samples used here. However, these are more complicated and are not cost effective. Obviously, the performance of this MIP sensor for morphine shows very strong binding affinity toward morphine. Both SWV and CV techniques show this strong correlation between the peak currents, and the concentration of morphine hence has potential in quick analysis of samples. The ease of fabrication combined with its specificity toward morphine places it at the top compared to others found in the literature. The proposed strategy has universal significance in creation of opioid-molecule-imprinted polymers for binding specific opioids.
5. Conclusions
In this contribution, we have prepared MIP electrodes sensors and used them for analysis of morphine one of common abused drug. This MIP sensor electrode was prepared using pyrrole monomer mixed with morphine molecules. The mixture was then electrolyzed by applying a cyclic voltametric and controlling the number of cyclic scans to make a polymer thickness of 4 nm. After optimization of the thickness and extraction of morphine, the three dimensional of receptor-type binding pocked imprints with shape and size complimentary to morphine were made. The efficiency of the detection of morphine was based on the rebinding performance. Our results show detection of morphine with appreciable figures of merit. The linear range was 0 to 20 nM with a limit of detection of 2.75 nM and 0 to 80 nM with LOD of 1.5 nM for CV and SW respectively. We find these results significant in that a cheap MIP electrode sensor can rapidly respond linearly to morphine in water samples. The response of the MIP electrode was not significantly affected by the presence of interfering molecules. Therefore, this technique can be applied to make other MIP electrodes for other abused drugs.
Supplementary Materials
The following supporting information can be downloaded at website of this paper posted online on Preprints.org, Figure S1: Calibration using SWV using 5 and 20 scans; Figure S2: Time-dependence plot of morphine rebinding on an imprinted electrode monitored as a function of time; Figure S3: 0.5 mM [Fe(CN)6]-3/-4 probe solution using NIP electrodes incubated in different morphine solutions using (a) Cyclic voltammograms (b)SWV. Figure S4: SWV obtained in 0.5 mM [Fe(CN)6]-3/-4 probe solution using MIP and NIP electrodes
Author Contributions
Conceptualization, methodology, validation and original draft preparation was performed by A.M. Formal analysis, investigation and data curation was performed by P.C. Review and editing, visualization, supervision and project administration were performed by A.M. All authors have read and agreed to the published version of the manuscript.
Funding
This research received no external funding.
Institutional Review Board Statement
Not applicable.
Informed Consent Statement
Not applicable.
Data Availability Statement
Data are available upon request from the corresponding author.
Acknowledgments
The authors would like to acknowledge Rowan for the facilities that enabled this work.
Conflicts of Interest
The authors declare no conflicts of interest.
References
- Hamilton, G.R.; Baskett, T.F. In the arms of morpheus: the development of morphine for postoperative pain relief. Can. J. Anaesth. 2000, 47, 367–374. [Google Scholar] [CrossRef]
- Gupta, K.; Kshirsagar, S.; Chang, L.; Schwartz, R.; Law, P.-Y.; Yee, D.; Hebbel, R.P. Morphine stimulates angiogenesis by activating proangiogenic and survival-promoting signaling and promotes breast tumor growth. . 2002, 62, 4491–8. [Google Scholar]
- Osborne, R.; Joel, S.; Trew, D.; Slevin, M. ANALGESIC ACTIVITY OF MORPHINE-6-GLUCURONIDE. Lancet 1988, 331, 828–828. [Google Scholar] [CrossRef]
- Oliveira, A.; Carvalho, F.; Pinho, P.G.; Remião, F.; Medeiros, R.; Dinis-Oliveira, R.J. Quantification of morphine and its major metabolites M3G and M6G in antemortem and postmortem samples. Biomed. Chromatogr. 2014, 28, 1263–1270. [Google Scholar] [CrossRef]
- Thevis, M.; Opfermann, G.; Schänzer, W. Urinary concentrations of morphine and codeine after consumption of poppy seeds. J. Anal. Toxicol. 2003, 27, 53–56. [Google Scholar] [CrossRef]
- Rashid, B.; Aherne, G.; Katmeh, M.; Kwasowski, P.; Stevenson, D. Determination of morphine in urine by solid-phase immunoextraction and high-performance liquid chromatography with electrochemical detection. J. Chromatogr. A 1998, 797, 245–250. [Google Scholar] [CrossRef]
- Sartori, D.; Lewis, T.; Breaud, A.; Clarke, W. The development of a high-performance liquid chromatography–tandem mass spectrometric method for simultaneous quantification of morphine, morphine-3-β-glucuronide, morphine-6-β-glucuronide, hydromorphone, and normorphine in serum. Clinical Biochemistry 2015, 48, 1283–1290. [Google Scholar] [CrossRef]
- Lewis, S.W.; Francis, P.S.; Lim, K.F.; Jenkins, G.E.; Wang, X.D. Pulsed flow chemistry: a new approach to solution handling for flow analysis coupled with chemiluminescence detection. Anal. 2000, 125, 1869–1874. [Google Scholar] [CrossRef]
- Sakai, G.; Ogata, K.; Uda, T.; Miura, N.; Yamazoe, N. A surface plasmon resonance-based immunosensor for highly sensitive detection of morphine. Sensors Actuators B: Chem. 1998, 49, 5–12. [Google Scholar] [CrossRef]
- Atta, N.F.; Hassan, H.K.; Galal, A. Rapid and simple electrochemical detection of morphine on graphene–palladium-hybrid-modified glassy carbon electrode. Anal. Bioanal. Chem. 2014, 406, 6933–6942. [Google Scholar] [CrossRef]
- Carrupt, P.A.; Testa, B.; Bechalany, A.; El Tayar, N.; Descas, P.; Perrissoud, D. Morphine 6-glucuronide and morphine 3-glucuronide as molecular chameleons with unexpected lipophilicity. J. Med. Chem. 1991, 34, 1272–1275. [Google Scholar] [CrossRef]
- Zhao, L.; Blackburn, J.; Brosseau, C.L. Quantitative Detection of Uric Acid by Electrochemical-Surface Enhanced Raman Spectroscopy Using a Multilayered Au/Ag Substrate. Anal. Chem. 2014, 87, 441–447. [Google Scholar] [CrossRef]
- Chen, W.; Yang, L.; Yan, C.; Yao, B.; Lu, J.; Xu, J.; Liu, G. Surface-Confined Building of Au@Pt-Centered and Multi-G-Quadruplex/Hemin Wire-Surrounded Electroactive Super-nanostructures for Ultrasensitive Monitoring of Morphine. ACS Sensors 2020, 5, 2644–2651. [Google Scholar] [CrossRef]
- Zhang, C.; Han, Y.; Lin, L.; Deng, N.; Chen, B.; Liu, Y. Development of Quantum Dots-Labeled Antibody Fluorescence Immunoassays for the Detection of Morphine. J. Agric. Food Chem. 2017, 65, 1290–1295. [Google Scholar] [CrossRef]
- Weng, C.-H.; Yeh, W.-M.; Ho, K.-C.; Lee, G.-B. A microfluidic system utilizing molecularly imprinted polymer films for amperometric detection of morphine. Sensors Actuators B: Chem. 2006, 121, 576–582. [Google Scholar] [CrossRef]
- Rezaei, B.; Foroughi-Dehnavi, S.; Ensafi, A.A. Fabrication of electrochemical sensor based on molecularly imprinted polymer and nanoparticles for determination trace amounts of morphine. Ionics 2015, 21, 2969–2980. [Google Scholar] [CrossRef]
- Lanza, F.; Sellergren, B. The application of molecular imprinting technology to solid phase extraction. Chromatographia 2001, 53, 599–611. [Google Scholar] [CrossRef]
- Pardieu, E.; Cheap, H.; Vedrine, C.; Lazerges, M.; Lattach, Y.; Garnier, F.; Remita, S.; Pernelle, C. Molecularly imprinted conducting polymer based electrochemical sensor for detection of atrazine. Anal. Chim. Acta 2009, 649, 236–245. [Google Scholar] [CrossRef]
- Yola, M.L.; Atar, N. Electrochemical Detection of Atrazine by Platinum Nanoparticles/Carbon Nitride Nanotubes with Molecularly Imprinted Polymer. Ind. Eng. Chem. Res. 2017, 56, 7631–7639. [Google Scholar] [CrossRef]
- Anantha-Iyengar, G.; Shanmugasundaram, K.; Nallal, M.; Lee, K.-P.; Whitcombe, M.J.; Lakshmi, D.; Sai-Anand, G. Functionalized conjugated polymers for sensing and molecular imprinting applications. Prog. Polym. Sci. 2019, 88, 1–129. [Google Scholar] [CrossRef]
- Huang, J.; Wei, Z.; Chen, J. Molecular imprinted polypyrrole nanowires for chiral amino acid recognition. Sensors Actuators B: Chem. 2008, 134, 573–578. [Google Scholar] [CrossRef]
- Deng, F.; Li, Y.; Luo, X.; Yang, L.; Tu, X. Preparation of conductive polypyrrole/TiO2 nanocomposite via surface molecular imprinting technique and its photocatalytic activity under simulated solar light irradiation. Colloids Surfaces A: Physicochem. Eng. Asp. 2012, 395, 183–189. [Google Scholar] [CrossRef]
- Aliabadi, A.; Rounaghi, G.H. A novel electrochemical sensor for determination of morphine in a sub-microliter of human urine sample. J. Electroanal. Chem. 2019, 832, 204–208. [Google Scholar] [CrossRef]
- Erdem, A.; Muti, M.; Karadeniz, H.; Congur, G.; Canavar, E. Electrochemical monitoring of indicator-free DNA hybridization by carbon nanotubes–chitosan modified disposable graphite sensors. Colloids Surfaces B: Biointerfaces 2012, 95, 222–228. [Google Scholar] [CrossRef]
- Pires, C.K.; Reis, B.F.; Galhardo, C.X.; Martelli, P.B. A Multicommuted Flow Procedure for the Determination of Cholesterol in Animal Blood Serum by Chemiluminescence. Anal. Lett. 2003, 36, 3011–3024. [Google Scholar] [CrossRef]
- Charkravarthula, P.; Mugweru, A. Molecularly Imprinted Electrochemical Sensor Based on Poly (O-Phenylenediamine) for Sensitive Detection of Oxycodone in Water. Electrochem 2023, 4, 435–446. [Google Scholar] [CrossRef]
- Afkhami, A.; Gomar, F.; Madrakian, T. CoFe2O4 nanoparticles modified carbon paste electrode for simultaneous detection of oxycodone and codeine in human plasma and urine. Sensors Actuators B: Chem. 2016, 233, 263–271. [Google Scholar] [CrossRef]
- Wang, C.; Luo, J.; Dou, H.; Raise, A.; Ali, M.S.; Fan, W.; Li, Q. Optimization and analytical behavior of a morphine electrochemical sensor in environmental and biological samples based on graphite rod electrode using graphene/Co3O4 nanocomposite. Chemosphere 2023, 326, 138451. [Google Scholar] [CrossRef]
- Verrinder, E.; Wester, N.; Leppänen, E.; Lilius, T.; Kalso, E.; Mikladal, B.; Varjos, I.; Koskinen, J.; Laurila, T. Electrochemical Detection of Morphine in Untreated Human Capillary Whole Blood. ACS Omega 2021, 6, 11563–11569. [Google Scholar] [CrossRef]
- Atta, N.F.; Galal, A.; Wassel, A.A.; Ibrahim, A.H. Sensitive Electrochemical Determination of Morphine Using Gold Nanoparticles–Ferrocene Modified Carbon Paste Electrode. Int. J. Electrochem. Sci. 2012, 7, 10501–10518. [Google Scholar] [CrossRef]
- Krumbiegel, F.; Hastedt, M.; Westendorf, L.; Niebel, A.; Methling, M.; Parr, M.K.; Tsokos, M. The use of nails as an alternative matrix for the long-term detection of previous drug intake: validation of sensitive UHPLC-MS/MS methods for the quantification of 76 substances and comparison of analytical results for drugs in nail and hair samples. Forensic Sci. Med. Pathol. 2016, 12, 416–434. [Google Scholar] [CrossRef]
- Ghorani-Azam, A.; Balali-Mood, M.; Khatami, S.-M.; Asoodeh, A.; Es’hAghi, Z.; Riahi-Zanjani, B. Plant Extract and Herbal Products as Potential Source of Sorbent for Analytical Purpose: An Experimental Study of Morphine and Codeine Determination Using HPLC and LC–MSMS. J. Chromatogr. Sci. 2021, 59, 482–489. [Google Scholar] [CrossRef]
- Beck, O.; BÖTtcher, M. Paradoxical Results in Urine Drug Testing for 6-Acetylmorphine and Total Opiates: Implications for Best Analytical Strategy. J. Anal. Toxicol. 2006, 30, 73–79. [Google Scholar] [CrossRef]
- Lin, Y.-H.; Lee, M.-R.; Lee, R.-J.; Ko, W.-K.; Wu, S.-M. Hair analysis for methamphetamine, ketamine, morphine and codeine by cation-selective exhaustive injection and sweeping micellar electrokinetic chromatography. J. Chromatogr. A 2007, 1145, 234–240. [Google Scholar] [CrossRef]
- Garrido, J.M.P.J.; Delerue-Matos, C.; Borges, F.; Macedo, T.R.A.; Oliveira-Brett, A.M. Voltammetric Oxidation of Drugs of Abuse I. Morphine and Metabolites. Electroanalysis 2004, 16, 1419–1426. [Google Scholar] [CrossRef]
- Li, F.; Song, J.; Gao, D.; Zhang, Q.; Han, D.; Niu, L. Simple and rapid voltammetric determination of morphine at electrochemically pretreated glassy carbon electrodes. Talanta 2009, 79, 845–850. [Google Scholar] [CrossRef]
Figure 1.
Molecular structure of morphine.
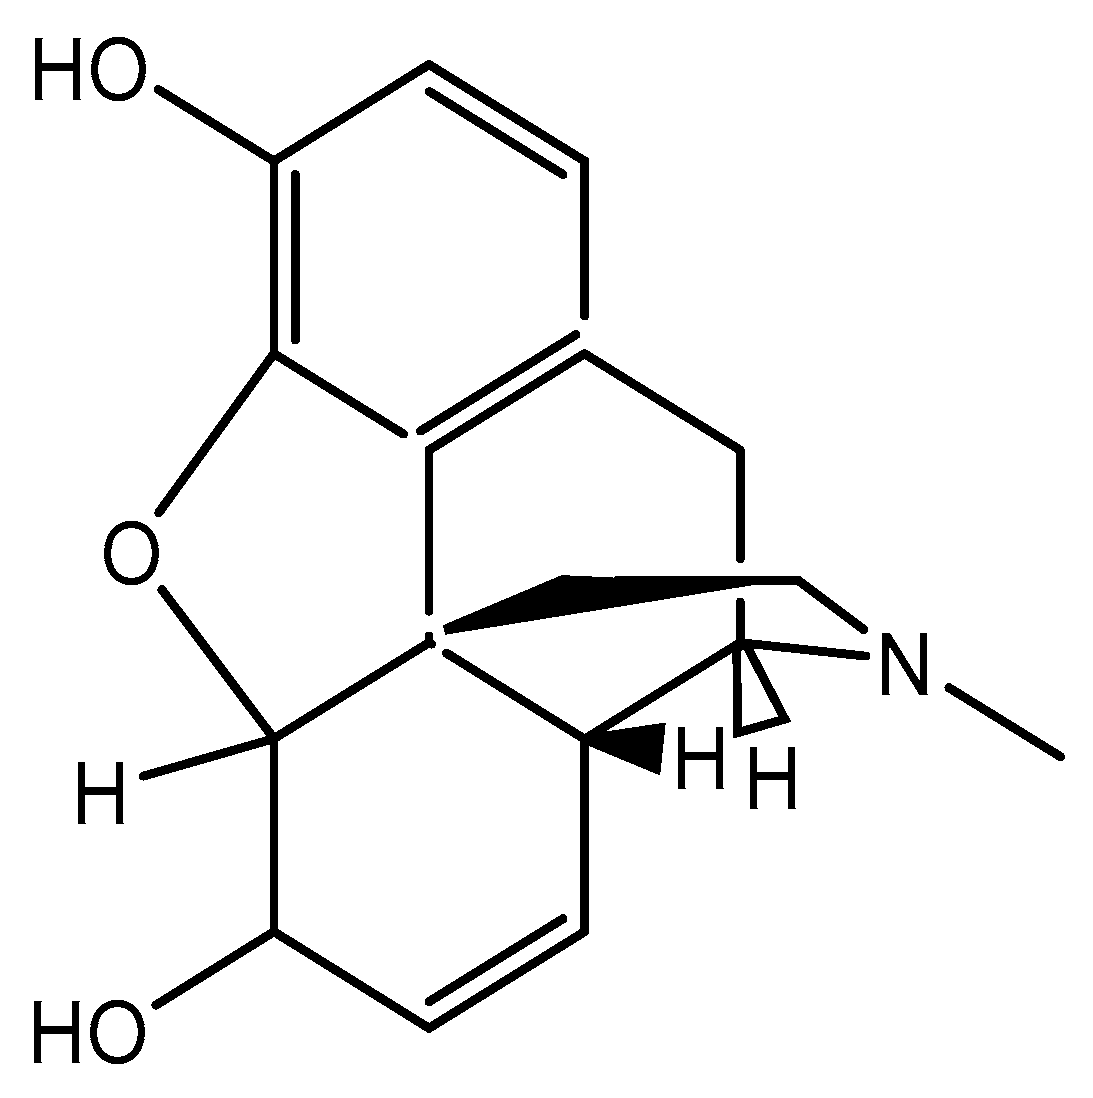
Figure 2.
Pictorial representation of Morphine detection using imprinted electrodes.
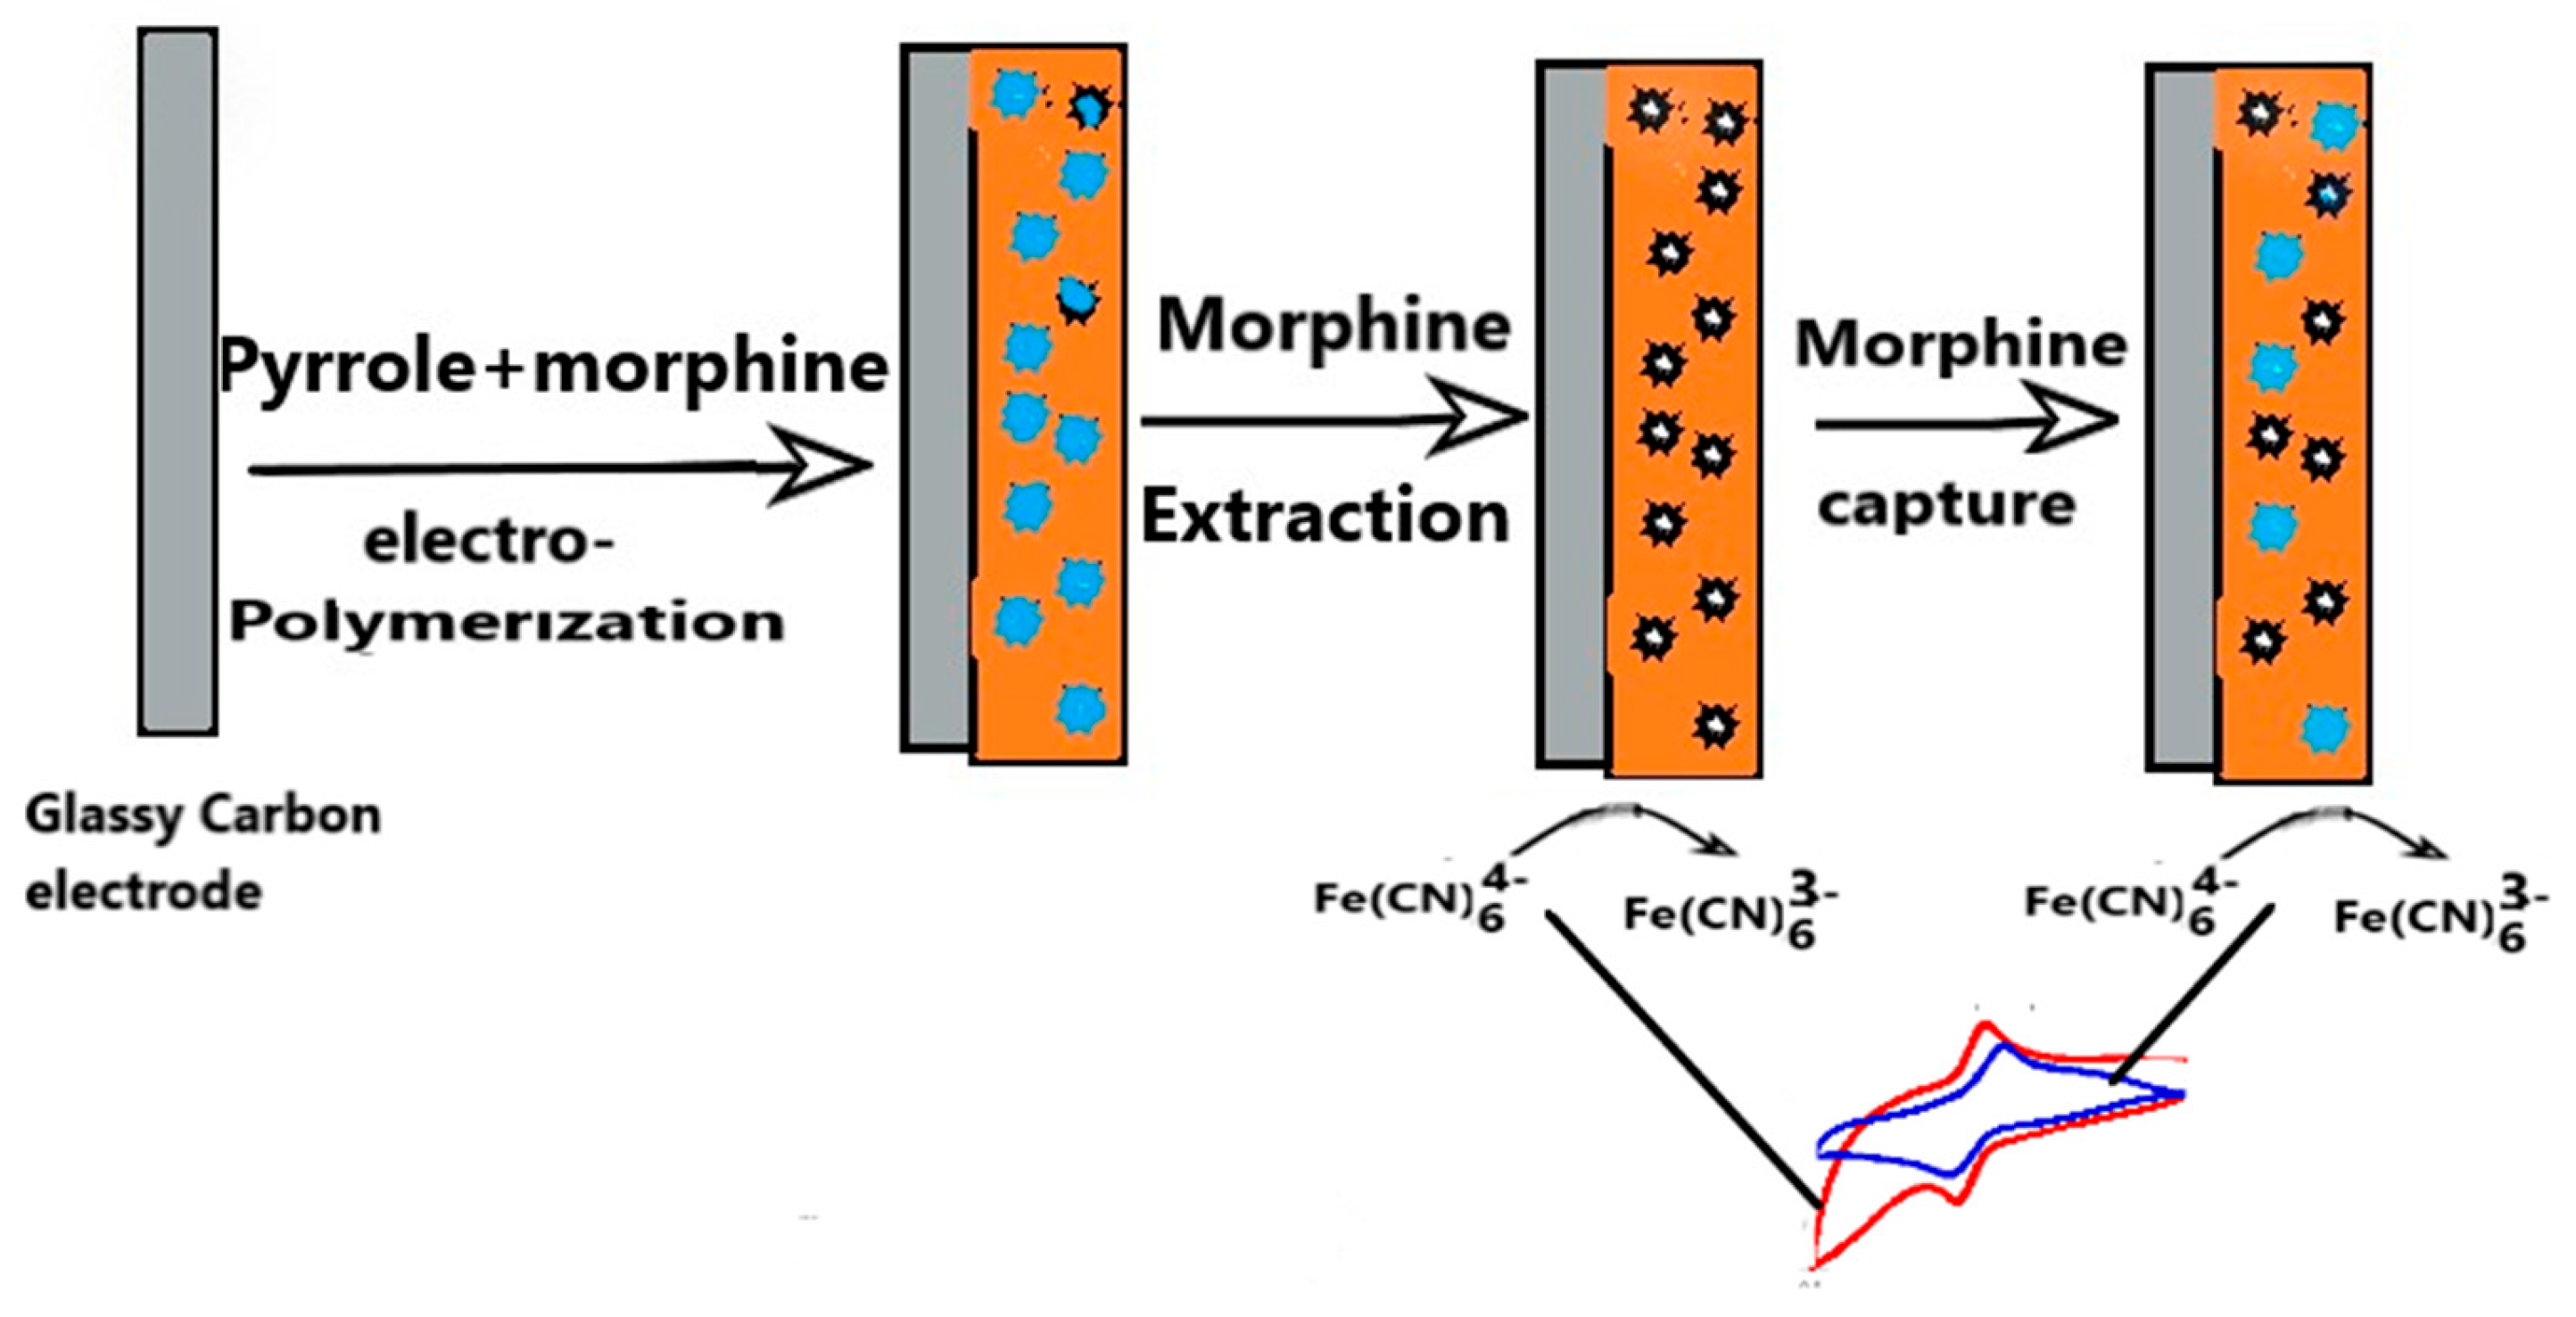
Figure 3.
(a) Cyclic voltammograms showing the electro-polymerization of pyrrole monomer on a glassy carbon electrode. (b) Current from cyclic voltammogram plotted as a function of the number of cycles.
Figure 3.
(a) Cyclic voltammograms showing the electro-polymerization of pyrrole monomer on a glassy carbon electrode. (b) Current from cyclic voltammogram plotted as a function of the number of cycles.
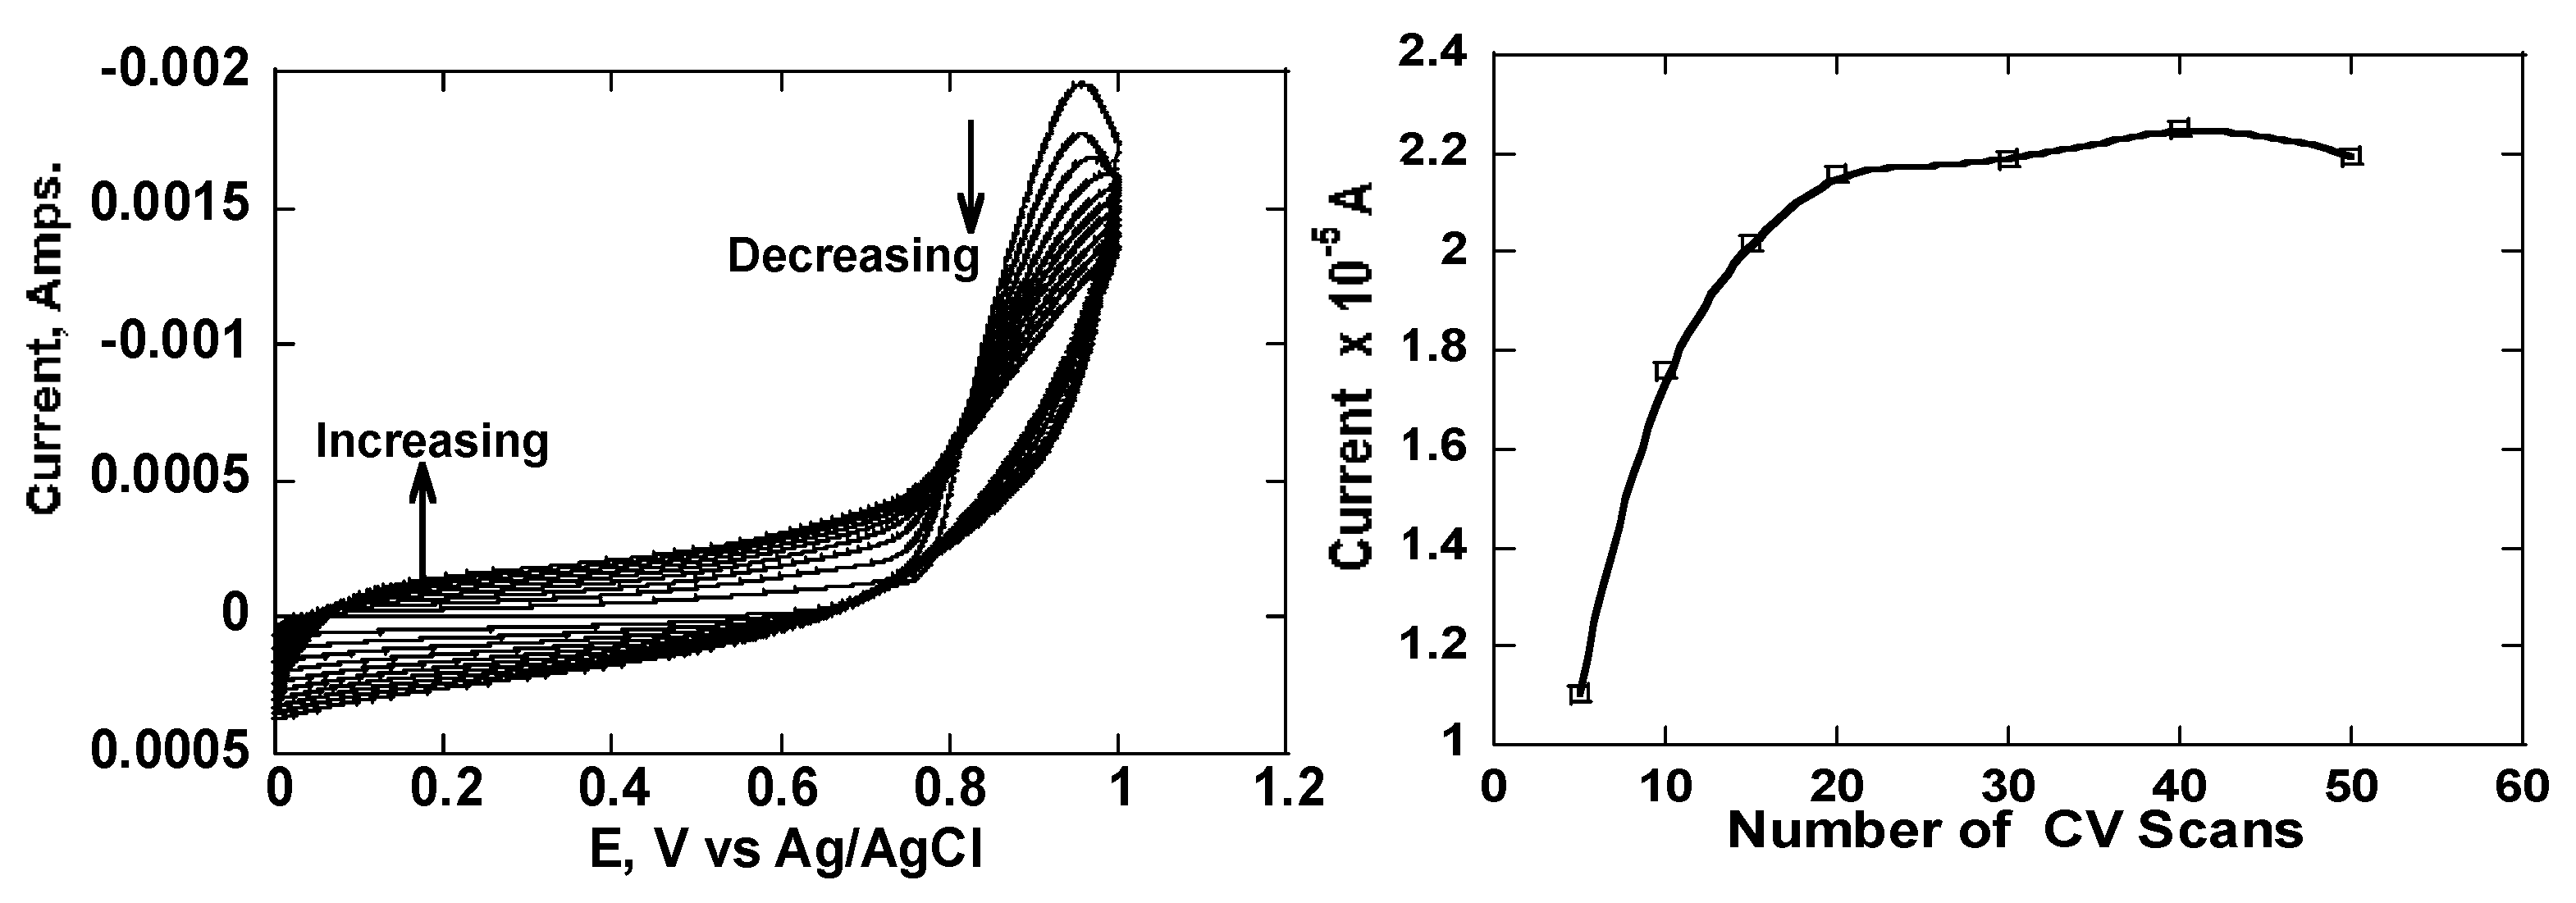
Figure 4.
FTIR of spectra of electropolymerized poly-pyrrole with trapped morphine before and after morphine extraction.
Figure 4.
FTIR of spectra of electropolymerized poly-pyrrole with trapped morphine before and after morphine extraction.
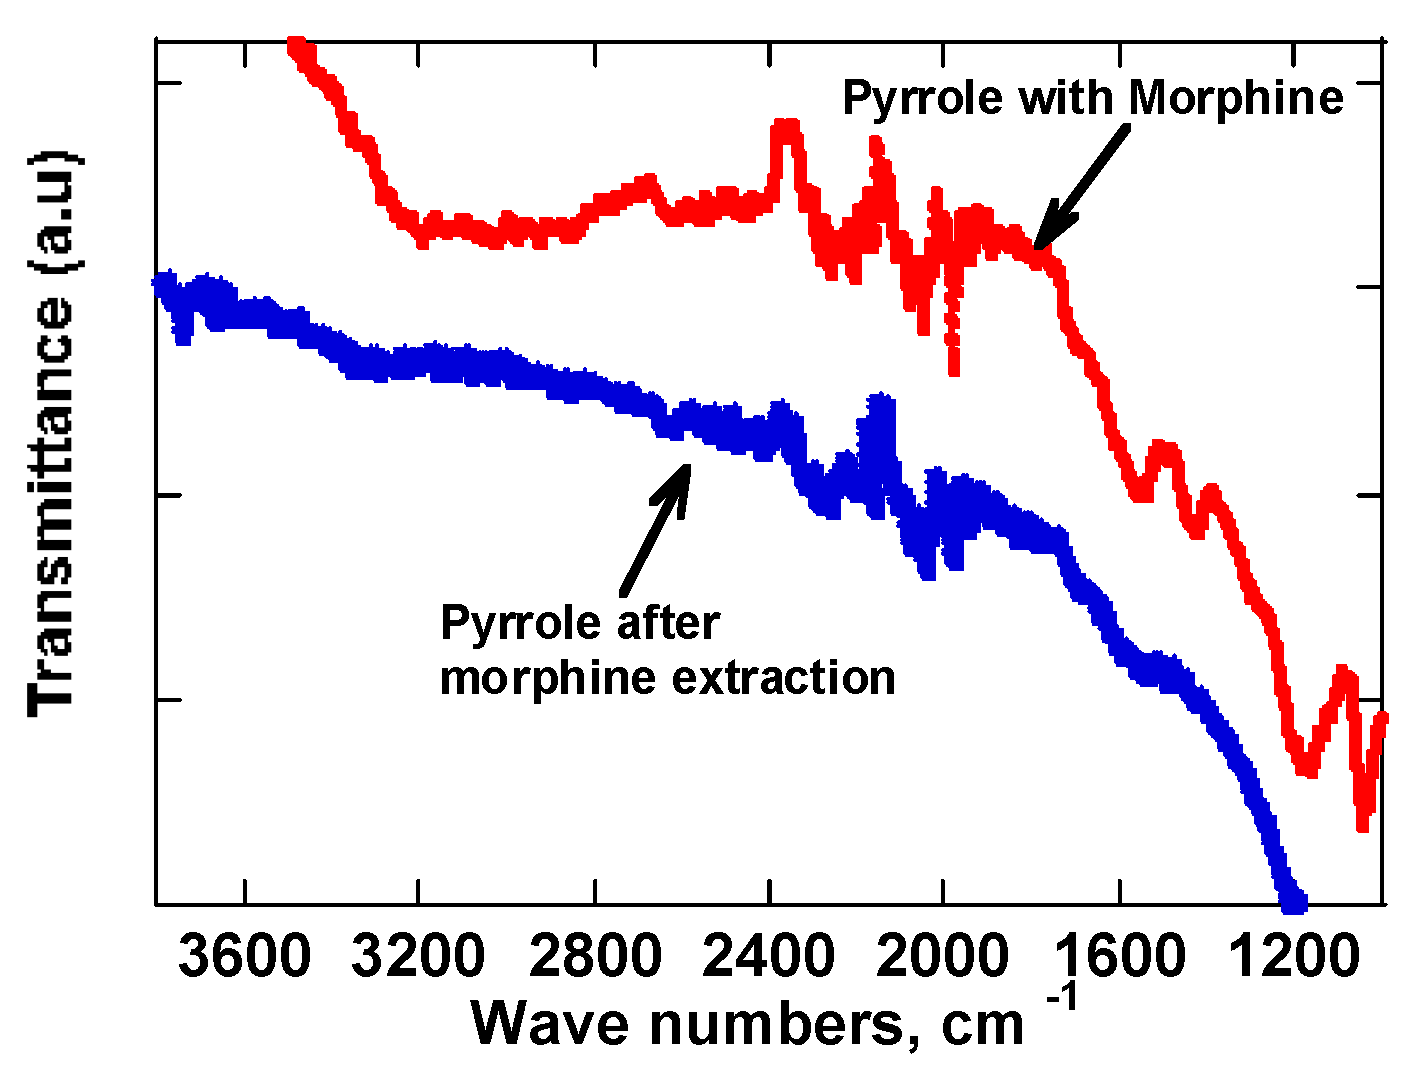
Figure 5.
Electrochemical impedance spectroscopy of a glassy carbon electrode with continuous electro-polymerization. A spectrum was taken after every cyclic voltammetry scan in Fe(CN)6-3/-4 solution.
Figure 5.
Electrochemical impedance spectroscopy of a glassy carbon electrode with continuous electro-polymerization. A spectrum was taken after every cyclic voltammetry scan in Fe(CN)6-3/-4 solution.
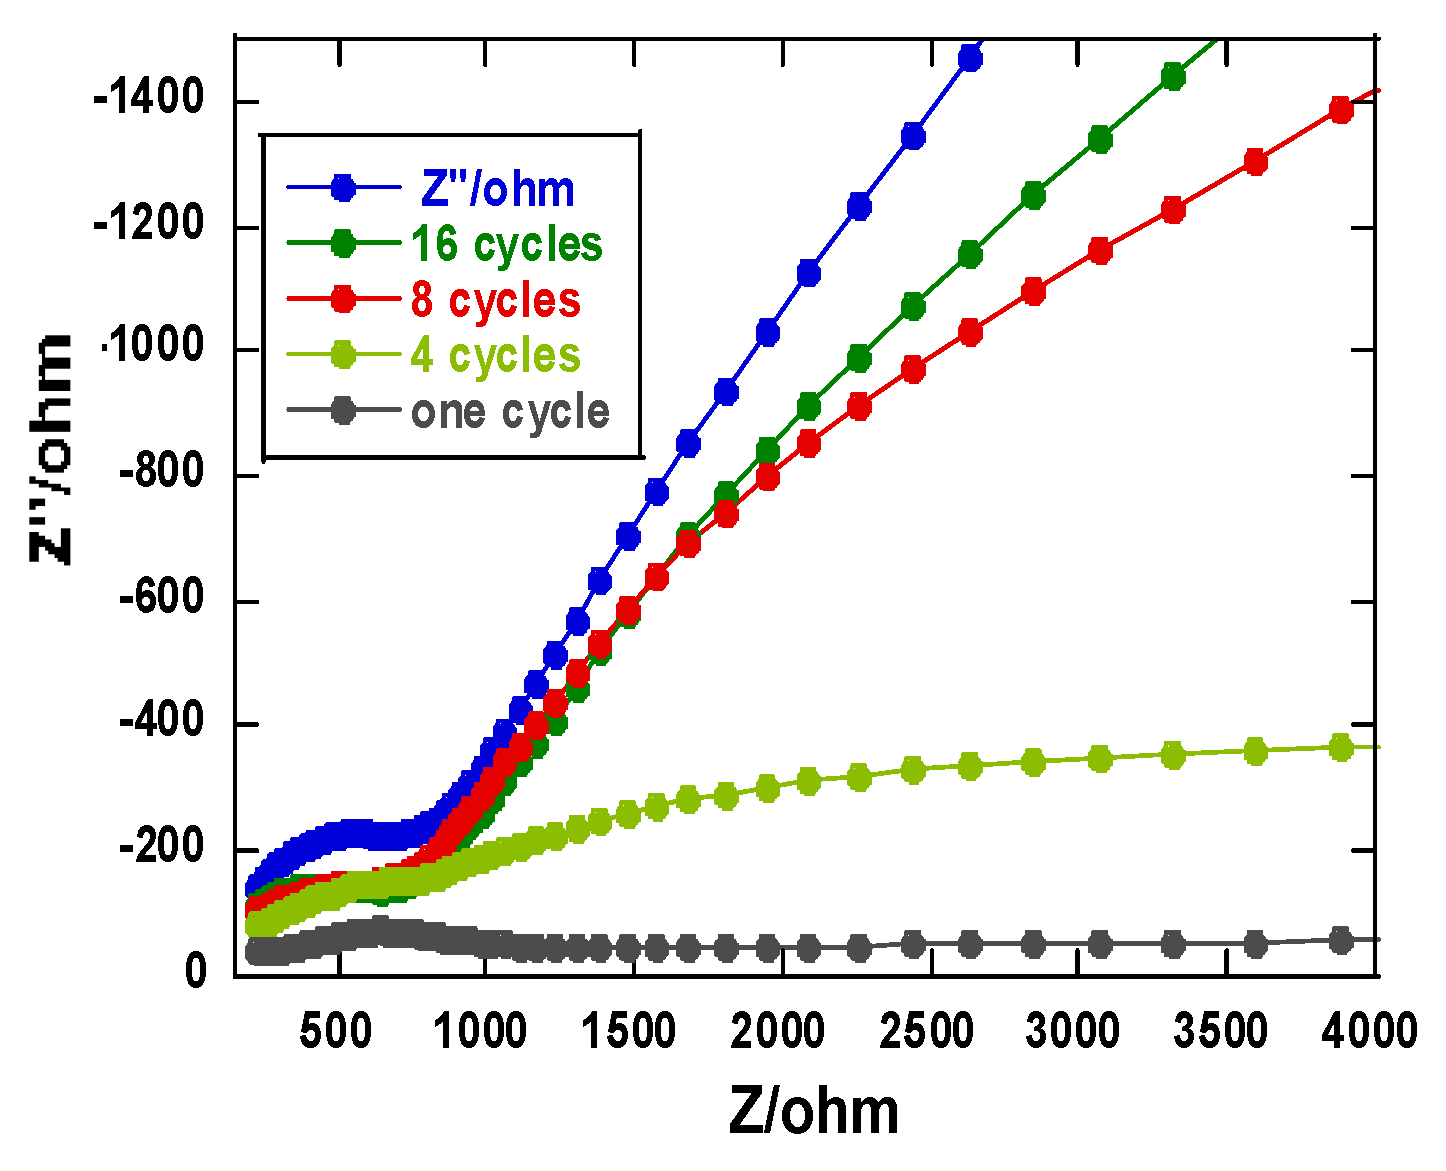
Figure 6.
(a) Cyclic voltammetry of pyrrole polymer imprinted electrodes analyzed in different concentrations of morphine solution. (b) Current as a function of concentration calibration plot of both imprinted using cyclic voltammograms. (c) Square wave voltammetry of pyrrole analyzed in morphine. (d) Current as a function of concentration using square wave voltammograms.
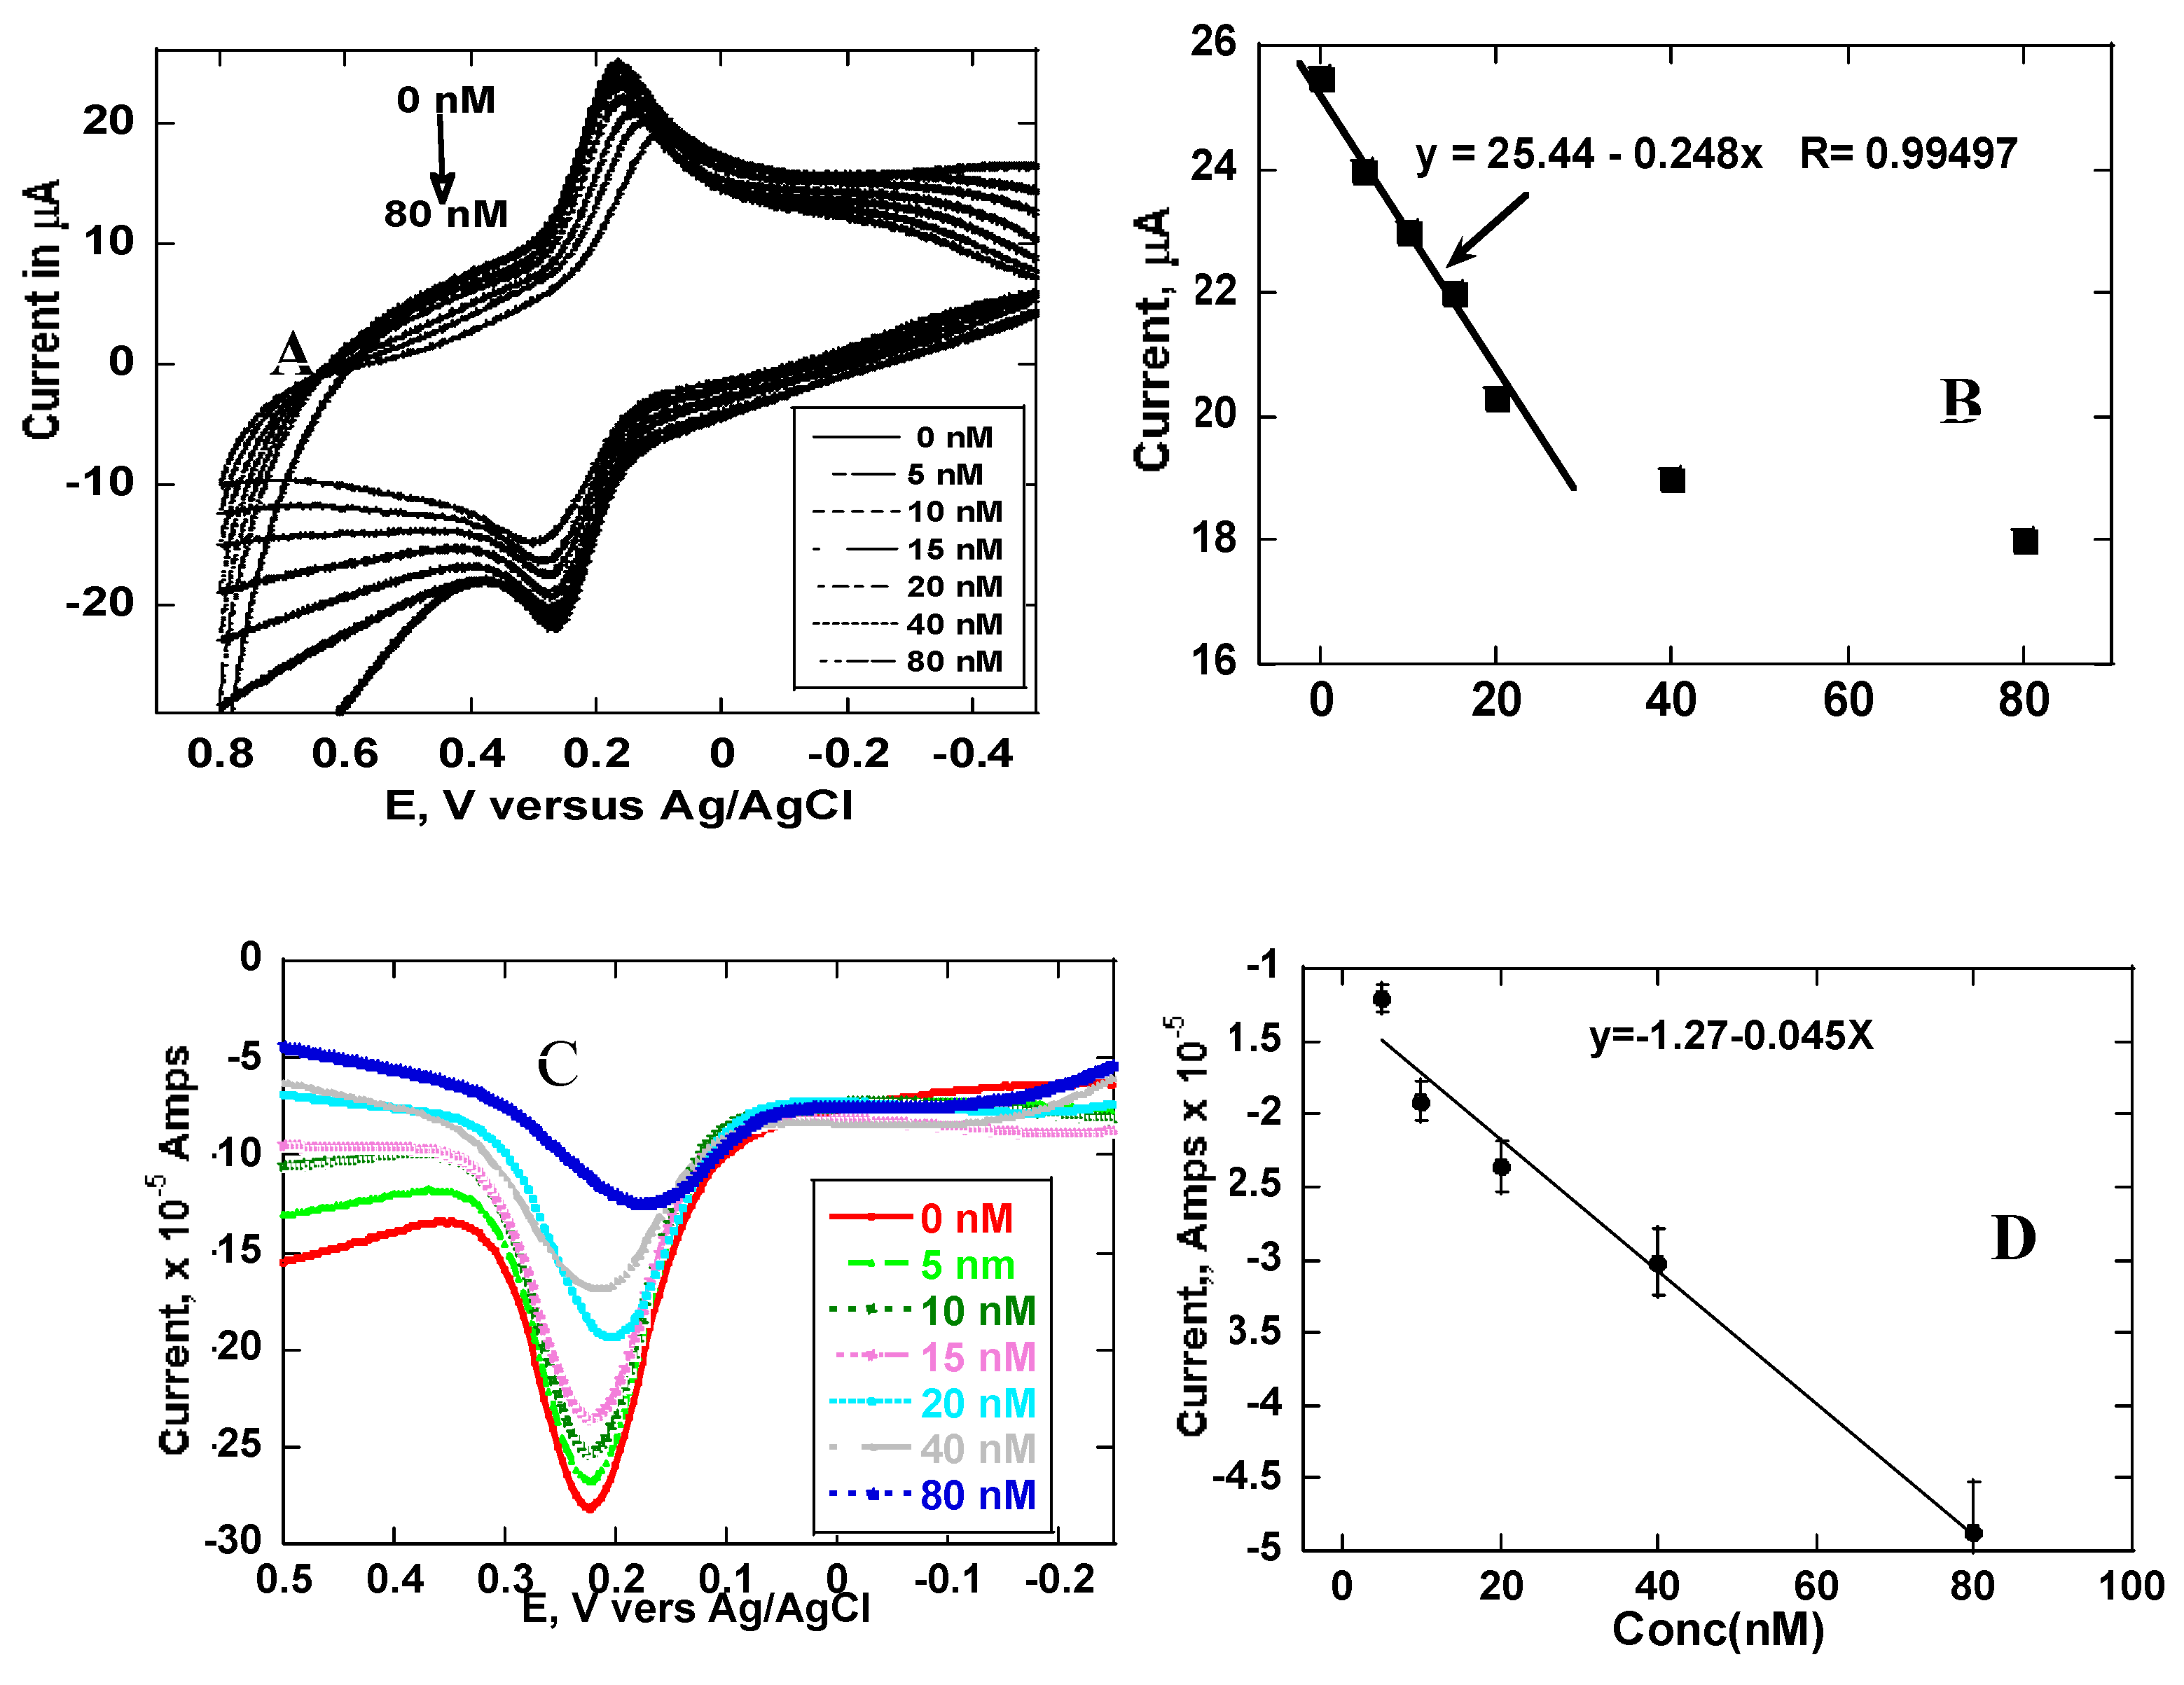
Figure 7.
(a) Current as a function of the concentration of morphine and acetaminophen using imprinted electrodes. (b) SWV of morphine using imprinted electrodes in a wastewater sample compared with the electrode in wastewater spiked with 20 nM morphine.
Figure 7.
(a) Current as a function of the concentration of morphine and acetaminophen using imprinted electrodes. (b) SWV of morphine using imprinted electrodes in a wastewater sample compared with the electrode in wastewater spiked with 20 nM morphine.
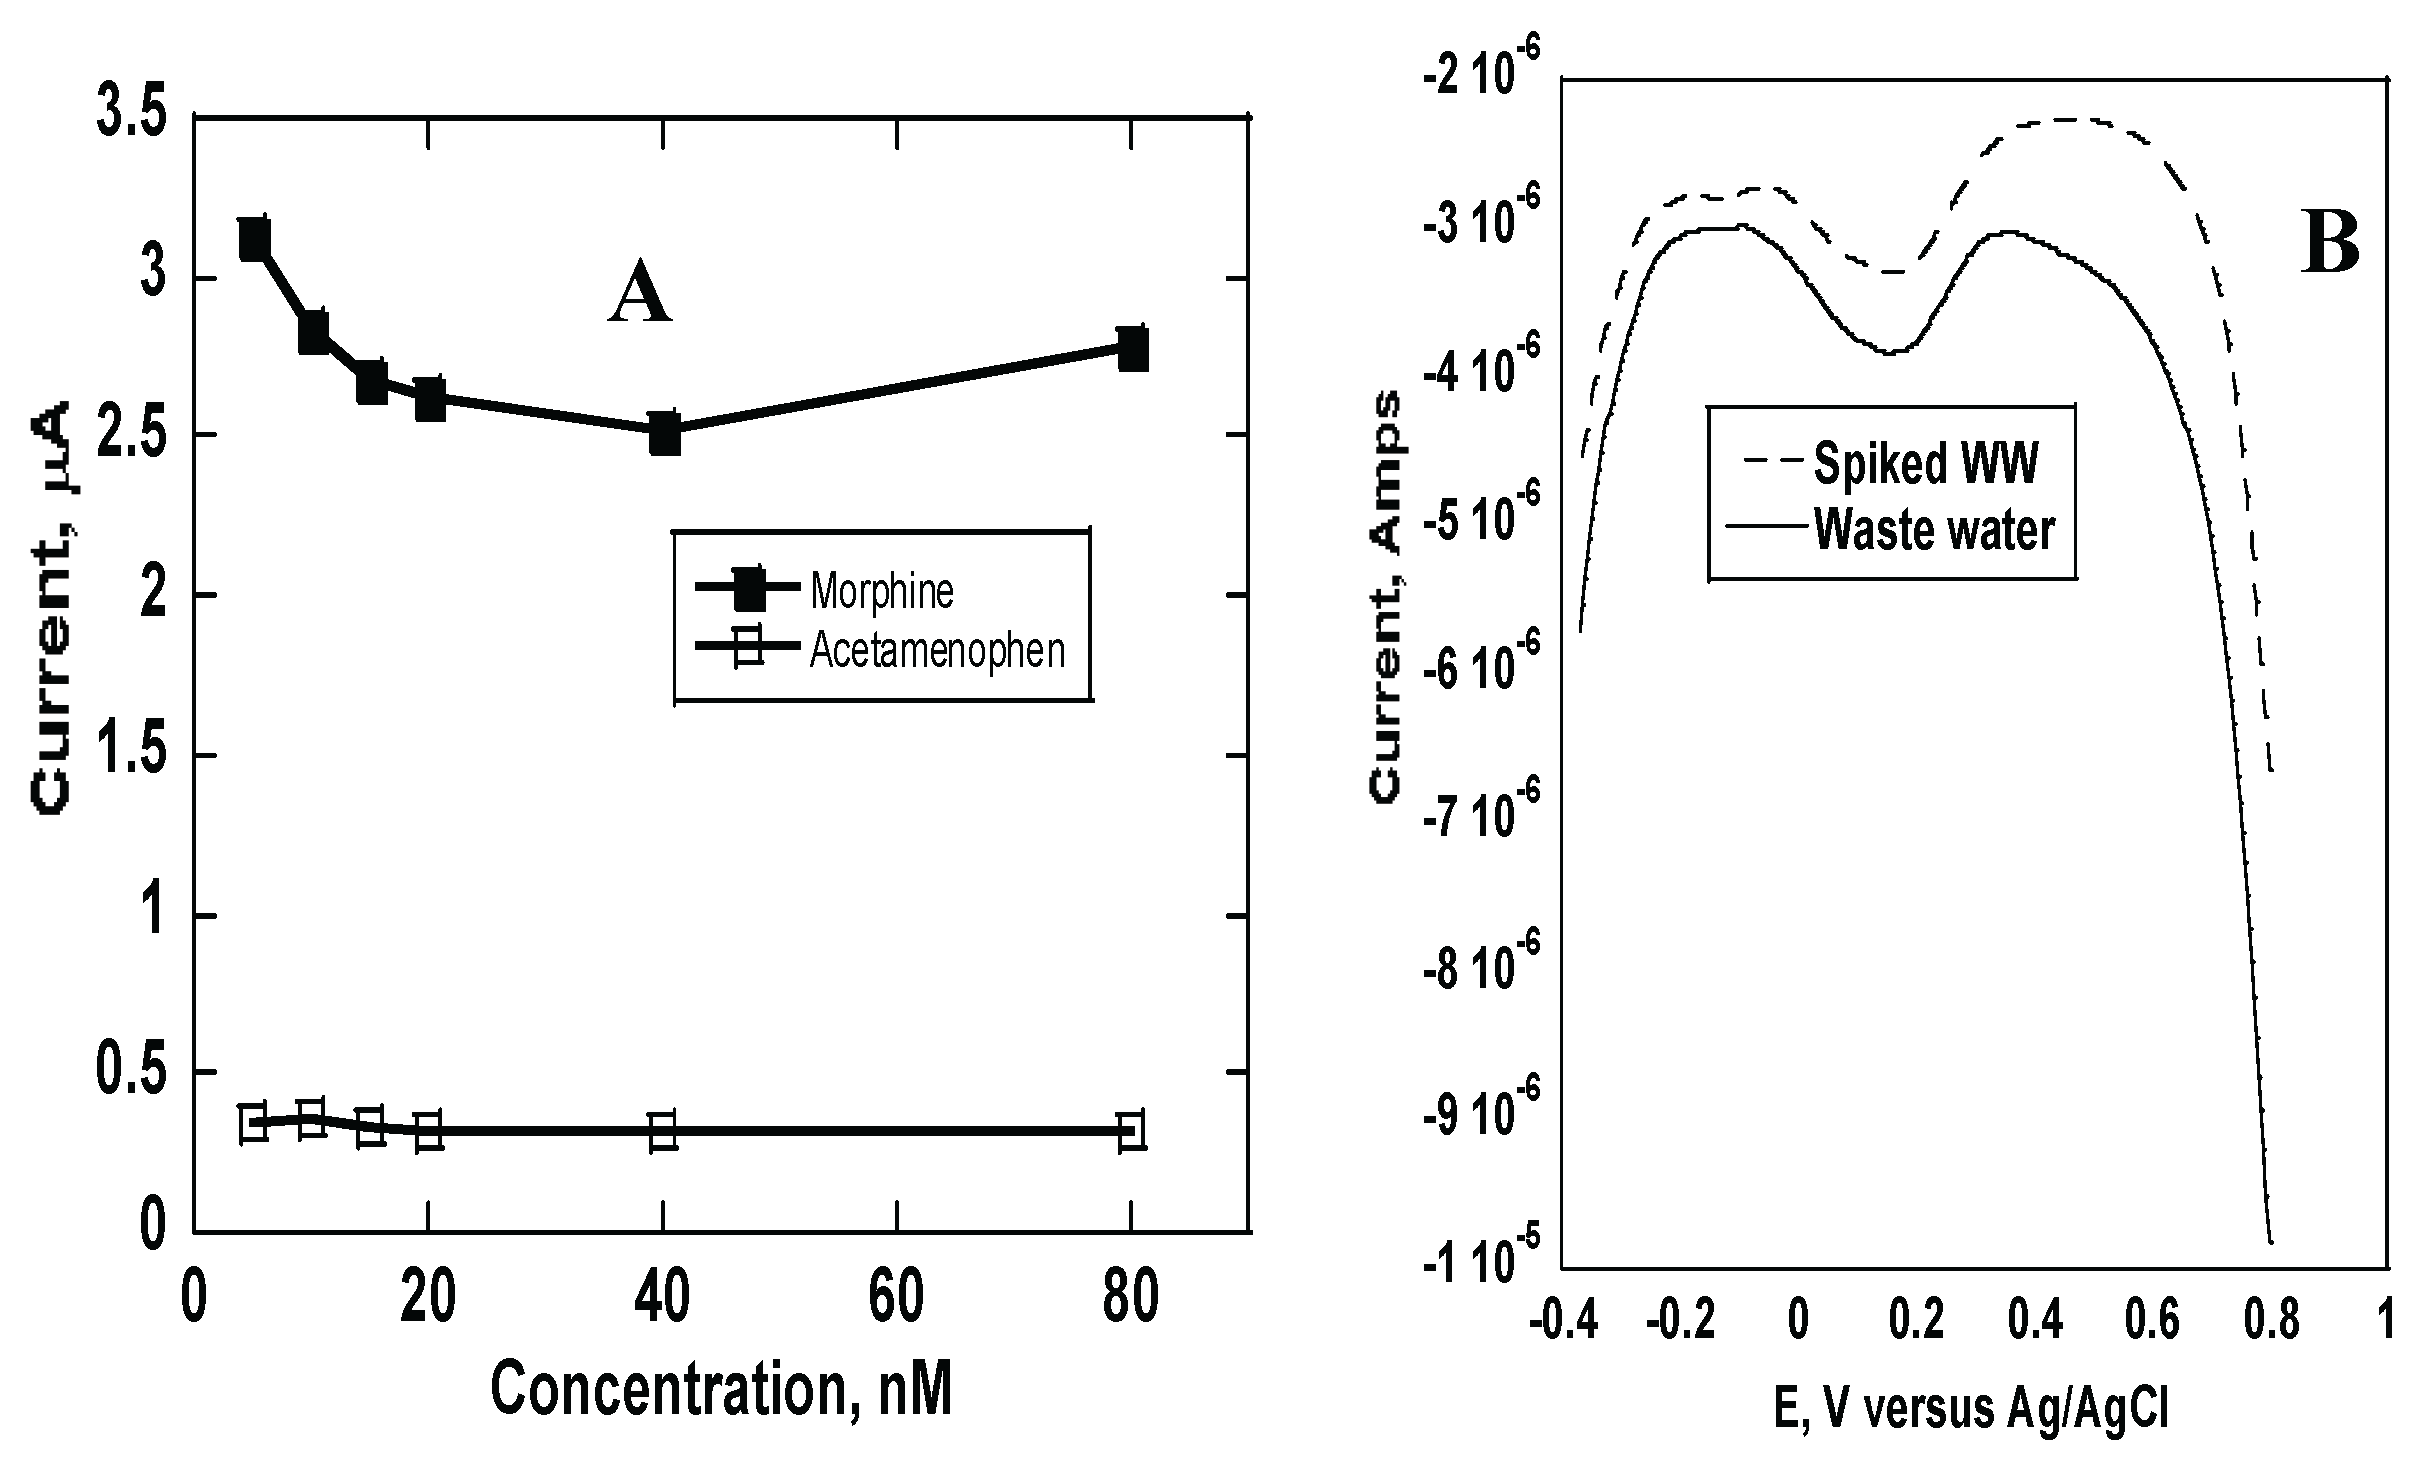

Table 1.
Comparisons of different methods for the detection of morphine.
| Electrode-Based | |||
| Modified Electrodes | Linear Range | Detection Limit | Reference |
| Graphene/Co3O4 (Gr/Co3O4) | 0.5-100.0μM | 80 nM | [27,28] |
| Polymer/SWCNT | 0.5-10μM | 0.48μM | [29] |
| Carbon Paste GNP | 1.0×10⁻⁶ - 18.0×10⁻⁴ M | 3.507 x 10⁻⁹ M | [30] |
| Polypyrrole polymer imprint | 0.–20 nM and 0 to 80nM | 2.75 and 1.5 nM | This work |
| Other methods | |||
| UHPLC-MS/MS | 0.025-12. 5 ng/mg | 20.27 pg/mg | [31] |
|
(LC-MS/MS) with CNTs extraction. |
25-2000 ng/mL | 2.0 ng/mL | [32] |
| DRI immunoassay | 0 to 1466 ug/L | 300 ug/L | [33] |
| Electrokinetic chromatography | 0.5-50 ng/mg | 200 pg/mg | [34] |
Disclaimer/Publisher’s Note: The statements, opinions and data contained in all publications are solely those of the individual author(s) and contributor(s) and not of MDPI and/or the editor(s). MDPI and/or the editor(s) disclaim responsibility for any injury to people or property resulting from any ideas, methods, instructions or products referred to in the content. |
© 2025 by the authors. Licensee MDPI, Basel, Switzerland. This article is an open access article distributed under the terms and conditions of the Creative Commons Attribution (CC BY) license (https://creativecommons.org/licenses/by/4.0/).
Copyright: This open access article is published under a Creative Commons CC BY 4.0 license, which permit the free download, distribution, and reuse, provided that the author and preprint are cited in any reuse.


