Submitted:
02 July 2025
Posted:
03 July 2025
You are already at the latest version
Abstract
FOS are short fructans with different DP and bonds in their structure, generated by the distinct activities of fructosyltransferase enzymes, which produce distinct types of links. FOS are highly demanded on the market, principally for their prebiotic effects. In recent years it has been described that depending on the link type in FOS structure, their prebiotic activity could be enhanced. Studies about β-fructanofuranosidases (FFasa), enzymes with fructosyltransferase activity in yeast, have reported the produc-tion of 1F-FOS, 6F-FOS, and 6G-FOS. The aims of this work were to evaluate the fructo-syltransferase activity of fifteen yeasts, determine the potential of agave juice as a sub-strate for FOS production, evaluate the fructosyltransferase activity of yeast enzymatic extracts generated by distinct induction media, and determine optimal parameters for FOS production using yeast isolated from agave. To carry out such a task, different techniques were employed: FT-IR, TLC, and HPAEC-PAD. We found two yeasts with fructosyltransferase activity, P. kudriavzevii ITMLB97 and C. lusitaniae ITMLB85. In addition, within the most relevant results, the production of the FOS: kestose, 6-kestose, and neokestose, as well as disaccharides: inulobiose, levanobiose, and blas-tose were determined, which are molecules with future potential applications. Overall, FOS production requires suitable yeasts, which grow in a medium under optimal con-ditions, from which microbial enzymes with industrial potential can be obtained.
Keywords:
Fructooligosaccharides
; blastose
; yeast
; 6-kestose
1. Introduction
Fructans are fructose polymers with linear or branched structures; if any, there is a D-glucose unit in the molecule [1,2]. Different types of fructans have been described and classified on the basis of their glycosidic linkage types: inulin (β(2→1)), levan (β(2→6)), graminans (β(2→1) and β(2→6)), neoseries of inulin, and neoseries of levan (with internal glucose), and agavins (β(2→1) and β(2→6)), highly branched fructans with internal glucose). In addition, depending on their degree of polymerization (DP), they are classified as fructooligosaccharides (FOS) between DP3 and DP12, and high polymerization degree (HDP)-fructans with DP > 12. In microorganisms, FOS synthesis is mediated by enzymes such as fructosyltransferases (FTase, E.C. 2.4.1.9) and β-fructofuranosidases (FFase, E.C. 3.2.1.26) [3]. The transfructosylation of fructose to sucrose or a FOS molecule results in an increase in the level of the molecule DP [4]. In wild yeast, FFase, also invertase, which has fructosyltransferase activity, has been documented; however, this activity requires high sucrose concentrations [3M] [5]. In this context, microbial enzymatic activity results in a structural variety of FOS, including 1F-FOS (inulin-type FOS), 6F-FOS (levan type FOS), 1,6F-FOS (graminan-type FOS), 6G-FOS (neolevan-FOS), and probably aFOS (agavin-FOS) [6,7,8], which later polymerize into all types of HDP-fructans. Nonetheless, in the pharma and food industries, FOS are the fructans in greatest demand because of their benefits to human health. For example, FOS can increase the absorption of minerals such as calcium, iron, and magnesium; increase beneficial intestinal microbiota and the inhibition of pathogens; decrease total cholesterol and serum lipids; positively stimulate the immune system; increase IgA secretion; decrease proinflammatory cytokines; and exert antioxidant properties [9,10,11,12,13].
In this context, the most studied type of FOS is 1F-FOS, followed by 6F-FOS. However, little is known about the 6G-FOS [7,14]. For this serie, a disaccharide called blastose is considered the first construction block of neo-FOS [15]; in addition, blastose inhibits the increase in glucose in plasma after its administration [16]. The next product of blastose resulting from transfructosylation is neokestose. Interestingly, when a subsequent fructofuranosyl transfer β(2→6) from fructose to blastose occurs, the blasto-FOS series arises [17]. This structural variation in FOS might be linked to distinctive effects on biological functions, as β(2→6) linkages enhance the prebiotic potential and chemical stability of these molecules [7,18] compared with conventional 1F-FOS. Some reports of 6F-FOS include FFase enzymes in Saccharomyces cerevisiae [19] and Schwanniomyces occidentalis [20]. Similarly, FFasa enzymes from Phaffia rhodozyma [21] and Xanthophyllomyces dendrorhous were found to produce 6G-FOS [22,23]. Interestingly, the 6G-FFase of the yeast X. dendrorhous also produced blastose [8]. FOS production varies depending on the type of microorganism (bacteria, filamentous fungi, or yeast) and their species, as well as their enzymes. In addition, FOS production is influenced by parameters such as temperature, pH, agitation speed, nutrients, substrate, and culture medium composition [3,24,25]
On the other hand, fructans occur in approximately 15% of terrestrial plants. Some of the most well-known species include chicory, dahlia, onion, garlic, asparagus, and agave; even the first photosynthetic products of agaves are fructans [26,27]. Agave is an emblematic group of plant species from Mexico, accounting for approximately 77% of all agave species worldwide [28]. Nonetheless, only a few species, such as Agave tequilana var. azul, are industrially exploited to produce tequila. However, many other species, varieties, and agave products have not yet been explored or properly exploited. For example, the “aguamiel”, the sap core of agave, is a raw material composed of saponins, vitamins, amino acids, fatty acids, minerals, and carbohydrates such as glucose, fructose, sucrose, and FOS. A wide variety of Agave species, including A. salmiana, A. mapisaga, A. atrovirens, A. americana, and A. ferox, are used for obtaining aguamiel to produce “pulque” (fermented beverage) [29]. In this context, only a few studies have used agave juice as a substrate for the evaluation of fructanase activity. The few ones include the hydrolytic activity of enzymes from Kluyveromyces marxianus and Saccharomyces paradoxus [30], as well as fructosyltransferase activity from Aspergillus oryzae [31]. However, agave juices could be explored as substrates to produce FOS through the fructosyltransferase activity of yeasts. In the region of the lake of Cuitzeo in Michoacán, México, agave specimens are cultivated to obtain aguamiel. However, this geographical region possesses peculiar features, for instance, the highest degree of salinity in Mexico’s lakes [32] is between 700 and 13 000 µS/cm [33,34]. This salinity affects the growth of most crops in this region, and agaves are not the exception. The specimens in this region possess small pine heads with large shapes (Figure S1), but the variation of their fructans, especially FOS, has not been profiled. In addition, the potential of the juice of the Cuitzeo lake agave specimens could also be used as a substrate to produce FOS by agave wild yeast, which remains unexplored. In addition, supported by experimental designs such as the Box‒Behnken design, the systematic variation in various variables can be explored to find the optimal conditions for FOS production [35,36,37]. Therefore, the aims of this work were to evaluate the fructosyltransferase activity of fifteen yeasts, determine the potential of agave juice as a substrate for FOS production, evaluate the fructosyltransferase activity of yeast enzymatic extracts generated by distinct induction media, and determine optimal parameters for FOS production using yeast isolated from agave.
2. Materials and Methods
2.1. Plant Material and Agave Juice Extraction
Specimens of Agave sp. were collected in Cuitzeo, Michoacán, Mexico (19 57´45.5”N, 101 12´29.4”W) at 1840 m altitude. The agave was dissected in pine head (P), base of the scape (BS), base of the leaf (BL), and leaf (L) (Figure S1), and cut into small pieces and stored at -20 °C. The juice extraction from every dissected agave part was performed in a Turmix® Rudo juice extractor TU05. Each agave juice was named P-juice, BS-juice, BL-juice, or L-juice. All juices were vacuum filtered through 0.22 µm membranes. Aliquots of each juice sample were taken for physicochemical analysis and fermentation assays. The juices for physicochemical analysis were stored at -20 °C until analysis. The juices for fermentation assays were sterilized at 121 °C for 15 min and then stored at -4 °C until experiments.
2.2. Microorganisms
The yeasts used in this study were Candida cylindracea NRRL Y-17537, Lachancea thermotolerans NRRL Y-2231, Torulaspora delbrueckii NRRL Y-1535, and Yarrowia lipolytica NRRL Y-5386 from the USDA collection. Issatchenkia terricola Y14, and Pichia kluyveri Y13 belong to the strain collection of TecNM/Instituto Tecnológico de Cd. Hidalgo. Kluyveromyces marxianus CDBB-L2029, Pichia stipitis ITMLB05, Zygosaccharomyces bailii ITMLB31, Candida lusitaniae ITMLB85, Candida lusitaniae ITMLB103, Kluyveromyces marxianus ITMLB106, Pichia kudriavzevii ITMLB97, Saccharomyces cerevisiae ITMLB69, and Saccharomyces cerevisiae ITMLB70 belong to the strain collection of TecNMX/Instituto Tecnológico de Morelia. The strains were maintained on YPD agar at 4 °C.
2.3. Physicochemical Analysis of the Agave Juices
The juices were subjected to the next determinations: pH (potentiometry, Hanna Instruments HI2211), density (pycnometer), soluble solids (refractometer ABBE), humidity (NMX-F-83-1986), ash (NOM-F-66-S), protein (Bradford), total phenolic content (Folin‒Ciocalteu), and thin layer chromatography (TLC) [38] using chicory FOS as a commercial FOS reference sample (Megazyme).
2.4. Yeast Growth Screening in Different Agave Juices
The growth of the fifteen yeast strains (C. cylindracea NRRL Y-17537, C. lusitaniae ITMLB85, C. lusitaniae ITMLB103, I. terricola Y14, K. marxianus CDBB-L2029, K. marxianus ITMLB106, L. thermotolerans NRRL Y-2231, P. kluyveri Y13, P. kudriavzevii ITMLB97, P. stipitis ITMLB05, S. cerevisiae ITMLB69, S. cerevisiae ITMLB70, T. delbrueckii NRRL Y-1535, Y. lipolytica NRRL Y-5386, and Z. bailii ITMLB31) was evaluated in all the agave juices (P, BS, BL, and L). To do so, independent pre-inoculation of each culture was performed, and two inoculation loops of each yeast were seeded in YPD media (casein peptone 20 g/L, dextrose 20 g/L, and yeast extract 10 g/L) and incubated for 24 h at 30 °C and 150 rpm. The cellular concentration was subsequently determined in a Neubauer chamber. For that, 100 µL samples of the corresponding media were taken and mixed with 10 µL of methylene blue and 890 µL of distilled water. From this mixture, 10 µL was added to each grid of the Neubauer chamber. On this basis, the volume of preinoculum required to obtain inoculums of 3x10⁶ cells/mL was determined. Thus, these inoculums were seeded in 50 mL Falcon tubes with 25 mL of the corresponding agave juice (P, BS, BL, or L). The growth of all the yeasts was tested at different temperatures (25, 35, and 45 °C), and pH= 5.5. In addition, the growth of each treatment was monitored (samples taken) every 6 h for 30 h. These assays were decisive to select the juice that would serve as a substrate for the yeasts, as well as the yeasts for the following experiments.
2.5. Effects of Sucrose Concentration on FOS Production
To determine the effect of the sucrose concentration on FOS production, three yeasts were selected (K. marxianus ITMLB106, P. kudriavzevii ITMLB97, and C. lusitaniae ITMLB85), as well as the BS-juice. The yeasts were grown with different sucrose concentrations (1.5, 20 and 40%, equivalent to 15, 200, and 400 g/L, respectively) in the BS-juice media. Moreover, different incubation temperatures were tested for microbial growth (23, 30, and 37 °C). For the pre-inoculation two inoculation loops of the corresponding yeast were used and transferred to 250 mL Erlenmeyer flasks with 100 mL of YPDE (casein peptone 20 g/L, dextrose 20 g/L, yeast extract 10 g/L, sucrose 15 g/L, K2HPO4 1 g/L, KH2PO4 2.3 g/L, (NH4)NO3 1 g/L, (NH4)2HPO4 1 g/L, and MgSO4 0.5 g/L), which were incubated for 16 h at 30 °C and 150 rpm. After that, inoculums of 3x10⁶ cells/mL of each yeast were prepared and inoculated in 250 mL Erlenmeyer flasks with 100 mL of enriched BS-juice (K2HPO4 1 g/L, KH2PO4 2.3 g/L, (NH4)NO3 1 g/L, (NH4)2HPO4 1 g/L, MgSO4 0.5 g/L). The BS-juice was adjusted to 8°Brix with distilled water. The inoculated flasks were subsequently incubated at 23, 30, and 37 °C for 56 h at 150 rpm, and pH= 5.5. Samples for cellular growth were taken at 0, 24, 48, and 56 h and immediately processed. The data were analyzed by ANOVA and Tukey tests with α= 0.05. In parallel, samples for TLC were taken and stored at -20 °C until analysis.
2.6. Surfactants Effects on FOS Production
The effects of different surfactants on FOS production were evaluated in P. kudriavzevii ITMLB97 and C. lusitaniae ITMLB85. They were subsequently grown in enriched BS-juice, treated with DNa, SDS, Tween 80, and Triton X-100 at 10 mM as surfactants. In addition, control treatments, which included only the corresponding yeast without any surfactant. Pre-inoculums of P. kudriavzevii ITMLB97 and C. lusitaniae ITMLB85 were prepared in YPDE media (as described in section 2.5). After that, inoculums of 3x10⁶ cells/mL were added to 50 mL Erlenmeyer flasks with 30 mL of enriched BS-juice, with the corresponding surfactant. After that, the inoculated flasks were incubated for 72 h at 30 °C, pH= 5.5, and 150 rpm. Samples were taken at 0, 24, 48, and 72 h for cellular growth, which were immediately analyzed. The data were analyzed by ANOVA and Tukey tests with α = 0.05. Additionally, samples for TLC analyses were taken and stored at -20 °C until analysis.
2.7. Effects of Carbon Sources and Nutrients on FOS Production
Other carbon sources and nutrients were tested with P. kudriavzevii ITMLB97 and C. lusitaniae ITMLB85. FOS, inulin, and BS-juice were used as unique carbon sources, and commercial nutrient formulas from ININBIO, called diphosta, multicel, forte, nutri, and plus, were also tested to produce FOS. All nutrients were donated by ININBIO. The general composition of the nutrient formulas consist in Di-phosta = assimilable nitrogen; Multi-cel = minerals such as potassium, sodium, magnesium, and calcium; organic nitrogen; Forte = minerals such as potassium, sodium, and ammonium salts as nitrogen source; Nutri-fast = salts of ammonium, magnesium, calcium, and potassium; and Plus-cel = potassium, sodium, magnesium, and calcium. The inoculation was performed as described in the previous sections. Then, inoculated flasks were incubated at 30 °C for 192 h at 150 rpm and pH= 5.5. Samples for cellular growth were taken at 0, 24, 48, 120, and 192 h, and were immediately analyzed. The growth at 192 h was analyzed by ANOVA and Tukey tests, with α = 0.05. In addition, samples for FT-IR (Fourier transform infrared spectroscopy), TLC, and HPAEC-PAD (High performance anion exchange chromatography) were taken and stored at -20 °C until analysis.
2.8. Fructosyltransferase Activity Evaluation
Box–Behnken designs were established to evaluate the fructosyltransferase activity of the enzymatic extracts of the yeasts (P. kudriavzevii ITMLB97 and C. lusitaniae ITMLB85) through two induction media (Table 1). The first induction medium was reported by Chen et al. [39] for the induction of fructosyltransferase activity from a FFase (yeast extract, 3 g/L; peptone, 5 g/L; sucrose, 30 g/L; and MgSO₄·7H₂O, 0.5 g/L). The second proposed induction medium was called NM (yeast extract, 10 g/L; peptone, 20 g/L; sucrose, 200 g/L; and diphosta nutrient from ININBIO, 0.25 g/L). For that, pre-inoculums of each yeast were prepared (as described in section 2.5), and inoculums of 3x10⁶ cells/mL were determined (as described in section 2.4) and used to inoculate 250 mL Erlenmeyer flasks with 100 mL of the respective induction medium. All the flasks containing the induction media were incubated for 48 h at 150 rpm. After incubation, all the induction media were centrifuged at 8000 × g for 10 min, and each supernatant was used to evaluate the enzymatic fructosyltransferase activity. These enzymatic extracts were named: the enzymatic extract of P. kudriavzevii ITMLB97 obtained from the induction medium of Chen (EE-Pk-Ch), the enzymatic extract of P. kudriavzevii ITMLB97 obtained from the induction medium of NM (EE-Pk-NM), the enzymatic extract of C. lusitaniae ITMLB85 obtained from the induction medium of Chen (EE-Cl-Ch), and the enzymatic extract of C. lusitaniae ITMLB85 obtained from the induction medium of NM (EE-Cl-NM) (Table 1). With each enzymatic extract, a Box–Behnken design was established in Statgraphics Centurion 18. For that, all the extracts were evaluated in 2 mL Eppendorf tubes with 1.5 mL of the reaction mixture composed of 1125 µL of sodium acetate buffer (pH= 5.5) with different sucrose (S) and glucose (G) concentrations (200, 400, and 600 g/L; 0, 300, and 600 g/L, respectively) at different times (0, 2, 6, 12, and 24 h), to which 375 µL of the corresponding enzymatic extract was added. The Eppendorf tubes were incubated for 24 h at 50 °C and 550 rpm. In addition, 50 µL aliquots were taken at the established times for TLC and HPAEC-PAD analyses. For the Box-Behnken designs, the response variables were FOS detection (1-kestose (K), blastose (B), inulobiose (Ib), 6-kestose (6K), levanobiose (Lb), and neokestose (nK)).
2.9. Fourier Transform Infrared (FT-IR) Spectroscopy
A Thermo Scientific Nicolet™ iS50 FTIR spectrometer was used for FT-IR analysis. The instrument features an attenuated total reflectance (ATR) diamond array. For analysis, 3 μL of each sample was taken during fermentation at 0, 24, 48, 120, and 192 h for each treatment, and the samples were separately placed on the plate. FT-IR spectra of the samples were collected in the 4000–600 cm−1 region, and 32 scans were recorded at a nominal resolution of 4 cm-1 in transmission mode (%T). All the generated data were analyzed by a Principal component analysis (PCA) and Orthogonal projections to latent structures (OPLS) on SIMCA-P (V.18) software. All the models were scaled by the unit variance (UV) method. OPLS models were cross-validated by permutation tests (100 permutations) with Q2 ≥ 0.40 and CV-ANOVA tests with p < 0.05.
2.10. Thin Layer Chromatography (TLC) Analysis
For sample preparation, 200 μL of each sample was concentrated in an Eppendorf Vacufuge Plus Concentrator for 5 h at 30 °C. Later, the samples were dissolved in 300 μL of water and sonicated. Then, 200 μL of absolute ethanol was added, and the samples were sonicated again. All the samples were prepared at 7 mg/mL, and 7 μL of each sample was applied to an aluminum foil silica sheet (Merck) with a CAMAG Automatic TLC sampler ATS4 under the following conditions: injection speed: 8 μL/s; predosage: 200 nL; retraction volume: 20 nL; dosing speed: 70 nL/s; rinse/vacuum cycles: 1/8 s; fill/empty cycles: 1/1 s; application length: 6 mm; separation between bands: 10 mm; and seventeen bands for sheet. For the standards, a total of 2 μL of each one was applied at 2 mg/mL (glucose, fructose, sucrose, 1-kestose, 1-nystose, and 1-F fructofuranosylnystose (DP5)). The sheets were developed into two mobile phases. First, the chamber was saturated for 20 min in the isopropanol-butanol-water-acetic acid phase (14:10:4:2 v/v). Afterward, the sheet was positioned in the chamber until the desired point was reached. When the sheet was dried, the chamber was saturated with the second phase of isopropanol-butanol-water-acetic acid-formic acid (14:10:4:1:1), and later, the same steps were followed Salomé-Abarca et al. [40]. When the TLC sheet was dried, it was developed with α-naphthol at 100 °C for 3 min or with aniline at 120 °C for 3 min. After that, the sheets were observed with a CAMAG TLC visualizer 2.
2.11. High-Performance Anion-Exchange Chromatography with Pulsed Amperometric Detection (HPAEC-PAD) Analyses
The FOS profiles were obtained via a DIONEX ICS-3000 chromatograph equipped with a precolumn (40x25 mm) and a DionexCarboPacTM PA-200 column (40x250 mm) maintained at 25 °C. The samples were adjusted to 1.75 mg/mL, and all the samples, including the standards, were filtered through a 0.22 μm nylon membrane (Millipore) before injection. A curve with standards (glucose, fructose, sucrose, 1-kestose, 1-nystose, and DP5) was generated. The separation elution and detection conditions were those reported by Salomé-Abarca et al. [40].
3. Results and Discussion
3.1. Physicochemical Analysis
There are notorious physicochemical differences between agave juices, which might be related to organ differences. Values of pH ranged from 5.02 to 5.51, the density ranged from 1.183 to 1.0483 g/mL, and the °Brix ranged from 4.8 to 10.8 (Table 2). Interestingly, all the values increased from the external (L and BL) to the internal (BS and P) regions of the plants. In line with our results, aguamiel obtained from agave pine heads tends to be acidic in pH [41]. For instance, the pH values of A. salmiana and Agave spp. are 4.37 and 6.43, respectively [42,43]. However, aguamiel can also display soft alkali characteristics, such as those of A. americana, with a pH of 7.72 [44]. The density and °Brix values for the aguamiel of A. americana ranged between 1.034 and 1.055 g/mL and 10° Brix, respectively [45]. These values were also in line with those observed in this study (10.8° Brix). However, °Brix variation has been reported to occur between 9.3 and 16 °Brix in the aguamiel of A. salmiana and Agave spp.; this variation could be related to agave age differences [46,47]. In addition, physicochemical variations in agave sap vary depending on the agave species [29,30,48,49], as well as the environmental conditions [50].
The moisture percentage in the agave juices varied between 92.08% and 96.76%. The moisture values in the aguamiel of A. atrovirens and Agave spp. were 87.38% and 90.04%, respectively. This indicated that the materials used in this study contained more water. The ash content in the juices used in this study ranged from 1.120-1.673% (Table 2). Other studies reported an ash content in the aguamiel of A. mapisaga of approximately 3.3±0.08% [51]. Ash values indicate mineral content, including K, Ca, Na, Fe, Cu, Mg, Se, and Zn, which means that our agave materials possess around half the mineral content of A. mapisaga [52].
The protein content of the P-juice was greater (41.28 μg/mL) than that of the BS, BL, and L juices. The protein content of the P-juice was twice as high as that of the L-juice. The protein percentage in the aguamiel of A. atrovirens is 3.5% (3.5 g/100 g) [42]. The use of the Lowry method results in values of 3.03-3.35% [53], which are superior to those reported in this study. The total phenolic content ranged from 2.06–3.80 μg/mL. The P and BS juices presented the highest phenolic contents among all the agave juices (Table 2). Studies of the aguamiel of A. atrovirens reported 3.02 GAE/g, whereas 2.26 GAE/g was reported for the aguamiel of A. salmiana [42,54].
Finally, TLC analyses of all the agave juices revealed differences in carbohydrate composition (Figure 1). The P-juice contained simple sugars such as fructose and glucose, the disaccharide sucrose, FOS molecules from DP3 to DP7, and HDP-fructans attached to the sample application point. Interestingly, BS juice was mainly composed of fructose, glucose and DP3 (kestose), whereas BL and L juices were mainly composed of glucose.
3.2. Yeast Growth Screening in Different Agave Juices
The capability of all the yeasts to grow in all the agave juices (P, BS, BL, or L) was tested by using them as part of their culture media. All tested yeasts did not grow in BL or L juices (Figure 2). Even if TLC analyses revealed the presence of simple sugars in BL and L juices, which might serve as substrates for yeast growth, there could be other metabolites in these tissues with antimicrobial properties. For example, polyphenols, saponins, and terpenes have been reported as common components of agave leaves, and they have also been reported to display antimicrobial properties [55], thus interfering with yeast development. On the other hand, C. lusitaniae ITMLB85, K. marxianus ITMLB106, and P. kudriavzevii ITMLB97 grew at 25 and 35 °C in P and BS juices. Nonetheless, these yeasts grew better in BS-juice, above 1x10⁷ cells/mL. Therefore, BS-juice, C. lusitaniae ITMLB85, K. marxianus ITMLB106, and P. kudriavzevii ITMLB97 were selected for subsequent tests.
3.3. Effects of Sucrose on FOS Production
From individual growth of K. marxianus ITMLB106, C. lusitaniae ITMLB85, and P. kudriavzevii ITMLB97, it was determined that the three yeasts were able to grow with all the tested sucrose concentrations in the media. However, a growth delay was observed as the sucrose concentration increased from 1.5 to 40% (Figure 3a-c). Through ANOVA and Tukey’s test (α=0.05) at 56 h, significant differences were found between the treatments of each yeast, represented by different letters as superscripts (Figure 3a–c).
In the case of C. lusitaniae ITMLB85 and P. kudriavzevii ITMLB97, the sucrose concentration and temperature had important effects on FOS production, especially for 20% sucrose at 30 and 37 °C, where a specific increase in nystose (DP4) was observed (Figure 3e,f,h,i). In this context, FOS production has been associated with the sucrose concentration. For instance, Gomes-Barbosa et al. [56] reported that increasing the sucrose concentration in the medium above 10% resulted in higher transferase activity of invertase from R. mucilaginosa and S. cerevisiae. Moreover, Muñiz-Marquez et al. [57] reported that FFase enzymes could have transfructosylation activity but only under relatively high sucrose concentrations in the medium. In the case of K. marxianus, ITMLB106 grew little (Figure 3b) and only showed glucose, fructose, and sucrose degradation but not FOS production. Thus, only C. lusitaniae ITMLB85 and P. kudriavzevii ITMLB97 were kept for further analyses. It is worth to mention, that the increase in FOS production in these two yeast was not very notorious. Therefore, other FOS production stimulant agents were further investigated.
3.4. Surfactants Effects on FOS Production
The cell growth of P. kudriavzevii ITMLB97 and C. lusitaniae ITMLB85 with surfactants is shown in Figure 4a,b, where different letters as superscripts indicate significant differences between the treatments through ANOVA and Tukey’s test at 72 h, with α=0.05.
In the past, the use of surfactants was reported as a strategy to increase the production of FOS [58]. Thus, to enhance the FTase activity of P. kudriavzevii ITMLB97 and C. lusitaniae ITMLB85, different surfactants, including SDS, DNa, Tween 80, and Triton X-100, were evaluated. The first two are considered ionic surfactants, whereas Tween 80 and Triton X-100 are nonionic. Both yeasts did not grow and died when the media with BS-juice contained SDS [10 mM], suggesting that this SDS concentration induced cellular lysis due to pore opening on the lipidic membrane of the yeast (Figure 4a,b). This was also reflected in the TLC profile of the yeast in this treatment, where no profile change was observed due to the death of the yeasts (Figure 4c,d), which was also confirmed under the microscope. All the treatments, except SDS, caused the consumption of glucose and fructose in the first 24 h by both microorganisms (Figures 4c–e).
Conversely, treatment with DNa in P. kudriavzevii ITMLB97 (Figure 4c) and treatment with Triton X-100 in C. lusitaniae ITMLB85 (Figure 4d) clearly increased FOS production over time. This increase occurred in DP3, DP4, DP5, and DP6, but it was more notable in DP4. Notably, the original BS-juice TLC profile showed mostly DP3, which also reinforces the production of FOS under these conditions. The use of surfactants in culture media affects the physiology of yeasts [59]. These agents positively affect membrane permeation, which has been reported for nonionic surfactants [60]. This might facilitate substrate incorporation in yeast cells and FOS release into the culture medium. Additionally, the permeation effects depend on the membrane sterol content [59,61], which varies depending on the yeast species, which might explain why different surfactants are best for each yeast species. With these results in hand, the next step was to test different carbon sources and nutrients to improve the production of FOS.
3.5. Effects of Carbon Sources and Nutrients on Yeast Growth and FOS Production
This step involved the use of different carbon sources, such as FOS, inulin and BS-juice, and nutrients variation in the culture of P. kudriavzevii ITMLB97 and C. lusitaniae ITMLB85. In the case of P. kudriavzevii ITMLB97, the use of FOS combined with nutrients from Di-phosta (Pk-FOS-di-phosta) resulted in greater yeast growth within the first 48 h than the other treatments did (Figure 5). In the case of C. lusitaniae ITMLB85, the use of BS-juice in combination with Forte nutrients (Cl-BS-forte) resulted in the highest yeast growth in a shorter time (48 h) than the other treatments did (Figure 5). In addition, significant differences between the treatments were identified through ANOVA and Tukey’s test at 192 h, with α=0.05.
Even if there are specific treatments with enhanced yeast growth, their FOS production must also be profiled. In this context, other analytical platforms that can provide deeper structural information should be employed. Thus, the first screening profile of the culture media of all the treatments was first scrutinized by FT-IR in the MIR range (600 – 4000 cm-1). The acquired spectra were extracted and subjected to multivariate data analysis via PCA. The data sets from P. kudriavzevii ITMLB97 and C. lusitaniae ITMLB85 were independently analyzed. In the case of P. kudriavzevii ITMLB97, the model produced 15 principal components (PCs), which explained 99% of the total variation in the model (RX2cum = 0.99). The model revealed that the main factor affecting the differentiation of the MIR profiles of all the treatments was the carbon source (Figure 6a). Therefore, the samples were clustered by carbon source along PC1 and PC2, which captured 41 and 32% of the variation in the model, respectively. Interestingly, samples of P. kudriavzevii ITMLB97 grown in chicory FOS and inulin were clustered together and separated into two subclusters. This might be explained by the fact that both chicory FOS and inulin possess the same structural configuration, that is, linear β(2→1) chains, thus exerting similar effects, which cause their clustering. The subclusters of these two treatments might be explained by nutrients variation in combination with effects caused by differences in DP between FOS and inulin. In the case of the BS-juice treatment, all its combinations with nutrients were clustered together, probably because there were no variations in the DP range, as one single source of agave fructans was used. This confirmed a differentiation between profiles caused by linear and branched fructans and by the DP range in the case of linear FOS and inulin. Similar results were observed when C. lusitaniae ITMLB85 data were analyzed by PCA. In this case, the model needed only five PCs to explain 95% of the total variation in the data set (RX2cum = 0.95). The model also needed three PCs to separate the samples properly; however, this model better separated the FOS, inulin, and BS juice treatments, mainly in PC3 (Figure 6b). The better separation between the FOS- and inulin-treated samples might indicate that C. lusitaniae ITMLB85 is not as affected as P. kudriavzevii ITMLB97 by differences in the DP range when it is used as a carbon source.
To further characterize and determine what infrared signals were correlated with the interaction of each microorganism, their carbon source, and nutrients, orthogonal projections to latent structure models were built. For this purpose, the MIR data were set as “X” data, whereas the time data were set as quantitative “Y” data. All the analyses revealed a correlation between the MIR variation as the culturing time passed by (Figure 6c–h). All the models were well validated (Q2 > 0.40 and p < 0.05). In the case of P. kudriavzevii ITMLB97, the best correlation models were those produced from inulin (Q2 = 0.93) and BS-juice (Q2 = 0.93), which had a highly significant effect (p < 0.0001) of the time on their MIR profiles. On the other hand, the FOS model was also validated, but it produced a lower Q2 (0.79) and p value (0.01); however, it was still validated. Similarly, for C. lusitaniae ITMLB85, the FOS model produced a Q2 of 0.55, whereas the inulin and BS models produced Q2 values of 0.95 and 0.94, respectively. These two models also obtained p < 0.0001. These results indicated that the composition of the culture medium changed with culture time, probably because of its metabolization by the yeasts. To get more insight into what was correlated to such changes, a VIPpred-plot was produced from each OPLS model. For P. kudriavzevii ITMLB97 fed FOS, the most correlated signals included wavenumbers between 975 and 985 cm-1 and signals around 831 cm-1. The same MIR range for the inulin model plus vibrations at 1335–1337 cm-1. For the BS-juice model, the bands at 975–985 cm-1 were also correlated signals plus signals at approximately 800 cm-1. The region conserved in the three models is close to bands associated with α- and β-anomers in cyclic carbohydrates [62], whereas signals around 831 cm-1 have been attributed to the α-configuration [63] but also to free fructose [64]. The signals near 1340 cm-1 are correlated with C–H bending vibrations [65], probably in the skeleton of carbohydrates. In the case of C. lusitaniae ITMLB85, the wavenumbers most correlated with FOS feeding over time were approximately 830 and 780 cm-1 related to free fructose and the α-configuration, which is in line with the FOS model of P. kudriavzevii ITMLB97. These findings suggest that FOS are metabolized in a similar way by both yeast species. Conversely, the inulin and BS-juice models presented wavenumbers between 913 and 923 cm-1, and the region between 870 and 877 cm-1 was distinctive for the BS-juice model. Bands at approximately 920 cm-1 have been detected in diverse polysaccharides, which strongly suggests the presence of and changes in fructans in the culture media [40]. These results indicate that even if P. kudriavzevii ITMLB97 and C. lusitaniae ITMLB85 similarly metabolize FOS, they metabolize inulin molecules and agavins [66] contained in the BS-juice differently. Thus, different carbon source metabolism products might be produced by different carbon sources and microorganisms. Such differences can be associated with structural (qualitative), quantitative or DP changes. Nonetheless, to confirm such changes, a more informative analytical platform is needed. Thus, the next step of this research consisted in the analysis of the samples by HPAEC-PAD.
In the case of yeast grown in media supplemented with inulin as a carbon source (Figure 7f), FOS synthesis occurred in the Pk-inulin-di-phosta, Pk-inulin-nutri-fast, and Pk-inulin-control treatments. The fructans produced were blastose, kestose, 6-kestose, inulobiose, and an unidentified oligosaccharide between DP5 and DP6. This result suggests the presence of the enzymes 1-SST and 6-SST [3]. As in another FOS growth conditions, inulin caused notable differences in the contents of glucose and fructose between the beginning and the end of the experiment. In addition, lower amounts of FOS were detected in the treatments with lower concentrations of glucose and fructose (Pk-inulin-multicel, Pk-inulin-forte, and Pk-inulin-plus-cel). The accumulation of those carbohydrates could be attributed to the hydrolysis of higher-DP fructans, but this was not observed in the chromatograms. In this context, the production of blastose, levanbiose, and inulobiose has been associated with the fast accumulation of glucose and fructose [17]. Conversely, Pk-inulin-di-phosta, Pk-inulin-nutri-fast, Pk-inulin-plus-cel, and Pk-inulin-control DP5 fructans were synthesized. Similarly, in the case of media with BS-juice as the carbon source (Figure 7), all the treatments resulted in blastose and inulobiose after 192 h of fermentation. Additionally, 6-kestose was detected mainly in Pk-inulin-fast, which indicates high 6-SST activity in the medium, which was probably enhanced by salts of ammonium, magnesium, calcium, and potassium present in the nutrient Nutri-fast formulation. The FFase from S. occidentalis, a yeast, has been reported to be a good 6-kestose synthetizer [7,20].
In the case of C. lusitaniae, the highest production of FOS was achieved under the growth conditions of the Cl-FOS-control (Figure 7d–f). This included higher abundances of kestose, blastose, inulobiose, 6-kestose, nystose, fructosylnystose, and FOS with DP > 5. This suggested that in addition to the 1-SST and 6-SST enzymes, 1-FFT actively participates in the production of FOS in this treatment. This, the best carbon source treatment for C. lusitaniae, was also characterized by chromatograms with high glucose and fructose contents at 192 h. Moreover, Cl-FOS-forte, Cl-FOS-nutri-fast, and Cl-FOS-plus-cel produced kestose, blastose, and inulobiose but not 6-kestose, whereas Cl-FOS-plus-cel produced nystose and fructosylnystose. Cl-FOS-di-phosta and Cl-FOS-multicel produced only blastose and inulobiose. On the other hand, all these treatments result in the production of isomeric FOS around DP5. In this context, to our knowledge, the first report of blastose production by the FFase of yeast mentioned the formation of this difructan by direct fructosylation of glucose [67]. Moreover, different forms of producing tri and tetrasaccharides have been described in species of Rhodotorula and Saccharomyces. For instance, 1- and 6-kestose have been reported to be produced by Rhodotorula dairenensis and S. cerevisiae [18,19]. Tetrasaccharides have been produced by R. dairenensis [18]. Interestingly, the production of nystose without kestose has been reported in S. cerevisiae CAT-1 and Rhodotorula mucilaginosa [56].
From the supplementation of C. lusitaniae with inulin (Figure 7e), only kestose, blastose, and 6-kestose were detected in the Cl-inulin-forte and Cl-inulin-control treatments. Thus, potassium, sodium, and ammonium salts favor the production of kestose. The ININBIO nutrients description is not precise about their concentration and specific composition; however, intracellular potassium and sodium concentrations are vital for cell growth and cellular functions, for example, maintaining electroneutrality, proper membrane potential and intracellular pH, as well as cell turgor and volume, protein synthesis, and enzyme activity. Specifically, S. cerevisiae can grow a broad range of concentrations of potassium (10–2.5 M) and sodium (up to 1.5 M). For this purpose, yeasts have developed different strategies to maintain proper monovalent cation homeostasis [68]. In addition, Park et al. [69] described the effect of ammonium ions, contained in the tested products, on fructosyltransferase activity, where they reported a reduction in the lag period of the reaction during FOS production.
Conversely, inulin was not a proper carbon source in combination with the Nutri-fast and Plus-cel formulas since no changes were observed in their carbohydrate profiles. Finally, C. lusitaniae ITMLB85 supplemented with BS-juice produced 6-kestose in all the treatments. However, Cl-JA-BS-plus-cel resulted in the highest production of this trisaccharide, which suggests increased 6-SST activity (Figure 7f). The nutrient Plus-cel contains potassium, sodium, magnesium and calcium. Magnesium is involved in several physiological functions, such as growth, cell division, enzyme activity, and structural stabilization of nucleic acids, polynucleotides, chromosomes, polysaccharides and lipids [70]. Moreover, Mg2+ is related to the proper structure of ribosomes [71]. The availability of Mg2+ in cell cultures and fermentation media influence the growth and metabolism of cells [72]. In Schizosaccharomyces pombe and Kluyveromyces fragilis, magnesium is considered the key transductor for the control of cell division by the microtubul assembly regulation [71]. On the other hand, Ca2+ antagonizes several Mg2+-dependent functions of yeast, such as growth and metabolism, through inhibitory competitive binding mechanisms [73]. Calcium is also needed by yeasts at concentrations ranging from 0.25–0.5 mM. If the calcium concentration exceeds 25 mM, growth inhibition will occur [74]. Yeasts have an important demand for Mg2+ but not Ca2+, which could be related to the fact that Mg2+ is considered essential for several glycolytic and fatty acid enzymes [73]. The addition of Mg2+ stabilizes biological membranes and is known for protecting yeast cells from stress caused by ethanol, temperature, and osmotic pressure [73].
3.5. Fructosyltransferase Enzyme Activity
FOS production was detected in the HPAEC-PAD chromatograms generated from the reactions with the enzymatic extracts of P. kudriavzevii ITMLB97 or C. lusitaniae ITMLB85 at 12 h (Figure 8a–d). When EE-Pk-Ch is used, 6-kestose is produced, and its peak can be observed in the 3Pk-Ch (G= 600 g/L, and S= 200 g/L) and 9Pk-Ch (G= 600 g/L, and S= 600 g/L) treatments, both of which correspond to 60% glucose in the medium, suggesting that high glucose concentrations are important for FOS production (Figure 8a). A similar phenomenon occurred with EE-Pk-NM; however, the peak of 6-kestose was clearer. In addition, in the 3Pk-NM (G= 600 g/L, and S= 200 g/L) and 9Pk-NM (G= 600 g/L, and S= 600 g/L) treatments, kestose and blastose were detected (Figure 8b). Therefore, the difference between the induction media (Ch and NM) is important for FOS production because both induce the production of some of the same molecules; however, the second one results in increased production. Therefore, obtaining efficient enzymatic extracts with fructosyltransferase activity requires an induction medium with optimal conditions. The differences between the Ch and NM induction media consisted of the concentrations of the yeast extract, peptone, and sucrose, as well as the use of distinct salts, whereas the Ch induction medium uses MgSO₄·7H₂O, the NM induction medium uses Di-phosta nutrients ((NH4)2HPO4). Suggesting that ammonium could increase fructosyltransferase activity. This phenomenon has previously been observed as a 15-fold increase in fructosyltransferase activity [69]. In addition, phosphate is one of the most important nutrients for microbes, not only because it is the main source of free energy required for many cellular processes but also because it forms parts of nucleotides, phospholipids, and nucleic acids. All the above could promote the fructosyltransferase activity of the enzymes present in the EE-Pk-NM. Thus, comparing Figure 8a,b it is observed increases FOS production.
In the case of C. lusitaniae ITMLB85, when EE-Cl-Ch was employed, a large peak of 6-kestose was detected in 5Cl-CH (G= 300 g/L and S= 400 g/L). Additionally, kestose, blastose and an unknown DP5/DP6 FOS were detected. The same qualitative results were obtained by using EE-Cl-NM. In this context, Gomes-Barbosa et al. [56] reported a positive association between sucrose concentration (0–20%) and FOS production by yeast FFase. Surprisingly, when EE-Cl-NM was used, 1Cl-NM (0 g/L glucose and 200 g/L sucrose) did not show any FOS production. Furthermore, another important difference is that fructosyltransferase activity varies depending on the yeast used, resulting in better FOS production with C. lusitaniae ITMLB85 (Figure 8b,d). There are reports of fructosyltransferase activity in yeasts, among which the fructosyltransferase activity of Candida has been reported [75,76].
The chromatograms of both induction media for P. kudriavzevii ITMLB97 and C. lusitaniae ITMLB85 at 0 and 24 h of fermentation revealed FOS production (Figure 8e–h). Blastose was produced when EE-Pk-Ch conditions were applied to 6Pk-CH (G= 600 g/L and S= 400 g/L) at 24 h. The same occurred with EE-Pk-NM under 6Pk-NM (G= 600 g/L and S= 400 g/L) treatment conditions and even at lower glucose and sucrose concentrations in 2Pk-NM (G= 300 g/L and S= 200 g/L). On the other hand, Figure 8g,h shows the chromatograms obtained when the enzymatic extracts of C. lusitaniae were used. Interestingly, 6-kestose was produced when EE-Cl-Ch was used for 2Cl-Ch (G= 300 g/L, and S= 200 g/L) treatment at 24 h, and 8Cl-Ch (G= 300 g/L, and S= 600 g/L) was produced at 0 h (Figure 8g). In addition, kestose and blastose were detected in the 2Cl-Ch (G= 300 g/L, and S= 200 g/L), 6Cl-Ch (G= 600 g/L, and S= 400 g/L), and 8Cl-Ch (G= 300 g/L, and S= 600 g/L) treatments at 0 and 24 h. Figure 8h shows the production of kestose, blastose, and 6-kestose, as well as the unknown FOS with DPs between DP5-DP6 in the 2Cl-NM (G= 300 g/L, and S= 200 g/L), and the 6Cl-NM (G= 600 g/L, and S=400 g/L) treatments at 0 and 24 h.
The effects of the enzymatic extracts obtained from different induction media and yeasts on FOS production were evaluated. Samples obtained from individual Box‒Behnken designs were analyzed via HPAEC-PAD, and all the signals generated by the ICS-3000 in the FOS region were analyzed through the RS generated. Figure 9 shows the RS generated by the distinct enzymatic extracts of P. kudriavzevii ITMLB97 and C. lusitaniae ITMLB85. Figure 9a,b contrasts the RS for FOS production with EE-Pk-Ch and EE-Pk-NM, where the production of kestose, blastose, inulobiose, 6-kestose, and levanobiose is favored when EE-Pk-NM is used. On the other hand, the RS for FOS production employing EE-Cl-Ch and EE-Cl-NM indicated that the production of blastose and 6-kestose improved with the use of EE-Cl-NM plus a slight increase in the production of levanbiose and neokestose. By analyzing the Pareto plots using the HPAEC FOS region in response to different enzymatic extracts, principal standardized effects were determined. In the plots, a reference line indicates statistically significant effects. In the Pareto plots, A= sucrose, B= glucose and C= time; combinations of these variables or squares of each one can also occur. When EE-Pk-Ch was used, the positive effects are shown in the following order for each carbohydrate: kestose (glucose > AA > CC), blastose (glucose > time > glucose-time interaction), levanobiose (glucose > BB), and neokestose (glucose). In the case of EE-Pk-NM, positive effects on the levels of kestose (glucose > time) and blastose (glucose > time > BC) were detected. For EE-Cl-Ch, positive effects were detected for kestose (glucose), blastose (glucose > time > BC > BB > CC), and levanobiose (glucose). The Pareto plot also revealed positive effects on EE-Cl-NM for kestose (AA > blastose > glucose > BC > BB), 6-kestose (glucose > BB), and levanobiose (sucrose > glucose > AB > CC > time, AA > BC > BB). All positive effects described were statistically significant (p < 0.05). Interestingly, for blastose, the glucose-time interaction was determined to have a positive effect independent of the enzymatic extracts, which highlights the importance of such interaction on the production of this difructan.
Each Box–Behnken design established for every induction medium with yeasts allow to find the optimal conditions of the factors evaluated to produce FOS (sucrose and glucose concentrations and time) and optimize the detection signals of products in the FOS region (kestose, blastose, inulobiose, 6-kestose, levanobiose, and neokestose) within the established conditions of the study. The production of kestose is greater with EE-Cl-Ch. The Box–Behnken design for this induction medium suggests that the optimal kestose production (9.67 nC) will be reached at S= 385.84 g/L and G= 600 g/L at 24 h (Table 3). On the other hand, the difructan inulobiose is highly presented with the EE-Pk-NM, and the optimal conditions for its higher production (115.07 nC) are S= 600 g/L and G= 600 g/L at 21.90 h. Moreover, the disacharides blastose and levanobiose are favored by the EE-Cl-NM. The Box–Behnken design for this induction medium suggests that the blastose optimal production (8.98 nC) will reach S= 200.20 g/L and G= 600 g/L at 24 h, whereas for levanobiose (1.21 nC), the conditions are S= 596.08 g/L and G= 599.90 g/L at 24 h. In addition, the FOS production of 6-kestose and neokestose are also favored by EE-Cl-NM. For 6-kestose, the optimal production (91.25 nC) will be reached at S= 200 g/L and G= 600 g/L at 10.35 h, whereas for neokestose (1.91 nC), the optimal conditions are S= 600 g/L and G= 0 g/L at 11.23 h. Therefore, most of the products in the FOS region (blastose, 6-kestose, levanobiose and neokestose) are produced when EE-Cl-NM is used. It is important to mentione that the optimal conditions for blastose and 6-kestose production with EE-Cl-NM are the same for S= 200 g/L and G= 600 g/L. Hence, the use of NM induction medium is a good option for obtaining enzymatic extracts for fructosyltransferase activity from both yeasts because it increases the production of most of the products in the FOS region. However, it is important to note that the most improved activity was the 6-SST, which resulted in the formation of 6-kestose. The next favored product was blastose, and its production has been associated with fructosyltransferase activity, specifically in levansucrases [15,17]. The difference between these products is that when fructosylation occurs in the case of the 6-kestose, the fructosyl is linked to the 6-carbon of the fructose in the sucrose, and when blastose is formed, the fructosyl is linked to the 6-carbon of the glucose. Blastose and 6-kestose have a β(2→6) link, which could be associated with improved effects on biological functions and increased prebiotic potential [7,18]. Blastose is considered the base of neoFOS and blasto-FOS [15,17].
5. Conclusions
Juices obtained from Agave sp. grown at Cuitzeo Lake in Michoacán display unusual DP compared with other reported agave juices. This might be related to distinctive geographical features of the region, such as high soil conductivity. The variation of such agave juices also depends on organ effects, resulting in each organ having different physicochemical properties, which impact their ability to serve as a growing medium for agave yeasts. Among them, BS-juice is an ideal base for culture medium for the development of C. lusitaniae ITMLB85, K. marxianus ITMLB106, and P. kudriavzevii ITMLB97. The sucrose concentration is a determining factor for the effects of FOS production on yeast fructosyltransferase activity. Increases between 1.5% and 20% of sucrose in the culture medium of P. kudriavzevii ITMLB97 and C. lusitaniae ITMLB85 increases the amount of synthesized FOS. On the other hand, increases of up to 40% in sucrose did not result in an increase in the production of FOS under the studied conditions. In general, the surfactants DNa, Tween 80, and Triton X-100 at 10 mM maintain or promote yeast fructosyltransferase activity for FOS production. Conversely, SDS at 10 mM kills yeast via cellular lysis, which results in the null production of FOS. The use of different carbon sources, such as FOS, inulin, and jugo-BS, corroborated the fructosyltransferase activity of the yeasts P. kudriavzevii ITMLB97 and C. lusitaniae ITMLB85. This included 1-SST and 6-SST enzymatic activity. Box‒Behnken designs allowed the identification of optimal conditions to produce some disaccharides and FOS. When EE-Pk-Ch was used as the growth medium, the best conditions to produce 6-kestose, levanobiose, and neokesose were S= 600 g/L and G= 600 g/L at 12.91, 15.43, and 12.39 h, respectively. EE-Pk-NM and EE-Cl-Ch presented different sucrose and glucose concentrations to produce each carbohydrate. However, EE-Pk-NM is the best to produce inulobiose at S= 600 g/L and G= 600 g/L glucose, with maximum production occurring at 21.90 h. On the other hand, EE-Cl-Ch is the best at producing kestose at S= 385.84 g/L and G= 600 g/L at 24 h. NM induction medium is the best option to obtain enzymatic extracts with fructosyltransferase activity from P. kudriavzevii ITMLB97 and C. lusitaniae ITMLB85. This induction medium increases the production of most compounds in the chromatographic FOS region. The EE-Cl-NM produced the highest contents of blastose, 6-kestose, levanobiose, and neokestose. For blastose and 6-kestose in this medium, the best conditions were S= 200 g/L and G= 600 g/L. These results provide the basis for low DP fructan production, especially in the 3–6 DP range, which could be a valuable prebiotic source.
Supplementary Materials
The following supporting information can be downloaded at the website of this paper posted on Preprints.org: Figure S1: The agave was dissected in leaf (L), base of the leaf (BL), base of the scape (BS), and pine head (P); Figure S2: HPAEC-PAD chromatograms of the treatments established by the Box‒Behnken design for enzymatic extract reactions (P. kudriavzevii ITMLB97 or C. lusitaniae ITMLB85) with distinct induction media: (a, e) EE-Pk-Ch, (b, f) EE-Pk-NM, (c, g) EE-Cl-Ch, and (d, h) EE-Cl-NM. Figures (a-d) show the products in treatments 1, 3, 5, 7, and 9 at 12 h (indicated by 4), whereas Figures (e-h) show the products in treatments 2, 4, 6, and 8 at 0 and 24 h (indicated by 1 and 5). G= glucose, F= fructose, K= blastose, Ib= inulobiose, 6K= 6-kestose, nK= neokestose
Author Contributions
Y.B.-I.: conceptualization, investigation, methodology, visualization, and writing—original draft preparation. L.F.S.-A.: conceptualization, investigation, methodology, visualization, and writing—review and editing. M.G.L.: conceptualization, supervision, resources, funding acquisition, project administration, and writing—review and editing. J.C.G.-H.: conceptualization, supervision, resources, funding acquisition, project administration, and writing—review and editing. All the authors have read and agreed to the published version of the manuscript.
Funding
This research was funded by Tecnológico Nacional de México grants 13650.22-P, 13773.22-P, and 16817.23-P and Cinvestav Zacatenco Federal Institutional funding.
Data Availability Statement
Not applicable.
Acknowledgments
To Tecnológico Nacional de México / Instituto Tecnológico de Morelia for the authorization of the scholarship-commission license for Yadira Belmonte Izquierdo, as well as Cinvestav Unidad Irapuato for the investigation stay for doctoral studies and for all the materials and analytical equipment available to perform this research. In addition, we are grateful to D.C. Clarita Olvera Carranza for blastoses standard, and D.C. Norio Shiomi and Midori Yoshida for DP´3s standard, as well as ININBIO for the donation of yeast nutrients.
Conflict of Interest
The authors declare no conflicts of interest.
Abbreviations
The following abbreviations are used in this manuscript:
| FOS | Fructooligosaccharides |
| DP | Degree polymerization |
| HDP | High polymerization degree |
| FTase | Fructosyltransferase |
| FFase | β-fructofuranosydase |
| 1F-FOS | Inulin type FOS |
| 6F-FOS | Levan type FOS |
| 1,6F-FOS | Graminan type FOS |
| 6G-FOS | Neo-levan type FOS |
| aFOS | Agavin-FOS |
| RSM | Response surface methodologies |
| P | Pine head |
| BS | Base of the scape |
| BL | Base of the leaf |
| L | Leaf |
| P-juice | Pine head juice |
| BS-juice | Base of the scape juice |
| BL-juice | Base of the leaf juice |
| L-juice | Leaf juice |
| TLC | Thin Layer Chromatography |
| YPD | Yeast Peptone Dextrose medium |
| YPDE | Enriched Yeast Peptone Dextrose medium |
| SDS | Sodium dodecyl sulfate |
| DNa | Sodium deoxycholate |
| FT-IR | Fourier Transform Infrared Spectroscopy |
| HPAEC-PAD | High-Performance Anion-Exchange Chromatography with Pulsed Amperometric Detection |
| ATR | Attenuated Total Reflectance |
| PCA | Principal Components Analysis |
| OPLS | Orthogonal Projections to Latent Structures |
| MIR | MID-infrared spectroscopy |
| PC | Principal Components |
| RS | Response Surface |
References
- Singh, R.S.; Singh, R.P.; Kennedy, J.F. Recent insights in enzymatic synthesis of fructooligosaccharides from inulin. Int. J. Biol. Macromol. 2016, 85, 565–572. [Google Scholar] [CrossRef] [PubMed]
- Banguela, A.; Hernández, L. Fructans: From natural sources to transgenic plants. Biotecnol. Apl. 2006, 23, 202–210. [Google Scholar]
- Belmonte-Izquierdo, Y.; Salomé-Abarca, L.F.; González-Hernández, J.C.; López, M.G. Fructooligosaccharides (FOS) production by microorganisms with fructosyltransferase activity. Fermentation, 2023, 9, 968. [Google Scholar] [CrossRef]
- Antošová, M.; Polakovič, M. Fructosyltransferases: The enzymes catalyzing production of fructooligosaccharides. Chem. Pap. 2001, 55, 350–358. [Google Scholar]
- Straathof, A.J.; Kieboom, A.P.; van Bekkum, H. Invertase-catalyzed fructosyl transfer in concentrated solutions of sucrose. Carbohydr. Res. 1986, 146, 154–159. [Google Scholar] [CrossRef] [PubMed]
- Huazano-García, A.; López, M.G. Enzymatic hydrolysis of agavins to generate branched fructooligosaccharides (a-FOS). Appl. Biochem. Biotechnol. 2018, 184, 25–34. [Google Scholar] [CrossRef]
- Rodrigo-Frutos, D.; Piedrabuena, D.; Sanz-Aparicio, J.; Fernández-Lobato, M. Yeast cultures expressing the Ffase from Schwanniomyces occidentalis, a simple system to produce the potential prebiotic sugar 6-kestose. Appl. Microbiol. Biotechnol. 2019, 103, 279–289. [Google Scholar] [CrossRef]
- Gimeno-Pérez, M.; Linde, D.; Fernández-Arrojo, L.; Plou, F.J.; Fernández-Lobato, M. Heterologous overproduction of β-fructofuranosidase from yeast Xanthophyllomyces dendrorhous, an enzyme producing prebiotic sugars. Appl. Microbiol. Biotechnol. 2015, 99, 3459–3467. [Google Scholar] [CrossRef]
- Huazano-García, A.; Silva-Adame, M.B.; Vázquez-Martínez, J.; Gastelum-Arellanez, A.; Sánchez-Segura, L.; López, M.G. Highly branched neo-fructans (Agavins) attenuate metabolic endotoxemia and low-grade inflammation in association with gut microbiota modulation on high-fat diet-fed mice. Foods. 2020, 9, 1792. [Google Scholar] [CrossRef]
- De la Rosa, O.; Flores-Gallegos, A.C.; Muñíz-Marquez, D.; Nobre, C.; Contreras-Esquivel, J.C.; Aguilar, C.N. Fructooligosaccharides production from agro-wastes as alternative low-cost source. Trends Food Sci. Technol. 2019, 91, 139–146. [Google Scholar] [CrossRef]
- Nguyen, T.T. The cholesterol-lowering action of plant stanol esters. J. Nutr. 1999, 129, 2109–2112. [Google Scholar] [CrossRef] [PubMed]
- Wang, Y.; Zeng, T.; Wang, S.E.; Wang, W.; Wang, Q.; Yu, H.X. Fructo-oligosaccharides enhance the mineral absorption and counteract the adverse effects of phytic acid in mice. J. Nutr. 2010, 26, 305–311. [Google Scholar] [CrossRef] [PubMed]
- Costa, G.T.; Vasconcelos, Q.D.; Aragão, G.F. Fructooligosaccharides on inflammation, immunomodulation, oxidative stress, and gut immune response: A systematic review. Nutr. Rev. 2022, 80, 709–722. [Google Scholar] [CrossRef]
- Roberfroid, M. Prebiotics: The concept revisited1. J. Nutr. 2007, 137, 830S–837S. [Google Scholar] [CrossRef]
- Miranda-Molina, A.; Castillo, E.; Munguia, A.L. A novel two-step enzymatic synthesis of blastose, a β-d-fructofuranosyl-(2↔ 6)-d-glucopyranose sucrose analog. Food Chem. 2017, 227, 202–210. [Google Scholar] [CrossRef] [PubMed]
- Sato, K.; Nagai, N.; Yamamoto, T.; Mitamura, K.; Taga, A. Identification of a functional oligosaccharide in maple syrup as a potential alternative saccharide for diabetes mellitus patients. Int. J. Mol. 2019, 20, 5041. [Google Scholar] [CrossRef]
- Raga-Carbajal, E.; López-Munguía, A.; Alvarez, L.; Olvera, C. Understanding the transfer reaction network behind the nonprocessive synthesis of low molecular weight levan catalyzed by Bacillus subtilis levansucrase. Sci. Rep. 2018, 8, 15035. [Google Scholar] [CrossRef]
- Gutiérrez-Alonso, P.; Fernández-Arrojo, L.; Plou, F.J.; Fernández-Lobato, M. Biochemical characterization of a β-fructofuranosidase from Rhodotorula dairenensis with transfructosylating activity. FEMS Yeast Res. 2009, 9, 768–773. [Google Scholar] [CrossRef]
- Farine, S.; Versluis, C.; Bonnici, P.; Heck, A.; L'homme, C.; Puigserver, A.; Biagini, A. Application of high performance anion exchange chromatography to study invertase-catalyzed hydrolysis of sucrose and formation of intermediate fructan products. Appl. Microbiol. Biotechnol. 2001, 55, 55–60. [Google Scholar] [CrossRef]
- Alvaro-Benito, M.; de Abreu, M.; Fernández-Arrojo, L.; Plou, F.J.; Jiménez-Barbero, J.; Ballesteros, A.; Polaina, J.; Fernández-Lobato, M. Characterization of a β-fructofuranosidase from Schwanniomyces occidentalis with transfructosylating activity yielding the prebiotic 6-kestose. J. Biotechnol. 2007, 132, 75–81. [Google Scholar] [CrossRef]
- Kilian, S.G.; Sutherland, F.C.W.; Meyer, P.S.; Du Preez, J.C. Transport-limited sucrose utilization and neokestose production by Phaffia rhodozyma. Biotechnol. Lett. 1996, 18, 975–980. [Google Scholar] [CrossRef]
- Kritzinger, S.M.; Kilian, S.G.; Potgieter, M.A.; Du Preez, J.C. The effect of production parameters on the synthesis of the prebiotic trisaccharide, neokestose, by Xanthophyllomyces dendrorhous (Phaffia rhodozyma). Enzyme Microb. Technol. 2003, 32, 728–737. [Google Scholar] [CrossRef]
- Chen, J.; Chen, X.; Xu, X.; Ning, Y.; Jin, Z.; Tian, Y. Biochemical characterization of an intracellular 6G-fructofuranosidase from Xanthophyllomyces dendrorhous and its use in production of neo-fructooligosaccharides (neo-FOSs). Bioresour. Technol. 2011, 102, 1715–1721. [Google Scholar] [CrossRef]
- Schorsch, J.; Castro, C.C.; Couto, L.D.; Nobre, C.; Kinnaert, M. Optimal control for fermentative production of fructooligosacharides in fed-batch bioreactor. J. Process Control. 2019, 78, 124–138. [Google Scholar] [CrossRef]
- Magri, A.; Oliveira, M.R.; Baldo, C.; Tischer, C.A.; Sartori, D.; Mantovani, M.S.; Celligoi, M.A.P.C. Production of fructooligosaccharides by Bacillus subtilis natto CCT7712 and their antiproliferative potential. J. Appl. Microbiol. 2020, 128, 1414–1426. [Google Scholar] [CrossRef] [PubMed]
- Lopez, M.G.; Mancilla-Margalli, N.A.; Mendoza-Díaz, G. Molecular structures of fructans from Agave tequilana Weber var. azul. J. Agric. Food Chem. 2003, 51, 7835–7840. [Google Scholar] [CrossRef]
- Sanchez-Marroquin, A.; Hope, P.H. Agave juice, fermentation and chemical composition studies of some species. J. Agric. Food Chem. 1953, 1, 246–249. [Google Scholar] [CrossRef]
- García-Mendoza, A.J. Flora del Valle de Tehuacán-Cuicatlán. Agavaceae. Fascículo. 2011; 88, 1-95.
- Isabel Enríquez-Salazar, M.; Veana, F.; Aguilar, C.N.; De la Garza-Rodríguez, I.M.; López, M.G.; Rutiaga-Quinones, O.M.; Morlett-Chávez, J.A.; Rodríguez-Herrera, R. Microbial diversity and biochemical profile of aguamiel collected from Agave salmiana and A. atrovirens during different seasons of year. Food Sci. Biotechnol. 2017, 26, 1003–1011. [Google Scholar] [CrossRef]
- Vicente-Magueyal, F.J.; Bautista-Méndez, A.; Villanueva-Tierrablanca, H.D.; García-Ruíz, J.L.; Jiménez-Islas, H.; Navarrete-Bolaños, J.L. Novel process to obtain agave sap (aguamiel) by directed enzymatic hydrolysis of agave juice fructans. LWT. 2020, 127, 109387. [Google Scholar]
- Picazo, B.; Flores-Gallegos, A.C.; Muñiz-Márquez, D.B.; Flores-Maltos, A.; Michel-Michel, M.R.; de la Rosa, O.; Rodriguez-Jasso, R.M.A.I.; Rodriguez, R.; Aguilar-González, C.N. Enzymes for fructooligosaccharides production: Achievements and opportunities. Enzymes in Food Biotechnology; Kuddus, M., Ed.; Academic Press: Cambridge, MA, USA, 2019; pp. 303–320. [Google Scholar]
- Bocco, G.; López-Granados, E.; Mendoza, M.E. La investigación ambiental en la cuenca del Lago de Cuitzeo: Una revisión de la bibliografía publicada. Contribuciones para el desarrollo sostenible de la cuenca del lago de Cuitzeo, Michoacán. 2012. 317-345.
- Alcocer, J.; Hammer, U.T. Saline lake ecosystems of Mexico. AEHMS. 1998, 1, 291–315. [Google Scholar] [CrossRef]
- Martínez-Pantoja, M.A.; Alcocer, J.; Maeda-Martínez, A.M. On the Spinicaudata (Branchiopoda) from Lake Cuitzeo, Michoacán, México: First report of a clam shrimp fishery. Hydrobiologia, 2002, 486, 207–213. [Google Scholar] [CrossRef]
- Ferreira, S.L.C.; Bruns, R.E.; da Silva, E.G.P.; Dos Santos, W.N.L.; Quintella, C.M.; David, J.M.; de Andrade, J.B.; Breitkreitz, M.C.; Jardim, I.C.S.F.; Neto, B.B. Statistical designs and response surface techniques for the optimization of chromatographic systems. J. Chromatogr. A 2007, 1158, 2–14. [Google Scholar] [CrossRef] [PubMed]
- Sharifi, A.; Montazerghaem, L.; Naeimi, A.; Abhari, A.R.; Vafaee, M.; Ali, G.A.; Sadegh, H. Investigation of photocatalytic behavior of modified ZnS: Mn/MWCNTs nanocomposite for organic pollutants effective photodegradation. J Environ Manage. 2019, 247, 624–632. [Google Scholar] [CrossRef] [PubMed]
- Song, L.; Yu, X.; Xu, B.; Pang, R.; Zhang, Z. 3D slope reliability analysis based on the intelligent response surface methodology. Bull. Eng. Geol. Environ. 2021, 80, 735–749. [Google Scholar] [CrossRef]
- Mellado-Mojica, E.; López, M.G. Fructan metabolism in A. tequilana Weber Blue variety along its developmental cycle in the field. J. Agric Food Chem. 2012, 60, 11704–11713. [Google Scholar] [CrossRef]
- Chen, J.; Chen, X.; Xu, X.; Ning, Y.; Jin, Z.; Tian, Y. Biochemical characterization of an intracellular 6G-fructofuranosidase from Xanthophyllomyces dendrorhous and its use in production of neo-fructooligosaccharides (neo-FOSs). Bioresour. Technol. 2011, 102, 1715–1721. [Google Scholar] [CrossRef]
- Salomé-Abarca, L.F.; Márquez-López, R.E.; Santiago-García, P.A.; López, M.G. HPTLC-based fingerprinting: An alternative approach for fructooligosaccharides metabolism profiling. CRFS. 2023, 6, 100451. [Google Scholar] [CrossRef]
- Lappe-Oliveras, P.; Moreno-Terrazas, R.; Arrizón-Gaviño, J.; Herrera-Suárez, T.; García-Mendoza, A.; Gschaedler-Mathis, A. Yeasts associated with the production of Mexican alcoholic nondistilled and distilled Agave beverages. FEMS Yeast Res. 2008, 8, 1037–1052. [Google Scholar] [CrossRef]
- Romero-López, M.R.; Osorio-Díaz, P.; Flores-Morales, A.; Robledo, N.; Mora-Escobedo, R. Chemical composition, antioxidant capacity and prebiotic effect of aguamiel (Agave atrovirens) during in vitro fermentation. RMIQ. 2015, 14, 281–292. [Google Scholar]
- Muñiz-Márquez, D.B.; Rodríguez-Jasso, R.M.; Rodríguez-Herrera, R.; Contreras-Esquivel, J.C.; Aguilar-González, C.N. Producción artesanal del aguamiel: una bebida tradicional mexicana. Rev. Cient. UadeC. 2013, 5. [Google Scholar]
- Bautista, N.; Arias, G.C. Bromatological chemical study about the aguamiel of Agave americana L. (Maguey). Cienc. Investig. 2008.
- Chagua Rodríguez, P.; Malpartida Yapias, R.J.; Ruíz Rodríguez, A. Tiempo de pasteurización y su respuesta en las características químicas y de capacidad antioxidante de aguamiel de Agave americana L. Rev. Investig. Altoandin. 2020, 22, 45–57. [Google Scholar] [CrossRef]
- Rascón, L.; Cruz, M.; Rodríguez-Jasso, R.M.; Neira-Vielma, A.A.; Ramírez-Barrón, S.N.; Belmares, R. Effect of Ohmic Heating on Sensory, Physicochemical, and Microbiological Properties of “Aguamiel” of Agave salmiana. Foods. 2020, 9, 1834. [Google Scholar] [CrossRef] [PubMed]
- Valadez-Blanco, R.; Bravo-Villa, G.; Santos-Sánchez, N.F.; Velasco-Almendarez, S.I.; Montville, T.J. The Artisanal Production of Pulque, a Traditional Beverage of the Mexican Highlands. Probiotics Antimicrob. Proteins. 2012, 4, 140–144. [Google Scholar] [CrossRef]
- Bland-Sutton, J. ON PULQUE AND PULQUE-DRINKING IN MEXICO. The Lancet. 1912, 179, 43–46. [Google Scholar] [CrossRef]
- Noriega-Juárez, A.D.; Meza-Espinoza, L.; García-Magaña, M.D.L.; Ortiz-Basurto, R.I.; Chacón-López, M.A.; Anaya-Esparza, L.M.; Montalvo-González, E. Aguamiel, a Traditional Mexican Beverage: A Review of Its Nutritional Composition, Health Effects and Conservation. Foods. 2025, 14, 134. [Google Scholar] [CrossRef]
- Álvarez-Ríos, G.; Figueredo-Urbina, C.J.; Casas, A. Physical, chemical, and microbiological characteristics of pulque: Management of a fermented beverage in Michoacán, Mexico. Foods. 2020, 9, 361. [Google Scholar] [CrossRef]
- Ortiz-Basurto, R.I.; Pourcelly, G.; Doco, T.; Williams, P.; Dornier, M.; Belleville, M.P. “Analysis of the main components of the aguamiel produced by the maguey-pulquero (Agave mapisaga) throughout the harvest period”. J. Agric. Food Chem. 2008, 56, 3682–3687. [Google Scholar] [CrossRef]
- Peralta-García, I.; González-Muñoz, F.; Elena, R.A.M.; Sánchez-Flores, A.; López Munguía, A. Evolution of fructans in Aguamiel (Agave Sap) during the plant production lifetime. Front. nutr. 2020, 7, 566950. [Google Scholar] [CrossRef]
- Espíndola-Sotres, V.; Trejo-Márquez, M.A.; Lira-Vargas, A.A.; Pascual-Bustamante, S. Caracterización de aguamiel y jarabe de agave originario del Estado de México, Hidalgo y Tlaxcala. IDCYTA. 2018, 3, 522–528. [Google Scholar]
- Tovar, R.C.; Perales, S.C.; Nava, C.A.; Valera, M.L.; Gomez, L.J.; Guevara, L.F.; Hernández, D.J. and Silos, H.E. Effect of aguamiel (Agave sap) on hematic biometry in rabbits and its antioxidant activity determination. Ital. J. Anim. Sci. 2011, 10, 10–21. [Google Scholar]
- López-Romero, J.C.; Ayala-Zavala, J.F.; González-Aguilar, G.A.; Peña-Ramos, E.A.; González-Ríos, H. Biological activities of Agave by-products and their possible applications in food and pharmaceuticals. J. Sci. Food Agric. 2018, 98, 2461–2474. [Google Scholar] [CrossRef] [PubMed]
- Gomes-Barbosa, P.M.; Pereira, T.; Aparecida, C.; da Silva Santos, F.R.; Lisbo, N.F.; Fonseca, G.G.; Leite, R.S.R.; da Paz, M.F. Biochemical characterization, and evaluation of invertases produced from Saccharomyces cerevisiae CAT-1 and Rhodotorula mucilaginosa for the production of fructooligosaccharides. Prep. Biochem. Biotechnol. 2018, 48, 506–513. [Google Scholar] [CrossRef]
- Muñiz-Márquez, D.B.; Contreras, J.C.; Rodríguez, R.; Mussatto, S.I.; Teixeira, J.A.; Aguilar, C.N. Enhancement of fructosyltransferase and fructooligosaccharides production by A. oryzae DIA-MF in Solid-State Fermentation using aguamiel as culture medium. Bioresour. Technol. 2016, 213, 276–282. [Google Scholar] [CrossRef] [PubMed]
- García-Pérez, M.C. “Identificación de la fructosiltransferasa involucrada en la síntesis de fructanos ramificados de plantas micropropagadas de Agave tequilana Weber var. Azul”. Tesis doctoral. Cinvestav Unidad Irapuato. 2015.
- Laouar, L.; Lowe, K.C.; Mulligan, B.J. Yeast responses to nonionic surfactants. Enzyme Microb. Technol. 1996, 18, 433–438. [Google Scholar] [CrossRef]
- King, A.T.; Davey, M.R.; Mellor, I.R.; Mulligan, B.J.; Lowe, K.C. Surfactant effects on yeast cells. Enzyme Microb. Technol. 1991, 13, 148–153. [Google Scholar] [CrossRef]
- Alonso, A.; Urbaneja, M.-A.; Goñi, F.M.; Carmona, F.G.; Cánovas, F.G.; Gómez-Fernández, J.C. Kinetic studies on the interaction of phosphatidylcholine liposomes with Triton X-100. BBA–Biomembranes. 1987, 902, 237–246. [Google Scholar] [CrossRef]
- Urbanski, T.; Hofman, W.; Witanowski, M. The infrared spectra of some carbohydrates. Bull. Acad. Polon. Sci. 1959, 7, 619–624. [Google Scholar]
- Hong, T.; Yin, J.Y.; Nie, S.P.; Xie, M.Y. Applications of infrared spectroscopy in polysaccharide structural analysis: Progress, challenge and perspective. Food Chem. X. 2021, 12, 100168. [Google Scholar] [CrossRef]
- Mondragón-Cortez, P.M.; Herrera-López, E.J.; Arriola-Guevara, E.; Guatemala-Morales, G.M. Application of Fourier Transform Infrared Spectroscopy (FTIR) in combination with Attenuated Total Reflection (ATR) for rapid analysis of the tequila production process. Rev. Mex. Ing. Quím. 2022, 21, Alim2806. [Google Scholar] [CrossRef]
- Tipson, R.S. Infrared Spectroscopy of Carbohydrates: A Review of the Literature, report. United States-Government Printing Office. Washington D.C.; USA. 1968.
- Mancilla-Margalli, N.A.; López, M.G. Water-soluble carbohydrates and fructan structure patterns from Agave and Dasylirion species. J. Agric. Food Chem. 2006, 54, 7832–7839. [Google Scholar] [CrossRef] [PubMed]
- Piedrabuena, D.; Míguez, N.; Poveda, A.; Plou, F.J.; Fernández-Lobato, M. Exploring the transferase activity of Ffase from Schwanniomyces occidentalis, a β-fructofuranosidase showing high fructosyl-acceptor promiscuity. Appl. Microbiol. Biotechnol 2016, 100, 8769–8778. [Google Scholar] [CrossRef] [PubMed]
- Yenush, L. Potassium and sodium transport in yeast. Yeast Membr. Transp. 2016, 187–228. [Google Scholar]
- Park, J.P.; Bae, J.T.; Yun, J.W. Critical effect of ammonium ions on the enzymatic reaction of a novel transfructosylating enzyme for fructooligosaccharide production from sucrose. Biotechnol. Lett. 1999, 21, 987–990. [Google Scholar] [CrossRef]
- Birch, R.M.; Walker, G.M. Influence of magnesium ions on heat shock and ethanol stress responses of Saccharomyces cerevisiae. Enz. Microb. Tech. 2000, 26, 678–687. [Google Scholar] [CrossRef]
- Saltukoglu, A.; Slaughter, J.C. The effect of magnesium and calcium on yeast growth. J. Inst. Brew. 1983, 89, 81–83. [Google Scholar] [CrossRef]
- Walker, G.M. The roles of magnesium in biotechnology. Crit. Rev. Biotechnol. 1994, 14, 311–354. [Google Scholar] [CrossRef]
- Walker, G.M.; Birch, R.M.; Chandrasena, G.; Maynard, A.I. Magnesium, calcium, and fermentative metabolism in industrial yeasts. J. Am. Soc. Brew. Chem. 1996, 54, 13–18. [Google Scholar] [CrossRef]
- Rees, E.M.; Stewart, G.G. The effects of increased magnesium and calcium concentrations on yeast fermentation performance in high gravity worts. J. Inst. Brew. 1997, 103, 287–291. [Google Scholar] [CrossRef]
- Maugeri, F.; Hernalsteens, S. Screening of yeast strains for transfructosylating activity. J. Mol. Catal. B: Enzym. 2007, 49, 43–49. [Google Scholar] [CrossRef]
- Arrizon, J.; Morel, S.; Gschaedler, A.; Monsan, P. Fructanase and fructosyltransferase activity of non-Saccharomyces yeasts isolated from fermenting musts of Mezcal. Bioresour. Technol. 2012, 110, 560–565. [Google Scholar] [CrossRef]
Figure 1.
(a) Agave juices for fermentation (P= pine head juice, BS= base of scape juice, BL= base of the leaf juice, and L= leaf juice), (b) TLC of the agave juices using aniline as a derivatizing reagent (FOS= fructooligosaccharides standard from Megazyme).
Figure 1.
(a) Agave juices for fermentation (P= pine head juice, BS= base of scape juice, BL= base of the leaf juice, and L= leaf juice), (b) TLC of the agave juices using aniline as a derivatizing reagent (FOS= fructooligosaccharides standard from Megazyme).
Figure 2.
Diverse yeasts growing in agave juices (P=pine head juice, BS= base of scape juice, BL= base of leaf juice, and L= leaf juice) at different temperatures: (a) 25 °C, (b) 35 °C, and (c) 45 °C. The color in the graphics represents the cell growth in the corresponding juice; in some cases, the color is not visible due to the absence of growth.
Figure 3.
Cell growth comparison of (a) P. kudriavzevii ITMLB97, (b) K. marxianus ITMLB106, and (c) C. lusitaniae ITMLB85 with different sucrose concentrations (1.5, 20, and 40%) at 30 °C. For cell growth at 56 h, different letters indicate significant differences according to Tukey’s test for α=0.05, n= 3. TLC of the fermentation products with (d-f) P. kudriavzevii ITMLB97 and (g-i) C. lusitaniae ITMLB85 at different temperatures (23, 30, and 37 °C), sucrose concentrations (20, and 40%), and times (0, 24, 48, and 56 h).
Figure 4.
Cell growth of (a) P. kudriavzevii ITMLB97 and (b) C. lusitaniae ITMLB85 with the surfactants at a 20% sucrose concentration in the media over time. For cell growth at 72 h, different letters indicate significant differences according to Tukey’s test for α=0.05, n=3. (c-e) TLC of the fermentation products for both yeasts, where increases in the FOS region over time are observed.
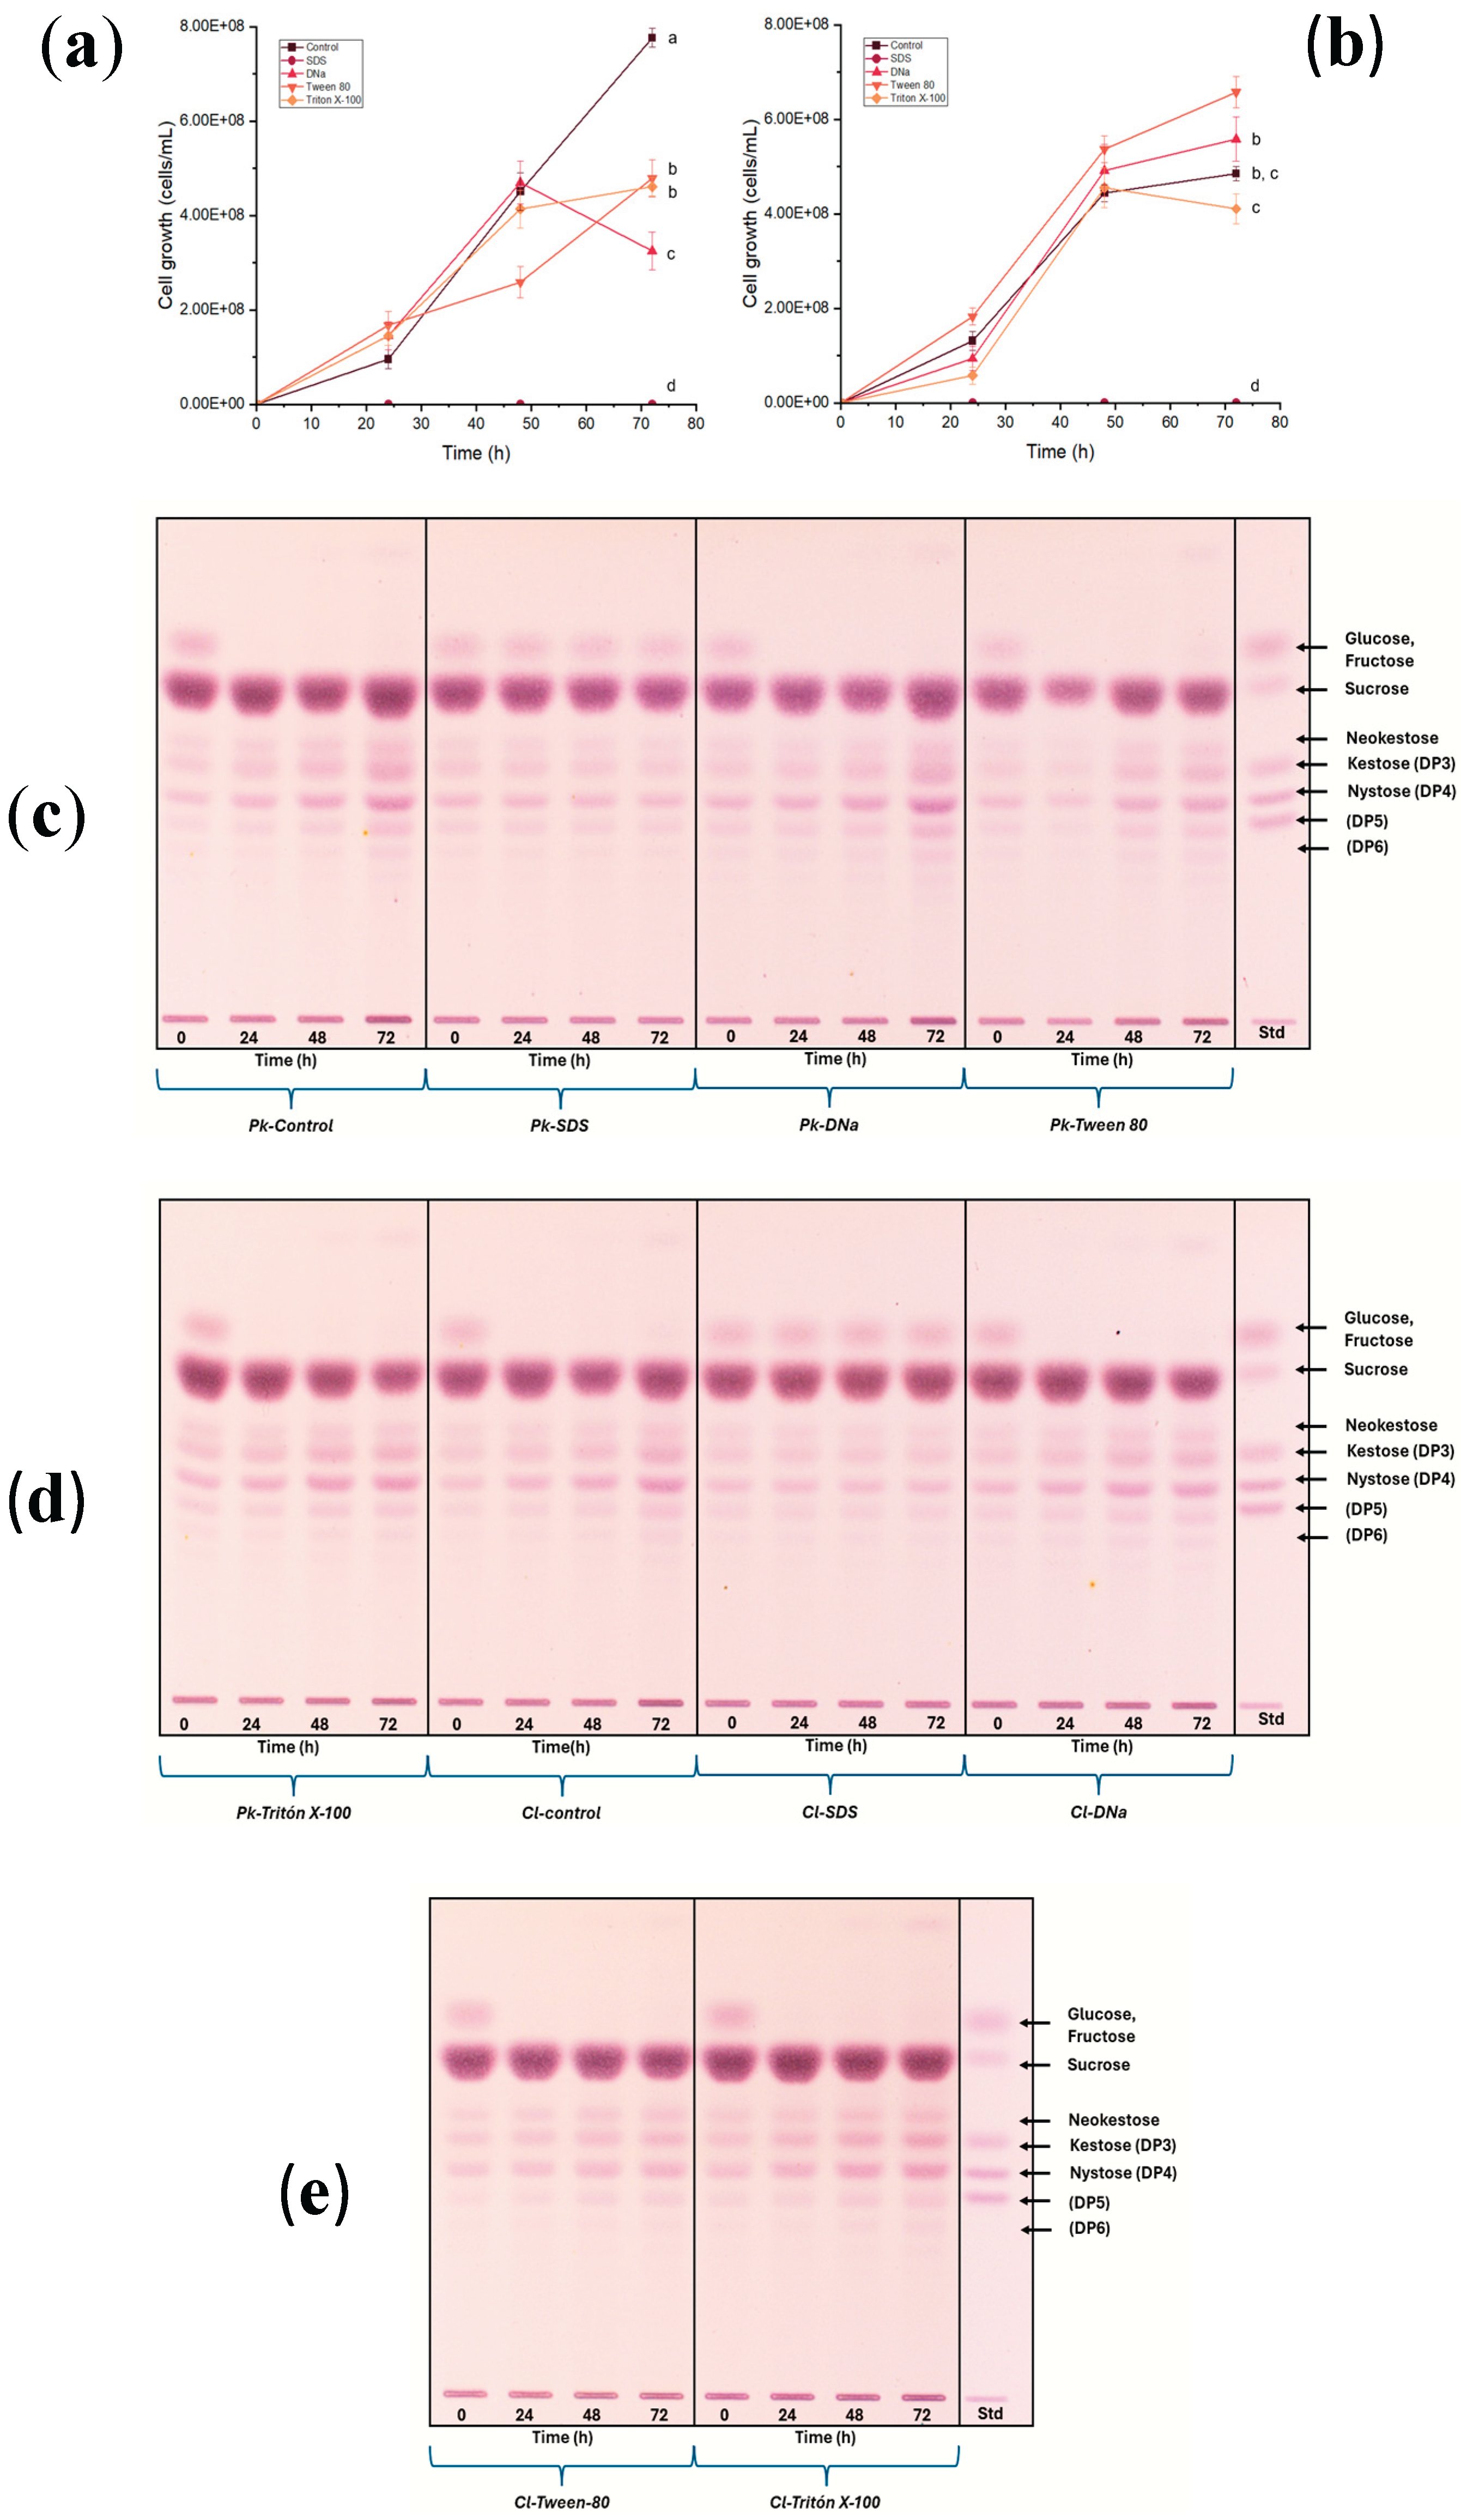
Figure 5.
Grown kinetics of (a, c, e) P. kudriavzevii ITMLB97 and (b, d, f) C. lusitaniae ITMLB85 with different carbon sources and nutrients. P. kudriavzevii ITMLB97 using as a carbon source: (a) FOS, (c) inulin, and (e) BS-juice; C. lusitaniae ITMLB85 using as a carbon source: (b) FOS, (d) inulin, and (f) BS-juice. (g-h) Approaches to P. kudriavzevii ITMLB97 or C. lusitaniae ITMLB85 at 192 h, with BS juice used as a carbon source. For cell growth at 192 h, different letters indicate significant differences according to Tukey’s test for α=0.05, n= 3.
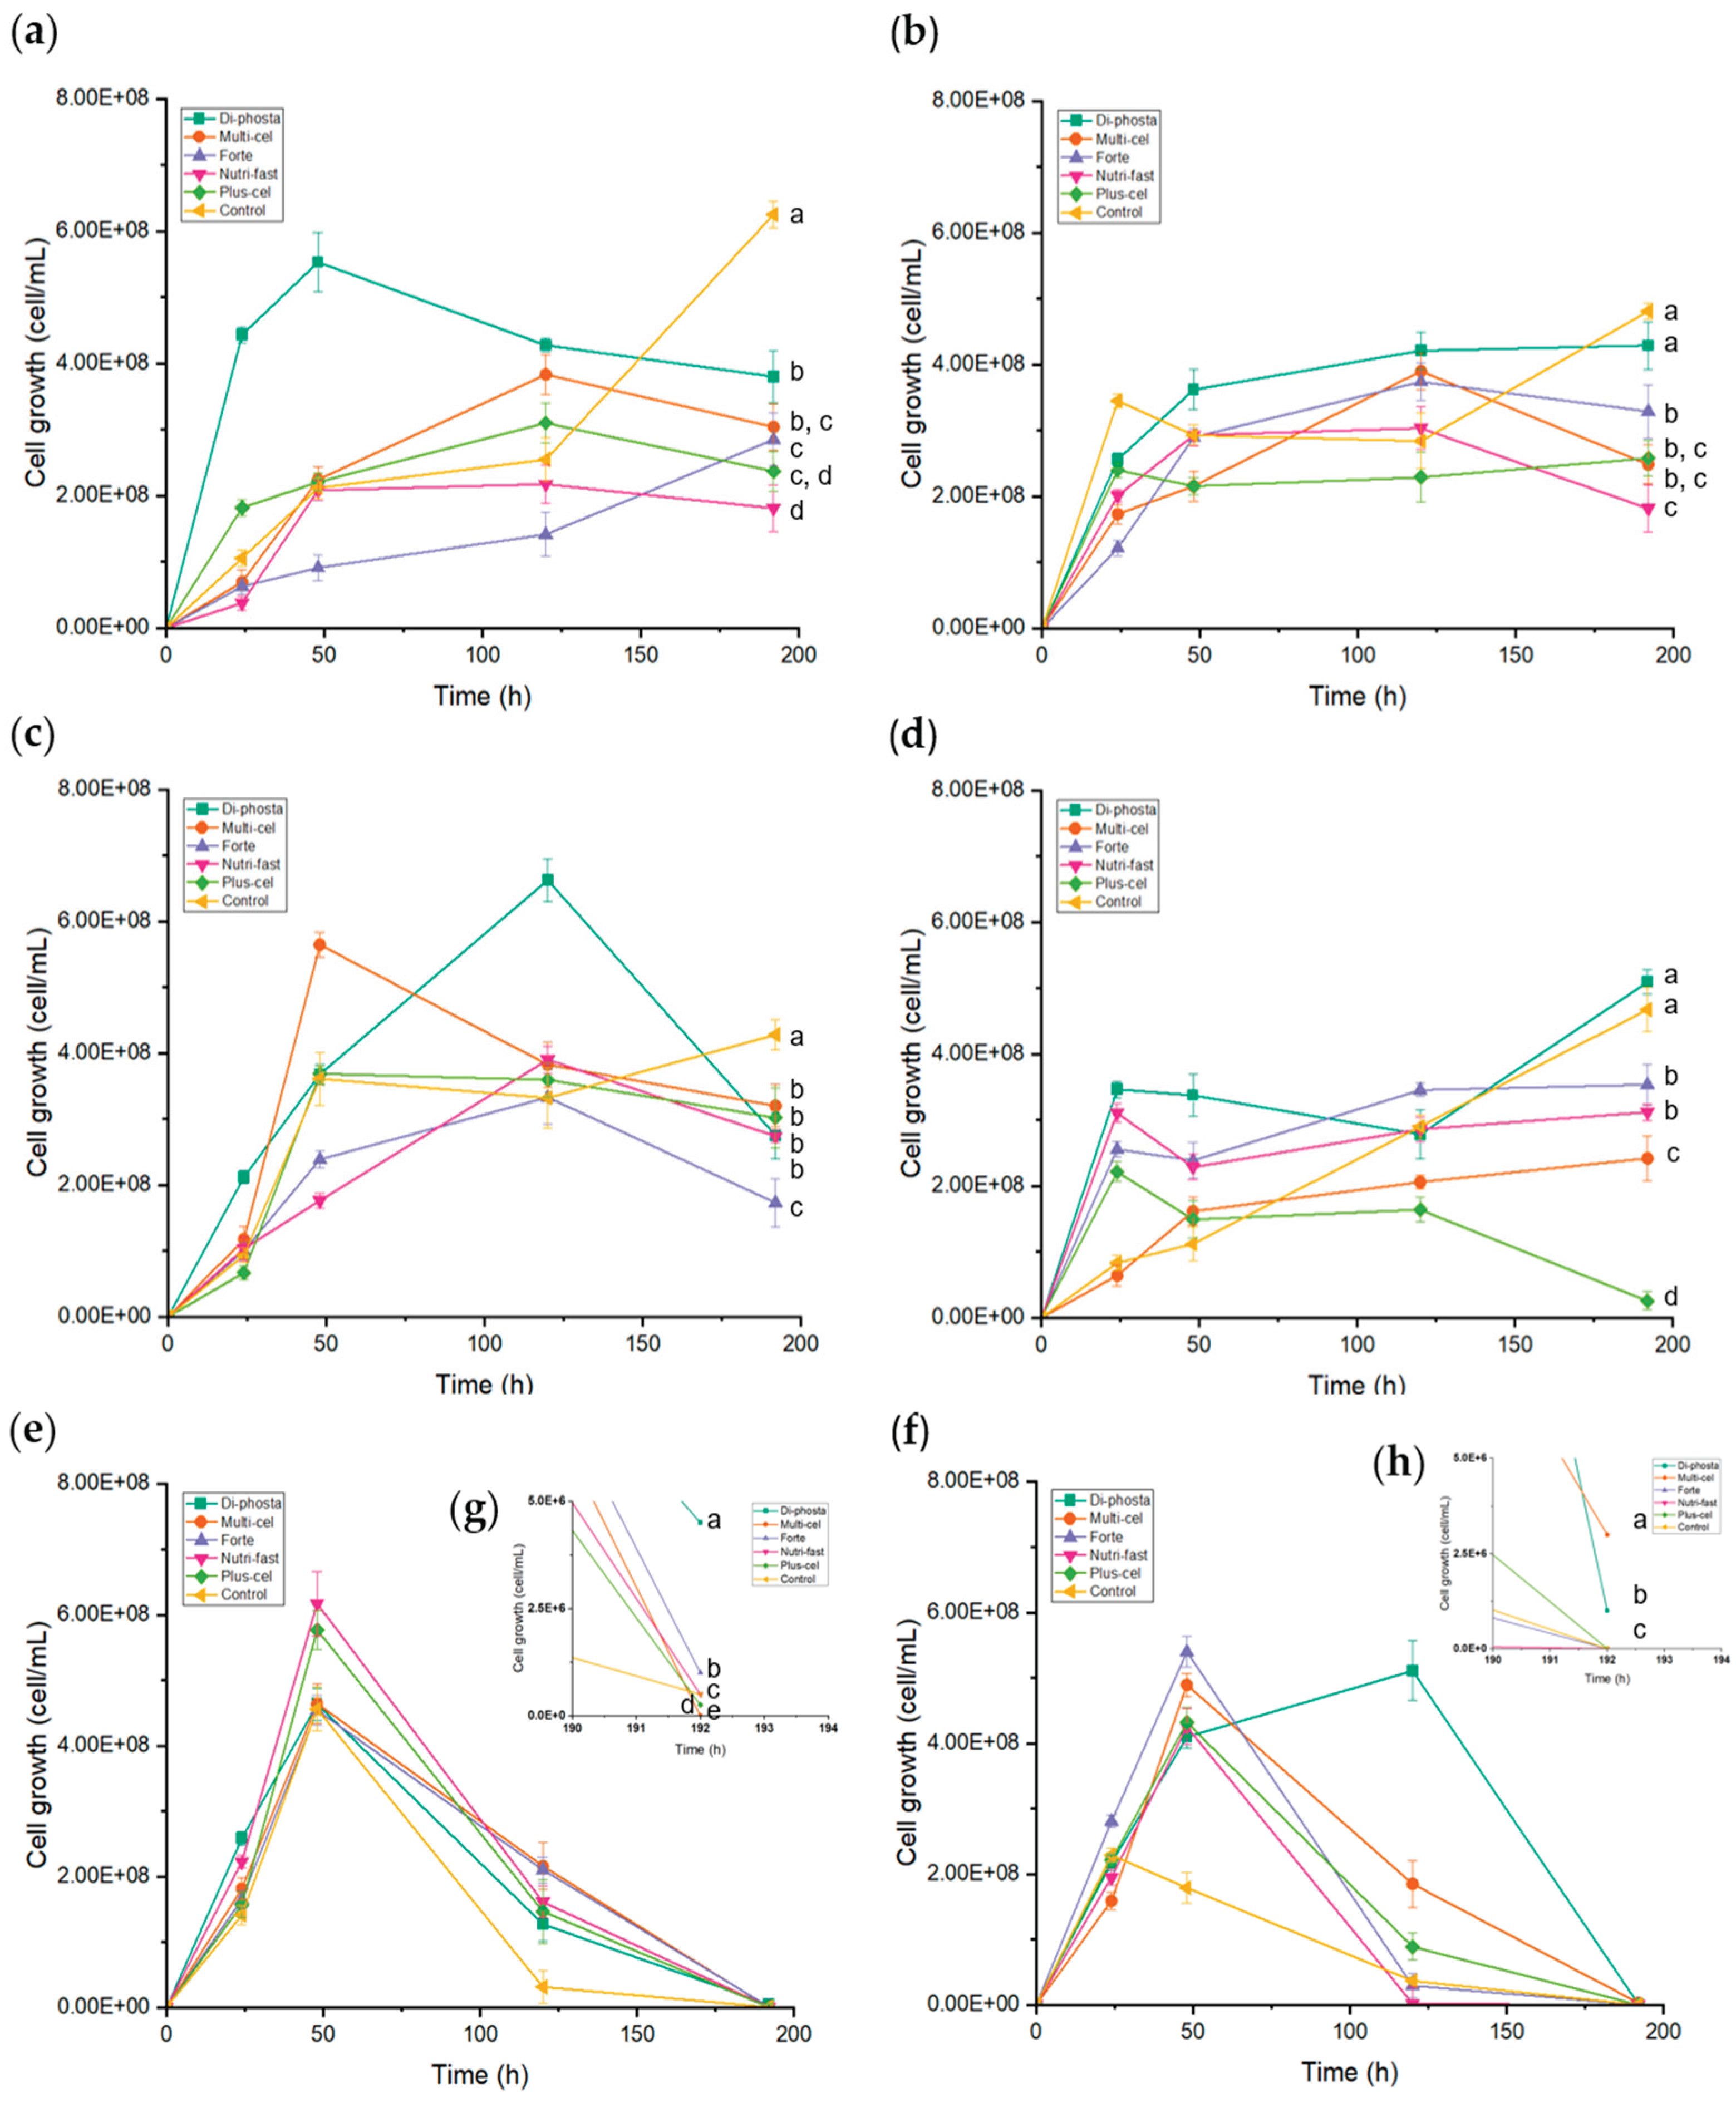
Figure 6.
PCA of (a) P. kudriavzevii ITMLB97 and (b) C. lusitaniae ITMLB85 with different carbon sources. OPLS for P. kudriavzevii ITMLB97 over time using (c) FOS, (c) inulin, and (d) BS-juice. OPLS results for C. lusitaniae ITMLB85 over time when (f) FOS, (g) inulin, and (h) BS-juice were used.
Figure 6.
PCA of (a) P. kudriavzevii ITMLB97 and (b) C. lusitaniae ITMLB85 with different carbon sources. OPLS for P. kudriavzevii ITMLB97 over time using (c) FOS, (c) inulin, and (d) BS-juice. OPLS results for C. lusitaniae ITMLB85 over time when (f) FOS, (g) inulin, and (h) BS-juice were used.
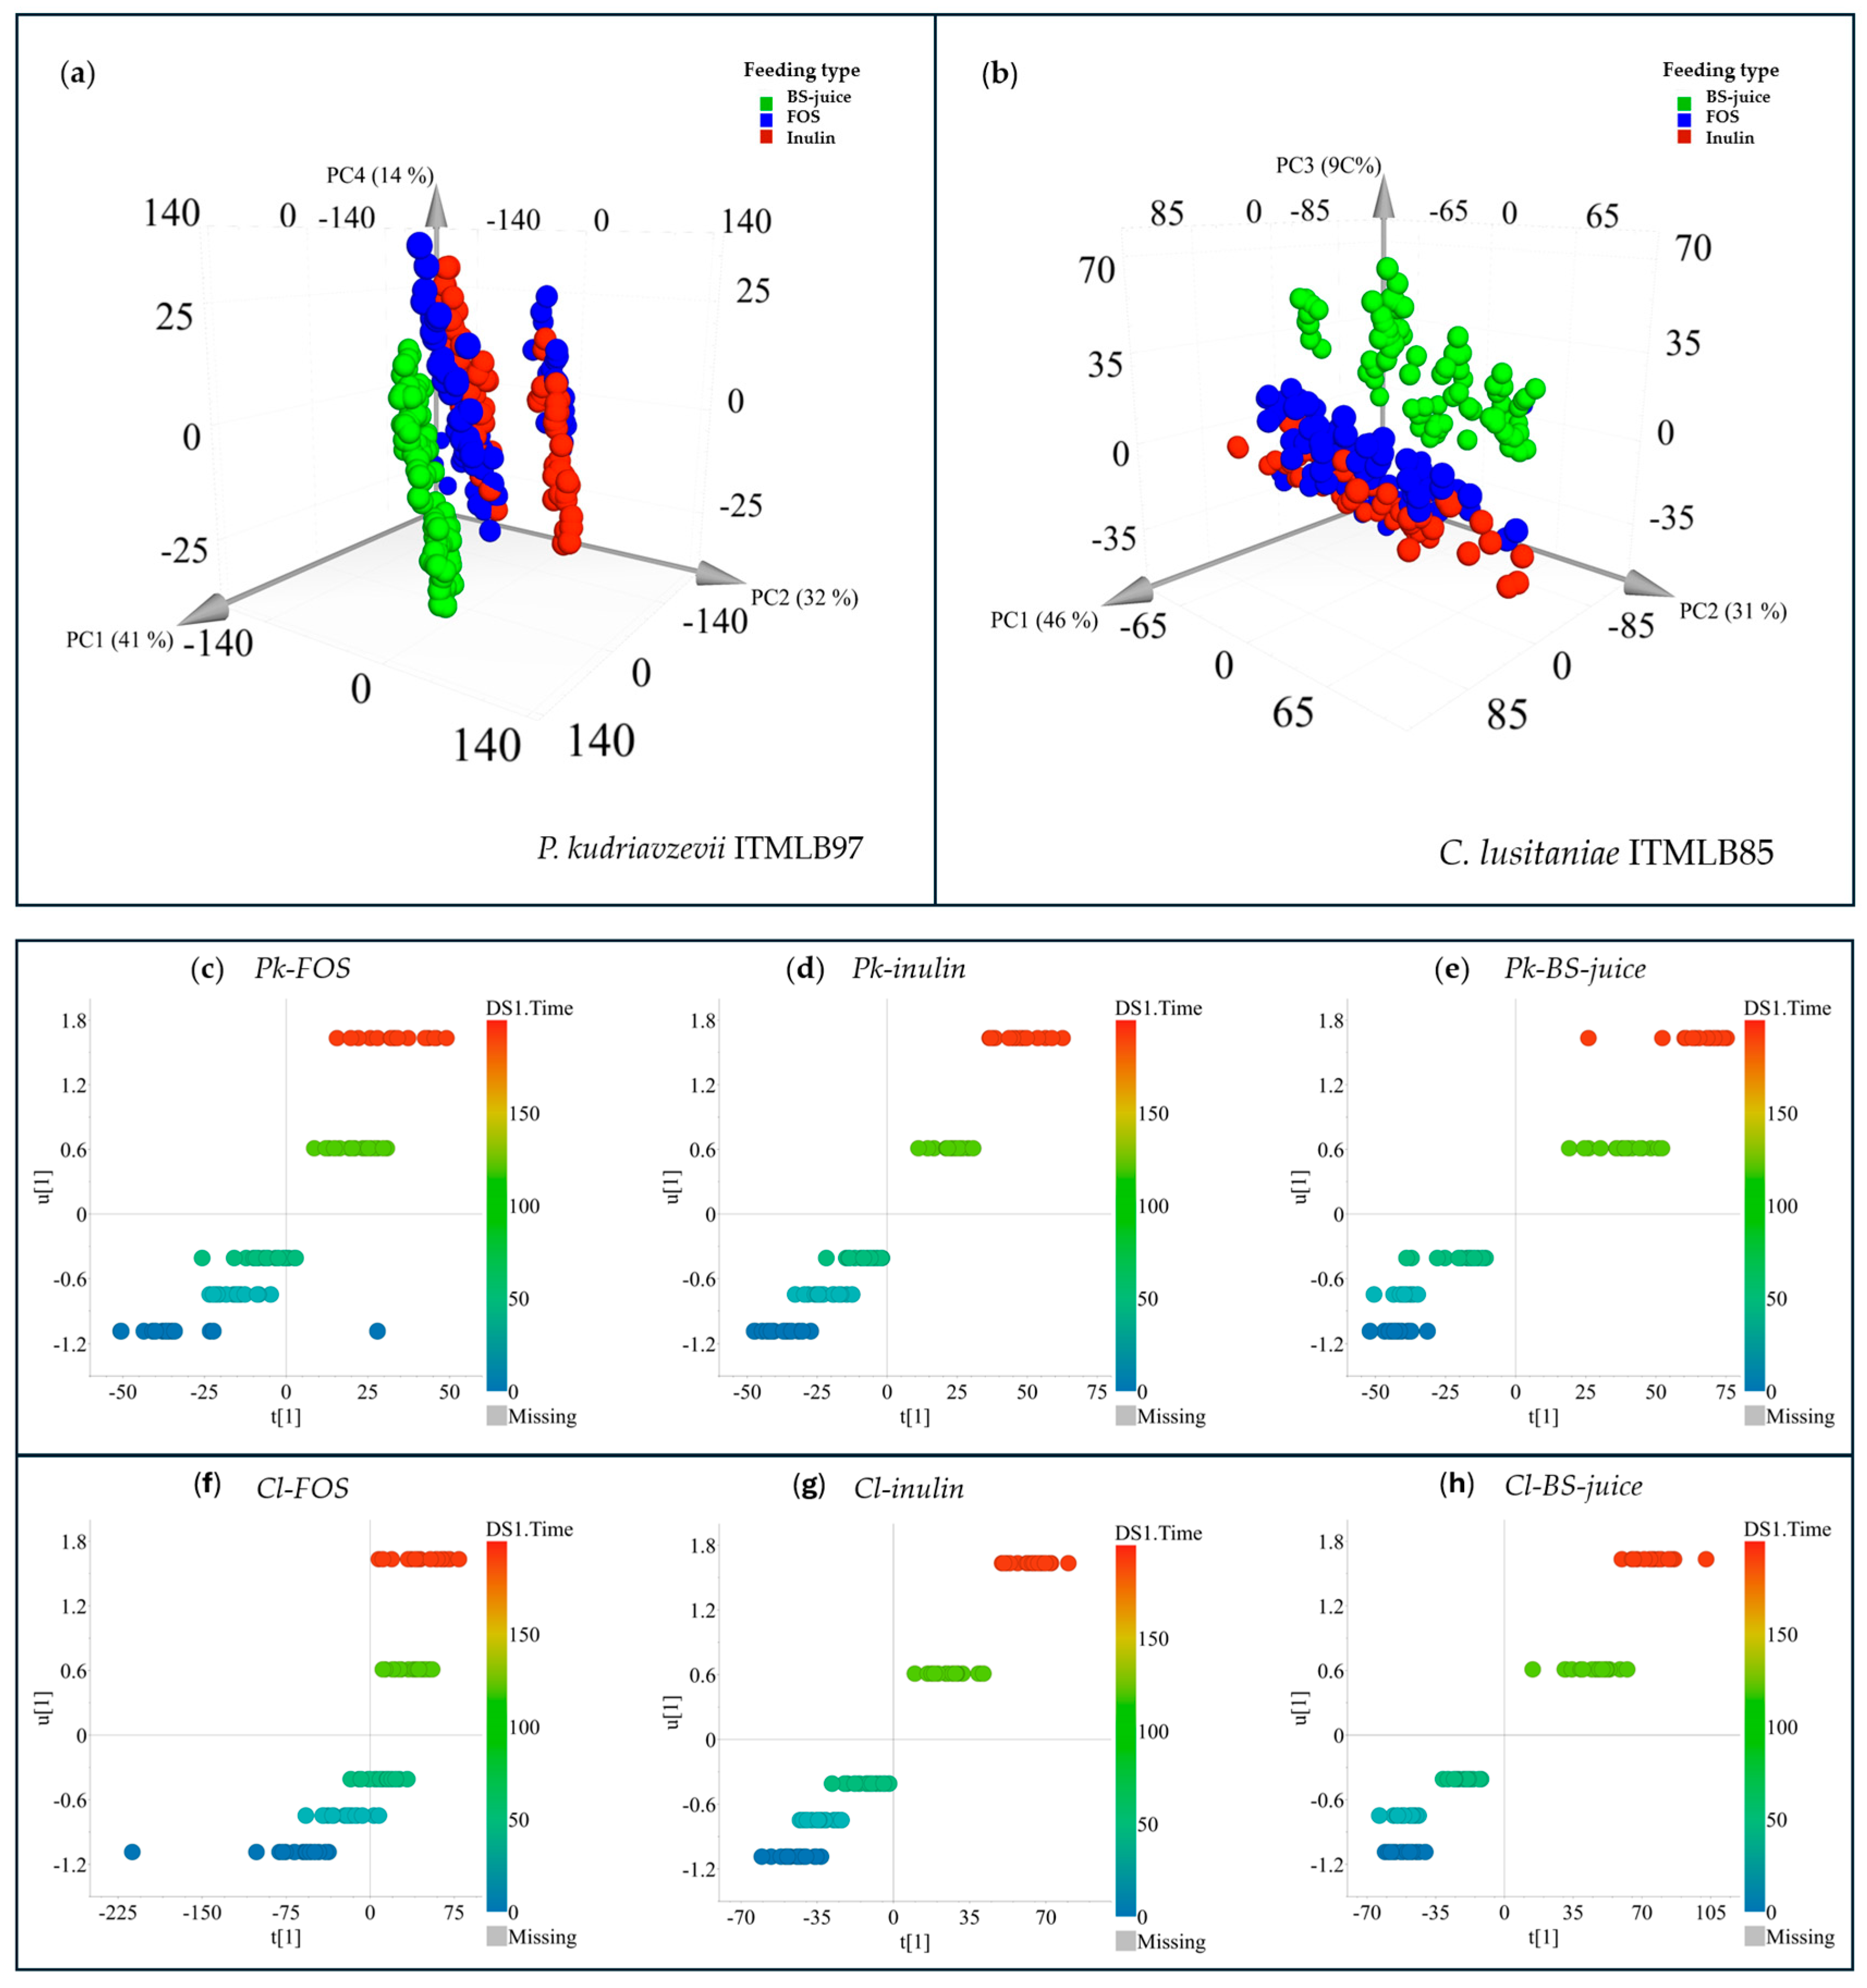
Figure 7.
HPAEC-PAD chromatograms of fermentation products from P. kudriavzevii ITMLB97 (a-c) and C. lusitaniae ITMLB85 (d-f) subjected to different carbon sources and nutrients. P. kudriavzevii ITMLB97 using as a carbon source: (a) FOS, (b) inulin, and (c) BS-juice; C. lusitaniae ITMLB85 using as a carbon source: (d) FOS, (e) inulin, and (f) BS-juice. The gray chromatograms correspond to samples at 0 h, and the color chromatograms correspond to treatments at 192 h. G= glucose, F= fructose, S= sucrose, K= kestose, B=blastose, Ib=inulobiose, 6K= 6-kestose, Lb=levanobiose.
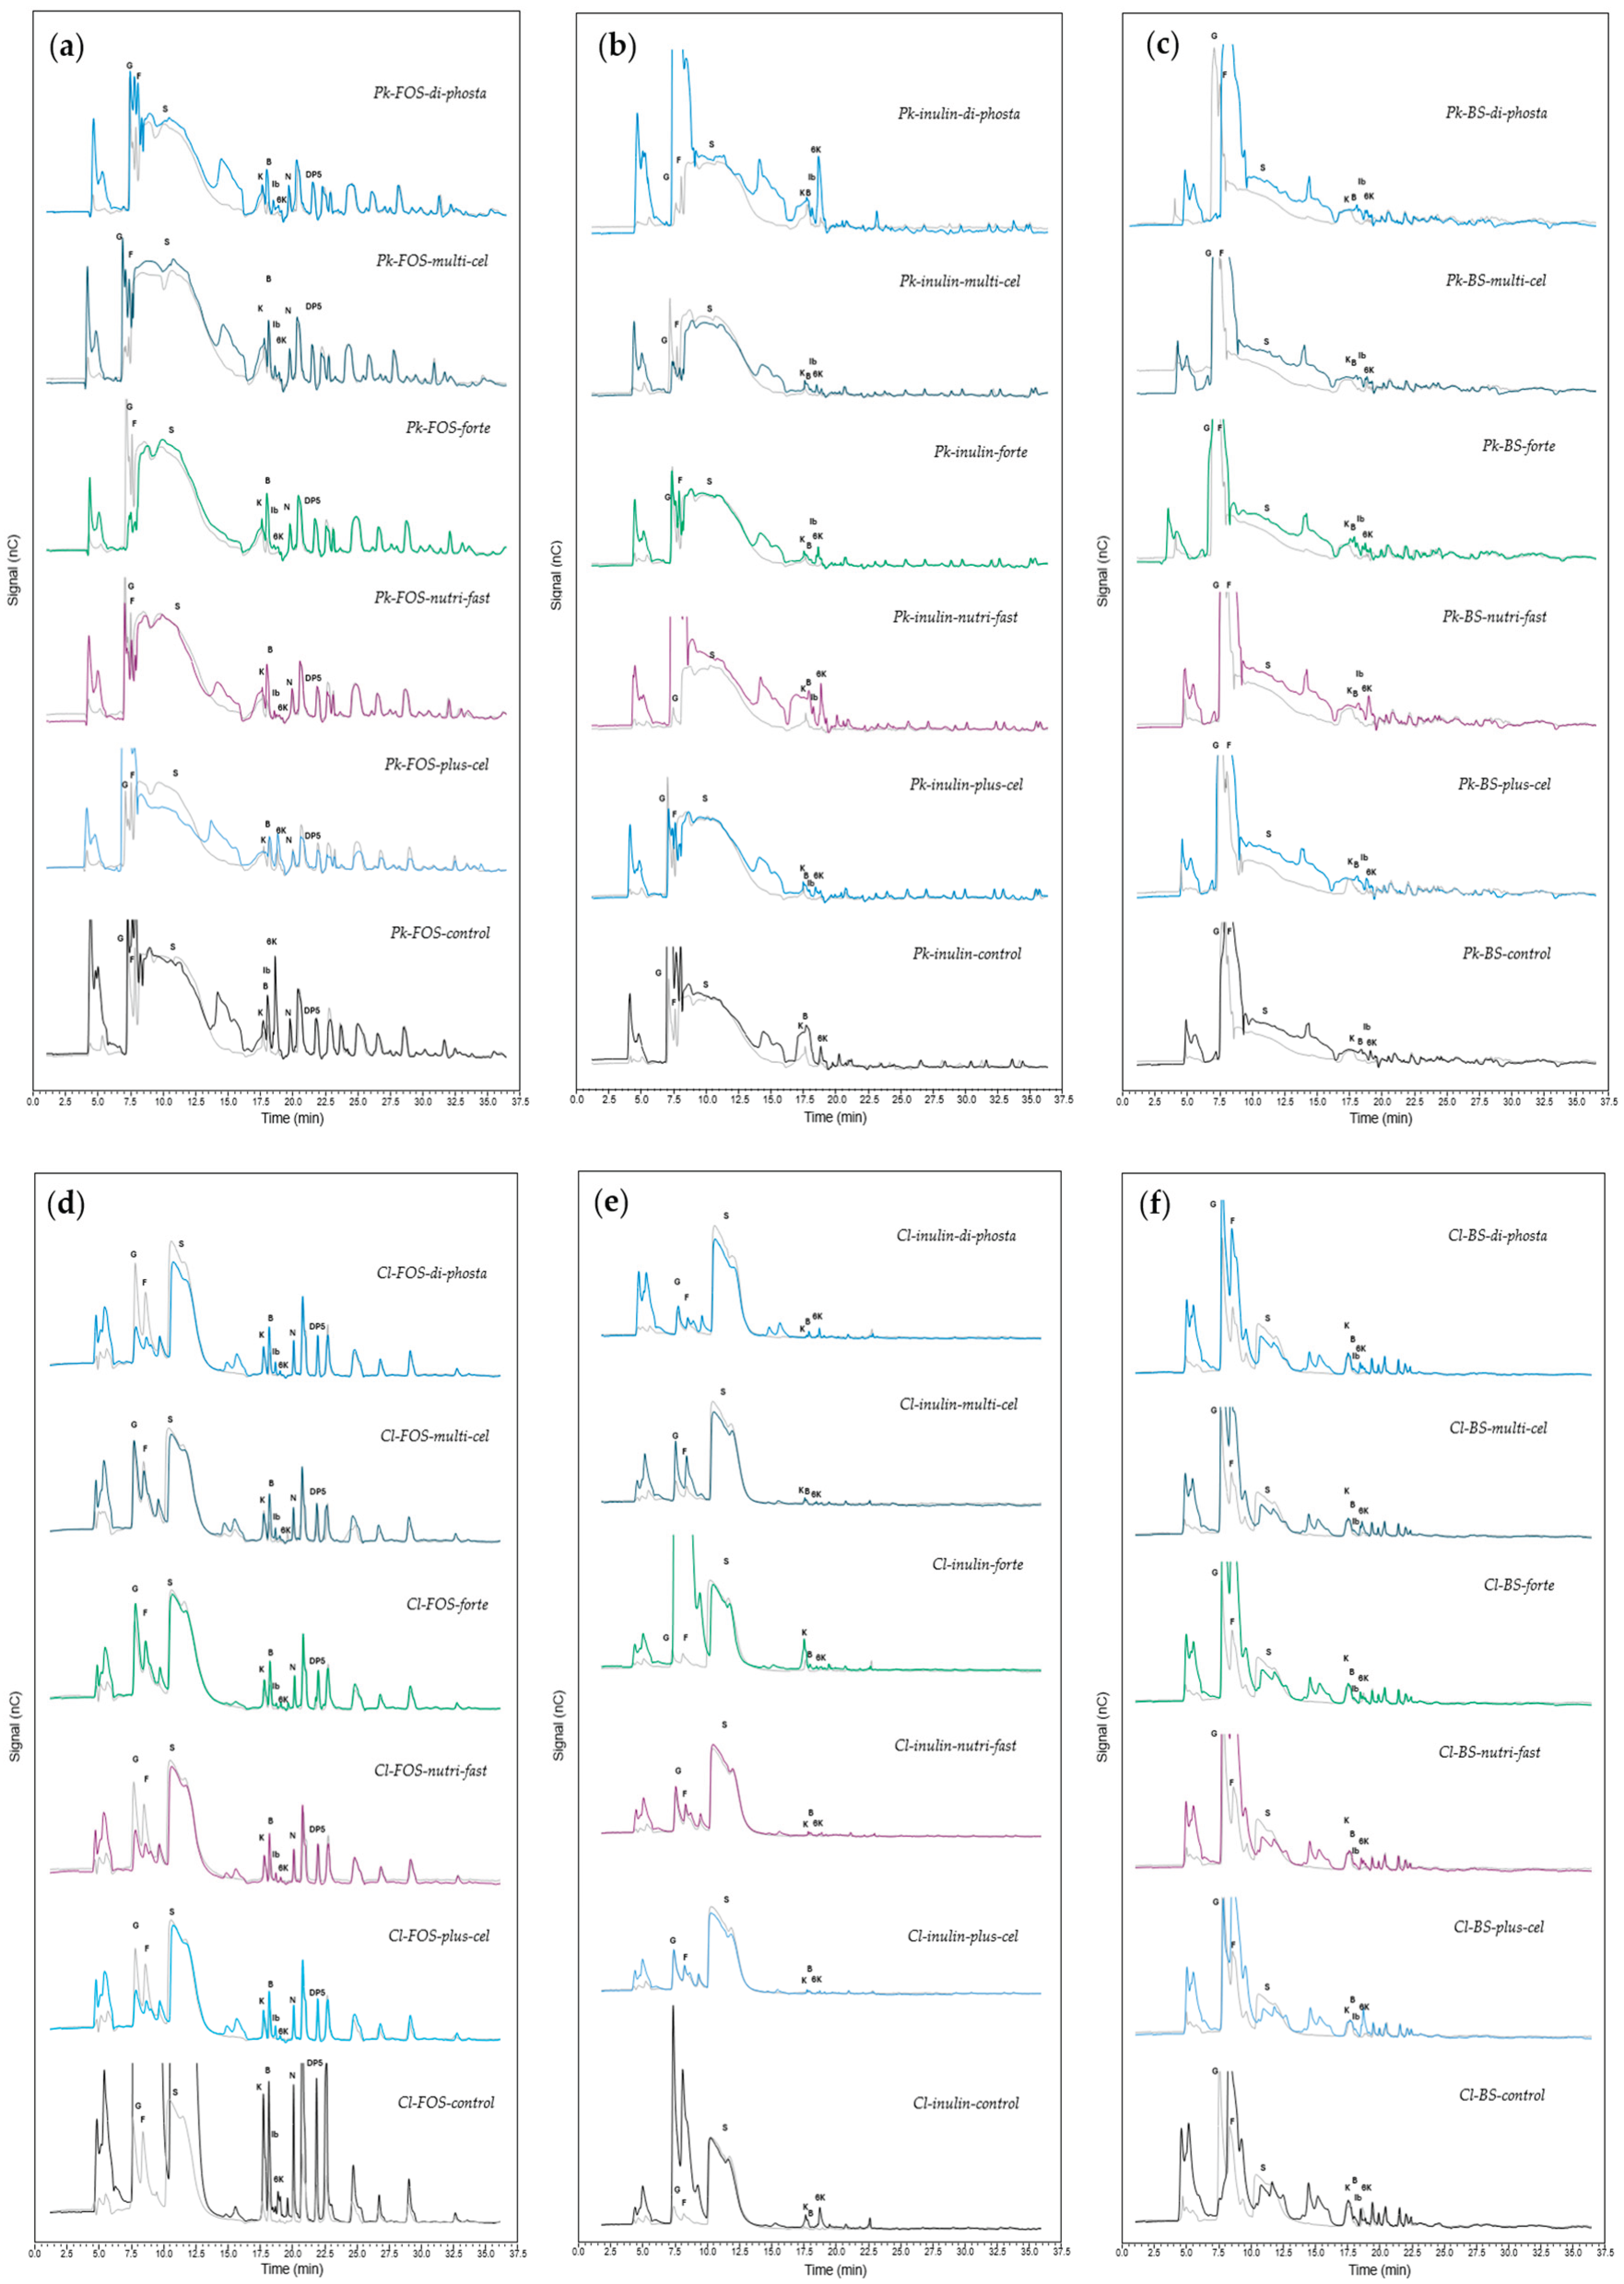
Figure 8.
HPAEC-PAD chromatograms of the treatments established by the Box‒Behnken design for enzymatic extract reactions (P. kudriavzevii ITMLB97 or C. lusitaniae ITMLB85) with distinct induction media: (a, e) EE-Pk-Ch, (b, f) EE-Pk-NM, (c, g) EE-Cl-Ch, (d, h) EE-Cl-NM. Figures (a-d) show the products in treatments 1, 3, 5, 7, and 9 at 12 h (indicated by 4), whereas Figures (e-h) show the products in treatments 2, 4, 6, and 8 at 0 and 24 h (indicated by 1 and 5). G= glucose, F= fructose, K= blastose, Ib= inulobiose, 6K= 6-kestose, nK= neokestose.
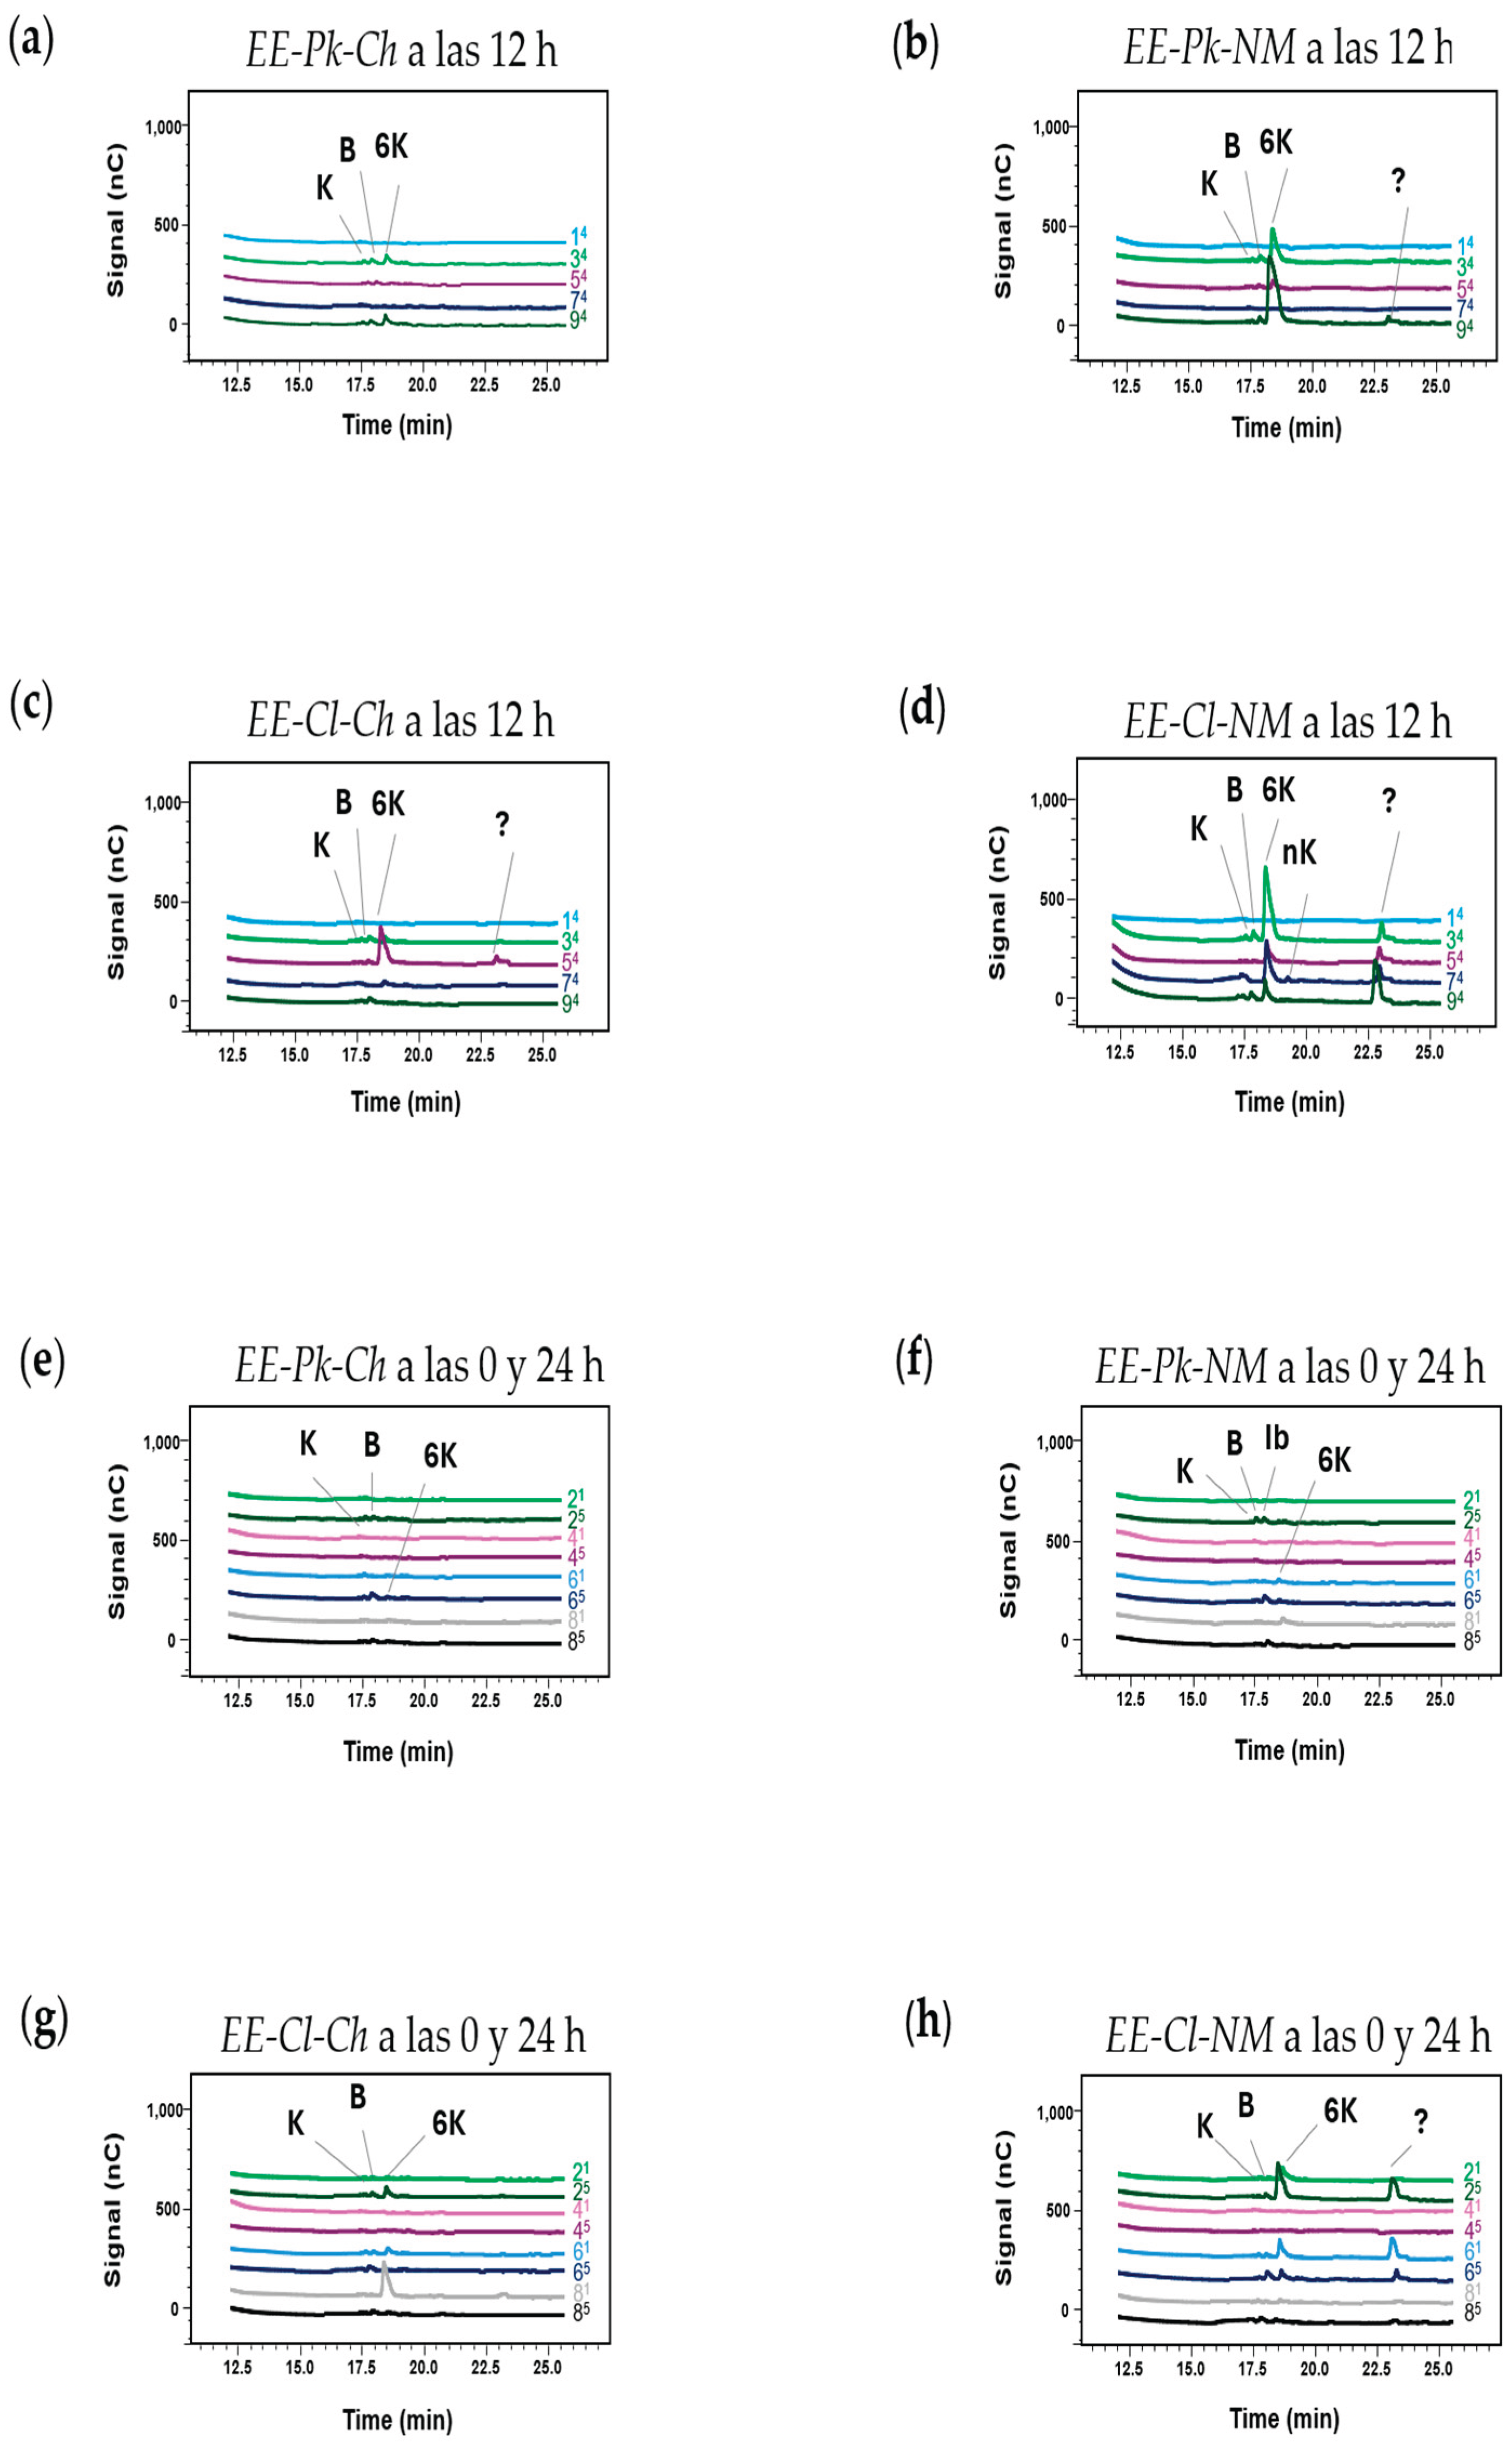
Figure 9.
Response surface generated for FOS production by enzymatic extracts of P. kudriavzevii ITMLB97 (EE-Pk-Ch and EE-Pk-NM) and C. lusitaniae ITMLB85 (EE-Cl-Ch and EE-Cl-NM). K=kestose, B=blastose, Ib=inulobiose, 6K= 6-kestose, Lb=levanobiose, and nK=neokestose.
Figure 9.
Response surface generated for FOS production by enzymatic extracts of P. kudriavzevii ITMLB97 (EE-Pk-Ch and EE-Pk-NM) and C. lusitaniae ITMLB85 (EE-Cl-Ch and EE-Cl-NM). K=kestose, B=blastose, Ib=inulobiose, 6K= 6-kestose, Lb=levanobiose, and nK=neokestose.
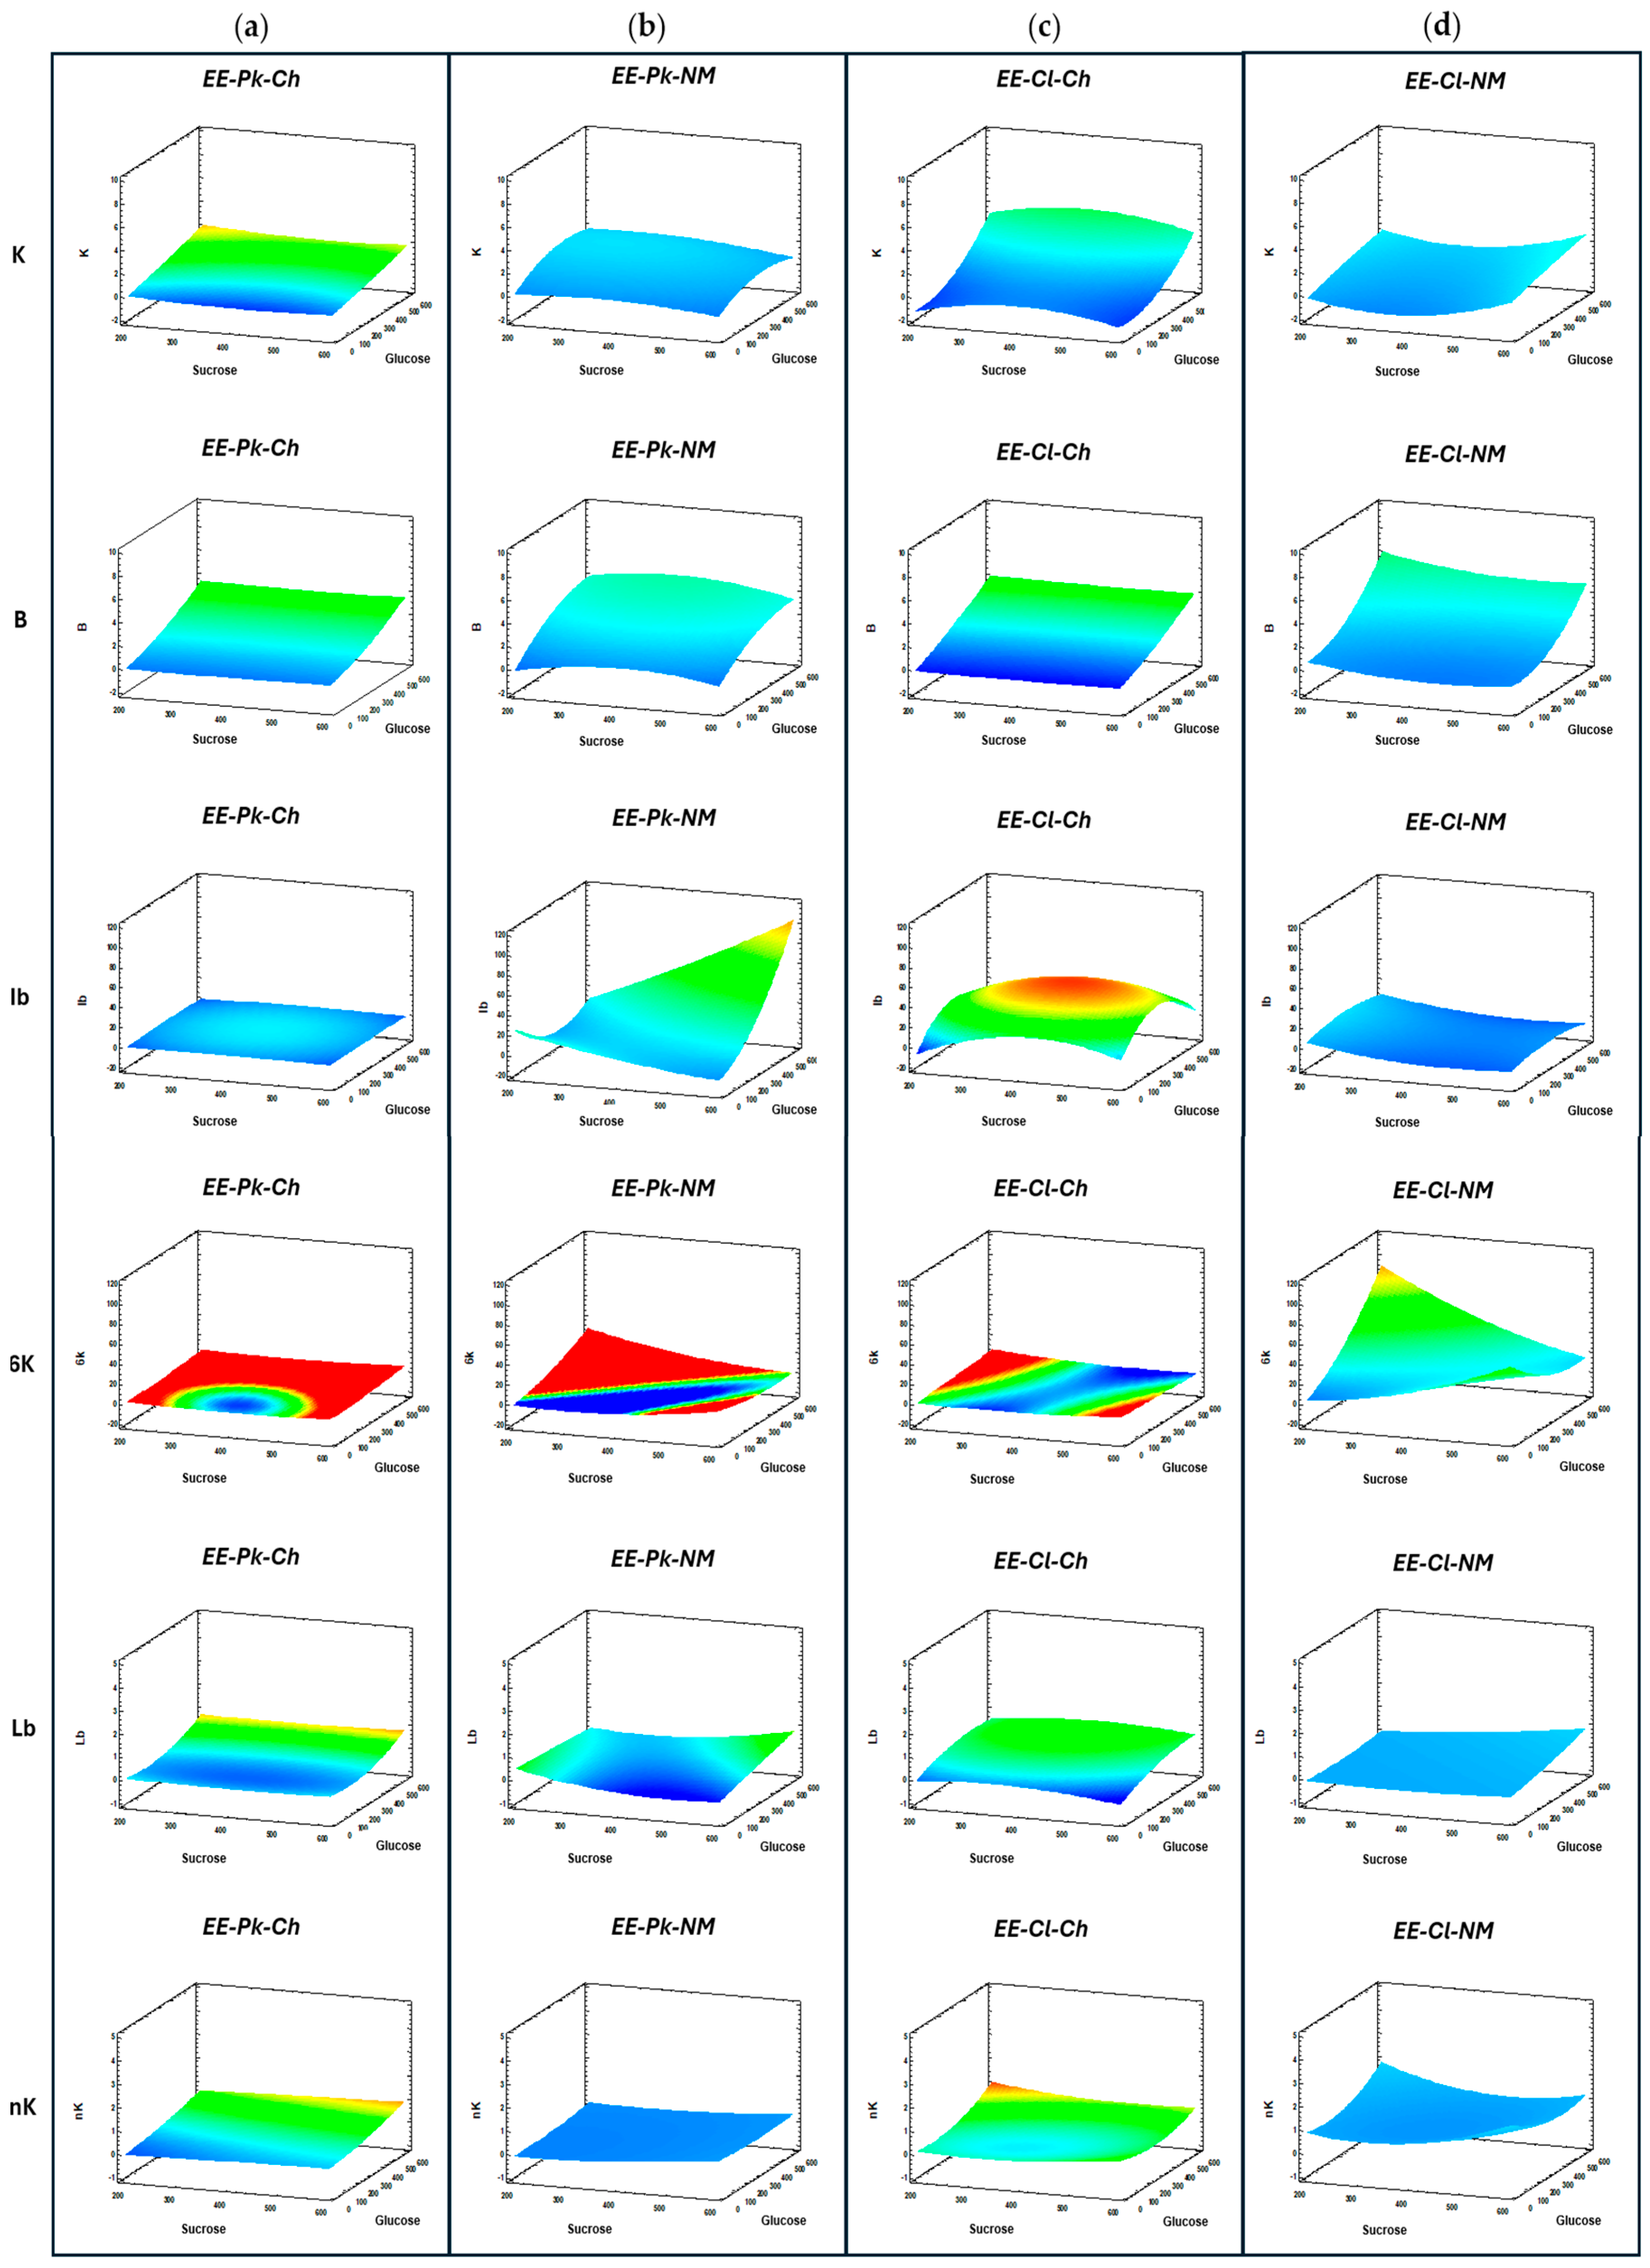

Table 1.
Box–Behnken designs and treatments for the evaluation of the different enzymatic extracts.
| EE-Pk-Ch | EE-Pk-NM | EE-Cl-Ch | EE-Cl-NM | |||||||||
|---|---|---|---|---|---|---|---|---|---|---|---|---|
| Glucose (g/L) | Glucose (g/L) | Glucose (g/L) | Glucose (g/L) | |||||||||
| Sucrose (g/L) | 0 | 300 | 600 | 0 | 300 | 600 | 0 | 300 | 600 | 0 | 300 | 600 |
| 200 | 1Pk-Ch | 2Pk-Ch | 3Pk-Ch | 1Pk-NM | 2Pk-NM | 3Pk-NM | 1Cl-Ch | 2Cl-Ch | 3Cl-Ch | 1Cl-NM | 2Cl-NM | 3Cl-NM |
| 400 | 4Pk-Ch | 5Pk-Ch | 6Pk-Ch | 4Pk-NM | 5Pk-NM | 6Pk-NM | 4Cl-Ch | 5Cl-Ch | 6Cl-Ch | 4Cl-NM | 5Cl-NM | 6Cl-NM |
| 600 | 7Pk-Ch | 8Pk-Ch | 9Pk-Ch | 7Pk-NM | 8Pk-NM | 9Pk-NM | 7Cl-Ch | 8Cl-Ch | 9Cl-Ch | 7Cl-NM | 8Cl-NM | 9Cl-NM |
The numbers 1, 2, 3, 4, 5, 6, 7, 8, and 9 indicate the treatments established by the different BoxBehnken designs for the corresponding enzymatic extracts (EE-Pk-Ch, EE-Pk-NM, EE-Cl-Ch or EE-Cl-NM).
Table 2.
Physicochemical analyses of the agave juices.
| Juice type | pH | Density | °Brix | Moisture % | Ash % | RS (g/L) | Protein (ug/mL) | Total phenols (ug/mL GAE) |
|---|---|---|---|---|---|---|---|---|
| P | 5.51 ± 0.00 a | 1.04± 0.01 a | 10.80 ± 0.10 a | 92.08 ± 0.20 a | 1.67 ± 0.02 a | 9.18 ± 0.07 a | 41.28 ± 0.05 a | 3.8 ± 0.23 a |
| BS | 5.44 ± 0.00 b | 1.03 ± 0.00 a,b | 6.50 ± 0.50 b | 96.76 ± 1.25 a | 1.24 ± 0.09 b,c | 7.35 ± 0.02 b | 35.86 ± 0.00 b | 3.53 ± 0.18 a |
| BL | 5.21 ± 0.00 c | 1.02 ± 0.01 a,b | 5.40 ± 0.30 c | 95.99 ± 0.26 a | 1.29 ± 0.02 b | 6.97 ± 0.41 a,b | 27.87 ± 0.04 c | 2.06 ± 0.06 b |
| L | 5.02 ± 0.00 d | 1.02 ± 0.01 b | 4.80 ± 0.10 c | 96.70 ± 0.16 a | 1.12 ± 0.06 c | 5.58 ± 0.18 c | 25.74 ± 0.01 d | 2.51 ± 0.31 b |
P= pine head juice, BS= base of scape juice, BL= base of leaf juice, L= leaf juice, RS= reducing sugars, and GAE= gallic acid equivalents. Different letters indicate significant differences according to Tukey’s test for α=0.05, n=3.
Table 3.
Optimal factors determined to produce the products in the FOS region by all the Box–Behnken designs for both induction media from P. kudriavzevii ITMLB97 and C. lusitaniae ITMLB85.
Table 3.
Optimal factors determined to produce the products in the FOS region by all the Box–Behnken designs for both induction media from P. kudriavzevii ITMLB97 and C. lusitaniae ITMLB85.
| Induction media | Optimal factors | Products generated in FOS region | |||||
|---|---|---|---|---|---|---|---|
| K | B | Ib | 6K | Lb | nK | ||
| EE-Pk-Ch | Sucrose (g/L) | 204.43 | 600.00 | 400.00 | 600.00 | 600.00 | 600.00 |
| Glucose (g/L) | 599.96 | 599.97 | 300.00 | 600.00 | 600.00 | 600.00 | |
| Time (h) | 24.00 | 24.00 | 12.00 | 12.91 | 15.43 | 12.39 | |
| Optimal value (nC) | 2.52 | 6.07 | 1.77 | 7.46 | 0.82 | 0.92 | |
| EE-Pk-NM | Sucrose (g/L) | 200.00 | 367.50 | 600.00 | 200.00 | 200.00 | 600.00 |
| Glucose (g/L) | 437.91 | 600.00 | 600.00 | 600.00 | 0.00 | 0.00 | |
| Time (h) | 24.00 | 24.00 | 21.90 | 13.21 | 23.72 | 22.32 | |
| Optimal value (nC) | 3.12 | 6.40 | 115.07 | 28.09 | 0.99 | 0.77 | |
| EE-Cl-Ch | Sucrose (g/L) | 385.84 | 600.00 | 440.27 | 200.00 | 500.12 | 200.00 |
| Glucose (g/L) | 600.00 | 599.99 | 306.21 | 600.00 | 554.65 | 598.18 | |
| Time (h) | 24.00 | 24.00 | 9.20 | 23.73 | 0.00 | 24.00 | |
| Optimal value (nC) | 9.67 | 7.10 | 51.48 | 9.55 | 0.92 | 1.74 | |
| EE-Cl-NM | Sucrose (g/L) | 599.33 | 200.20 | 200.00 | 200.00 | 596.08 | 600.00 |
| Glucose (g/L) | 600.00 | 600.00 | 300.00 | 600.00 | 599.90 | 0.00 | |
| Time (h) | 23.81 | 24.00 | 24.00 | 10.35 | 24.00 | 11.23 | |
| Optimal value (nC) | 4.25 | 8.98 | 35.97 | 91.25 | 1.21 | 1.91 | |
The blue color specifies the higher value for the products in the FOS region obtained from all the Box–Behnken designs analysis. K= kestose, B= blastose, Ib= inulobiose, 6K= 6-kestose, Lb= levanobiose, nK= neokestose.
Disclaimer/Publisher’s Note: The statements, opinions and data contained in all publications are solely those of the individual author(s) and contributor(s) and not of MDPI and/or the editor(s). MDPI and/or the editor(s) disclaim responsibility for any injury to people or property resulting from any ideas, methods, instructions or products referred to in the content. |
© 2025 by the authors. Licensee MDPI, Basel, Switzerland. This article is an open access article distributed under the terms and conditions of the Creative Commons Attribution (CC BY) license (http://creativecommons.org/licenses/by/4.0/).
Copyright: This open access article is published under a Creative Commons CC BY 4.0 license, which permit the free download, distribution, and reuse, provided that the author and preprint are cited in any reuse.


