
Submitted:
30 June 2025
Posted:
02 July 2025
You are already at the latest version
Abstract
Maintaining a high quality of life is increasingly important in an aging society. This study explores the causal relationships among quality of life (QOL), lifestyle, social activity, and perceptions of aging. A nationwide survey in Japan in 2013 involved 9,508 elderly residents. The primary survey received responses from 4,343 participants, resulting in a response rate of 45.7%. Six years later, a follow-up survey was conducted, with responses from 3,345 individuals, achieving an 86.7% recovery rate. The analysis focused on 2,859 participants aged 65 to 85 years. The questionnaire assessed subjective health and life satisfaction related to QOL. Covariance analysis was used to clarify the causal structural relationships through cross-lagged and synchronous effect models, as described by Finkel. The "Quality of Life" (QOL) (a latent variable) was significantly more influenced by "Pain, Illness, and Lifestyle" than by "Aging Perception and Disease Preventability" over the previous six years. Additionally, both "QOL" and "Pain, Illness, and Lifestyle" were found to causally affect "Aging Perception and Disease Preventability" after six years. These causal relationships remained consistent across genders and age groups. Instead of focusing solely on improving awareness and perception to influence behavior, promoting desirable QOL may enhance health awareness and motivate positive actions. Interventional research is expected to clarify these effects by adopting it as a new health support model.
Keywords:
causal structural relationship
; QOL
; lifestyle
; aging perception
1. Introduction
Japan has the highest life expectancy in the world, but it faces significant challenges due to a rapidly aging population and declining birth rates. One primary concern for the elderly is the increasing prevalence of age-related diseases. This demographic shift has created a substantial gap of approximately ten years between average life expectancy and healthy life expectancy [1]. Given these circumstances, extending healthy life and maintaining quality of life(QOL) are becoming increasingly important [2].
Recently, there has been an increasing emphasis on preventing long-term care needs by addressing frailty as a new health policy for older adults [3]. Studies indicate that maintaining a desirable daily lifestyle [4,5] and engaging in active social participation [6,7] are crucial for improving survival rates and quality of life [8]. Additionally, following a recommended lifestyle and diet is vital [9]. Furthermore, having a positive outlook on life has been identified as a key factor in achieving healthy longevity. In a study by Reuben et al. [10], 1,011 older adults were tracked over 23 years. The researchers found that positive stereotypes about physical health at retirement were linked to a 4.5-year survival advantage. Moreover, positive stereotypes regarding mental health were associated with a 2.5-year survival advantage.
Shirai [11] conducted a study of 319 individuals aged 75 and older to identify factors that distinguish those at risk for long-term care from those who are healthy. The findings revealed that individuals at risk for long-term care were more likely to experience depression, have weak social relationships, and report low levels of life satisfaction and self-esteem.
Colleen et al. reviewed 21 high-quality follow-up studies on self-awareness of aging and attitudes toward aging. They recommended the Attitudes Toward Own Aging (ATOA) scale, which assesses depression, cognitive function, longevity, health promotion, health behavior, and disease prevention. The review found that more positive self-perceptions of aging (SPAs) were linked to higher health self-esteem, positive thinking, improved cognitive function, increased life expectancy, and better living abilities [12].
In a study conducted by Kodama et al. [13] on older adults in rural areas of northern Okinawa, happiness emerged as a strong indicator of survival over three years. They reported that maintaining a positive lifestyle is associated with better survival rates and a decreased need for long-term care. Additionally, Ng et al. [14] noted that combining physical activity, good nutrition, cognitive engagement, and social participation can help prevent frailty and improve the quality of life (QOL).
Older individuals who engage in physical, cultural, and community activities at least once a week are less likely to require nursing care and extensive health support compared to those who do not participate in these activities [15].
The World Health Organization (WHO) has introduced guidelines known as Integrated Care for Older People (ICOPE) to provide personalized support at the local level for comprehensive health assessments of older adults [16]. The WHO recommends prioritizing the needs of older adults in their familiar living environments to prevent a decline in their abilities.
Recognizing the benefits of adopting healthy behaviors and applying a health belief model can enhance overall health [17]. However, the causal structural relationships among lifestyle-related diseases, social activities, quality of life (QOL), and perceptions of aging remain poorly understood. It is still unclear whether adopting a healthier lifestyle results in a better quality of life and a longer lifespan, or if a positive lifestyle coupled with a favorable perception of aging is crucial for survival and improved QOL.
Before conducting intervention research, it is important to clarify the causal structural relationships involving perceptions of aging, disease prevention, lifestyle habits, disease status, and quality of life (QOL).
Our study conducted a nationwide longitudinal survey of older adults twice over six years. This research aims to clarify the comprehensive causal structure involving lifestyle, presence or absence of diseases, pain, perceptions of aging, disease prevention, and quality of life. To understand the causal structure, we analyzed it using covariance structure analysis based on the model presented by Finkel, utilizing the results from both the pre-survey and the post-survey conducted after six years.
2. Method
2.1. Research Subject
The survey involved 9,508 older adults who participated in the Longevity Center for Social Development project across 25 prefectures in Japan. The initial survey was conducted in 2013 using a self-administered questionnaire distributed by mail ([T1]).
Six years later, in 2019, a follow-up survey was conducted involving 3,856 of the 4,343 respondents from the initial study who agreed to participate in the follow-up. The response rate is 86.7%, with 3,345 individuals([T2]). The analysis focused on 2,859 participants aged 65 to 85 (Table 1). An overview of the primary survey and some research findings was reported in prior studies [18].
2.2. Analytic Item
Regarding the questionnaire for participants, we have developed a survey that covers the following topics: 1) physical health, 2) mental health, 3) weight change, 4) exercise, 5) smoking, and 6) social participation. This questionnaire is based on the essential questionnaire recommended by the Japanese Ministry of Health, Labor, and Welfare [19].
- 1). Physical Health
For our physical health assessment, we assigned a disease score of one for any history of heart disease, liver disease, diabetes, or depression. Additionally, we calculated pain scores by awarding one point for each instance of pain experienced in the back, hips, knees, and feet. The total score for disease and pain regarding physical health ranged from 0 to 4.
- 2.) Lifestyle and Mental Health
For Body Mass Index (BMI), we classified individuals as follows: underweight (less than 18.5), normal weight (18.5 to 24.9), overweight (25.0 to 29.9), and obese (more than 30.0). If a person’s weight class remained unchanged for six years, we assigned one score for stability in body weight. We granted a score of one to individuals who exercised more than three times a week, did not smoke, and slept between 6 and 8 hours per night. Lifestyle-related scores ranged from 0 to 4[4].
In terms of mental health, we examined subjective health and life satisfaction. Subjective health was evaluated using a four-point Likert scale based on respondents’ perceptions of their overall health, with the options: “feeble,” “poor,” “fair,” and “excellent.” To assess life satisfaction, we asked, “How satisfied are you with your current life?” The response options were: “not satisfied,” “neither,” and “satisfied.” [5].
- 3). Social Participation
As an indicator of social participation, we have chosen relationships with people, community activities, hobbies, and the frequency of enjoying life. Participants will receive one point for social activity scores if they select “at least once a week” for each activity, resulting in a total score ranging from 0 to 4[6,7].
- 4.) Nutritional Status
The study examined the impact of diet on survival over six years. It identified four types of foods—soybeans, eggs, milk products, and fruits—that showed a significant association with survival. Participants’ weekly food intake frequency was classified into five categories, with a point system assigned: 5 points for every day consumption, 4 points for 3-6 times a week, 1 point for 1-2 times, and 0 points for no consumption. The total score for recommended meals ranged from 0 to 20 points[8,9].
- 5). Aging Perception and Disease Preventability
Lawton [20] reported that the Philadelphia Geriatric Center Morale Scale (PGC) strongly indicates mental health and survival predictions. Loke et al. report that the PGC in older adults is closely associated with disability and social support[21].
In the role of aging, “How did you feel about your role as you age?” The response options included three choices: “not important,” “neither,” and “important.” Levy et al. [22] report that recognizing disease prevention is likely associated with maintaining favorable lifestyle habits for health maintenance. The question about disease preventability was, “What do you think about the idea that illness can be prevented by taking care of yourself?” The response options included three choices: “not right,” “neither,” and “right.”
2.3. Research Ethics and Data Availability
The research survey was conducted over six years, starting in 2013, as a collaborative effort between the International Longevity Center and Tokyo Metropolitan University. Both organizations collaborated to plan and implement the research, ensuring strict confidentiality and centralized management of personal information at the Longevity Center for Social Development. The questionnaire was anonymized using an ID number to safeguard personal information, preventing the identification of any individual participant. Analysts agreed to combine the ID data with other data. The research received approval from the Sagami Women’s Junior College Ethics Committee on September 4, 2021. The analytic data for this study is available through the UMIN System (https://upload.umin.ac.jp/cgi-bin/fileshare/upload.cgi?DELETE=1&on=589518), which functions as an open-data access platform in Japan.
2.4. Analytical Method
Finkel’s model was used to analyze the cause-and-effect relationship and assess its impact six years after the initial survey. This model included two methodologies: cross-lagged and synchronous effect models [23,24]. The analysis employed covariance structure analysis while taking gender into account.
The model’s goodness of fit was evaluated using the chi-square test, degrees of freedom, and P-value. This evaluation included the Normed Fit Index (NFI), Comparative Fit Index (CFI), and the Root Mean Square Error of Approximation (RMSEA). Model selection criteria focused on achieving the best goodness of fit index and significant path relationships between latent and observed variables, as determined by the Wald test.
For all subsequent projections, standardized estimates were utilized to address the varying units of each observed variable. The t-test was employed to compare continuous variables between two groups, while the Mann-Whitney U test was used for ordinal categories. The chi-square and Kendall’s τ-test were also applied to compare categorical data. The analysis was conducted using SPSS 28.0 and AMOS 28.0 (IBM), with a statistical significance level set at 5%.
2.5. Exploratory Factor Analysis
In this study, we conducted exploratory factor analysis using the maximum likelihood method with varimax rotation to identify latent variables. Our analysis revealed four distinct factors: subjective health, life satisfaction, pain, and illness scores. The second factor included lifestyle-related scores as well as the total food diversity score. The third factor is related to the social activity score. Lastly, the fourth factor encompasses awareness of aging, role changes, and the potential for disease prevention.
We labeled the subjective health and life satisfaction latent variable as “QOL.” The variables associated with recognizing age-related role changes and the belief in disease prevention were designated as “Aging Perception and Disease Preventability.” The cumulative contribution rate of the entire analysis was 38.2%.
Additionally, we calculated Cronbach’s alpha coefficient for the first factor (subjective health and life satisfaction) to be 0.41. For the fourth factor (recognition of age-related changes, recognition of role changes, and the confidence factor of disease prevention), the coefficient was 0.42. The second and fourth factors were combined and labeled as the latent variable “Pain, Disease, and Lifestyle” (Table 1).
3. Results
The survey included 1,571 men and 1,288 women, as shown in Table 2.
3.1. Stability and Causal Effects of the Same Latent Variables over Six Years
The stability of the same latent variable over six years was assessed using a cross-lag effect model. The standardized estimate of the causal relationship between [T1] and [T2] in the domains of “Pain, Illness, and Lifestyle” was 0.99 overall, ranging from 0.32 to 0.99 for both sexes across early and late age groups, indicating a highly significant stabilizing effect.
In the field of “Aging Perception and Disease Preventability,” the standardized estimates of the causal effects between [T1] and [T2] were 0.65 overall, ranging from 0.52 to 0.70. For “Quality of Life” (QOL), the estimates were 0.48 overall, ranging from 0.33 to 0.55. The causal relationships among the same latent variables over six years showed strong connections across all three domains (Figure 1, Table 3).
3.2. Synchronous Effect Model for Clarifying Indirect Effects
We estimated the indirect impact of “Pain, Illness, and Lifestyle” six years before on “Perception of Aging and Disease Preventability” to be 0.08(=0.47 x 0.17). Similarly, the indirect effect of “Pain, Illness, and Lifestyle” at T1 on “Quality of Life” at T2 was estimated at 0.004(=0.01 x 0.42).
Additionally, following the T1 and T2 surveys of “Perception of Aging and Disease Preventability,” the indirect effect on “Quality of Life” was estimated at 0.09(=0.15 x 0.63). The indirect effect from “Quality of Life” examined in T1 and T2 on “Pain, Illness, and Lifestyle” was estimated at 0.31(=0.15 x 0.12). On the other hand, the indirect effect on “Quality of Life” resulting from the T1 and T2 surveys regarding “Perception of Aging and Disease Preventability” had an estimated value of 0.005(=0.02 x 0.24). In contrast, the indirect effects of “Perception of Aging and Disease Preventability” on “Pain, Illness, and Lifestyle” from the T1 and T2 surveys were minor, with an estimate of 0.005 (=0.02 x 0.24) (Figure 2, Table 3).
3.3. Total Effect and Coefficient of Determination
We used the Finkel model to examine total effects, including both direct and indirect impacts. The total effect on “Aging Perception and Disease Prevention” (T2), six years later from “Pain, Illness, and Lifestyle” (T1), six years earlier, was found to be 0.46, ranging from 0.32 to 0.62. Similarly, the overall effect on “Quality of Life” (QOL) was estimated at 0.84, ranging from 0.72 to 0.92. The total impact on “QOL” (T2) from “Aging Perception and Disease Prevention” (T1) six years earlier was 0.11, with a range of 0.07 to 0.24. Additionally, the total effect on “Pain, Illness, and Lifestyle” (T2) from “Aging Perception and Disease Prevention” (T1) was 0.08, ranging from 0.04 to 0.29.
Additionally, the overall effect on “Aging Perception and Disease Prevention” (T2) from “Quality of Life” (QOL) (T1) six years earlier was found to be 0.27, ranging from 0.25 to 0.67. Similarly, the correlation between “Illness and Lifestyle” (T2) and “QOL” (T1) was 0.37, ranging from 0.25 to 0.67, as shown in Table 3. This research demonstrated that “Quality of Life” is more significantly influenced by “Pain, Illness, and Lifestyle” than by “Aging Perception and Disease Preventability,” as measured six years ago. Furthermore, the final models explained 70-99% of the coefficients of determination for the three latent variables. The coefficients of determination for each latent variable were more explanatory among the late elderly population, both men and women, except for “Aging Perception and Disease Preventability” in late elderly men (Table 3).
3.4. Primary Distribution of Survey Items by Sex and Age Groups
Regarding subjective health, the percentage of individuals reporting feeling “very healthy” ranged from 12.3% to 16.3%. There were no significant differences in subjective health based on gender or age group in the T1 or T2 surveys.
The proportion of participants who expressed high satisfaction with their lives ranged from 77.0% to 83.1%. We observed no significant gender differences in life satisfaction in T1 or T2. However, in the T2 survey, life satisfaction among late-older women was significantly lower than that of their early-older counterparts(Table 5).
The percentage of people who viewed aging positively ranged from 21.4% to 37.6%. There was no significant difference in perceptions based on gender in either the T1 or T2 surveys. In the T1 survey, more men in the late elderly group viewed aging as a positive aspect of life than those in the early elderly group. Furthermore, the percentage of respondents highlighting the positive aspects of aging ranged from 15.8% to 28.4%. In both the T1 and T2 surveys, men demonstrated significantly greater acceptance of aging than women. The results showed that, among the late elderly male group, a notably higher proportion acknowledged the benefits of aging than in the early elderly group. Additionally, the percentage of individuals who believed in the possibility of disease prevention ranged from 55.9% to 72.3%. The T1 study indicated that men held significantly stronger beliefs in disease prevention than women. Furthermore, older men exhibited significantly stronger beliefs in disease prevention than younger men.
This analysis examined the survey results collected at two different time points (T1 and T2) across various factors, including pain, disease count, social activities, lifestyle, and food diversity scores.
Pain scores ranged from 0.64 to 1.36, with women consistently reporting higher scores than men in both T1 and T2 surveys. Additionally, pain scores were higher among the late elderly compared to the early elderly for both genders. The scores for disease count ranged from 0.12 to 0.41. Women reported fewer diseases than men, and both genders indicated significantly higher disease scores in the late elderly population compared to the early elderly in both T1 and T2 surveys.
Social activity scores ranged from 2.00 to 2.32, with women consistently reporting higher scores than men. In the T1 survey, late elderly females showed higher social activity scores compared to their early elderly counterparts. Conversely, the T2 survey revealed that both men and women reported lower social activity scores among late elderly individuals than in the early elderly group.
The lifestyle scores ranged from 2.63 to 3.08. In both the T1 and T2 surveys, women consistently achieved higher lifestyle scores than men. However, there was no significant difference in lifestyle scores between the younger elderly and older elderly groups for either gender in both surveys.
The food diversity scores ranged from 7.60 to 9.59 points. The T1 and T2 surveys indicated that men had significantly higher food diversity scores than women. Aside from women in the T2 survey, dietary diversity scores were notably lower in the late elderly compared to the early elderly(Table 6).
4. Discussion
4.1. Causality Between Latent Variables
The findings indicated that “Pain, Illness, and Lifestyle” is slightly influenced by “Recognition of Aging and Disease Preventability” from six years ago. And also, “Recognition of Aging and Disease Preventability” was found to be much more influenced by “Pain, Illness, and Lifestyle” and “Quality of Life” (QOL) from six years earlier. The research further revealed that “Quality of Life” is more significantly affected by “Pain, Illness, and Lifestyle” than by “Recognition of Aging and Disease Preventability” six years earlier. Consequently, the hypothesis that higher awareness of aging and disease prevention leads to positive lifestyle habits and improves Quality of Life six years later could not be confirmed (Figure 1, Table 3).
Previous studies and theories [17] suggest that being health-conscious promotes better behaviors and improves quality of life. However, these ideas may be questioned. Instead, maintaining a satisfactory level of quality of life (QOL) might lead to a more positive view of aging and potentially help prevent disease six years later. Current health status may also influence future perceptions of aging.
In our previous causal structural study, we conducted a follow-up investigation into the causal relationship between two health factors. We found that mental health six years before was a crucial determinant of physical health. Therefore, this study’s findings support the evidence from previous studies [25].
Replicating these findings, including those of other generations, is essential to confirm their validity.
4.2. Desirable Health Support Activities Based on the Causal Structural Effects Model
Based on the same nationwide database, Kodama et al. [18] found that elderly individuals should exercise three times a week to maintain enjoyment and prevent a decline in Instrumental Activities of Daily Living (IADL) three years later. Our study’s results may align with those of Kodama et al. [18]. However, Martin et al. report that in a random sample of 1,140 individuals aged 50 and older, their preferred attitude toward aging (ATOA) significantly predicted physical and mental health, even after controlling for gender, age variables, and resilience. This suggests that interventions providing education about the positive aspects of aging and promoting optimism may help increase ATOA and, in turn, improve the physical and mental health of older adults, particularly cancer patients. This report represents an excellent study that controls for gender, age, and resilience among representative subjects. However, the impact of physical and mental health on subsequent ATOA remains unverified.
4.3. Distribution of Survey Items by Sex and Age Groups
In the T2 survey, older women were significantly less satisfied than their younger elderly counterparts. The background suggested a possible separation from their spouses.
It was observed that the proportion of individuals with a positive view of aging and the likelihood of disease prevention is higher in men than in women, and significantly greater in older elderly individuals compared to their younger counterparts. This may reflect a characteristic of the group where male survival extended into later stages.
Additionally, pain scores were notably higher in women than in men, particularly in the late elderly age group for both genders. Previous research indicating that the older you get, the more pain you experience was supported [26].
Social activity and lifestyle habits for women scored higher than those for men, potentially linked to women’s longer lifespans. However, the food score was significantly higher for men than for women. In this way, several characteristics were identified in the survey items, categorized by gender and age (Table 5 and Table 6). Since few previous studies have been similar, reproducibility is necessary.
4.4. Research Issue
This research aims to establish a causal relationship, which requires meeting specific criteria for universality and consistency. These criteria include: 1) temporal relationships, 2) strength of the relationship, 3) relevance, 4) intervention, 5) universality of relevance, and 6) consistency [27].
While this study has partially met the requirements for association and consistency, further detailed testing is needed to strengthen the claim of universality. Additionally, intervention studies with control groups must confirm the essential causal relationship.
The issue of selection bias [28] needs to be addressed. The survey analysts reported high subjective feelings about the respondents’ health at T1 and T2. The target group in this paper excludes those who passed away within six years. The participants in the survey were actively engaged in community activities, indicating that the analysis results reflect a healthier lifestyle for the group. Enhancing the generalizability of the analysis results derived from randomly selected populations is a consideration for the future.
Another research issue to consider in the future is the scale used in the study. The PGC Moral Scale [20] systematically addresses psychological distress, loneliness, satisfaction, and attitudes toward aging. However, the simplified scale used in this survey measured only perceptions and attitudes toward aging. As a result, the research findings were confined to a scale that assessed only a portion of the comprehensive scale. Previous significant studies mainly focused on scales related to the importance of aging, reporting predictive validity for maintaining survival and life satisfaction [12,13].
It is crucial to explore the mechanisms that support survival, including relational and causal factors, through intervention studies that thoroughly analyze all systematic scales. Sapporo et al. [29] conducted intervention studies focusing on the subjective health of older adults in the community. Their findings revealed that health education interventions aimed at improving subjective health over 18 months were more effective in preventing institutional admissions and deaths than those in the control group.
Therefore, future practical support for promoting healthy aging in older adults should emphasize the significance of maintaining QOL. Additionally, research should aim to yield results with external validity to assist in developing a comprehensive support program. This program should include various supportive elements, such as a living environment that promotes physical activity, dietary habits, psychological factors, and social engagement, including socioeconomic status. Such an initiative is expected to demonstrate how intervention research can improve quality of life (QOL).
Establishing a clear causal structure, which includes socioeconomic factors such as academic background and annual income, is crucial for addressing various research issues, as these factors can significantly influence QOL outcomes. This study did not analyze the necessary care and maintenance for survival, particularly regarding socioeconomic status. Future research is expected to clarify the causal structure of healthy life expectancy [30].
5. Conclusion
Our study suggests that a high quality of life may influence perceptions of aging, disease prevention, pain, illness, and lifestyle six years later. Additionally, pain, illness, and lifestyle significantly impacted quality of life (QOL) six years afterward. Moreover, the ability to recognize aging and the potential for disease prevention had only a minor effect on determining quality of life (QOL) six years later. It was suggested that Becker et al.’s belief model (17) might not apply to the elderly. Successfully maintaining quality of life may help improve awareness of disease prevention and positively influence pain, illness, and lifestyle.
Funding
The Japanese Ministry of Education, Culture, Sports, Science, and Technology funded the study with a Grant-in-Aid for Scientific Research (B) (No.1531012 & 14350327). The Longevity Center for Social Development and the Liaison Council for the Promotion of the Bright Longevity Society cooperated excellently on this research.
Consent of the Institutional Review Board
This investigation received approval from the Institutional Review Board for Human Research at Sagami Women’s University, with acceptance number 1,793, dated October 27, 2017. This study was conducted in accordance with the Declaration of Helsinki. All participants completed the questionnaire based on informed consent.
Data Availability
The analytical data from this study are available to the UMIN SYSTEM in Japan as an open system. https://upload.umin.ac.jp/cgi-bin/fileshare/upload.cgi?DELETE=1&on=589518 Additionally, analytical data and materials can be obtained from the first author via email: star@onyx.dti.ne.jp (Hoshi, First author).
Acknowledgments
This research was conducted with the outstanding cooperation of the Longevity Center for Social Development and the Liaison Council for the Promotion of Bright Longevity Society. We sincerely thank Mr. Kiyoyuki Yakushiji, Yamato Kazuki of the Longevity Center, and everyone nationwide who participated in the questionnaire survey.
Conflicts of Interest Statement
All authors declare that there is no conflict of interest. The funders had no role in the study’s design, data analysis, or interpretation.
Division of Roles for Writing a Treatise
Hoshi summarized the entire sentence. Fujita, Kurimori, and Kodama worked together to collect and analyze data.
Publication Content
All of the researchers agreed to publish this original paper.
Abbreviations
The following abbreviations are used in this manuscript.
| ATOA: | Attitudes Toward Own Aging |
| SPAs | Self-perceptions of Aging |
| QOL | Quality of Life |
| WHO | World Health Organization |
| ICOPE | Integrated Care for Older People |
| PGC | Philadelphia Geriatric Center Morale Scale |
| NFI | Normed Fit Index |
| IFI | Incremental Fit Index |
| RMSEA | Root Mean Square Error of Approximation |
References
- Labor Statistics Association. Trends in national hygiene. 2018/2019, 65, pp. 82–84. Available online: https://www.hws-kyokai.or.jp/publishing/type/magazine/103-magazine-list/2519-eis.
- Sakurai, N.; Hoshi, T. The aim of Health Japan 21. hokennokagaku 2003, 45, 552–557. Available online: https://search.jamas.or.jp/link/ui/2004038424.
- The second edition of the Health Business Guidelines based on the characteristics of older people. Medical Division for the Elderly, Insurance Bureau, Ministry of Health, Labor and Welfare in Japan. Available online: https://www.mhlw.go.jp/content/12401000/000604327.pdf (accessed on 20 May 2022).
- Berkman, L.; Breslow, L. Health and Ways of Lliving. OXFORD UNIVERSITY PRESS. 1983. Health and ways of living by Lisa F. Berkman | Open Library.
- Kaplan, G.A.; Camacho, T. Perceived health and mortality: A nine-year follow-up of the human population laboratory cohort. Am J Epidemiol 1983, 117, 292–304, Perceived health and mortality: A nine-year follow-up of the human population laboratory cohort - PubMed (nih.gov). [Google Scholar] [CrossRef]
- Berkman, L.F.; Syme, S.L. Social networks, host resistance, and mortality: A nine-year follow-up study of Alameda County residents. Am J Epidemiol 1979, 109, 186–204, Social networks, host resistance, and mortality: A nine-year follow-up study of Alameda County residents - PubMed (nih.gov). [Google Scholar] [CrossRef]
- Seeman, T.E.; Kaplan, G.A.; Knudsen, L.; et al. Social network ties and mortality among the elderly in the Alameda County Study. Am J Epidemiol 1987, 126, 714–723, Social network ties and mortality among the elderly in the Alameda County Study - PubMed (nih.gov). [Google Scholar] [CrossRef]
- Lorenzo-López, L.; Maseda, A.; de Labra, C.; et al. Nutritional determinants of frailty in older adults: A systematic review. BMC Geriatr 2017, 17, 108, Nutritional determinants of frailty in older adults: A systematic review - PubMed (nih.gov). [Google Scholar] [CrossRef]
- Rashidi-Pourfard, N.; Amirabdollahian, F.; Haghighatdoost, F. Dietary patterns and frailty: A systematic review and meta-analysis. Nutr Rev 2019, 77, 498–513, Dietary patterns and frailty: A systematic review and meta-analysisPubMed (nih.gov). [Google Scholar] [CrossRef]
- Reuben, N.; Heather, G.A.; Joan, K.M.; Becca, R.L. Retirement as Meaningful: Positive Retirement Stereotypes Associated with Longevity. J Soc Issues. 2016, 72, 69–85, Epub 2016 Mar 9. [Google Scholar] [CrossRef]
- Shirai, M. Analyzing the differences in positive thinking between the healthy elderly and the elderly with long-term care risk. Japanese. Journal of public health 2019, 66, 88–95, [Analyzing the differences in positive thinking between the healthy elderly and the elderly with long-term care risk] - PubMed (nih.gov). [Google Scholar]
- Colleen, T.W.; Richard, B.; Prudence, M.M.; et al. Self-perceptions of aging: A systematic review of longitudinal studies. Psychol Aging. 2021, 36, 773–789, Epub 2021 Sep 9. [Google Scholar] [CrossRef]
- Kodama, S.; Kurimori, S.; Hoshi, T. Association between feelings of happiness among community-dwelling, independent, elderly individuals in an Okinawan farm village and survival three years later. Journal of public health 2018, 65, 199–209, [Association between feelings of happiness among community-dwelling, independent, elderly individuals in an Okinawan farm village and survival three years later] - PubMed (nih.gov). [Google Scholar]
- Ng, T.P.; Feng LNyunt, M.S.; et al. Nutritional, Physical, Cognitive, and Combination Interventions and Frailty Reversal Among Older Adults: A Randomized Controlled Trial. Am J Med 2015, 128, 1225–1236.e1221, Nutritional, Physical, Cognitive, and Combination Interventions and Frailty Reversal Among Older Adults: A Randomized Controlled Trial - PubMed (nih.gov). [Google Scholar] [CrossRef]
- Yoshizawa, U.; Tanaka, T.; Takahashi, K.; et al. The associations of frailty with regular participation in physical, cultural, and community social activities among independent elders in Japan. Journal of public health 2019, 66, 306–316, [The associations of frailty with regular participation in physical, cultural, and community social activities among independent elders in Japan] - PubMed (nih.gov). [Google Scholar]
- World Health Organization. Integrated care for older people: Guidelines on community-level interventions to manage declines in intrinsic capacity; World Health Organization: Geneva, 2017; Volume ix, 46 p, Integrated care for older people: Guidelines on community-level interventions to manage declines in intrinsic capacity (who.int). [Google Scholar]
- Becker, M.; Drachman, R.; Kirscht, J. A new approach to explaining sick-role behavior in low-income populations. Am J Public Health 1974, 64, 205–216, A new approach to explaining sick-role behavior in low-income populations - PubMed (nih.gov). [Google Scholar] [CrossRef]
- Kodama, S.; Hoshi, T.; Kurimori, S. Decline in independence after three years and its association with dietary patterns and IADL-related factors in community-dwelling older people: An analysis by age stage and sex. BMC 2021, 21, 385, Decline in independence after three years and its association with dietary patterns and IADL-related factors - Search Results - PubMed (nih.gov). [Google Scholar] [CrossRef]
- Explanation and points to note in the questionnaire for the late-stage elderly. Medical Division for the Elderly, Insurance Bureau, Ministry of Health, Labor and Welfare in Japan. 2019. Available online: https://www.mhlw.go.jp/content/12401000/000557576.pdf (accessed on 20 February 2022).
- Lawton, M.P. The Philadelphia Geriatric Center Morale Scale: A revision. J Gerontol 1975, 30, 85–89, The Philadelphia Geriatric Center Morale Scale: A revision - PubMed (nih.gov). [Google Scholar] [CrossRef]
- Loke, S.C.; Abdullah, S.S.; Chai, S.T.; et al. Assessment of factors influencing morale in the elderly. PLoS ONE 2011, 6, e16490. [Google Scholar] [CrossRef]
- Levy, B.; Slade, M.; Kasl, S. Longitudinal benefit of positive self-perceptions of aging on functional health. J Gerontol B Psychol Sci Soc Sci 2002, 57, 409–417, Longitudinal benefit of positive self-perceptions of aging on functional health - PubMed (nih.gov). [Google Scholar] [CrossRef]
- Finkel, S.E. Causal analysis with panel data; Sage Publications: California, 1995; pp. 41–56. [Google Scholar] [CrossRef]
- Bentler, P.M.; Dudgeon, P. Covariance structure analysis: Statistical practice, theory, and directions. Annu Rev Psychol 1996, 47, 563–592. [Google Scholar] [CrossRef]
- Hoshi, T.; Takagi, C.; Bosako, Y.; et al. Chronological evaluation of physical, psychological and social health of urban elderly dwellers over 6 years and assesment of cuasal inter-relationships. Nihon Koshu Eisei Zasshi 2011, 58, 491–500, [Chronological evaluation of physical, psychological and social health of urban elderly dwellers over 6 years and assessment of causal inter-relationships] - PubMed (nih.gov). [Google Scholar]
- Stone, R. The Assumptions on Which Causal Inferences Rest. Journal of the Royal Statistical Society. Series B (Methodological) 1993, 55, 455–466. [Google Scholar] [CrossRef]
- Wong, C.K.; Mak, R.Y.; Kwok, T.S.; Tsang, J.S. Prevalence, Incidence, and Factors Associated With Non-Specific Chronic Low Back Pain in Community-Dwelling Older Adults Aged 60 Years and Older: A Systematic Review and Meta-Analysis. Pain 2022, 23, 509–534. [Google Scholar] [CrossRef]
- Yusuf, S.; Collins, R.; Peto, R. Why do we need some large, simple randomized trials? Stat Med 1984, 3, 409–422, Why do we need some large, simple randomized trials? - PubMed (nih.gov). [Google Scholar] [CrossRef]
- Shapiro, A.; Taylor, M. Effects of a community-based early intervention program on the subjective well-being, institutionalization, and mortality of low-income elders. Gerontologist 2002, 42, 334–341. [Google Scholar] [CrossRef]
- Hoshi, T. SES. Dietary and lifestyle habits, three health-related dimensions, and healthy survival days. In The Structure of Healthy Life Determinants: Lessons from the Japanese Aging Cohort Studies; Hoshi, T., Kodama, S., Eds.; Springer: Singapore, 2018; pp. 134–189, The Structure of Healthy Life Determinants: Lessons from the Japanese Aging Cohort Studies SpringerLink. [Google Scholar]
Figure 1.
Cross-lag effect model of “QOL,” “Pain, Illness, and Lifestyle,” and “Aging Perception and Disease Preventability.
Figure 1.
Cross-lag effect model of “QOL,” “Pain, Illness, and Lifestyle,” and “Aging Perception and Disease Preventability.
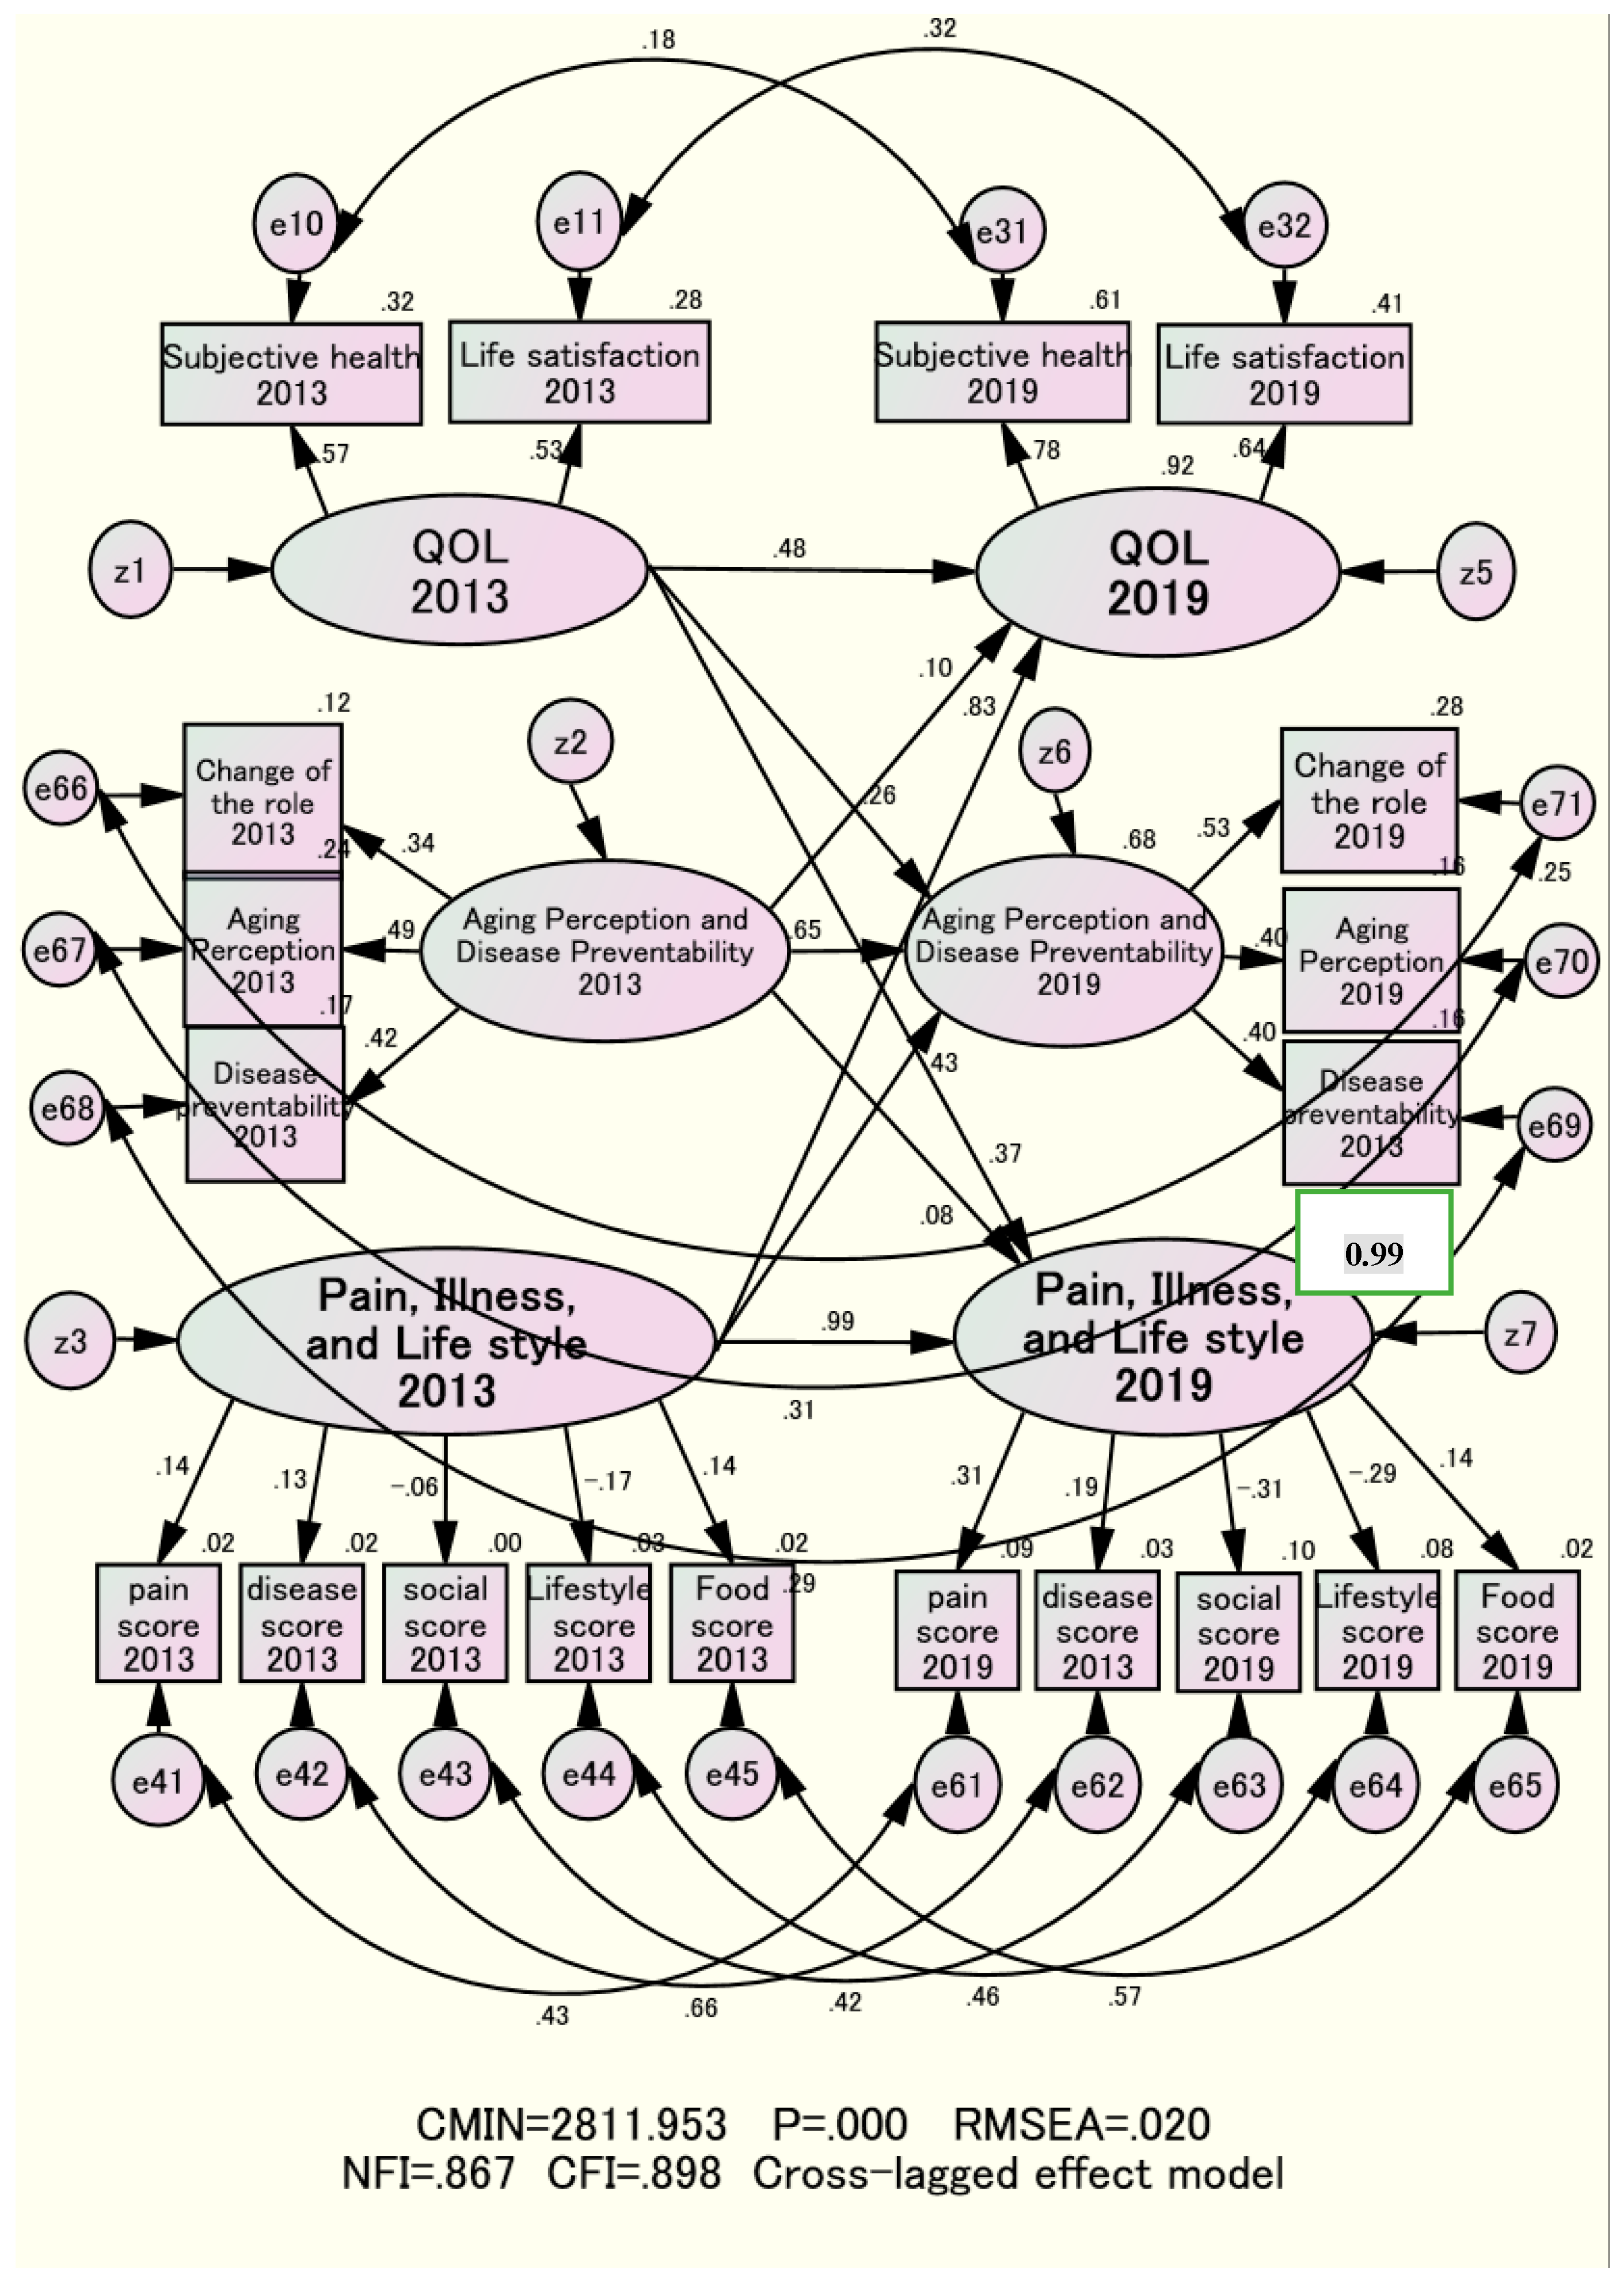
Figure 2.
Synchronous effect model of the “QOL,” “Pain, Illness, and.Lifestyle,” and “Aging Perception and Disease Preventability.
Figure 2.
Synchronous effect model of the “QOL,” “Pain, Illness, and.Lifestyle,” and “Aging Perception and Disease Preventability.


Table 1.
Exploratory Factor Analysis.
| QOL | Life style | Social participation | Aging Perception and Disease Preventability | |
| Subjective health | .910 | .011 | .002 | .208 |
| Life satisfaction | .284 | -.066 | -.054 | .257 |
| Number of pain points | .271 | -.007 | .000 | .076 |
| Number of disease points | .203 | -.054 | -.021 | -.012 |
| Lifestyle-related score | -.139 | .989 | -.024 | .008 |
| Food diversity total score | .015 | -.125 | -.026 | .108 |
| Social activity score | -.063 | .030 | .983 | -.166 |
| Aging perception | .047 | .006 | -.038 | .497 |
| Change of the role | .065 | -.032 | -.142 | .426 |
| Disease preventability | .131 | -.071 | .028 | .406 |
| Cumulative contribution rate(%) |
10.5 | 20.8 | 30.7 | 38.2 |
| Cronbach’s confidence coefficient | 0.409 | 0.152 | 0.423 |
Table 2.
Analytic Subjects by Age and Sex.
| 65-69 | 70-74 | 75-79 | 80-84 | Total | ||
| Men | 508 | 532 | 352 | 179 | 1571 | |
| 32.3% | 33.9% | 22.4% | 11.4% | 100.0% | ||
| Women | 421 | 461 | 298 | 108 | 1288 | |
| 32.7% | 35.8% | 23.1% | 8.4% | 100.0% | ||
| Total | 929 | 993 | 650 | 287 | 2859 | |
| 32.5% | 34.7% | 22.7% | 10.0% | 100.0% | ||
Table 3.
Standardized estimates of the Direct, Indirect, and Total effects by sex and age group.
| Men | Women | |||||
| 65-74 | 75-84 | 65-74 | 75-84 | Total | ||
| Pain, illness, and life style13⇒Pain, illness, and life style19 | 0.95 | 1.00 | 0.32 | 0.62 | 0.98 | |
| QOL13⇒QOL19 | 0.52 | 0.33 | 0.53 | 0.55 | 0.48 | |
| Aging Perxeption13⇒Aging Perception 19 | 0.67 | 0.61 | 0.70 | 0.52 | 0.64 | |
| Pain, illness, and life style13⇒Pain, illness, and life style19⇒QOL19 | 0.11 | 0.01 | 0.02 | 0.42 | 0.35 | |
| Pain, illness, and life style13⇒Pain, illness, and life style19⇒Aging Perxeption119 | 0.03 | 0.17 | 0.47 | 0.01 | 0.19 | |
| QOL13⇒QOL19⇒Aging Perxeption19 | 0.23 | 0.05 | 0.15 | 0.63 | 0.33 | |
| QOL13⇒QOL19⇒Pain, illness, and lifestyle19 | 0.15 | 0.41 | 0.15 | 0.81 | 0.31 | |
| Aging Perxeption13⇒Aging Perception 19⇒QOL19 | 0.05 | 0.03 | 0.02 | 0.24 | 0.18 | |
| Aging Perxeption13⇒Aging Perception 19⇒Pain, illness, and life style19 | 0.05 | 0.14 | 0.02 | 0.01 | 0.18 | |
| Pain, illness, and lifestyle13⇒⇒⇒QOL19 | 0.72 | 0.90 | 0.76 | 0.92 | 0.84 | |
| Pain, illness, and lifestyle13⇒⇒⇒Aging Perception19 | 0.48 | 0.43 | 0.32 | 0.62 | 0.46 | |
| QOL13⇒⇒⇒Pain, illness, and lifestyle19 | 0.34 | 0.25 | 0.45 | 0.67 | 0.37 | |
| QOL13⇒⇒⇒Aging Perxeption19 | 0.23 | 0.20 | 0.37 | 0.44 | 0.27 | |
| Aging Perxeption13⇒⇒⇒QOL19 | 0.18 | 0.11 | 0.07 | 0.24 | 0.11 | |
| Aging Perxeption13⇒⇒⇒Pain, illness, and lifestyle19 | 0.04 | 0.14 | 0.12 | 0.29 | 0.08 | |
| ⇒means Direct standard effect | ||||||
| ⇒⇒means Indirect standard effect | ||||||
| ⇒⇒⇒means Total standard effect | ||||||
Table 4.
Each Latent Variable Coefficient of Determination by Sex and Age Group.
| Men | Women | |||||
| 65-74 | 75-84 | 65-74 | 75-84 | |||
| Aging Perception and Disease Preventability 2019 | 0.70 | 0.59 | 0.72 | 0.85 | ||
| QOL 2019 | 0.83 | 0.88 | 0.87 | 0.99 | ||
| Pain, illness, and lifestyle 2019 | 0.97 | 0.99 | 0.99 | 0.99 | ||
Table 5.
Distribution of the Survey Items in Basic Survey(T1) 2013 and Follow-up Survey(T2) by Sex ang Age Groups.
Table 5.
Distribution of the Survey Items in Basic Survey(T1) 2013 and Follow-up Survey(T2) by Sex ang Age Groups.
| Basic Survey(T1) 2013 | Followup survey(T2) 2019 | ||||||||||||||||||||
| 65-74 Men | 75-84 Men | 65-74 Women | 75-84 Women | 65-74 Men | 75-84 Men | 65-74 Women | 75-84 Women | ||||||||||||||
| n | % | n | % | P | n | % | n | % | P | N | % | n | % | P | n | % | n | % | P | ||
| Subjective health | |||||||||||||||||||||
| excellent | 170 | 16.4 | 81 | 15.5 | 135 | 13.8 | 71 | 16.2 | 150 | 17.1 | 73 | 18.3 | 118 | 13.8 | 46 | 12.3 | |||||
| Fair | 787 | 76.0 | 394 | 75.5 | 726 | 74.1 | 305 | 69.6 | 668 | 76.0 | 287 | 72.1 | 652 | 76.5 | 275 | 73.7 | |||||
| Poor | 61 | 5.9 | 37 | 7.1 | 84 | 8.6 | 46 | 10.5 | 44 | 5.0 | 31 | 7.8 | 62 | 7.3 | 33 | 8.8 | |||||
| very poor | 17 | 1.6 | 10 | 1.9 | 35 | 3.6 | 16 | 3.7 | 17 | 1.9 | 7 | 1.8 | 20 | 2.3 | 19 | 5.1 | |||||
| Life satisfaction | |||||||||||||||||||||
| Satisfy | 824 | 81.8 | 408 | 83.1 | 760 | 77.7 | 339 | 77.0 | 708 | 81.4 | 312 | 80.6 | 669 | 78.3 | 270 | 72.6 | * | ||||
| Neither | 151 | 15.0 | 67 | 13.6 | 189 | 17.3 | 81 | 18.4 | 136 | 15.6 | 64 | 16.5 | 165 | 19.3 | 83 | 22.3 | |||||
| not satisfy | 32 | 3.2 | 16 | 3.3 | 49 | 5.0 | 20 | 4.5 | 26 | 3.0 | 11 | 2.8 | 20 | 2.3 | 19 | 5.1 | |||||
| Aging perception | |||||||||||||||||||||
| Good | 340 | 34.5 | 203 | 43.1 | * | 228 | 23.5 | 114 | 25.8 | 282 | 33.3 | 140 | 37.6 | 181 | 21.4 | 83 | 22.4 | ||||
| Neither | 567 | 57.5 | 236 | 50.1 | 644 | 66.5 | 286 | 64.7 | 515 | 60.9 | 204 | 54.8 | 593 | 70.2 | 256 | 69.0 | |||||
| Bad | 79 | 8.0 | 32 | 6.8 | 97 | 10.0 | 42 | 9.5 | 49 | 5.8 | 28 | 7.5 | 71 | 8.4 | 32 | 8.6 | |||||
| Changing of the role | |||||||||||||||||||||
| important | 238 | 23.9 | 136 | 28.4 | * | 154 | 15.8 | 63 | 15.8 | 218 | 25.6 | 103 | 27.5 | 140 | 16.4 | 74 | 19.6 | ||||
| Neither | 598 | 60.1 | 282 | 58.9 | 630 | 64.7 | 630 | 64.7 | 570 | 67.1 | 233 | 62.3 | 624 | 73.0 | 247 | 65.5 | |||||
| not important | 159 | 16.0 | 61 | 12.7 | 190 | 19.5 | 190 | 19.5 | 62 | 7.3 | 38 | 10.2 | 91 | 10.6 | 56 | 14.9 | |||||
| Disease preventability | |||||||||||||||||||||
| Right | 654 | 65.4 | 347 | 72.3 | * | 566 | 58.0 | 260 | 59.1 | 541 | 63.5 | 239 | 63.1 | 487 | 57.0 | 212 | 55.9 | ||||
| Neither | 282 | 28.2 | 102 | 21.3 | 308 | 31.6 | 141 | 32.0 | 270 | 31.7 | 115 | 30.3 | 274 | 32.0 | 124 | 32.7 | |||||
| not right | 64 | 6.4 | 31 | 6.5 | 102 | 10.5 | 38 | 19.5 | 41 | 4.8 | 25 | 6.6 | 94 | 11.0 | 43 | 11.3 | |||||
| * P<0.05, ** P<0.01, *** P<0.001 | |||||||||||||||||||||
| Associations were analyzed for T1 and T2, and for each gender, compared by early and late elderly groups. Statistical results are indicated by *. | |||||||||||||||||||||
Table 6.
Distribution of the Survey Items in Basic Survey(T1) 2013 and Follow-up Survey(T2) by Sex ang Age Groups.
Table 6.
Distribution of the Survey Items in Basic Survey(T1) 2013 and Follow-up Survey(T2) by Sex ang Age Groups.
| Basic Survey(T1) 2013 Follow up Survey(T2) 20199 | ||||||||||
| 65-74 | 75-84 | 65-74 | 75-84 | |||||||
| Mean | SD | Mean | SD | P | Mean | SD | Mean | SD | P | |
| Number of Pain Scores in Men | 0.64 | 0.74 | 0.83 | 0.85 | * | 0.87 | 0.91 | 1.05 | 0.98 | * |
| Number of Pain Scores in Women | 0.77 | 0.84 | 1.12 | 0.99 | *** | 1.03 | 0.98 | 1.36 | 1.11 | |
| Number of Disease Scores in Men | 0.26 | 0.50 | 0.33 | 0.54 | * | 0.33 | 0.55 | 0.41 | 0.60 | * |
| Number of Disease Scores in Women | 0.12 | 0.36 | 0.22 | 0.46 | *** | 0.19 | 0.43 | 0.29 | 0.53 | *** |
| Social Activity Scores in Men | 2.09 | 1.08 | 2.18 | 1.09 | 2.16 | 1.08 | 2.00 | 1.14 | * | |
| Social Activity Scores in Women | 2.14 | 1.10 | 2.32 | 1.08 | * | 2.28 | 1.11 | 2.09 | 1.17 | * |
| Lifestyle-related Scores in Men | 2.63 | 0.89 | 2.66 | 0.94 | 2.63 | 0.89 | 2.70 | 0.94 | ||
| Lifestyle-related Scores in Women | 3.04 | 0.88 | 3.08 | 0.84 | 3.00 | 0.86 | 2.96 | 0.85 | ||
| Food Diversity Scores in Men | 9.59 | 3.02 | 8.53 | 2.98 | 8.95 | 3.12 | 8.14 | 3.03 | ||
| Food Diversity Scores in Women | 8.36 | 2.68 | 7.78 | 2.63 | 7.71 | 2.86 | 7.60 | 2.90 | ||
| * P<0.05, ** P<0.01, *** P<0.001 SD: Standard Deviation | ||||||||||
Disclaimer/Publisher’s Note: The statements, opinions and data contained in all publications are solely those of the individual author(s) and contributor(s) and not of MDPI and/or the editor(s). MDPI and/or the editor(s) disclaim responsibility for any injury to people or property resulting from any ideas, methods, instructions or products referred to in the content. |
© 2025 by the authors. Licensee MDPI, Basel, Switzerland. This article is an open access article distributed under the terms and conditions of the Creative Commons Attribution (CC BY) license (http://creativecommons.org/licenses/by/4.0/).
Copyright: This open access article is published under a Creative Commons CC BY 4.0 license, which permit the free download, distribution, and reuse, provided that the author and preprint are cited in any reuse.


