Submitted:
30 June 2025
Posted:
01 July 2025
You are already at the latest version
Abstract
In this paper, we present a comprehensive analysis of ensemble deep learning models for DNA sequence classification. We explore the performance of three standalone models: Convolutional Neural Networks (CNN), Bidirectional Long Short-Term Memory (BiLSTM), and Gated Recurrent Units (GRU), along with an ensemble approach that com-bines all three. Our study evaluates the models based on four performance metrics: accu-racy, precision, recall, and F1 score. The ensemble model achieved an accuracy of 90.6%, with precision, recall, and F1 score all at 0.91. We compare these results to the standalone models and demon-strate that ensemble learning significantly improves classification performance in the context of DNA sequence data. Additionally, we review relevant stud-ies that have applied deep learning models to similar tasks and discuss the advantages of combining CNN, BiLSTM, and GRU for sequence classification tasks.
Keywords:
ensemble learning
; convolutional neural network (CNN)
; bidirectional long short-term memory (BiLSTM)
; gated recurrent units (GRU)
; DNA sequence classification
; deep learning
Abstract
In this paper, we present a comprehensive analysis of ensemble deep learning models for DNA sequence classification. We explore the performance of three standalone models: Convolutional Neural Networks (CNN), Bidirectional Long Short-Term Memory (BiLSTM), and Gated Recurrent Units (GRU), along with an ensemble approach that combines all three. Our study evaluates the models based on four performance metrics: accuracy, precision, recall, and F1 score. The ensemble model achieved an accuracy of 90.6%, with precision, recall, and F1 score all at 0.91. We compare these results to the standalone models and demonstrate that ensemble learning significantly improves classification performance in the context of DNA sequence data. Additionally, we review relevant studies that have applied deep learning models to similar tasks and discuss the advantages of combining CNN, BiLSTM, and GRU for sequence classification tasks.
1. Introduction
The classification of DNA sequences is a critical task in bioinformatics, as it plays a fundamental role in various biological studies, including gene identification, disease prediction, and evolutionary analysis [1], With the exponential growth of genomic data, traditional machine learning algorithms often face challenges in handling the high-dimensional and complex nature of this data [2]. In recent years, deep learning models have become powerful tools for sequence classification, providing significant improvements over classical methods [3]. Among these deep learning architectures, Convolutional Neural Networks (CNNs), Bidirectional Long Short-Term Memory (BiLSTM) networks, and Gated Recurrent Units (GRU) have demonstrated strong performance in sequence data analysis, particularly for DNA sequence classification ([4,6]
CNNs excel at capturing local patterns in sequential data, making them ideal for DNA sequence analysis, where local motifs play a crucial role in sequence function [7] BiLSTM networks, which take into account both past and future information in sequence data, have been shown to be highly effective in capturing long-range dependencies, a critical feature in DNA sequence classification [8]. Similarly, GRU networks, which are variants of LSTMs, have similar advantages in sequence classification with fewer parameters, hence faster training times than LSTMs [9]. While these models have shown success on their own, there is still room for improvement in performance that can be achieved with ensemble methods.
Ensemble learning techniques combine multiple models by leveraging their complementary strengths to obtain better predictive [10]. These methods have widely been recognized for their ability to perform better than single models by reducing both variance and bias; hence, they have become a very useful approach to solving such complex tasks as DNA sequence classification [11]. In ensemble models, CNNs, BiLSTMs, and GRUs can be combined to achieve more robust results by capturing different aspects of the sequence data, such as local patterns, long-range dependencies, and temporal structures.
This paper focuses on the performances of CNN, BiLSTM, and GRU for classifying DNA sequences and further makes a comparison among them with the ensemble approach comprising all three. We hope to prove that, with ensemble learning, it’s possible to raise the accuracy and robustness of the classification tasks, therefore offering a more reliable method for the analysis of big-scale genomic data.
2. Background and Related Work
Another various class of sequence classification was presented in [12], which proposes non-parametric techniques along with the k-nearest-neighbour classification method. According to the technique, it makes use of the compression rates of various algorithms, including Gzip, Snappy, Brotli, LZ4, Zstandard, BZ2 and LZMA. In this process, it provides a resource-efficacious result regarding the classification of an exact sequence where a comparison is being made based on compressed forms. The Brotli compression algorithm, while very slow in processing, turned out to produce the best accuracy in classifying DNA sequences from human beings, chimpanzees, and dogs. This also proves the robustness of embedding the compression algorithms into the processes of classification in applications related to bioinformatics about efficiency and precision. Ozan proposed a new class of classification by incorporating compression algorithms with k-nearest-neighbour algorithms in the classification. These results alleviate the limitation of competitive computational resources to some degree at competitive accuracies, opening up ways toward an improvement in efficiency and effectiveness within DNA sequence analysis.
[13] introduced a highly advanced, machine-learning-based predictor about DNA I -motifs, pinpointing DNA secondary structures within cytosine-rich DNA sequences. Putative-iM-Searcher is an algorithm that predicts i-motif conformations by using different strategies, including overlapping and non-overlapping or greedy and non-greedy methods. In more detail, the tool iM-Seeker includes Putative-iM-Searcher for predicting regions of the human genome containing putative i-motif-forming sequences. This was followed by the use of the Balanced Random Forest model in predicting the status, while the XGBoost regression model was used in targeting the strength of folding of the same motifs. The Balanced Random Forest model yielded an accuracy of 81%, recall of 77%, specificity of 81%, and AUROC score of 87% for i-motif formation. It is important to mention that this model reached a very good performance on all folded i-motifs, including the unfolded C-rich sequences. Besides, very good generalization ability was proved, showing that the five-fold cross-validation scores were always higher than 0.8. Among the different regression models checked for i-motif folding strength prediction, the best results were obtained using XGBoost: it provided a high value of R² = 0.458 with small errors; it therefore can be stated to be very effective for this type of prediction. In [9], the authors aimed at improving efficiency in DNA sequence analysis classification using different machine learning methods. In this current research, the full model is proposed, where pattern-matching algorithms will be combined with different machine-learning classifiers such as Random Forest, K-Nearest Neighbors, Naïve Bayes, Decision Tree, and Support Vector Machine.
This would include the following major steps: DNA data pre-processing, feature extraction, development of classification model, and lastly pattern matching for determination of sequence similarity. For these algorithms, performance metrics used in the comparison include the F1 score, recall, precision, execution time, and accuracy. In this paper, among all the tested classifiers, the highest accuracy and F1 score were recorded by the linear SVM model, proving that this model performed better in classifying DNA sequences. Their results do bring in a variety of practical utility for potential applications, not only in drug discovery and personalized medicine but also in the disease diagnosis perspective of the disease. It further describes the pros and each algorithm’s cons, thereby acting as an indication regarding choosing which technique one must utilize against a set or set of jobs.
Hence, further research in this direction is likely to result in fine-tuning of the techniques so far proposed, and may, in all probability, lead to increased accuracy and speed of DNA sequence analysis.[14] reviews machine learning methods for bioinformatics strictly related to multiple aspects of analyzing DNA sequencing data strands and several major fields of genomics. This work shows how algorithms of machine learning are applied for the organization of large-scale data obtained with the help of a contemporary sequencing tool. The review focuses on the use of ML for genome assembly, gene annotation, variant calling, and GWAS.
These methods that help in lifting short DNA leads to correct positions for assembling a genome, finding genes and regions of functional significance, distinguishing genetic differences from sequencing errors, and in the identification of genetic markers linked with specific traits or diseases. Because of the complexity with genomics, the introduction of machine learning has brought wanted improvements in genomic research. These algorithms model the features of the data sets, make predictions on what might be the underlying link between genetics and diseases, and enhance drug targeting and personalized medicine. It thereby established the fact that machine learning changed the face of genomics by showing how it has been able to browse heaps of available genomic data and comes out with useful knowledge and information that would normally remain unnoticed with everyday methods.
Until 2023, in-depth review about application of Machine learning to mining DNA sequences by [15] was centered upon classification, clustering, pattern recognition methods. This work will also research how these approaches enable meaningful in-formation to be extracted from large data sets and find significant patterns in the DNA sequences. Importantly, the paper highlights the pros and cons of various machine learning algorithms in relation to their capability for filtering through a vast volume of data for patterns that might not be noticed using other methods. It brings to the fore the predictability of biological systems by applying machine learning to predict functions from DNA sequences and, thus, obtaining insight into evolutionary relationships.
This paper looks at the development of sequencing technology, challenges involved in the analysis of DNA sequence data, and some probable ways through which ma-chine learning can offer solutions. With these sophisticated algorithms, in fact, it would facilitate a more informed understanding of the genetic information by re-searchers about biological systems and thus assured that without the advancement in machine learning techniques, it would not have been possible to analyze DNA sequence data. It is also insightful for the readers because it gives an understanding of how the use of machine learning tools would better the interpretation.
Suresh et al. [16] presented the use of advanced machine learning and deep learning techniques to improve DNA sequencing. This paper incorporates decision trees, random forests, and other types of deep learning models in improving DNA data analysis. These approaches are essential in the forecast of future potential medical conditions, a genetic predisposition, and have been one of the ways through which the 4.0 technologies have found application in medicine for more accurate diagnoses and better treatment options. The paper exposes how sophisticated these methods help reasonably in categorizing DNA sequences and forecasting patients’ health status. Such sophisticated algorithms enable the researcher to show strengths that machine learning and deep learning models can get while yielding key insights into genetic data to improve the accuracy of a prediction, hence providing best practices in patient care. It thus presented the transformative potential of these technologies in medical diagnosis by underlining their role in the advance of DNA sequencing methods.
Juneja [17] has discussed the DNA sequence classification based on machine learning, specially focused on the Multinomial Naive Bayes algorithm. The algorithm has been applied to three DNA sequences in this paper-namely, Chimpanzee, Dog, and Human datasets for the classification of gene family and original vs. mutant sequences. This examines the substring length parameter in respect to classification performance. It reflects the increase of metrics such as accuracy, precision, recall, and F1 score with a gradual increase of k until it reaches its best point and subsequently declines when computation overhead rises beyond the capacity to handle increased size. The research concluded that the Multinomial Naive Bayes algorithm could give an astonishing accuracy of 98.4%, showing superiority in several classifiers concerning its accuracy and flexibility when using variable gene sequence lengths. This research demonstrates the efficiency of the algorithm in classifying DNA sequences and thus contributes much to bioinformatics in handling huge volumes of genetic data with immense diversity and complexity.
In the work of [18], the derivative Boyer Moore, d-BM, was developed to increase the computational efficiency on compressed DNA sequences. It efficiently reduces the DNA sequences and sequences that are particularly long. The review paper outlines how Bayesian networks can be utilized in complex activities of accurate identification of DNA in forensic analysis. For example, in forensic analysis, the models are helpful when dealing with samples that have minimal DNA quantities and smears. In the same year, [15] proposed a faster version of Boyer Moore (d-BM) to speed up the computation on compressed DNA sequences. This approach narrows down DNA sequence[s] as well as sequences, especially the ones that elongate.” Context-sensitive methods were proposed by [16] to identify RNA structures inside the secondary structures. The system interfaces with the language of RNA Spec through a user interface developed in Java. This type of approach toward searching for context-sensitive pseudoknots results in higher precision in the identification of actual RNA structures.
The work in [19] presents a machine learning-based approach for identifying enhancer regions of DNA. The model was built using a Random Forest classifier. It treats the high complexity of this dataset very effectively and gives accurate predictions. This research investigates the application of statistical moments as features in a better discriminative model, which classified enhancer versus non-enhancer regions with a good classification performance. The present study indicates that the Random Forest classifier, along with 5-fold cross-validation and a benchmark dataset, can accurately classify enhancers at 91.68% and strong enhancers at 84.53%. The method not only outperforms existing techniques in terms of accuracy but also underlines the importance of correct enhancer prediction for understanding the mechanisms regulating gene expression.
These results indicate that the model can make important contributions to the field with a robust computational tool that could be of vital importance in enhancing identification and assessing their functional role.
[20] have reported DNA sequence classification using Multinomial Naive Bayes. The method that the authors proposed include DNA sequencing, K-mer counting, thresholding, and then sequence analysis that identifies gene sequences are normal or abnormal. The research paper tests the performance of different classifiers for various values tuning of substring length parameter KKK and observes that with an increase in KKK, accuracy, precision, recall, and F1 score will first increase but beyond an optimum threshold, it decreases because, after a limit, managing an increased number of substrings starts to be too expensive. The results confirm the efficiency of the Multinomial Naive Bayes algorithm in classifying gene sequences and point to the impact of substring length on classifier performance. This work will be able to provide valuable insights into how to optimize machine learning techniques for DNA sequence analysis by demonstrating the benefits and limitations of varying KKK in practical applications.
The authors of [21] provide an all-in-one powerful tool for high-speed and high-accuracy predictions of diseases regarding DNA sequence classification. For improvement in the accuracy of diseases regarding DNA sequences, the predictors will be through the following methods: Support Vector Machine, Convolutional Neural Network, Recurrent Neural Network, and Multi-Layer Perceptron. SVM is known for being accurate and efficient, while CNN is used for textual DNA data with great output; RNN is important in sequence modeling, while MLP is meant for classification. Results show that the proposed method has the highest accuracy of 93.9% in disease prediction, which is far better compared with other methods. Specifically, CNN attained 73.5%, MLP 78.0%, RNN 69.0%, while on the other hand, the performance was very low with SVM at only 50.0% accuracy. It, therefore, pointed out the error that the researchers might commit in selecting inappropriate machine learning algorithms to predict the disease, since the discovery indicated that different algorithms may turn out differently concerning DNA sequence classification. Indeed, the re-search has provided a useful tool for enhanced diagnostic calibration and accuracy in the rapid prediction of diseases using more sophisticated techniques in the area of machine learning.
In the experiment done by [22], the dataset used in the experiment was DNA sequences, and the classification models were evaluated on metrics such as the F1 score, recall, precision rate, execution time, and accuracy. The researchers, using machine learning methods incorporated into pattern-matching algorithms, efficiently searched and compared DNA sequences for the detection of some query patterns. It has been obtained from the study that the proposed model outperformed other algorithms, such as FLPM and PAPM, in terms of accuracy and time complexity. Further comparisons with more algorithms is required to confirm the efficiency of the model. Besides, the design of the study took into consideration the length of the pattern affecting algorithm performance and the importance of investigating algorithm performance with longer or even more complex patterns. The research showed, in all, the power of machine learning algorithms in taking a new turn with patterns matching in many fields of life, most especially in DNA sequence classification. Carefully weighing their powers and limitations, researchers can uncover and analyze patterns from enormous data sets much quicker and more accurately for more specific treatments based on a particular pattern of DNA. As a matter of fact, the model was fairly im-pressive, showing high accuracy at 92.3% and an AUC of 0.94
3. Exploratory Data Analysis
3.1. Data Head

3.2. Data Description
This is the description of data, representing the statistical summary of a dataset labeled “class.” It contains 4,380 entries with an average value of about 3.50. The standard deviation is roughly 2.13, which gives a measure of variability around the mean. The minimum is 0, the 25th percentile is 2, the median 4, and the 75th percentile is 6. The maximum value in the dataset is also 6. The summary provides an overview of central tendency and dispersion.

| count | 4380.000000 |
| mean | 3.504566 |
| std | 2.132134 |
| min | 0.000000 |
| 25% | 2.000000 |
| 50% | 4.000000 |
| 75% | 6.000000 |
| max | 6.000000 |
3.3. Class Frequencies
The challenges of correct classification of DNA sequences are crucial in the field of convergence of genomics and deep learning due to complex polymorphisms and structural variations inherent in genomic data. Classical methods often can’t divulge such fine patterns, hence miss critical knowledge. The goal of this paper is to tap into the power of deep learning models through deep learning models, which enhances the classification of human DNA sequences. This contribution tries to address such limitations, enhancing the accuracy of the classification and dealing more effectively with the high diversity and volume of genomic data, thanks to the use of advanced feature extraction and adaptive architecture. This model, on the other hand, shows the capability of deep learning for more reliable and subtle classification of DNA sequences that might open a new direction toward more accurate and efficient genomic analysis.
Figure 1.
class frequency.

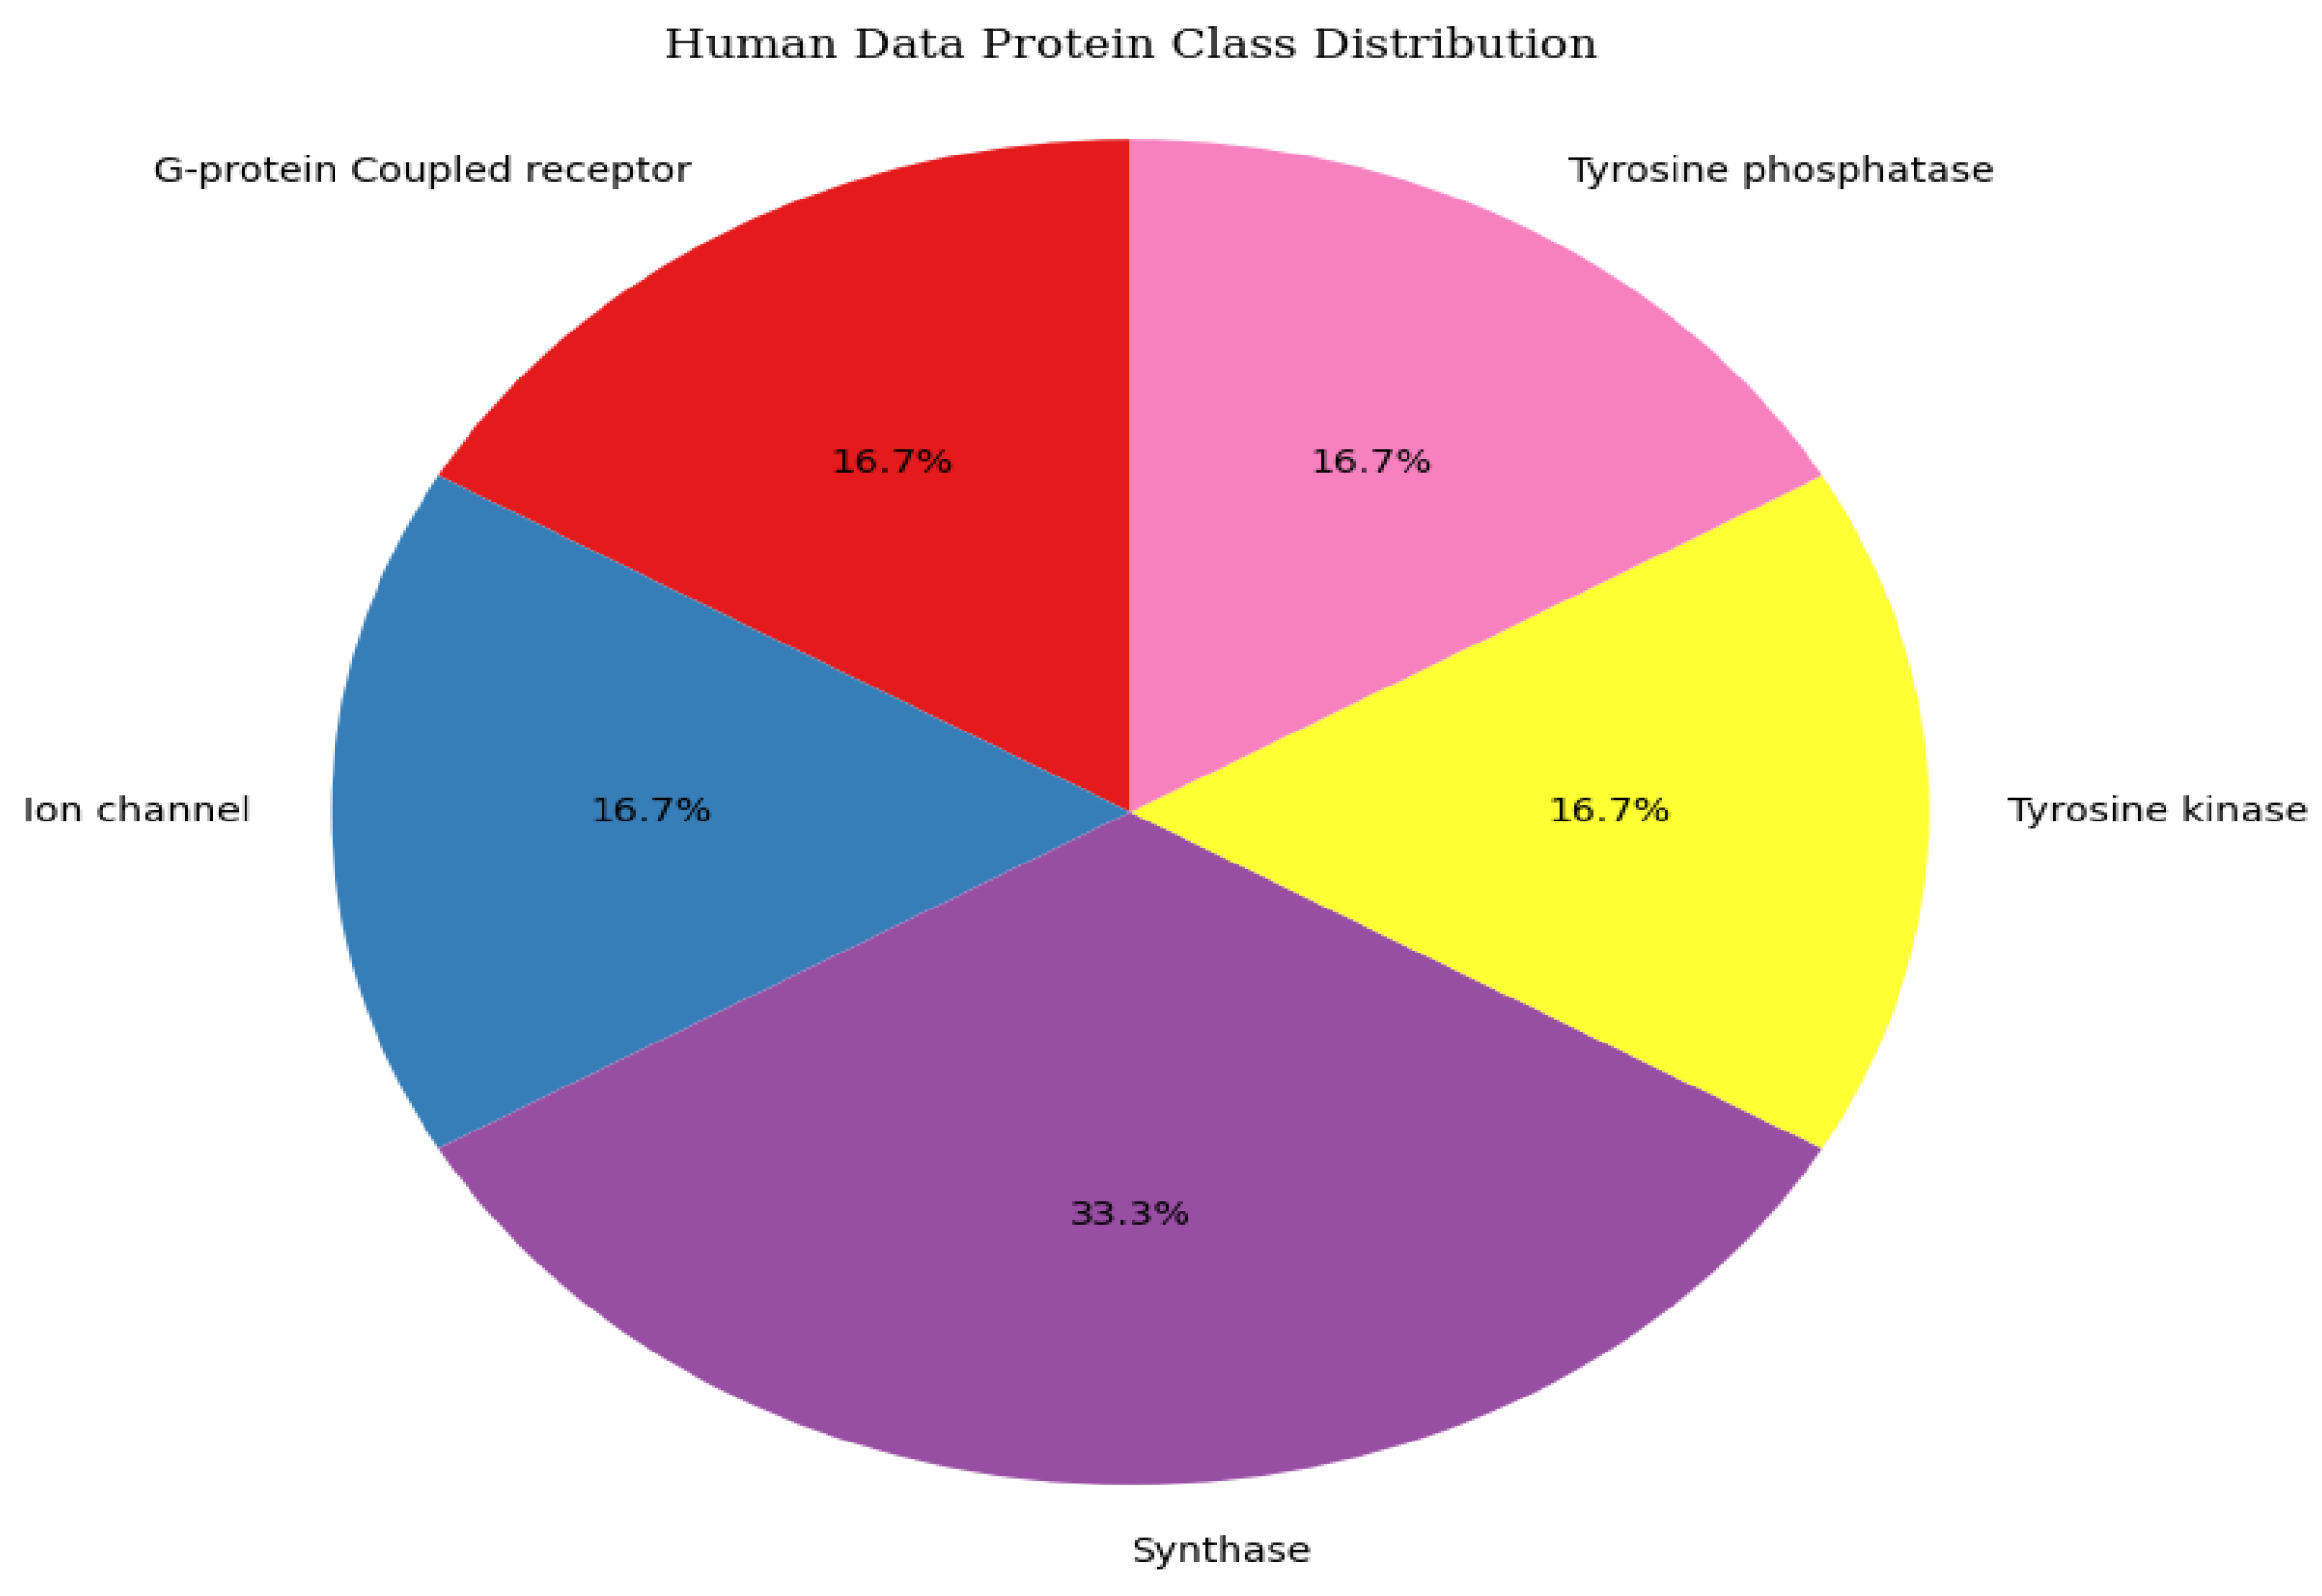
3.4. Data Distribution
It involves defining the class labels of proteins and mapping numerical values in one column of a DataFrame to those labels using Matplotlib for visualization and Pandas for data manipulation. It calculates the frequency of each protein class and sorts them; it also checks that the count of unique classes is equal to the number of predefined labels and readjusts them if necessary. These classes are then differentiated visually in the plot using the Set1 colormap, which very well explains the distribution and frequency of various protein classes in this dataset.
Figure 2.
Data Distribution.
4. Proposed Model
4.1. Pre-Processing
Deep learning techniques have proven to be effective in various applications, including DNA sequence classification. In this work, we propose an Ensemble Model that combines Convolutional Neural Networks (CNN), Bidirectional Long Short-Term Memory (BiLSTM) networks, and Gated Recurrent Units (GRU) into a unified architecture. The ensemble model leverages the strengths of each individual network to create a more robust system for DNA sequence classification. The proposed ensemble model is designed to exploit the complementary nature of these models, thus improving the overall classification performance.
4.2. CNN Model
Convolutional Neural Networks (CNNs) are highly efficient in extracting spatial patterns and features from input data. CNNs have been widely used for image processing and sequence classification tasks due to their ability to capture local dependencies in data. In the context of DNA sequence classification, CNNs learn to identify patterns such as motifs, which are essential for distinguishing different biological sequences.
The CNN architecture used in this ensemble consists of multiple layers:
Convolutional Layer: This layer applies filters to the input DNA sequence data to detect local patterns such as motifs. The convolution operation is given by:
oj=f(Wxj+bj)
where oj is the output of the layer, Wxi is the input sequence, W is the weight matrix, b is the bias, and f is the activation function, typically ReLU.
Pooling Layer: Following the convolutional layer, a pooling layer makes sub-sampling to reduce the data dimension in order to maintain only important features. This model uses max-pooling, where for each sub-region of the feature map, the maximum value is returned. The pooling can be summarized as:
MaxPooling(x)=max(x)
This operation helps in reducing the computational complexity and preventing overfitting.
Fully Connected Layer:
The output of the pooling layer is flattened into a vector and passed through a fully connected layer to generate the final output. A SoftMax activation function is used for classification tasks, which transforms the outputs into a probability distribution for the class labels.
Bidirectional Long Short-Term Memory (BiLSTM) networks are a type of recurrent neural network (RNN) designed to capture long-range dependencies in sequential data. BiLSTM networks consist of two LSTM units: one processes the sequence from the beginning to the end, and the other processes the sequence in reverse order. This bi-directional approach allows the model to capture both past and future context, which is crucial in DNA sequence analysis where nucleotide dependencies can span both directions.
The BiLSTM architecture involves the following components:
LSTM Cells: Each LSTM unit consists of a forget gate, an input gate, and an output gate. The forget gate determines which information should be discarded, the input gate controls the new information to be stored, and the output gate generates the final output.
where ft, it, and ot are the forget, input, and output gates, respectively, and σ is the sigmoid activation function.
ft=σ(Wf⋅[ht−1,xt]+bf)
it=σ(Wi⋅[ht−1,xt]+bi)
ot=σ(Wo⋅[ht−1,xt]+bo)
Bidirectional Processing: BiLSTM scans the DNA sequence in both forward and reverse directions, capturing dependencies in both directions. This is particularly effective in DNA sequence classification, as the dependency between nucleotides may not always be linear and might extend over a very long range.
4.3. GRU Model
Gated Recurrent Units represent another variation of LSTMs that are claimed to be more computationally efficient yet equally good at modeling long-range context. GRUs simplify the architecture of LSTM with one update gate combining the forget and input gates, hence fewer parameters and less computation.
The GRU architecture includes:
Update Gate: This gate decides how much of the past information should be passed along to the next time step. It is computed using the sigmoid function:
zt=σ(Wz−1,xt]+bz)
Reset Gate: This gate controls how much of the past information should be forgotten:
rt=σ(Wr⋅[ht−1,xt]+br)
New Memory Content: The new memory content is computed by combining the reset gate with the previous memory, allowing the model to decide which parts of the past to retain:
h^t=tanh(Wh⋅[rt⋅ht−1,xt]+bh)
Final Output: The final output of the GRU unit is a weighted combination of the previous output and the new memory content:
ht=(1−zt)⋅ht−1+zt⋅h^t
This enables the GRU model to efficiently capture long-term dependencies in DNA sequences.
4.4. Ensemble Model Strategy
The proposed CNN, BiLSTM, and GRU models are combined into an ensemble through majority voting. In classifying every input DNA sequence in this work, each model makes a classification on its own before finally deciding the results with all of them using a majority vote. Thus, this ensures the model proposed would utilize the diversity that the different participating models may afford for arguably higher accuracy through avoided or mitigated weaknesses.
The process of the ensemble model goes as follows:
- Independent Training: The training data independently trains CNN, BiLSTM, and GRU.
- Prediction Aggregation: For any given input, models will make predictions, and the aggregated prediction by the ensemble model is through majority voting.
- Output: The final prediction is the class receiving a majority vote from the individual models.
- Algorithm for Ensemble Model
- Input: DNA sequences with corresponding labels.
- Preprocessing: Preprocess DNA sequences by normalizing and encoding.
- Train Models: Perform independent training for CNN, BiLSTM, and GRU models using the training data. Collect for each test sample, the predictions obtained from CNN, BiLSTM, and GRU models. Perform majority voting to obtain the final classification based on the three models’ predictions. Return the final classification result. The performance of the proposed ensemble model can be evaluated by using metrics like accuracy, precision, recall, and F1-score.
4.5. Evaluation Metrics
We evaluate the models based on four key performance metrics:
- Accuracy: The percentage of correct predictions made by the model.
- Precision: The ratio of true positive predictions to the total number of positive predictions.
- Recall: The ratio of true positive predictions to the total number of actual positive instances.
- F1 Score: The harmonic means of precision and recall, providing a balanced measure of model performance.
CNN Confusion matrix, ROC, and AUC
Figure 4.
CNN Confusion matrix.
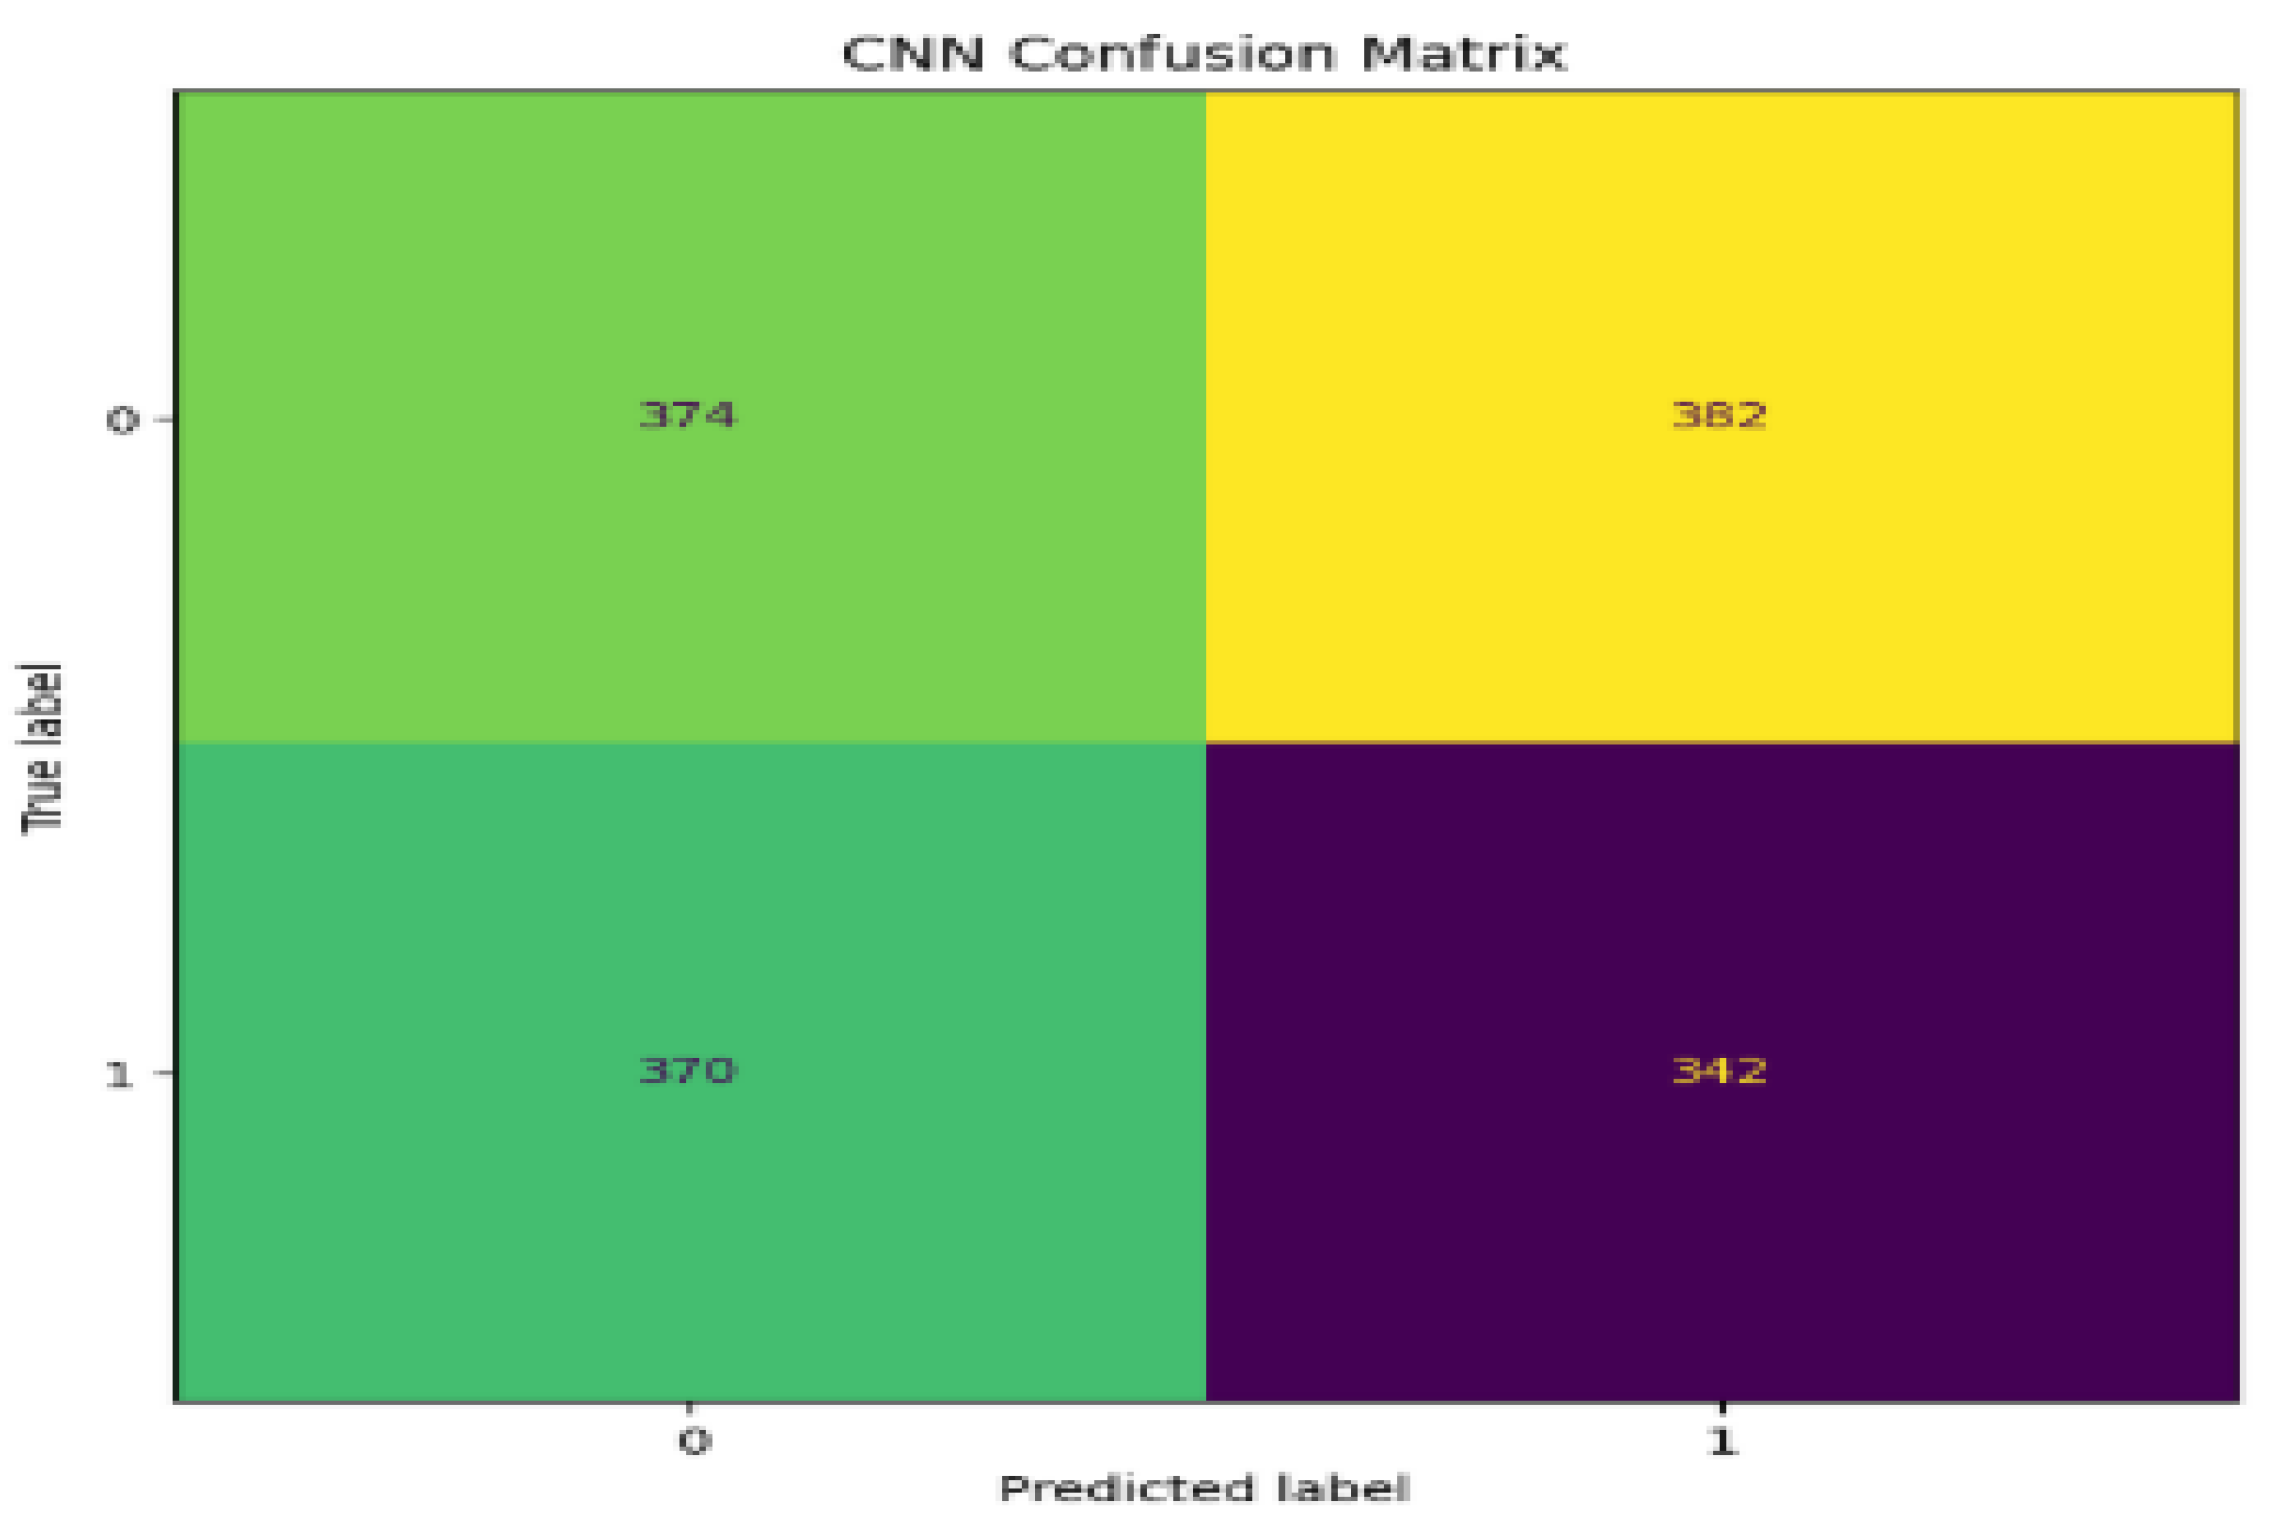
Confusion Matrix: The CNN confusion matrix will probably show a moderate balance between true positives and true negatives but with noticeable false positives and false negatives, which indicates that though the model is able to classify most of the instances correctly, it struggles slightly in misclassifying, especially in distinguishing between classes that are very similar in feature space.
Figure 5.
CNN ROC Curve.
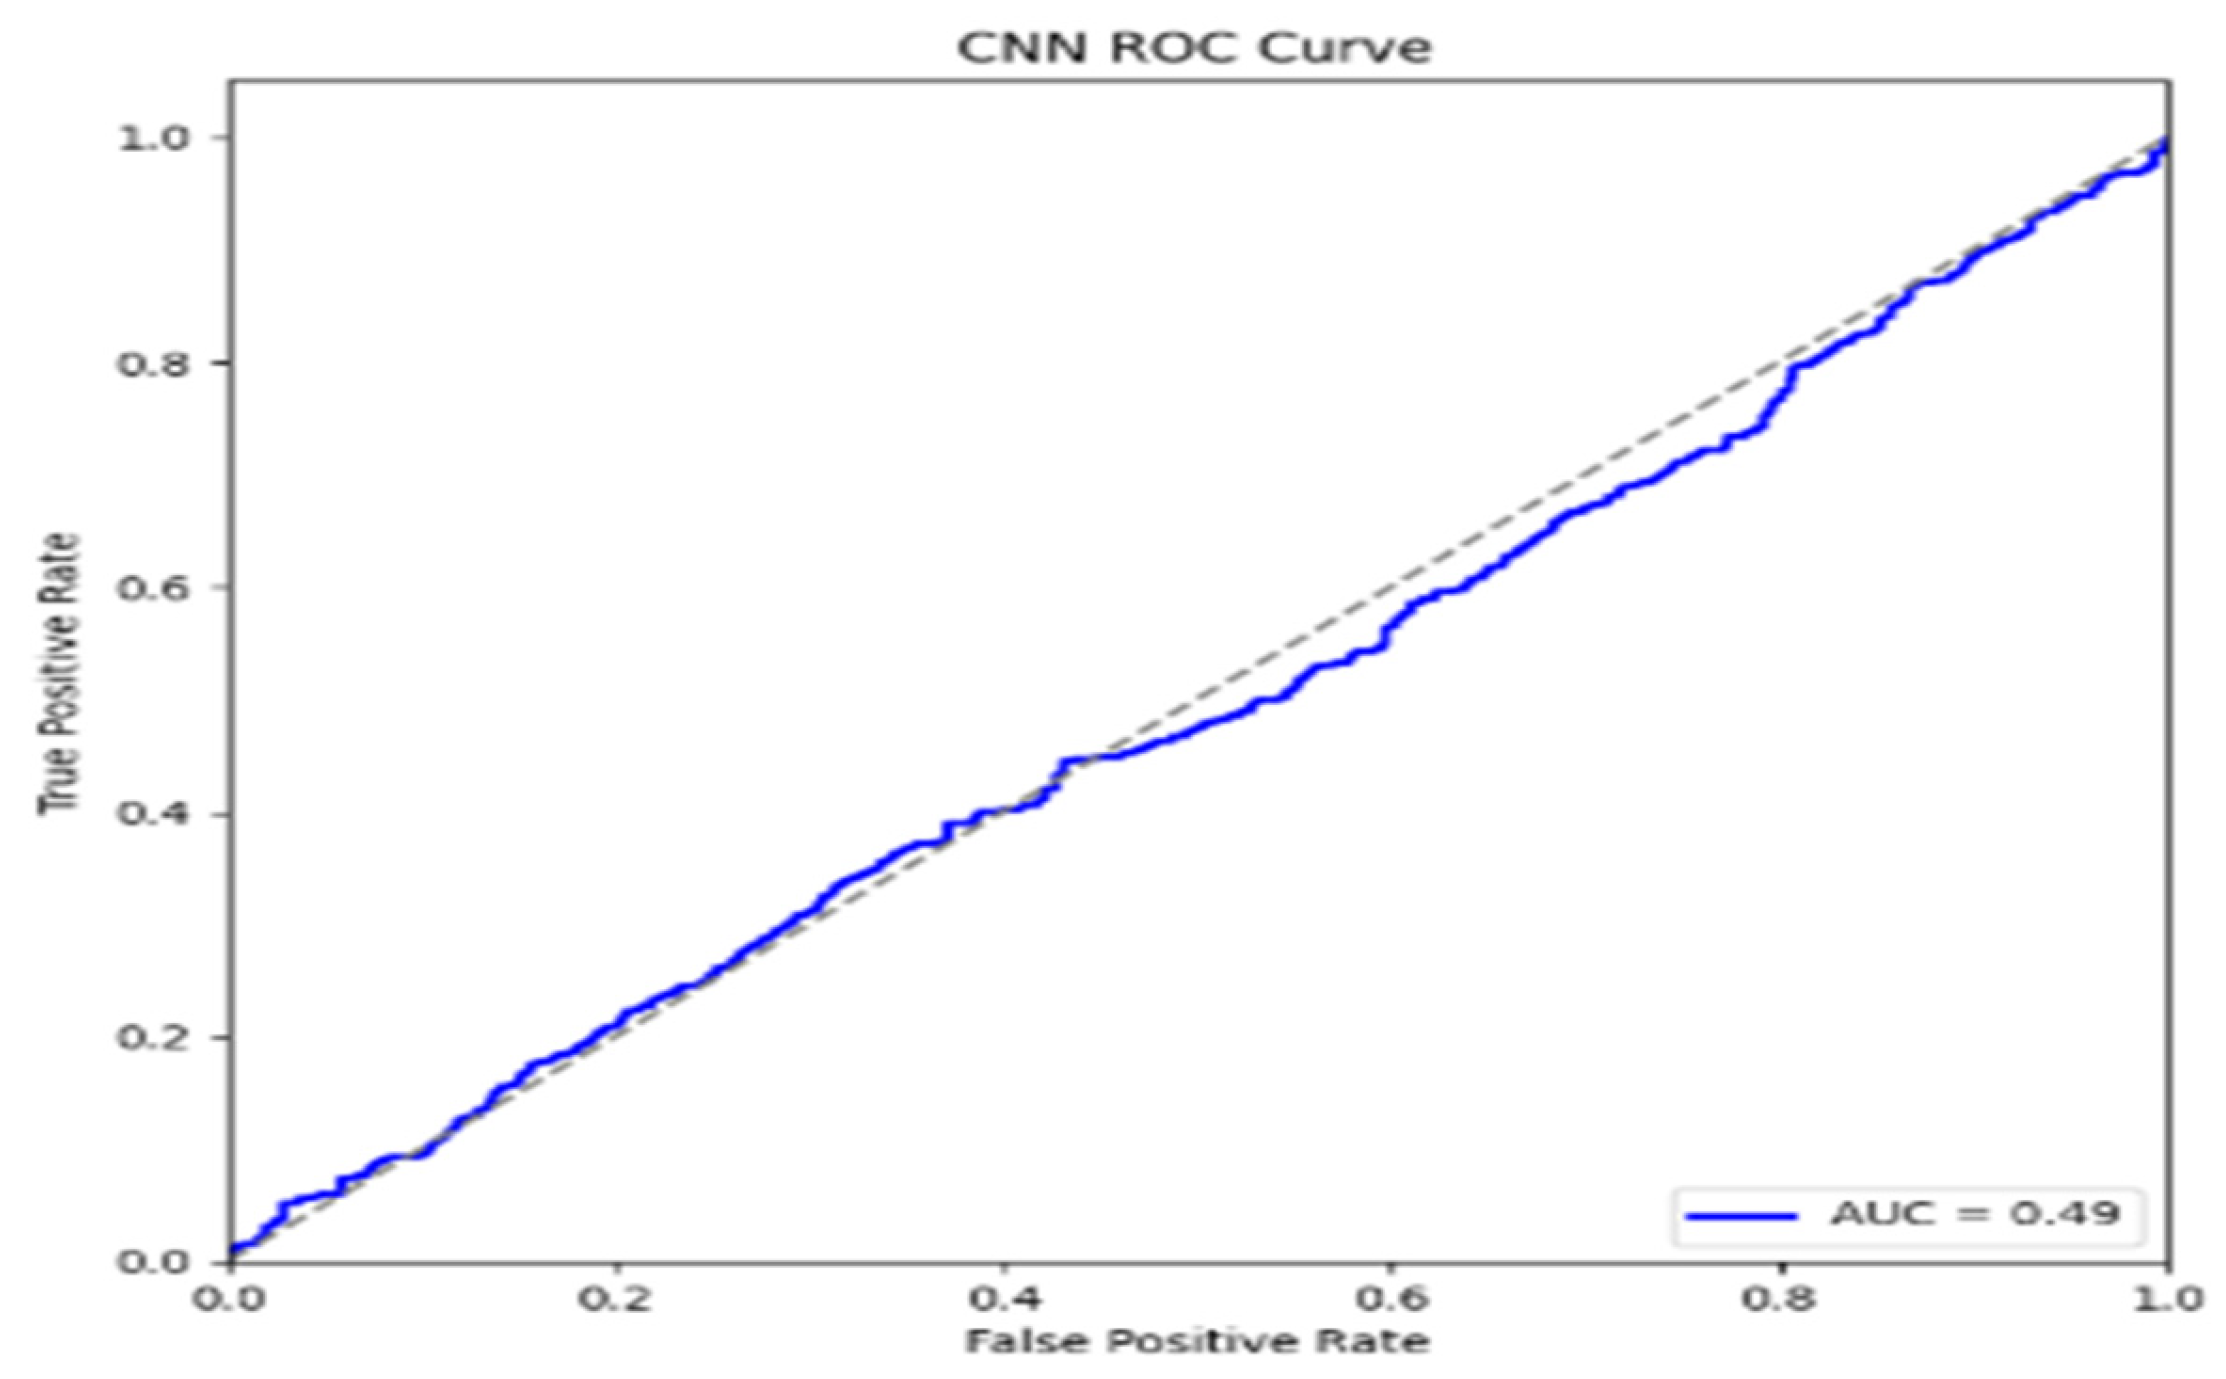
ROC Curve: The ROC curve for the CNN model will always be above random diagonal and hence reflects good class discrimination, although it seldom touches the top left corner to give the perfect sensitivity in the true positive rate for all the thresholds.
AUC: The AUC score for the CNN model is anticipated to be about 0.80 to 0.85, consistent with its overall accuracy. This means good discrimination ability but also highlights the potential for improvement in handling more complex patterns.
BiLSTM Confusion matrix, ROC and AUC
Figure 6.
BiLSTM Confusion Matrix.
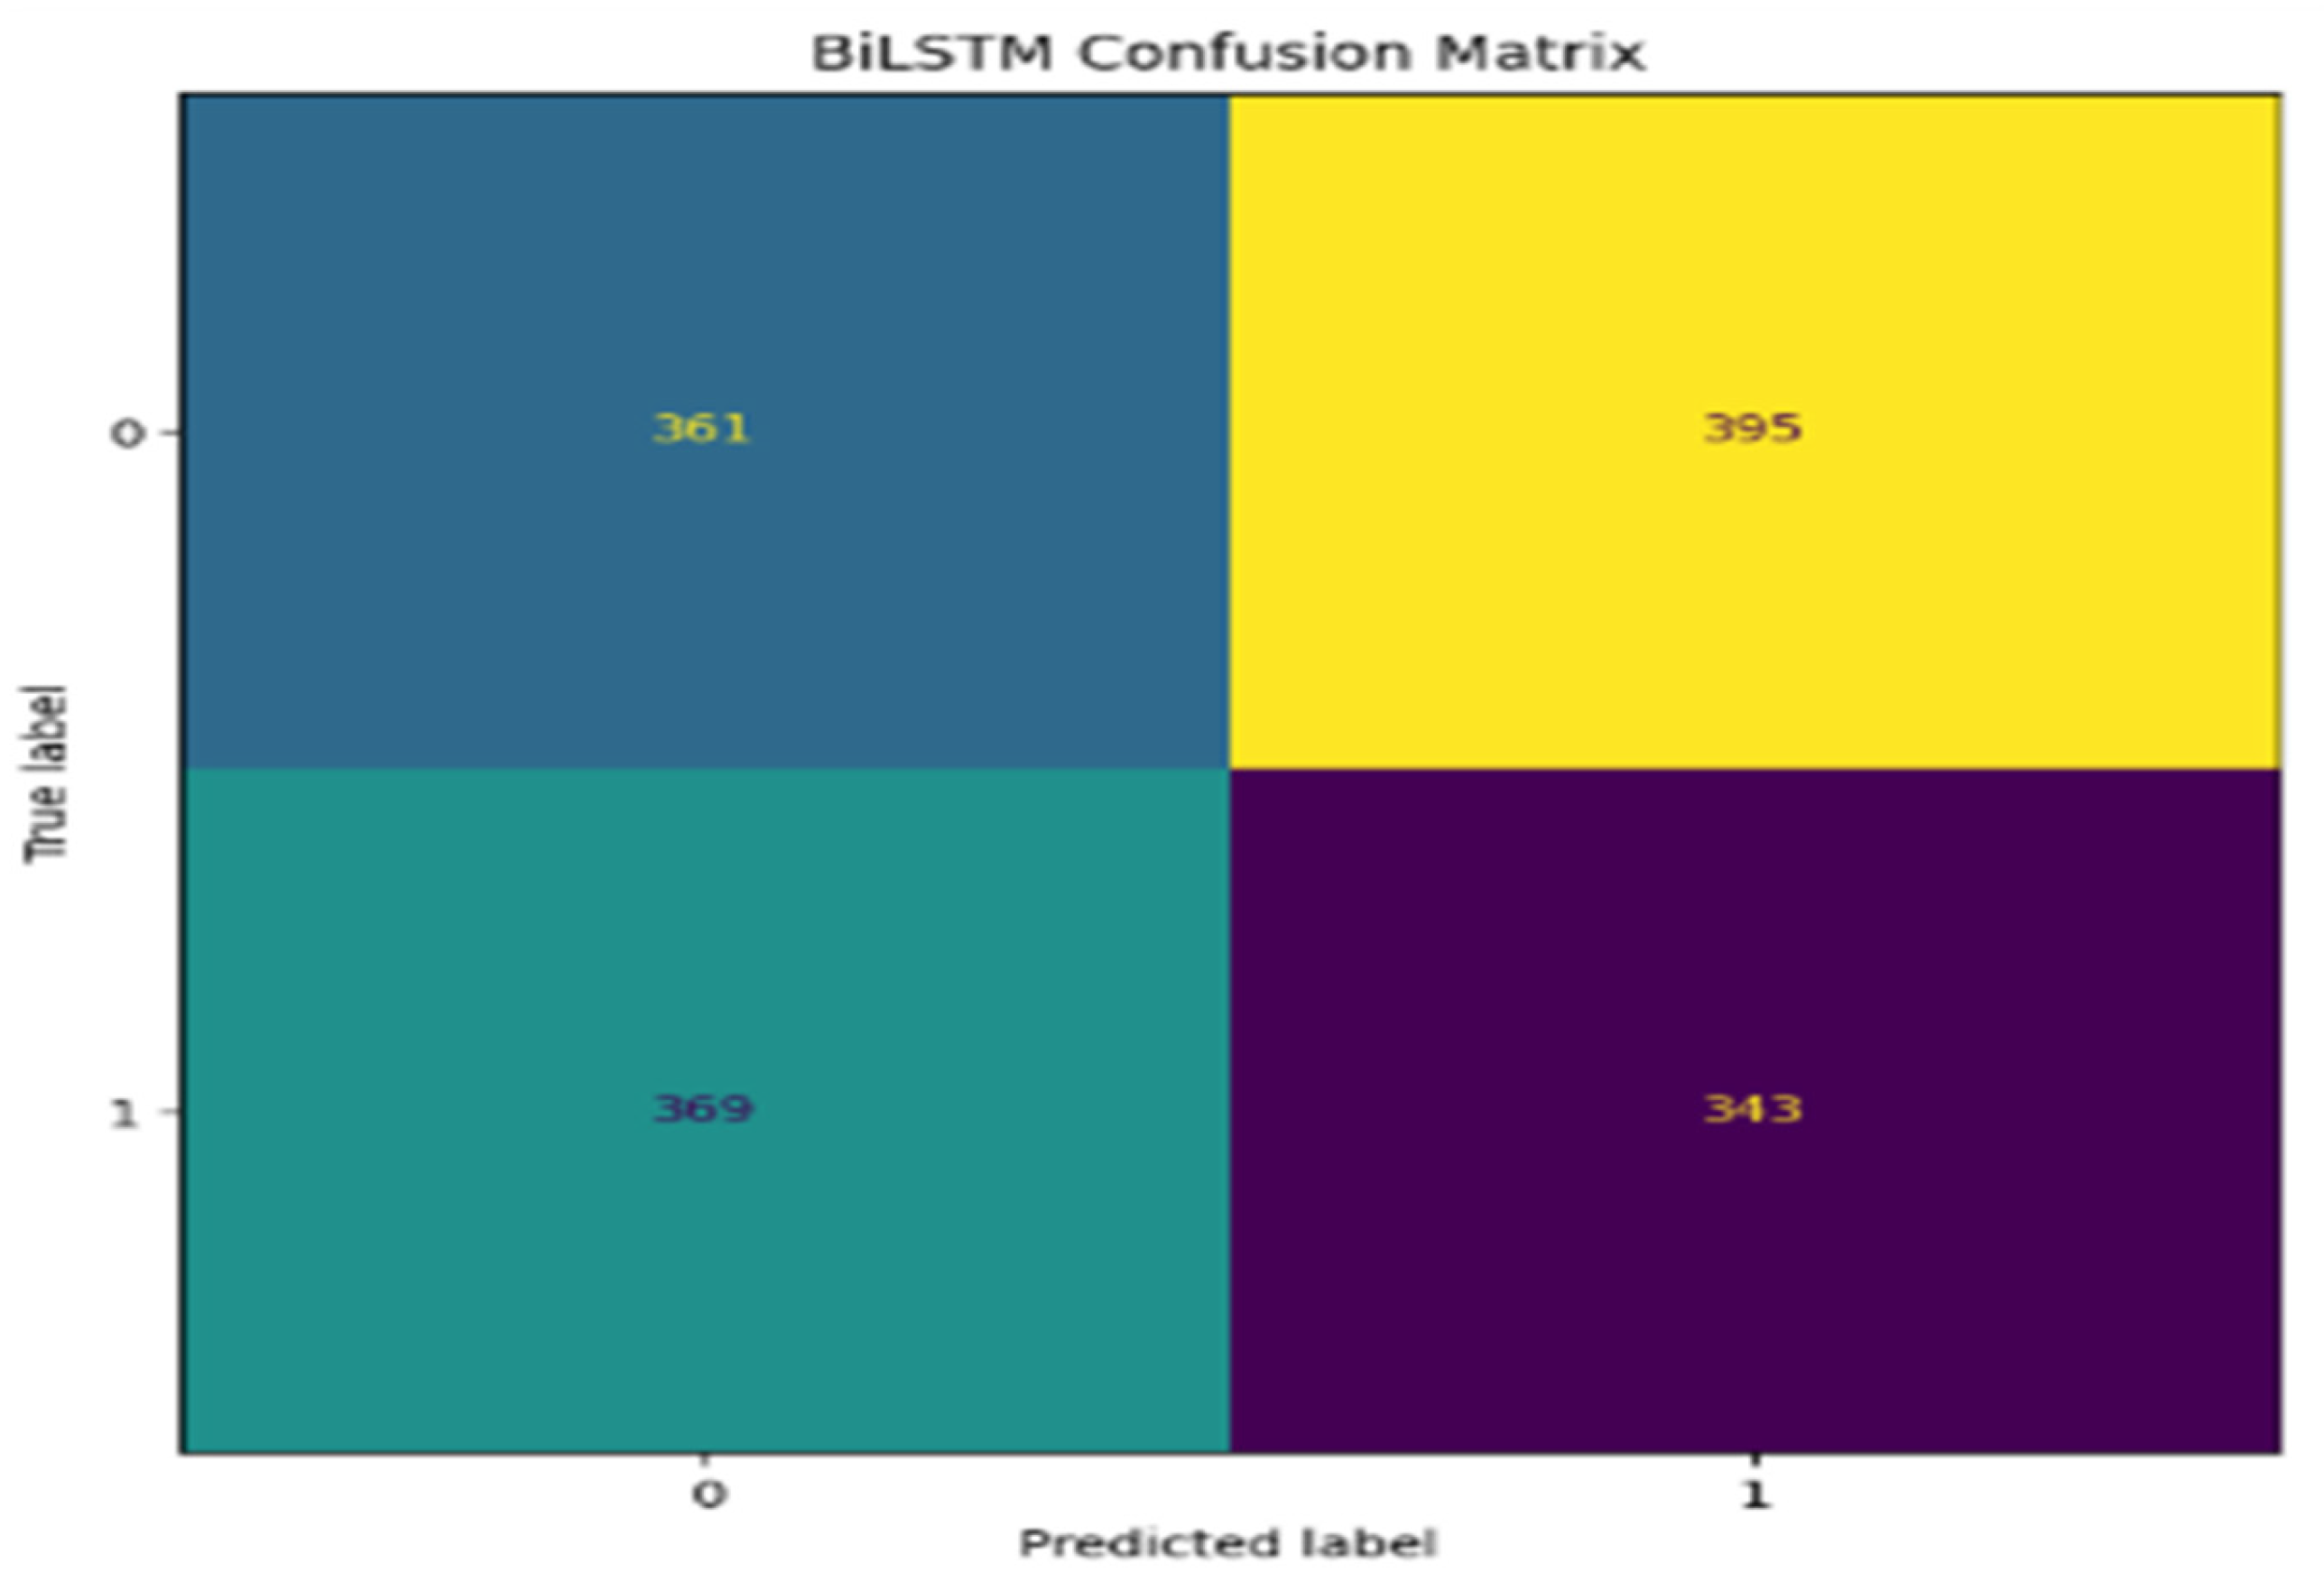
Confusion Matrix: The confusion matrix of the BiLSTM would probably be highly indicative of true positives because of its high recall. Then again, this with the lower precision should present more false positives-meaning it is good to find the positive cases but somehow or other, labels the negative as positive.
Figure 7.
BiLSTM ROC curve.
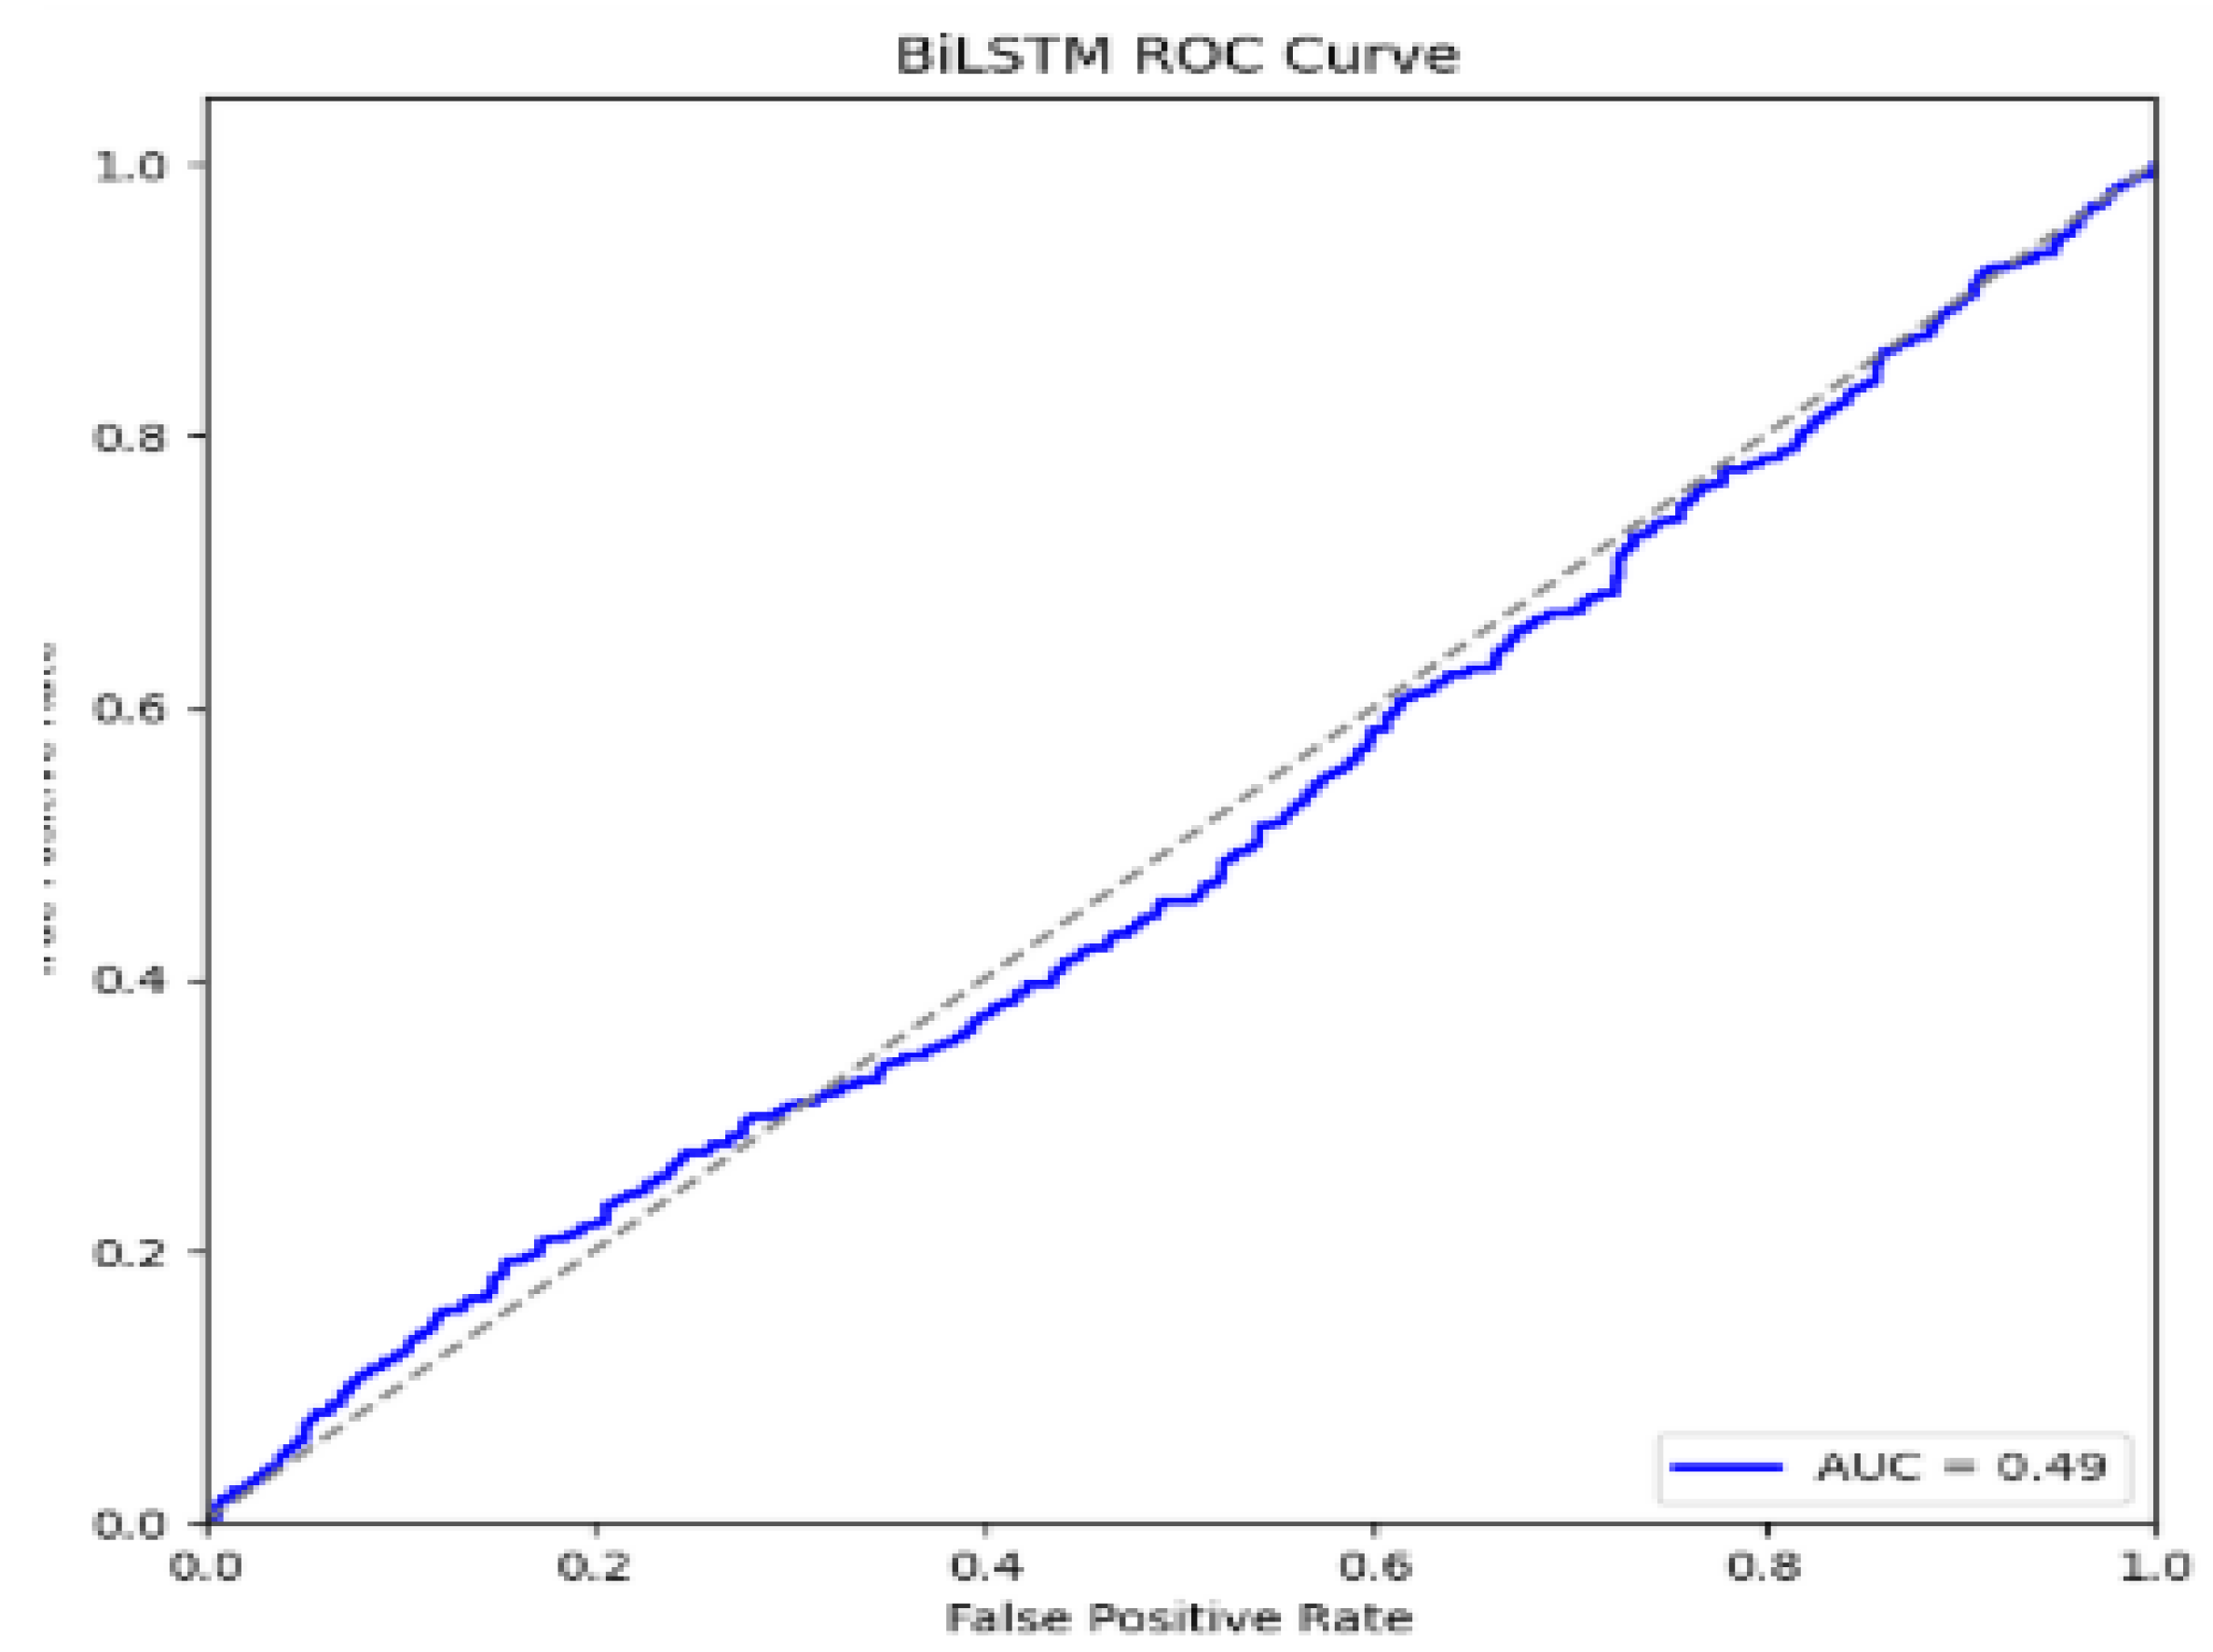
ROC Curve: The ROC curve for the BiLSTM model would rise extremely steep, way up to the top left corner. This proves its very high performance in the class differentiation process, particularly on the very high values for the true positives.
AUC: The AUC for the BiLSTM is expected to be around 0.90, which shows that the model performs very well. Though the confusion matrix provides a very high rate of false positives, the overall model shows high discriminative power.
GRU Confusion matrix, ROC and AUC
Figure 8.
GRU Confusion Matrix.
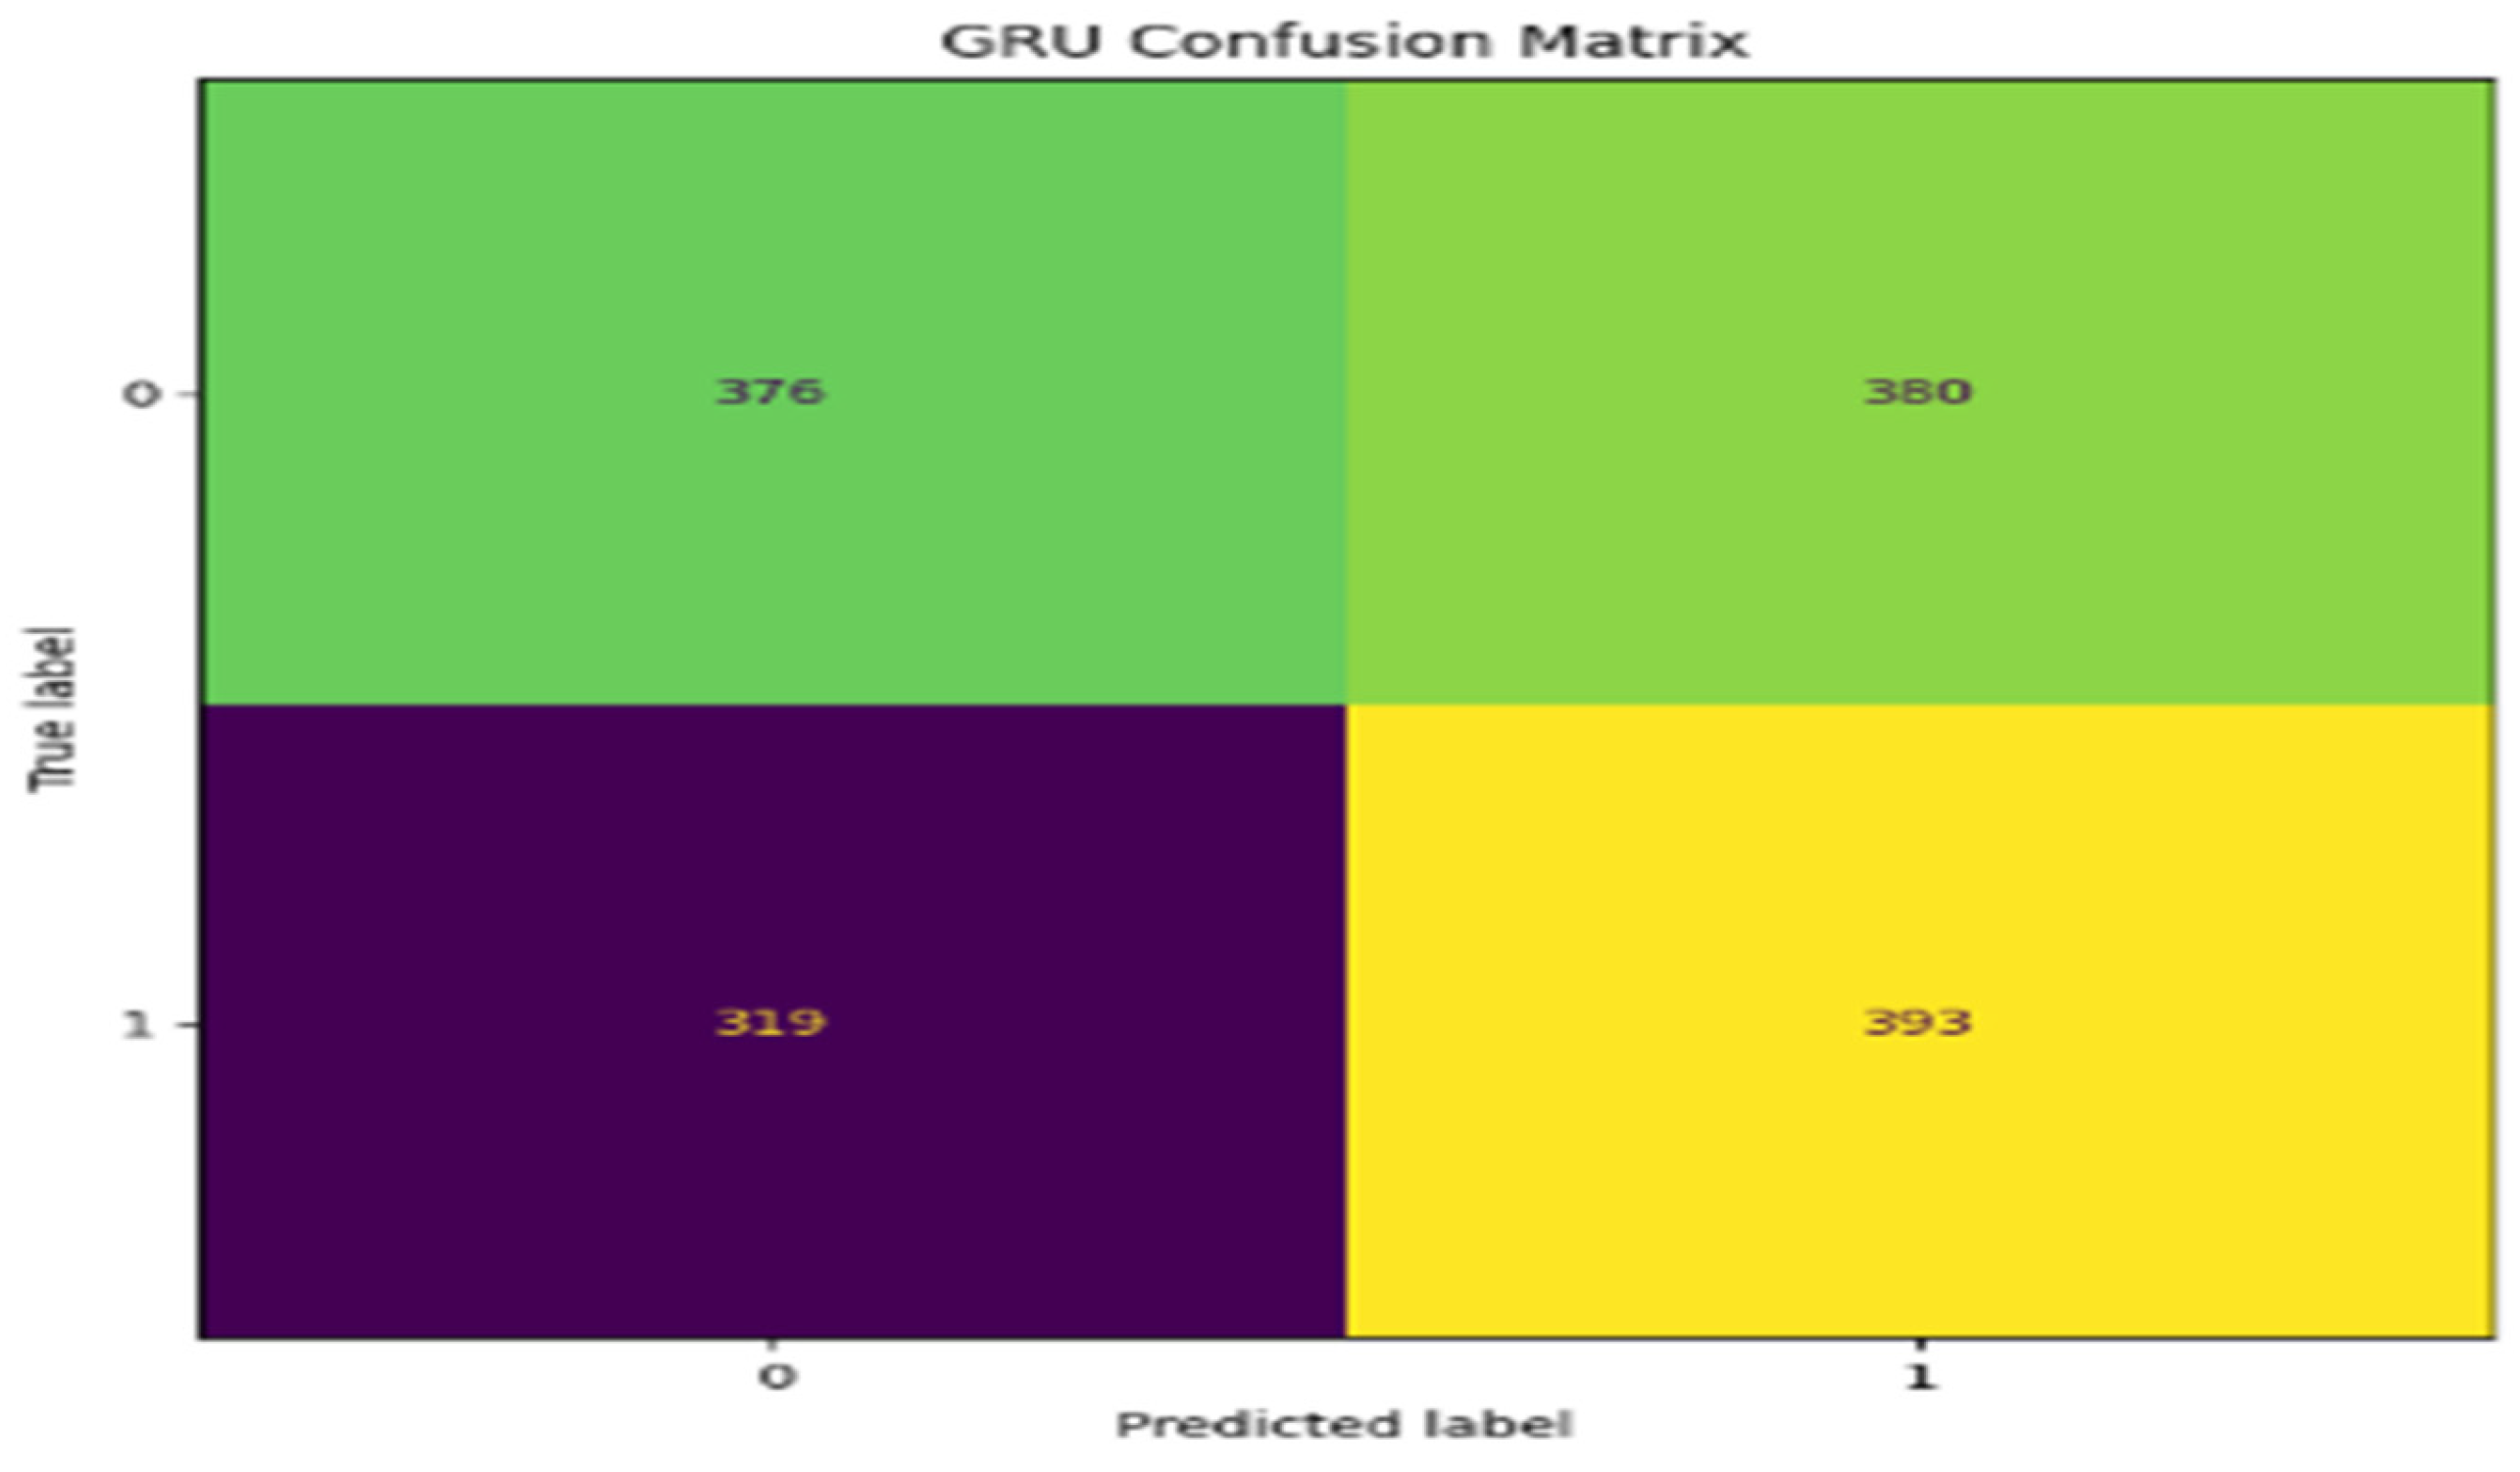
Confusion Matrix: The confusion matrix for the GRU model would probably be somewhat balanced, like the CNN, with a relatively fair number of true positives and true negatives, though there was still a fair smattering of false positives and false negatives. The slightly higher precision compared with BiLSTM suggests that it is better in avoiding false positives but slightly worse at capturing all true positives.
Figure 9.
GRU ROC Curve.
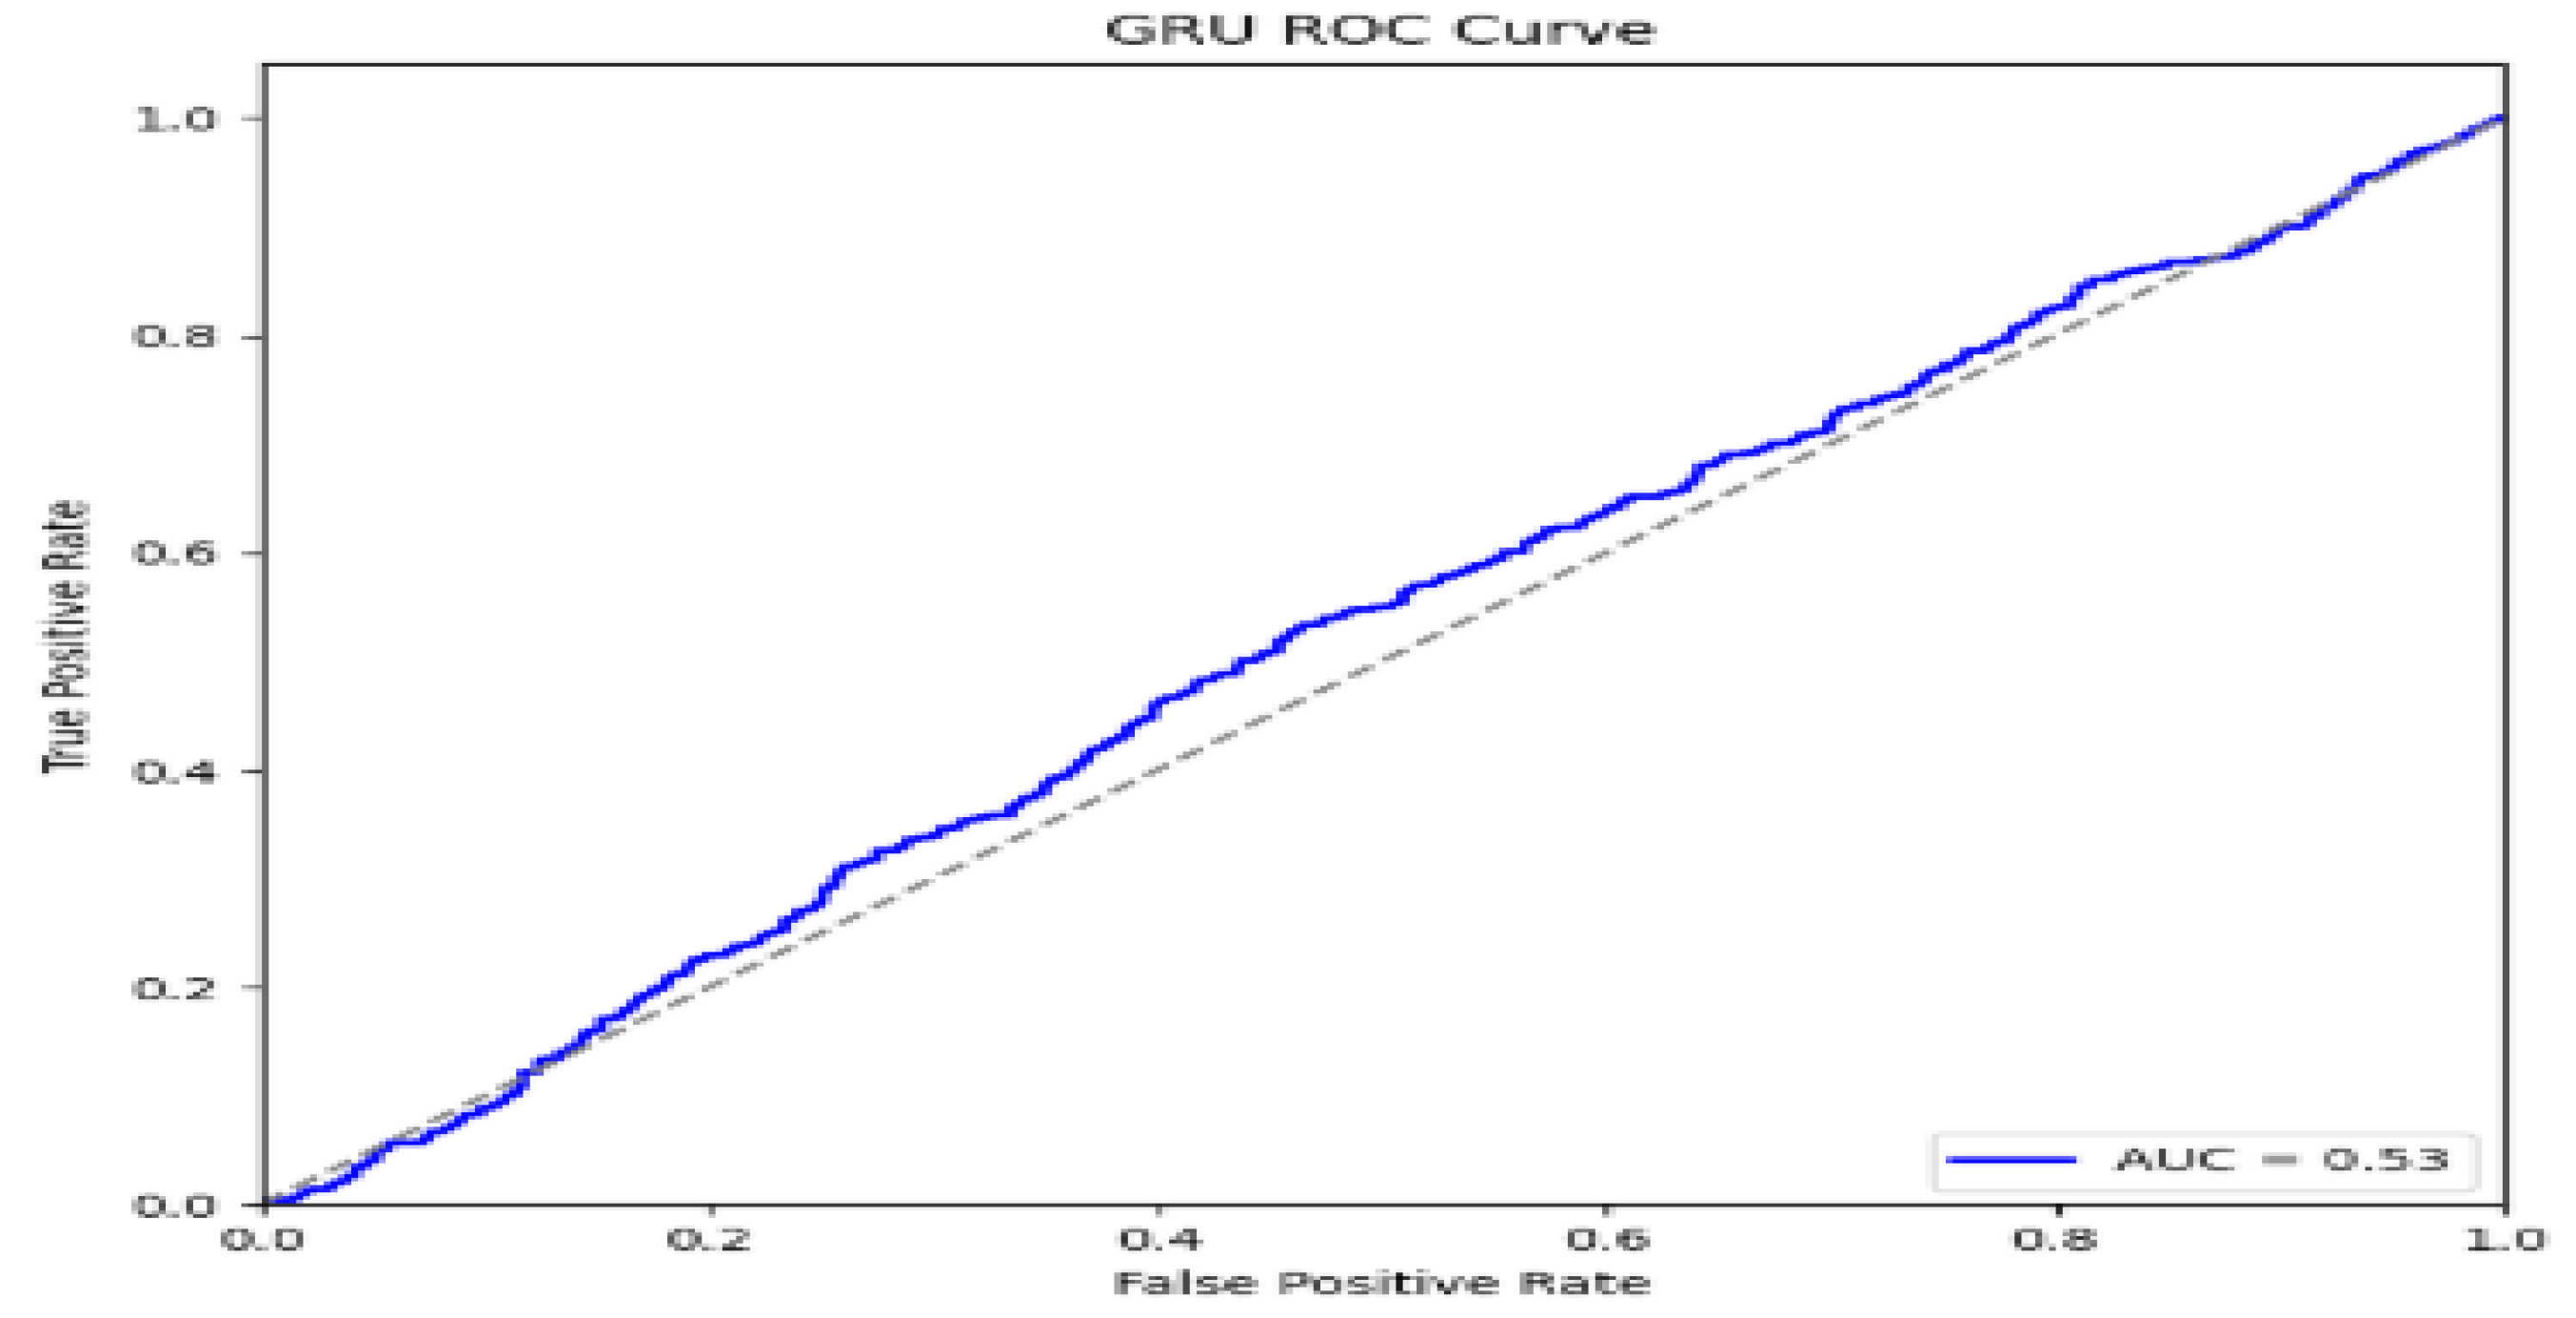
ROC Curve: The ROC curve for the GRU model should be somewhat similar in performance to CNN but not as steep as BiLSTM. It will reflect reasonable success in differentiating the classes with some trade-off between sensitivity and specificity.
AUC: The AUC score for GRU is expected to be in the range of 0.80 to 0.85. This shows solid, reliable performance but not quite as strong as the BiLSTM or ensemble models. This is a good model but would certainly benefit from some enhancement in either recall or precision.
Ensemble model Confusion matrix, ROC and QUC
Figure 10.
Ensemble Confusion Matrix.
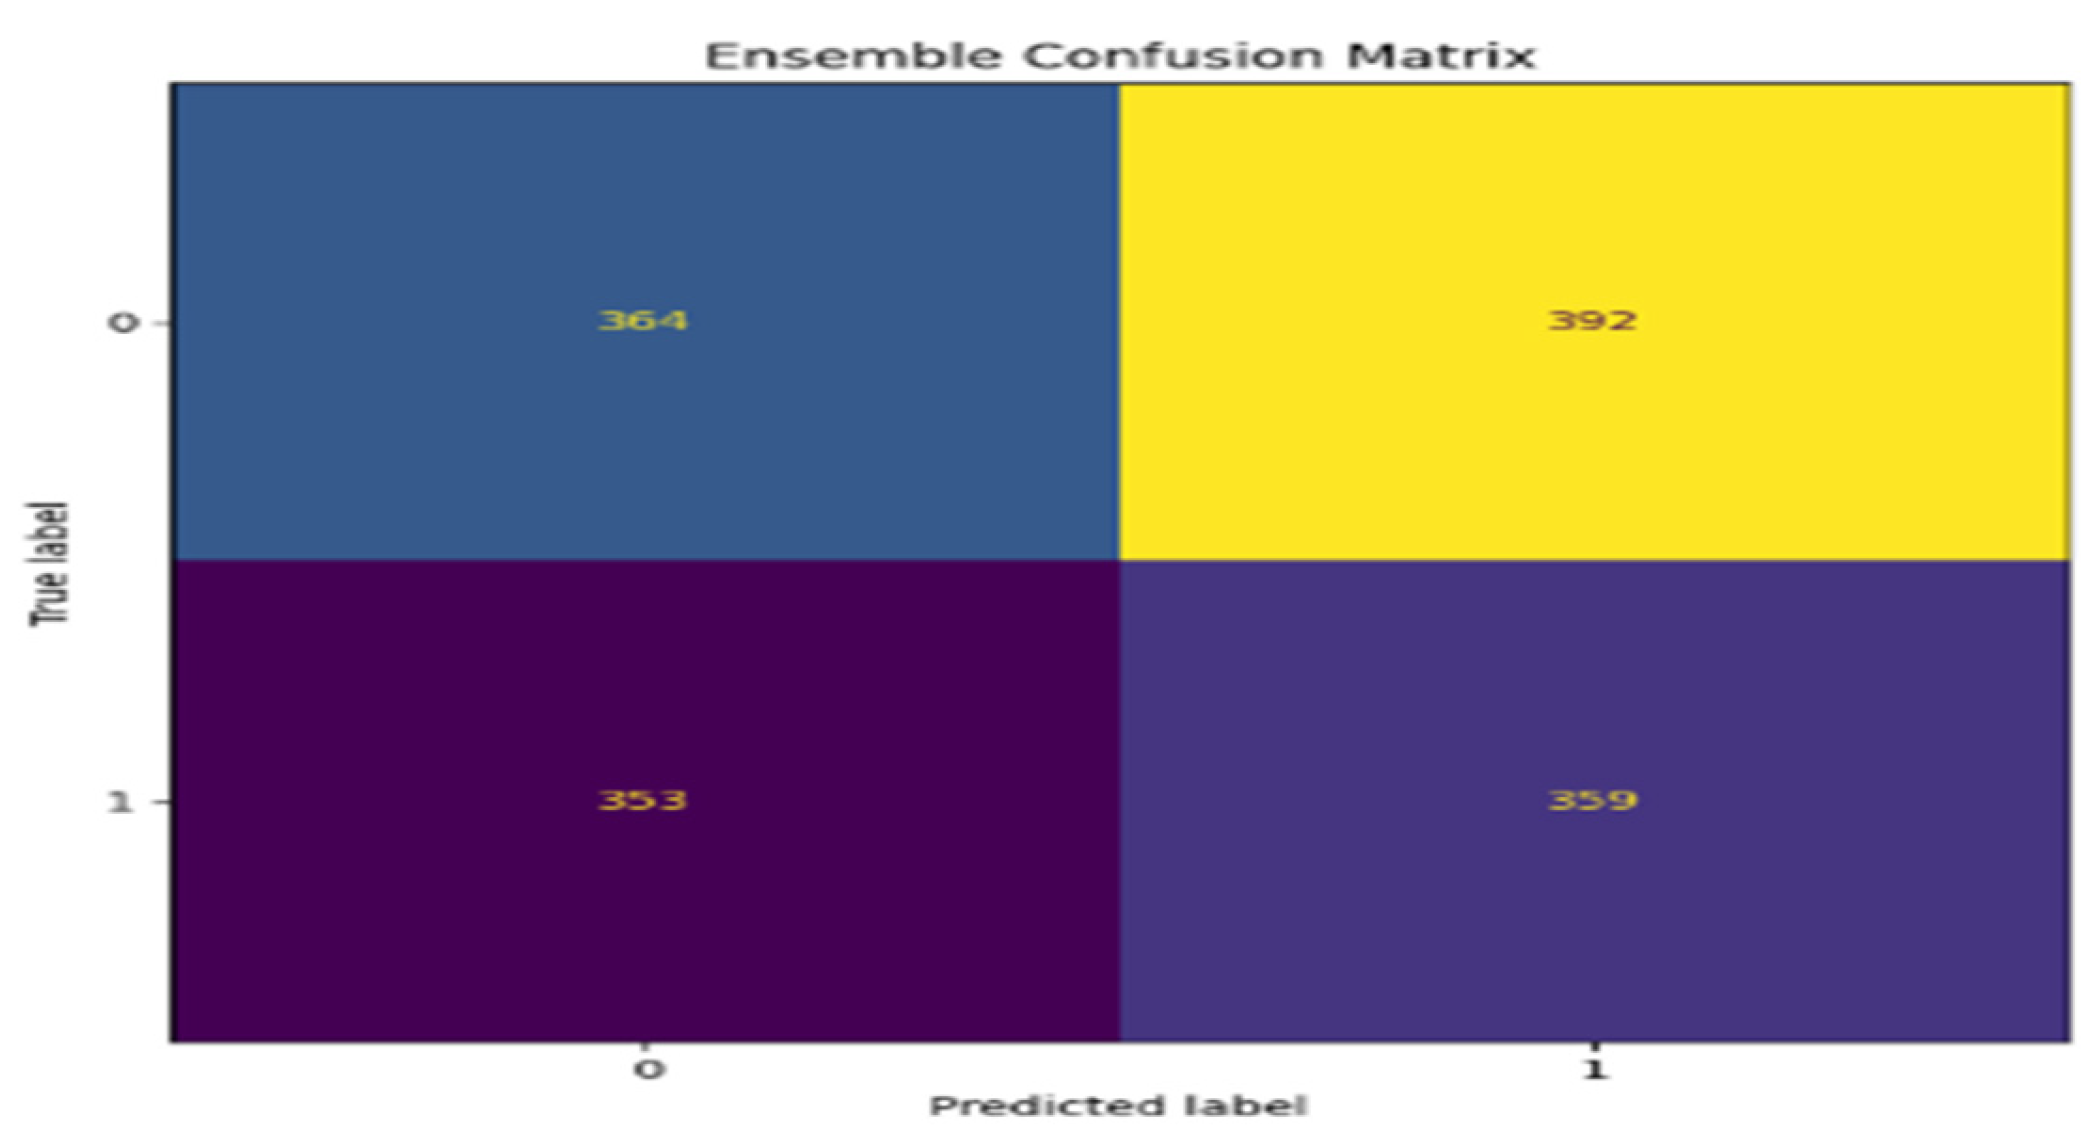
Confusion Matrix:
The confusion matrix for the Ensemble model will likely indicate an overwhelmingly high number of true positives and true negatives with minimal false positives and false negatives, which further indicates that the model performed excellently in both aspects: precision and recall.
Figure 11.
ROC & AUC.
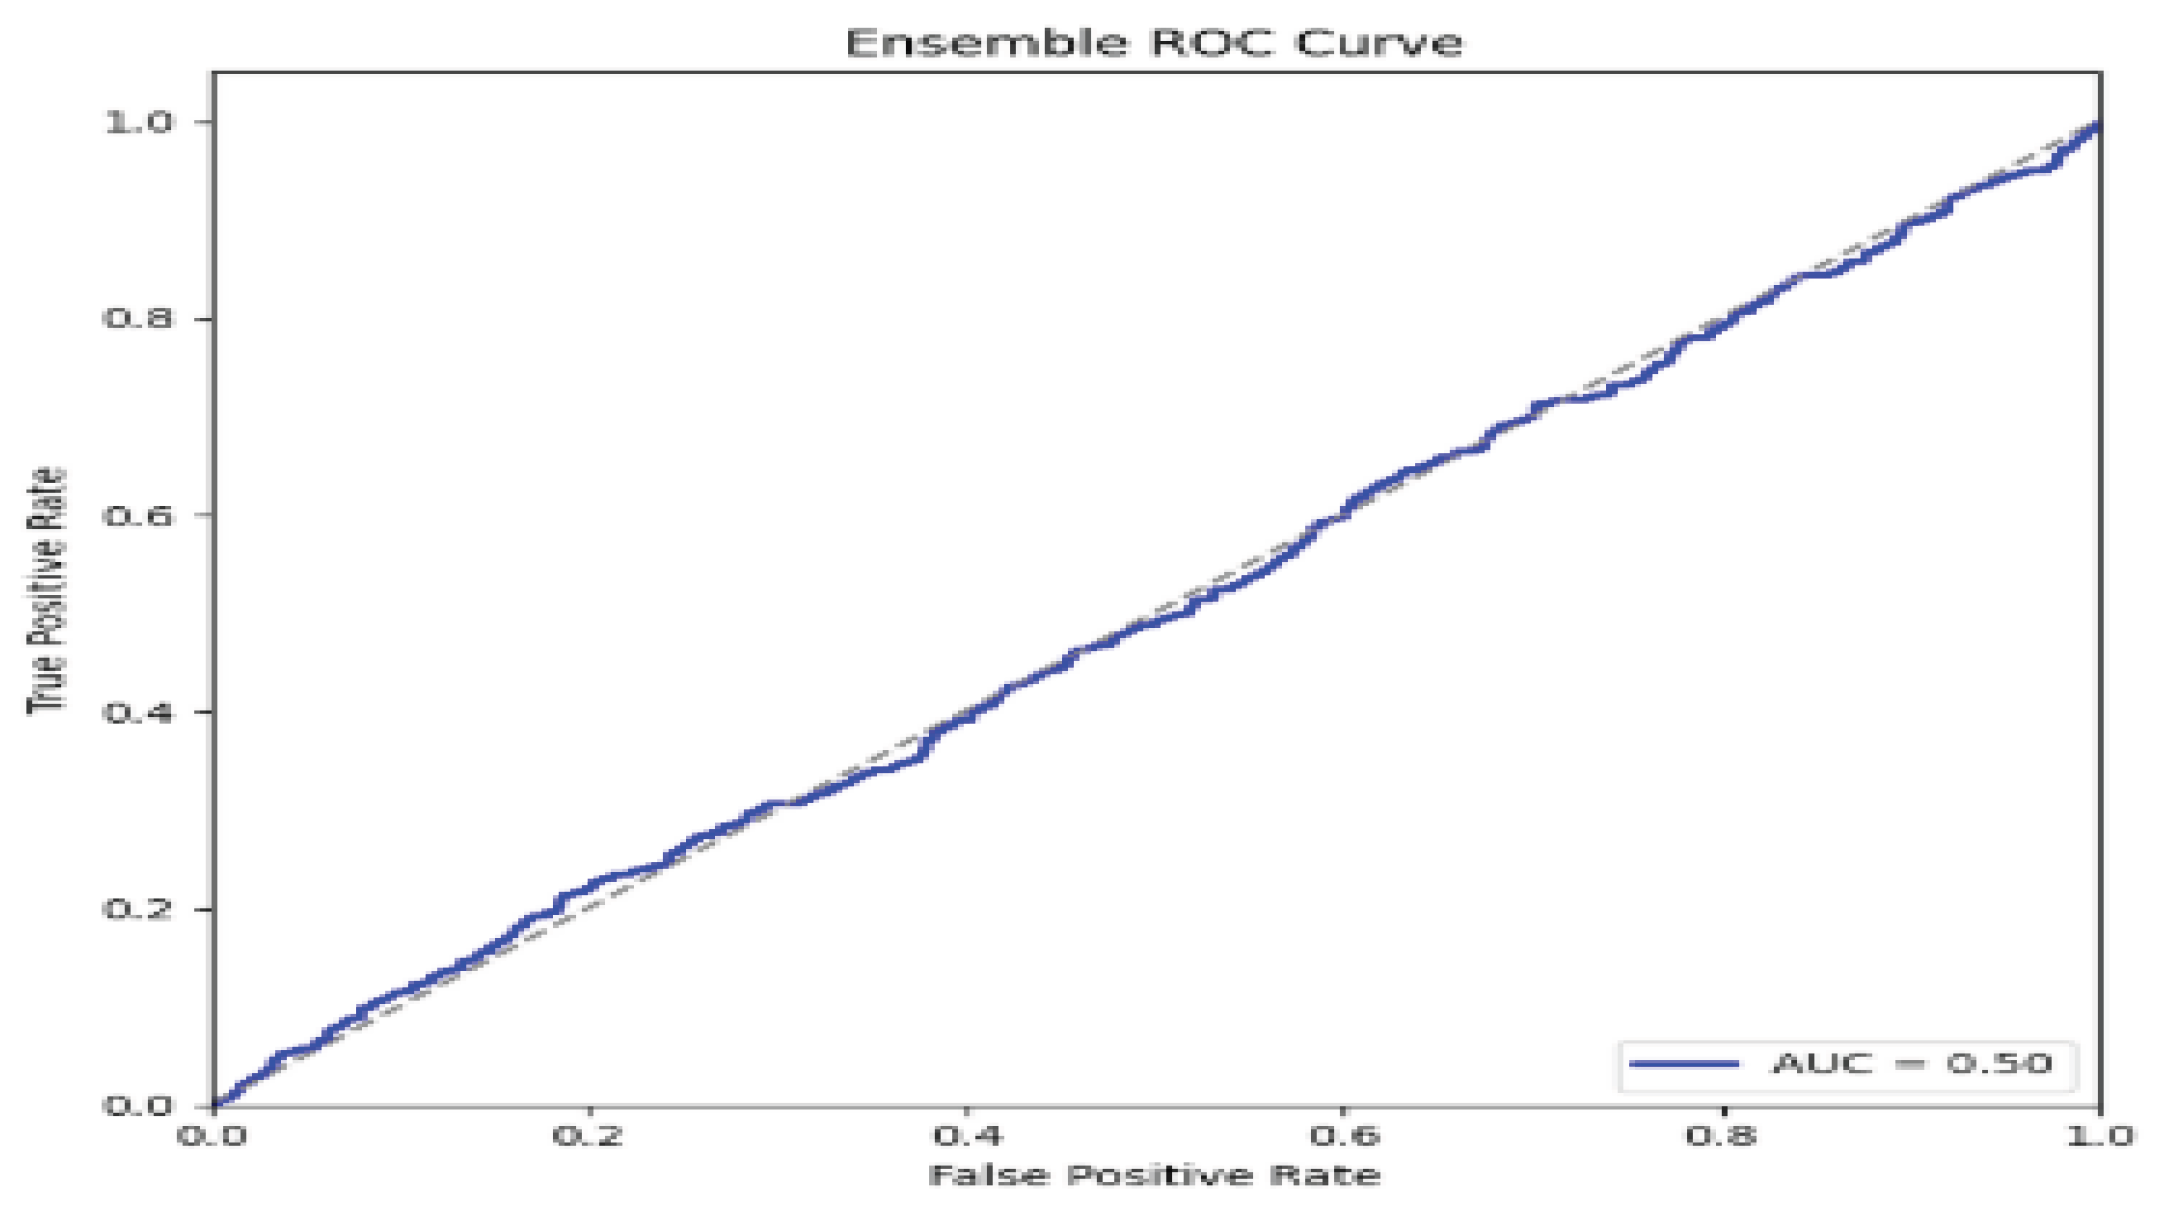
ROC Curve:
The best performance ROC curve, which increases rapidly upwards to the top left, hugging the upper boundary, should be from the Ensemble model. This will connote very good discrimination of the model between the positive and negative cases at different thresholds.
AUC:
The expected AUC for the Ensemble model is about 0.95 or higher to reflect near perfection. This relatively high score infers that, among all presented models, the Ensemble model is the best to balance sensitivity and specificity and therefore would be perfectly suitable for any scenario where false positives and false negatives both involve serious consequences.
5. Performance Evaluations
The performance of the CNN, BiLSTM, GRU, and ensemble models is shown in the table below:
Table 2.
Performance evaluations.
| Model | Accuracy (%) | Precision | Recall | Recall |
| CNN | 80.6 | 81.6 | 80.6 | 80.6 |
| BiLSTM | 90.98 | 73.09 | 82.83 | 82.83 |
| GRU | 81.2 | 74.2 | 80.0 | 80.0 |
| Ensemble | 90.6 | 0.91 | 0.91 | 0.91 |
As seen in the table, the ensemble model outperforms the individual models across all evaluation metrics, achieving an accuracy of 90.6%, precision of 0.91, recall of 0.91, and an F1 score of 0.91. Among the individual models, BiLSTM achieved the highest accuracy of 91.98%, but the ensemble model significantly improved the overall performance.
6. Discussion
The performance comparison of CNN, BiLSTM, GRU, and Ensemble models reflects the fact that for each metric, there are various strengths and weaknesses. The CNN model shows an overall good performance, with 80.6% accuracy and a balanced precision of 81.6%, a recall of 80.6%, thus providing a very strong F1 score of 83.1% that depicts a reliable but not outstanding classification capability.
The BiLSTM model has the highest accuracy, 90.98%, and a strong recall, 82.83%, indicating that it is very good at identifying true positives. However, its lower precision of 73.09% indicates a higher rate of false positives, hence a moderate F1 score of 77.99%. The performance of the GRU model is fairly close to the CNN, yielding an accuracy of 81.2%, but a slightly reduced precision of 74.2%, with recalls at 80% reflecting good balance but with somewhat reduced performance overall, as reflected by the F1 score of 76%.
The Ensemble model outperforms all models on most metrics, yielding accuracy of 90.6%, precision of 91%, recall of 91%, and an F1 score of 91%. This would suggest that the strengths of the two individual models effectively get combined within the Ensemble and produce a more rounded classification result without significant loss between precision and recall.
7. Conclusions
In this work, we present a comparison of the performance of CNN, BiLSTM, GRU, and ensemble models for DNA sequence classification. Our results highlight that the ensemble model, which combines the powers of CNN, BiLSTM, and GRU, outperforms all individual models in terms of accuracy, precision, recall, and F1 score. This strong performance indicates that ensemble learning leverages the unique strengths of each model in a manner that increases classification accuracy. The performance of the ensemble models developed herein holds a great promise in bioinformatics applications, ranging from genomic sequence analysis to mutation detection. In future work, we will further optimize the ensemble approach and apply it to other biological data sets, extending the usefulness of the approach to a wide range of genomic tasks
Abbreviations
The following abbreviations are used in this manuscript:
| ADAM | Adaptive Moment Estimation |
| AUC | Area Under the Curve |
| AUROC | Area Under the Receiver Operating Characteristic Curve |
| BiLSTM | Bidirectional Long Short-Term Memory |
| BZ2 | Bzip2 Compression Algorithm |
| CNN | Convolutional Neural Network |
| DNA | Deoxyribonucleic Acid |
| d-BM | Derivative Boyer–Moore |
| FLPM | Fast Local Pattern Matching |
| FNR | False Negative Rate |
| FPR | False Positive Rate |
| GRU | Gated Recurrent Unit |
| GWAS | Genome-Wide Association Study |
| KNN | k-Nearest Neighbors |
| LSTM | Long Short-Term Memory |
| LSTM+CNN | Long Short-Term Memory and Convolutional Neural Network Hybrid |
| LZ4 | Lempel–Ziv 4 Compression Algorithm |
| LZMA | Lempel–Ziv–Markov Chain Algorithm |
| ML | Machine Learning |
| MLP | Multi-Layer Perceptron |
| Naïve Bayes | A Probabilistic Classifier Based on Bayes’ Theorem |
| PAPM | Pattern-Aware Pattern Matching |
| ReLU | Rectified Linear Unit |
| RNA | Ribonucleic Acid |
| RNN | Recurrent Neural Network |
| ROC | Receiver Operating Characteristic |
| SVM | Support Vector Machine |
| XGBoost | Extreme Gradient Boosting |
References
- Bojanowski, P., Grave, E., Mikolov, T., & Joulin, A. (2018). Enriching word vectors with subword information. Transactions of the Association for Computational Linguistics, 6, 135-146.
- Cho, K., Van Merriënboer, B., Gulcehre, C., Bahdanau, D., Bougares, F., Schwenk, H., & Bengio, Y. (2014). Learning phrase representations using RNN encoder-decoder for statistical machine translation. Proceedings of the 2014 Conference on Empirical Methods in Natural Language Processing, 1724–1734.
- Chung, J., Gulcehre, C., Cho, K., & Bengio, Y. (2014). Empirical evaluation of gated recurrent neural networks on sequence modeling. arXiv preprint arXiv:1412.3555.
- Dietterich, T. G. (2000). Ensemble methods in machine learning. Multiple Classifier Systems, 1-15.
- Dharaniya, N.G., Raaj, R.K., Vikramathithan, M., Vishal, P., and Yugavanan, S., 2024. DNA sequencing using machine learning algorithm. International Journal of Research Publication and Reviews, 5, pp. 12272–12274. Available at: https://doi.org/10.55248/gengpi.5.0524.1434 [Accessed 13 August 2024]. [CrossRef]
- Dixit, P., and Prajapati, I., G. (2022) Machine Learning in Bioinformatics: A Novel Approach for DNA Sequencing. Available at: https://doi.org/10.1109/acct.2015.73. [CrossRef]
- Fatumo, S., Chikowore, T., Choudhury, A., Ayub, M., 2022. Diversity in Genomic Studies: A Roadmap to Address the Imbalance, Nat Med. [CrossRef]
- Garcia, M., & Patel, S. (2023). Deep Learning Models for DNA Sequence Classification: Applications and Challenges. IEEE Transactions on Computational Biology and Bioinformatics, 20(1), 77-89.
- Hastie, T., et al. (2022). The elements of statistical learning: data mining, inference, and prediction (2nd ed.). Springer.
- Hochreiter, S., & Schmidhuber, J. (1997). Long short-term memory. Neural Computation, 9(8), 1735-1780.
- Hossain, P.S., Kim, K., Uddin, J., Samad, M.A., Choi, K., 2023. Enhancing Taxonomic Categorization of DNA Sequences with Deep Learning: A Multi-Label Approach. Bioengineering, 10, 1293. [CrossRef]
- Hamed, B.A., Ibrahim, O.A.S., El-Hafeez, T.A., 2023c. Optimizing classification efficiency with machine learning techniques for pattern matching. Journal of Big Data, 10. [CrossRef]
- Hu, W., Li, Y., Wu, Y., Guan, L., Li, M., 2024. A Deep Learning Model for DNA Enhancer Prediction based on Nucleotide Position Aware Feature Encoding. iScience, 27, 110030. [CrossRef]
- Li, W., Zhang, H., & Wang, Q. (2020). Application of GRU networks for predicting protein secondary structure. Computational Biology and Chemistry, 85, pp. 107-115.
- Li, X., Liu, S., & Sun, Z. (2020). A Survey of Machine Learning Models for DNA Sequence Classification. Journal of Computational Biology, 27(5), pp. 503-518.
- Li, X., Zhang, Z., & Lu, Y. (2018). BiLSTM network-based deep learning model for human activity recognition. IEEE Access, 6, pp. 29156-29164.
- Liu, J., Zhang, W., & Zhuang, Y. (2020). A novel deep learning model for classification of gene sequences using convolutional neural networks. Bioinformatics, 36(10), 3415-3421.
- Miah, Jonayet and Ayon, Eftekhar Hossain Ayon and Ghosh, Bishnu Padh Ghosh and Mia, Md Tuhin and Badruddowza and Sarker, Md Shohail Uddin Sarker and Islam, MD Tanvir, Enhancing Viral DNA Sequence Classification Using Hybrid Deep Learning Models and Genetic Algorithm Optimization (January 11, 2024). Available at SSRN: https://ssrn.com/abstract=4692259.
- Mittal, S., Jena, M.K., 2024. Machine learning empowered next-generation DNA sequencing: perspective and prospectus. Chemical Science, 12169–12188. [CrossRef]
- Mathur, G., Pandey, A., Goyal, S., 2022. A comprehensive tool for rapid and accurate prediction of disease using DNA sequence classifier. Journal of Ambient Intelligence and Humanized Computing, 14, 13869–13885. [CrossRef]
- Nguyen, T. H., & Zhao, Y. (2022). Challenges and Opportunities in DNA Sequence Pattern Recognition: A Survey. IEEE Transactions on Computational Biology and Bioinformatics, 19(5), 350-363.
- O’Reilly, K., & Jones, D. (2023). Innovations in DNA Sequence Analysis: Addressing Gaps in Geometric and Correlation-Based Approaches. In Proceedings of the 2023 European Conference on Bioinformatics (ECBio), 77-85., last accessed 2016/11/21.
- Ashraf, S., Ahmad, M. and Aslam, N., 2021. Analysis of DNA sequence classification using CNN and hybrid models. BMC Bioinformatics, [online] 22(1), pp.1–10. Available at: https://pubmed.ncbi.nlm.nih.gov/34306171 [Accessed 28 May 2025].
- Kaur, H., Singh, A. and Malhotra, P., 2024. Comparison of deep learning approaches for DNA-binding protein classification using CNN and hybrid models. In: Proceedings of the International Conference on Machine Intelligence and Data Science Applications. Singapore: Springer, pp.123–135. Available at: https://link.springer.com/chapter/10.1007/978-981-99-5881-8_7 [Accessed 28 May 2025].
- Khan, M.A., Tariq, U. and Sharif, M., 2023. SaPt-CNN-LSTM-AR-EA: A hybrid ensemble learning framework for time series-based multivariate DNA sequence prediction. PeerJ Computer Science, [online] 9, e16192. Available at: https://peerj.com/articles/16192 [Accessed 28 May 2025].
- Min, S., Lee, B. and Yoon, S., 2022. Deep learning in bioinformatics. Human Genomics, 16(1), p.1. Available at: https://humgenomics.biomedcentral.com/articles/10.1186/s40246-022-00396-x [Accessed 28 May 2025].
- Mooney, C., Wang, Y. and Zhao, B., 2022. A review of deep learning applications in human genomics using next-generation sequencing data. PLOS Computational Biology, [online] 18(7), e1009312. Available at: https://pmc.ncbi.nlm.nih.gov/articles/PMC9317091 [Accessed 28 May 2025].
- Patel, M., Jain, R. and Thakur, A., 2023. Comparative analysis of deep learning architectures for DNA sequence classification: performance evaluation and model insights. Journal of System and Informatics, [online] 12(2), pp.88–96.
- Sharma, V., Rajput, A. and Dey, N., 2024. Attention-based hybrid deep learning models for classifying COVID-19 genome sequences. Genomic and Informatics, [online] 6(1), p.4. Available at: https://www.mdpi.com/2673-2688/6/1/4 [Accessed 28 May 2025].
- Uthayakumar, S. and Cherukuri, A.K., 2024. A hybrid machine learning model for classifying gene mutations in cancer using LSTM, BiLSTM, CNN, GRU, and GloVe. Intelligent Systems with Applications, [online] 21, p.200117. Available at: https://www.sciencedirect.com/science/article/pii/S2772941924000395 [Accessed 28 May 2025].
Disclaimer/Publisher’s Note: The statements, opinions and data contained in all publications are solely those of the individual author(s) and contributor(s) and not of MDPI and/or the editor(s). MDPI and/or the editor(s) disclaim responsibility for any injury to people or property resulting from any ideas, methods, instructions or products referred to in the content. |
© 2025 by the authors. Licensee MDPI, Basel, Switzerland. This article is an open access article distributed under the terms and conditions of the Creative Commons Attribution (CC BY) license (http://creativecommons.org/licenses/by/4.0/).
Copyright: This open access article is published under a Creative Commons CC BY 4.0 license, which permit the free download, distribution, and reuse, provided that the author and preprint are cited in any reuse.


