Submitted:
25 June 2025
Posted:
30 June 2025
You are already at the latest version
Abstract
Opioid-related deaths in the U.S. have surged, despite ongoing policy efforts. This cross-sectional study analyzed trends in opioid spending among Medicaid and Medicare Part D beneficiaries from 2018 to 2022. Overall, opioid prescriptions and total spending declined, though patterns varied by drug. Findings suggest recent interventions may be reducing opioid reliance.
Keywords:
opioid prescribing trends
; Medicare Part D
; Medicaid drug spending
; prescription opioids
Introduction
Over the past decade, the U.S. opioid epidemic has escalated dramatically, with the rates of opioid-related deaths tripling from 2010 to 2020 (1). This sharp rise has been linked to the third and fourth waves of the crisis, driven respectively by the distribution of synthetic opioids like illicit fentanyl and the increasingly common co-use of stimulants with other opioids during the COVID-19 pandemic (1). Despite increasing efforts at the state level to combat these changes, including improving access to prescription drug monitoring programs (PDMPs), mandatory PDMP use, pain clinic regulations, prescription limit laws, naloxone access laws, and Good Samaritan laws, the crisis continues to escalate (2). To inform future public health efforts, this cross-sectional study was designed to evaluate patterns in opioid medication spending among Medicaid and Medicare Part D beneficiaries from January 2018 to December 2022.
Methods
The data for this study were sourced from the publicly available Medicaid by Drug and Medicare Part D by Drug datasets covering the years 2018 to 2022. We identified all formulations of the most commonly prescribed opioids: hydrocodone, oxycodone, oxymorphone, morphine, codeine, and fentanyl. Information on the number of claims, average spending per claim, and annual spending on each formulation was extracted from both databases. Annual spending and average spending per claim were adjusted for inflation and presented in 2022 dollars using the CPI inflation calculator, based on official records from the U.S. Department of Labor.
Results
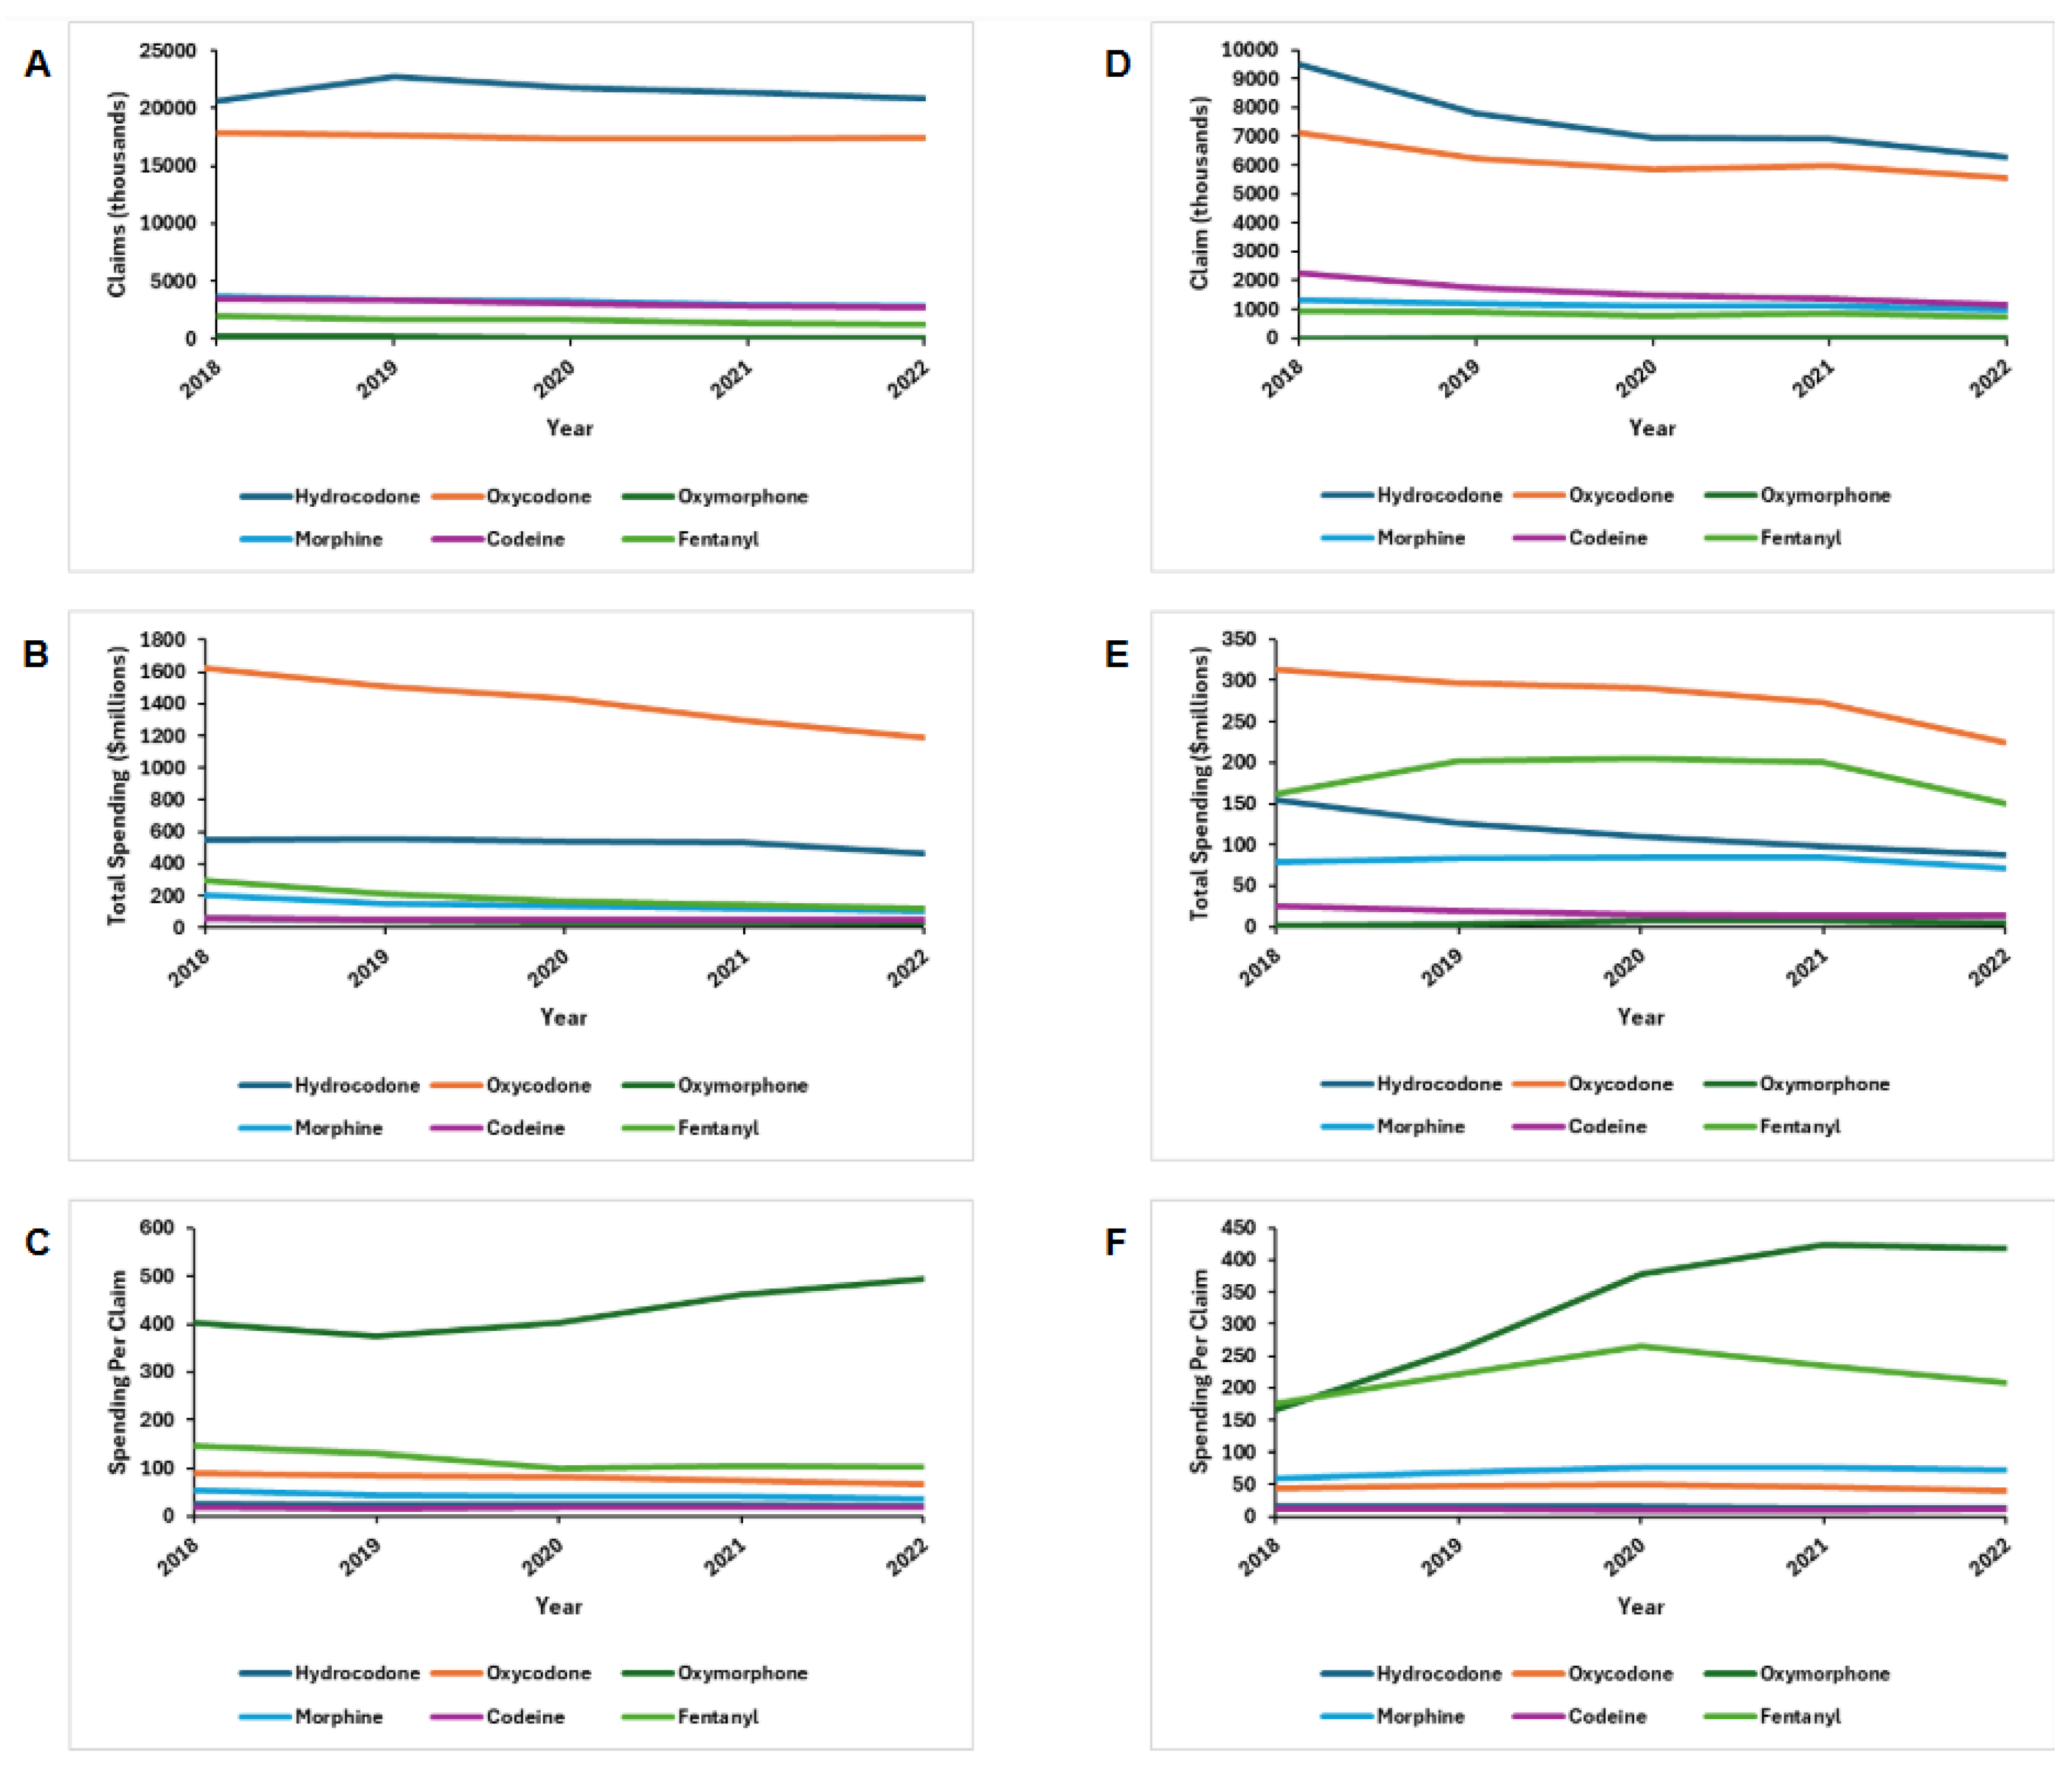
Between 2018 and 2022, opioid claims among Medicare Part D beneficiaries decreased by 6% (47.9 - 45.0 million), influenced predominantly by decreases in fentanyl (2.0 - 1.2 million) and morphine (3.7 - 2.8 million) prescriptions (Figure 1). On the other hand, hydrocodone (20.6 - 20.8 million) was the only opioid found to increase in popularity. Total prescription opioid spending decreased by 21.1% (2.79 - 1.96 billion), brought about primarily by decreases in oxycodone (1.63 - 1.19 billion). Average spending per claim decreased for morphine ($54 to $37), fentanyl ($147 to $102), oxycodone ($91 to $68), and hydrocodone ($27 to $22). It increased for oxymorphone ($402 to $495) and did not vary for codeine.
Likewise, opioid claims among Medicaid beneficiaries decreased by 30% (21.1 - 14.7 million) between 2018 and 2022. Claims decreased for fentanyl (0.92 - 0.72 million), codeine (2.25 - 1.15 million), morphine (1.31 - 0.99 million), oxycodone (7.11 - 5.56 million), and hydrocodone (9.50 - 6.28 million), while increasing for oxymorphone (6529 - 12854) (Figure 1). Total prescription opioid spending decreased by 25.1% (735.6 - 550.9 million) with the most substantial decrease in oxycodone (313.5 - 223.6 million). Spending per claim increased for oxymorphone ($166 to $418), morphine ($52 to $72), and fentanyl ($176 to $208), while remaining stable for oxycodone, hydrocodone, and codeine.
A, Medicare Part D claims; B, Medicare Part D total spending; C, Medicare Part D out-of-pocket spending; D, Medicaid total claims; E, Medicaid total spending. All dollar values are represented in 2019 US dollars.
Discussion
Between 2018 and 2022, both Medicare Part D and Medicaid experienced a downward trend in prescription opioid claims and total spending. Changes in prescribing guidelines and recently implemented interventions aimed at enhancing safety and reducing risks involved with pain medication have been effective in diminishing reliance on opioid prescriptions across multiple hospital systems and could explain the decrease in overall claims (4). Furthermore, these changes have led many providers to turn to non-opioid medications for pain management, most notably gabapentinoids and antidepressants (5).
Consistent with previous studies, we observed substantial declines in licit fentanyl usage due to increased awareness of addiction risks among providers (4). Notably, although oxymorphone usage declined nationwide following the removal of Opana ER in 2017, Medicaid claims for oxymorphone increased between 2018 and 2022 (3). Our study was limited by the inability to account for drug rebates in the spending estimates for Medicaid and Medicare due to a lack of available information.
In conclusion, this cross-sectional study suggests that changes in prescribing guidelines and recently implemented interventions aimed at enhancing safety and reducing risks involved with pain medication have been effective in diminishing reliance on opioid prescriptions.
References
- Post LA, Lundberg A, Moss CB, et al. Geographic trends in opioid overdoses in the US from 1999 to 2020. JAMA Network Open. 2022;5(7). doi:10.1001/jamanetworkopen.2022.23631. [CrossRef]
- Lee B, Zhao W, Yang K-C, et al. Systematic evaluation of state policy interventions targeting the US opioid epidemic, 2007-2018. JAMA Network Open. 2021;4(2). doi:10.1001/jamanetworkopen.2020.36687. [CrossRef]
- DEA Diversion Control. Oxymorphone. DEA Diversion Control Division. November 2022. Accessed January 28, 2025. https://www.deadiversion.usdoj.gov/drug_chem_info/oxymorphone.pdf.
- Stemrich RA, Weber JV, McCall KL, et al. Pronounced declines in dispensed licit fentanyl, but not fentanyl derivatives. Research in Social and Administrative Pharmacy. 2022;18(6):3046-3051. doi:10.1016/j.sapharm.2021.08.001. [CrossRef]
- Gorfinkel LR, Hasin D, Saxon AJ, et al. Trends in Prescriptions for Non-opioid Pain Medications Among U.S. Adults With Moderate or Severe Pain, 2014-2018. J Pain. 2022;23(7):1187-1195. doi:10.1016/j.jpain.2022.01.006. [CrossRef]
Figure 1.
Trends in Medicare and Medicaid claims and spending on popular prescription opioids from 2018 to 2022.
Figure 1.
Trends in Medicare and Medicaid claims and spending on popular prescription opioids from 2018 to 2022.
Disclaimer/Publisher’s Note: The statements, opinions and data contained in all publications are solely those of the individual author(s) and contributor(s) and not of MDPI and/or the editor(s). MDPI and/or the editor(s) disclaim responsibility for any injury to people or property resulting from any ideas, methods, instructions or products referred to in the content. |
© 2025 by the authors. Licensee MDPI, Basel, Switzerland. This article is an open access article distributed under the terms and conditions of the Creative Commons Attribution (CC BY) license (http://creativecommons.org/licenses/by/4.0/).
Copyright: This open access article is published under a Creative Commons CC BY 4.0 license, which permit the free download, distribution, and reuse, provided that the author and preprint are cited in any reuse.


