
Submitted:
27 June 2025
Posted:
27 June 2025
You are already at the latest version
Abstract
Eutrophication, resulting from the environmental impacts of aquaculture activities and the presence of excess nutrients, is particularly significant for aquatic ecosystems. The present study aims to evaluate the eutrophication and trophic status of an aquaculture zone along the southern coast of the Black Sea by employing various indices and comparing the findings with established threshold levels for coastal waters. Water quality parameters-including chlorophyll-a, dissolved oxygen, dissolved inorganic nitrogen, and total phosphorus-were measured at 16 aquaculture production sites located along the southern Black Sea coast. Based on these measurements, TRIX, UNTRIX, and TQRTRIX values were calculated. The average temperature at the production sites was determined to be 21.72±0.11°C (p>0.05), the average salinity was ‰16.84±0.05 (p>0.05), the average pH was 8.28±0.03 (p>0.05), and the average dissolved oxygen concentration was 8.69±0.06 mg/L (p<0.05). The TRIX, UNTRIX, and TQRTRIX values ranged from 2.48 to 4.17, 1.48 to 3.51, and 0.31 to 0.88, respectively. When the water quality parameters and index values from the sampling stations were compared with reference thresholds, variations in trophic status were observed among the sites.
Keywords:
Black Sea
; Aquaculture
; Water quality
; Environmental impacts
; Eutrophication
; Trophic index
1. Introduction
Over the past 40 years, the global aquaculture sector has experienced rapid growth as countries have sought to meet the rising demand for aquatic products. While global capture fisheries have declined in both species diversity and total catch due to overfishing and other factors,-and harvest levels have remained relatively stable since the 1980’s-aquaculture production has continued to grow steadily. This trend suggests that aquaculture, alongside capture fisheries, can play a crucial role in meeting the growing global demand for seafood [1].
According to the FAO’s 2024 report, global aquatic production reached 185.4 million tons in 2022, with aquaculture accounting for 50.9% of the total [2]. In Turkey, aquaculture production has increased significantly over the past 25 years, rising from 18,150 tons in 1997 to 556,287 tons in 2023 [3]. While aquaculture holds substantial potential for Turkey, its productive and sustainable development necessitates environmentally responsible practices.
Numerous factors, including competition over limited resources, influence the development and implementation of intensive aquaculture systems. Among these, environmental impacts are particularly critical. During production, uneaten feed, fish excreta, and other waste materials can have an adverse effect on aquatic ecosystems, potentially accumulating over time and contributing to cumulative environmental stress.
Although numerous studies acknowledge the ecological consequences of aquaculture, some have specifically documented environmental degradation at particular facilities [4,5]. The increasing pollution in aquaculture production areas has become a global concern for the health and resilience of ecosystems. As the industry expands, these environmental impacts are expected to intensify [6]. In China, for instance, pollution from fish farming has already become a serious issue in coastal waters [7,8,9,10]. Similarly, in Australia and New Zealand, environmental concerns have been cited as major constraints to the further development of cage aquaculture [11].
The environmental impacts of aquaculture vary depending on the culture method, production capacity, hydrographic characteristics of the area, stocking density, farm management practices, feed composition, and the biological, chemical, and physical features of the farming site [12,13]. A measurable increase in the concentration of dissolved nutrients is referred to as eutrophication. In stagnant or semi-enclosed water bodies, excessive accumulation of nitrogen and phosphorus can shift the trophic status from oligotrophic to mesotrophic, eutrophic, and ultimately hypertrophic conditions [14,15]. When nutrient input exceeds the natural assimilative capacity of aquatic ecosystems, it may lead to eutrophication, oxygen depletion, and shifts in biodiversity, both in the water column and in sediments [16].
To assess the environmental impacts of waste from feed and metabolism in aquaculture, factors such as the settling rate of feed and feces, sediment composition and grain size, and changes in natural species composition must be taken into account. Sediment degradation and eutrophication driven by nutrient loading in the water column are key environmental issues. Evaluating the risks and consequences of eutrophication in estuarine and coastal ecosystems is a central aspect of environmental management [17].
One of the key tools used to evaluate the eutrophication status of aquaculture areas is the Trophic Index (TRIX). Owing to its simplicity, TRIX has been widely adopted across various European countries for classifying the trophic status of water bodies [18]. It has been applied in the Adriatic and Tyrrhenian Seas [19,20,21], northern European seas [22], the Black Sea [23,24], the Baltic coastal waters [25], the Ionian Sea [26], and the Venice Lagoon [27].
In Turkey, legislation enacted in 2022 established parameters and criteria for the siting of fish farms in enclosed bays and gulfs. These regulations assess the environmental impact of aquaculture on aquatic ecosystems using the TRIX index values and the degree of eutrophication [28].
Although TRIX offers valuable insights for environmental decision-making, it must be integrated with other data sources to form a comprehensive understanding necessary for adaptive coastal water management [29,30,31]. TRIX and its adapted version, TRIXcs, have also been used in combination with chemical and biological indicators-such as phytoplankton abundance in the Caspian Sea-to assess water quality [32].
The Black Sea, bordered by Bulgaria, Romania, Ukraine, Russia, Georgia, and Turkey, has been subjected to multiple stressors since the 1960’s due to intensive anthropogenic activity. These include eutrophication caused by nutrient pollution, overfishing, the introduction of invasive species, coastal erosion resulting from construction, and climate change, all of which have severely impacted the region’s ecological balance [33]. The sea has experienced nearly every known anthropogenic pressure, including marine litter [34,35]; nutrient enrichment, eutrophication, and hypoxia [36]; coastal erosion and abrasion [37,38]; and biological invasions [39].
Although there is a substantial body of research on the ecological impacts of aquaculture [18,40,41,42,43,44], studies specifically classifying the trophic status of aquaculture zones along the Black Sea coast remain scarce. This renders the present research distinctive.
The present study aims to assess the eutrophication and trophic status of aquaculture areas along the southern coast of the Black Sea using a range of indices and to compare the resulting values with threshold levels established for coastal waters.
2. Materials and Methods
The Black Sea is one of the major fishing grounds, possessing substantial potential for the exploitation of aquatic resources. In addition to capturing fisheries, cage-based aquaculture is carried out in designated zones within the Black Sea. The present study assessed the eutrophication status of 16 aquaculture production sites located along the southern coast of the Black Sea (Figure 1).
Aquaculture facilities along the southern coast of the Black Sea employ cage systems for production (Figure 2).
Measurements and samplings were conducted instantaneously at seven points designated within the aquaculture areas (500m and 50m upstream from the production area against the current; 50m, 100m, and 200m downstream in the direction of the current; and 50 m from the shallow and deep zones of the production area) [28] (Figure 3).
2.1. Water Quality Measurement
Water quality parameters—specifically temperature, salinity, pH, and dissolved oxygen levels (both percentile saturation and mg/L)—were measured in situ at the sampling stations using a YSI 556 MPS multiparameter probe system.
Chlorophyll-a, dissolved inorganic nitrogen, and total phosphorus concentrations in the production areas were determined through laboratory analysis of water samples. These analyses were conducted in a laboratory accredited by the Turkish Accreditation Agency under the TS EN ISO/IEC 17025 standard. They were performed in accordance with ISO, EPA, TS, and EN protocols.
2.2. Trophic Index (TRIX), UNTRIX and TQRTRIX
To determine the eutrophication risk scale of the aquaculture sites, three metrics were employed: the Trophic Index (TRIX), the Unscaled Trophic Index (UNTRIX), and the Quartile Range of the Trophic Index (TQRTRIX). The TRIX index provides a valuable tool for assessing the trophic status of coastal waters [19]. UNTRIX has been proposed as an alternative approach for classifying trophic status using unscaled data. Both TRIX and UNTRIX are based on four state variables that are strongly associated with nutrient-related productivity: chlorophyll-a, dissolved oxygen (% saturation), dissolved inorganic nitrogen (DIN), and total phosphorus (TP). TQRTRIX, in contrast, is derived from a scale developed through the evaluation of UNTRIX values, incorporating data from both reference sites and aquaculture production areas [45].
The formulas used for calculating TRIX, UNTRIX, and TQRTRIX are as follows [19,45]:
TRIX = [Log (Chl-a x DO2 (%) x DIN x TP) − (-1,5)] /1,2,
UNTRIX = log (Chl-a × DO2 (%) x DIN x TP),
TQRTRIX = 50th UNTRIXref / 75th UNTRIXsite,
Chl-a: Chlorophyll-a concentration (μg L-1).
DO2 (%): Absolute deviation of measured dissolved oxygen content in % from 100% saturation.
TIN: Concentration of total N (μg L-1).
TP: Concentration of total P (μg L-1).
The comparative evaluation of the TRIX index results was conducted based on the table below (Table 1), which presents the classification of the aquaculture area according to the trophic index.
2.3. Statistical Analysis
A one-way analysis of variance (ANOVA) was conducted to evaluate differences in water quality parameters among the stations. Following ANOVA, Tukey’s HSD post hoc test was applied to identify statistically significant differences at the levels of p<0.05, p<0.01, and p<0.001.
3. Results
The aquaculture site examined in the present study is located in the southern part of the Black Sea and exhibits the characteristics of a semi-enclosed gulf. The average depth of the production area ranges between 40 and 78 meters. A total of 33 aquaculture enterprises operate within this region. While the total licensed production capacity of these enterprises is 38,880 tons per year, the actual production volume in 2023 was approximately 26,700 tons. In addition to the impacts associated with aquaculture activities, urban and industrial influences are also present in and around the production area.
3.1. Water Quality Parameters
The average temperature across the stations was measured at 21.72±0.11°C (p>0.05), the average salinity at ‰16.84±0.05 (p>0.05), the average pH at 8.28±0.03 (p>0.05), and the average dissolved oxygen concentration at 8.69±0.06 mg/L (p<0.05).
The mean depths of the sampling stations ranged from 42.1 to 77.2 m, while Secchi disk depths were recorded between 3.0 and 14.8 m. Chlorophyll-a concentrations ranged from 0 to 0.5 µg/L, and dissolved oxygen saturation varied between 88.07% and 116.83%. Total dissolved inorganic nitrogen (TIN) concentrations in the production areas ranged from 0.073 to 0.404 mg/L, whereas total phosphorus (TP) values were recorded between 0.022 and 0.05 mg/L (Table 3).
Dissolved oxygen values ranged from a minimum of 88.07% to a maximum of 116.83%. Total dissolved inorganic nitrogen (TIN) concentrations varied between 0.073 and 0.404 mg/L. Total phosphorus (TP) values were recorded between a minimum of 0.005 and a maximum of 0.022 mg/L. Chlorophyll-a concentrations were generally observed to be below 0.5 µg/L.
3.2. TRIX, UNTRIX, and TQRTRIX Values
The TRIX, UNTRIX, and TQRTRIX values calculated from the data collected in the production area are presented in Table 4.
The TRIX values for all production areas ranged from 2.48 to 4.17. According to the TRIX index scale provided in Table 1, stations with TRIX values below 4 were classified as having “No Eutrophication Risk.” In contrast, those with values between 4 and 5 were categorized as having a “Low Eutrophication Risk.” The UNTRIX values in the production areas were found to range from 1.48 to 3.51. Overall, a general consistency was observed between the TRIX and UNTRIX values calculated for the stations within the production area. The TQRTRIX values ranged from 0.31 to 0.88.
The TRIX, UNTRIX, and TQRTRIX values calculated from the production area data are illustrated in Figure 4.
Among the calculated TRIX and UNTRIX values for the production area, the best value was identified at Station 14, which also had the highest Secchi disk depth (14.5 m). In terms of the calculated TQRTRIX values, the best result was found at Station 10.
The statistical analysis conducted in the study revealed significant differences among the sampling areas of the production zones in terms of Chl-a, TP, depth, Secchi disk depth, and TRIX values (Table 5).
4. Discussion and Conclusions
According to the European Water Framework Directive (WFD), the classification of coastal waters serves as the basis for assessing ecological status [46,47,48]. Marine and coastal environments are influenced by numerous factors that can lead to eutrophication. In recent years, changes in marine water parameters have altered trophic status by increasing phytoplankton abundance, thereby imposing stress and pressure on local species [49]. Moreover, coastal waters are characterized by rapid temporal fluctuations in nutrient concentrations and chlorophyll-a levels, rendering them highly dynamic systems [20]. To understand the dynamics of marine ecosystems, trophic status can be evaluated using various indices [50]. However, in addition to monitoring eutrophication-related variables, reference data are also essential for assessing trophic conditions [51].
Aquaculture is particularly sensitive to pollution and requires a cleaner environment compared to other coastal activities. Therefore, all factors that may negatively impact the ecosystem must be thoroughly examined [52]. In this context, the present study evaluated the eutrophication and trophic status of the aquaculture area using the TRIX, UNTRIX, and TQRTRIX indices and compared the results with the desired values for coastal waters.
According to the TRIX index proposed by Vollenweider et al. [19] and the reference classification table of the Ministry of Environment and Urbanization [28], TRIX values for the production area in the present study ranged from 2.48 to 4.17, indicating a High–Good trophic status. In the present study, 31.25% of the aquaculture area exhibited TRIX values between 4 and 5, corresponding to a “Low Eutrophication Risk.”
Giovanardi and Vollenweider [20] reported that TRIX values exceeding 6 for coastal waters indicate potential eutrophication, while values below 4 suggest rare eutrophication and values below 3 correspond to areas with very low productivity and low phytoplankton abundance.
Trophic status classification based on TRIX is as follows: 2–4 Good, 4–5 Moderate, 5–6 Poor, and 6–8 Bad (dlgs. 152/99) [21].
Aertebjerg et al. [53] noted that the trophic status of temperate waters is strongly influenced by seasonal variations, displaying tendencies toward both low and high trophic conditions during winter and spring within the same year. Saravi [54] indicated that even in the presence of high nutrient concentrations, TRIX values may remain low under low-temperature conditions. As the Black Sea is not classified as a temperate sea, seasonal changes are expected to have a limited impact on its trophic status. The present study was conducted during the summer, when seawater temperatures were relatively high, and differences in TRIX values were observed among the stations.
An inverse relationship was identified between TRIX values and the depth of the production areas, although depth alone is not an isolated influencing factor. This finding aligns with the assessments of Saravi [54], Shahrban and Etemad-Shahidi [55], and Saravi et al. [56]. It has also been reported that nearshore marine areas experience more rapid degradation in water quality and are more susceptible to eutrophication [57]. Coastal zones located closer to land are directly influenced by terrestrial runoff [45].
The ongoing development of eutrophication assessment tools highlights the need to strengthen the linkage between nutrient-related variables and both the direct and indirect effects of eutrophication [58]. According to the TQRTRIX values and reference classification proposed by Pettine et al. [45], the trophic status of the production area in the present study was classified as Poor–High (TQRTRIX values: 0.31–0.88). Additionally, UNTRIX values for the production area ranged from 1.48 to 3.51.
Various studies have demonstrated that different trophic indices used for classifying coastal water trophic status are generally compatible and consistent, thus supporting their application in trophic classification [18,45]. However, other studies have indicated that TRIX and UNTRIX values are not always consistent or meaningful and that variations in trophic status may be influenced by nutrient loads, particularly nitrogen and phosphorus concentrations [56,59].
In the present study, the TQRTRIX index, based on TRIX and UNTRIX, was utilized to determine the trophic status of the production area. Based on average TRIX and TQRTRIX values, the area was found to exhibit a low trophic level and a low risk of eutrophication, considering seasonal variation. When compared with established reference thresholds, the results remained below legal limits [28]. TRIX values likely remained below threshold levels because aquaculture operations in the region were not functioning at full capacity. Given the recent increase in aquaculture activity in the Black Sea, continuous monitoring and evaluation of production sites based on reference thresholds is essential. Furthermore, it was observed that, in addition to the main components of the trophic indices (chlorophyll-a, %DO, TIN, TP), both the average depth of the production area and Secchi disk depth were correlated with the index values.
The findings of the present study demonstrate that all stakeholders involved in aquaculture operations must employ continuous monitoring through TRIX applications and systematically analyze the resulting data to ensure the sustainable management of coastal environments.
Author Contributions
Conceptualization, B.B.; methodology, B.B. and O.G.B.; software, B.B. and O.G.B.; validation, B.B. and O.G.B.; investigation, B.B. and O.G.B.; resources, B.B.; data curation, B.B. and O.G.B.; writing—original draft preparation, B.B. and O.G.B.; writing—review and editing, B.B. and O.G.B.; visualization, B.B. and O.G.B.; supervision, B.B. and O.G.B. All authors have read and agreed to the published version of the manuscript.
Funding
No financial supports have been provided for the conduct of the research and/or preparation of the article. This research did not receive any specific grant from funding agencies in the public, commercial, or not-for-profit sectors.
Institutional Review Board Statement
Not applicable.
Informed Consent Statement
Not applicable.
Data Availability Statement
The original contributions presented in this study are included in the article/supplementary material. Further inquiries can be directed to the corresponding author.
Acknowledgments
We are grateful to the anonymous reviewers for their suggestions and comments, which allowed to significantly improve the present paper.
Conflicts of Interest
The authors declare that they have no known competing financial interests or personal relationships that could have appeared to influence the work reported in this paper.
References
- FAO. The state of world fisheries and aquaculture. Food and Agriculture Organization of the United Nations, Rome, 2022. Link: https://openknowledge.fao.org/items/11a4abd8-4e09-4bef-9c12-900fb4605a02.
- FAO. The state of world fisheries and aquaculture. Food and Agriculture Organization of the United Nations, Rome, 2024. Link: https://openknowledge.fao.org/items/06690fd0-d133-424c-9673-1849e414543d.
- TURKSTAT. Turkish Statistical Institute Fishery Statistics 2023. Prime Ministry Republic of Turkey, 2024. Link: https://data.tuik.gov.tr/Bulten/Index?p=Fishery-Products-2023-53702&dil=2#:~:text=In%202023%2C%20capture%20of%20fishery,as%20553%20thousand%20862%20tonnes.
- Barg, U.C. Guideline For The Promotion Of Management Of Costal Aquaculture Development Of Coastal Aquaculture Development. FAO Fisheries Technical Paper, 1992, No:328, 122pp. Link: https://openknowledge.fao.org/handle/20.500.14283/t0697e.
- Koca, S.B.; Terzioğlu, S.; Didinen, B.I.; Yiğit, N.Ö. Eco-friendly Production for Sustainable Aquaculture. Ankara University Journal of Environmental Sciences 2011, 3(1), 107-113. Link: https://scholar.google.com/scholar?hl=tr&as_sdt=0%2C5&q=Koca%2C+S.B.%3B+Terzio%C4%9Flu%2C+S.%3B+Didinen%2C+B.I.%3B+Yi%C4%9Fit%2C+N.%C3%96.+Eco-friendly+Production+for+Sustainable+Aquaculture.+Ankara+University+Journal+of+Environmental+Sciences+2011%2C+3%281%29%2C+107-113.&btnG=.
- Klesius, M. The State of the Planet: A Global Report Card. National Geographic 2002, 197(9), 102-115.
- Duqi, Z.; Minjie, F. The review of marine environment on carrying capacity of cage culture. 2nd International Symposium on Cage Aquaculture in Asia (CAA2), Hangzhou, China (3-8 July 2006).
- Honghui, H.; Qing, L.; Chunhou, L.; Juli, G.; Xiaoping, J. Impact of cage fish farming on sediment in Daya Bay, PR China. 2nd International Symposium on Cage Aquaculture in Asia, Hangzhou, China (3-8 July 2006).
- Xiao, C.; Shaobo, C.; Shenyun, Y. Pollution of mariculture and recovery of the environment. 2nd International Symposium on Cage Aquaculture in Asia, Hangzhou, China (3-8 July 2006).
- Chen, J.; Guang, C.; Xu, H.; Chen, Z.; Xu, P.; Yan, X.; Wang, Y.; Liu, J. A review of cage and pen aquaculture: China. In M. Halwart, D. Soto and J.R. Arthur (eds). Cage aquaculture-Regional reviews and global overview, pp. 50–68. FAO Fisheries Technical Paper, 2007, No. 498. Rome, FAO, 241 pp. Link: https://www.fao.org/4/a1290e/a1290e03.pdf.
- Rimmer, M.A.; Ponia, B. A review of cage aquaculture: Oceania. In M. Halwart, D. Soto and J.R. Arthur (eds). Cage aquaculture-Regional reviews and global overview, pp. 208-231. FAO Fisheries Technical Paper, 2007, No. 498. Rome, FAO, 241 pp. Link: https://www.fao.org/4/a1290e/a1290e09.pdf.
- Davies. P.E. Cage culture of salmonids in lakes: best practice and risk management for Tasmania. Report to Minister for Inland Fisheries and Inland Fisheries Service, 2000, Freshwater Systems, Sandy Bay, Tasmania, Australia. Link: https://scholar.google.com/scholar?hl=en&q=Davies+P.+E.+%282000%29+Cage+Culture+of+Salmonids+in+Lakes%3A+Best+Practice+and+Risk+Management+for+Tasmania.+Freshwater+Systems.+Report+to+Minister+for+Inland+Fisheries+and+Inland+Fisheries+Service.
- Beveridge, M. Cage Aquaculture, 3rd ed.; Publisher: Blackwell Publishing Ltd. Oxford, England, 2004; 368 pp. Link: https://scholar.google.com/scholar?hl=tr&as_sdt=0%2C5&q=Beveridge%2C+M.+Cage+Aquaculture&btnG=.
- Pillay, T. Aquaculture and Environment, 2rd ed.; Publisher: Blackwell Publishing Ltd. Oxford, England, 2004; 195 pp. Link: https://scholar.google.com/scholar?hl=tr&as_sdt=0%2C5&q=Pillay%2C+T.+Aquaculture+and+Environment&btnG=.
- Pillay, T.V.R.; Kutty, M.N. Aquaculture: Principles and Practices, 2rd ed.; Publisher: Blackwell Publishing Ltd. Oxford, England, 2005; 624 pp. Link: https://scholar.google.com/scholar?hl=tr&as_sdt=0%2C5&q=Pillay%2C+T.V.R.%3B+Kutty%2C+M.N.+Aquaculture%3A+Principles+and+Practices&btnG=.
- IUCN (The World Conservation Union). Guide for the Sustainable Development of Mediterranean Aquaculture, 2007, No:1. Link: https://iucn.org/content/guide-sustainable-development-mediterranean-aquaculture.
- Painting, S.J.; Devlin, M.J.; Rogers, S.I.; Mills, D.K.; Parker, E.R.; Rees, H.L. Assessing the suitability of OSPAR EcoQOs for eutrophication vs ICES criteria for England and Wales. Marine Pollution Bulletin 2005, 50, 1569–1584. Link: https://scholar.google.com/scholar?hl=tr&as_sdt=0%2C5& q=Assessing+the+suitability+of+OSPAR+EcoQOs+for+eutrophication+vs+ICES+criteria+for+Eng land+and+Wales&btnG=
- Yucel-Gier, G.; Pazi, I.; Kucuksezgin, F.; Kocak, F. The composite trophic status index (TRIX) as a potential tool for the regulation of Turkish marine aquaculture as applied to the eastern Aegean coast (Izmir Bay). J. Appl. Ichthyol. 2011, 27, 39–45. [CrossRef]
- Vollenweider, R.A.; Giovanardi, F.; Motanari, G.; Rinaldi, A. Characterization of the trophic conditions of marine coastal waters with special reference to the NW Adriatic Sea: proposal for a trophic scale, turbidity and generalized water quality index. Environmetrics 1998, 9, 329–357. [CrossRef]
- Giovanardi, F.; Vollenweider, R.A. Trophic conditions of marine coastal waters: experience in applying the Trophic Index TRIX to two areas of the Adriatic and Tyrrhenian Seas. Journal of Limnology 2004, 63, 199–218. [CrossRef]
- Artioli, Y.; Bendoricchio, G.; Palmeri, L. Defining and modeling the coastal zone affected by the Po River (Italy). Ecol. Modell. 2005, 184, 55–68. [CrossRef]
- EEA (European Environment Agency). Eutrophication in Europe’s coastal waters. Topic report, 2001, No. 7, Copenhagen, pp. 86. Link: https://www.eea.europa.eu/publications/topic_report_2001_7/Topic_Report_7_2001.pdf.
- Moncheva, S.; Dontcheva, V.; Shtereva, G.; Kamburska, L.; Malej, A.; Gorinstein, S. Application of eutrophication indices for assessment of the Bulgarian Black Sea coastal ecosystem ecological quality. Water Sci Technol. 2002, 46(8):19-28. PMID: 12420962. [CrossRef]
- Parkhomenko, A.V.; Kuftarkova, E.A.; Subbotin, A.A.; Gubanov, V.I. Results of hydrochemical monitoring of Sevastopol Black Sea’s offshore waters. J. Coastal Res. 2003, 19, 907–911. https://www.jstor.org/stable/4299233.
- Vascetta, M.; Kauppila, P.; Furman, E. Indicating eutrophication for sustainability considerations by the trophic index TRIX-does our baltic case reveal its usability outside Italian waters? PEER Conference, Finnish Environment Institute, Helsinki, Finland (17 November 2004).
- Nikolaidis, G.; Moschandreou, K.; Patoucheas, D.P. Application of trophic index (TRIX) for water quality assessment in Kalamitsi coasts (Ioanian Sea) after the operation of the wastewater treatment plant. Fresenius Environ. Bull. 2008, 17, 1938-1944. https://www.prt-parlar.de/download_list/?c=FEB_2008.
- Bendoricchio, G.; De Boni, G. A water-quality model for the Lagoon of Venice, Italy. Ecol. Modell. 2005, 184, 69–81. [CrossRef]
- MEF, (Ministry of Environment and Forestry). Regulation on environmental management of fish farms operating at sea (in Turkish). Turkish Official Gazette, 28 October 2020, No: 31288. Link: https://www.resmigazete.gov.tr/eskiler/2020/10/20201028-1.htm.
- Giovanardi, F.; Ferrari, C.R.; Rinaldi, A.; Volleinweider, R.A. The use of trophic index TRIX and other derived indicators as management tools for regional government administrators: the case of the Emilia Romagna coastal waters. Biol. Mar. Med. 2003, 11, 210–229. Link: https://scholar.google.com/scholar_lookup?hl=en&volume=11&publication_year=2003&pages=210-229&journal=Biol.+Mar.+Med.&author=F.+Giovanardi&author=C.+R.+Ferrari&author=A.+Rinaldi&author=R.+A.+Volleinweider&title=The+use+of+trophic+index+TRIX+and+other+derived+indicators+as+management+tools+for+regional+government+administrators%3A+the+case+of+the+Emilia+Romagna+coastal+waters.
- Vascetta, M.; Kauppila, P.; Furman, E. Aggregate indicators in coastal policy making: potentials of the trophic index TRIX for sustainable considerations of eutrophication. Sustain. Dev. 2008, 16, 282–289. [CrossRef]
- Herrera-Silveira, J.A.; Morales-Ojeda, S.M. Evaluation of the health status of a coastal ecosystem in southeast Mexico: assessment of water quality, phytoplankton and submerged aquatic vegetation. Mar. Pollut. Bull. 2009, 59, 72–86. [CrossRef]
- Nasrollahzadeh, H.S.; Din, Z.B.; Foong, S.Y.; Makhlough, A. Trophic status of the Iranian Caspian sea based on water quality parameters and phytoplankton diversity. Continental Shelf Res. 2009, 28, 1153–1165. [CrossRef]
- Akoglu, E. Ecological indicators reveal historical regime shifts in the Black Sea ecosystem. PeerJ, 2023, 11:e15649. [CrossRef]
- Topçu, E.N.; Öztürk, B. Abundance and composition of solid waste materials on the western part of the Turkish Black Sea seabed. Aquatic Ecosystem Health & Management 2010, 13, 301–306. [CrossRef]
- Ioakeimidis, C.; Zeri, C.; Kaberi, H.; Galatchi, M.; Antoniadis, K.; Streftaris, N.; Galgani, F.; Papathanassiou, E.; Papatheodorou, G. A comparative study of marine litter on the seafloor of coastal areas in the Eastern Mediterranean and Black Seas. Marine Pollution Bulletin 2014, 89(1–2), 296–304. [CrossRef]
- Pokazeev, K.; Sovga, E.; Chaplina, T. Pollution in the Black Sea. 2rd ed.; Publisher: Springer, Switzerland, 2021; 227 pp.
- Kosyan, R.D.; Velikova, V.N. Coastal zone–Terra (and aqua) incognita–Integrated coastal zone management in the Black Sea. Estuarine, Coastal and Shelf Science 2016, 169(3), 1–16. [CrossRef]
- Tătui, F.; Pîrvan, M.; Popa, M.; Aydogan, B.; Ayat, B.; Görmüș, T.; Korzinin, D.; Văidianu, N.; Vespremeanu-Stroe, A.; Zăinescu, F.; Kuznetsov, S. The Black Sea coastline erosion: index-based sensitivity assessment and management-related issues. Ocean & Coastal Management 2019, 182, 104949. [CrossRef]
- Shalovenkov, N. Alien species invasion: case study of the Black Sea. Coasts and Estuaries, 1nd ed.; Wolanski E, Day JW, Elliott M, Ramachandran R, Eds.. Publisher: Elsevier, Amsterdam, 2019, pp. 547–568. [CrossRef]
- Karakassis, I.; Tsapakis, M.; Hatziyanni, E.; Papadopoulou, K.N.; Plaiti, W. Impact of cage farming of fish on the seabed in three Mediterranean coastal areas. ICES J. Mar. Sci. 2000, 57, 1462-1471. [CrossRef]
- GESAMP. Planning and management for sustainable coastal aquaculture development. FAO, Rome, Reports and Studies, 2001, No:68. http://www.gesamp.org/site/assets/files/1247/planning-and-management-for-sustainable-coastal-aquaculture-development-en.pdf.
- Kalantzi, I.; Karakassis, I. Benthic impacts of fish farming: meta-analysis of community and geochemical data. Mar. Pollut. Bull. 2006, 52, 484–493. [CrossRef]
- Yucel-Gier, G.; Kucuksezgin, F.; Kocak, F. Effects of fish farming on nutrients and benthic community structure in the Eastern Aegean (Turkey). Aquacult. Res. 2007, 38, 256–267. [CrossRef]
- Neofitou, N.; Klaoudatos, S. Effect of fish farming on the water column nutrient concentration in a semi-enclosed gulf of the Eastern Mediterranean. Aquacult. Res. 2008, 39, 482–490. [CrossRef]
- Pettine, M.; Casentini, B.; Fazi, S.; Giovanardi, F.; Pagnotta, R. A revisitation of TRIX for trophic status assessment in the light of the European Water framework Directive: Application to Italian coastal waters. Marine Pollution Bulletin 2007, 54, 1413–1426. [CrossRef]
- Borja, A.; Muxika, I.; Franco, J. The application of a Marine Biotic Index to different impact sources affecting soft-bottom benthic communities along European coasts. Marine Pollution Bulletin 2003, 46, 835–845. [CrossRef]
- Simboura, N.; Panayotidis, P.; Papathanassiou, E. A synthesis of the biological quality elements for the implementation of the European Water Framework Directive in the Mediterranean ecoregion: the case of Saronikos Gulf. Ecological Indicators 2005, 5, 253–266. [CrossRef]
- Muxika, I.; Borja, A.; Bald, J. Using historical data, expert judgement and multivariate analysis in assessing reference conditions and benthic ecological status, according to the European Water Framework Directive. Marine Pollution Bulletin 2007, 55, 16–29. [CrossRef]
- Bagheri, S.; Khatib, S.; Yeok, F.S. Changes in near-shore phytoplankton community and distribution, south western Caspian Sea. Limnology 2024, 25, 293–303. [CrossRef]
- Cognetti, G. Marine eutrophication: the need for a new indicator species. Marine Pollution Bulletin 2001, 42, 163-164. [CrossRef]
- Izzo, G.; Silvestri, C.; Creo C.; Signorini, A Is nitrate an oligotrophic factor in Venice Lagoon. Marine Chemistry 1997, 58, 245-253. [CrossRef]
- Yucel-Gier, G.; Uslu, O.; Kucuksezgin, F. Regulating and monitoring marine finfish aquaculture in Turkey. J. Appl. Ichthyol. 2009, 25, 686–694. [CrossRef]
- Aertebjerg, G.; Carstensen, J.; Dahl, K.; Hansen, J.; Nygard, K.; Rygg, B.; Sørensen, K.; Severinsen, G.; Casartelli, S.; Schrimpf, W.; Schiller, C.; Druon, J.N. Eutrophication in Europe‟s coastal waters. European Environmental Agency. Copenhagen, 2001, DK. 86 p. https://www.eea.europa.eu/publications/topic_report_2001_7/topic_report_7_summary.pdf.
- Saravi, N.H. Ecological modeling on nutrient distribution and phytoplankton diversity in the southern of the Caspian Sea. Doctoral Dissertation, University Science Malaysia, Malaysia, 2008.
- Shahrban, M.; Etemad-Shahidi, A. Classification of the Caspian Sea coastal waters based on trophic index and numerical analysis. Environmental Monitoring and Assessment 2010, 164, 349–356. [CrossRef]
- Saravi, N.H.; Pourang N.; Foong, S.Y.; Makhlough A. Eutrophication and trophic status using different indices: A study in the Iranian coastal waters of the Caspian Sea. Iranian Journal of Fisheries Sciences 2019, 18(3), 531-546. https://jifro.ir/article-1-2767-fa.pdf.
- Kontas, A.; Kucuksezgin, F.; Altay, O.; Uluturhan, E. Monitoring of eutrophication and nutrient limitation in the Izmir Bay (Turkey) before and after wastewater treatment plant. Environ. Int. 2004, 29, 1057–1062. [CrossRef]
- Painting, S.J.; Devlin, M.J.; Malcolm, S.J.; Parker, E.R.; Mills, D.K.; Mills, C.; Tett, P.; Wither, A.; Burt, J.; Jones, R.; Winpenny, K. Assessing the impact of nutrient enrichment in estuaries: susceptibility to eutrophication. Marine Pollution Bulletin 2007, 55, 74–90. [CrossRef]
- Saravi, N.H.; Makhlough, A.; Vahedi, F.; Abedini, A.; Daryanabard, Gh.R.; Rostami, K.M. Temporal-spatial changes of the trophic index (TRIXcs), the risk of eutrophication (UNTRIX) and the determination of affected areas using a spatial salinity pattern in the southern of Caspian Sea. Iranian Scientific Fisheries Journal 2021, 30:2, 61-73. https://isfj.ir/browse.php?a_id=2404&sid=1&slc_lang=en.
Figure 1.
Study Area.
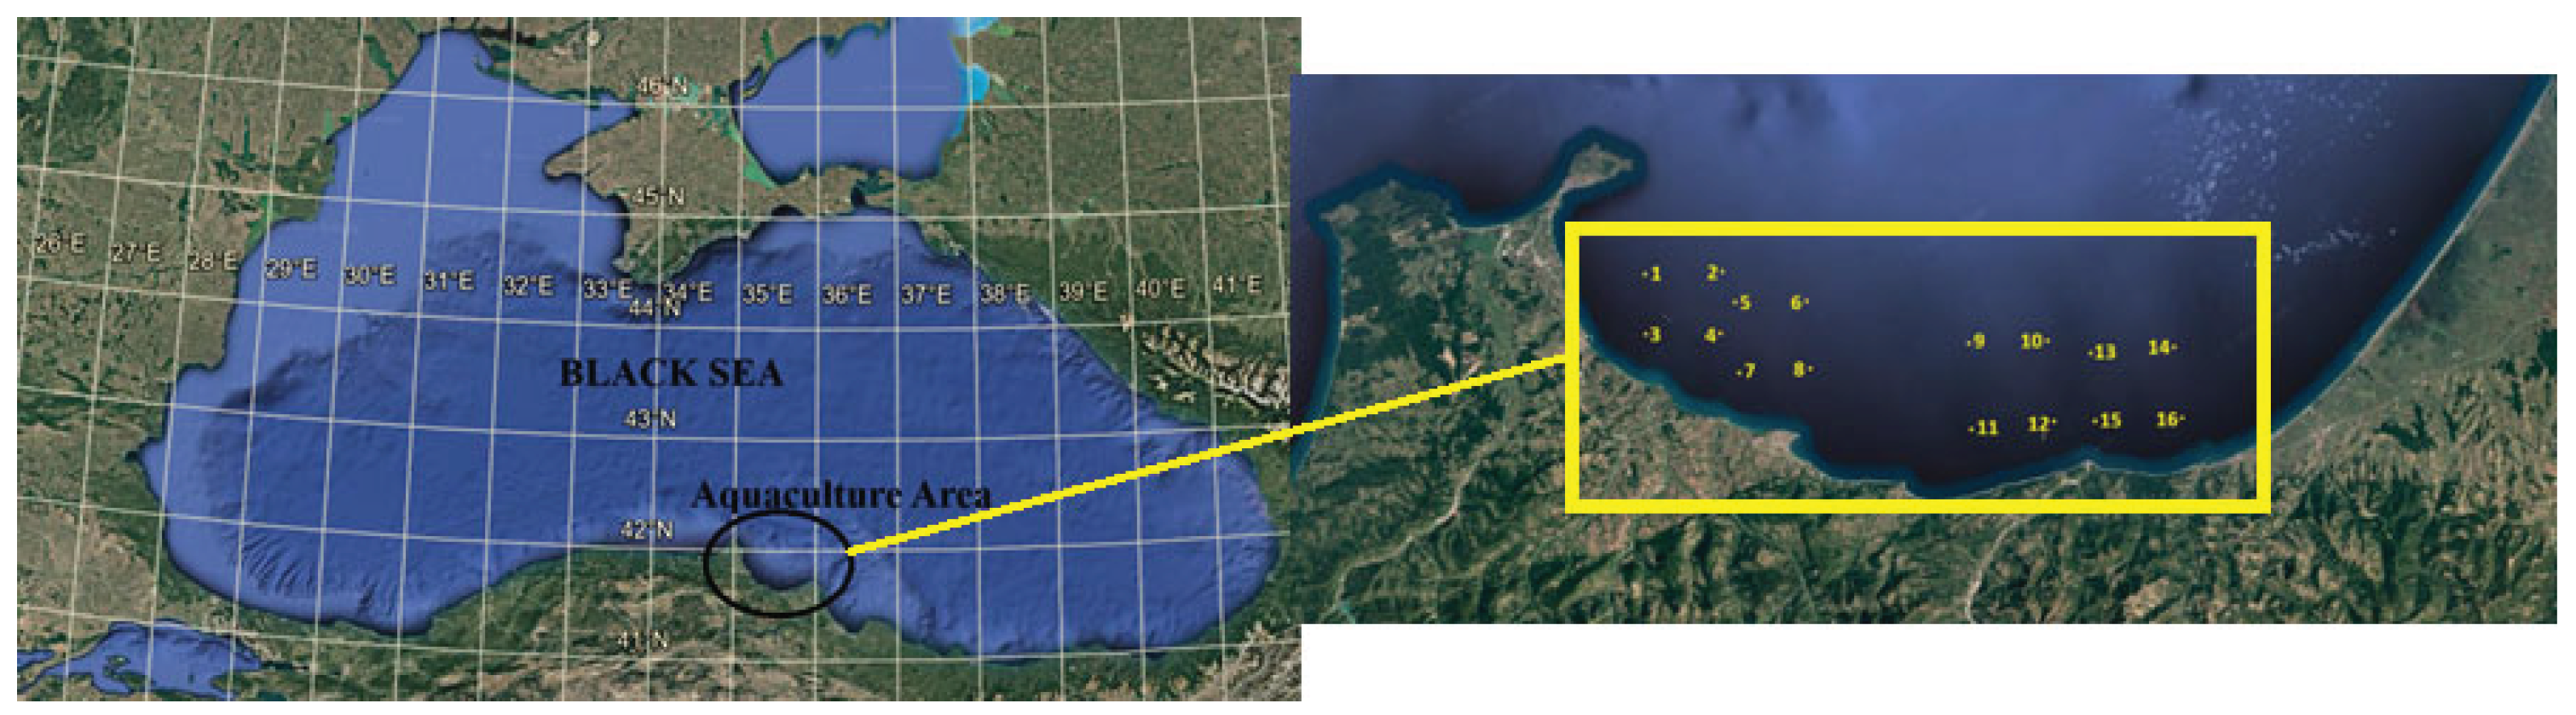
Figure 2.
Cage systems.
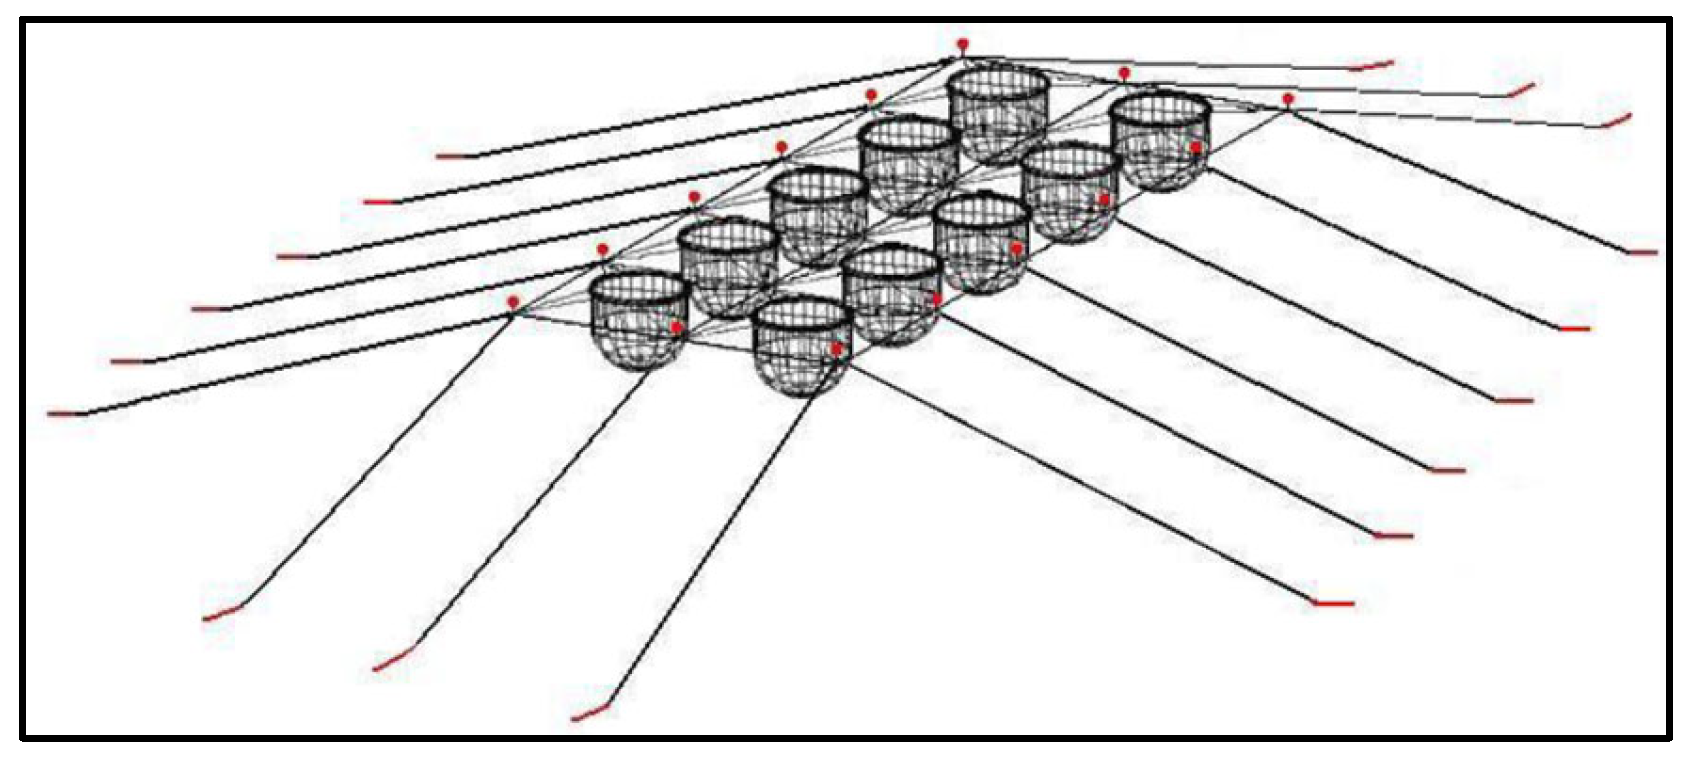
Figure 3.
Sampling Points of the Aquaculture Sites.
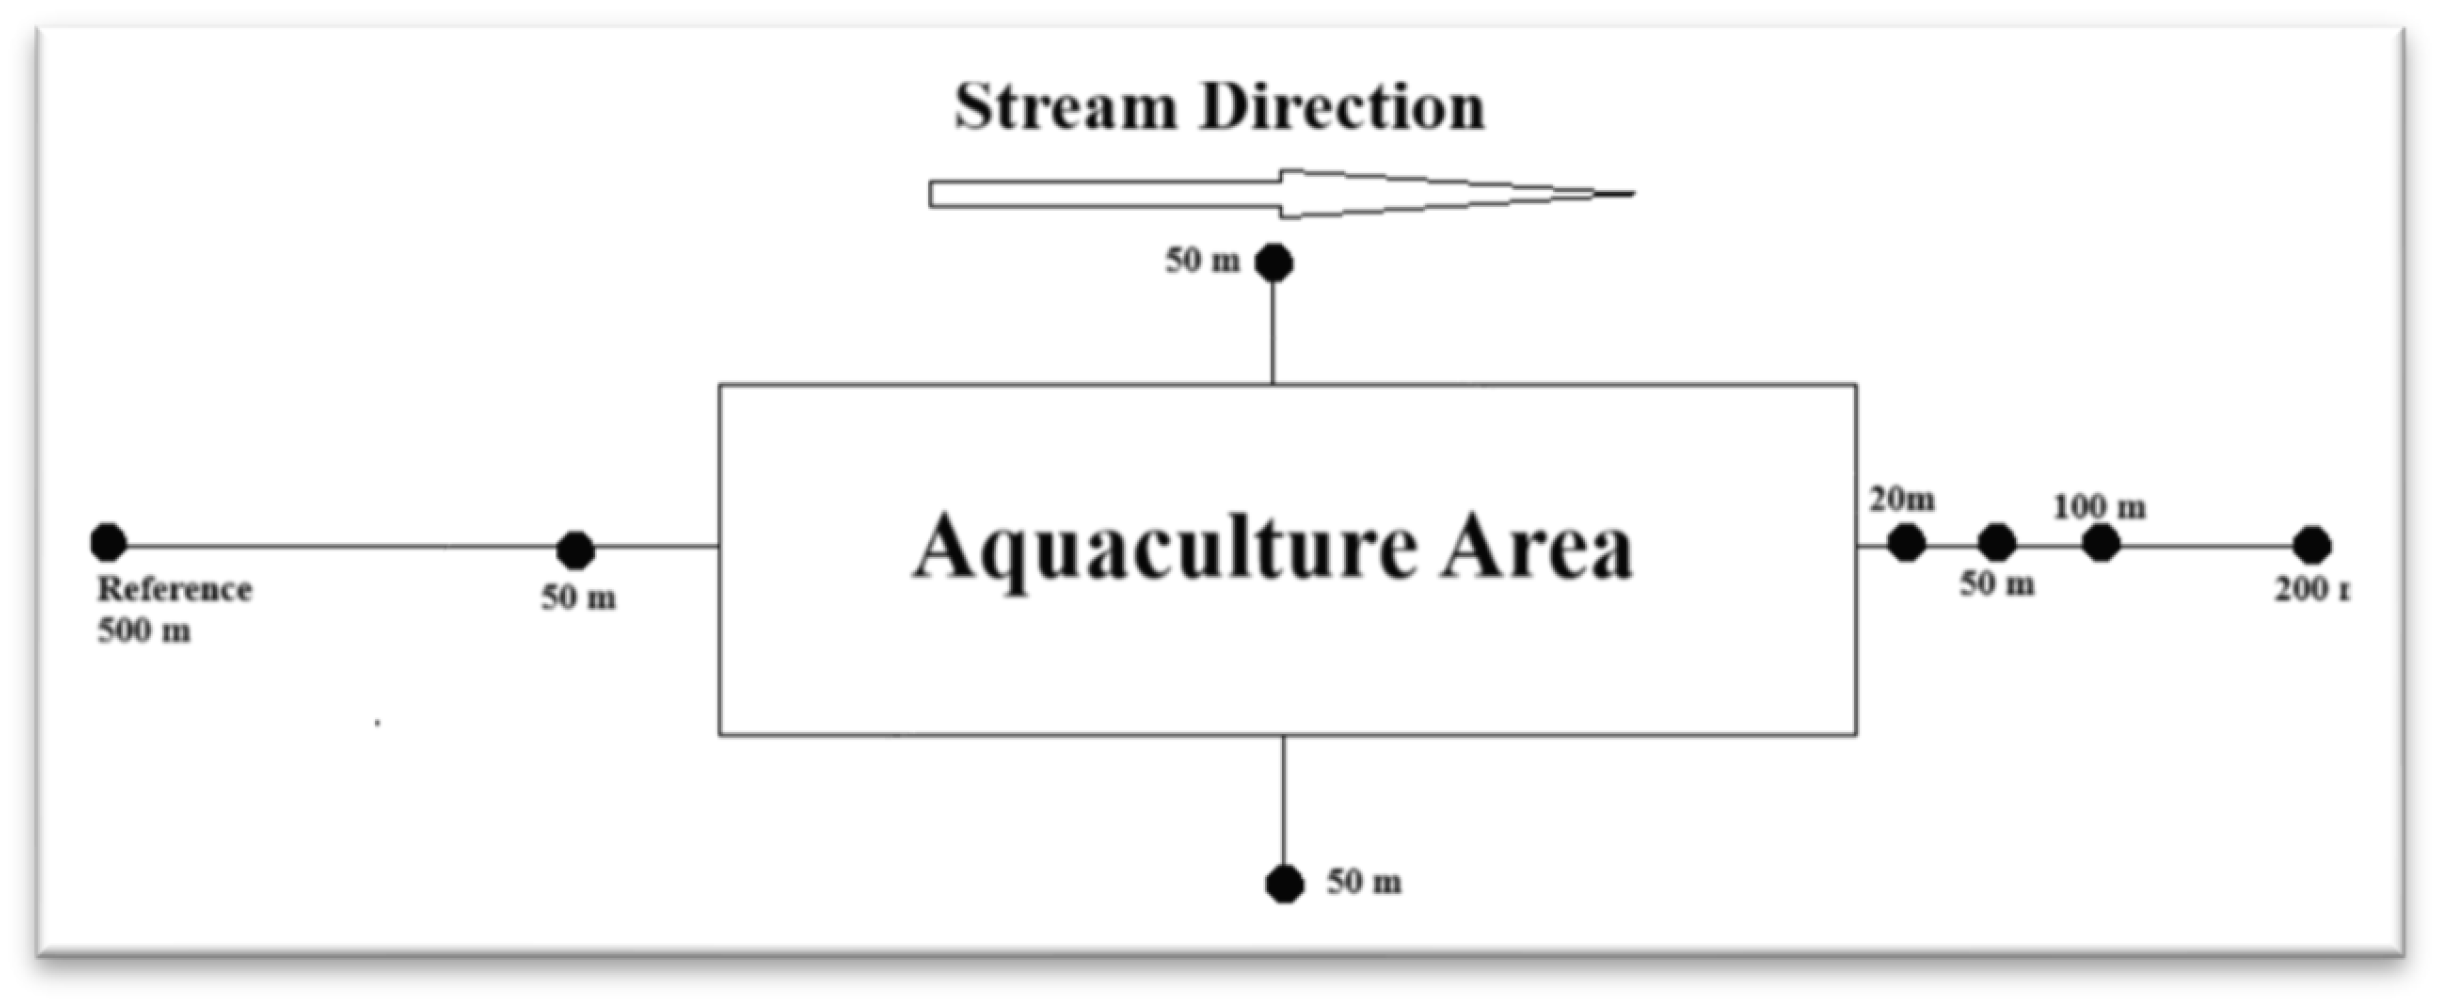
Figure 4.
TRIX, UNTRIX, and TQRTRIX values.
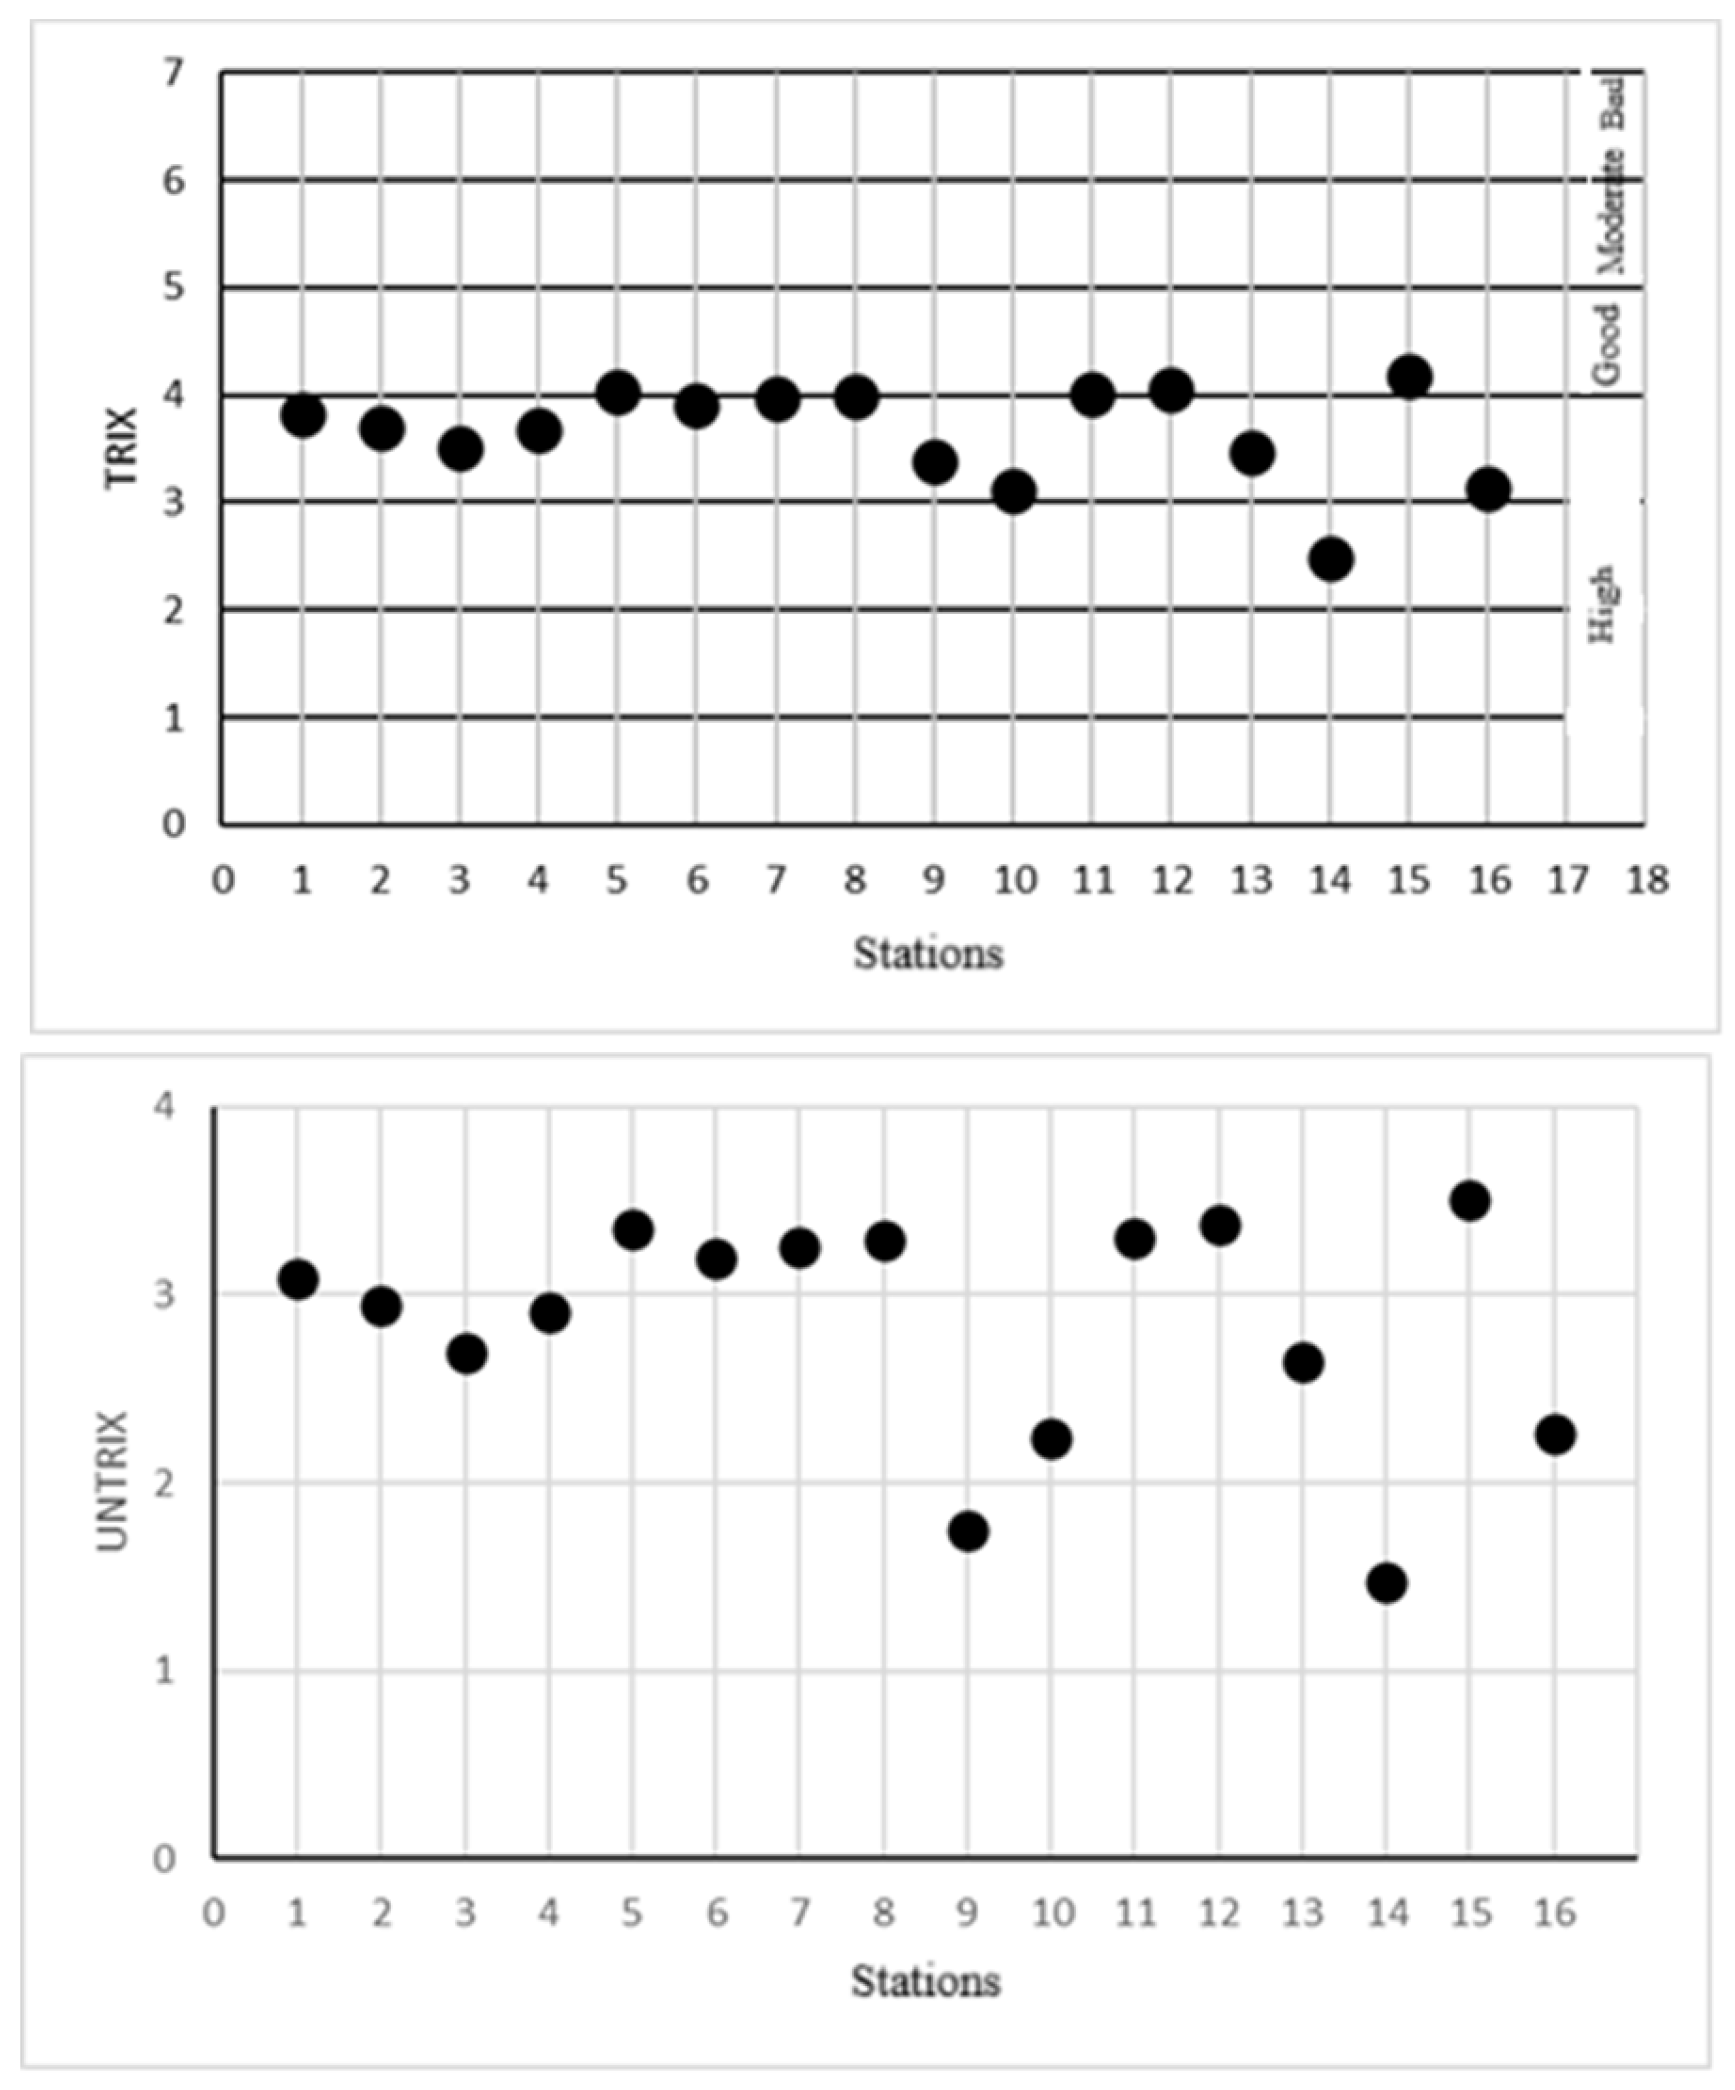
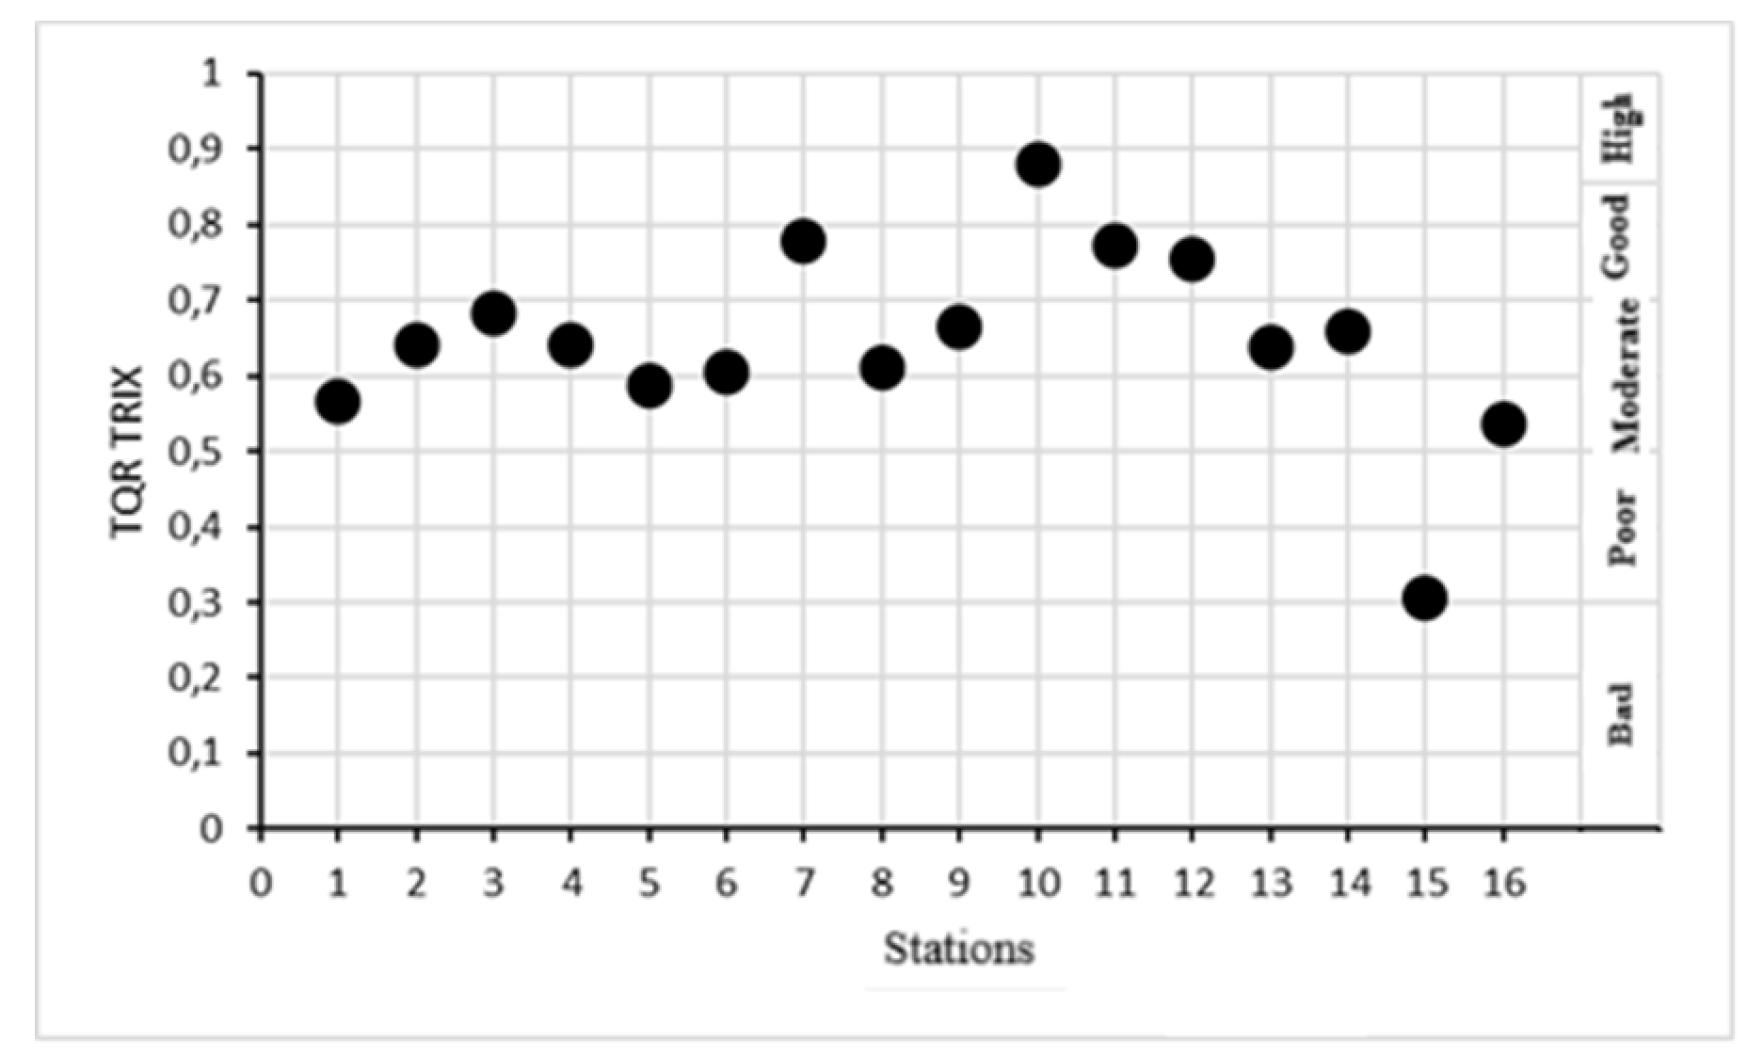

Table 1.
“Eutrophication Risk Scale Table” from the “Environmental Management Regulation for Fish Farms Operating in Marine Areas” [28].
Table 1.
“Eutrophication Risk Scale Table” from the “Environmental Management Regulation for Fish Farms Operating in Marine Areas” [28].
| TRIX Value | Eutrophication Status / Class Definition | Explanation |
|---|---|---|
| < 4* | No Eutrophication Risk / High quality | Aquaculture is permitted |
| 4–5* | Low Eutrophication Risk / Good quality | Aquaculture is allowed for existing facilities, but no new facilities are permitted |
| 5–6* | Eutrophication Risk Present / Moderate quality | No new aquaculture facilities are allowed; restrictions are imposed on existing facilities |
| > 6* | High Eutrophication Risk / Bad quality | Aquaculture is not permitted, and existing facilities must cease operations |
1 For the Black Sea, an additional +1 is applied.
Table 2.
Trophic status of coastal waters based on the TQRTRIX trophic scale.
| TQRTRIX value | Trophic classification |
|---|---|
| 0.00–0.29 | Bad |
| 0.30–0.49 | Poor |
| 0.50–0.69 | Moderate |
| 0.70–0.84 | Good |
| 0.85–1.00 | High |
Table 3.
Coordinates, Depth, Secchi Disk Depth, Chlorophyll-a, Dissolved Oxygen (%), TIN, and TP Values of Sampling Stations.
Table 3.
Coordinates, Depth, Secchi Disk Depth, Chlorophyll-a, Dissolved Oxygen (%), TIN, and TP Values of Sampling Stations.
| Station | Coordinates | Depth (m) | Secchi Disk (m) | Chlorophyll-a | Dissolved Oxygen (%) | TIN | TP |
|---|---|---|---|---|---|---|---|
| 1 | 41°50’48.23-35°13’47.09 | 57.5 | 3 | 0.5< | 98.57±2,16 | 0.081±0.006 | 0.014±0.002 |
| 2 | 41°54’04.63-35°11’23.91 | 53.8 | 3 | 0.1< | 106.82±2,18 | 0.331±0.01 | 0.005±0.001 |
| 3 | 41°54’40.19-35°09’48.45 | 49.6 | 3 | 0.1< | 112.00±2,11 | 0.333±0.02 | 0.005±0.001 |
| 4 | 41°53’56.33-35°10’32.72 | 48.7 | 5.7 | 0.1< | 106.96±2,13 | 0.351±0.02 | 0.005±0.001 |
| 5 | 41°52’15.59-35°12’38.73 | 48.0 | 11 | 0.5< | 99.53±0.03 | 0.096±0.01 | 0.020±0.001 |
| 6 | 41°52’06.89-35°12’49.84 | 47.4 | 11 | 0.5< | 99.40±0.06 | 0.106±0.01 | 0.020±0.001 |
| 7 | 41°43’42.22-35°23’39.96 | 46.4 | 11 | 0.5< | 99.43±0.04 | 0.101±0.02 | 0.019±0.001 |
| 8 | 41°52’04.00-35°12’43.06 | 42.1 | 5.7 | 0.5< | 99.52±0.02 | 0.106±0.01 | 0.020±0.001 |
| 9 | 41°45’38.14 35°21’14.32 | 76.0 | 10.7 | 0.5< | 88.45±3.21 | 0.073±0.005 | 0.012±0.002 |
| 10 | 41°45’28.15-35°23’36.03 | 77.2 | 11 | 0.5< | 88.07±2.91 | 0.087±0.004 | 0.011±0.003 |
| 11 | 41°43’51.23-35°20’22.09 | 58.0 | 11 | 0.5< | 99.17±2.96 | 0.079±0.003 | 0.015±0.002 |
| 12 | 41°43’28.62-35°23’33.40 | 54.0 | 11 | 0.5< | 99.60±2.75 | 0.097±0.004 | 0.022±0.003 |
| 13 | 41°42’54.32-35°27’41.20 | 59.0 | 13 | 0.5< | 97.18±3.77 | 0.158±0.078 | 0.010±0.003 |
| 14 | 41°41’51.20-35°30’15.41 | 54.2 | 14.8 | 0.5< | 116.83±2.98 | 0.398±0.065 | 0.010±0.002 |
| 15 | 41°41’42.30-35°27’33.61 | 57.4 | 12.3 | 0.5< | 99.75±3.45 | 0.113±0.059 | 0.022±0.003 |
| 16 | 41°40’55.72-35°30’04.25 | 57.4 | 14.1 | 0.5< | 102.73±1.06 | 0.404±0.063 | 0.010±0.001 |
Table 4.
Calculated TRIX, UNTRIX, and TQRTRIX Values.
| Station | Coordinates | TRIX | Trophic status | UNTRIX | TQRTRIX | Trophic status |
|---|---|---|---|---|---|---|
| 1 | 41°50’48,23-35°13’47,09 | 3,83±0.06 | High | 3,09±0.08 | 0,57±0.02 | Moderate |
| 2 | 41°54’04,63-35°11’23,91 | 3,71±0.05 | High | 2,95±0.06 | 0,64±0.03 | Moderate |
| 3 | 41°54’40,19-35°09’48,45 | 3,50±0.05 | High | 2,70±0.05 | 0,68±0.01 | Moderate |
| 4 | 41°53’56,33-35°10’32,72 | 3,68±0.04 | High | 2,91±0.05 | 0,64±0.01 | Moderate |
| 5 | 41°52’15,59-35°12’38,73 | 4,04±0.02 | Good | 3,35±0.03 | 0,59±0.05 | Moderate |
| 6 | 41°52’06,89-35°12’49,84 | 3,92±0.01 | High | 3,20±0.02 | 0,60±0.04 | Moderate |
| 7 | 41°43’42,22-35°23’39,96 | 3,97±0.02 | High | 3,26±0.03 | 0,78±0.05 | Good |
| 8 | 41°52’04,00-35°12’43,06 | 4,00±0.02 | Good | 3,29±0.04 | 0,61±0.03 | Moderate |
| 9 | 41°45’38,14 35°21’14,32 | 3,39±0.08 | High | 1,75±0.15 | 0,67±0.04 | Moderate |
| 10 | 41°45’28,15-35°23’36,03 | 3,12±0.11 | High | 2,24±0.11 | 0,88±0.03 | High |
| 11 | 41°43’51,23-35°20’22,09 | 4,01±0.05 | Good | 3,31±0.07 | 0,77±0.01 | Good |
| 12 | 41°43’28,62-35°23’33,40 | 4,06±0.03 | Good | 3,37±0.01 | 0,75±0.01 | Good |
| 13 | 41°42’54,32-35°27’41,20 | 3,46±0.15 | High | 2,65±0.22 | 0,64±0.08 | Moderate |
| 14 | 41°41’51,20-35°30’15,41 | 2,48±0.18 | High | 1,48±0.19 | 0,66±0.04 | Moderate |
| 15 | 41°41’42,30-35°27’33,61 | 4,17±0.04 | Good | 3,51±0.06 | 0,31±0.02 | Poor |
| 16 | 41°40’55,72-35°30’04,25 | 3,13±0.09 | High | 2,26±0.10 | 0,54±0.06 | Moderate |
Table 5.
Values of one-way analysis of aquaculture area.
| Variables | Sampling area | ||
|---|---|---|---|
| d.f. | F | p level | |
| Chl-a | 16 | 5,28 | * |
| DO | 16 | 3,28 | ns |
| DIN | 16 | 3,20 | ns |
| TP | 16 | 4,19 | * |
| Depth | 16 | 8,06 | ** |
| Secchi disk depth | 16 | 6,80 | ** |
| TRIX | 16 | 27,63 | *** |
| UNTRIX | 16 | 1,66 | ns |
| TQRTRIX | 16 | 1,37 | ns |
*p<0.05, **p<0.01, ***p<0.001. ns: not significant.
Disclaimer/Publisher’s Note: The statements, opinions and data contained in all publications are solely those of the individual author(s) and contributor(s) and not of MDPI and/or the editor(s). MDPI and/or the editor(s) disclaim responsibility for any injury to people or property resulting from any ideas, methods, instructions or products referred to in the content. |
© 2025 by the authors. Licensee MDPI, Basel, Switzerland. This article is an open access article distributed under the terms and conditions of the Creative Commons Attribution (CC BY) license (http://creativecommons.org/licenses/by/4.0/).
Copyright: This open access article is published under a Creative Commons CC BY 4.0 license, which permit the free download, distribution, and reuse, provided that the author and preprint are cited in any reuse.


