Submitted:
26 June 2025
Posted:
26 June 2025
You are already at the latest version
Abstract
Hemorrhoidal disease (HD) is one of the most common anorectal conditions seen in general practice, but the true prevalence in the general population is not well understood, partly because many patients do not seek treatments. There are many factors which can favour the onset of haemorrhoidal disease. The most common of these are constipation, pregnancy, dietary factors, overweight, obesity, sedentary lifestyles, exertion and sport, heredity. The HD is classified according to their location and degree of prolapse. There are 3 types of haemorrhoids: internal haemorrhoids, external haemorrhoids and mixed haemorrhoids (internal and external). By analyzing the real-word data (RWD) obtained through this survey, it is possible to notice how patients, pharmacists and physicians have reported a very positive effectiveness profile of Neofitoroid BioOintment associated with a very favorable perception of its efficacy and safety profile. In addition, the data indicate that the ointment is widely used both as a monotherapy and in combination with other treatments, underscoring its versatility and clinical relevance across a range of therapeutic contexts. From this point of view, it was observed that all three populations showed a strong concordance and coherence on all items of the questionnaire. The quali-quantitative analyses revealed higher levels of effectiveness , safety and tolerability. A hypothetical parametric distribution (HPD), was used as control, in order to compare RW results to find the significant differences (p<0.05). These findings underscore the treatment’s effectiveness, safety, tolerability, and positive influence on quality of life for patients with hemorrhoids.
Keywords:
Hemorrhoidal disease
; self-management
; real-word evidence
; RWE
; natural substance-based medical device
; safety
; effectiveness
1. Introduction
Hemorrhoidal disease (HD) is defined as the distal displacement of enlarged, congested anal cushions. Clinical manifestations of HD, which include discomfort, bleeding, anal leakage and symptoms of perianal irritation (i.e. itching and burning), seem to occur after hemorrhoidal nodules have begun their sliding down process [1,2,3]. Studies have indicated a prevalence of hemorrhoidal disease ranging from 4% to 7% among adult patients visiting general practice clinics. In contrast, population-based surveys in the USA [4], Spain [5], and Japan [6] reported prevalences of 4%, 13%, and 17%, respectively. Higher prevalence rates, between 12% and 41% [7,8], are observed in specific groups, such as pregnant or postpartum women. This findings suggest that hemorrhoidal disease may be underdiagnosed and undertreated. The pathogenesis and progression of the disease are undeniably multifactorial, involving mechanical, vascular, and inflammatory factors that influence the presence and severity of clinical manifestations. However, the way these factors are interconnected and the extent of their contribution in each individual patient remains unclear. In a recent international online survey study [4], the prevalence of hemorrhoidal disease in the general population was 11%. Individuals with hemorrhoidal disease were generally middle-aged (average 46 years) and had a family history of this condition. Women were slightly over-represented in the hemorrhoid population compared with men (56 vs 44%), and most women (81%) affected by hemorrhoidal disease had a history of pregnancy (average of 1.9 pregnancies each). The nosographic classification of HD provides two macroscopic divisions: external or internal. External hemorrhoids are distinguished by their external covering with perianal, anal skin and by their location inferior to the dentate line [2,5,6,7,8]. While, the internal hemorroidis are above the dentate line and covered by the columnar and transitional rectal mucosa. Instead, as regards the degree of clinical importance, the HD is in turn distributed on a four-point numerical scale [2]. While no classification of external hemorrhoids is used clinically, internal hemorrhoids are graded according to Goligher’s classification is based on the presence of prolapse outside of the anal canal during defecation, and whether it may be reduced. The following scale recapitulate the features of HD [5,8]:
Grade I—Visible hemorrhoids that do not prolapse.
Grade II—Hemorrhoids that prolapse during the Valsalva maneuver but spontaneously reduce.
Grade III—Hemorrhoids that prolapse during the Valsalva maneuver and need manual reduction.
Grade IV—No-reducible hemorrhoids [9].
In the therapeutic choice of treatment for HD, one should evaluate the degree and severity of the disease, its impact on the quality of life, the degree of pain that the patient feels, the probability that the patient will be responsive to treatment and finally, but no less important, the patient's personal preferences. Treatments can be grouped into 3 categories: conservative, outpatient and surgical. Clinicians should discuss the options thoroughly with the patient, outlining the pros and cons of each. Disease pathogenesis and progression is undoubtedly multifactorial involving mechanical, vascular and inflammatory factors, which influence the presence and intensity of clinical manifestations. However how these factors are connected and the extent of their contribution in every single patient who develops the disease is still unclear [2-6]. Current management of external and grade I and II HD is based on dietary and lifestyle modification combined with medical therapy or on interventional non-surgical procedures [3,4,12]. The topical medications available usually contain either a combination of local anesthetics with anti-inflammatories or muscle relaxants [13], thus addressing a single mechanism of those that underlie signs and symptoms onset.
There are many factors, which can favor the onset of hemorrhoid disease. The most common of these are: constipation, pregnancy, dietary factors, overweight, obesity, sedentary lifestyles, exertion, sport and Inheritance, according to the study of Lohsiriwat, 2012 [8] Vazquez, 2008 [10] and Chan, 2007 [11]. These factors generally act through two types of mechanisms:
- Hemodynamic Theory. Venous blood reflux due to the increase of the intra-abdominal pressure, or to a venous stasis (vascular congestion) due to a prolonged effort to an increase intra-abdominal pressure (in case of ascites, pregnancy or obesity) [12].
- Mechanical theory. Progressive and gradual weakening and degeneration of muscle-fibro elastic tissue surrounding the hemorrhoidal structures which can occur due to aging to an increase of intra-abdominal pressure or a chronic constipation [12].
The most frequent complications that accompany the haemorrhoidal disease are anal fissure and perianal abscess and are among the most common causes of anal pain in patients with hemorrhoids. The pharmacological treatments under clinicians supervision are well assessed. In last timeframe (about five years) three principal compound o big class of molecules where used in HD treatment. This list includes: flavonoids [13,14,15,16,17,18], calcium dobesilate [19], substance plant-derived [20] and essential oils (EOs) [21,22].
Treatment methods for haemorrhoids range from lifestyle changes to radical surgery, depending on the grade and the severity of symptoms. Thus, a first-line conservative treatment of hemorrhoids consists of a high-fiber diet, fiber supplementation, increased water intake, warm water (sitz) baths, and stool softeners [23,24]. The topical medications available typically contain a combination of local anaesthetics with anti-inflammatories or muscle relaxants, targeting a specific mechanism responsible for the onset of signs and symptoms [25].
The NeoFitoroid BioOintment (Aboca S.p.a. – Sansepolcro, Arezzo – Italy) is a substance-based medical device (SBMD) indicated for topical treatment of HD, both grades I and II [26].
It is formulated with plant-based molecular complexes, combining the patented functional complex Helydol® (a freeze-dry extract of Helichrysum lipophilic fraction) with a pool of functional natural molecules [27]. The formulation has the required features thanks to all its components and adheres to the epithelial surface and establishes a physical protective barrier. The adhered formulation exerts a lubricating action in which facilitates the transit of feces and reduces their rubbing on the mucosa with free radicals generated by the mucosal inflammation.
A recent prospective study evaluates the positive effect of a SBMD in reducing the symptoms and signs of HD, making the product a valid non-pharmacological treatment option for therapeutic management of grade I and II HD. The study highlights how the unique combination of natural substances appears to target multiple pathophysiological mechanisms involved in the onset and severity of HD and its clinical manifestations [28]. In this context, to assess the safety and efficacy of the product in a real-world (RW) setting, a survey was conducted using an electronic platform to gather data on the product [27].
This evaluation is required under the new EU Medical Device Regulation (EU) 2017/745, which sets updated criteria for the authorization, classification, and post-market surveillance of medical devices [26]. This large-scale study aimed to assess the perceived efficacy, safety, and usage patterns of the product among patients, physicians, and pharmacists.
2. Materials and Methods
2.1. Product
Neofitoroid BioOinment [27] is a complex herbal system containing Helydol® combined together with a pool of functional molecules, including extract of Ruscus, dry extract of Aloe Vera gel, aqueous solution of Helichrysum, oil of Hypericum, Shea butter, Jojoba oil, essential oils of Melaleuca, Peppermint and Cypress. The product is able to calm irritation, to protect the mucosa and to support its normalization through three mechanisms of action. First, it exhibits a mucoadhesive property, adhering to the mucosa and forming a protective barrier-like film that shields the tissue from contact with irritants. Second, it acts as a lubricant, reducing friction during stool passage and thereby minimizing irritation and perianal congestion. Third, it has antioxidant activity, protecting the mucosa from free radical damage and indirectly contributing to the reduction of inflammation.
The SBMD does not contain corticosteroids or anaesthetics, and its mechanism of action ensures that it does not irritate or dry out the mucosa. Indeed, it is indicated for the treatment of HD (both internal and external) and their symptoms, such as pain, burning and anal and perianal itching. It can be used even in the case of anal fissures. The product can also be used in prevention and in all situations that can cause irritation and/or congestion of the anal and perianal region (constipation, diarrhoea, unhealthy eating or lifestyle) and is also suitable during pregnancy and breastfeeding.
2.2. Study Design
An observational study was conducted to assess the perceived efficacy and safety profiles of Neofitoroid BioOintment, involving three different cohorts: patients, physicians, and pharmacists. All clinical real-world data (RWD) were gathered through a structured GxP web platform [29]. The survey was carried out from April 12, 2021, to November 3, 2024 and it intends to gather information through on-line questionnaires specifically developed for patients, physicians and pharmacists [29]. Patients could access the platform via a website link or a QR code provided on the product packaging. The purchase is verified by entering a batch number and a unique code, both found on the package, before beginning the online questionnaire. Similarly, physicians and pharmacists can access the platform via a dedicated healthcare professionals’ section on the manufacturer’s website, on their own initiative. Additionally, physicians were directly recruited by the manufacturer’s scientific representatives. The clinical data were collected using digital questionnaires developed by clinical experts in collaboration with the Department of Biomedicine, Surgery and Dentistry at the College of Milan. These questionnaires were specifically tailored to the groups of people surveyed and covered various aspects such as efficacy, dose adherence, quality of life, possible side effects and misuse. Patients were asked to share their experiences with the device, while physicians and pharmacists were asked about their patients’ experiences. This approach allowed for the indirect validation of the data reported by patients. To evaluate the accuracy of the current survey, a repeatability study was performed before distributing the questionnaires to participants. This preliminary study also indirectly assessed the potential validity of the questionnaire [29]. Although the repeatability study was conducted for a different product than Neofitoroid BioOintment, the methodology and question structure were identical. Therefore, the repeatability of the results can be considered applicable to the current survey.
Questionnaire’s main scope was focusing on the following items:
- Effectiveness of the device in the treatment of HD (both internal and external) and their symptoms, such as anal and perianal pain, burning and itching.
- Evaluation of satisfaction levels associated with its use.
- Safety and tolerability.
- Quality of Life (QoL).
- Compliance with the dosage suggested by the product.
- Concomitant treatments.
- Conditions for which the product was used/prescribed.
- Improvement and timing of problem resolution.
- Clarity of information.
2.3. Questionnaire Pourposes
The survey was conducted using a questionnaire consisting of a series of questions acted to discover and gather information on the clinical context from the prospective of patients, pharmacist and physicians. The users are invited to report at the end of the questionnaire any adverse event or interaction with the Medical Device to the Medical Vigilance Department through a specific safety mailbox. The main questions of the questionnaire aimed at discovering the real pathological situation of the patients, the use of the product and the clinical improvements obtained are shown in Figure 1.
Due to the non-anonymous nature of the data, information was provided to each participant as of 2018 in accordance with Italian laws and regulations on the protection and management of personal data and the EU General Data Protection Regulation (GDPR). Each participant declared to have read and accepted this information.
2.4. Sample Size and Power Study
The sample size of this Real Word Evidence (RWE) survey is composed by the following cohorts: 1424 patients; 709 pharmacists and 485 physicians. This sample allow a estimation with the following error margins were calculated for the populations included in the RWE: patients 3%, pharmacists 4% and physicians 6%, in a confidence interval of 95% and a estimated response rate to the question of 50%. The calculations were performed using an online tool available at http://www.raosoft.com/samplesize.html. Descriptive analyses were performed for each question, findings presented as both absolute counts and percentages. For questions allowing single or multiple answers, the percentage reflects the share of responders who selected that option, unless specified otherwise.
2.5. Scoring and Answers
To establish how much the patients' conditions had actually improved, it was decided to create a fixed score for the responses provided by the patients and also by the phisicians and phamracists. A 5-point Likert scale was used jugging the following options: Excellent, Good, Fair, Adequate and Poor. The best criterion (excellent) was given the highest score: 5, while the criterion considered worst (poor) was given the lowest value: 1. We assessed the average satisfaction score by analysing the most rapresentative questions related to the clinical aspects of the treatment, across the three cohorts considered. Likert scales were distributed across five scores, depending upon the individual statement, with the extremity points of scale representing the “not important” and the “very important” option. To facilitate comparisons between different statements within the same category, a Global Score (GS) regarding the RWE was calculated, applying the weighted average formula as well in the equation below (Equation 1). For any statement, the score considered the product between each frequency of answers (AF;; inside the relative frequencies of statement) for the it’s specific value of Likert scale (LSV). The GS for each question was obtained by the sum of all five products as reported below (Equation 1). In fact, the GS was obtained for all statements in each cohort (i.e. patients, pharmacists and physicians). To understand whether the collected answers were provided randomly or following a causal distribution, the hypothetical parametric distribution (HPD) was constructed to compare the obtained results of the RWE (Equation 1). In the HPD equation, all the LSV (the same scale used for the RWE) have the same frequency (0.2; Equation 2). Therefore, the result of the Equation 2 is always equal to 3 and represents the comparison term vs RWE. A GS >3 obtained in the RWE indicates results that deviate from randomness indicating a favorable opinion for that certain option, while a GS <3 indicates results that deviate from randomness indicating worse opinions for the RWE results.
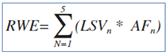
Equation 1: Global Score for Real World Evidence answers; LSV=Likert Scale Value; AF answer frequency; N= Referral value of Likert scale.
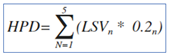
Equation 2: Global Score for Hypotetical parametric distribution (HPD answers; LSV=Likert Scale Value; AF=answer frequency (0.2); N= Referral value of Likert scale. The AF is equal to0.2 because of the LVS are 5 and then the equal distribution is represented by 0.2 of frequency.
2.7. Statistical (Qualitative) Analysis
Descriptive analyses were performed for each question, in wich the results were reported in absolute numbers and percentages. For both single and multiple-response questions, the percentage corresponds to the proportion of responders who chose that response unless otherwise stated.
2.8. Statistical (Quantitative) Analysis
Quantitative analyses were performed in all three different cohorts according their respective answers to the statements regarding the QoL, effectivenes and the safety, comparing RWE vs HPD global scores (GSs).
Both Student’s and ANOVA parametric test were used in order to find statistical significant differences. The results of the comparison mentioned above were judged significant according the p values <0.05. Shaphiro-wilk tests were also performed in order to verify the parametric distribution in the three cohorts mentioned above.
3. Results
3.1. Participant to the Survey
In the period of the survey, in total 1424 patients, 709 pharmacists and 485 physicians, spontaneously participated in the study. Among the patients, 85.46% (N = 1217) were women, and participants ranged in age from 17 to over 65 years old. The largest group of participants was represented by subjects aged between 31 and 50 years (N = 838). No angraphical data were acquired from both the pharmacists and physicians. In the survey, all three participants cohorts answerd to a series of questions, including the following key aspects: condition of use, perceived effectiveness , safety, Tolerability, QoL and concomitant treatments.
3.2. Condition of Use
Concerning the condions of use, the question included eight different variant of conditions and mutliple answers were allowed. Indeed a total of 2622, 2427 and 1798 answers were acquired for patients, pharmacist and physicians, respectively. The frequency of specific condion of use for each subgroup of participating are reported in the Figure 2.
Based on the responses collected from patients, pharmacists and physicians, the most frequently condition across all three cohorts was a combination of internal and external hemorrhoids, particularly among patients (43.26%). External hemorrhoids were also commonly cited, with 39.33% of patients, 53,03% of pharmacists and 62,06% (of physicians reporting this condition. Additionally, the collected data also highlighted a strong propensity toward self-medication within the patients cohort.
3.3. Effectiveness
The effectiveness of the SBMD was evaluated through specific questions addressed to patients, pharmacists and physicians. Patients were asked to express their level of satisfaction with the effectiveness of the product (Q1) and to report the extent to which their most common symptoms had improved following its use (Q2). Pharmacists and physicians were both asked to evaluate the degree of symptoms improvement observed in patients using the product. Regarding the question on effectiveness common to all three cohorts, nearly 90% of patients (N=1263) reported being highly satisfied with the product’s efficacy. Similarly, almost all physicians and pharmacists expressed satisfaction. Notably, among pharmacists and physicians, over 97% (N=690 and N= 474, respectively) rated the efficacy as 'good' or 'excellent'. The qualitative data of responders were reported in the Figure 3.
3.4. Safety and Tolerability
Safety and tolerability were evaluated through a specific item included in the questionnaire and addressed to patients, pharmacists, and physicians. These data indicate unequivocally that a plenary safety and tolerability level has been recognized. In particular, over 96% of patients (N = 1369) rated the product as ‘good’ or ‘excellent’. This favorable safety profile was further supported by the assessments provided by both pharmacists and physicians, who also reported very high levels of satisfaction, whit 98.59% (N = 699) and 98.76% (N = 699) of responders respectively, rating the product positively (Figure 4). Only one patient reported a non-serious adverse effect (application site pain), has been reported by a patient, in associated with device ineffectiveness. Potential systematic misuses of the product and off-label use were not reported as well.
3.5. Quality of Life
The questionnaire also evaluated the improvement of the quality of life (QoL), considering aspects such as mood, social life, work, dietary freedom and physical activity. This evaluation was conducted across all the three cohorts examined, as presented in Figure 5. Also, in this statement of questionnaire, all groups focused their preferences into the higher level of Likert scale, specifically in the ‘Extremely’ and ‘Greater’ scores. The sum of percentages including these levels in patients, pharmacists and physicians were equal to 69.11% (N = 978), 68.83% (N = 488) and 87.42% (N = 424), respectively as shown in Figure 5.
Within the patient cohort, the questionnaire also explored perceived improvements in specific aspects of daily life following the use of the product. The majority of responders (69.28%, N = 918) reported experiencing greater comfort while sitting. Additionally, 47.3% (N = 627) of patients indicated an improvement in mood. The other possible choices, including social life, sporting activity, dietary freedom, and work performance, were indicated in similar percentages (from 11.17% to 22.26%), as reported in Figure 6.
3.6. Concomitant Treatments
As part of the survey, patients, pharmacists and physicians were asked whether the product was used alone or in combination with other treatments. Among patients, 43.82% reported using only the product and the 34.63% in combination with dietary and behavioural advice. A smaller proportion (7,07%) reported combining it with other topical treatments, such as creams or ointments containing anesthetics and/or anti-inflammatory agents. Pharmacists and physicians also confirmed that the product was frequently used as a monotherapy, particularly in patients who had previously experienced unsatisfactory outcomes with other treatments. Specifically, 51.62% of pharmacists and 43.30% of physicians reported recommending or prescribing the product as a stand-alone option. Results are shown in Figure 7 below.
3.7. Quantitative Analyses
The quantitative analyses were performed looking for the statistically significant differences in three major important traits of questionnaire: the effectiveness, the safety/tolerability and the QoL. All three groups of analysis showed significant statistical differences comparing RWE vs HPD data distributions. Notably, in all three categories analyzed, responders selected more the higher levels of the Likert scale (Level 5: Extremely and Level 4: Greatly).
Patients: Patient responses were for one question regarding QoL, two questions regarding effectiveness (Q1 and Q2) and one regarding safety and tolerability. Patients reported the following GS, respectively: 3.970, 4.290, 4.040 and 4.560. The GS obtained for all four responses were all well above 3 with a mean difference of 1.215. These statistical differences, compared with HPD, were revealed to be significant, through the ANOVA test (P=0.0028, Figure 8A).
Pharmacists: The Pharmacist responses, instead, concerned only one question on QoL, efficacy and safety/tolerability. Pharmacists reported the following GS, respectively: 3.712, 4.460 and 4.380. The GS obtained for all three responses were well above 3, with a mean difference of 1.184. These statistical differences, compared to HPD, proved significant through the ANOVA test (P=0.0378, Figure 8B).
Physicians: The clinicians' responses (as well as those of the pharmacists) concerned a question on QoL, efficacy and safety/tolerability. The clinicians reported the following GS, respectively: 4.037, 4.290 and 4.620. The GS obtained for all three responses were well above 3, with a mean difference of 1.316. These statistical differences, compared to HPD, were found to be significant through the ANOVA test (P=0.0161, Figure 8C).
All questions: These data indicate unequivocally that all three groups perceived the QoL as highly satisfactory, with consistently elevated scores across patients, pharmacists, and physicians, highlighting a shared positive evaluation of QoL (Figure 8). Similarly, safety and tolerability were evaluated using the same Likert scale, and results showed consistently high levels across all three groups. In fact, the mean of all questions for each group was well above three with at least one point more on average, compared to the HPD distribution. The overall results of the three groups, with means and standard deviations are reported in the following table (Table 1).
The combined frequency of the top two positive responses ('Extremely' and 'Greatly') indicated that the majority of participants perceived the product as both safe and well-tolerated. All three groups of analyses mentioned above, revealed significant statistical differences, comparing RWE and HPD data (Figure 8D).
4. Discussion
Hemorrhoidal disease (HD) is often a underestimated pathology [31], partially due to its classification into four degree of severity [3,32] and sometime because patients may find it difficult to discuss their symptoms whit a physician [33]. Concerning the high grade of HD, the clinical treatment by surgery or other ablative approach are recommended [34], however, looking at the low grade of HD (I and II) different pharmacological approach are allowed [5].
Indeed, the most important therapeutic attempts are represented by utilization of, calcium dobesilate [19] and natural compounds [20]. Nevertheless, the self-management of HD, directly by patient, is an occurring situation validate by the SICCR [3]. Indeed, the self management of medical conditions can be a valuable approach for patient care. However, it is often challenging to accurately assess key data related to effectiveness, safety, tolerability and overall benefit for the patients [35,36,37]. Indeed, RWE surveys represent a valuable and dynamic framework for gathering data from real life that can help monitor and better understand patient behaviors, treatment patterns, and clinical outcomes in everyday settings, offering complementary insights that are often not captured in traditional clinical trials [30,38]. This study presents the findings of a large-scale survey involving a total of 2,618 participants from three distinct groups: patients, pharmacists, and physicians. The primary objective of this study was to collect RWD on the perceived efficacy, safety, tolerability, and usage patterns of Neofitoroid BioOintment in the treatment of internal and external hemorrhoids. The survey has also the aim to assess the satisfaction level associated with its use and related QoL after treatment, compliance with the suggested dosage, identifying any off-label uses and side effects. For this purpose, data were collected through a newly validated, GDPR-compliant digital platform designed to support post-marketing surveillance and benefit–risk assessment [29]. The platform ensures full compliance with EU Regulation 2017/745 [26]. The on-line questionnaire was specifically developed and implemented for digital access, addressed both healthcare professionals (HCPs, both pharmacists and medical doctors) and patients. The data collected confirm that the RWE studies are effective in capturing valuable insights, consistent with results reported in other studies [36,37].
The questionnaire was almost the same used for other different Aboca products and for all items, tailored for the current product so for the product description, and target symptoms [29,30]. The repeatability/validity of the questionnaires was assessed before the implementation of the survey. Given that the structure remained unchanged, it is reasonable to infer that the previously established repeatability can also be extended to the current version. Furthermore, a key strength of this survey lies in the simultaneous involvement of three interconnected population groups -patients, pharmacists, and physicians all of whom are actively involved in either using or recommending the product. These aspects seem to be enforce the meaning of results obtain through this RWE, because of the “end user” and the target data of questionnaire , is solely, the patient [36]. Starting from this point of view, it was observed that all three populations showed strong concordance and coherence on all items of the questionnaire. As a matter of fact, also a strong consistency on general satisfaction for the product effectiveness was observed, which was reported in the range of “excellent/good” across patients, pharmacists, and physicians (Figure 3). In fact, most patients noted great/extreme improvements in HD symptoms (78.69%), ultimately leading to an improvement in QoL. Remarkably, these positive perceptions were coherent between the two groups of HCPs involved.
Similarly, the level of consistency across the three cohorts was evaluated with regard to the safety and tolerability of the SBMD. In all groups, the product was reported to be very safe and well tolerated, with over 90% of responders expressing positive evaluations (Figure 4). Indeed, except for one case of application site pain associated with device ineffectiveness, no potentially related adverse effects or interactions with other concomitant treatments were reported, providing further evidence that there are no safety issues.
In general, the questionnaire answers indicated a correct use and dosage of the product to protect the anorectal mucosa. Indeed, patients used the product to treat hemorrhoids, both internal and external, and anal fissures or as prevention, in presence of the expected symptoms, such as anal and perianal pain or discomfort.
Furthermore, the complete agreement was found analyzing the results of QoL. The consistent concentration of responses in the highest categories of the Likert scale (‘Extremely’ and ‘Greatly’) across all three cohorts indicates that the product is perceived as effective in improving key aspects of daily living, including mood, social interactions, work performance, dietary freedom, and physical activity. This alignment between patient-reported outcomes and professional assessments reinforces the clinical relevance of the treatment’s benefits in real-world setting.
An earlier prospective interventional study by Podda et al. [28] already evaluated the efficacy and tolerability of Neofitoroid BioOinment in 45 patients with grade I or II HD. After 10 days of treatment, a significant reduction in discomfort was observed, with the mean VAS score decreasing from 47.4 to 15.4 (p < 0.001). Similar improvements were reported for pain, itching, and burning, with statistically significant reductions as early as day 3. Objective signs such as bleeding and anal leakage also decreased significantly (p < 0.001 and p < 0.05, respectively). Notably, 60% of patients with prolapse at baseline no longer showed signs of prolapse after treatment.
In addition, data from the section on concomitant treatments indicates that the product is frequently used both as a stand-alone therapy and as part of broader treatment strategies. These findings highlight the real-world variability in therapeutic approaches and underscore the product’s flexibility in clinical practice. The integration of the ointment into multimodal regimens—often alongside dietary and behavioral advice or other topical and systemic treatments—reflects its perceived value across different patient profiles and clinical scenarios.
In all three participant cohorts, the minimum of satisfaction level (89% in the patients cohort) was associated with a greater perceived positive impact of treatment, while pharmacists and physicians, evaluated the improvement as higher than 95% (Figure 3).
In recent years, there has been increasing interest in the use of natural compounds for the treatment of hemorrhoidal disease. This shift is driven by the need for safer, well-tolerated alternatives to conventional pharmacological or surgical interventions. Indeed, clinical evidence supports the efficacy of plant-based flavonoid in significantly reducing key symptoms of HD [3,39,40].
The design and data collection methods present some limitations. Participation was partially self-selected and potentially biased, as completing the digital survey required both internet access and basic digital literacy. Furthermore, the assessment of patients’ quality of life was based on a limited set of indicators — specifically, perceived improvements in social life, physical activity, dietary freedom, and work performance. These simplified measures were preferred over standard quality of life questionnaires to minimize the risk of low response rates due to survey length. As the data were collected through real-world surveys, they should be interpreted as reflecting the subjective experiences of users — both patients and healthcare professionals.
In addition, the statistical methods used in order to analyze the data, revealed a quantitative output of them, through the PHD concept. In fact, the utilization of Likert scale and the PHD calculation (see materials and methods), open the possibility of data quantification of survey related to RWD, by specific test revealing also the level significance by generating a p value. Looking for these types of results of responders, their answers highlighted the “a causal distribution”, instead of “a casual distribution" of data.
Overall, the product appears to meet the essential criteria of an effective HD treatment: a high safety profile that allows use without specialist supervision, compatibility with other therapies, and efficacy in treating both internal and external hemorrhoids. The RWD collected provide valuable insights into the treatment’s clinical benefit and safety in the general population, supporting a robust benefit–risk assessment.
5. Conclusions
The survey involved a sample of 1,424 patients, 709 pharmacists, and 485 physicians. Based on this sample size, the estimated margins of error were 3% for patients, 4% for pharmacists, and 6% for physicians, assuming a 95% confidence interval for each group. Nonetheless, also the analyses based on the use of three mathematical tools: the Likert scale, the HPD (stochastic variables) and the ANOVA tests have highlighted the statistical significance distribution of the RWE, with regard to efficacy, safety, tolerability and QoL in a quantitative way. Patients and HCPs reported notable improvements in symptoms and QoL, along with high levels of safety and tolerability. These findings support the self use of the product, as a valid treatment option for of HD.
Author Contributions
Conceptualization, E.G.; formal analysis, P.M. and M.R.; data curation, P.M. and M.R.; writing—original draft preparation, P.M. M.R. and E.G.; writing—review and editing, R.C., E.G., R.L.S., E.G. and A.C.; supervision, E.G.; project administration, R.C. and A.C. All authors have read and agreed to the published version of the manuscript.
Funding
This research was funded by Aboca S.p.A., the manufacturer of the medical device.
Institutional Review Board Statement
In accordance with the relevant regulations, ethical approval was not sought since the data were retrieved from voluntary online surveys. Nevertheless, ethical considerations were made in alignment with the principles for research on human subjects, as outlined in the Declaration of Helsinki.
Informed Consent Statement
Informed consent was obtained from all subjects involved in the study.
Data Availability Statement
The raw data supporting the conclusions of this article will be made available by the authors on request.
Conflicts of Interest
R.C., E.G., A.C. E.G. and R.L.S. are employees of the research promoter and worked on this project as part of their employment. The remaining authors declare that the research was conducted in the absence of any commercial or financial relationships that could be construed as potential conflicts of interest.
References
- Abramowitz, L.; Benabderrahmane, M.; Pospait, D.; Philip, J.; Laouénan, C. The Prevalence of Proctological Symptoms amongst Patients Who See General Practitioners in France. Eur. J. Gen. Pract. 2014, 20, 301–306. [Google Scholar] [CrossRef] [PubMed]
- Cengiz, T.B.; Gorgun, E. Hemorrhoids: A Range of Treatments. Cleve. Clin. J. Med. 2019, 86, 612–620. [Google Scholar] [CrossRef]
- Gallo, G.; Martellucci, J.; Sturiale, A.; Clerico, G.; Milito, G.; Marino, F.; Cocorullo, G.; Giordano, P.; Mistrangelo, M.; Trompetto, M. Consensus Statement of the Italian Society of Colorectal Surgery (SICCR): Management and Treatment of Hemorrhoidal Disease. Tech. Coloproctology 2020, 24, 145–164. [Google Scholar] [CrossRef]
- Sheikh, P.; Régnier, C.; Goron, F.; Salmat, G. The Prevalence, Characteristics and Treatment of Hemorrhoidal Disease: Results of an International Web-Based Survey. J. Comp. Eff. Res. 2020, 9, 1219–1232. [Google Scholar] [CrossRef]
- Acheson, A.G.; Scholefield, J.H. Management of Haemorrhoids. BMJ 2008, 336, 380–383. [Google Scholar] [CrossRef] [PubMed]
- Foxx-Orenstein, A.E.; Umar, S.B.; Crowell, M.D. Common Anorectal Disorders. Gastroenterol. Hepatol. 2014, 10, 294–301. [Google Scholar]
- Grossi C. M. Medicina e Salute. Vol. 5: Apparato Digerente; Ermes, 1993; ISBN 88-7051-132-4.
- Lohsiriwat, V. Hemorrhoids: From Basic Pathophysiology to Clinical Management. World J. Gastroenterol. 2012, 18, 2009. [Google Scholar] [CrossRef]
- Banov, L.; Knoepp, L.F.; Erdman, L.H.; Alia, R.T. Management of Hemorrhoidal Disease. J. S. C. Med. Assoc. 1975 1985, 81, 398–401. [Google Scholar]
- Vazquez, J.C. Constipation, Haemorrhoids, and Heartburn in Pregnancy. BMJ Clin. Evid. 2010, 2010, 1411. [Google Scholar]
- Chan, A.O.O.; Lam, K.F.; Hui, W.M.; Leung, G.; Wong, N.Y.H.; Lam, S.K.; Wong, B.C.Y. Influence of Positive Family History on Clinical Characteristics of Functional Constipation. Clin. Gastroenterol. Hepatol. 2007, 5, 197–200. [Google Scholar] [CrossRef]
- Schubert, M.C.; Sridhar, S.; Schade, R.R.; Wexner, S.D. What Every Gastroenterologist Needs to Know about Common Anorectal Disorders. World J. Gastroenterol. 2009, 15, 3201–3209. [Google Scholar] [CrossRef] [PubMed]
- Caetano, A.C.; Cunha, C.; Arroja, B.; Costa, D.; Rolanda, C. Role of a Micronized Purified Flavonoid Fraction as an Adjuvant Treatment to Rubber Band Ligation for the Treatment of Patients With Hemorrhoidal Disease: A Longitudinal Cohort Study. Ann. Coloproctology 2019, 35, 306–312. [Google Scholar] [CrossRef] [PubMed]
- Chiaretti, M.; Fegatelli, D.A.; Pappalardo, G.; Venti, M.D.S.; Chiaretti, A.I. Comparison of Centella with Flavonoids for Treatment of Symptoms in Hemorrhoidal Disease and After Surgical Intervention: A Randomized Clinical Trial. Sci. Rep. 2020, 10, 8009. [Google Scholar] [CrossRef]
- Godeberge, P.; Sheikh, P.; Lohsiriwat, V.; Jalife, A.; Shelygin, Y. Micronized Purified Flavonoid Fraction in the Treatment of Hemorrhoidal Disease. J. Comp. Eff. Res. 2021, 10, 801–813. [Google Scholar] [CrossRef]
- Gravina, A.G.; Pellegrino, R.; Facchiano, A.; Palladino, G.; Loguercio, C.; Federico, A. Evaluation of the Efficacy and Safety of a Compound of Micronized Flavonoids in Combination With Vitamin C and Extracts of Centella Asiatica, Vaccinium Myrtillus, and Vitis Vinifera for the Reduction of Hemorrhoidal Symptoms in Patients With Grade II and III Hemorrhoidal Disease: A Retrospective Real-Life Study. Front. Pharmacol. 2021, 12, 773320. [Google Scholar] [CrossRef]
- Razdar, S.; Panahi, Y.; Mohammadi, R.; Khedmat, L.; Khedmat, H. Evaluation of the Efficacy and Safety of an Innovative Flavonoid Lotion in Patients with Haemorrhoid: A Randomised Clinical Trial. BMJ Open Gastroenterol. 2023, 10, e001158. [Google Scholar] [CrossRef]
- Sheikh, P.; Lohsiriwat, V.; Shelygin, Y. Micronized Purified Flavonoid Fraction in Hemorrhoid Disease: A Systematic Review and Meta-Analysis. Adv. Ther. 2020, 37, 2792–2812. [Google Scholar] [CrossRef]
- Changazi, S.H.; Bhatti, S.; Choudary, A.; Rajput, M.N.A.; Iqbal, Z.; Ahmed, Q.A. Calcium Dobesilate Versus Flavonoids for the Treatment of Early Hemorrhoidal Disease: A Randomized Controlled Trial. Cureus 2020. [Google Scholar] [CrossRef]
- Mustafa, S.; Akbar, M.; Khan, M.A.; Sunita, K.; Parveen, S.; Pawar, J.S.; Massey, S.; Agarwal, N.R.; Husain, S.A. Plant Metabolite Diosmin as the Therapeutic Agent in Human Diseases. Curr. Res. Pharmacol. Drug Discov. 2022, 3, 100122. [Google Scholar] [CrossRef]
- Kunc, N.; Frlan, A.; Baričevič, D.; Kočevar Glavač, N.; Kokalj Ladan, M. Essential Oil and Hydrosol Composition of Immortelle (Helichrysumitalicum). Plants 2022, 11, 2573. [Google Scholar] [CrossRef]
- Zheljazkov, V.D.; Semerdjieva, I.; Yankova-Tsvetkova, E.; Astatkie, T.; Stanev, S.; Dincheva, I.; Kačániová, M. Chemical Profile and Antimicrobial Activity of the Essential Oils of Helichrysum Arenarium (L.) Moench. and Helichrysum Italicum (Roth.) G. Don. Plants 2022, 11, 951. [Google Scholar] [CrossRef] [PubMed]
- Jacobs, D. Hemorrhoids. N. Engl. J. Med. 2014, 371, 944–951. [Google Scholar] [CrossRef] [PubMed]
- ANNE, L.A.L.M. , MD; JACQUELINE HALLADAY, MD, MPH; and TIMOTHY S. SADIQ, M. Hemorrhoids. Am Fam Physician 2011, 84, 204–210. [Google Scholar]
- Mott, T.; Latimer, K.; Edwards, C. Hemorrhoids: Diagnosis and Treatment Options. Am. Fam. Physician 2018, 97, 172–179. [Google Scholar]
- Https://Eur-Lex.Europa.Eu/ Legal-Content/EN/TXT/?uri=CELEX:02017R0745-20230320.
- Https://Www.Aboca.Com/Product/Neofitoroid-Bioointment/.
- Podda Mariangela, Laureti Silvio, Gentilini Lorenzo, Vittori Laura and Poggioli Gilberto Prospective Interventional Study to Evaluate the Effect of a Medical Device Made of Substances in Reducing Signs and Symptoms in Patients with Hemorrhoidal Disease. Annals of Clinical and Laboratory Research 2021, 4, 1–8. [CrossRef]
- Cioeta, R.; Cossu, A.; Giovagnoni, E.; Rigoni, M.; Muti, P. A New Platform for Post-Marketing Surveillance and Real-World Evidence Data Collection for Substance-Based Medical Devices. Front. Drug Saf. Regul. 2022, 2, 992359. [Google Scholar] [CrossRef]
- Cioeta, R.; Muti, P.; Rigoni, M.; Morlando, L.; Siragusa, F.; Cossu, A.; Giovagnoni, E. Effectiveness and Tolerability of Poliprotect, a Natural Mucosal Protective Agent for Gastroesophageal Reflux Disease and Dyspepsia: Surveys from Patients, Physicians, and Pharmacists. Front. Drug Saf. Regul. 2022, 2, 969831. [Google Scholar] [CrossRef]
- Johanson, J.F.; Sonnenberg, A. The Prevalence of Hemorrhoids and Chronic Constipation. Gastroenterology 1990, 98, 380–386. [Google Scholar] [CrossRef]
- Picciariello, A.; Rinaldi, M.; Grossi, U.; Verre, L.; De Fazio, M.; Dezi, A.; Tomasicchio, G.; Altomare, D.F.; Gallo, G. Management and Treatment of External Hemorrhoidal Thrombosis. Front. Surg. 2022, 9, 898850. [Google Scholar] [CrossRef]
- Van Tol, R.R.; Kleijnen, J.; Watson, A.J.M.; Jongen, J.; Altomare, D.F.; Qvist, N.; Higuero, T.; Muris, J.W.M.; Breukink, S.O. European Society of ColoProctology: Guideline for Haemorrhoidal Disease. Colorectal Dis. 2020, 22, 650–662. [Google Scholar] [CrossRef]
- Lohsiriwat, V.; Sheikh, P.; Bandolon, R.; Ren, D.-L.; Roslani, A.C.; Schaible, K.; Freitag, A.; Martin, M.; Yaltirik, P.; Godeberge, P. Recurrence Rates and Pharmacological Treatment for Hemorrhoidal Disease: A Systematic Review. Adv. Ther. 2023, 40, 117–132. [Google Scholar] [CrossRef]
- Jaksa, A.; Arena, P.J.; Hanisch, M.; Marsico, M. Use of Real-World Evidence in Health Technology Reassessments Across Six Health Technology Assessment Agencies. Value Health 2025, S1098301525000907. [Google Scholar] [CrossRef]
- Hankosky, E.R.; Desai, K.; Chinthammit, C.; Grabner, M.; Stockbower, G.; He, X.; Mojdami, D.; Wenziger, C.; Gibble, T.H. Real-World Use and Effectiveness of Tirzepatide Among People Without Evidence of Type 2 Diabetes in the United States. Diabetes Metab. 2025, 101636. [Google Scholar] [CrossRef] [PubMed]
- Hou, M.; Tang, S.; Zhang, F.; Fu, S.; Ding, H.; Cha, Y.; Ma, X.; Shi, Y.; Cai, Y. Chemical Exposure in Females of Childbearing Age Associated with Sex Hormones: Evidence from an Untargeted Exposomic Approach. Environ. Int. 2025, 197, 109362. [Google Scholar] [CrossRef] [PubMed]
- Cioeta, R.; Cossu, A.; Giovagnoni, E.; Rigoni, M.; Muti, P. A New Platform for Post-Marketing Surveillance and Real-World Evidence Data Collection for Substance-Based Medical Devices. Front. Drug Saf. Regul. 2022, 2, 992359. [Google Scholar] [CrossRef]
- Al-Kubati, W. Chronic Khat Chewing Induced High-Grade Hemorrhoidal Disease and Post-Operative Bleeding in Yemen. Ther. Clin. Risk Manag. 2025, Volume 21, 489–499. [Google Scholar] [CrossRef]
- Kusumo, M.H.B.; Prayitno, A.S.; Laqif, A. Synergistic Therapeutic Approach for Hemorrhoids: Integrating Mesenchymal Stem Cells with Diosmin-Hesperidin to Target Tissue Edema and Inflammation. Arch. Med. Sci. 2024. [Google Scholar] [CrossRef]
Figure 1.
The real-world data platform technology is implemented following a basic web architecture model. In this setup, a server—comprising web services and the business logic (i.e., the application layer)—communicates with the client by delivering HTML pages. Each page on the client side contains distinct components called widgets, which are interactive elements of the graphical user interface. These widgets can exchange data with the server by sending AJAX requests to the web.
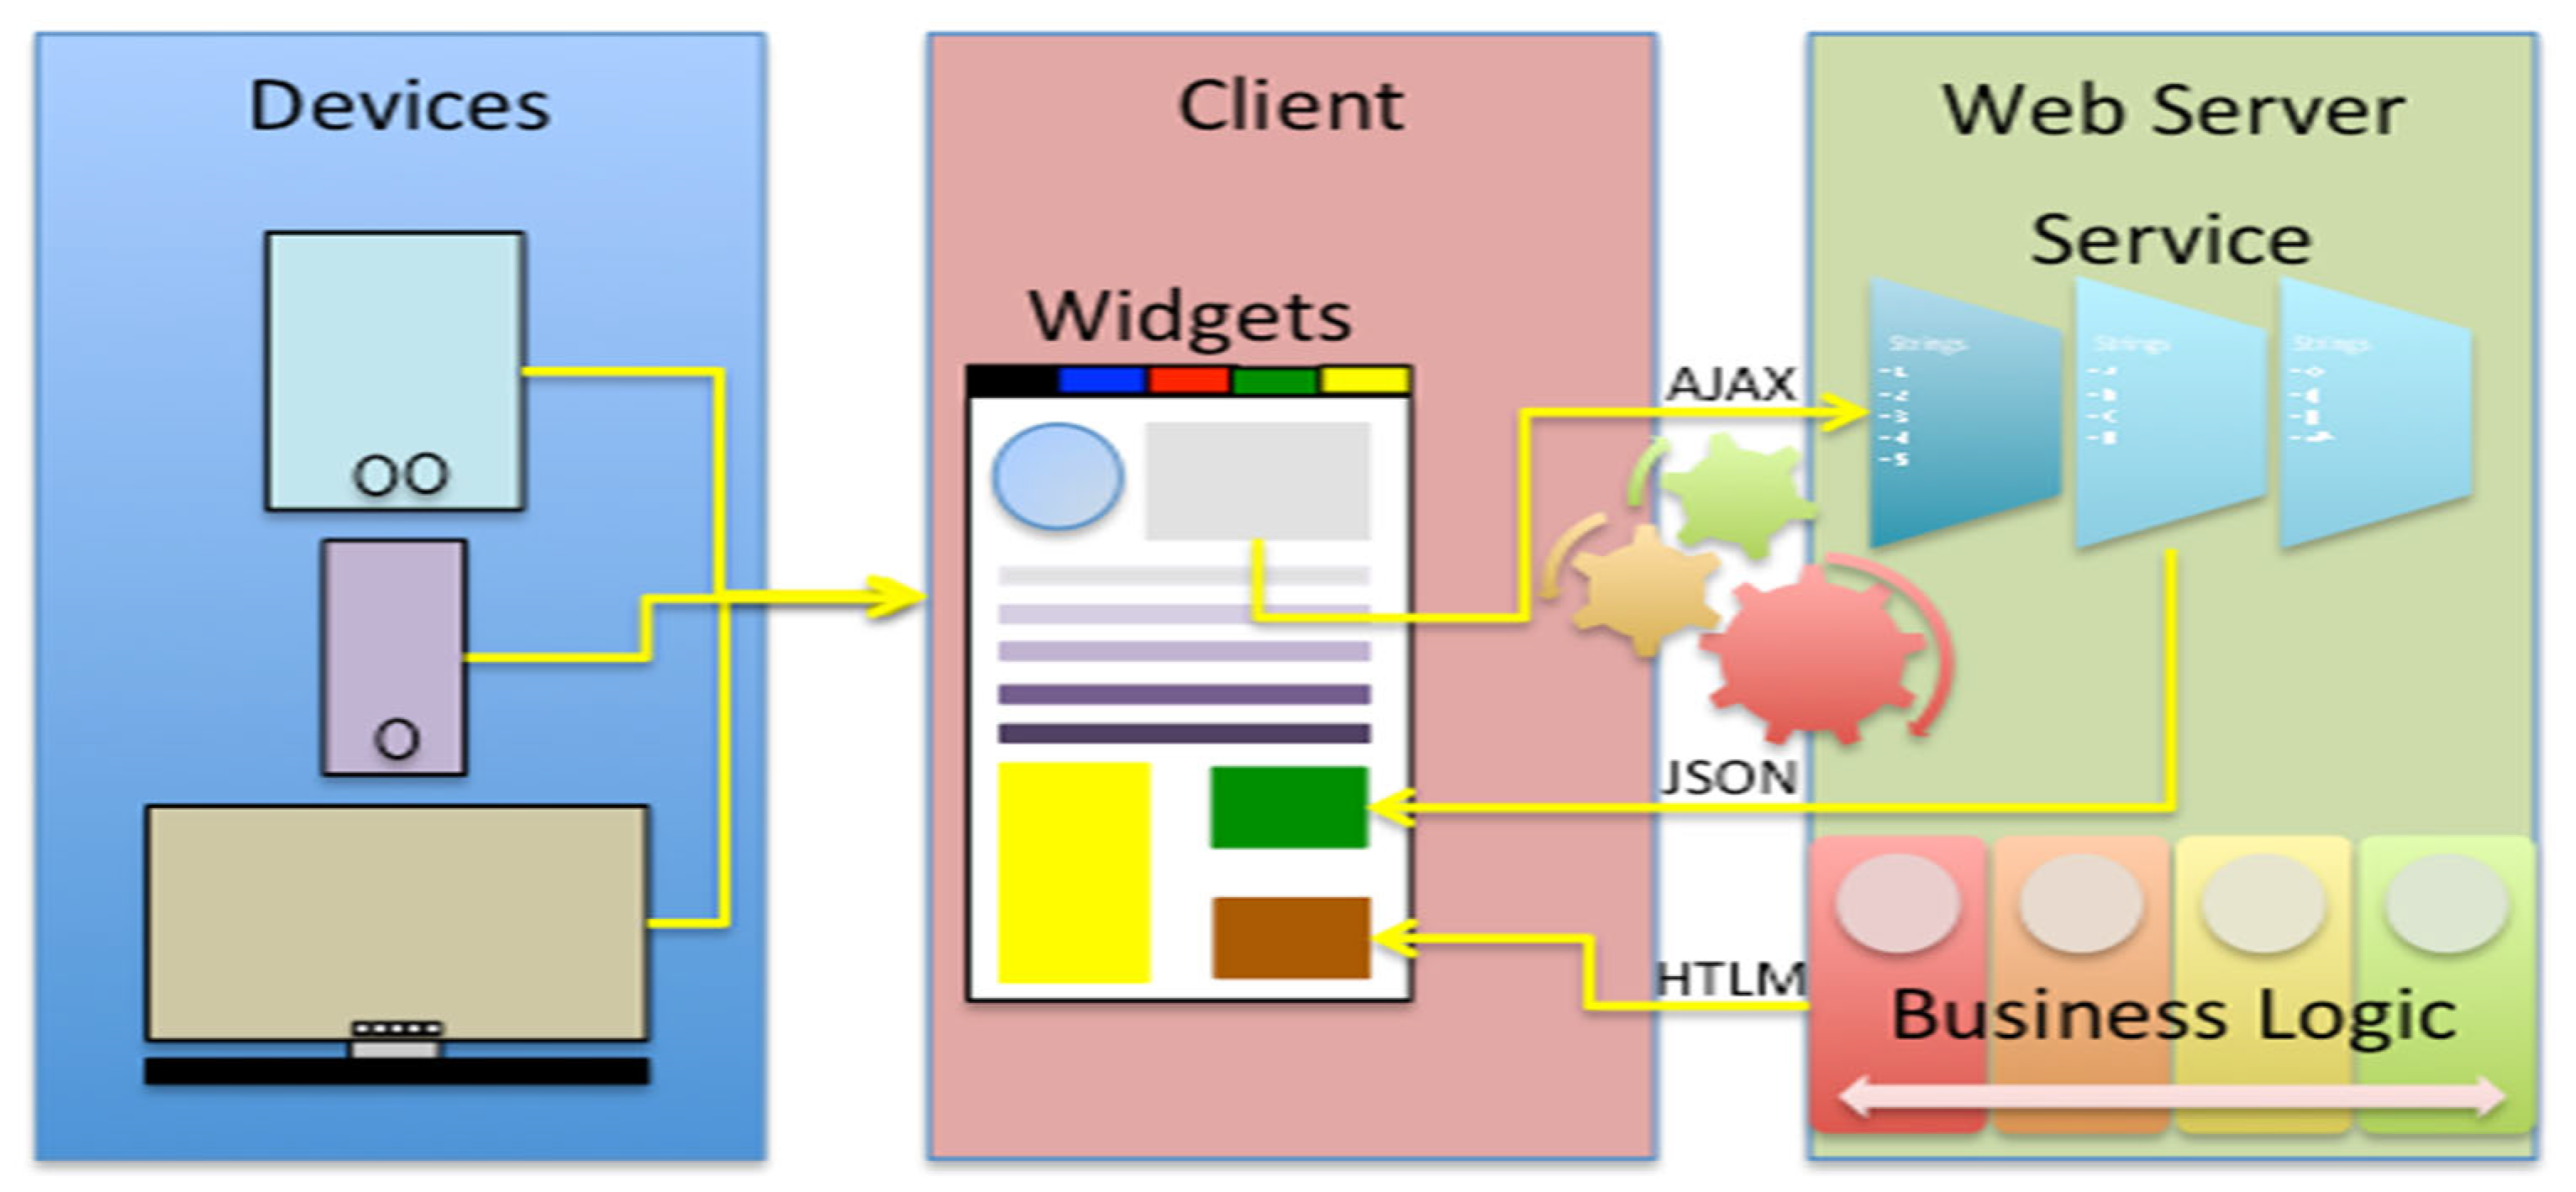
Figure 2.
Condition of product use. (A) Shows the distribution of conditions for which the product was used by patients (N = 1424 responders in total); (B, C) show the distribution of conditions for which the product was recommended or prescribed by pharmacists and physicians (N = 709 and N= 485 reposnders, respectively). All results in the figure refer to multiple-response questions, with the percentages indicating the proportion of responders who selected each response.

Figure 3.
Effectiveness evaluation. Distribution of responses on the perceived effectiveness of the product across the three cohorts: patients, pharmacists, and physicians. Each bar represents the percentage of responders who rated the product as ‘Excellent’, ‘Good’, ‘Fair’, ‘Adequate’, or ‘Poor’. The question on effectiveness was common to all three cohorts. All data refer to single-response questions.
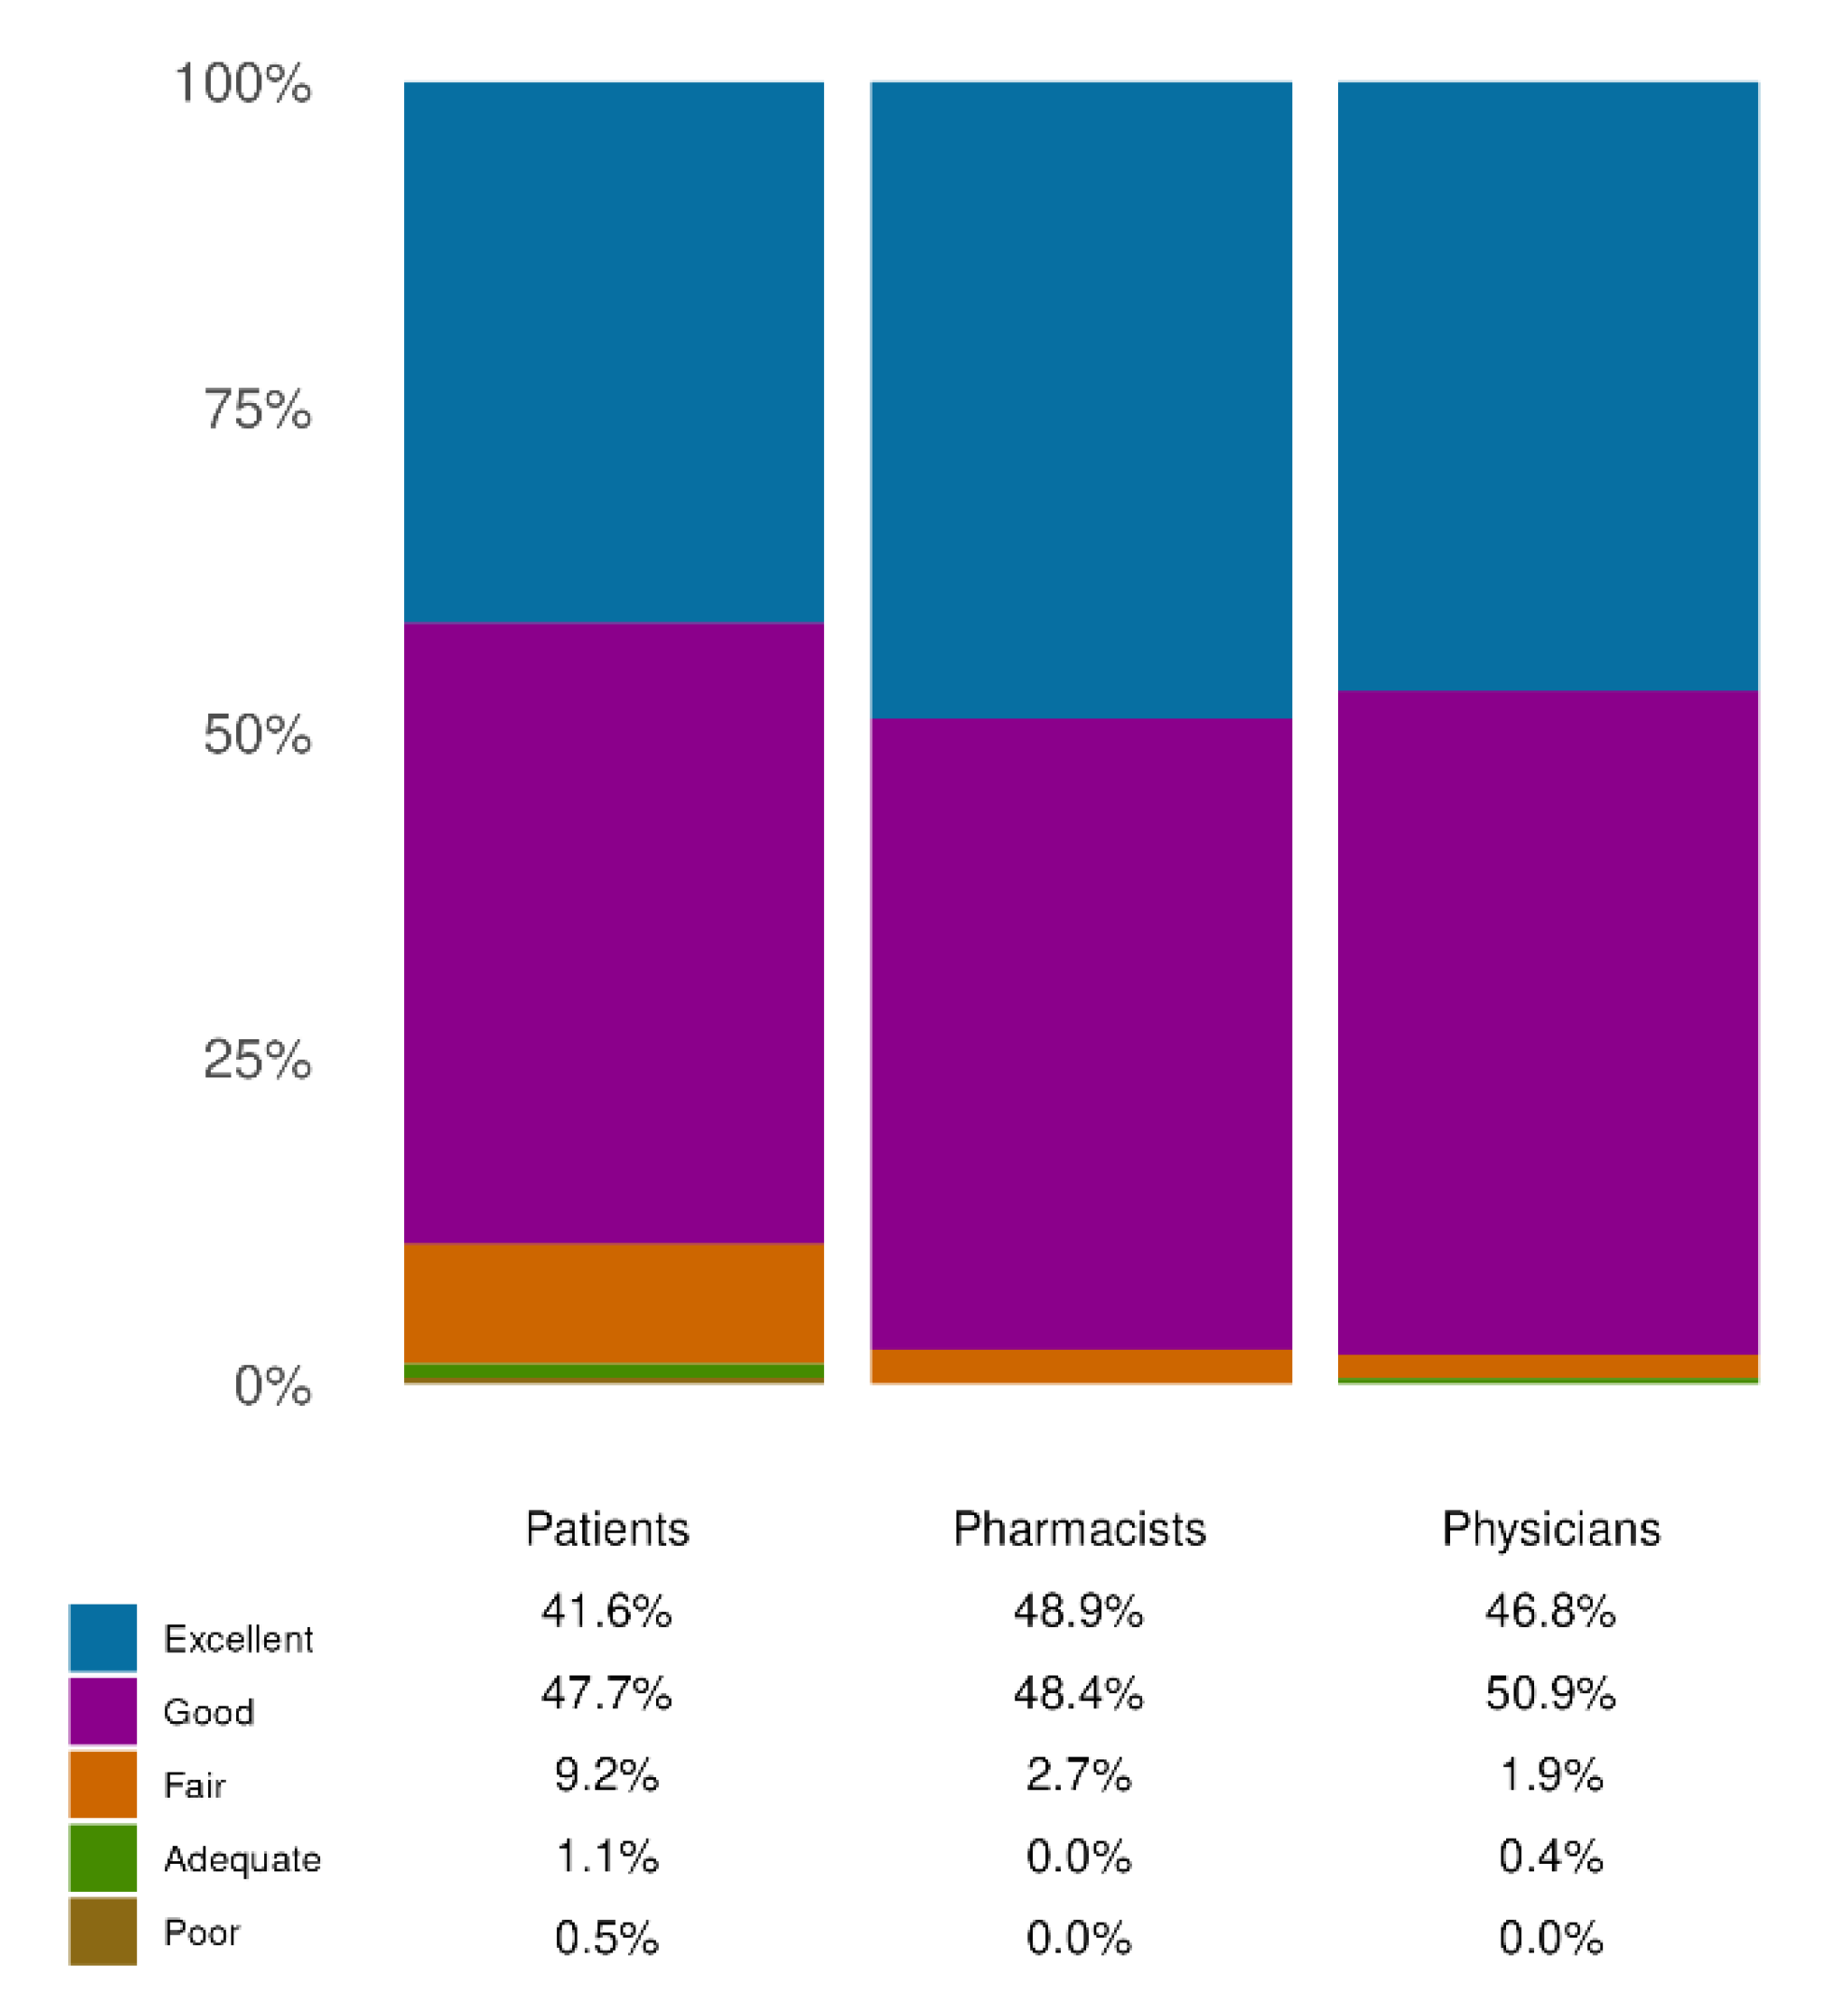
Figure 4.
Figure 4. Safety and tolerability evaluation. The figure illustrates the assessment of safety and tolerability as reported by the three respondent cohorts (total number of responders: 1,424 patients; 709 pharmacists; 485 physicians). In all three group over the 96% of responders selected the higher leves of the score (‘good’ or ‘excellent’), indicating a favorable perception of safety and tolerability. Each bar represents the percentage of responders who rated the product as ‘Excellent’, ‘Good’, ‘Fair’, ‘Adequate’, or ‘Poor’. All results in the figure refer to single-response questions.
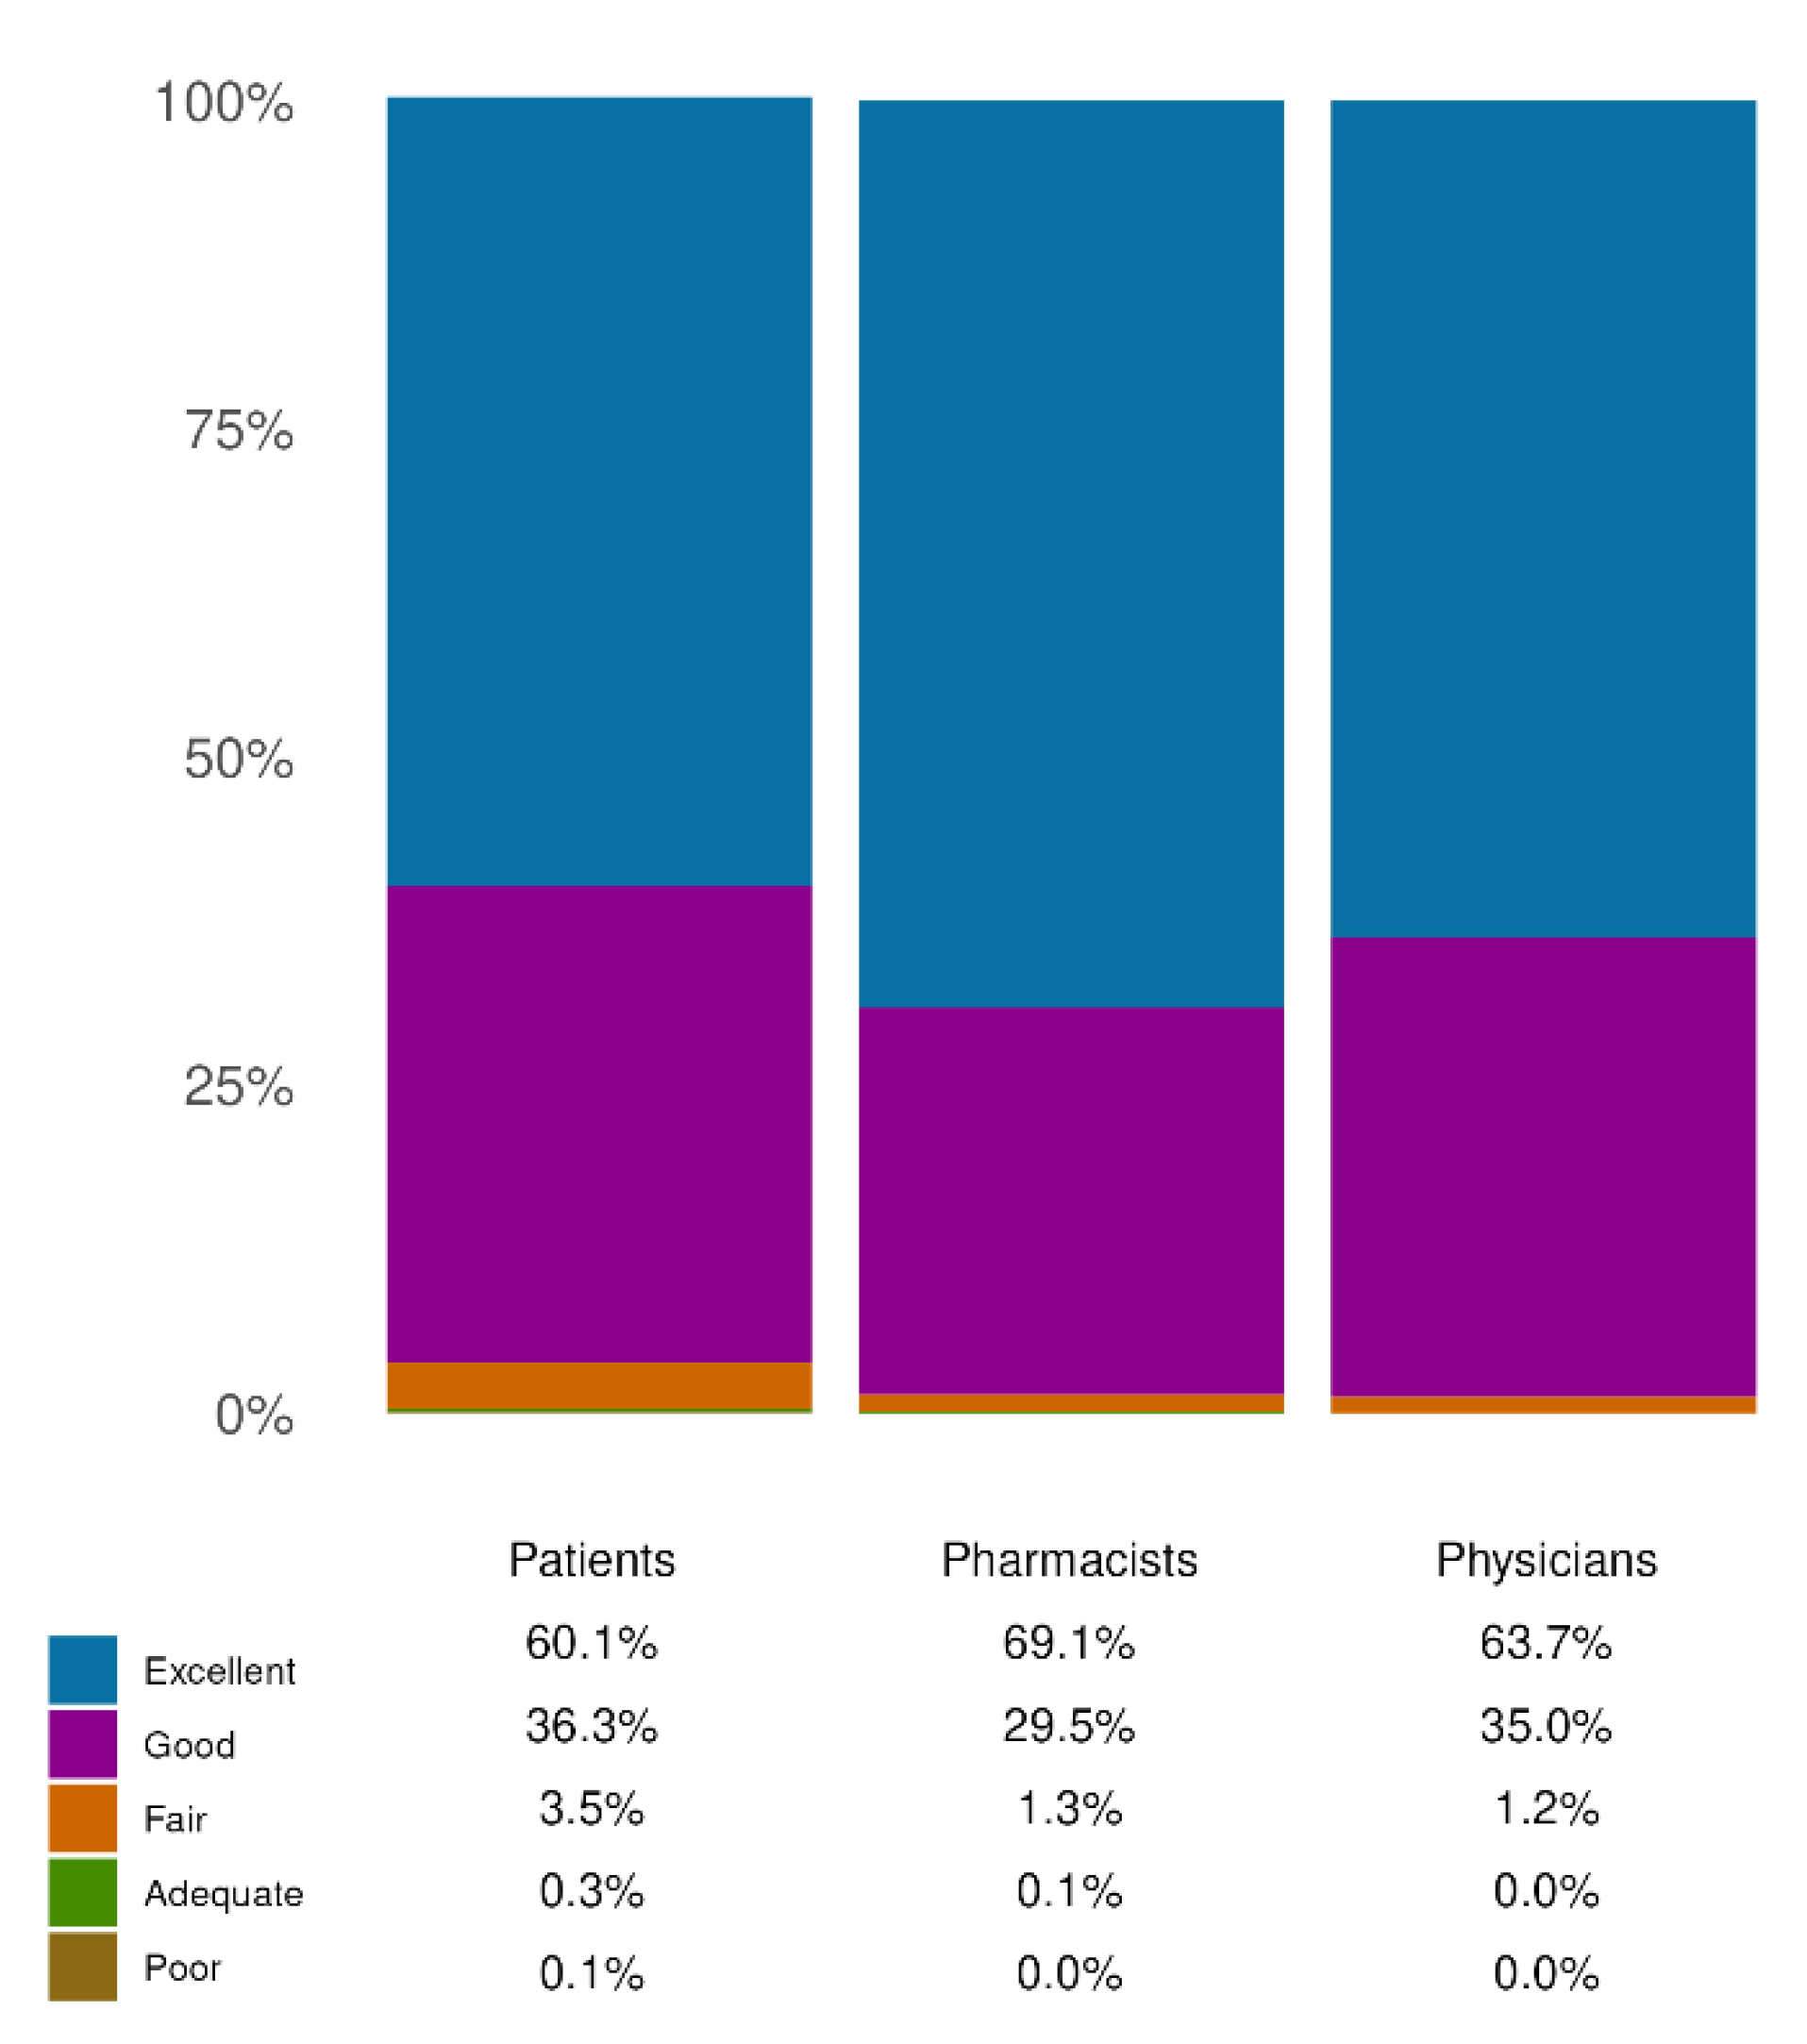
Figure 5.
Effects on QoL.The chart indicates the improvement in QoL as assessed by the three responder cohorts (total number of responders: 1,415 patients; 709 pharmacists; 485 physicians). Each bar represents the percentage of responders who reported the perceived impact of the product on their quality of life, using the categories: ‘Extremely’, ‘Greatly’, ‘Moderately’, ‘Somewhat’, or ‘Not at all’. The physician and pharmacist cohorts had the option to select “I don’t know” (chosen by 3.81% of pharmacists and 1.24% of physicians). All results in the figure refer to single-response questions.
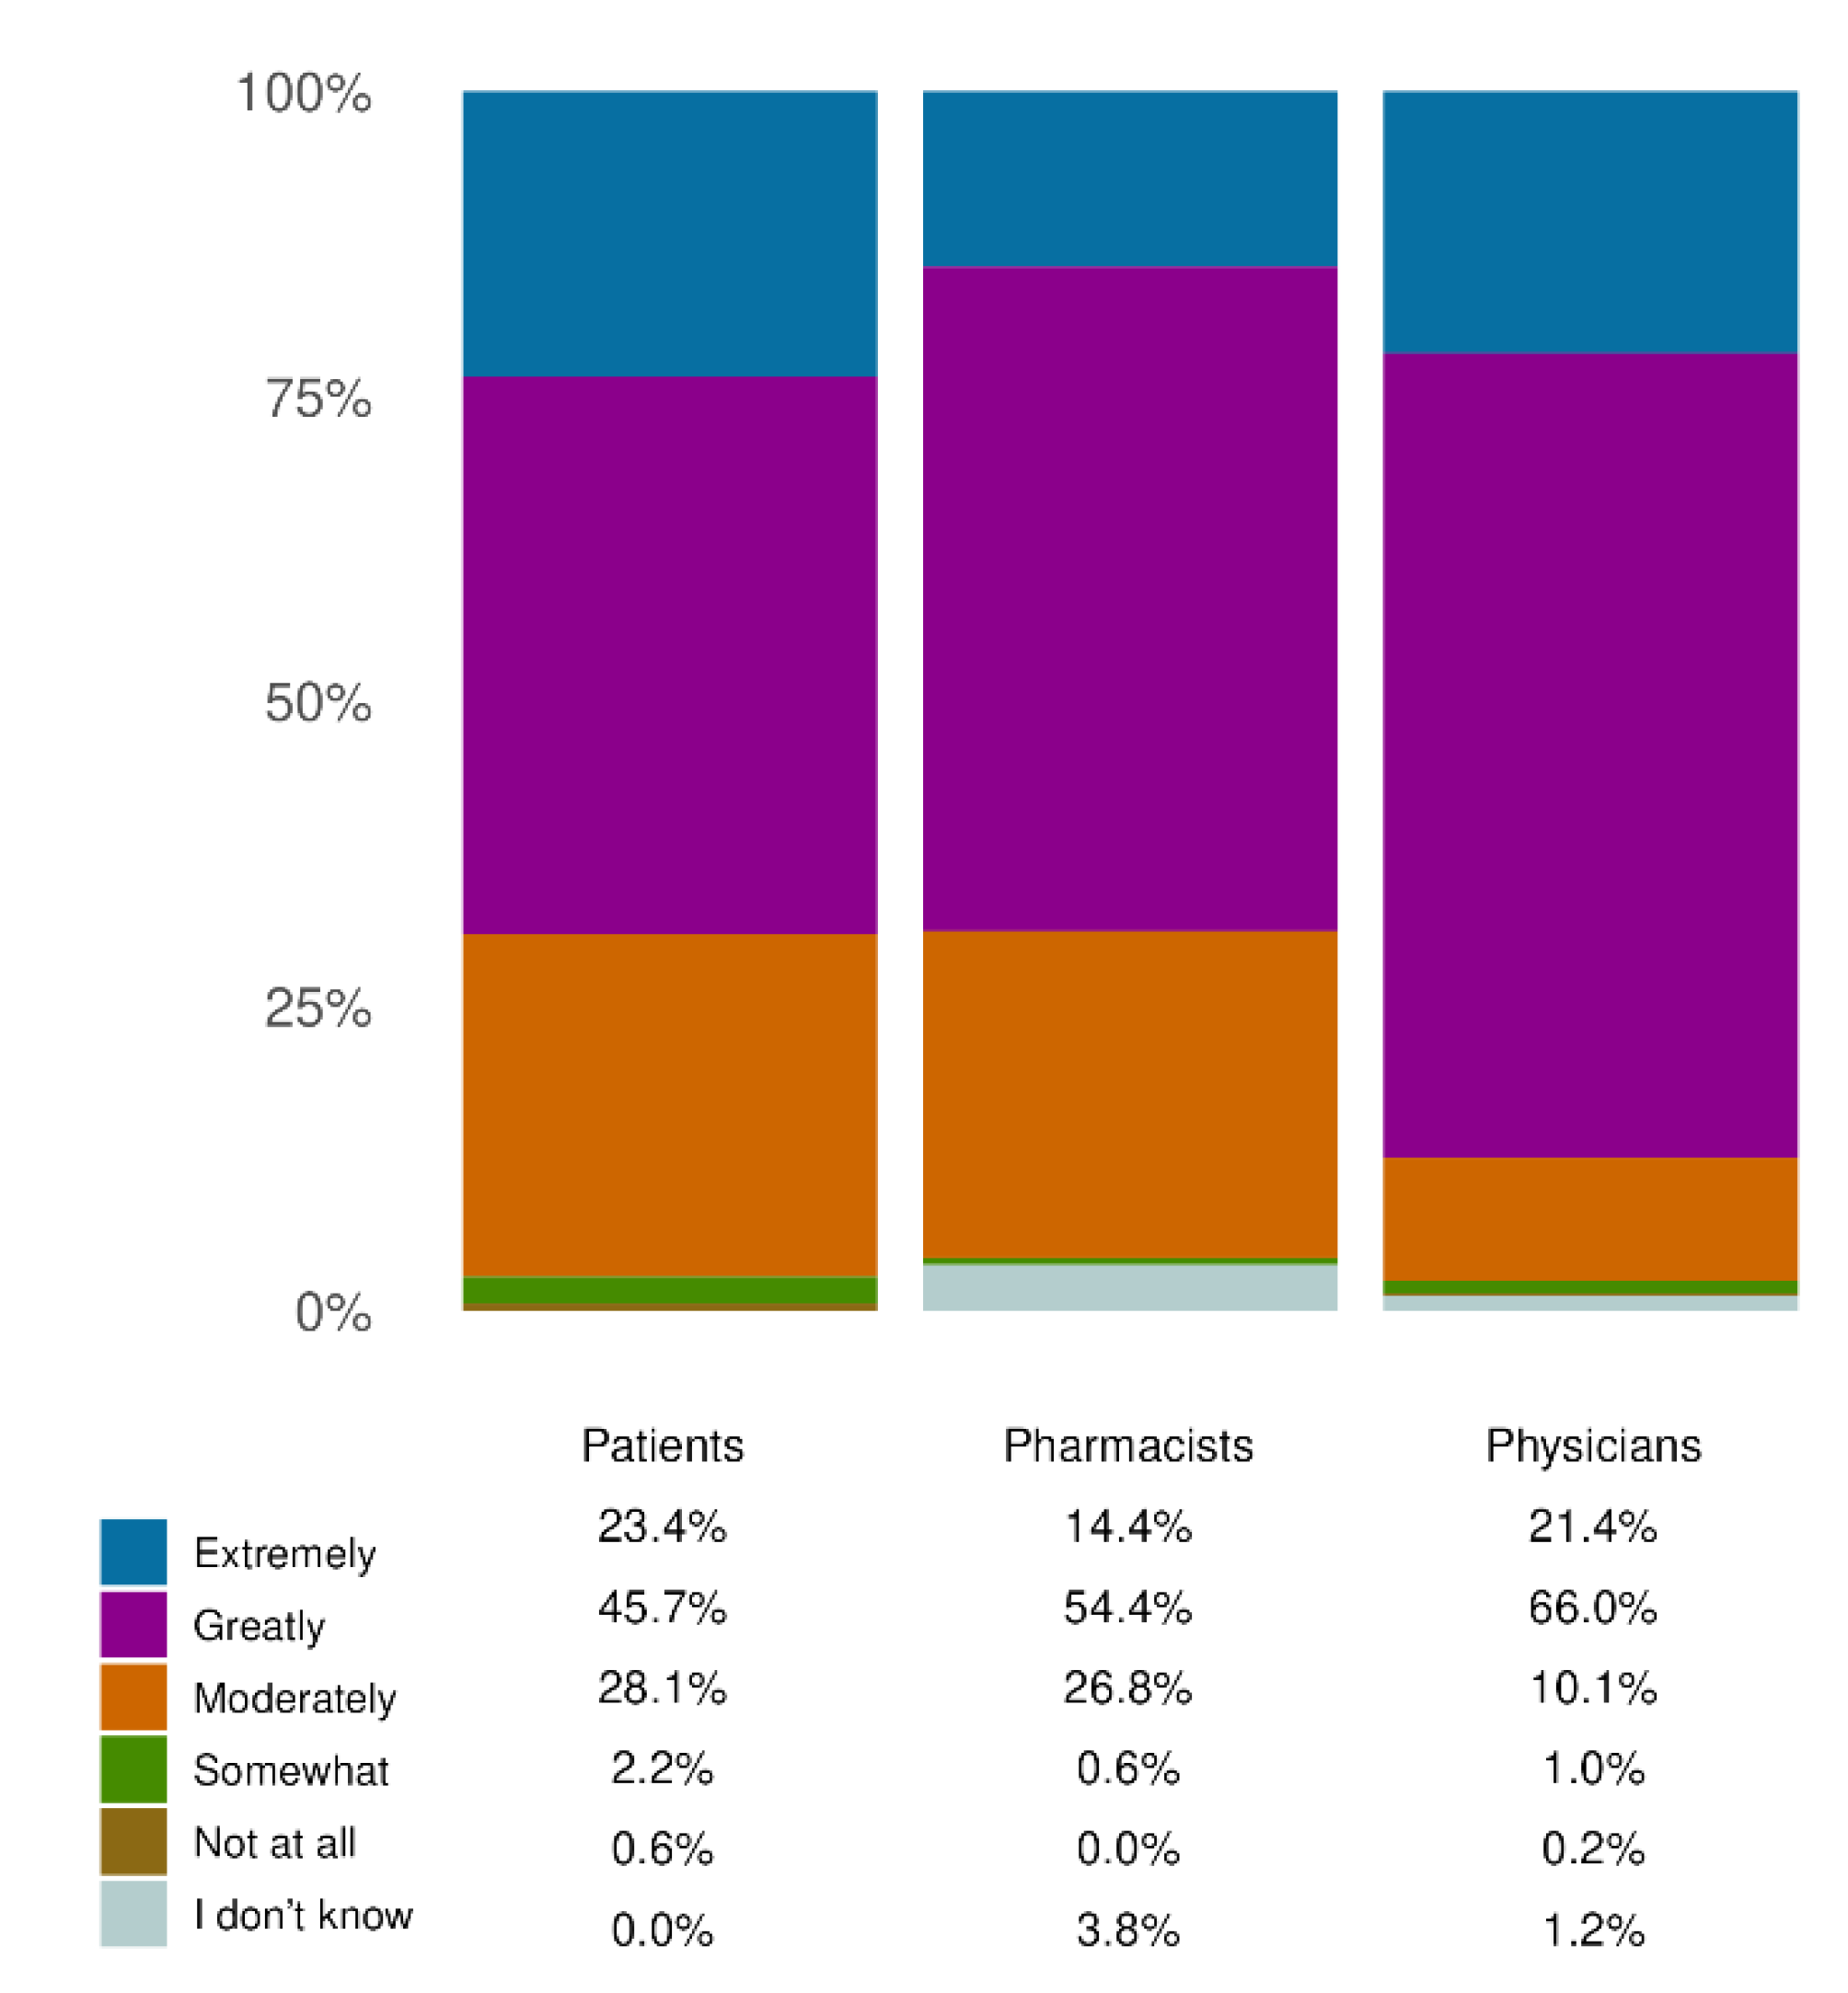
Figure 6.
Focus on effects on patient’s QoL. The chart illustrates the percentage of patients who reported improvements in specific areas of daily life following the use of the product. The most frequently reported benefit was the ability to remain comfortably in a sitting position (69.28%, N = 918), followed by improved mood (47.32%, N = 627), enhanced social life (22.26%, N = 295), and increased ease in participating in sporting activities (22.04%, N = 292). Additional improvements included greater dietary freedom (14.94%) and better performance at work (11.17%, N = 295). All results in the figure refer to multiple-response questions, with the percentages indicating the proportion of responders who selected each response.
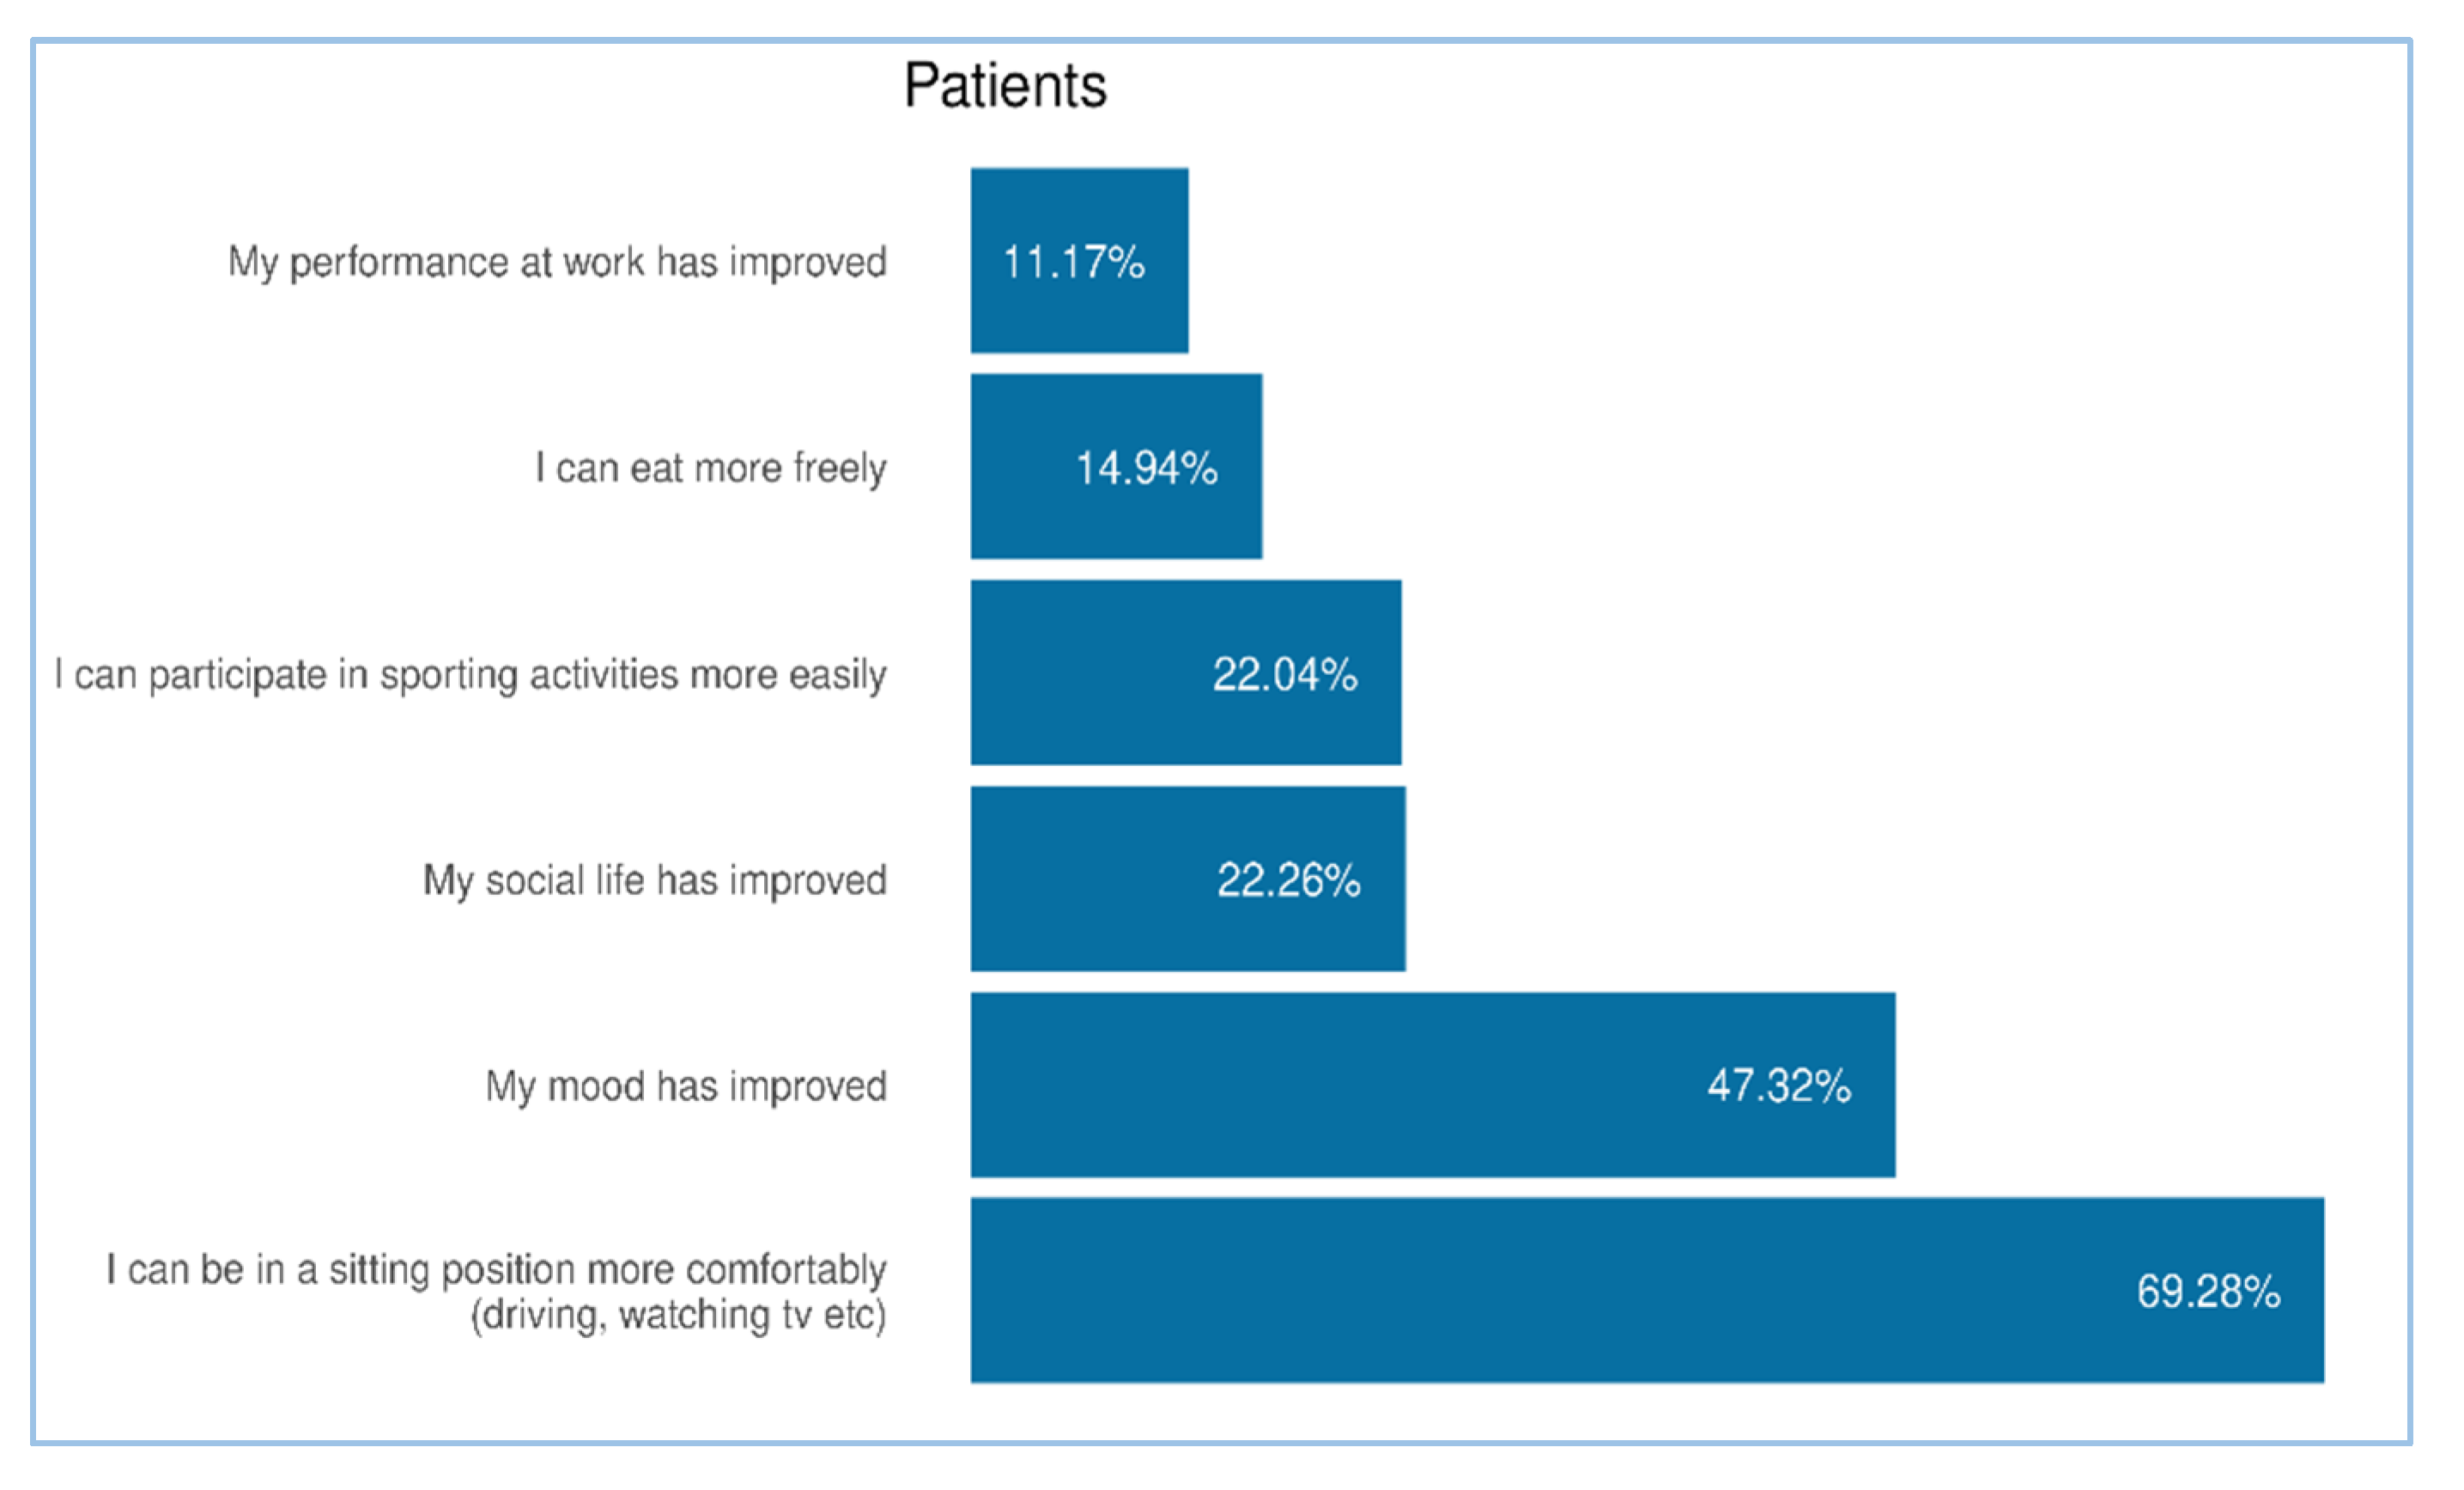
Figure 7.
Figure 7. Products/interventions for the treatment of HD. (A) Distribution of different products/interventions used by patients (N =1415 responders). (B, C) Distribution of products/interventions recommended or prescribed by pharmacists and physicians (N = 709 and N = 485, respectively). The physician and pharmacist cohorts had the option to select “I don’t know” (1.83% of pharmacists 2.06% of physicians). All results in the figure refer to multiple-response questions, with the percentages indicating the proportion of responders who selected each response.
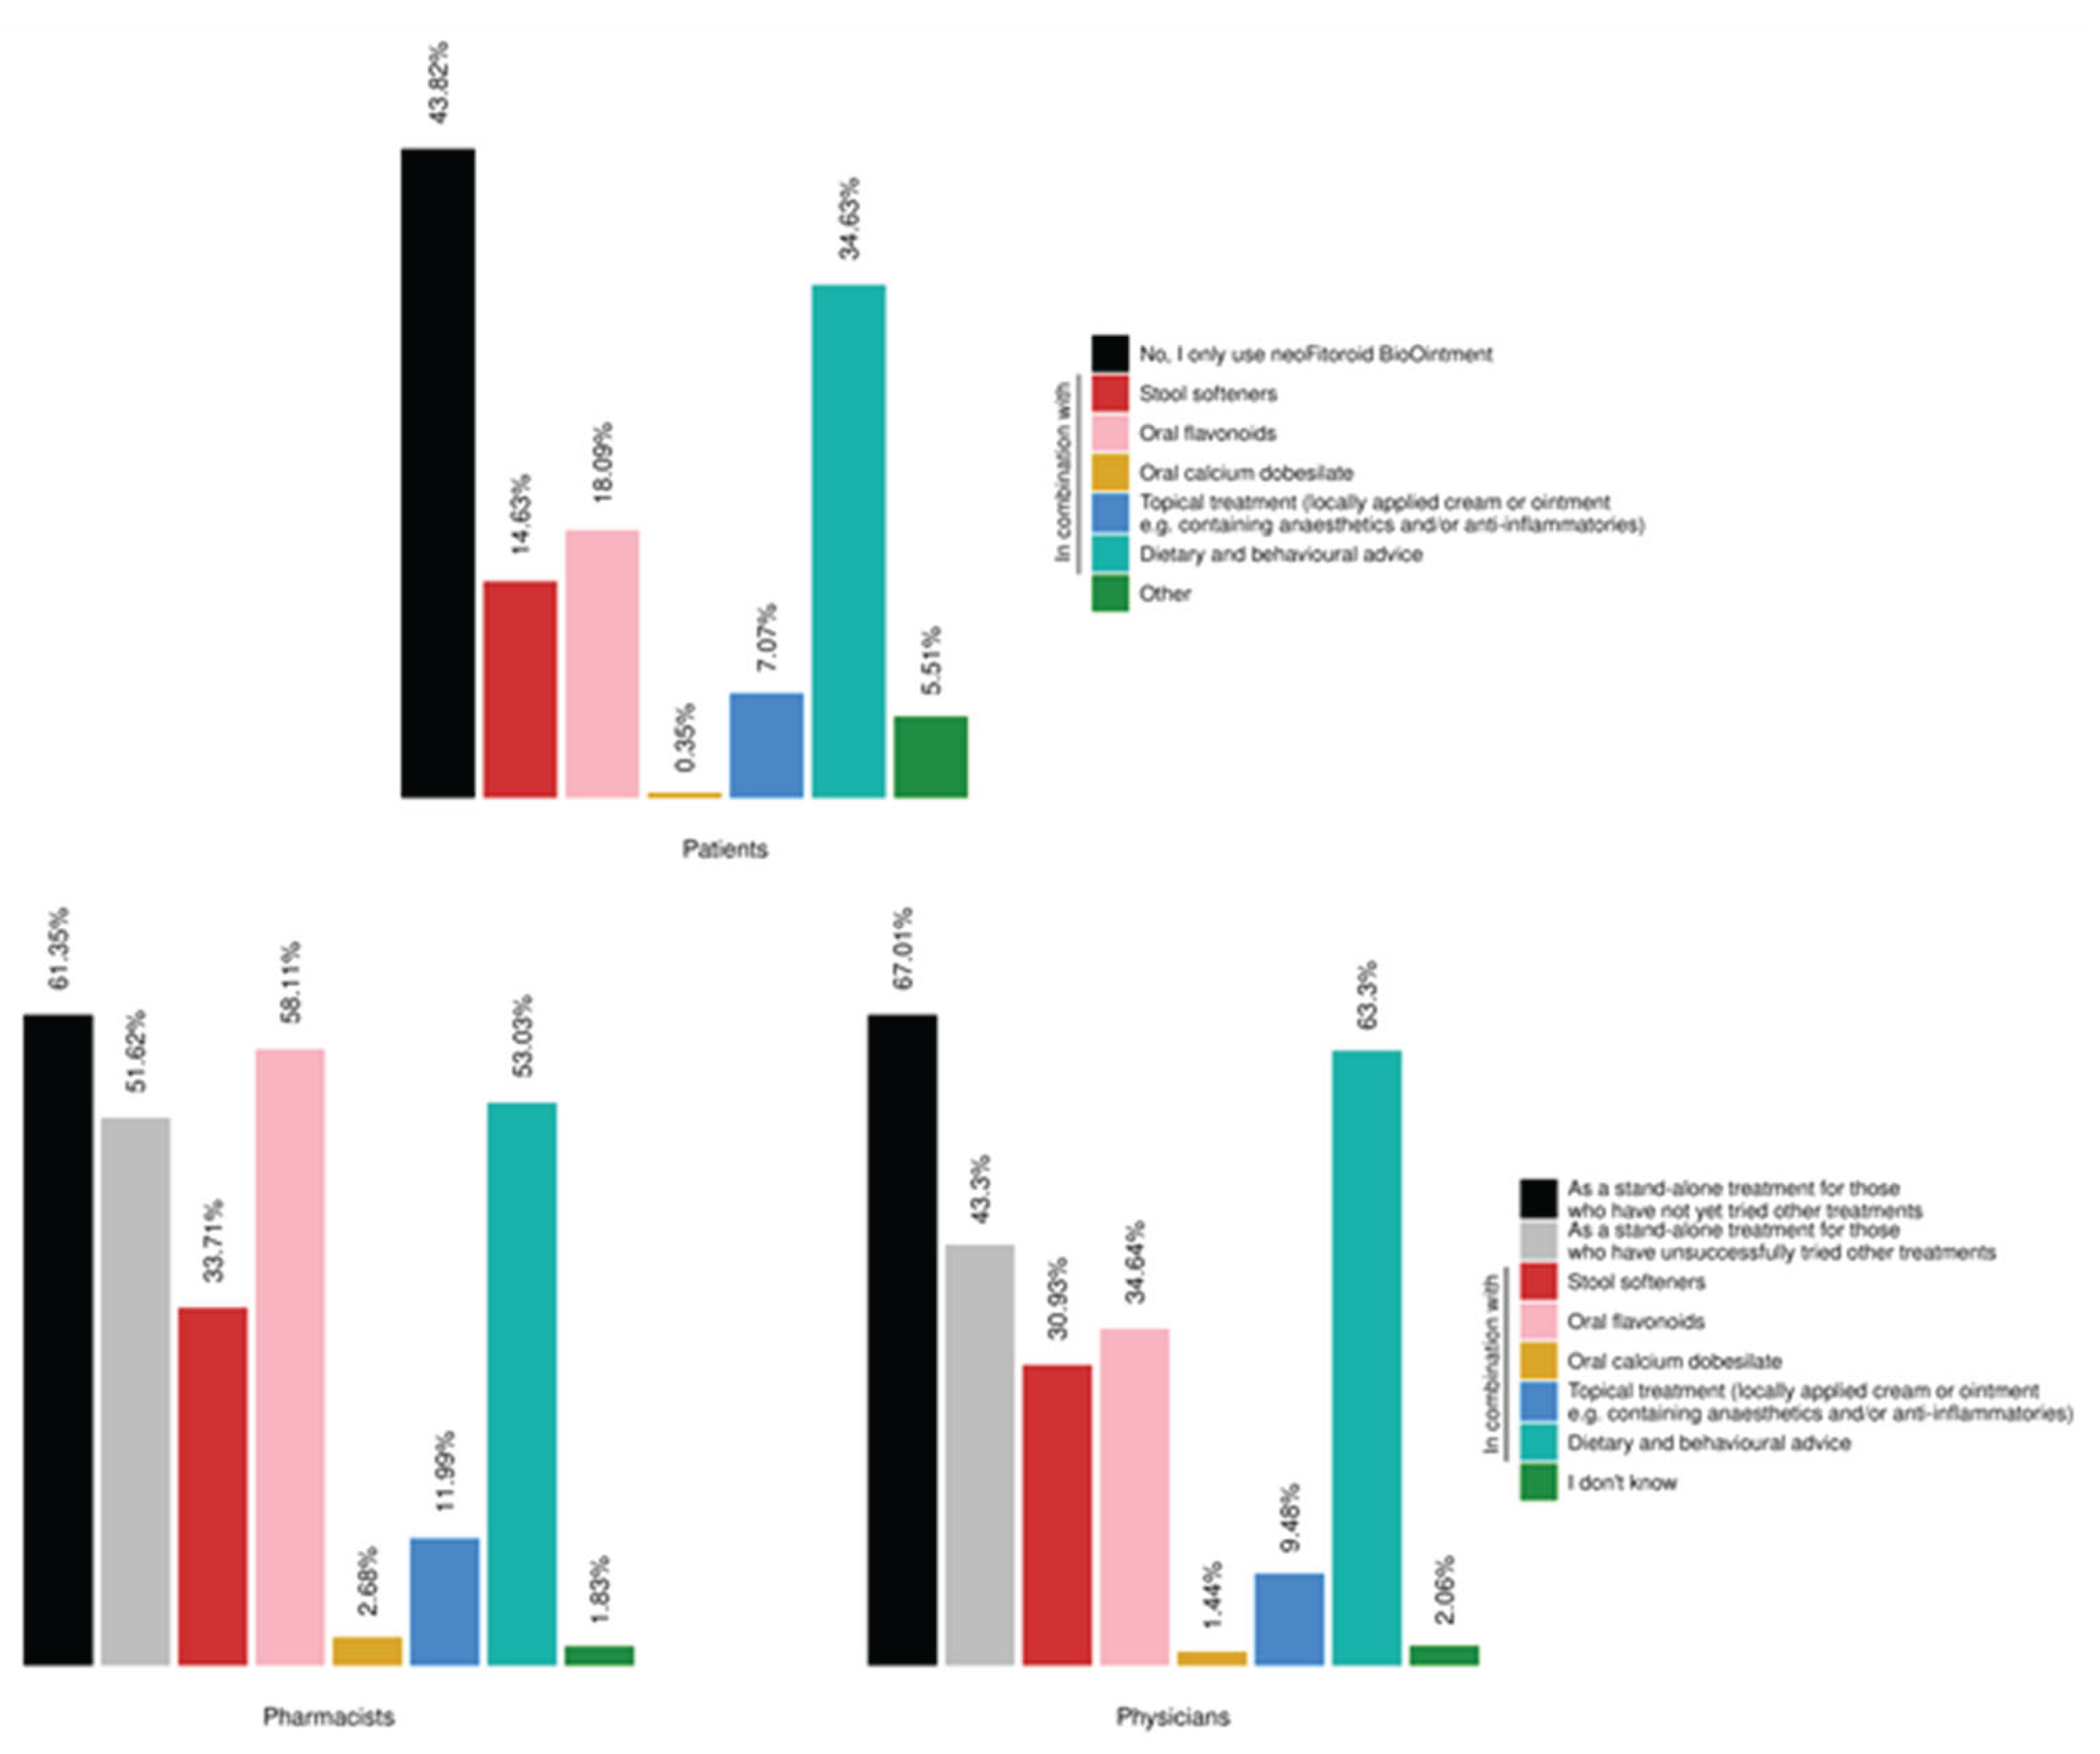
Figure 8.
Quantification data. A-Patient; B-Pharmacist; C-Physicians and D-Summury of RWE quantification by Heatmap. Quantitative evaluation of effectiveness, safety/tolerability and quality of life (QoL) across three responder groups: patients, pharmacists, and physicians. All three groups reported high GS. ANOVA analyses revealed statistically significant differences between RWE and HPD distributions, in all three groups: Patients p=0.0028; pharmacists p=0.0161 and physicians p=0.0378. The red dashed line indicates the expected GS value equal to 3 in random distribution. The predominance of responses at the highest Likert levels (4 and 5) confirms a strong positive perception of the treatment’s clinical impact.
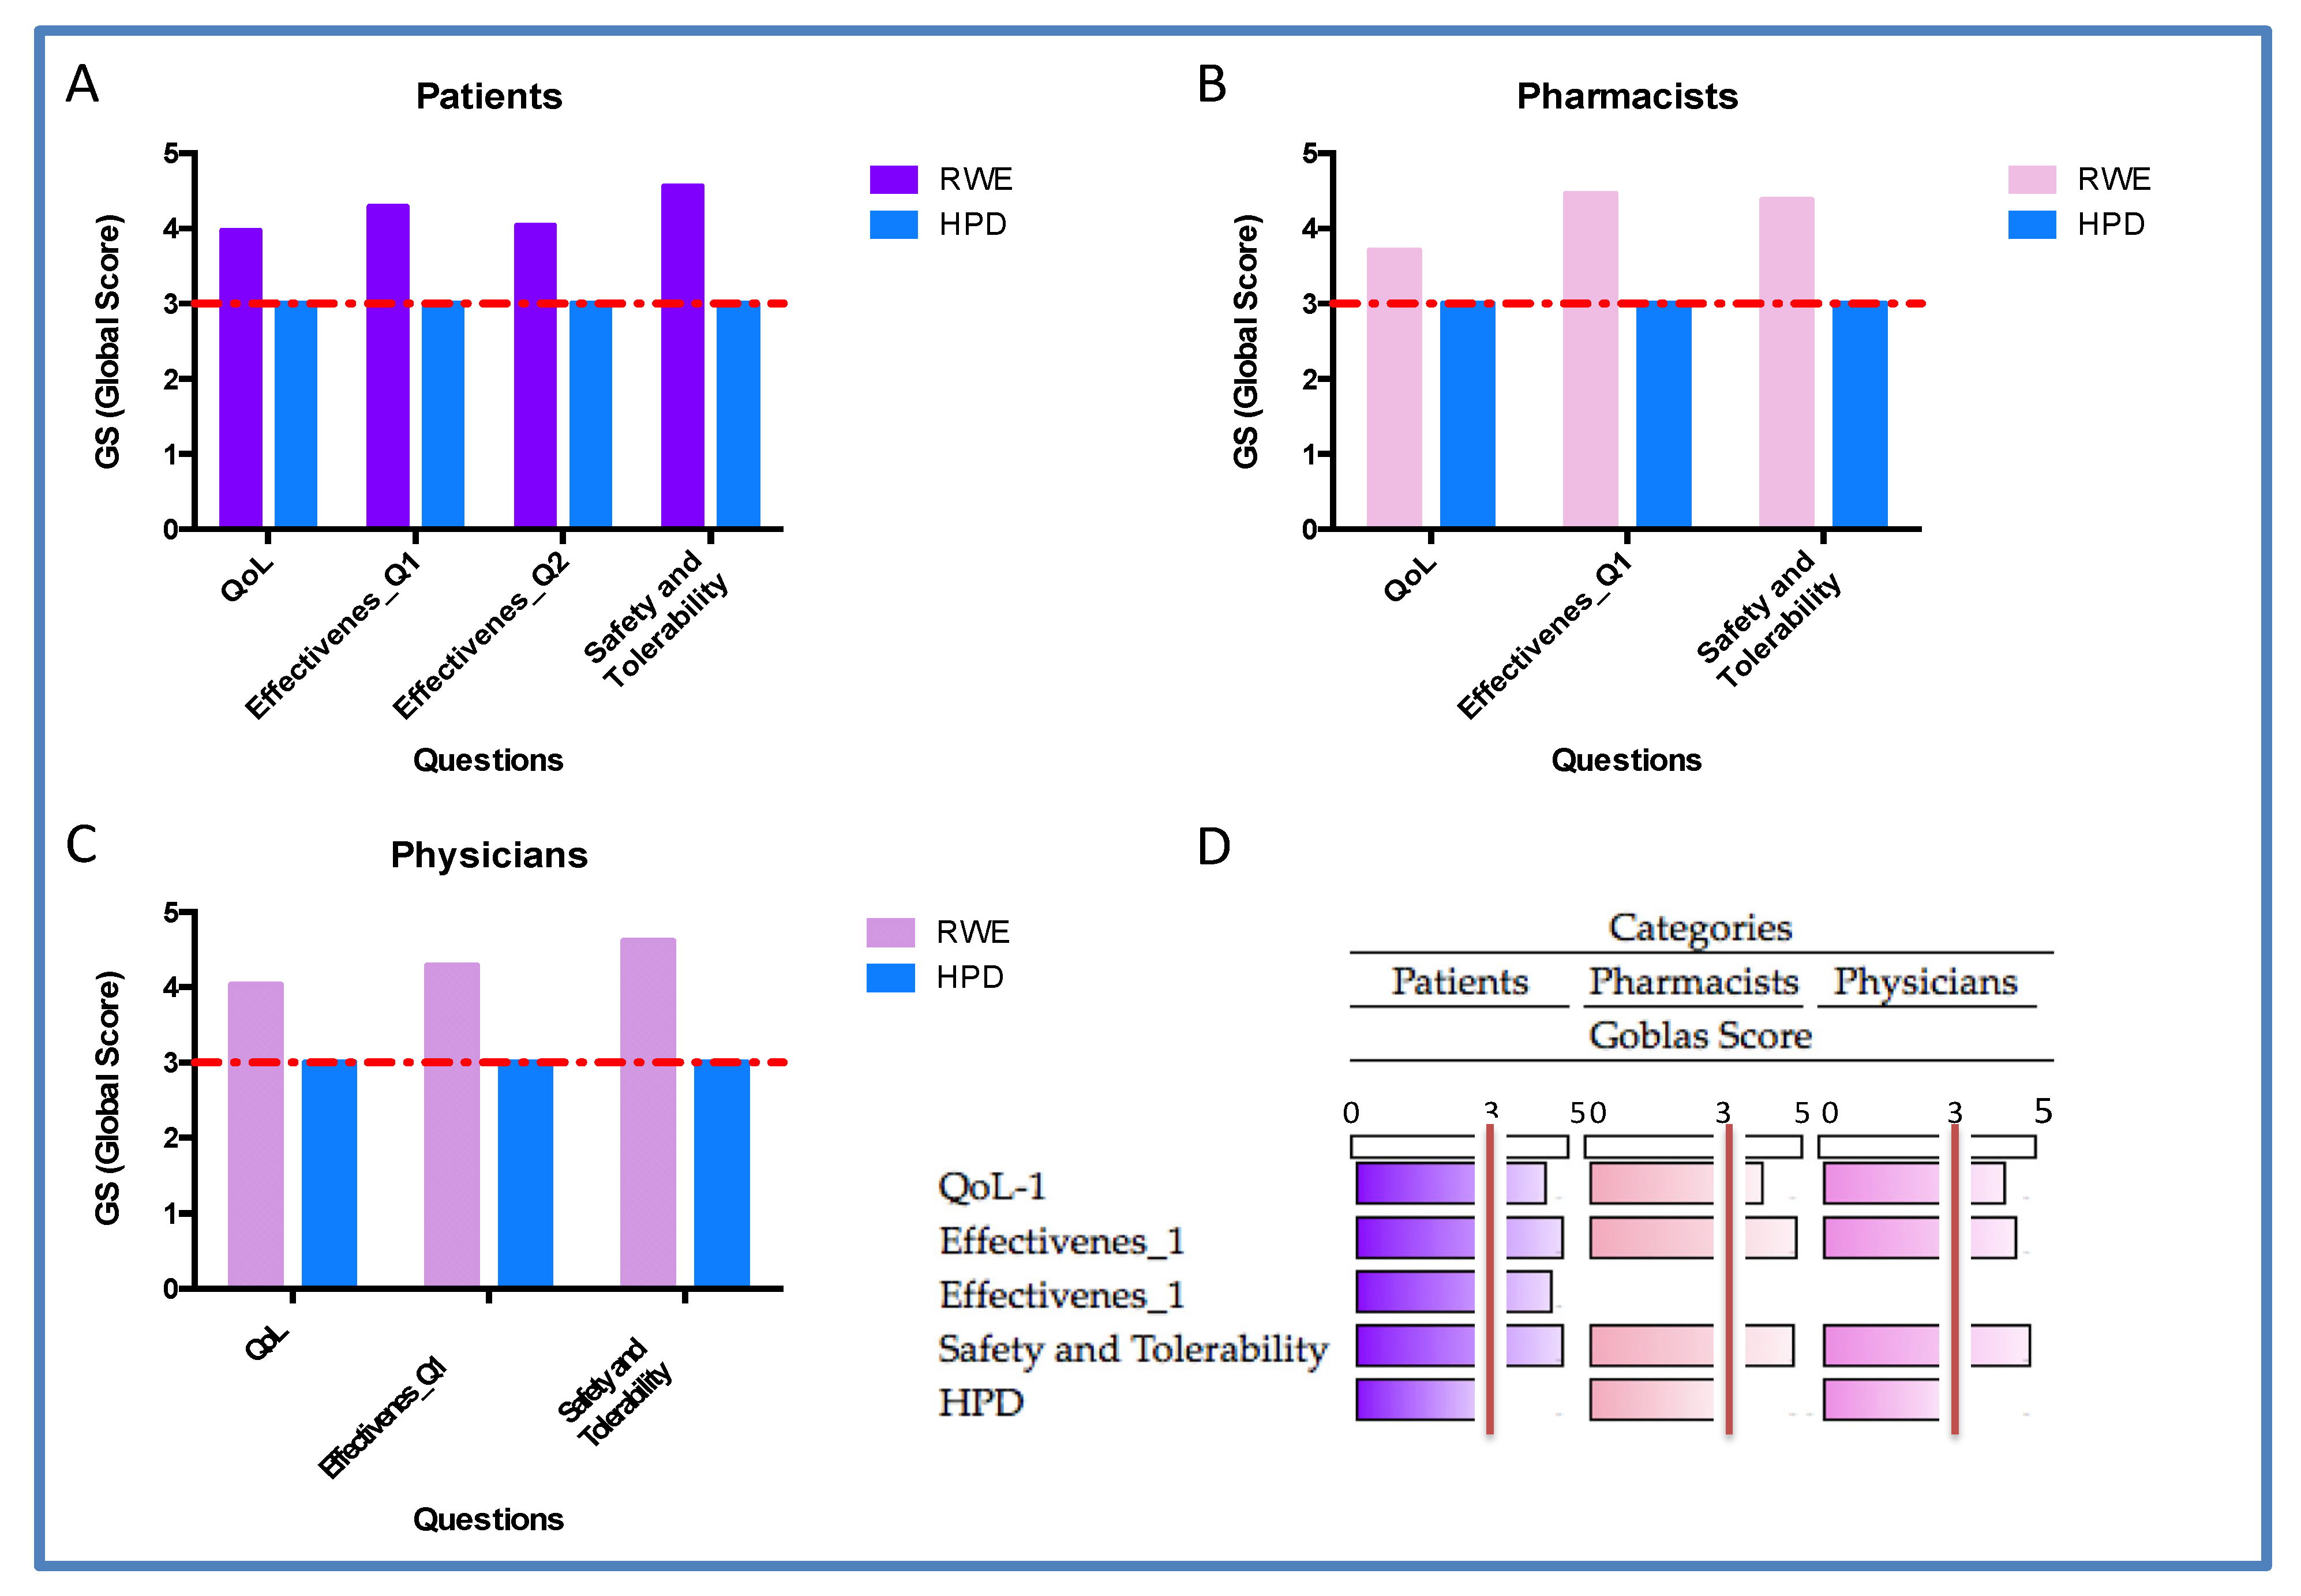

Table 1.
Statistics for each group among the GS of all questions.
| Group | Mean | SD | N |
| Patients | 4.215 | 0.268 | 4 |
| Pharmacists | 4.316 | 0.292 | 3 |
| Physicians | 4.184 | 0.411 | 3 |
Disclaimer/Publisher’s Note: The statements, opinions and data contained in all publications are solely those of the individual author(s) and contributor(s) and not of MDPI and/or the editor(s). MDPI and/or the editor(s) disclaim responsibility for any injury to people or property resulting from any ideas, methods, instructions or products referred to in the content. |
© 2025 by the authors. Licensee MDPI, Basel, Switzerland. This article is an open access article distributed under the terms and conditions of the Creative Commons Attribution (CC BY) license (http://creativecommons.org/licenses/by/4.0/).
Copyright: This open access article is published under a Creative Commons CC BY 4.0 license, which permit the free download, distribution, and reuse, provided that the author and preprint are cited in any reuse.


