
Submitted:
20 June 2025
Posted:
24 June 2025
You are already at the latest version
Abstract
To identify differentially abundant polyketide synthases (PKSs) and to characterize the biochemical consequences of brevetoxin biosynthesis, bottom up, TMT based quantitative proteomics and redox proteomics were conducted to compare two strains of the Florida red tide dinoflagellate Karenia brevis, which differ significantly in brevetoxin content. Forty-eight PKS enzymes potentially linked to brevetoxin production were identified, with 38 showing up to 16-fold higher abundance in the high-toxin strain. A pronounced shift toward a more oxidized redox state was observed in this strain’s proteome. Notably, 25 antioxidant-related proteins were significantly elevated, including alternative oxidase (AOX), which increased by 17-fold. These results elucidate the cellular consequences of toxin biosynthesis in K. brevis, offer new leads for the study of brevetoxin biosynthesis, and suggest a novel red tide mitigation approach targeting high toxin-producing strains.
Keywords:
Karenia brevis
; proteomics
; polyketide synthase
; brevetoxin
1. Introduction
Recurring blooms of Karenia brevis, the Florida red tide dinoflagellate, in the Gulf of Mexico, are a bane to the shellfish and tourism industries in the region and can precipitate environmental, economic and public health related catastrophe. Extended events can persist for months or even years [1] resulting in massive wildlife mortalities [2] and economic losses for the shellfish and tourism industries [3,4]. Humans exposed to the Florida red tide may experience respiratory, gastrointestinal or neurological disorders [5,6] through the inhalation of toxic aerosols or the consumption of tainted shellfish. These harmful effects are caused by a suite of neurotoxins, known as the brevetoxins, which are produced by K. brevis. The brevetoxins belong to a small class of secondary metabolites called polyether ladders (Figure 1). More than a dozen structural variants of the brevetoxins have been reported to date [7]. However, by far the most abundant of the brevetoxins is PbTx-2 [7,8].
In higher organisms, brevetoxins activate the voltage-gated sodium channel (VGSC) affecting both the central and peripheral nervous systems as well as skeletal muscle [9]. Yet, the endogenous function of brevetoxins remains uncertain. It has been suggested that brevetoxins acts as a deterrent to grazing by predators [10,11,12] or that they play an allelopathic role, allowing K. brevis to outperform phytoplankton competitors [13,14,15,16,17]. The localization of the brevetoxins to the chloroplast of K. brevis using a fluorescent brevetoxin derivative and the capture of two chloroplast proteins using a brevetoxin photoaffinity probe: the light harvesting complex II (LHC-II) and a thioredoxin (Trx) like protein [18] suggested a role in photosynthetic processes and/or regulation of redox status of the cell. It was later demonstrated that PbTx-2 is an inhibitor of recombinant K. brevis thioredoxin reductase KbTrxR [19].
Precursor incorporation experiments have established the polyketide origins of brevetoxins [20]. Over the past three decades, genes encoding hundreds of polyketide biosynthetic pathways in bacteria, plants, and fungi have been identified, cloned, and heterologously expressed [21,22]. Such studies have expanded our understanding of these pathways and facilitated production of valuable polyketide products [23], to include novel structures resulting from genetic alterations and recombinations [24]. Despite these advances, peculiarities of the dinoflagellate genome and their mechanisms for regulating gene expression have made the analysis of polyketide biosynthesis in dinoflagellates at the genome level thus far impenetrable. Dinoflagellates have large, complex genomes characterized by repetitive tandem gene arrays and a high abundance of modified nucleotides [25]. RNA trans-splicing is common in dinoflagellates [26,27,28], and gene expression appears to be regulated largely at the translational or post-translational level rather than at the transcriptional level [29]. While a handful of reports describe the transformation of dinoflagellate chloroplast [30] or nuclear genomes [31,32,33], no robust method currently exists for genetic transformation of dinoflagellates, in particular for those with large repetitive genomes. Due in part to these limitations, much effort has focused on de novo transcriptome assembly to catalog dinoflagellate-derived polyketide synthase (PKS) transcripts that may encode the biosynthetic enzymes involved in these pathways [34,35,36]. Such studies have revealed an unexpectedly large number of transcripts, many of which do not conform to predicted architectures based on toxin structures and few correlations between transcript abundance and toxin content have emerged.
While non-toxic strains of K. brevis have not been identified, cellular toxin loads can vary widely in K. brevis blooms, ranging from less than 1 up to 68 pg/cell [37,38]. Laboratory strains of K. brevis have been reported to have sustained differences in toxin content by up to 10-fold [8,39]. Two strains, both derived from the same (Wilson) strain of K. brevis, inexplicably have shown a sustained 10-fold difference in brevetoxin content for over a decade. The availability of high (KbHT) and low (KbLT) toxin producing strains of K. brevis provides an outstanding opportunity to probe the endogenous function of the brevetoxins as well as the pathway for their biosynthesis. In this work, we have compared log-phase cultures of KbHT and KbLT by bottom-up quantitative proteomics using amine reactive tandem mass tags (TMT) to identify differentially abundant proteins (DAPs) that may be related to brevetoxin biosynthesis. Furthermore, if PbTx-2 is indeed a regulator of cellular redox status, then these two strains should exhibit discernable differences in the redox state of their proteomes. Hence, we have performed redox proteomics utilizing cysteine reactive iodo-TMT reagents to identify and quantify those differences. Log-phase cultures were chosen as they are likely to exhibit higher metabolic activity when compared to stationary phase cultures. Van Dolah and co-workers found more multi-module PKS transcripts using log-phase cultures of the ciguatoxin producing Gambierdiscus polynesiensis when comparing non-toxic G. pacificus [40]. Furthermore, Monroe, et al. reported higher levels of two PKS proteins in KbHT compared to KbLT by western blot of log-phase cultures [41]. Our studies have revealed differentially abundant proteins that may be related to toxin biosynthesis and global disparities in the redox states of the two K. brevis proteomes.
2. Results
2.1. Differences in Redox Stoichiometry Between High and Low-Toxin K. brevis.
Iodo-TMT reagents are useful for analyzing the redox status of cysteine residues in proteins [42,43]. Like amine reactive TMTs, iodo-TMTs have five isotopic labels (either 15N or 13C: see Figure 2A) distributed across the mass reporter and the mass equalizer, such that the total nominal mass is the same for all reagents, but each reporter will have a unique mass. Using the differential cysteine labeling strategy [44,45] outlined in Figure 2B, the redox stoichiometry of individual proteins was obtained from the ratio of reduced to total (TMTred/TMTtotal) cysteines.
In total, 2,542 proteins were identified among four replicate samples. Among these 2,542 proteins, 1,092 occurred in three or more replicates. Multi-scatter plots of biological replicates and a histogram of fold change of redox stoichiometry (TMTred/TMTtotal) for all 2,542 proteins for KbHT/KbLT are shown in Figure 3A and B respectively. Cysteine residues were significantly more oxidized (lower redox stoichiometry) in KbHT. The average redox stoichiometries were 0.28 ± 0.15 and 0.37 ± 0.19 (p = 0, two-tailed paired t-test) for KbHT and KbLT respectively. Shown in Figure 3B, the average and median values for the fold change of redox stoichiometry KbHT/KbLT were 0.74 ± 0.25 and 0.78 ± 0.09 respectively. The shift in the ratios of redox stoichiometry for KbHT/KbLT towards values less than one is indicative of a more oxidized proteome in KbHT. A volcano plot of the redox stoichiometry of all proteins is shown in Figure 3C. While 85% of the proteins showed a reduced redox stoichiometry in KbHT, differences for individual proteins were not significant when applying an FDR of 0.05. Hierarchical clustering failed to reveal any discernible clusters in the data. Among the 1,092 proteins that appeared in three or more replicates, 758 could be annotated with confidence and assigned COG (Clusters of Orthologous Groups) [47]terms. Fisher's exact test for the enrichment of COG terms after filtering out unannotated proteins did not identify any significant associations. Gene set enrichment analysis (GSEA) of redox stoichiometry, performed by submitting a ranked list (fold change) of gene names to WebGestalt [48] against Arabidopsis thaliana did not return any significantly enriched pathways. The algorithm DeepLoc 2.1 [49] was applied to assign all 2,542 proteins into 10 cellular compartments. Fisher’s exact test was performed to assess the association between redox stoichiometry and cellular compartments, but no significant associations were identified.
2.2. Differentially Abundant Proteins Between High and Low-Toxin K. brevis
Proteins were analyzed from four biological replicate samples of KbHT and five biological replicate samples of KbLT. LC-MS/MS analysis identified 5,044 unique proteins of which only 2,061 could be assigned a function and 1,925 assigned a COG classification. Log intensity histograms after scaling channels to the same intensity and normalization to the mean are shown for all 9 samples in Figure 4A and demonstrate consistent intensities across replicates. Multi-correlation plots shown in Figure 4B demonstrate good correlation within each group (KbHT or KbLT). As shown in the volcano plot in Figure 4C, 1,910 proteins were identified as DAPs (FDR = 0.02, S = 1) with 859 more abundant in KbHT. Hierarchical clustering analysis based on protein expression profiles resulted in the identification of two distinct clusters that reflected the expected groupings of KbHT and KbLT (Figure 4D).
Among the 1,910 proteins that were significantly altered, only 675 could be assigned COG terms. After filtering for annotated proteins, Fisher's exact test revealed significant associations with three COG term categorical annotations: A (RNA processing and modification, enrichment KbHT/KbLT = 0.50, p-value = 1.6 E-5, FDR = 6.4 E-3), T (signal transduction mechanisms, enrichment KbHT/KbLT =0.65, p-value = 5.8 E-4, FDR = 1.6 E-2), and Q (secondary metabolite biosynthesis, enrichment KbHT/KbLT = 1.54, p-value = 1.02 E-6, FDR = 8.02 E-5). Enrichment scores indicate more uniformity across COG terms A and T and enhanced variability across COG term Q. Within the category of secondary metabolite biosynthesis, 48 proteins were annotated as polyketide synthases. Fisher’s exact test on this subset of Q, which we call “Q PKS” revealed an even more significant association (enrichment KbHT/KbLT = 1.81, p-value = 1.0 E-7, FDR = 8.1 E-6). Heat maps of COG Q and Q PKS are shown in Figure 5A and 5B respectively. The 1D annotation enrichment feature of the Perseus software determines whether the proteins tend to be ranked higher (or lower) by categorical class between the two observation groups [50]. Comparing the normalized intensity of each protein, this analysis determined that proteins belonging to secondary metabolite biosynthesis (COG Q) and to polyketide biosynthesis (Q PKS), were higher in all four KbHT replicates (p-values < 2.1 E-11, FDR < 1.7 E -9) and lower in all five KbLT replicates (p-values < 2.3 E-11, FDR < 1.9 E -9). Ranking all DAPs by fold change revealed that the protein with the fourth highest fold change and the first that was annotated was a PKS (16-fold). Among the 48 PKS proteins identified in our dataset, 39 differed significantly between the two strains with 38 having fold change >1 (1.7 to 18) and one <1 (0.45) for KbHT/KbLT. These 48 PKS proteins include five multi-domain PKSs corresponding to those reported at the transcript level by Van Dolah [34]. Four of the multi-domain PKSs were more abundant in KbHT having fold change >1 (1.3 to 6.9) and three of the five were significantly more abundant in KbHT. The remaining 43 PKSs were listed as single domain enzymes while two PKSs consisted of two or three repeated KS domains. The presence of ACP, KS, DH and KR domains in these PKSs was confirmed by submission to sequence and structure-based analysis of PKS and NRPS (SBSPKS v2) and to the Search PKS/NRPS and InterPro Scan Analysis tools [51,52,53]. Signal peptides which would target the proteins to the plastid were identified in 3 of the PKS proteins, but these 3 were not significantly different between KbHT and KbLT. All other PKS proteins were localized to the cytoplasm by the DeepLoc algorithm. Interestingly, Monroe and co-workers were able to localize one PKS to the plastid [41]. Of note is the identification of a trans-acting enoyl reductase (ER), which was grouped into COG I (fatty acid biosynthesis and metabolism) among the DAPs that exhibited a 12-fold increase for KbHT/KbLT. Not only are trans-acting ERs involved with the biosynthesis of polyunsaturated fatty acids in algae [54], but also polyketide biosynthesis in fungi [55].
Given the massive shift in redox stoichiometry of the K. brevis proteome, we explored DAPs that are more abundant in KbHT for proteins related to antioxidant defense. A volcano plot that includes 52 antioxidant defense related enzymes that were identified in our dataset is shown in Figure 6A. Among these enzymes, 32 were DAPs and 25 of the DAPs were higher in KbHT. This included an alternative oxidase (AOX) which was an astonishing 17-fold more abundant in KbHT. The AOX is member of a non-heme diiron carboxylate family of proteins and an alternative pathway of mitochondrial electron transport [56]. The AOX pathway is uncoupled from ATP production as it transfers electrons directly from ubiquinol to reduce oxygen to water without contributing to the proton gradient that drives ATP production. The AOX is believed to contribute to biotic and abiotic stress tolerance in plants, algae fungi and animals and to suppress excessive reactive oxygen species (ROS) generation in both mitochondria and chloroplasts [57,58,59,60]. ATP regulates the activity of AOX via a negative feedback mechanism. In the parasitic protist Trypanosoma brucei an ATP synthase was found to operate in reverse mode [61]. That is, it functions as an ATPase with H+ pump activity, reducing cellular ATP concentration. Intriguingly, we found an ATP synthase also 17-fold higher in KbHT. Furthermore, an ABC-type Fe+3 transporter was 15-fold more abundant in KbHT presumably transporting iron for increased AOX biosynthesis. Along with the AOX, and shown in Figure 6A, 24 other proteins related to antioxidant defense were significantly more abundant in KbHT. The enzymes represented in Figure 6A include ascorbate peroxidase (APx), alkyl hydroperoxide reductase (AhpC) (both DAPs and 7.5- and 6-fold increase in KbHT), multiple isoforms of thioredoxin, thioredoxin reductase, superoxide dismutase, glutaredoxin (Grx), peroxiredoxin (Prx), glutathione-S-transferase (GST), glutathione peroxidase (GPx), several enzymes simply annotated as “peroxidase” as well as enzymes related to glutathione biosynthesis: lactoyl glutathione lyase, hydroxyacyl glutathione hydrolase, S-formyl glutathione hydrolase.
The Fisher's exact test revealed significant associations with six cellular compartments based on DeepLoc localizations: Plastid (enrichment KbHT/KbLT = 1.54, p-value = 2.8 E-26, FDR = 1.42 E-24), Extracellular (enrichment KbHT/KbLT = 1.35, p-value = 6.8 E-21, FDR = 1.71 E-19), Golgi apparatus (enrichment KbHT/KbLT = 1.30, p-value = 2.0 E-4, FDR = 1.74 E-3), Cytoplasm (enrichment KbHT/KbLT = 0.92 p-value = 1.35 E-5, FDR = 1.68 E-4), Mitochondrian (enrichment KbHT/KbLT = 0.85, p-value = 1.95 E-3, FDR = 1.40 E-3), Endoplasmic reticulum (ER, enrichment KbHT/KbLT = 0.74, p-value = 1.37 E-5, FDR = 1.33 E-3). Enrichment factors are indicative of more uniformity between strains in the cytoplasm, mitochondrion and ER and increased variability in the plastid, Golgi apparatus and extracellular structures. A sixth group categorized as either cytoplasm or nucleus was also significantly different (enrichment KbHT/KbLT = 0.70, p-value = 1.36 E-9, FDR = 2.28 E-8). As nuclear proteins were not significantly different, this is likely due to cytoplasmic proteins also classified in this group. A volcano plot and heat map of plastid proteins is shown in Figures 6B and 6C. The 1 D annotation enrichment feature in Perseus determined that plastid localized proteins were higher in all four KbHT samples (p-values < 1.5 E-25, FDR < 7.6 E -24) and lower in all 5 KbLT samples (p-values < 1.59 E-31, FDR < 9.5 E -30).
3. Discussion
Two long-standing questions regarding dinoflagellates polyether biosynthesis are why and how these energetically costly molecules are produced. Considering the resources committed to their construction, one would presume that some advantage is conferred by their presence. Using fluorescent and photoaffinity probes, brevetoxin was localized to the chloroplasts of K. brevis and was found to interact with the light harvesting complex and thioredoxin [18], a key component of the cellular antioxidant defense system. The thioredoxin system is composed of thioredoxin (Trx) and thioredoxin reductase (TrxR). Together these enzymes function to maintain redox homeostasis with a cell and are essential components of the antioxidant defense system. Trx regulates the activity of numerous target proteins by reducing disulfide bridges by thiol-disulfide exchange. In the process, the catalytic Trx dithiol is oxidized to the disulfide. TrxR returns Trx to its active, reduced state using NADPH [62]. Brevetoxin (PbTx-2) has been shown to be an inhibitor of recombinant K. brevis thioredoxin reductase (KbTrxR) [19]. The IC50 for inhibition of KbTrxR by PbTx-2 is modest (56 μM), but potentially impactful, given that intracellular levels of brevetoxins can reach millimolar concentrations. We reasoned that the inhibition of KbTrxR by PbTx-2 should impact the redox state of the K. brevis proteome. Indeed, using iodoTMT labeling, we observed a broad, significant shift toward oxidation in the high-toxin strain (KbHT), spanning multiple pathways, enzyme classes, and organelles, representing a key finding of this study.
These observations lead to the conspicuous question: what advantage, if any, does the production of PbTx-2 provide to KbHT? The inhibition of TrxR can have profound impacts on cellular processes as it regulates the activity of numerous enzymes through its principal substrate Trx. Photosynthetic organisms, including K. brevis express multiple isoforms of Trx and not all Trx targets have been identified even in the most well studied plants [63,64] which presents a challenge to assessing the full breadth of this effect. We have previously described how the shift to a more reduced proteome in KbLT can negatively influence processes whose enzymes require intramolecular disulfide bridges or nucleophilic cysteine residues to maintain full catalytic activity [46]. On the other hand, PbTx-2 may negatively impact the thioredoxin system of competitors. K. brevis has been shown to induce oxidative stress in the diatom Thalassiosira pseudonana [15,16]. In addition Karenia mikimotoi, which produces the structurally similar polyether ladder gymnocin, has been shown to induce oxidative stress in the marine copepod Tigriopis japonicus [65]. Deng and co-workers demonstrated that bacteria that inhabit the phycopshere of toxic dinoflagellates, including that of K. brevis, tend to be enriched in genes coding for antioxidant defense related enzymes [66].
We propose that the inhibition of KbTrxR by PbTx-2 leads in turn to the disruption of redox homeostasis, promoting oxidative stress. KbHT may compensate for TrxR inhibition by increasing the production of enzymes related to antioxidant defense such as the AOX, APx, AhpC, Grx, GST, SOD, GPx and Prx. KbHT has previously been shown to have lower levels of ascorbic acid, reduced glutathione (GSH), and high molecular weight thiols compared to KbLT. Yet, KbHT showed an overall higher antioxidant capacity [46,67]. Interestingly, we showed a slightly higher Trx and Grpx activity in KbLT [67] which is not consistent with our current findings of enrichment of these enzymes in KbHT. On the other hand, the activity of Trx and Grx depend on active site cysteines which, when oxidized, become inactivated [62,68]. Therefore, these enzymes may need to be enriched under highly oxidizing conditions to achieve the same activity. The type of excess cysteine oxidation in KbHT proteins cannot be determined from our data. Reversible cysteine oxidations include sulfenic acids, S-nitrosocysteines, protein disulfide bridges, or glutathionylated cysteines. The lower levels of GSH and upregulation of GST may indicate high levels of protein glutathionylation as a mechanism to protect against brevetoxin induced oxidative stress.
Recently, there has been significant interest and effort focused on red tide suppression or mitigation, including the Florida red tide [69,70]. An intricate understanding of the unique biochemistry of these harmful algae would support these efforts. The AOX is common in protists and is in fact, the terminal oxidase of the Trypanosome parasite Trypanosoma brucei brucei which is responsible for African sleeping sickness. As such, it has been identified as a drug target for treatment of the disease and numerous AOX inhibitors have been discovered [56], including ascofuranone, a fungal derived terpene. Our discovery of enhanced AOX production suggests that KbHT is reacting to the more oxidized redox state of the cell associated with the presence of brevetoxin and as such, may be more sensitive to AOX inhibitors than KbLT. This discovery offers a novel approach to mitigation of the Florida red tide by selectively targeting high toxin producing strains with AOX inhibitors or the appropriate fungi.
Polyketides are constructed from the sequential condensation of carboxylic acid units, extending the growing carbon chain by 2 carbons at time. Polyketide synthases can be composed of single-function multienzyme complexes that act on growing polyketides by passing intermediate substrates between individual enzymes. On the other hand, large multidomain/multimodular enzymes pass the growing intermediate intermediates along sequential modules in an assembly line fashion. The products of multimodular PKSs can often be predicted based on module order. Conversely, the sequence of modules may be predicted by inspection of the polyketide structure. Recently, two multimodular gigasynthases have been identified in the haptophyte algae Prymnesium parvum [71]. The 56 modules of PKZILLA-1 and-2, align with the predicted architecture and are believed to be responsible for the construction of the ladder frame polyether prymnesins. The size and complex structure of dinoflagellate derived ladder frame polyethers suggest that they may also express similar giant PKSs. Early studies in dinoflagellates identified numerous transcripts encoding single function PKS enzymes. More recently, multidomain/multimodular transcripts have been identified in K. brevis, Symbiodinium minutim, and in the ciguatoxin producing G. polynesiensis [34,40,77]. None of these, however, compare to the size of the PKZILLAs or can fully account for the biosynthesis of brevetoxins or ciguatoxins. Our custom proteome, which was generated from the translation of transcriptome libraries obtained through sort read sequencing [64] holds no multi-domain PKSs on the order of the PKZILLAs, therefore could not have been identified in our dataset. Nonetheless, many single domain or small multi-domain K. brevis PKSs were found to be significantly more abundant in KbHT. None of these would be sufficient for complete brevetoxin assembly under the PKZILLA model. This suggests that, unlike prymnesins, brevetoxins are constructed by a complex of interacting, multiple and/or single domain enzymes. Alternatively, that the small multi-domain and single domain PKSs from K. brevis transcriptome libraries belong to one or more large multidomain enzymes, illustrating the challenges of assembling long repetitive transcripts from short read sequences.
The identification and analysis of the PKZILLAs was facilitated by the mining of a complete P. parvum genome assembly where PKZILLAs were found. Unfortunately, even a draft genome of K. brevis is unlikely to appear soon and predicting how multiple PKS enzymes interact to coordinate the assembly of large polyketide products is not possible using transcriptomics alone. The differentially abundant PKSs identified in this work represent excellent leads for pursuing the biosynthetic pathway for the brevetoxins or other K. brevis derived polyketides at the protein level. Affinity enrichment or pulldown experiments may allow us to piece together the enzymes responsible for brevetoxin biosynthesis.
Proteomic studies of K. brevis are severely limited by the lack of a reference genome, or an annotated reference proteome and we fully acknowledge this limitation. At the time of this writing, 71,931 K. brevis proteins can be found in the NCBI database and 68,945 are described as “unnamed protein”. Lacking a reference proteome, reliable statistical analysis by categorical groupings is difficult if not impossible. Fewer than half of the proteins that appear in our dataset could be annotated and our limited annotation of the proteome is based on in silico comparisons. Highly conserved proteins are likely to be annotated correctly. Arguably, less conserved proteins may be annotated incorrectly and enzymes with highly conserved domains could be misidentified. For example, proteins annotated as glutaredoxin or protein disulfide isomerase (PDI) might in fact be Trx, both of which contain a highly conserved thioredoxin-fold [72] and function by thiol-disulfide exchange. The assessment of pathway enrichment applies statistical tests that rely on the definition of background genes or proteins for comparison. All annotated proteins or genes are often used as default but when background data includes only a subset of all proteins, the inflation of p-values may result in false-positive identifications. To complicate matters further, each of the proteins potentially can have multiple annotation terms. The choice of terms to be used in the enrichment analysis can significantly shift the outcome and is not a trivial decision. Nonetheless, we are confident in our PKS annotations and the 1D enrichment analysis relies only on accurate annotation of the specific group in question and not necessarily accurate annotation of background proteins.
Our K. brevis cultures are unialgal but not axenic: they do contain associated bacteria. We are confident that the identified PKSs originate from K. brevis and not from bacteria. The twenty-seven PKSs identified in this work that are common with those reported by Van Dolah were placed within a monophyletic clade of protist PKSs by phylogenetic analysis [34]. Among those unique to this study, a BLASTp [73] search against the NCBI bacteria (Taxid: 2) and the SAR supergroup (taxid:2698737) databases was performed for each PKS protein. The distance tree generated from the top-scoring hits (via NCBI’s default Fast Minimum Evolution method) revealed that the query PKSs grouped exclusively within a clade of dinoflagellate sequences. Notably, no close relationship was observed with bacterial sequences, which formed a separate and distinct branch. Distinct bacterial communities have been reported in toxic and non-toxic dinoflagellate strains [66] and others have reported stimulation or suppression of toxins by associated bacteria [74]. However, we have not yet assessed KbHT and KbLT for differences in the associated bacterial communities.
While there are limitations to what we can currently learn from proteomics experiments on non-model organisms, the demonstration of a massive shift in redox state of the proteome and the large percentage of DAPs between high and low toxin strains of K. brevis does not require a fully annotated proteome to be meaningful. These findings highlight the profound biochemical impact of brevetoxins and suggest an important functional role. The identification of differentially abundant PKSs offers valuable leads for probing the biosynthesis, while the enrichment of antioxidant defense proteins aligns with redox trends and previous strain comparisons, pointing to a potential strategy for selectively targeting high-toxin producers.
4. Materials and Methods
4.1. K. brevis Culture
Cultures of high and low toxin producing K. brevis (Wilson strains) were obtained from Mote Marine Laboratory (Sarasota, Florida) and maintained in L1-Si medium [75], with the exception that the NH 15 vitamin supplement [76] replaced the L-1 vitamin supplement. Cultures were diluted to 10,000 cells/ml and were maintained in a Percival growth chamber (Model I-66LLVL) at 25 °C using a 12:12 day/night cycle at 25% of full light intensity. Growth was monitored by counting cells using a Countess 3FL cell counter with a Cy5 2.0 light cube. Cells were harvested on days 13 and 17 post dilution, 4 h after the start of the daylight phase. Cell counts and growth curves are provided in the Supplementary Materials.
4.2. Brevetoxin Extraction and Liquid Chromatography–Mass Spectrometry (LC–MS) Analysis
K. brevis culture in logarithmic growth phase, was diluted to 800,000 cells/liter in filtered, ozonated seawater. Brevetoxins were extracted from subsamples according to previously described methods [69]. Briefly, 50 ml aliquots of diluted culture were passed through Strata C-18-E cartridges (Phenomenex, Torrance, CA, USA) using a PromoChrom SPE-O3 automated sample preparation system (PromoChrom, Cincinnati, OH, USA) and analytes were eluted with LCMS-grade methanol. Extracts were concentrated by evaporation under ultra-high purity nitrogen stream at 40°C, reconstituted in 100% LCMS-grade methanol, and syringe-filtered using 0.2 um polytetrafluoroethylene (PTFE) chromatography syringe filters (Cole-Palmer, Vernon Hills, IL) into glass autosampler vials. Extracts were stored at -20°C until analysis. Brevetoxin congeners (BTX-1, BTX-2 and BTX-3) were quantified by HPLC-MS/MS analysis using a Vanquish HPLC system coupled to a TSQ Quantis triple quadrupole mass spectrometer equipped with an electrospray interface (LC/ESI/MS/MS) (Thermo Fisher Scientific Inc., Waltham, MA, USA). Reference standards for BTX-1, BTX-2 and BTX-3 (MARBIONC University of North Carolina, Wilmington, NC, USA) were used for instrument calibration and method quality assurance. The results of toxin analysis are included in the Supplementary Materials (Table S2).
4.3. Peptide Isolation and Labeling
Cells were harvested in 50 ml falcon tubes by centrifugation of culture at 800xg for 10 min. Protein isolation, digestion and labeling with iodoTMT reagents was previously described [46]. Briefly, four biological replicate samples of KbHT and KbLT were prepared according to the workflow in Figure 2B. Proteins are labeled before and again after reduction of oxidized cysteines with TCEP using TMT reagents having a different isotope distribution across the reporter and equalizer. Peptides for amine reactive TMT labeling were prepared using the EasyPep MS sample prep kit according to the manufacturer’s instruction. Five replicates each of KbHT and KbLT were prepared. Pellets were resuspended in 100 μl of the provided lysis buffer. Proteins were quantified prior to digestion using Bradford reagent against a standard curve of BSA. Typical protein concentrations were in the range of 0.5 – 1 mg/ml and 100 μg of protein from each sample was digested. A reference channel consisted of a pooled sample of each (100 µg total or 10 μg each) of the ten samples. Peptides were quantified after digestion using the Pierce Quantitative Colorimetric Peptide Assay kit according to the manufacturer’s instructions and 70 μg of each peptide sample was labeled. Peptides were labeled with amine reactive TMT reagents using the TMT10plex Isobaric Label Reagent Set plus TMT-131C for the reference channel. KbHT was labeled with 126, 127N, 127C, 128N and 129N. KbLT was labeled with 128C, 129C, 130C, 130N, 131N. After labeling, samples were pooled into a single sample, and the pooled sample was separated into eight fractions using the Pierce High pH Reversed-Phase Peptide Fractionation kit.
4.4. Liquid Chromatography–Mass Spectrometry (LC–MS) Analysis of Labeled Peptide Samples
Samples were reconstituted in a 2% acetonitrile, 0.1% TFA buffer and diluted such that ~1 μg of peptides were injected per sample or per fraction. Peptides were analyzed on a Thermo Orbitrap Eclipse MS system coupled to an Ultimate 3000 RSLC-Nano liquid chromatography system. Samples were injected onto a 75 um i.d., 75-cm long EasySpray column (Thermo) and eluted with a gradient (from 1-28% buffer B over 180 min and from 28-45% buffer B in 25 minutes for iodoTMT labeled samples or from 0-28% buffer B for TMT labeled samples), at a flow rate of 250 nL/min. Buffer A contained 2% (v/v) ACN and 0.1% formic acid in water, and buffer B contained 80% (v/v) ACN, 10% (v/v) trifluoroethanol, and 0.1% formic acid in water. Spectra were continuously acquired in a data-dependent manner throughout the gradient, acquiring a full scan in the Orbitrap (at 120,000 resolution with a standard AGC target) followed by MS/MS scans on the most abundant ions in 2.5 s in the ion trap (turbo scan type with an intensity threshold of 5,000, CID collision energy of 35%, standard AGC target, maximum injection time of 35 ms, and isolation width of 0.7 m/z). Charge states from 2-6 were included. Dynamic exclusion was enabled with a repeat count of 1 and an exclusion duration of 25 s and an exclusion mass width of ± 10 ppm. Real-time search was used for selection of up to 10 MS2 peaks for SPS-MS3 analysis, in the Orbitrap at a resolution of 50,000, HCD collision energy of 65% (TMT labeled) or a resolution of 30,000, HCD collision energy of 58% (iodoTMT labeled) and a scan range of 100–500.
Raw MS data files from the eight TMT fractions were merged and protein identification and quantification were done using Proteome Discoverer v.3.0 (Thermo) for TMT samples or v.2.4 (Thermo) for iodoTMT samples, analyzed against the K. brevis translated transcriptome database [64]. Both Comet and SequestHT with INFERYS Rescoring were used. Carbamidomethylation (+57.0215) of cysteine and TMT reagent (+229.1629) of lysine and peptide N-termini or iodoTMT (+229.1629) of cysteine were used as static modifications and oxidation (+15.9949) of methionine was used as a variable modification for both sets of labeled peptides. Up to 2 (TMT labeled) or 3 (iodoTMT labeled) missed tryptic cleavage were allowed.
4.5. Functional Annotation of the Identified Proteins
Protein sequences derived from the six-frame translation of the K. brevis Wilson strain transcriptome library [77] with stop codons removed, were annotated by CD Genomics using the eggNOG mapper tool [78]. From the transcriptome library containing over 80,000 sequences, 519,481 translated protein sequences were obtained of which 11,487 could be annotated. Among the 5,044 proteins identified in our dataset, 1655 were annotated using eggNOG mapper and another 434 were annotated by submitting the protein sequence to NCBI BLASTp against the SAR (stramenopiles, alveolates, and rhizarians; taxid:2698737) supergroup [73]. Annotations were made when a protein was identified in three or more genera, with an E-value of <10E-9 and >50% query coverage. In total 2,089 sequences were annotated, while 1,941 were assigned a COG classification, 1,635 to a Pfam classification, 1,200 were assigned a KO term and 948 were assigned to a KEGG pathway. To this database were added translations of all K. brevis PKS transcripts reported by Van Dolah [34].
4.6. Analysis of Proteomic Data
For iodo-TMT samples redox stoichiometry for each protein was calculated by dividing summed reporter ion intensities for the light label of each protein (reduced cysteines) by the sum of reporter ion intensities of both labels (total cysteines) for each individual protein. Redox stoichiometry values were used as input for Perseus. Fold change in redox stoichiometry is expressed as KbHT/KbLT. p-values were calculated using students t-test in Excel (two-tailed, homoscedastic) and in Perseus.
For TMT samples, reporter ion intensities for all peptides matched to each respective protein were summed to create total protein intensities. The intensities of 18 proteins that were identified as chlorophyll A/B binding protein (LHCII) were summed to a single line prior to analysis. Either due to low protein yield or inefficient labeling, one channel (129N KbHT) had a summed reporter intensity that was two orders of magnitude lower than the other channels, with more than half of the proteins were missing. This channel was dropped from the analysis. Reporter intensities for the remaining channels were multiplied by global scaling factors specific to each channel such that all total channel intensities were equal.
Scaled reporter intensities served as input for Perseus. Intensities were log2 transformed and normalized by subtraction of the mean. Similar results were obtained by subtraction of the median, but the results are reported here using mean normalization. The differential abundance was calculated as difference of the average log2 protein intensities of KbHT-KbLT. P-values were calculated using t-test in Perseus and in Excel (two-tailed, homoscedastic) using the method described by Aguilan [79]. Heatmaps were produced using Perseus after Z-score normalization of the protein dataset, and minimum and maximum intensity values were represented by default green and red colors, respectively. 1D annotation enrichment analysis and Fisher’s exact tests were performed in Perseus applying a Benjamini-Hochberg FDR threshold value of 0.02.
Supplementary Materials
The following supporting information can be downloaded at the website of this paper posted on Preprints.org, Supplemental File S1: Cell counts, growth curves, toxin analysis. Supplemental File S2: K. brevis translated transcriptome .txt file (519,408 proteins). Supplemental File S3: K. brevis annotated proteins .txt file (14,859 proteins). Supplemental File S4: Perseus output that includes protein identification (Locus within the transcriptome library), DeepLoc localization, COG class, protein description, InterProScan, normalized TMT intensities, fold change, p-value (two-tailed, homoscedastic, unpaired t-test) (5,044 proteins).
Author Contributions
Conceptualization, K.R; Methodology, K.R and R.C; Formal Analysis, K.R, R.C, S.R., K.F.; Investigation, K.R, R.C, S.R., N.O., and K.F.; Resources, K.R. and K.F.; Data Curation, K.R, R.C, C.R, S.R., N.O., and K.F.; Writing – Original Draft Preparation, K.R.; Writing – Review & Editing, K.R. Visualization, K.R.; Supervision, K.R.; Project Administration, K.R.; Funding Acquisition, K.R.
Funding
This work was supported in part by NOAA grant NA22NOS4690190 and by the Water School at Florida Gulf Coast University.
Data Availability Statement
The mass spectrometry proteomics data have been deposited to the ProteomeXchange Consortium via the MassIVE partner repository and are publicly available as of the date of publication. iodoTMT samples: Accession number: MSV0000095971. TMT11plex samples: Accession number: MSV0000095972.
Acknowledgments
LC-MS/MS analysis of peptides was conducted by the University of Texas Southwestern Medical Center Proteomics Core Facility, Dallas, TX. Protein annotations were performed by CD Genomics. The authors wish to thank Dr. Vince Lovko of Mote Marine Laboratory (Sarasota, FL) for sharing K. brevis cultures and Jax Centrella and Megan D’Souza for assistance with additional protein annotations.
Conflicts of Interest
The authors declare that they have no known competing financial interests or personal relationships that could have appeared to influence the work reported in this paper. The funders had no role in the design of the study; in the collection, analyses, or interpretation of data; in the writing of the manuscript; or in the decision to publish the results.
References
- Tominack, S.A.; Coffey, K.Z.; Yoskowitz, D.; Sutton, G.; Wetz, M.S. An Assessment of Trends in the Frequency and Duration of Karenia Brevis Red Tide Blooms on the South Texas Coast (Western Gulf of Mexico). PLOS ONE 2020, 15, e0239309. [CrossRef]
- Ecotoxicology of Marine Organisms; Duarte, B., Caçador, I., Eds.; CRC Press, Taylor & Francis Group: Boca Raton, 2020; ISBN 978-1-138-03549-2.
- Bechard, A. The Economic Impacts of Harmful Algal Blooms on Tourism: An Examination of Southwest Florida Using a Spline Regression Approach. Nat. Hazards 2020, 104, 593–609. [CrossRef]
- Béchard, A. Economics Losses to Fishery and Seafood Related Businesses during Harmful Algal Blooms. Fish. Res. 2020, 230, 105678. [CrossRef]
- Patel, S.S.; Lovko, V.J.; Lockey, R.F. Red Tide: Overview and Clinical Manifestations. J. Allergy Clin. Immunol. Pract. 2020, 8, 1219–1223. [CrossRef]
- Diaz, R.E.; Friedman, M.A.; Jin, D.; Beet, A.; Kirkpatrick, B.; Reich, A.; Kirkpatrick, G.; Ullmann, S.G.; Fleming, L.E.; Hoagland, P. Neurological Illnesses Associated with Florida Red Tide (Karenia Brevis) Blooms. Harmful Algae 2019, 82, 73–81. [CrossRef]
- Hort, V.; Abadie, E.; Arnich, N.; Dechraoui Bottein, M.-Y.; Amzil, Z. Chemodiversity of Brevetoxins and Other Potentially Toxic Metabolites Produced by Karenia Spp. and Their Metabolic Products in Marine Organisms. Mar. Drugs 2021, 19, 656. [CrossRef]
- Lekan, D.K.; Tomas, C.R. The Brevetoxin and Brevenal Composition of Three Karenia Brevis Clones at Different Salinities and Nutrient Conditions. Harmful Algae 2010, 9, 39–47. [CrossRef]
- Jeglitsch, G.; Rein, K.; Baden, D.G.; Adams, D.J. Brevetoxin-3 (PbTx-3) and Its Derivatives Modulate Single Tetrodotoxin-Sensitive Sodium Channels in Rat Sensory Neurons. J. Pharmacol. Exp. Ther. 1998, 284, 516–525.
- Cohen, J.H.; Tester, P.A.; Forward, R.B. Sublethal Effects of the Toxic Dinoflagellate Karenia Brevis on Marine Copepod Behavior. J. Plankton Res. 2007, 29, 301–315. [CrossRef]
- Hong, J.; Talapatra, S.; Katz, J.; Tester, P.A.; Waggett, R.J.; Place, A.R. Algal Toxins Alter Copepod Feeding Behavior. PLoS ONE 2012, 7, e36845. [CrossRef]
- Waggett, R.; Hardison, D.; Tester, P. Toxicity and Nutritional Inadequacy of Karenia Brevis: Synergistic Mechanisms Disrupt Top-down Grazer Control. Mar. Ecol. Prog. Ser. 2012, 444, 15–30. [CrossRef]
- Kubanek, J.; Hicks, M.K.; Naar, J.; Villareal, T.A. Does the Red Tide Dinoflagellate Karenia Brevis Use Allelopathy to Outcompete Other Phytoplankton? Limnol. Oceanogr. 2005, 50, 883–895. [CrossRef]
- Poulson-Ellestad, K.; Mcmillan, E.; Montoya, J.P.; Kubanek, J. Are Offshore Phytoplankton Susceptible to Karenia Brevis Allelopathy? J. Plankton Res. 2014, 36, 1344–1356. [CrossRef]
- Poulson-Ellestad, K.L.; Jones, C.M.; Roy, J.; Viant, M.R.; Fernández, F.M.; Kubanek, J.; Nunn, B.L. Metabolomics and Proteomics Reveal Impacts of Chemically Mediated Competition on Marine Plankton. Proc. Natl. Acad. Sci. 2014, 111, 9009–9014. [CrossRef]
- Poulin, R.X.; Poulson-Ellestad, K.L.; Roy, J.S.; Kubanek, J. Variable Allelopathy among Phytoplankton Reflected in Red Tide Metabolome. Harmful Algae 2018, 71, 50–56. [CrossRef]
- Prince, E.K.; Myers, T.L.; Kubanek, J. Effects of Harmful Algal Blooms on Competitors: Allelopathic Mechanisms of the Red Tide Dinoflagellate Karenia Brevis. Limnol. Oceanogr. 2008, 53, 531–541. [CrossRef]
- Cassell, R.T.; Chen, W.; Thomas, S.; Liu, L.; Rein, K.S. Brevetoxin, the Dinoflagellate Neurotoxin, Localizes to Thylakoid Membranes and Interacts with the Light-Harvesting Complex II (LHCII) of Photosystem II. ChemBioChem 2015, 16, 1060–1067. [CrossRef]
- Colon, R.; Wheater, M.; Joyce, E.J.; Ste.Marie, E.J.; Hondal, R.J.; Rein, K.S. The Marine Neurotoxin Brevetoxin (PbTx-2) Inhibits Karenia Brevis and Mammalian Thioredoxin Reductases by Targeting Different Residues. J. Nat. Prod. 2021, 84, 2961–2970. [CrossRef]
- Rein, K.S.; Borrone, J. Polyketides from Dinoflagellates: Origins, Pharmacology and Biosynthesis. Comp. Biochem. Physiol. B Biochem. Mol. Biol. 1999, 124, 117–131. [CrossRef]
- Hwang, S.; Lee, N.; Cho, S.; Palsson, B.; Cho, B.-K. Repurposing Modular Polyketide Synthases and Non-Ribosomal Peptide Synthetases for Novel Chemical Biosynthesis. Front. Mol. Biosci. 2020, 7, 87. [CrossRef]
- Kang, H.-S.; Kim, E.-S. Recent Advances in Heterologous Expression of Natural Product Biosynthetic Gene Clusters in Streptomyces Hosts. Curr. Opin. Biotechnol. 2021, 69, 118–127. [CrossRef]
- Li, S.; Li, Z.; Pang, S.; Xiang, W.; Wang, W. Coordinating Precursor Supply for Pharmaceutical Polyketide Production in Streptomyces. Curr. Opin. Biotechnol. 2021, 69, 26–34. [CrossRef]
- Yang, D.; Zhou, H.; Lee, S.Y. Production of Diversified Polyketides by Metabolic Engineering. Biochemistry 2021, 60, 3424–3426. [CrossRef]
- Riaz, S.; Sui, Z.; Niaz, Z.; Khan, S.; Liu, Y.; Liu, H. Distinctive Nuclear Features of Dinoflagellates with A Particular Focus on Histone and Histone-Replacement Proteins. Microorganisms 2018, 6, 128. [CrossRef]
- Wisecaver, J.H.; Hackett, J.D. Dinoflagellate Genome Evolution. Annu. Rev. Microbiol. 2011, 65, 369–387. [CrossRef]
- Lidie, K.B.; Van Dolah, F.M. Spliced Leader RNA-Mediated Trans -Splicing in a Dinoflagellate, Karenia Brevis. J. Eukaryot. Microbiol. 2007, 54, 427–435. [CrossRef]
- Zhang, H.; Campbell, D.A.; Sturm, N.R.; Lin, S. Dinoflagellate Spliced Leader RNA Genes Display a Variety of Sequences and Genomic Arrangements. Mol. Biol. Evol. 2009, 26, 1757–1771. [CrossRef]
- Roy, S.; Jagus, R.; Morse, D. Translation and Translational Control in Dinoflagellates. Microorganisms 2018, 6, 30. [CrossRef]
- Nimmo, I.C.; Barbrook, A.C.; Lassadi, I.; Chen, J.E.; Geisler, K.; Smith, A.G.; Aranda, M.; Purton, S.; Waller, R.F.; Nisbet, R.E.R.; et al. Genetic Transformation of the Dinoflagellate Chloroplast. eLife 2019, 8, e45292. [CrossRef]
- Te, M.R.; Lohuis; Miller, D.J. Genetic Transformation of Dinoflagellates ( Amphidinium and Symbiodinium ): Expression of GUS in Microalgae Using Heterologous Promoter Constructs. Plant J. 1998, 13, 427–435. [CrossRef]
- Gornik, S.G.; Maegele, I.; Hambleton, E.A.; Voss, P.A.; Waller, R.F.; Guse, A. Nuclear Transformation of a Dinoflagellate Symbiont of Corals. Front. Mar. Sci. 2022, 9, 1035413. [CrossRef]
- Sprecher, B.N.; Zhang, H.; Lin, S. Nuclear Gene Transformation in the Dinoflagellate Oxyrrhis Marina. Microorganisms 2020, 8, 126. [CrossRef]
- Van Dolah, F.M.; Kohli, G.S.; Morey, J.S.; Murray, S.A. Both Modular and Single-domain Type I Polyketide Synthases Are Expressed in the Brevetoxin-producing Dinoflagellate, Karenia Brevis (Dinophyceae). J. Phycol. 2017, 53, 1325–1339. [CrossRef]
- Kretzschmar, A.-L. Delving into the Genetic Code of Gambierdiscus: The Devil Is in the Detail. PhD Diss., 2019. Dissertation, University of Technology: Syndey, Australia, 2019.
- Verma, A.; Kohli, G.S.; Harwood, D.T.; Ralph, P.J.; Murray, S.A. Transcriptomic Investigation into Polyketide Toxin Synthesis in Ostreopsis (Dinophyceae) Species. Environ. Microbiol. 2019, 21, 4196–4211. [CrossRef]
- Hardison, D.R.; Sunda, W.G.; Shea, D.; Litaker, R.W. Increased Toxicity of Karenia Brevis during Phosphate Limited Growth: Ecological and Evolutionary Implications. PLoS ONE 2013, 8, e58545. [CrossRef]
- Heil, C.A.; Dixon, L.K.; Hall, E.; Garrett, M.; Lenes, J.M.; O’Neil, J.M.; Walsh, B.M.; Bronk, D.A.; Killberg-Thoreson, L.; Hitchcock, G.L.; et al. Blooms of Karenia Brevis (Davis) G. Hansen & Ø. Moestrup on the West Florida Shelf: Nutrient Sources and Potential Management Strategies Based on a Multi-Year Regional Study. Harmful Algae 2014, 38, 127–140. [CrossRef]
- Errera, R.M.; Bourdelais, A.; Drennan, M.A.; Dodd, E.B.; Henrichs, D.W.; Campbell, L. Variation in Brevetoxin and Brevenal Content among Clonal Cultures of Karenia Brevis May Influence Bloom Toxicity. Toxicon 2010, 55, 195–203. [CrossRef]
- Van Dolah, F.M.; Morey, J.S.; Milne, S.; Ung, A.; Anderson, P.E.; Chinain, M. Transcriptomic Analysis of Polyketide Synthases in a Highly Ciguatoxic Dinoflagellate, Gambierdiscus Polynesiensis and Low Toxicity Gambierdiscus Pacificus, from French Polynesia. PLOS ONE 2020, 15, e0231400. [CrossRef]
- Monroe, E.A.; Johnson, J.G.; Wang, Z.; Pierce, R.K.; Van Dolah, F.M. CHARACTERIZATION AND EXPRESSION OF NUCLEAR-ENCODED POLYKETIDE SYNTHASES IN THE BREVETOXIN-PRODUCING DINOFLAGELLATE KARENIA BREVIS 1. J. Phycol. 2010, 46, 541–552. [CrossRef]
- Butterfield, D.A.; Perluigi, M. Redox Proteomics: A Key Tool for New Insights into Protein Modification with Relevance to Disease. Antioxid. Redox Signal. 2017, 26, 277–279. [CrossRef]
- Day, N.J.; Gaffrey, M.J.; Qian, W.-J. Stoichiometric Thiol Redox Proteomics for Quantifying Cellular Responses to Perturbations. Antioxidants 2021, 10, 499. [CrossRef]
- Pham, T.K.; Buczek, W.A.; Mead, R.J.; Shaw, P.J.; Collins, M.O. Proteomic Approaches to Study Cysteine Oxidation: Applications in Neurodegenerative Diseases. Front. Mol. Neurosci. 2021, 14, 678837. [CrossRef]
- Knoke, L.R.; Leichert, L.I. Global Approaches for Protein Thiol Redox State Detection. Curr. Opin. Chem. Biol. 2023, 77, 102390. [CrossRef]
- Colon, R.; Rein, K.S. Essential Components of the Xanthophyll Cycle Differ in High and Low Toxin Karenia Brevis. Harmful Algae 2021, 103, 102006. [CrossRef]
- Galperin, M.Y.; Kristensen, D.M.; Makarova, K.S.; Wolf, Y.I.; Koonin, E.V. Microbial Genome Analysis: The COG Approach. Brief. Bioinform. 2019, 20, 1063–1070. [CrossRef]
- Liao, Y.; Wang, J.; Jaehnig, E.J.; Shi, Z.; Zhang, B. WebGestalt 2019: Gene Set Analysis Toolkit with Revamped UIs and APIs. Nucleic Acids Res. 2019, 47, W199–W205. [CrossRef]
- Ødum, M.T.; Teufel, F.; Thumuluri, V.; Almagro Armenteros, J.J.; Johansen, A.R.; Winther, O.; Nielsen, H. DeepLoc 2.1: Multi-Label Membrane Protein Type Prediction Using Protein Language Models. Nucleic Acids Res. 2024, 52, W215–W220. [CrossRef]
- Cox, J.; Mann, M. 1D and 2D Annotation Enrichment: A Statistical Method Integrating Quantitative Proteomics with Complementary High-Throughput Data. BMC Bioinformatics 2012, 13, S12. [CrossRef]
- Khater, S.; Gupta, M.; Agrawal, P.; Sain, N.; Prava, J.; Gupta, P.; Grover, M.; Kumar, N.; Mohanty, D. SBSPKSv2: Structure-Based Sequence Analysis of Polyketide Synthases and Non-Ribosomal Peptide Synthetases. Nucleic Acids Res. 2017, 45, W72–W79. [CrossRef]
- Bachmann, B.O.; Ravel, J. Chapter 8 Methods for In Silico Prediction of Microbial Polyketide and Nonribosomal Peptide Biosynthetic Pathways from DNA Sequence Data. In Methods in Enzymology; Elsevier, 2009; Vol. 458, pp. 181–217 ISBN 978-0-12-374588-0.
- Paysan-Lafosse, T.; Blum, M.; Chuguransky, S.; Grego, T.; Pinto, B.L.; Salazar, G.A.; Bileschi, M.L.; Bork, P.; Bridge, A.; Colwell, L.; et al. InterPro in 2022. Nucleic Acids Res. 2023, 51, D418–D427. [CrossRef]
- Zhang, M.; Zhang, H.; Li, Q.; Gao, Y.; Guo, L.; He, L.; Zang, S.; Guo, X.; Huang, J.; Li, L. Structural Insights into the Trans -Acting Enoyl Reductase in the Biosynthesis of Long-Chain Polyunsaturated Fatty Acids in Shewanella Piezotolerans. J. Agric. Food Chem. 2021, 69, 2316–2324. [CrossRef]
- Skellam, E. Biosynthesis of Fungal Polyketides by Collaborating and Trans -Acting Enzymes. Nat. Prod. Rep. 2022, 39, 754–783. [CrossRef]
- Li, J.; Yang, S.; Wu, Y.; Wang, R.; Liu, Y.; Liu, J.; Ye, Z.; Tang, R.; Whiteway, M.; Lv, Q.; et al. Alternative Oxidase: From Molecule and Function to Future Inhibitors. ACS Omega 2024, acsomega.3c09339. [CrossRef]
- Saha, B.; Borovskii, G.; Panda, S.K. Alternative Oxidase and Plant Stress Tolerance. Plant Signal. Behav. 2016, 11, e1256530. [CrossRef]
- Vishwakarma, A.; Tetali, S.D.; Selinski, J.; Scheibe, R.; Padmasree, K. Importance of the Alternative Oxidase (AOX) Pathway in Regulating Cellular Redox and ROS Homeostasis to Optimize Photosynthesis during Restriction of the Cytochrome Oxidase Pathway in Arabidopsis Thaliana. Ann. Bot. 2015, 116, 555–569. [CrossRef]
- Jacobs, H.T.; Ballard, J.W.O. What Physiological Role(s) Does the Alternative Oxidase Perform in Animals? Biochim. Biophys. Acta BBA - Bioenerg. 2022, 1863, 148556. [CrossRef]
- Edrich, E.S.M.; Duvenage, L.; Gourlay, C.W. Alternative Oxidase – Aid or Obstacle to Combat the Rise of Fungal Pathogens? Biochim. Biophys. Acta BBA - Bioenerg. 2024, 1865, 149031. [CrossRef]
- Schnaufer, A.; Clark-Walker, G.D.; Steinberg, A.G.; Stuart, K. The F 1 -ATP Synthase Complex in Bloodstream Stage Trypanosomes Has an Unusual and Essential Function: F 1 -ATPase in Bloodstream Stage Trypanosomes. EMBO J. 2005, 24, 4029–4040. [CrossRef]
- Gelhaye, E.; Rouhier, N.; Navrot, N.; Jacquot, J.P. The Plant Thioredoxin System. Cell. Mol. Life Sci. 2005, 62, 24–35. [CrossRef]
- Geigenberger, P.; Thormählen, I.; Daloso, D.M.; Fernie, A.R. The Unprecedented Versatility of the Plant Thioredoxin System. Trends Plant Sci. 2017, 22, 249–262. [CrossRef]
- Montrichard, F.; Alkhalfioui, F.; Yano, H.; Vensel, W.H.; Hurkman, W.J.; Buchanan, B.B. Thioredoxin Targets in Plants: The First 30 Years. J. Proteomics 2009, 72, 452–474. [CrossRef]
- Chen, H.; Wang, J.; Zhuang, Y.; Yu, W.; Liu, G. Reduced Fitness and Elevated Oxidative Stress in the Marine Copepod Tigriopus Japonicus Exposed to the Toxic Dinoflagellate Karenia Mikimotoi. Antioxidants 2022, 11, 2299. [CrossRef]
- Deng, Y.; Wang, K.; Hu, Z.; Hu, Q.; Tang, Y.Z. Toxic and Non-Toxic Dinoflagellates Host Distinct Bacterial Communities in Their Phycospheres. Commun. Earth Environ. 2023, 4, 263. [CrossRef]
- Chen, W.; Colon, R.; Louda, J.W.; Del Rey, F.R.; Durham, M.; Rein, K.S. Brevetoxin (PbTx-2) Influences the Redox Status and NPQ of Karenia Brevis by Way of Thioredoxin Reductase. Harmful Algae 2018, 71, 29–39. [CrossRef]
- Lillig, C.H.; Berndt, C. Glutaredoxins in Thiol/Disulfide Exchange. Antioxid. Redox Signal. 2013, 18, 1654–1665. [CrossRef]
- Hall, E.R.; Heil, C.A.; Frankle, J.D.; Klass, S.; Devillier, V.; Lovko, V.; Toyoda, J.H.; Pierce, R. Mitigation of Karenia Brevis Cells and Brevetoxins Using Curcumin, a Natural Supplement. Water 2024, 16, 1458. [CrossRef]
- AziziHariri, P.; Hossain, I.; Burni, F.; Raghavan, S.R.; Lovko, V.J.; McLean, T.I.; John, V.T. A Simple Method to Clear Harmful Algal Blooms: Sprayable Foams with Algaecides and Flocculants. ACS EST Water 2025, acsestwater.5c00111. [CrossRef]
- Fallon, T.R.; Shende, V.V.; Wierzbicki, I.H.; Auber, R.P.; Gonzalez, D.J.; Wisecaver, J.H.; Moore, B.S. Giant Polyketide Synthase Enzymes Biosynthesize a Giant Marine Polyether Biotoxin 2024.
- Atkinson, H.J.; Babbitt, P.C. An Atlas of the Thioredoxin Fold Class Reveals the Complexity of Function-Enabling Adaptations. PLoS Comput. Biol. 2009, 5, e1000541. [CrossRef]
- Altschul, S.F.; Gish, W.; Miller, W.; Myers, E.W.; Lipman, D.J. Basic Local Alignment Search Tool. J. Mol. Biol. 1990, 215, 403–410. [CrossRef]
- Yang, X.; Liu, Z.; Zhang, Y.; Shi, X.; Wu, Z. Dinoflagellate–Bacteria Interactions: Physiology, Ecology, and Evolution. Biology 2024, 13, 579. [CrossRef]
- Hallegraeff, G.M.; Anderson, D.M.; Cembella, A.D. Manual on Harmful Marine Microalgae; Monographs on oceanographic methodology; UNESCO publ: Paris, 2003; ISBN 978-92-3-103871-6.
- Gates, J.A.; Wilson, W.B. THE TOXICITY OF GONYAULAX MONILATA HOWELL TO MUGIL CEPHALUS. Limnol. Oceanogr. 1960, 5, 171–174. [CrossRef]
- Ryan, D.E.; Pepper, A.E.; Campbell, L. De Novo Assembly and Characterization of the Transcriptome of the Toxic Dinoflagellate Karenia Brevis. BMC Genomics 2014, 15, 888. [CrossRef]
- Cantalapiedra, C.P.; Hernández-Plaza, A.; Letunic, I.; Bork, P.; Huerta-Cepas, J. eggNOG-Mapper v2: Functional Annotation, Orthology Assignments, and Domain Prediction at the Metagenomic Scale. Mol. Biol. Evol. 2021, 38, 5825–5829. [CrossRef]
- Aguilan, J.T.; Kulej, K.; Sidoli, S. Guide for Protein Fold Change and p -Value Calculation for Non-Experts in Proteomics. Mol. Omics 2020, 16, 573–582. [CrossRef]
Figure 1.
Structures of the brevetoxins.
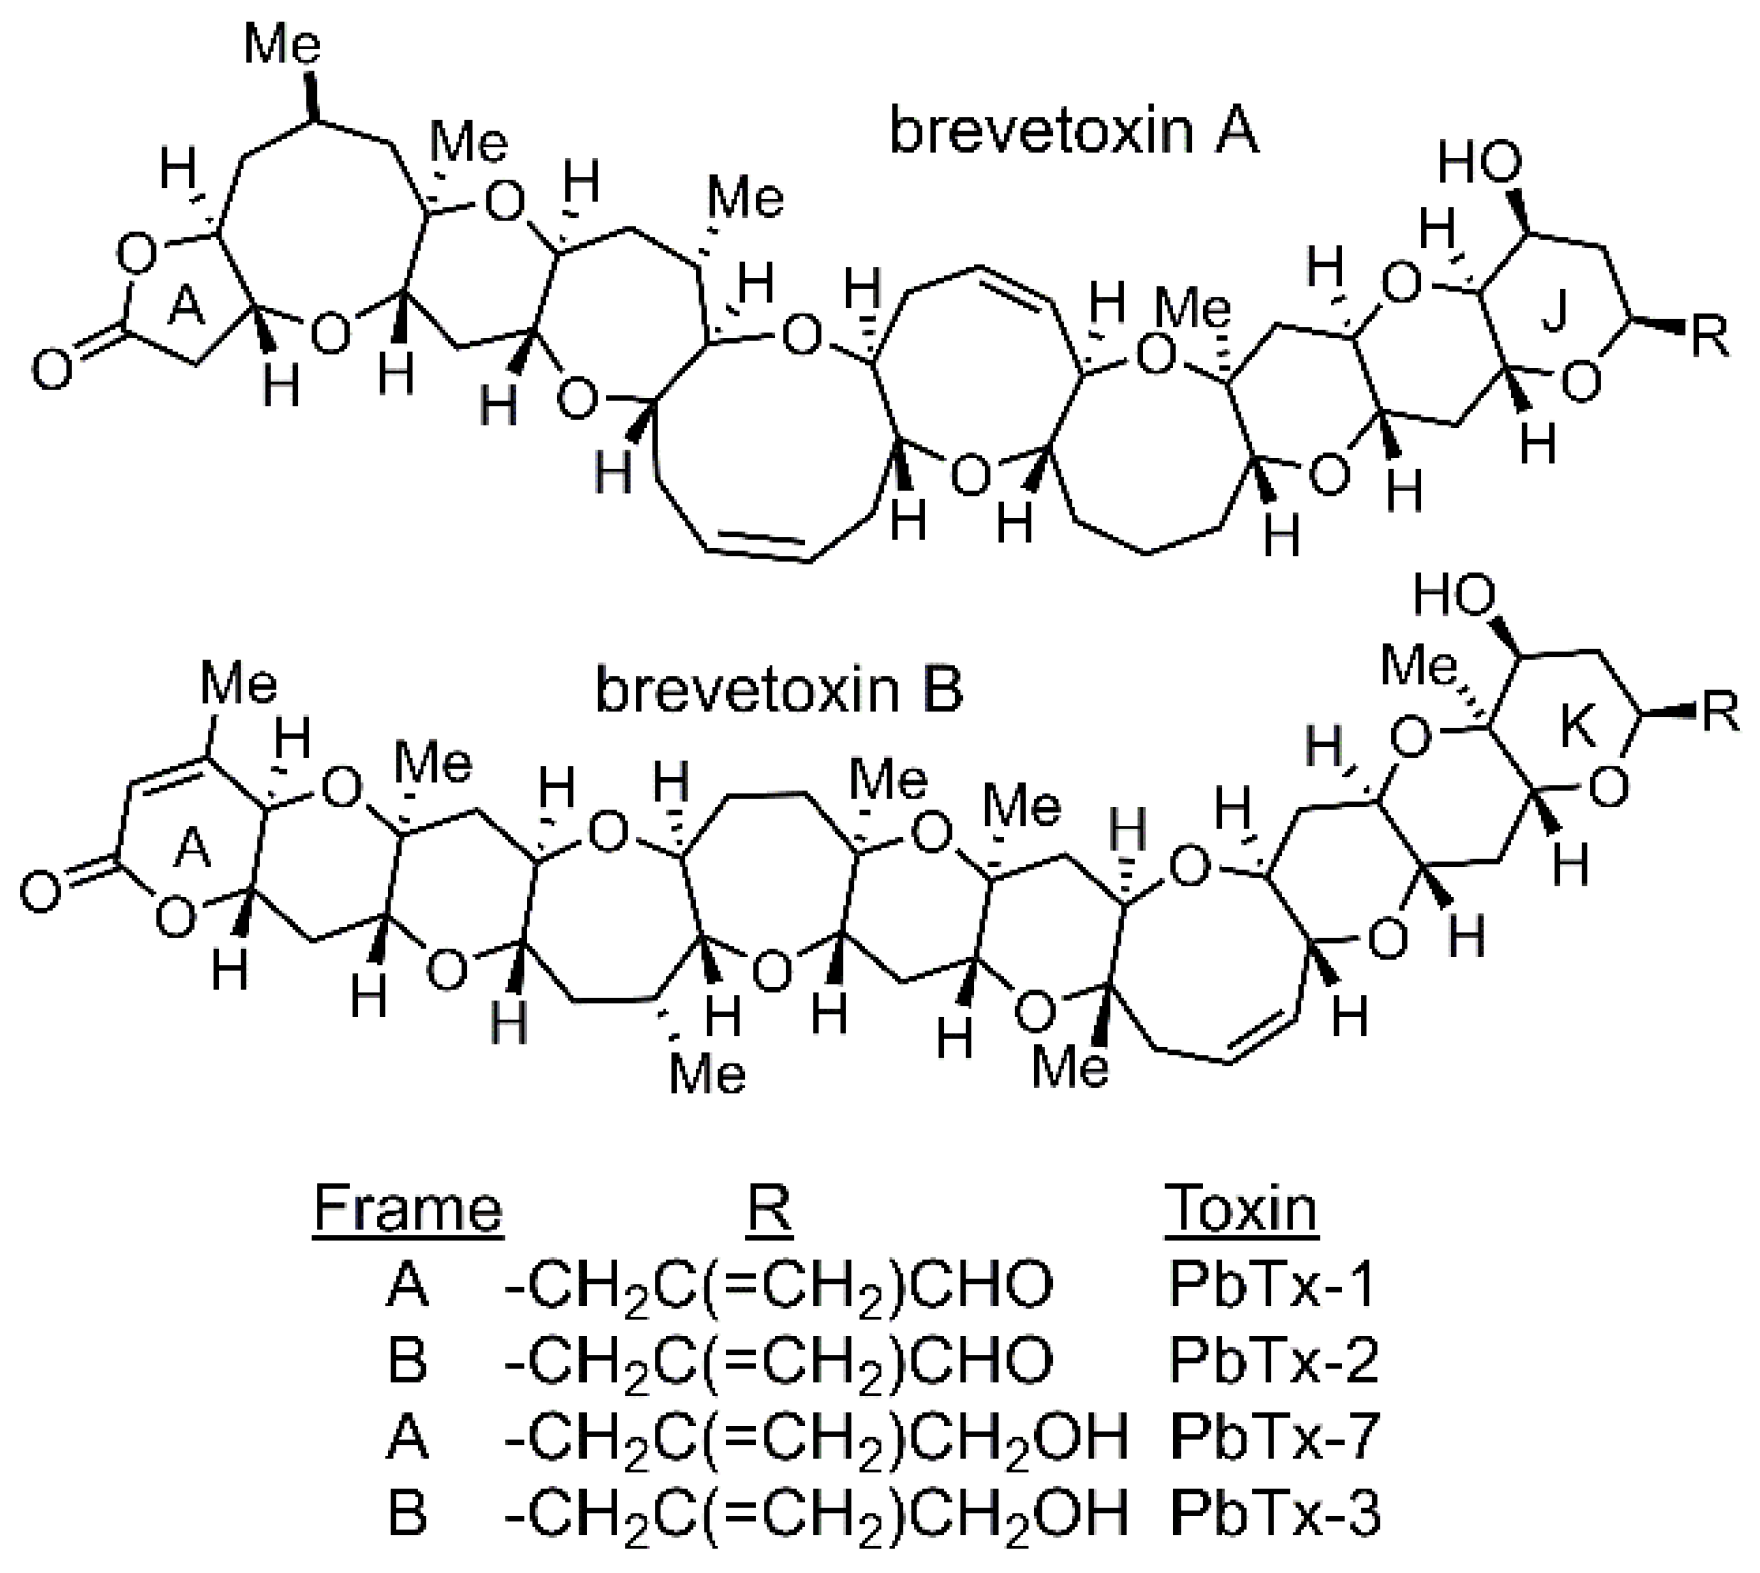
Figure 2.
(A) Isobaric iodoTMT cysteine labeling reagent. The mass of the reporter is balanced by the mass equalizer such that each label has the same nominal mass. Locations of labels are shown for TMT131 (●) and TMT126(*). (B) Redox proteomics workflow. 1. Cysteine residues were labeled with the light label. (iodoTMT126 and iodoTMT127 for KbHT and KbLT respectively). 2. Unlabeled cysteine residues were reduced with TCEP. 3. Heavy tags (iodoTMT130 and iodoTMT131 for KbHT and KbLT, respectively) were used to label newly reduced cysteine residues. 4. Equal amounts of labeled proteins (according to Bradford assay) were combined, trypsinized and purified using Immobilized anti-TMT resin (black triangles represent unlabeled peptides which will not bind to the resin). 5. Purified, labeled peptides were eluted from the resin and analyzed via LC-MS/MS. Figure modified from Colon and Rein [46].
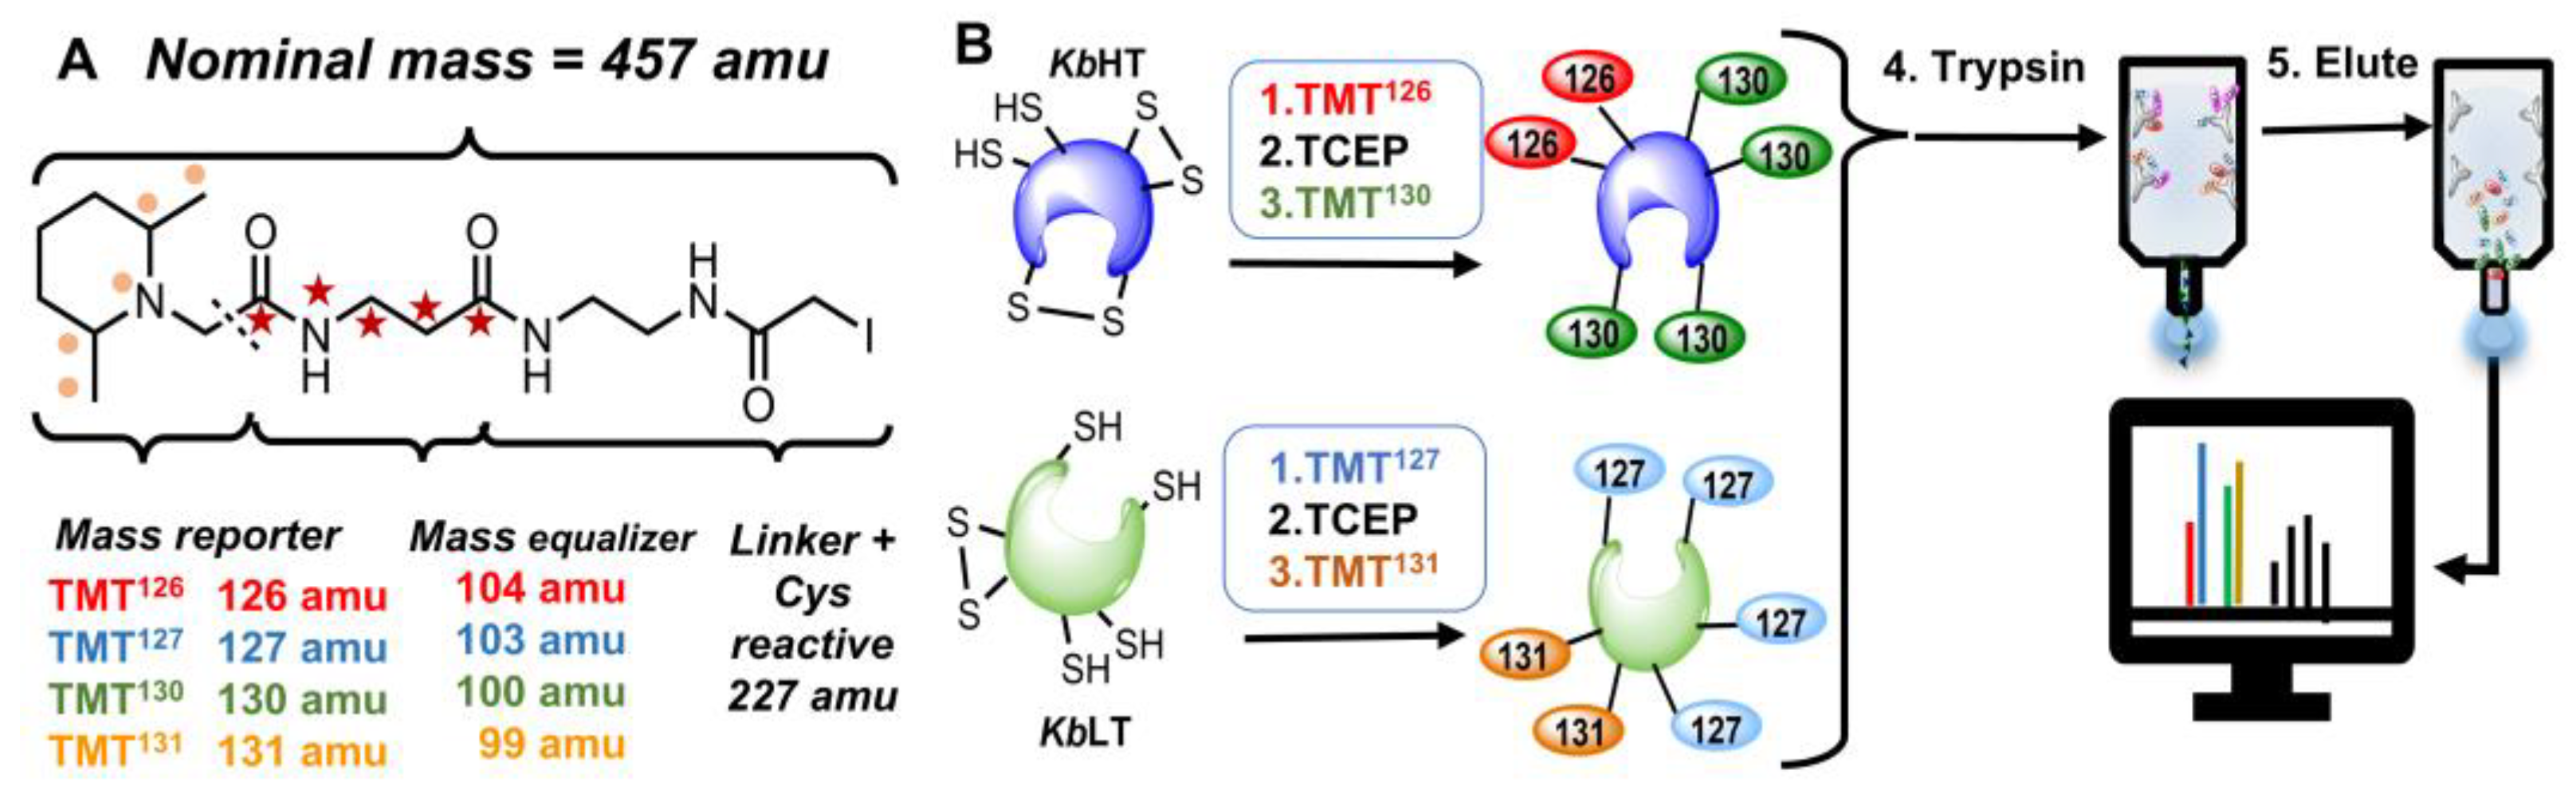
Figure 3.
(A) Multi-scatter plots of log transformed ratio of redox stoichiometry for KbHT, KbLT and KbHT/KbLT. (Pearson correlation coefficients are all ≥ 0.85). (B) Histogram of fold change of redox state for KbHT/KbLT for all proteins identified. (C) Volcano plot of log2 of fold change in redox state for KbHT/KbLT. (FDR 0.05).
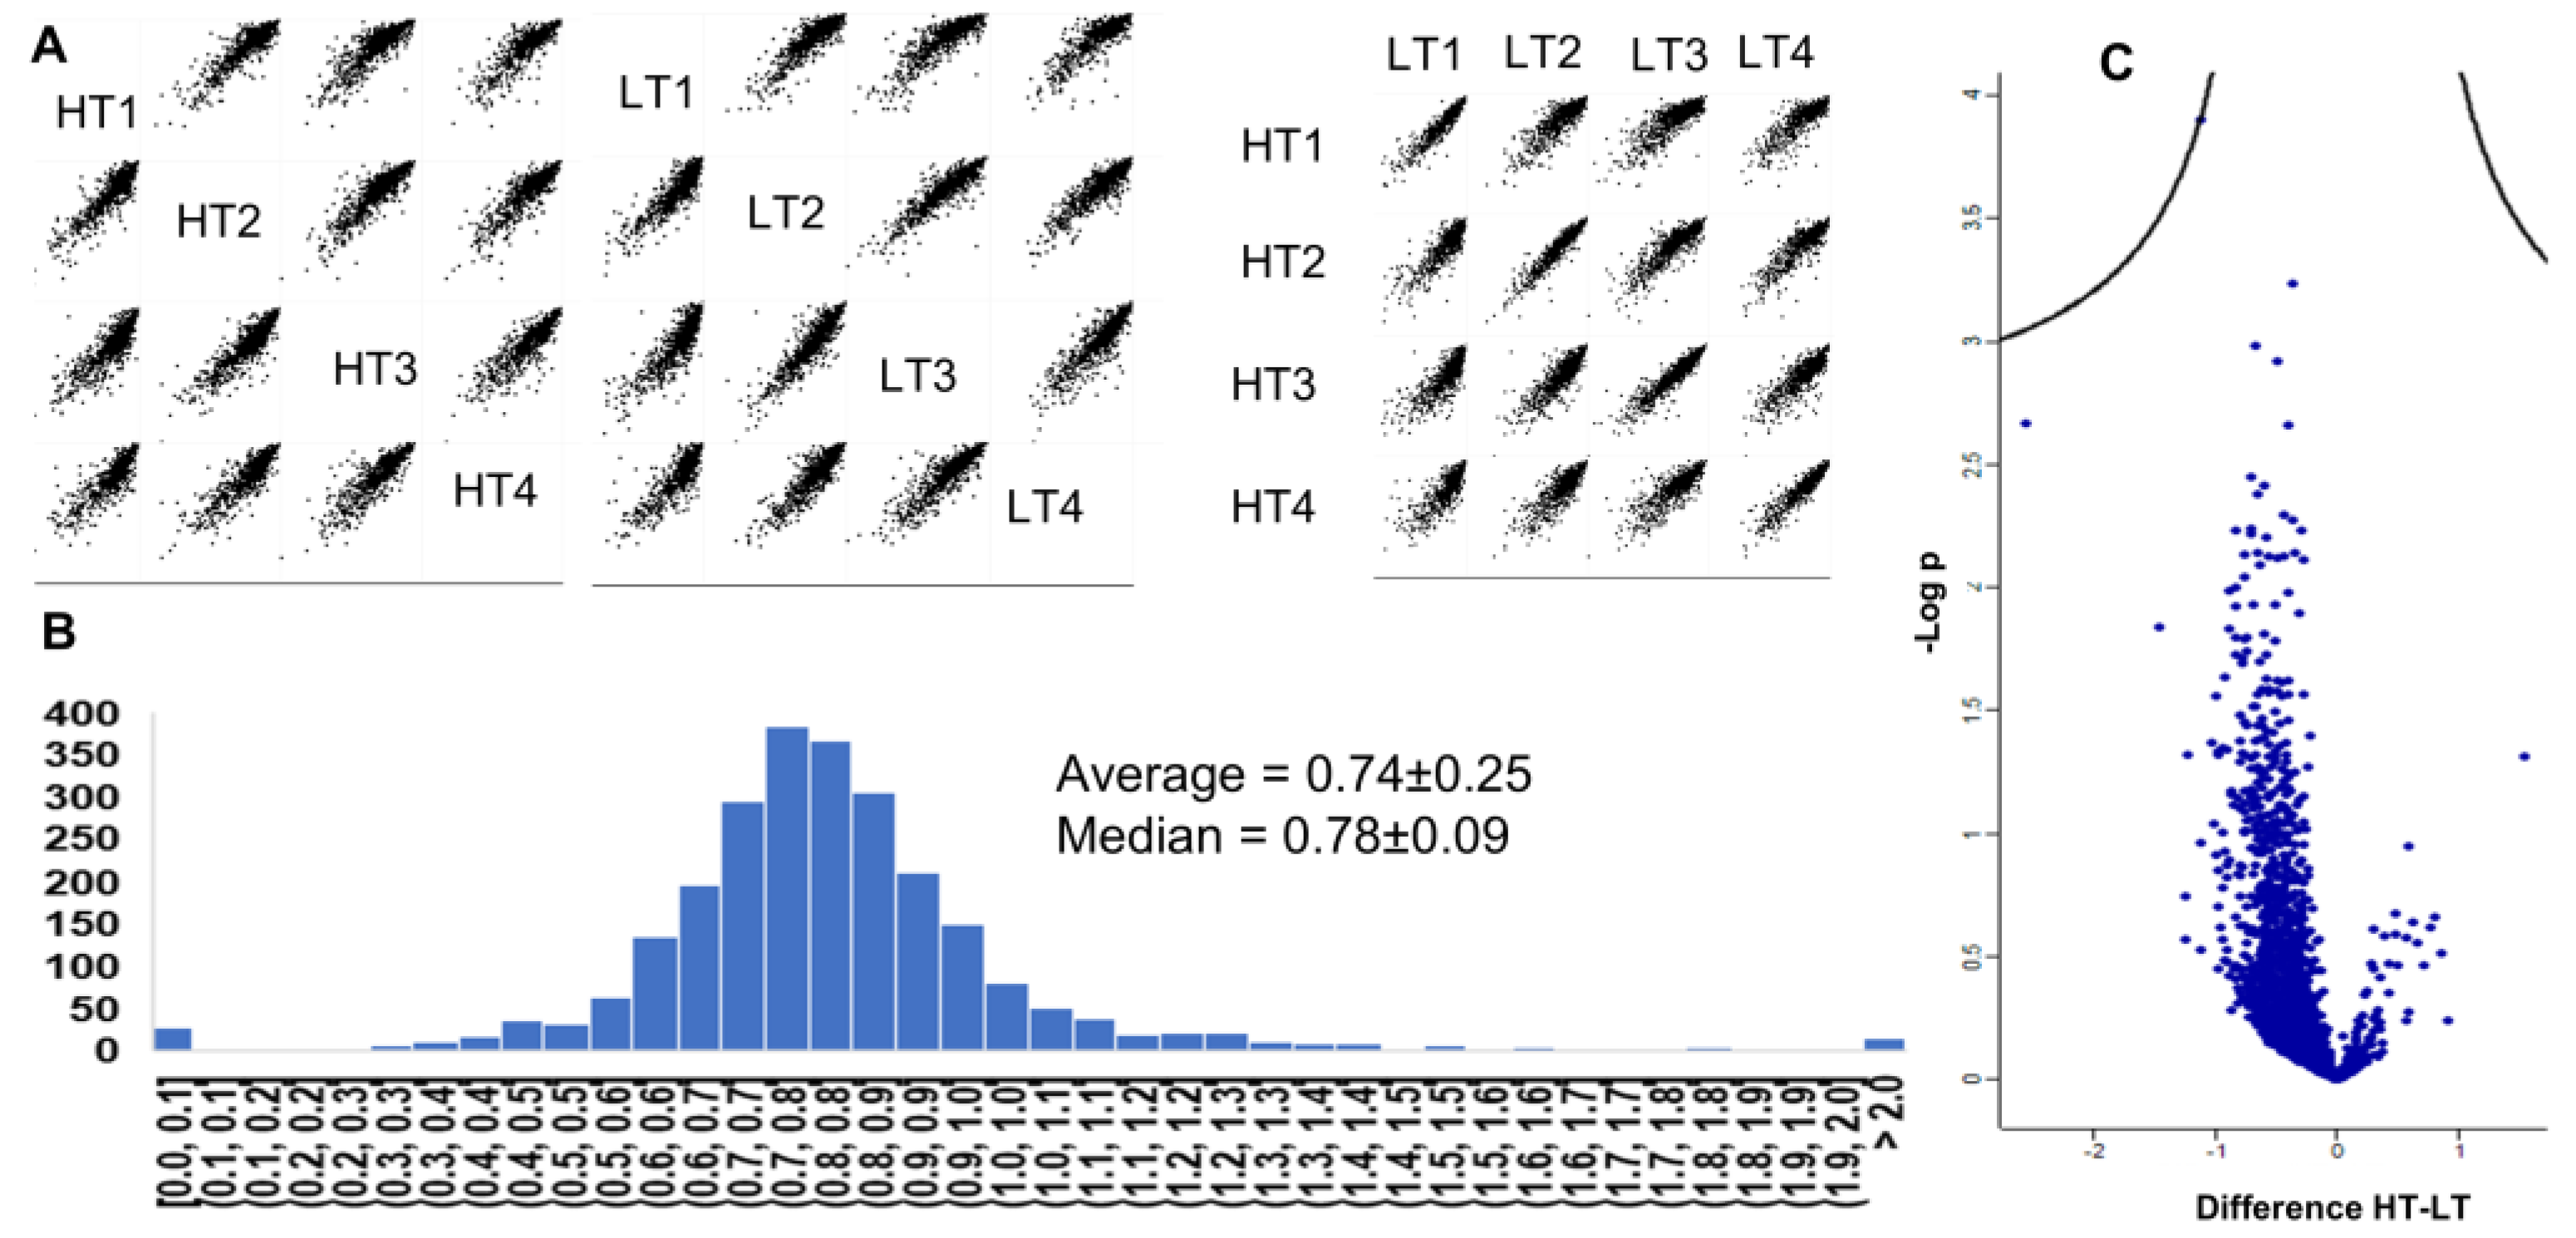
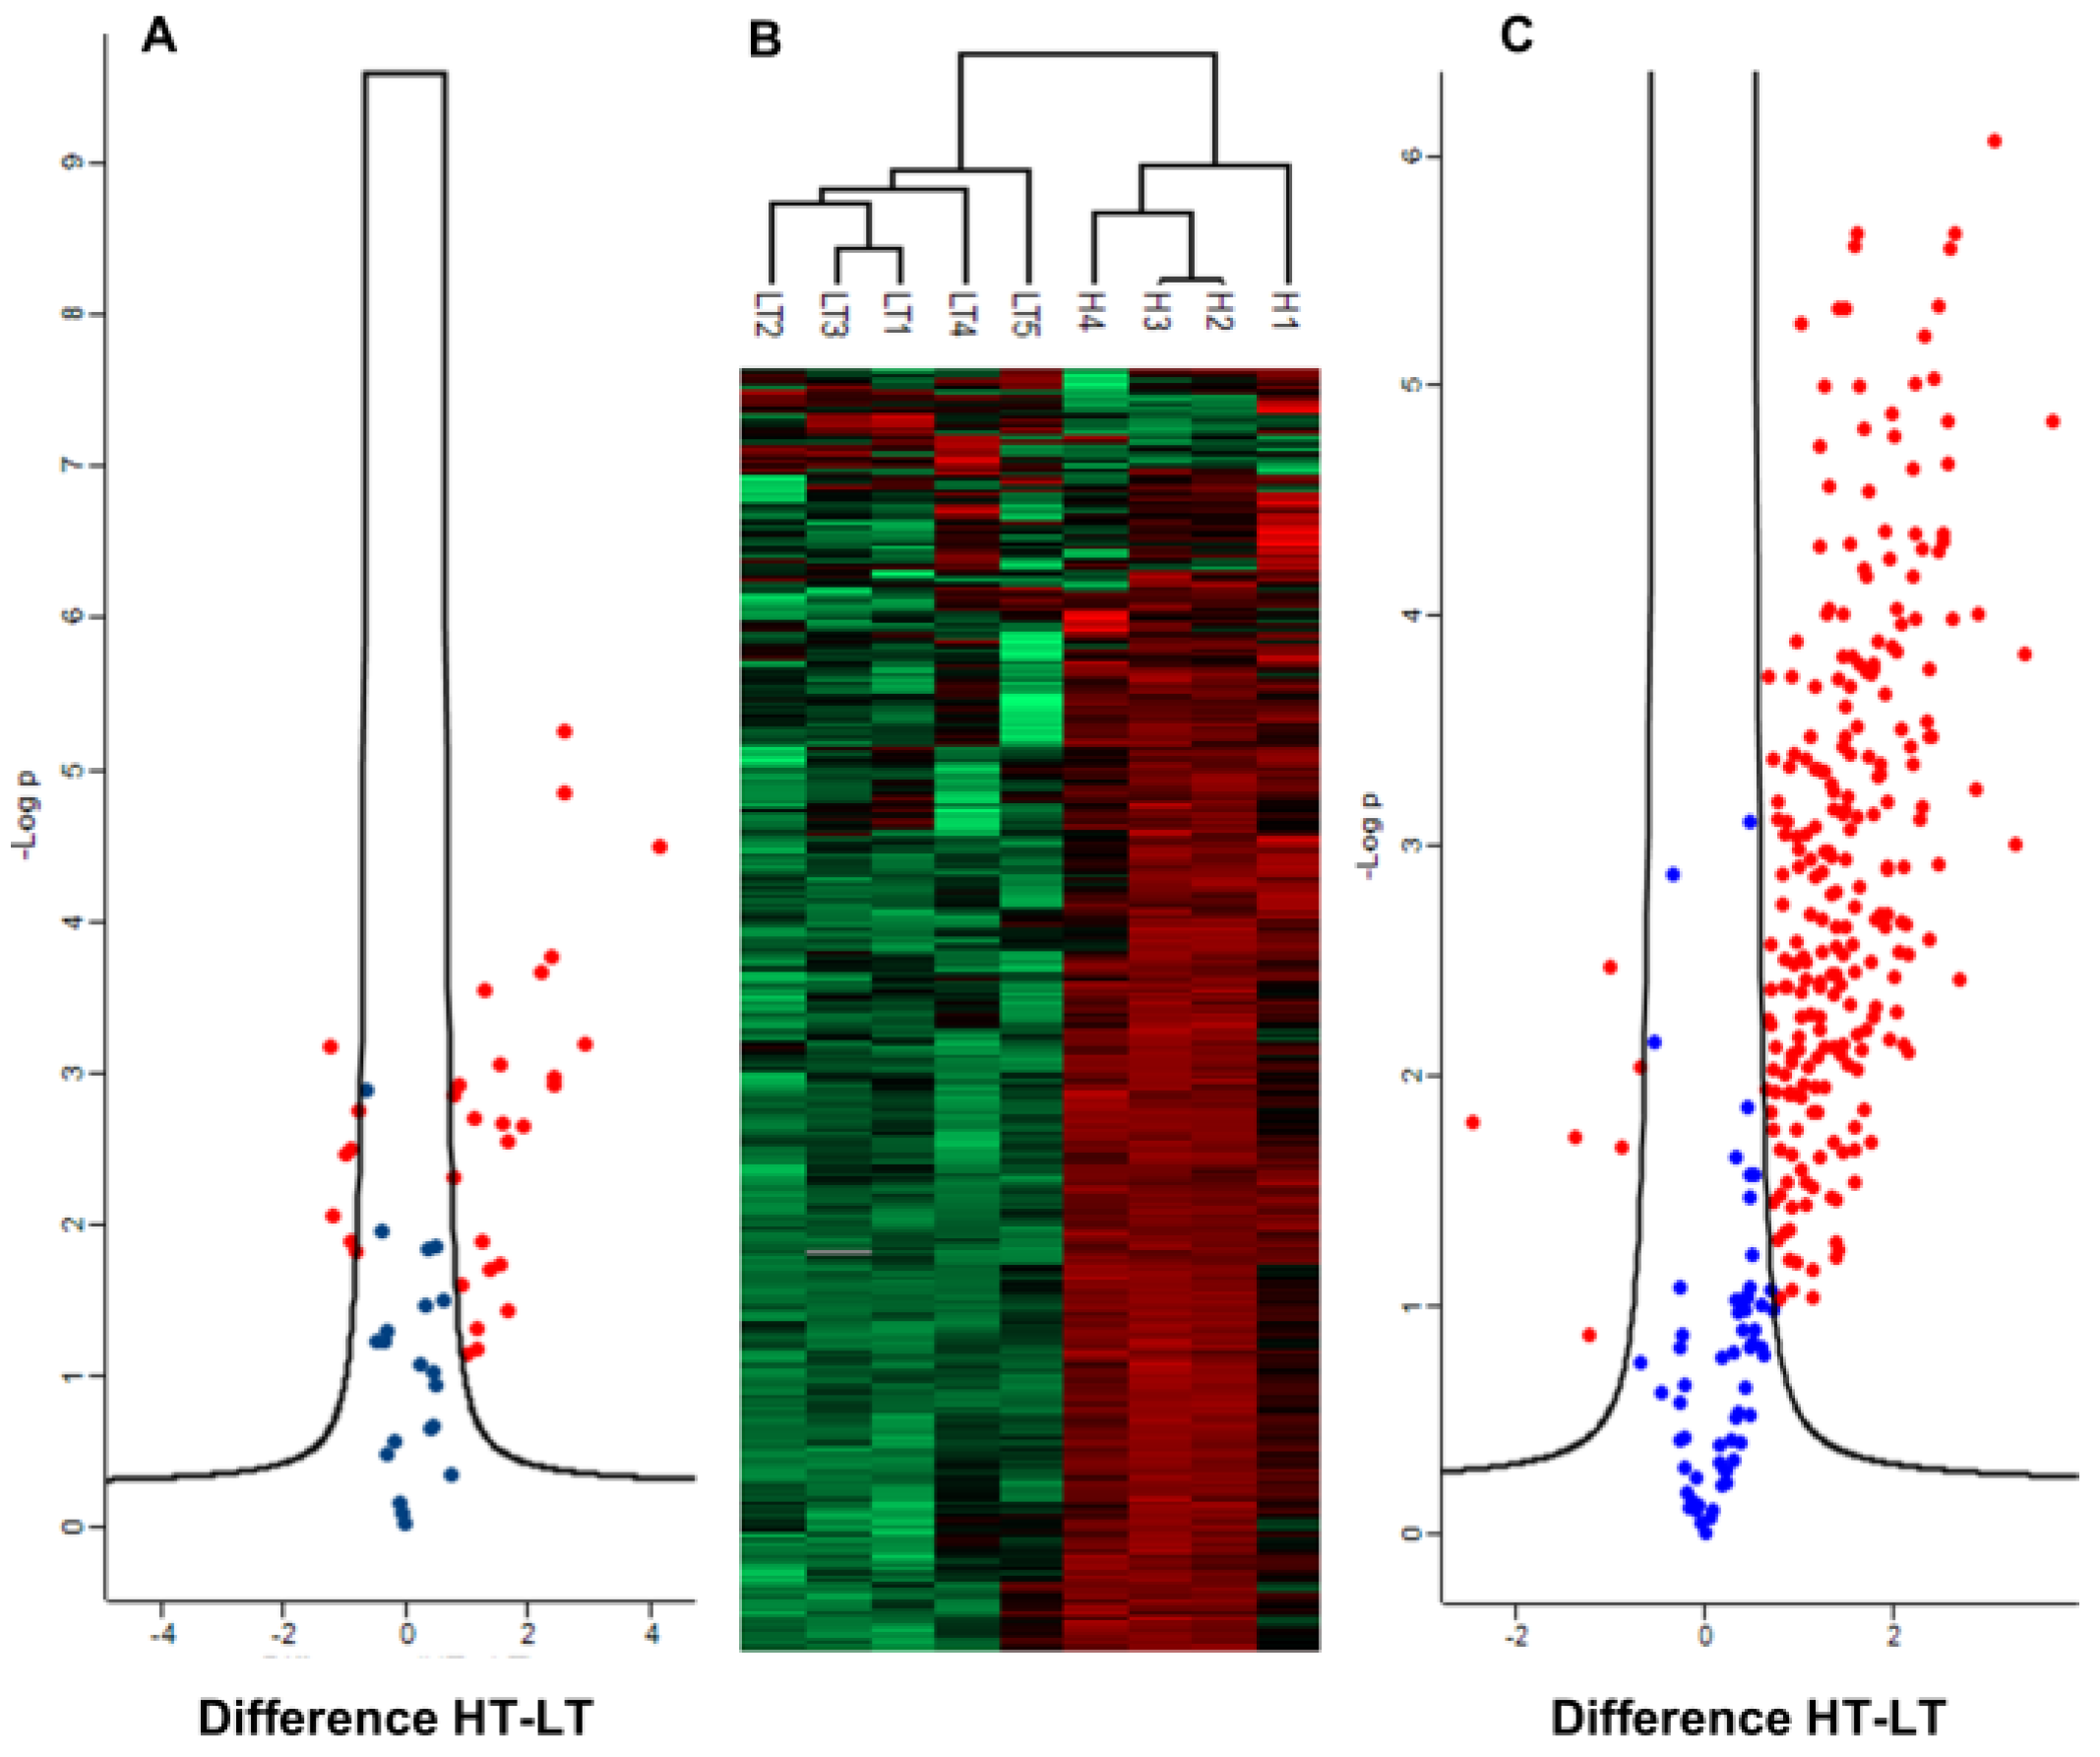
Figure 4.
A) Log-intensity histograms for KbHTand KbLT samples normalized to the mean. B) Multi-scatter plots of pairwise log-intensity distribution for all samples B1) KbLT (Pearson correlation coefficients ≥ 0.94). B2) KbHT (Pearson correlation coefficients ≥ 0.91), and B3) KbHT/KbLT (Pearson correlation coefficients >0.85). C) Volcano plot of log2 fold change KbHT/KbLT vs -log10p. (FDR 0.02, S 1.0) D) Heat map showing hierarchical clustering for all identified proteins. Red and green colors represent more and less abundant proteins respectively.
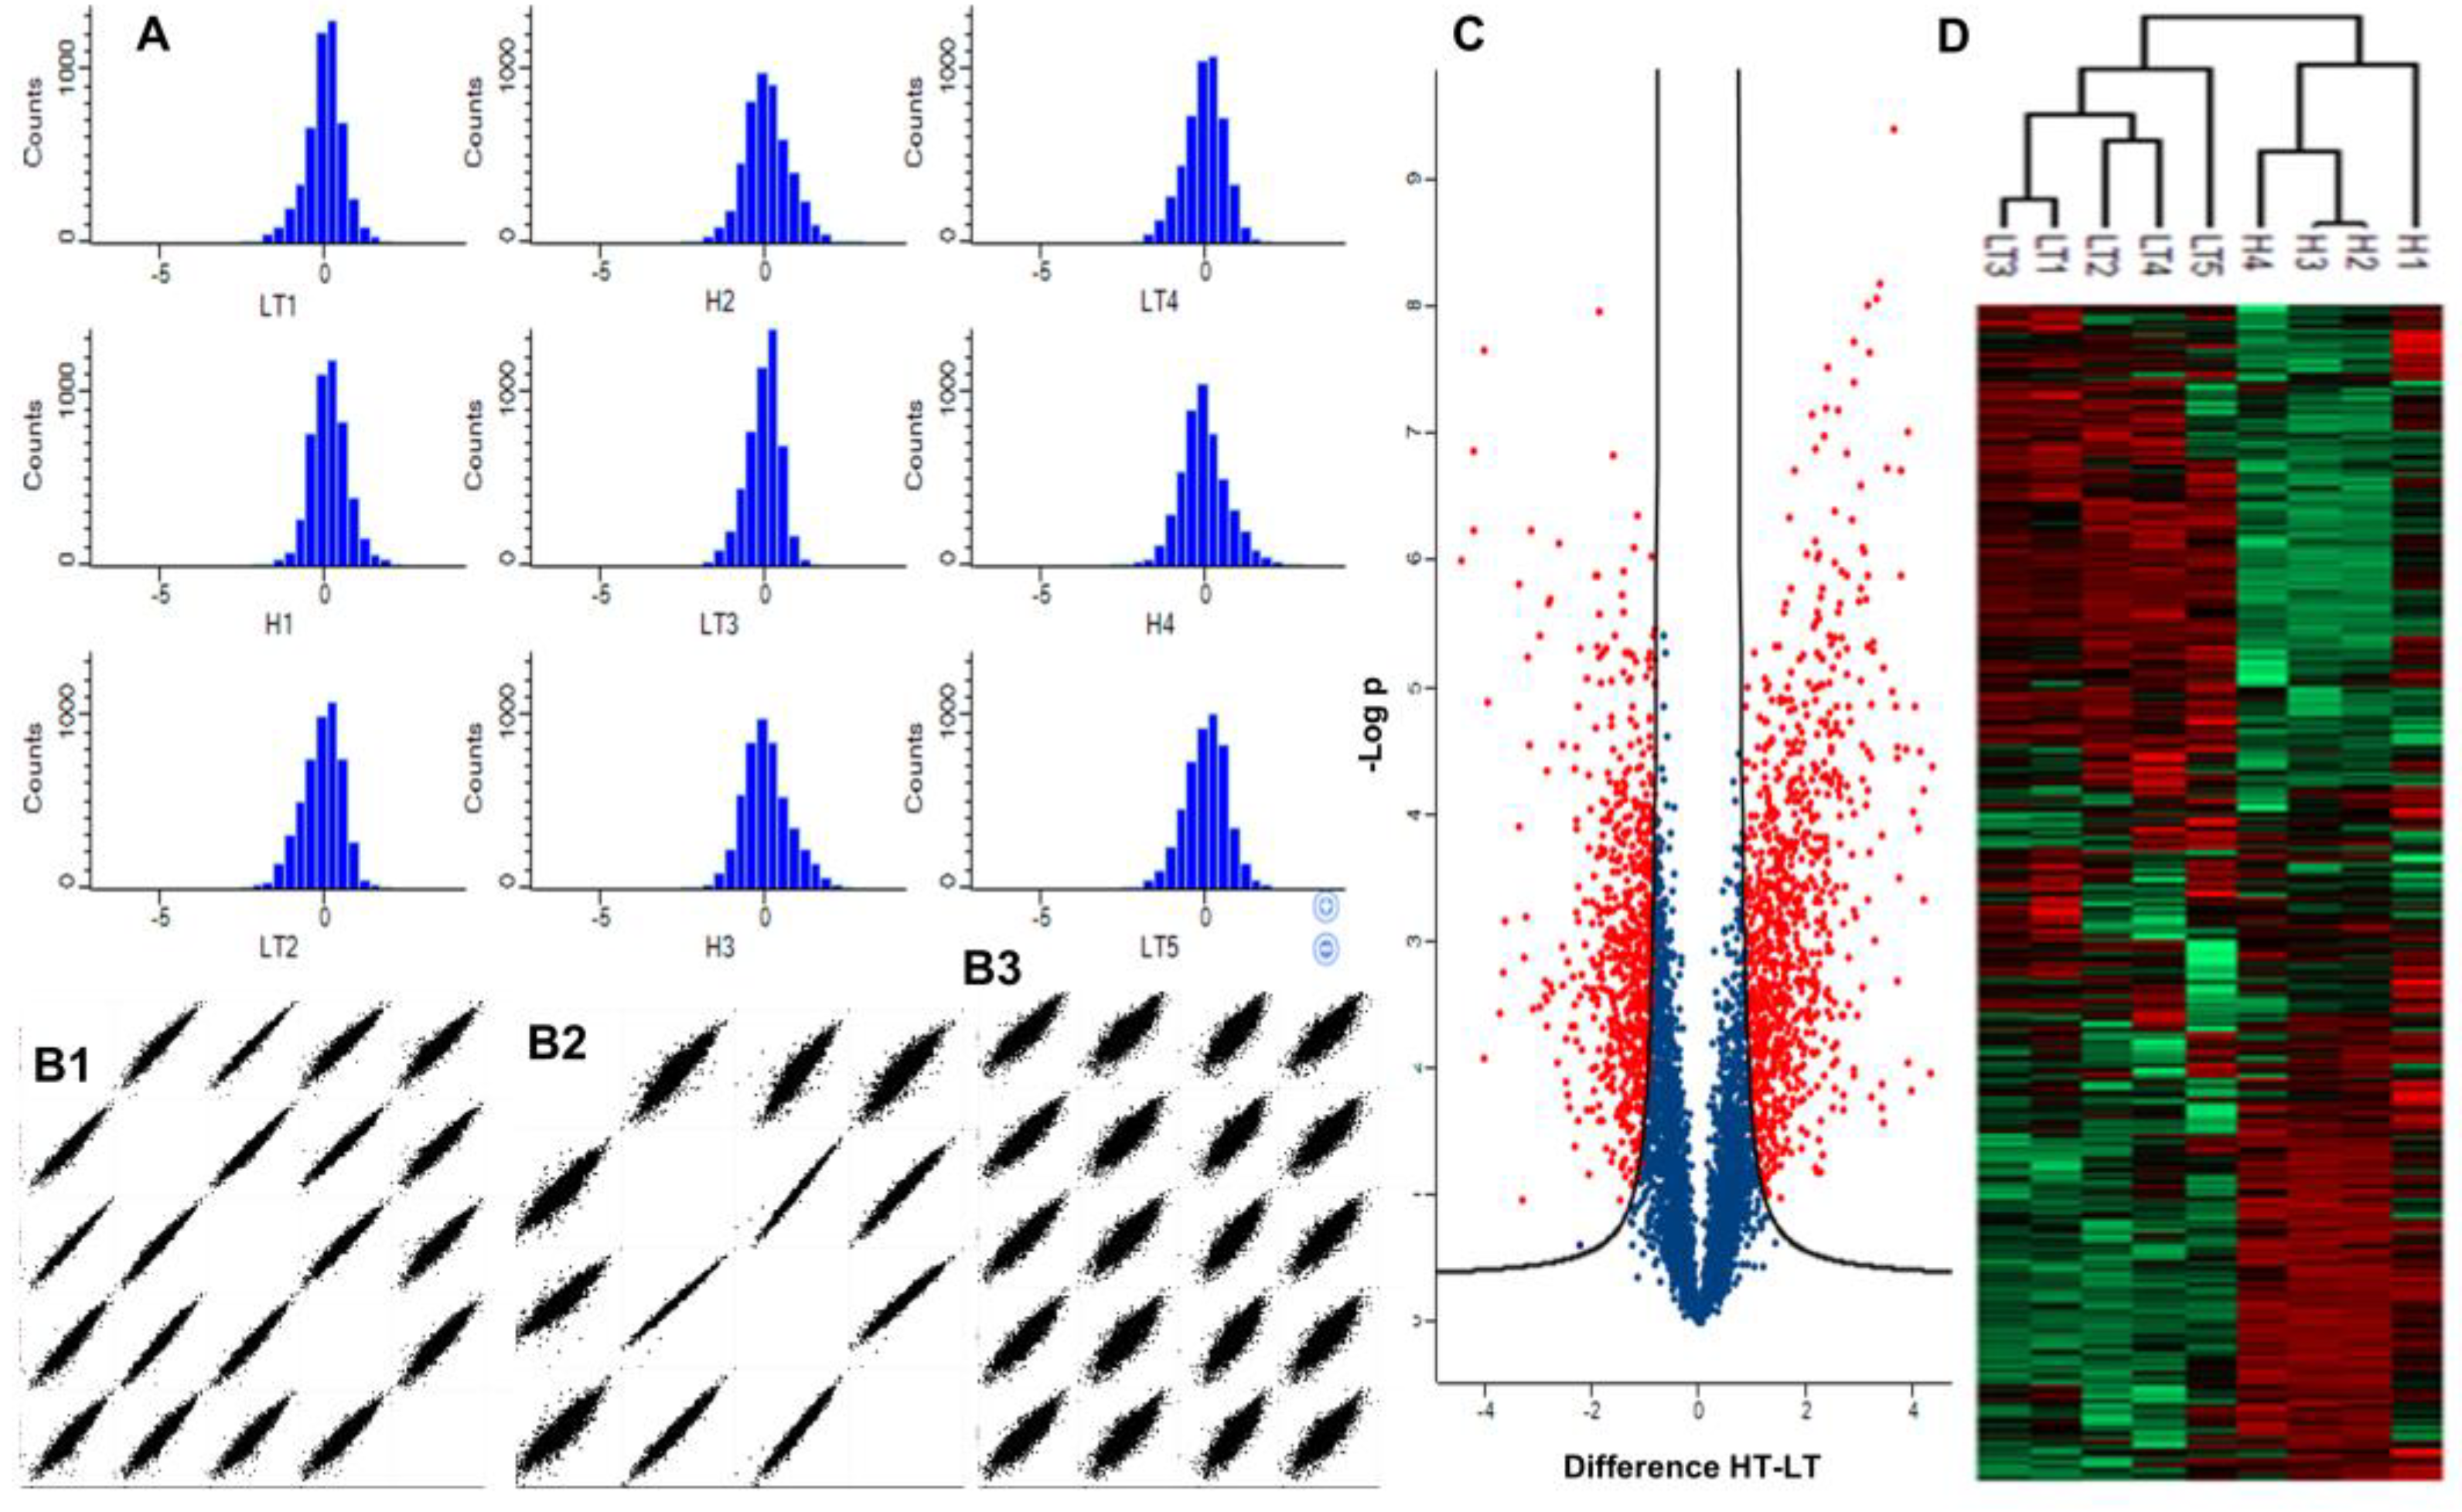
Figure 5.
A) Heatmap of COG Q (secondary metabolite biosynthesis). B) Heatmap of COG Q PKS (polyketide synthase). Red and green colors on the heatmaps represent more and less abundant proteins respectively. C) Volcano plot of log2 fold change KbHT/KbLT vs -log10p (FDR 0.02, S 1.0) COG Q shown in blue PKS shown in red.
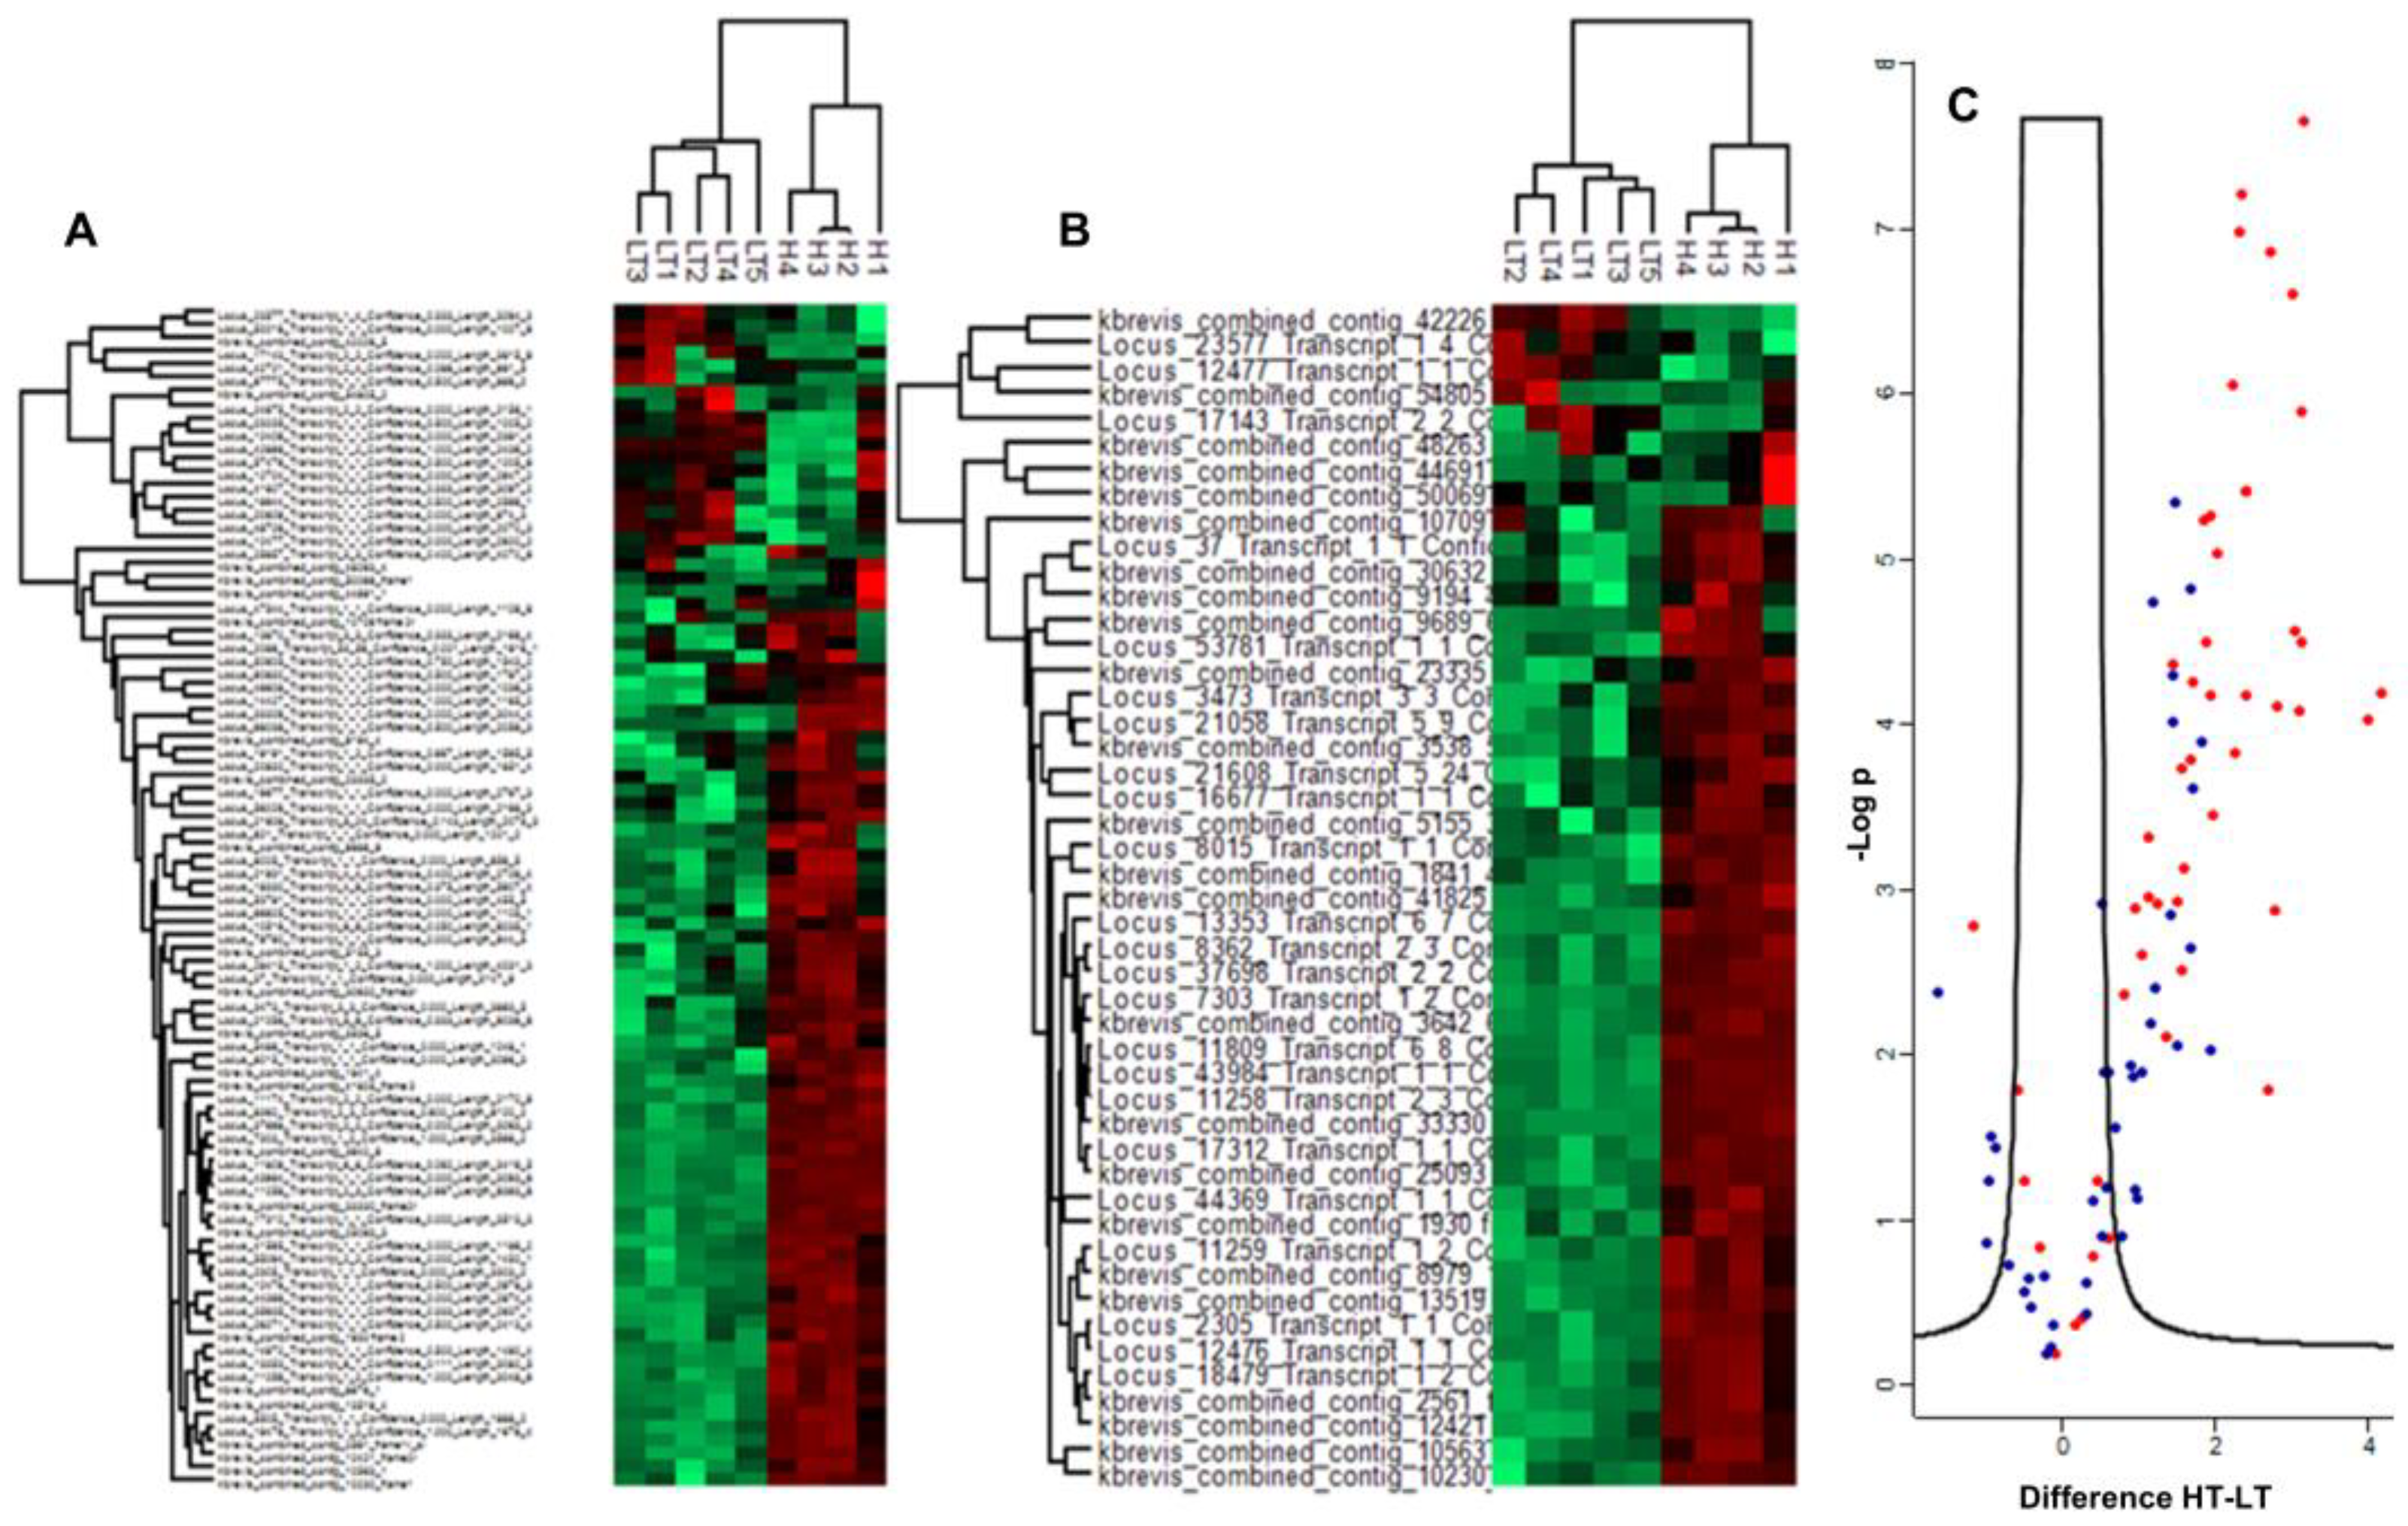
Figure 6.
A) Volcano plot of 52 proteins related to antioxidant defense. B) Heat map showing hierarchical clustering of KbHT and KbLT plastid proteins. Red and green colors on the heatmap represent more and less abundant proteins respectively. C) Volcano plot of all proteins localized to the plastid by Deeploc. DAPs are red.
Disclaimer/Publisher’s Note: The statements, opinions and data contained in all publications are solely those of the individual author(s) and contributor(s) and not of MDPI and/or the editor(s). MDPI and/or the editor(s) disclaim responsibility for any injury to people or property resulting from any ideas, methods, instructions or products referred to in the content. |
© 2025 by the authors. Licensee MDPI, Basel, Switzerland. This article is an open access article distributed under the terms and conditions of the Creative Commons Attribution (CC BY) license (http://creativecommons.org/licenses/by/4.0/).
Copyright: This open access article is published under a Creative Commons CC BY 4.0 license, which permit the free download, distribution, and reuse, provided that the author and preprint are cited in any reuse.


