Submitted:
21 June 2025
Posted:
23 June 2025
You are already at the latest version
Abstract
Robust point cloud registration under low-overlap conditions remains a significant challenge in 3D computer vision and perception. To address this issue, we propose a novel registration framework that integrates edge-guided feature extraction, FPFH-based correspondence estimation, and quaternion averaging. The proposed method begins by detecting edge features through a normal-extrema-based strategy, which identifies geometrically salient points to enhance structural consistency in sparse overlapping regions. Next, FPFH descriptors are employed to establish point correspondences, followed by quaternion averaging to obtain a globally consistent initial alignment. Finally, a point-to-plane ICP refinement step is applied to improve the registration precision. Comprehensive experiments are conducted on three benchmark datasets—Stanford Bunny, Dragon, and Happy Buddha—to evaluate the performance of the proposed method. Compared with classical ICP and RANSAC-ICP algorithms, our method achieves significantly improved registration accuracy under low-overlap conditions, with the highest improvement reaching 75.7%. The results demonstrate the effectiveness and robustness of the proposed framework in challenging partial overlap scenarios.
Keywords:
point cloud registration
; edge feature
; feature descriptor
; quaternion averaging
; iterative closest point
1. Introduction
The convenient acquisition of point cloud data has led to its widespread application in image processing and object reconstruction [1]. Point cloud registration (PCR) is a fundamental problem in this domain, aiming to estimate the six-degree-of-freedom relative pose between two point clouds [2] by determining the optimal rigid transformation matrix. Accurate estimation of this transformation is critical for downstream tasks such as 3D reconstruction and localization.
Classical registration methods, such as the Iterative Closest Point(ICP) algorithm proposed by Besl and McKay [3], and the Normal Distributions Transform (NDT) introduced by Magnusson and Martin [4], have demonstrated strong performance under high-overlap conditions. However, these methods often converge to local minima when dealing with low-overlap data. To address this, Rusu et al. incorporated the Random Sample Consensus (RANSAC) algorithm [5] to provide a coarse alignment, which is subsequently refined using ICP [6]. While this pipeline helps avoid local traps, it remains sensitive to outliers and performs poorly in sparse correspondence scenarios [7].
Recent learning-based methods, such as PRNet by Y. Wang et al. [8] and the improved HOUV algorithm by Yan Y. et al. [9], have shown promising performance by leveraging large-scale feature matching in overlapping regions. However, their reliance on sufficient overlap makes them less effective in low-overlap cases, where feature sparsity severely hampers registration accuracy [10].
Several studies have explored alternative strategies to address this challenge. Zhang et al. introduced a method combining shape and texture features [11], while Sun et al. proposed a registration framework incorporating Intrinsic Shape Signature (ISS) keypoints as edge features [12]. These approaches improve robustness under low-overlap conditions. Nonetheless, traditional edge detectors such as ISS and Harris-3D depend on global geometric statistics [13], making them computationally expensive and less scalable for dense point clouds.
Normal Vector Extrema Change (NVEC) has been widely adopted in differential geometry to describe sharp variations in surface curvature, and edge extraction methods based on this principle have been widely applied in 3D printing [14] and boundary detection in medical imaging [15]. Meanwhile, quaternions, as compact mathematical tools for representing rigid body transformations in three-dimensional space, have been extensively used in point cloud registration [16], especially in multi-view alignment [17] and spacecraft attitude estimation [18].
Motivated by these insights, this study presents an edge-guided and quaternion-averaged fusion algorithm to enhance registration robustness under low-overlap conditions, by leveraging the complementary strengths of NVEC-based edge detection and quaternion averaging.
2. Research Methods
In this study, two input point clouds are defined as the source and target point clouds. First, edge features are extracted from the raw point cloud using the Normal Vector Extrema Change method. Subsequently, Fast Point Feature Histogram are computed for the extracted edge points, and feature correspondences are established through KDTree-based nearest neighbor search. An initial pose estimation is then performed using these correspondences, with an emphasis on preserving local geometric consistency. Finally, a point-to-plane ICP algorithm is applied for fine alignment, completing the precise registration process. The complete workflow is illustrated in Figure 1.
2.1. Edge Extraction Based on Normal Vector Extrema Change
Based on the definition of geometric variation, this study introduces a method for edge feature extraction grounded in Normal Vector Extrema Change (NVEC). By computing the maximum angular deviation between normal vectors in the local neighborhood of each point in the cloud, the method determines whether the point lies on a geometric edge. This approach effectively reduces computational complexity while improving the efficiency of edge detection.
Let the input point cloud be denoted as . A voxel downsampling process is applied to normalize point density and reduce computational redundancy. The 3D space is partitioned into cubic voxels, and each voxel is represented by the geometric centroid of the points it contains, resulting in a sparse point cloud . The voxel size is estimated as follows:
where denotes the sampling ratio, is the number of original points, and is the maximum edge length of the point cloud’s bounding box. This adaptive strategy ensures the preservation of geometric features across varying scales.
For each point , a local neighborhood is constructed, and its normal vector is estimated using Principal Component Analysis (PCA). A covariance matrix is computed within a spherical region, and the normal vector is defined as the eigenvector corresponding to the smallest eigenvalue. To avoid directional ambiguity, all normals are consistently oriented toward the centroid of the point cloud.
For each point , its k-nearest neighbors in Euclidean space form the neighborhood set , denoted as . A radius constraint is applied:
where is typically set between 10 and 30 to ensure local stability, and is chosen to constrain outlier inclusion and preserve local geometric consistency.
Let and denote the normal vectors of point and its neighbor , respectively. The angle between them is computed as:
Since all normals are normalized, this simplifies to:
The maximum angular deviation of the normal vector is defined as the edge response of point :
If approaches zero, the point lies on a smooth surface; conversely, a large value indicates a geometric edge.
To improve robustness, the variance of angular deviations is also used as a secondary criterion:
According to empirical engineering experience, the angular threshold is set to 12°, and the variance threshold is set to 8°. A point is classified as an edge point if:
To further suppress noise and outliers, an edge response range constraint is imposed:
where is set to 45°, and is set to 8°. These thresholds help eliminate spurious boundaries caused by measurement noise.
2.2. FPFH Descriptors and Matched Point Pairs
To construct local descriptors for edge points, the Fast Point Feature Histogram (FPFH) method is employed due to its robustness in capturing neighborhood geometry while maintaining invariance to rigid transformations. For each edge point , a spherical neighborhood with radius is defined to balance local geometric stability and descriptive capability.
Let the set of edge descriptors for the source point cloud be denoted as , and those for the target point cloud as . For each descriptor in the source set, its two nearest neighbors in the target descriptor space—denoted as and —are identified, with corresponding distances and , respectively.
To suppress ambiguous matches, a ratio test is applied. A match is accepted only if:
where is the ratio threshold, set to 0.8 in this study. This filtering strategy helps eliminate incorrect correspondences arising from repetitive structures or similar local patterns.
To further enhance the robustness of the matching process, a mutual consistency check is performed, inspired by the concept of inverse consistency. Specifically, if a point in the source point cloud is matched to a point in the target, the reverse correspondence—from back to —must also hold:
This constraint ensures one-to-one matching and eliminates inconsistent or one-to-many correspondences, which are common in densely sampled point clouds. As a result, the geometric consistency of the final correspondences is significantly improved.
The final set of reliable matched point pairs, filtered by both the ratio test and mutual consistency check, is denoted as , represented as the set .
2.3. Local Rigid Transformation Estimation and Quaternion Averaging
For the constructed set of matched point pairs, density-based spatial clustering is performed on the source point cloud using the DBSCAN algorithm. This method identifies core points whose local neighborhoods contain a sufficient number of nearby points and groups them into clusters . Points not assigned to any cluster are discarded.
This strategy naturally filters out outliers introduced during descriptor matching. For each point in the resulting valid clusters , its corresponding point in the matches pair set is retrieved to form a new set of valid correspondences , collectively denoted as . These pairs form the basis for subsequent rigid transformation estimation.
For each matched point pair set , the rigid transformation is estimated using Singular Value Decomposition (SVD). The centroids of the source and target point sets are first computed:
The centered covariance matrix is then constructed:
Applying SVD to
, we obtain:
The resulting rotation matrix and translation vector are given by:
This transformation represents the estimated rigid alignment for the selected cluster.
Since rigid transformations lie in the Special Euclidean group , direct averaging in Euclidean space is not valid. To obtain a globally consistent estimate, the quaternion representation of each rotation matrix is computed and denoted as . These quaternions are then averaged to obtain a representative rotation:
The averaged quaternion is converted back to a rotation matrix, denoted as . The corresponding translation vector is computed as:
Here, and represent the centroids of the source and target sets, respectively. This estimated transformation pair serves as the initial global pose for subsequent fine registration.
2.4. Point-to-Plane ICP Fine Registration
The traditional ICP algorithm estimates the optimal rigid transformation that aligns the source point cloud to the target by minimizing the Euclidean distance between corresponding points. In contrast, the point-to-plane ICP variant minimizes the sum of squared distances between transformed source points and the tangent planes of their corresponding points in the target point cloud. Given an initial pose estimate, the objective function is formulated as:
where denotes the i-th point in the source point cloud, is its corresponding nearest neighbor in the target , is the unit normal vector at , and are the rotation matrix and translation vector to be estimated.
During each iteration, the orthogonal projection residual is computed as the point-to-plane distance:
This residual measures how far the transformed point deviates from the tangent plane at .
The surface normals are pre-computed on the target point cloud using local neighborhood PCA. For each source point its nearest neighbor in the target is identified, and the residuals are computed using the corresponding surface normals. Based on the least-squares principle, the incremental rigid transformation is estimated. The transformation is iteratively refined until convergence is achieved or the maximum number of iterations is reached. The final rigid transformation is obtained by composing the converged incremental transformation with the initial pose.
3. Experiment
3.1. Data Set
In this study, the Stanford 3D Scanning Repository was utilized as the experimental dataset [19]. As one of the earliest and most widely used publicly available 3D scanned datasets in the fields of computer graphics and computational geometry, it was collected and released by the Stanford Computer Graphics Laboratory. This dataset has been widely adopted for evaluating tasks such as point cloud registration, 3D reconstruction, surface resampling, and normal estimation. The point clouds were acquired using a Cyberware 3030 MS 3D laser scanner through segmented 360-degree scanning. Each scan frame contains approximately 35,000 to 50,000 points.
3.2. Implementation Detail
The computer configuration used in the experiment is an Intel(R) I9-13900K CPU (Intel, Santa Clara, CA, USA), an NVIDIA GeForce GTX4060 graphics card (NVIDIA, Santa Clara, CA, USA), with 8 GB of video memory. In this experiment, three datasets—Bunny, Dragon, and Happy Buddha—were selected, with multiple viewpoint point clouds from each dataset used for testing. Parameters not explicitly mentioned in the code were set to their default values.
3.3. Accuracy Evaluation Metrics
For edge extraction evaluation, precision and recall are adopted as error metrics. They are computed as:
where denotes the number of true positives, i.e., correctly identified edge points; represents false positives, i.e., non-edge points incorrectly classified as edge points; and refers to false negatives, i.e., actual edge points that were not correctly identified. Precision reflects the discriminative capability of the edge detector, while recall reflects the completeness of edge detection.
For registration accuracy, the Root Mean Square Error (RMSE) is used as a quantitative metric. Given a set of point correspondences , where
and are corresponding points from the transformed source and target point clouds respectively, the RMSE is calculated as follows:
where is the number of matched point pairs, and are the estimated rotation matrix and translation vector. RMSE measures the average geometric alignment error of the registered point clouds, serving as an indicator of overall registration accuracy.
4. Discussion
4.1. Edge Extraction Validation
Edge extraction experiments were conducted on the bunny000 model from the Bunny dataset. The result of ISS-based edge extraction is shown in Figure 2(a), while the result obtained using the proposed NVEC method is presented in Figure 2(b).
As illustrated in Figure 2, the NVEC method more effectively captures structurally meaningful edge points, especially in regions with complex geometric variation. It achieves this without discarding essential boundary details. In contrast, the ISS method tends to miss critical geometric features and often produces sparse and incomplete edge representations due to its reliance on global saliency measures.
Figure 3 further compares the performance of ISS, Harris-3D, and NVEC in terms of precision and recall. The results show that as recall increases, the precision of the NVEC method remains consistently high, outperforming the other two methods. This indicates that NVEC achieves a better balance between accuracy and coverage in edge extraction. Overall, the NVEC method provides a more reliable and complete edge representation, making it particularly advantageous for downstream tasks such as point cloud registration.
4.2. Point Cloud Registration Validation
To evaluate the effectiveness of the proposed Edge-Preserving Iterative Closest Point (EPICP) algorithm in point cloud registration, we conducted comparative experiments using three Stanford datasets: Bunny, Dragon, and Happy Buddha. Three methods were evaluated: traditional ICP, RANSAC-enhanced ICP, and the proposed EPICP, where RANSAC was applied as an initial pose optimizer for all methods.
As shown in Table 1, EPICP achieves lower RMSE than the other two methods, indicating improved registration accuracy for rigid object alignment. Although EPICP incurs a slightly longer runtime, this can be mitigated through Python-based multithreaded parallelism, enabling efficient execution.
TTo further validate the robustness of EPICP under low-overlap conditions (less than 50%), two additional experiments were conducted. In the first experiment, the Happy Buddha model was tested with a 47% overlap. In the second, the Bunny model was used with only 33% overlap. All three methods were evaluated under identical conditions. As shown in Figure 4, EPICP consistently outperformed the other methods across both overlap settings.
These findings demonstrate that EPICP provides superior accuracy in low-overlap point cloud registration scenarios. It consistently outperforms traditional methods and exhibits strong robustness even when the overlap is significantly limited.
Table 2 presents RMSE values and statistical results for the two overlap settings. Under 47% and 33% overlap, the registration accuracy of EPICP improved by 61.9% and 75.7%, respectively, compared to baseline methods. The corresponding standard deviations are within acceptable bounds, confirming result stability.
Figure 5 illustrates the RMSE variation under different overlap ratios. EPICP maintains stable registration accuracy under moderate-to-low overlap. When the overlap becomes extremely low, RMSE increases significantly and the registration becomes less stable. Nevertheless, compared with traditional algorithms, EPICP still exhibits notable performance advantages under challenging conditions.
4.3. Ablation Study
To validate the contribution of each module within the EPICP algorithm, a series of ablation experiments were conducted on the Stanford Bunny dataset. As shown in Figure 3, different module combinations were tested to assess their individual and joint impact on the final registration accuracy. In the first configuration, only point-to-plane ICP was applied without any initialization. The RMSE reached 1.91 cm, indicating that without a good initial pose, the registration tends to converge to a suboptimal solution. In the second configuration, pose initialization was enabled but without refinement, yielding an RMSE of 2.83 cm. This shows that initial alignment alone is insufficient and leads to large residual errors. In the third configuration, only outlier rejection was activated (with initialization and fine registration disabled), achieving an RMSE of 0.93 cm. Although the exclusion of mismatched correspondences improves accuracy, the absence of initialization still results in notable alignment errors. The fourth configuration, using only fine registration, reduced the RMSE to 1.02 cm, suggesting that this module contributes to accuracy, but its effect is limited without supporting components. Configurations five to seven, which combined two modules at a time, showed moderately improved performance, with RMSEs remaining relatively stable. These results confirm that the modules are complementary and can cooperate effectively. In the eighth configuration, when all three modules (initialization, outlier rejection, and fine registration) were activated, the RMSE was minimized, and the highest accuracy was achieved. This demonstrates the capability of the proposed EPICP framework to maintain high registration precision under low-overlap conditions by leveraging robust initialization, effective correspondence filtering, and accurate refinement.

Table 3.
Ablation study on Bunny Dataset.
| EdgeExtraction | FPFH | Local Registration | Global Registration | RMSE(cm) | |
| 1) | ✓ | 1.91 | |||
| 2) | ✓ | ✓ | 2.83 | ||
| 3) | ✓ | ✓ | 0.93 | ||
| 4) | ✓ | ✓ | 1.02 | ||
| 5) | ✓ | ✓ | ✓ | 1.26 | |
| 6) | ✓ | ✓ | ✓ | 1.26 | |
| 7) | ✓ | ✓ | ✓ | 1.42 | |
| 8) | ✓ | ✓ | ✓ | ✓ | 0.16 |
5. Conclusions
To address the challenge of point cloud registration under low-overlap conditions, this study proposes a novel registration framework that integrates edge enhancement with quaternion-based fusion. The proposed method overcomes the limitations of traditional approaches that often fail to extract reliable local features in sparse-overlap scenarios, thereby improving registration accuracy. Specifically, the method first calculates the maximum angular deviation between neighboring normals to detect geometric edges. These edge points are then used for robust feature matching. A local rigid transformation is subsequently estimated, followed by quaternion-based averaging to obtain a reliable initial pose. Finally, a point-to-plane ICP refinement step is performed to achieve precise alignment. Experimental results on the Stanford 3D Scanning Repository demonstrate that the proposed method significantly outperforms traditional techniques in terms of accuracy and robustness, particularly under low-overlap conditions.
However, some limitations remain. The method relies heavily on accurate edge detection; noisy or incomplete edge features may affect registration outcomes. In extremely low-overlap scenarios, over-filtering may reduce the number of matching pairs, potentially leading to registration failure. Nevertheless, the proposed approach shows strong potential for achieving accurate and reliable registration under challenging conditions. Future work will focus on improving edge detection robustness, optimizing module integration, and enhancing adaptability to diverse and complex registration environments.
Author Contributions
Conceptualization, Y.Z.; methodology, Y.Z. and B.Y.; software, Y.Z.; validation, Y.Z. and B.Y.; formal analysis, Y.Z.; investigation, B.Y.; writing—original draft preparation, Y.Z.; writing—review and editing, Y.Z. and M.L.; supervision, M.L.; project administration, D.T. All authors have read and agreed to the published version of the manuscript.
Funding
This research received no external funding.
Institutional Review Board Statement
Not applicable.
Informed Consent Statement
Not applicable.
Data Availability Statement
The point cloud data used in this study (Bunny, Dragon, and Happy Buddha) are publicly available from the Stanford 3D Scanning Repository at http://graphics.stanford.edu/data/3Dscanrep/.
Acknowledgments
The authors would like to thank the Stanford 3D Scanning Repository for providing the Bunny, Dragon, and Happy Buddha datasets used in this study. We also appreciate the reviewers for their constructive feedback.
Conflicts of Interest
The authors declare no conflict of interest.
Abbreviations
The following abbreviations are used in this manuscript:
| ICP | Iterative Closest Point |
| FPFH | Fast Point Feature Histograms |
| PCR | Point Cloud Registration |
| NDT | Normal Distributions Transform |
| RANSAC | Random Sample Consensus |
| PRNet | Partial-to-partial Registration Net |
| HOUV | Hybrid optimization with unconstrained variables |
| ISS | Intrinsic Shape Signatures |
| PCA | Principal Component Analysis |
| DBSCAN | Density-Based Spatial Clustering of Applications with Noise |
| SVD | Singular Value Decomposition |
| SE(3) | Special Euclidean Group in 3D |
| SO(3) | Special Orthogonal Group in 3D |
| TP | True Positives |
| FP | False Positives |
| FN | False Negatives |
| RMSE | Root Mean Square Error |
| NVEC | Normal Vector Extrema Change |
| EPICP | Edge-Preserving Iterative Closest Point |
References
- Zhang, R.C.; Chen, K.Y.; Zhao, Y. Research on Multi-View Point Cloud Registration Method for 3D Reconstruction of Large-Scale Components. Machine Design & Research 2022, 38, 30–36. [Google Scholar]
- Yang, B.; Li, M.F.; Tan, D.; et al. Point Cloud Registration Algorithm Based on the Model of L₍1,ₚ₎ Sparse Constraint. Laser & Optoelectronics Progress, 2024, 61, 1–17. [Google Scholar]
- Besl, P.J.; McKay, N.D. A Method for Registration of 3-D Shapes. In Proceedings of the Sensor Fusion IV: Control Paradigms and Data Structures, San Jose, CA, USA; SPIE: Bellingham, WA, USA, 1992; pp. 586–606. [Google Scholar]
- Magnusson, M. The Three-Dimensional Normal-Distributions Transform: An Efficient Representation for Registration, Surface Analysis, and Loop Detection. Ph.D. Thesis, Örebro University, Örebro, Sweden, 2009. [Google Scholar]
- Rusu, R.B.; Cousins, S. 3D Is Here: Point Cloud Library (PCL). In Proceedings of the 2011 IEEE International Conference on Robotics and Automation (ICRA), Shanghai, China, 9–13 May 2011; IEEE: New York, NY, USA, 2011; pp. 1–4. [Google Scholar]
- Fischler, M.A.; Bolles, R.C. Random Sample Consensus: A Paradigm for Model Fitting with Applications to Image Analysis and Automated Cartography. Commun. ACM 1981, 24, 381–395. [Google Scholar] [CrossRef]
- Zhang, G.Y.; Han, Y.; Zhang, R.T.; et al. A Spatial Consistency-Based Point Cloud Registration Method for the Same Platform. Acta Geodaetica et Cartographica Sinica 2023, 52, 789–797. [Google Scholar]
- Wang, Y.; Solomon, J.M. PRNet: Self-Supervised Learning for Partial-to-Partial Registration. Adv. Neural Inf. Process. Syst. 2019, 32, 8815–8826. [Google Scholar]
- Yan, Y.; An, J.; Zhao, J.; et al. Hybrid Optimization with Unconstrained Variables on Partial Point Cloud Registration. Pattern Recognit. 2023, 136, 109267. [Google Scholar] [CrossRef]
- Chen, S.; Nan, L.; Xia, R.; et al. PLADE: A Plane-Based Descriptor for Point Cloud Registration with Small Overlap. IEEE Trans. Geosci. Remote Sens. 2019, 58, 2530–2540. [Google Scholar] [CrossRef]
- Zhang, Y.; Shi, Z.P.; Pang, M.; et al. Color Point-Cloud Registration Algorithm Integrating Shape and Texture. Laser & Optoelectronics Progress 2024, 61, 212–220. [Google Scholar]
- Sun, R.; Zhang, E.; Mu, D.; et al. Optimization of the 3D Point Cloud Registration Algorithm Based on FPFH Features. Appl. Sci. 2023, 13, 3096. [Google Scholar] [CrossRef]
- Wu, M.L.; Mou, P.; Ran, C.P.; et al. Point Cloud Registration Based on Sampling Rate Optimization and Descriptor Extracting Improvement. Electron. Opt. Control 2025, 32, 74–78. [Google Scholar]
- Liu, Z.; Yin, S.C.; Pan, X.; et al. 3D Model Retrieval Method Based on Feature Lines. J. Comput.-Aided Des. Comput. Graph. 2016, 28, 1512–1520. [Google Scholar]
- Huang, Q.; Jia, L.; Ren, G.; et al. Extraction of Vascular Wall in Carotid Ultrasound via a Novel Boundary-Delineation Network. Eng. Appl. Artif. Intell. 2023, 121, 106069. [Google Scholar] [CrossRef]
- Solà, J. Quaternion Kinematics for the Error-State Kalman Filter. arXiv arXiv:1711.02508, 2017.
- Hartley, R.; Trumpf, J.; Dai, Y.; et al. Rotation Averaging. Int. J. Comput. Vis. 2013, 103, 267–305. [Google Scholar] [CrossRef]
- Markley, F.L.; Cheng, Y.; Crassidis, J.L.; Oshman, Y. Quaternion Averaging. J. Guid. Control Dyn. 2007, 30, 1193–1197. [Google Scholar] [CrossRef]
- Turk, G.; Levoy, M. Zippered Polygon Meshes from Range Images. In Proceedings of the 21st Annual Conference on Computer Graphics and Interactive Techniques (SIGGRAPH), Orlando, FL, USA, 24–29 July 1994; pp. 311–318. [Google Scholar]
Figure 1.
Framework of the Registration Pipeline.
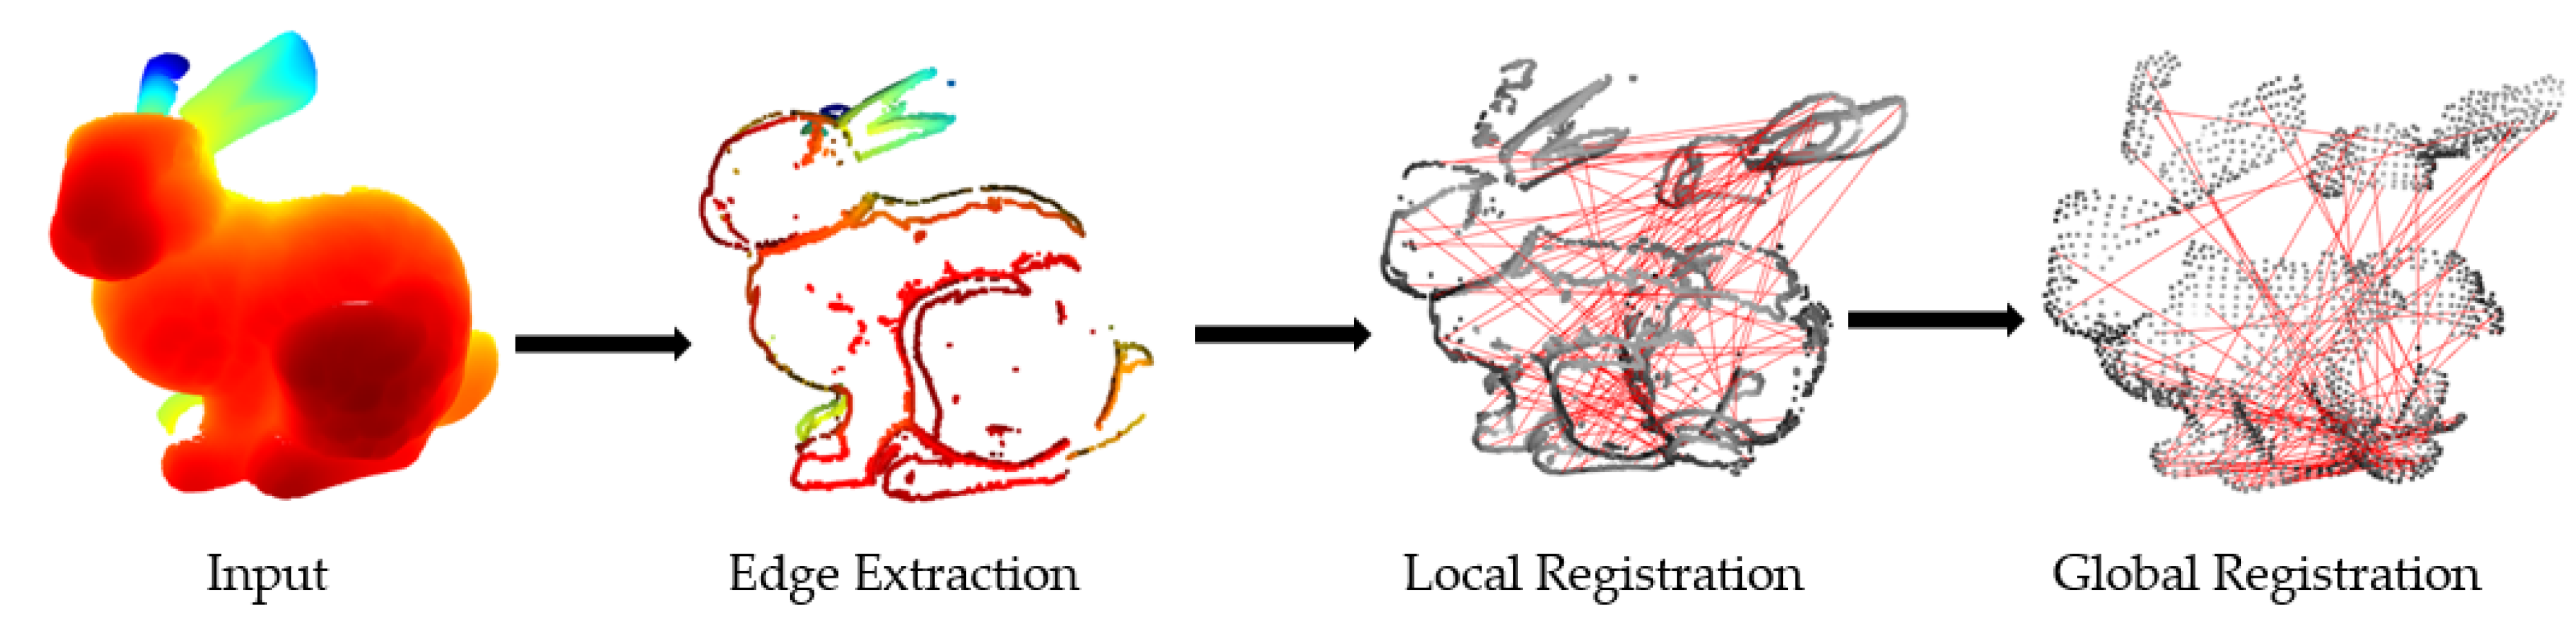
Figure 2.
Edge Extraction Results of the Two Methods.
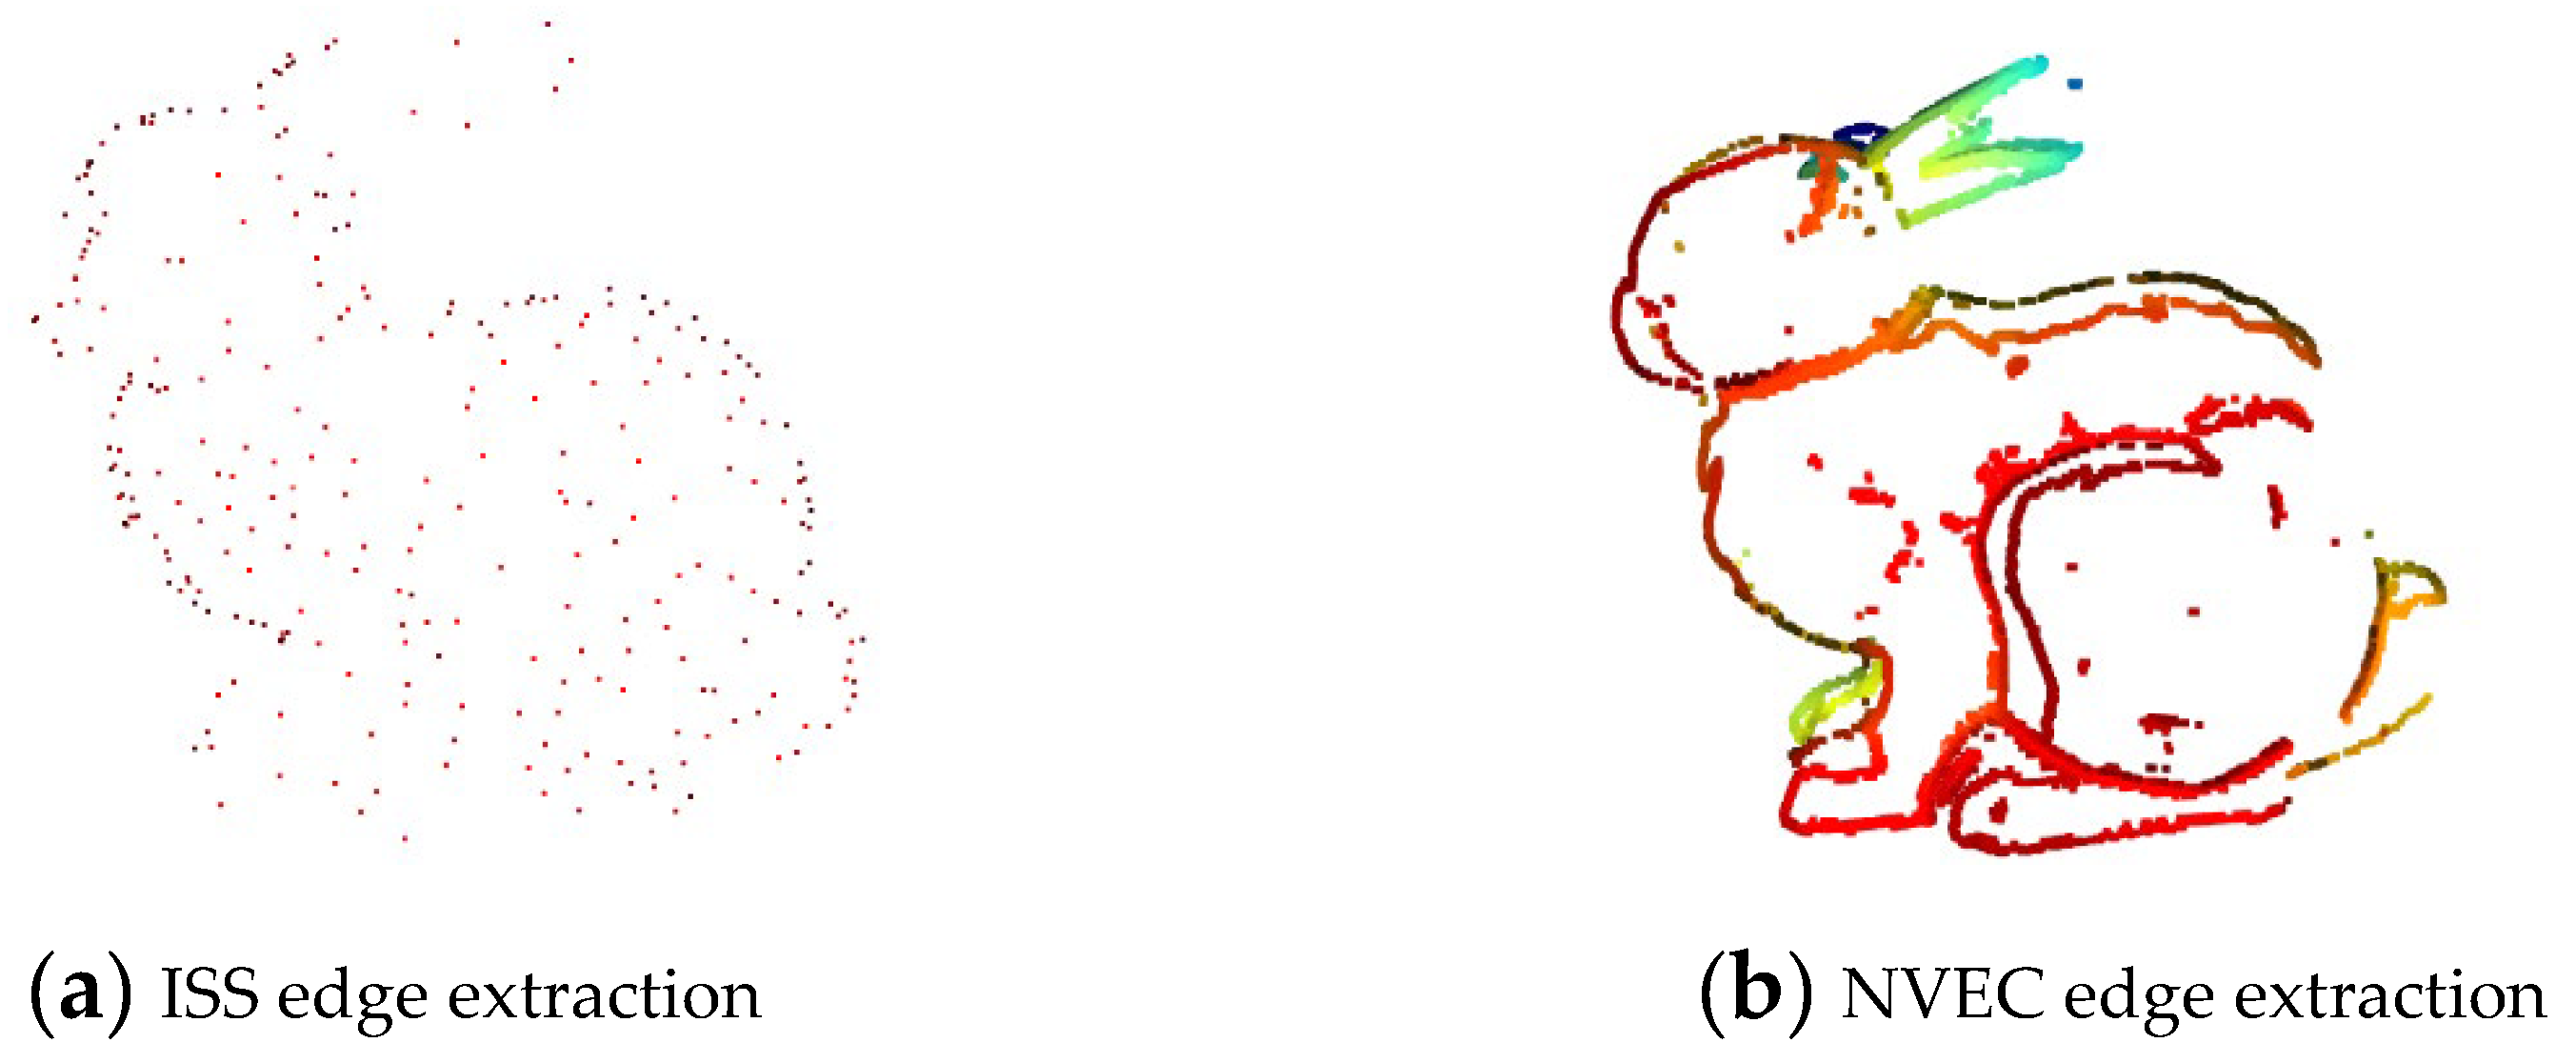
Figure 3.
Comparison of Recall–Precision Among Three Methods.
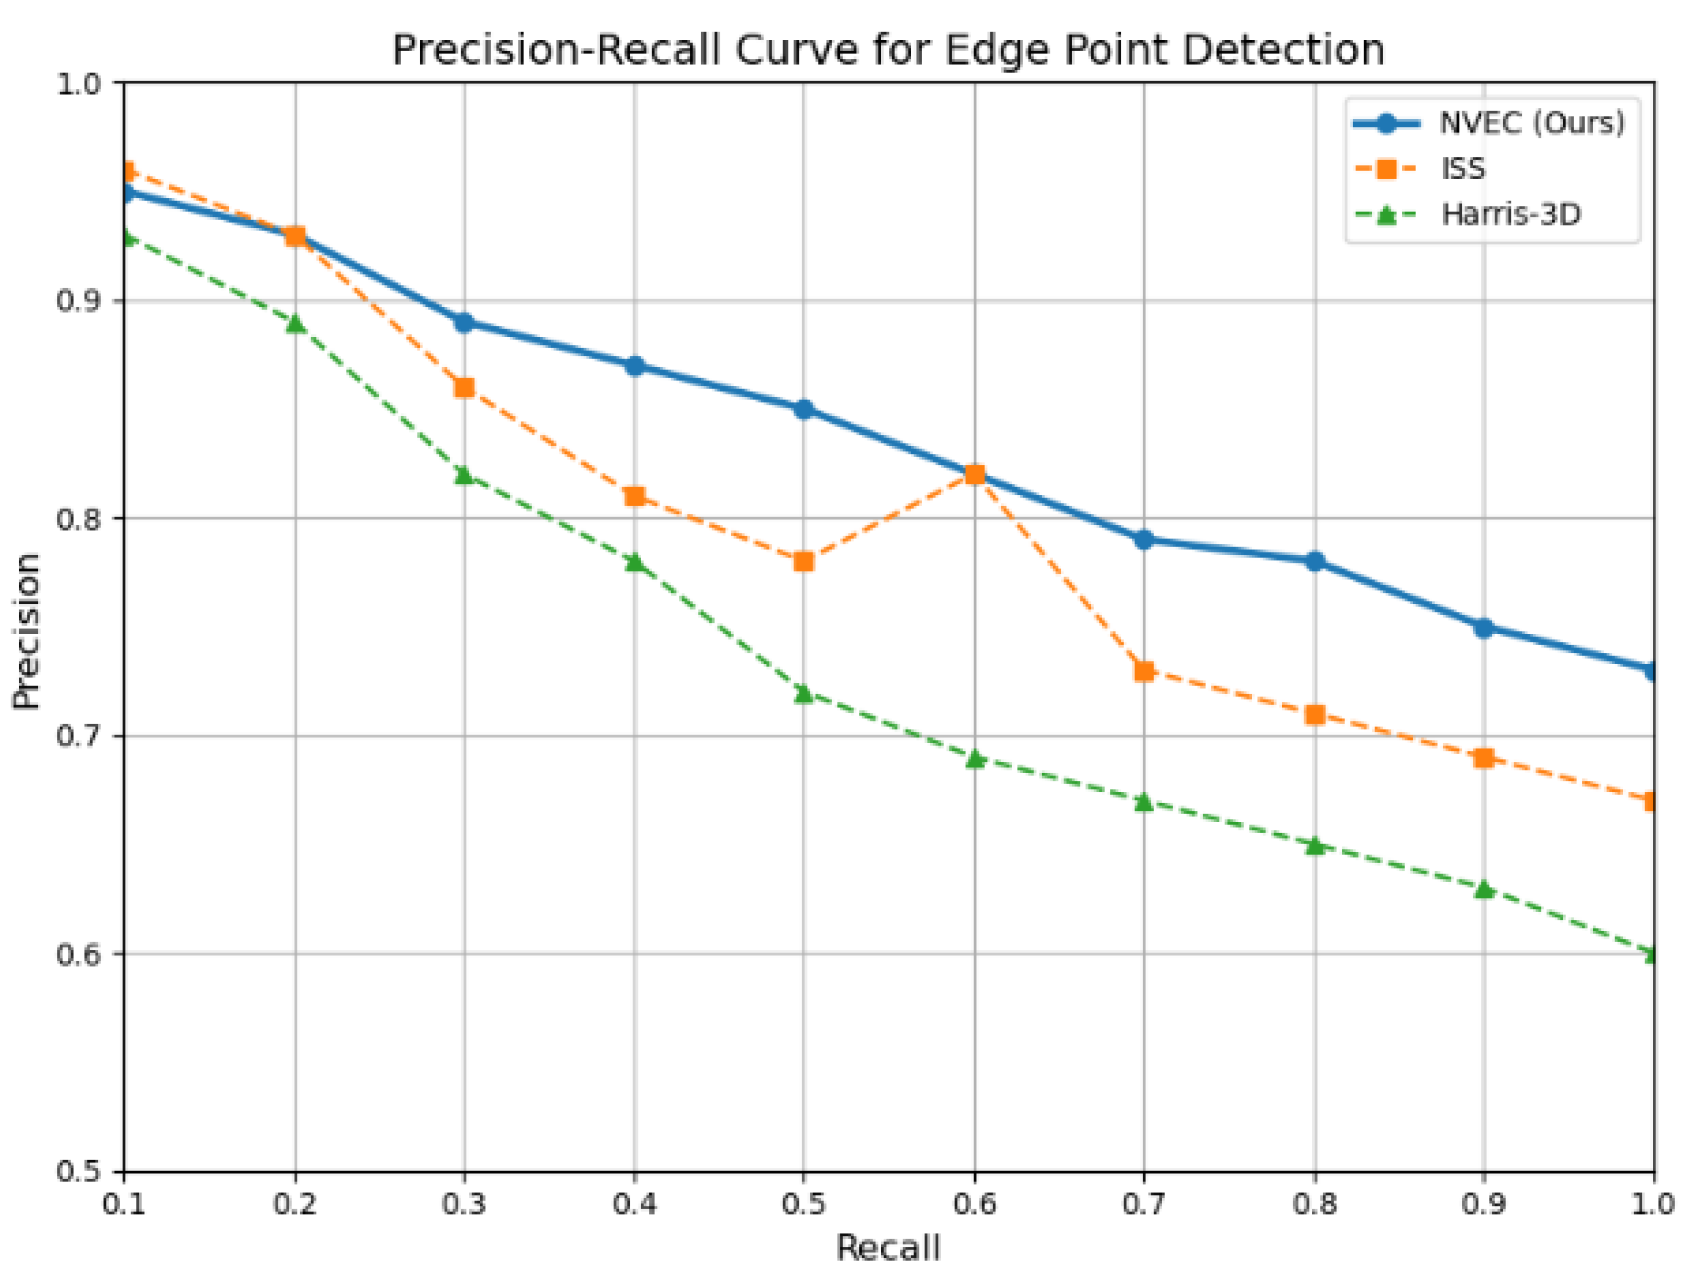
Figure 4.
Performance Comparison of Three Methods.
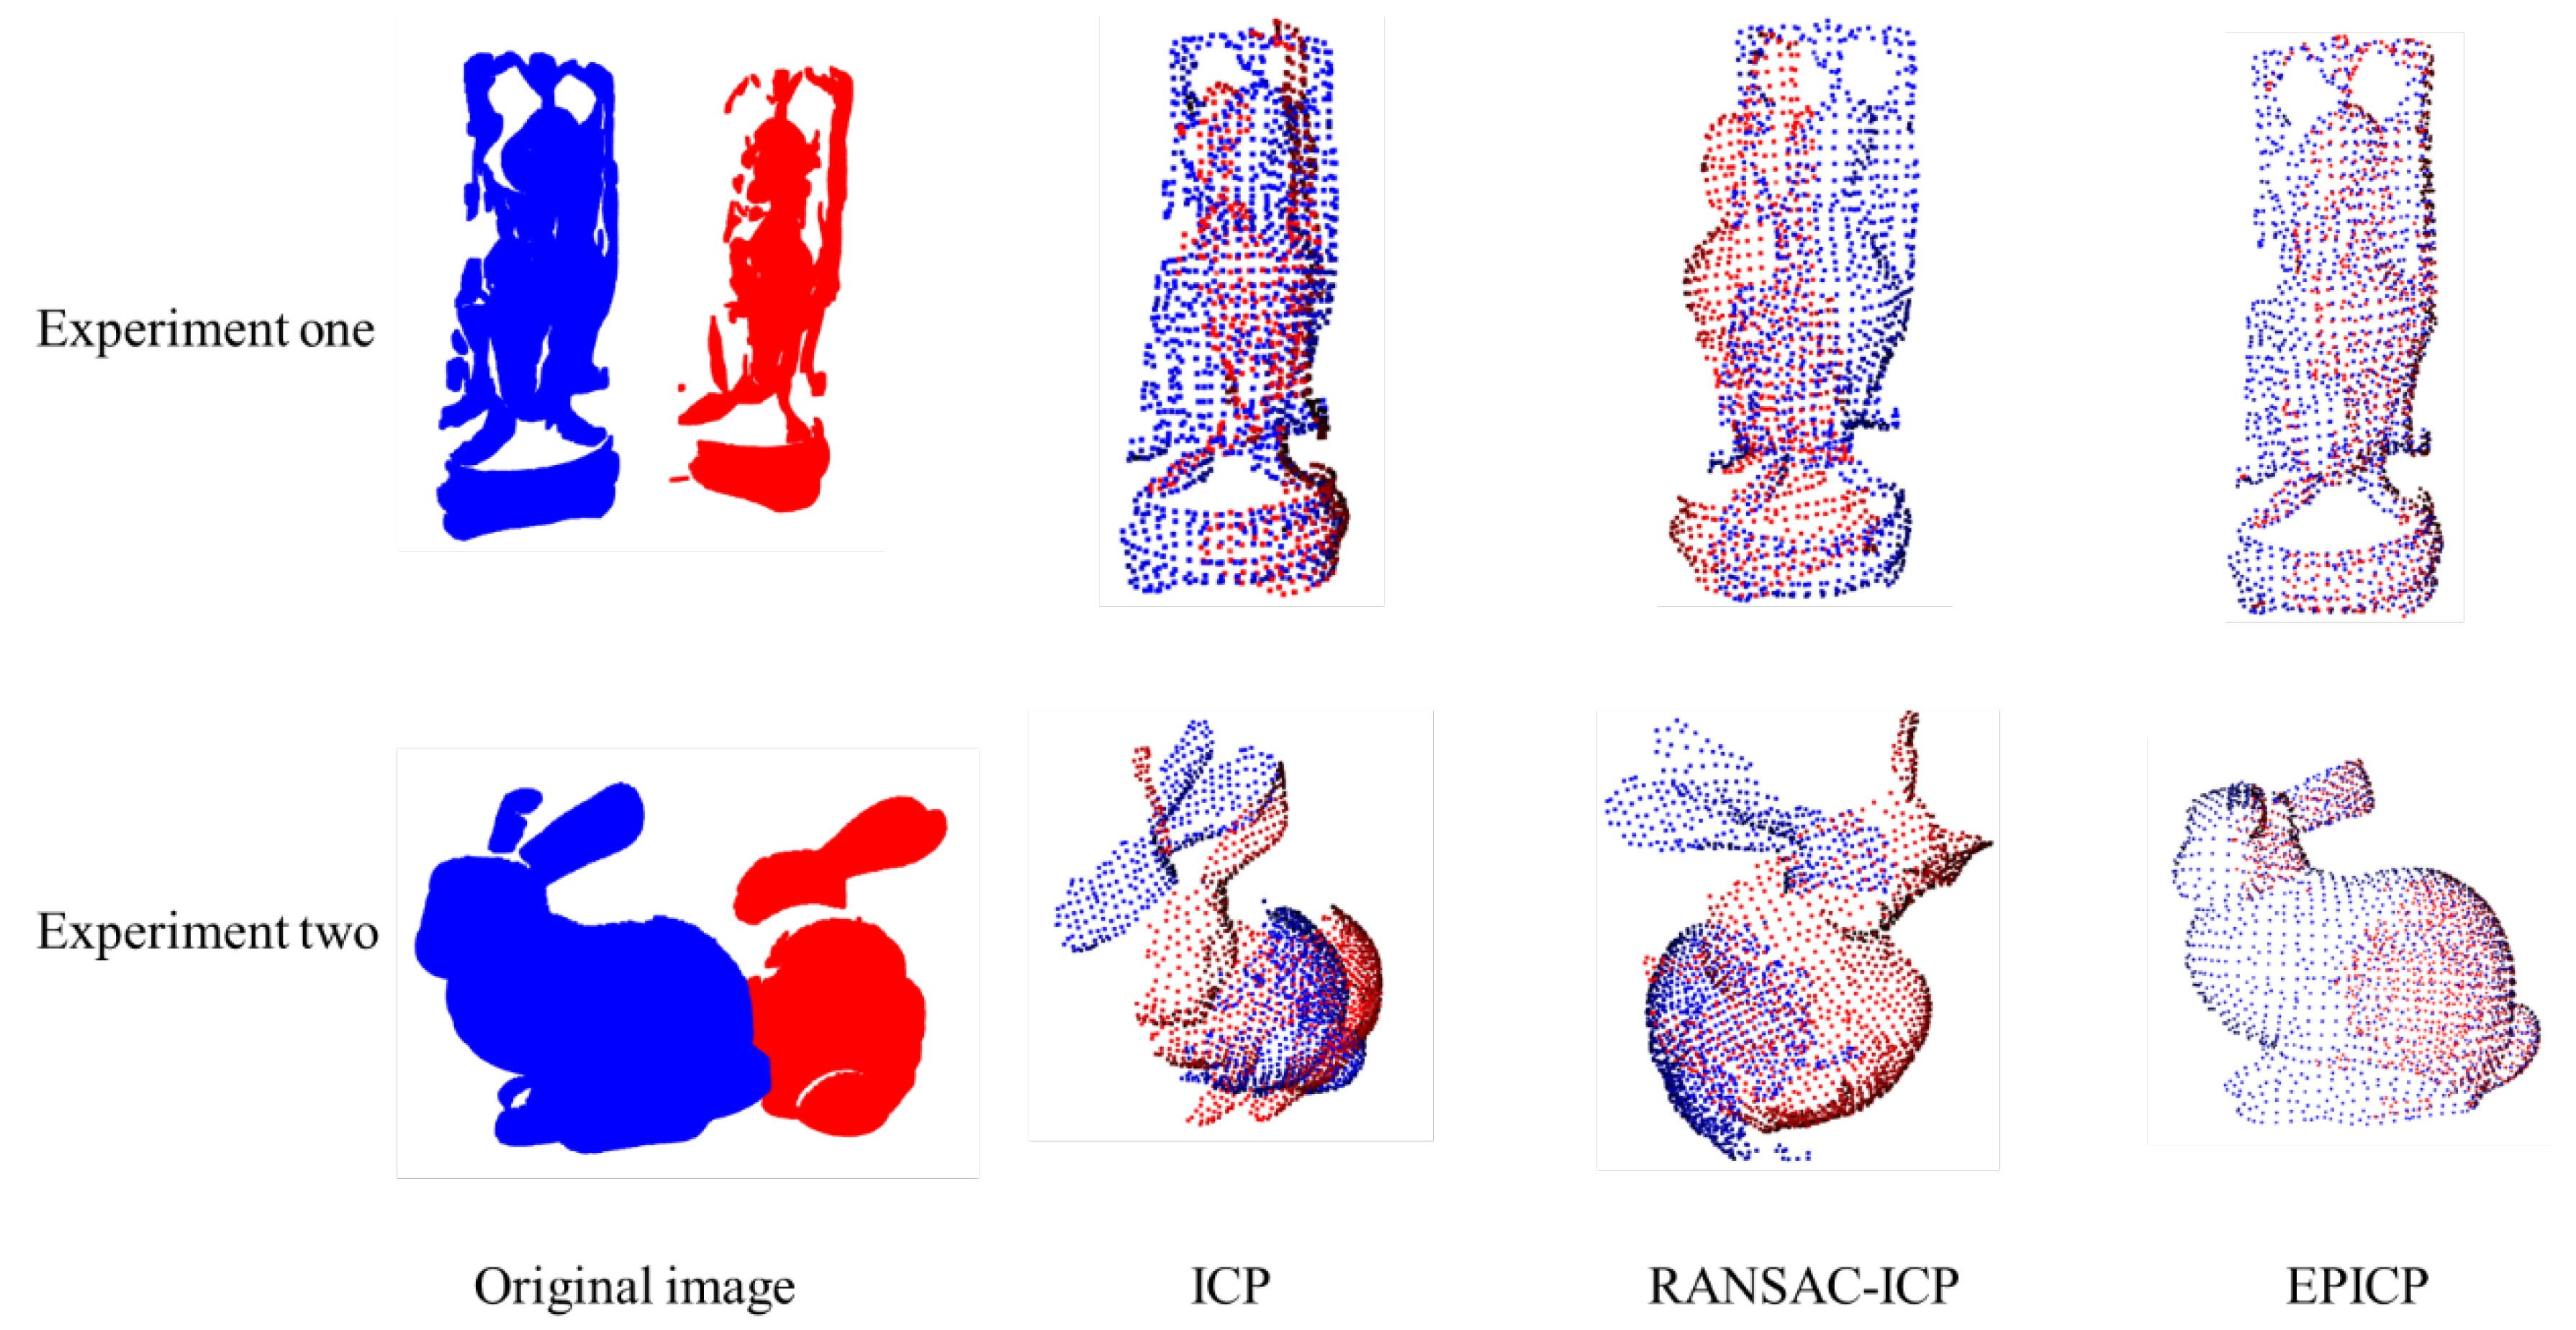
Figure 5.
RMSE Variation of Three Methods with Respect to Overlap Ratio.
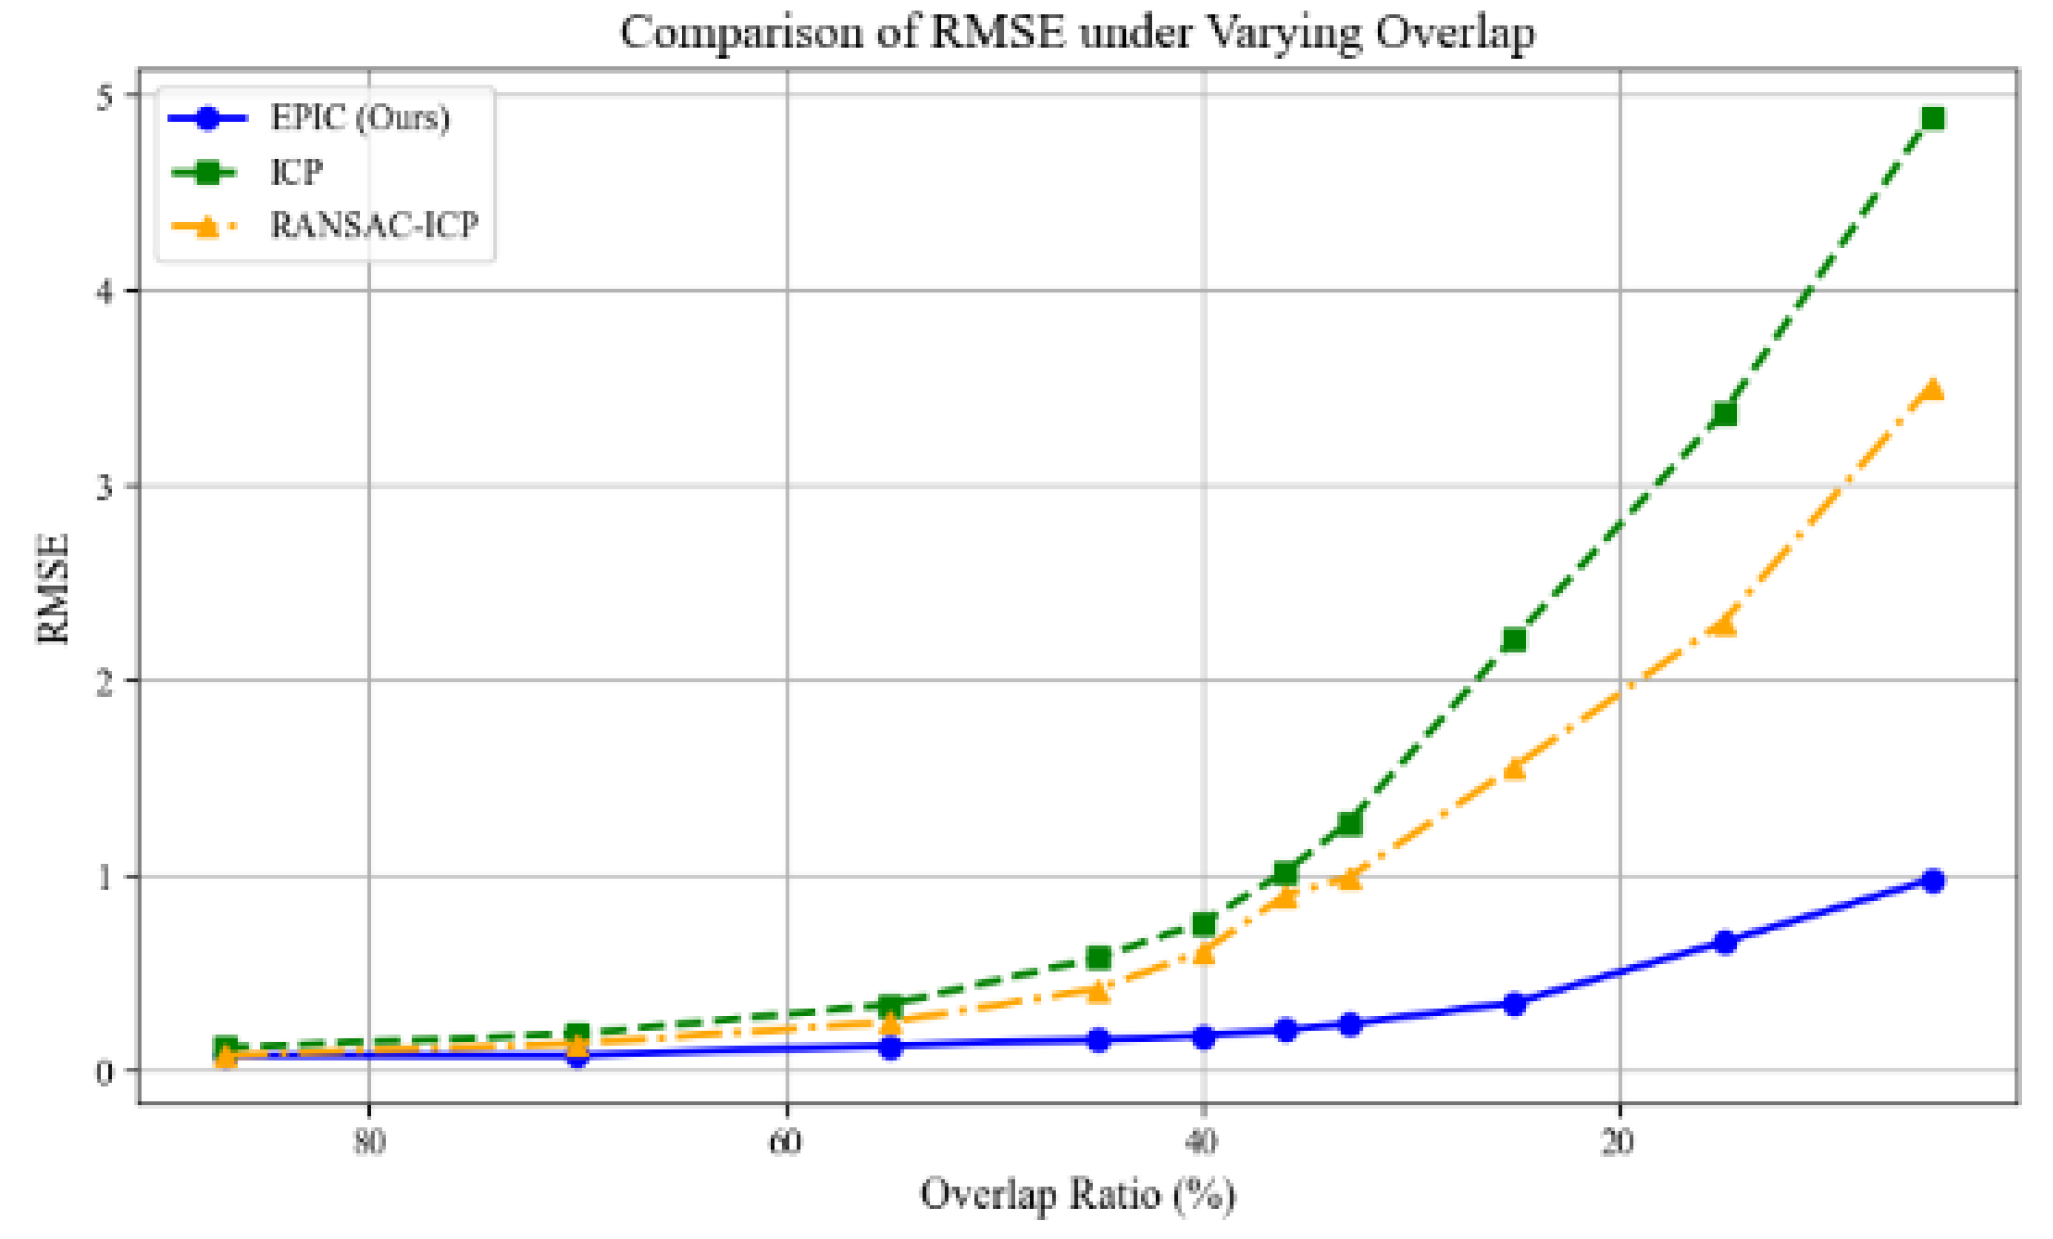
Table 1.
Summary of Registration Results on Three Datasets.
| Method | Bunny | Dragon | Happy Buddha | |||
| RMSE(cm) | Time(s) | RMSE(cm) | Time(s) | RMSE(cm) | Time(s) | |
| ICP | 0.12 | 6.8 | 0.19 | 7.4 | 0.18 | 7.2 |
| Ransac-ICP | 0.08 | 10.2 | 0.14 | 15.4 | 0.14 | 11.4 |
| EPICP | 0.08 | 11.7 | 0.11 | 18.7 | 0.10 | 11.8 |
Table 2.
Summary of Experimental Results.
| Method | RMSE(cm) | Time(s) | |
| Experimental one | ICP | 0.58 | 6.5 |
| RANSAC-ICP | 0.42 | 13.1 | |
| EPICP | 0.16 | 18.7 | |
| Experiment two | ICP | 1.27 | 7.9 |
| RANSAC-ICP | 0.99 | 14.5 | |
| EPICP | 0.24 | 24.3 |
Disclaimer/Publisher’s Note: The statements, opinions and data contained in all publications are solely those of the individual author(s) and contributor(s) and not of MDPI and/or the editor(s). MDPI and/or the editor(s) disclaim responsibility for any injury to people or property resulting from any ideas, methods, instructions or products referred to in the content. |
© 2025 by the authors. Licensee MDPI, Basel, Switzerland. This article is an open access article distributed under the terms and conditions of the Creative Commons Attribution (CC BY) license (http://creativecommons.org/licenses/by/4.0/).
Copyright: This open access article is published under a Creative Commons CC BY 4.0 license, which permit the free download, distribution, and reuse, provided that the author and preprint are cited in any reuse.


