
Submitted:
14 June 2025
Posted:
17 June 2025
You are already at the latest version
Abstract
This study aimed to assess the impact of glutathione S-transferase M1 (GSTM1) and N-acetyltransferase 2 (NAT2) polymorphisms on renal cell carcinoma (RCC) risk in Mongolian individuals, both independently and in combination with smoking and urinary tract diseases (UTDs). Methods: This hospital-based case-control study included 88 histologically confirmed RCC patients and 88 cancer-free controls, matched by age and sex. Genotyping of GSTM1 and NAT2 polymorphisms was performed using PCR-RFLP. Results: There were 34 men, and 54 women, with a mean age of 51.9 ± 13.2 years. The results revealed that NAT2 low acetylator genotype significantly increased risk of RCC (cOR=2.077, 95%CI=1.072-4.025, p=0.03). Notably, WT/M3 genotype was significantly associated with RCC risk (aOR=9.1, 95% CI=1.138–72.783; p=0.037). GSTM1-positive genotype significantly increased RCC risk when combined with NAT2 low acetylator genotypes (cOR=3.304, 95% CI=1.311–8.327, p=0.011). Among smokers, individuals with GSTM1-null genotype increased risk of RCC (cOR=4.654, 95% CI=1.458-14.86, p=0.009). Additionally, NAT2 low acetylator genotype significantly increased RCC risk in smokers (cOR=6.596, 95% CI=2.26–19.255, p=0.001). Furthermore, both GSTM1 and NAT2 genotypes were associated with significantly increased RCC risk following stratification by a history of urinary tract diseases. Conclusion: The findings suggest that the NAT2 WT/M3 polymorphism, along with smoking and UTDs, contributes to RCC susceptibility in Mongolian cases.
Keywords:
GSTM1
; NAT2
; renal cell carcinoma (RCC) risk
1. Introduction
Renal cell carcinoma (RCC) is the most prevalent form of kidney cancer, accounting for 90% of all renal malignancies and representing a significant global health burden [1].
RCC arises from the renal epithelium and is known for its high heterogeneity, resistance to chemotherapy, and late-stage detection, making it one of the most challenging malignancies to manage [2]. In 2020, RCC was responsible for over 430,000 new cases and approximately 180,000 deaths worldwide, with incidence rates continuing to rise, particularly in developing regions [3].
RCC is the most common urological cancer in Mongolia and its incidence continues to increase annually [4]. While advances in imaging and targeted therapies have improved survival outcomes, the lack of early diagnostic biomarkers and the influence of genetic and environmental risk factors make RCC a growing concern in oncology research [5,6].
The development of RCC is influenced by a complex interplay of genetic susceptibility and environmental exposures [5]. Several epidemiological studies have identified major risk factors, including hypertension, smoking, obesity, urinary tract diseases (UTD), diabetes mellitus, and occupational exposure to carcinogens. Among these, hypertension and smoking are the most consistently associated with RCC [7,8,9,10]. Genetic predisposition also plays a crucial role in RCC susceptibility, particularly in populations with distinct genetic backgrounds [11]. One of the most studied genetic variations in cancer susceptibility involves polymorphisms in detoxification and metabolic enzyme pathways, such as glutathione S-transferase M1 (GSTM1) and N-acetyltransferase 2 (NAT2) [11,12,13]. The GSTM1 gene, located on chromosome 1p13.3, encodes an enzyme that is critical in the detoxification of reactive oxygen species (ROS) and carcinogens. A homozygous deletion of the GSTM1 gene (GSTM1-null genotype) leads to a complete loss of enzymatic function, impairing the body's ability to detoxify harmful compounds and increasing oxidative stress-related DNA damage, which is a major factor in renal carcinogenesis [12,14].
Similarly, the NAT2 gene, located on chromosome 8p22, encodes an enzyme involved in the acetylation and biotransformation of carcinogenic aromatic amines, which are found in tobacco smoke, industrial chemicals, and dietary sources [15,16,17]. Variations in NAT2 result in different acetylation genotypes—slow, intermediate, and rapid acetylators—which influence an individual's ability to metabolize and eliminate carcinogens [17]. Slow acetylators have reduced enzymatic activity, leading to prolonged exposure to carcinogens, increasing the likelihood of mutations and cancer development [12,18]. While the role of NAT2 polymorphisms has been extensively studied in bladder cancer, its association with RCC remains unclear, particularly in Asian populations, where genetic diversity and environmental factors may modify its impact [19]. Mongolia provides a unique setting for studying the interplay between genetic and environmental risk factors for RCC. The high prevalence of tobacco smoking, hypertension, and obesity, coupled with potential exposure to contaminated drinking water, heavy metals, and traditional dietary patterns, suggests that Mongolians may have a distinct risk profile for RCC [19]. Furthermore, Mongolia’s high-altitude environment, characterized by chronic hypoxia, may contribute to oxidative stress and altered renal metabolism, potentially influencing RCC susceptibility [19,20,21]. Given these factors, a detailed investigation of GSTM1 and NAT2 polymorphisms in the Mongolian population could provide valuable insights into the genetic determinants of RCC and their interaction with lifestyle and environmental risk factors [22]. This hospital-based case-control study aims to assess the association between GSTM1 and NAT2 polymorphisms and RCC risk, both independently and in combination with smoking, hypertension, obesity, and urinary tract diseases (UTD). By evaluating genotype distributions and their modifying effects on RCC susceptibility, this study seeks to identify high-risk individuals, improve early detection strategies, and contribute to the development of personalized preventive measures for RCC in populations with distinct environmental and genetic backgrounds.
2. Results
The study included a total of 176 participants, comprising 88 renal cell carcinoma (RCC) patients and 88 cancer-free controls. The mean age of both groups was 51.9 ± 13.2 years, with an equal sex distribution (male: 34 (38.6%), female: 54 (61.4%) in each group), showing no significant difference between cases and controls. Most cases are diagnosed between the ages of 40 and 69 in Mongolia. (Table 1).
Several clinical and lifestyle factors demonstrated a significant association with RCC risk. Smoking was notably more prevalent among RCC patients (48.9%) compared to controls (20.5%), indicating a significant increase in RCC risk among smokers (p < 0.001). Similarly, hypertension was highly associated with RCC, with 53.4% of RCC patients having a history of hypertension compared to only 2.3% of controls (p < 0.001). Alcohol consumption was also significantly linked to RCC, with 28.4% of RCC cases reporting alcohol use, compared to 9.1% of controls (p = 0.001). A history of urinary tract diseases (UTD) was another major risk factor, with 33% of RCC patients having a history of UTD, compared to only 4.5% of controls, demonstrating a highly significant association with RCC risk (p < 0.001). In contrast, body mass index (BMI) was not significantly associated with RCC, though individuals with BMI >35 kg/m² had an increased but borderline significant risk (p = 0.135). These findings suggest that smoking, hypertension, alcohol consumption, and UTD history are major risk factors for RCC, warranting further investigation into their combined effects with genetic susceptibility (Table 1).
GSTM1 and NAT2 Genotypes and RCC Risk
The GSTM1-null genotype was detected in 52.3% of RCC cases and 53.4% of controls, showing no significant association with RCC risk (cOR= 0.947, 95% CI =0.497 - 1.805, p=0.869 and aOR = 0.727, 95% CI = 0.228 - 2.322, p = 0.59). These findings suggest that GSTM1 deletion alone may not contribute significantly to RCC susceptibility (Table 2). Conversely, NAT2 polymorphisms exhibited a notable influence on RCC risk. The NAT2 low acetylator genotype was found in 50% of RCC cases compared to 34.1% of controls, indicating a potential increase in RCC risk. Furthermore, the association was statistically significant after adjustment for confounders (cOR = 2.077, 95% CI = 1.072-4.025, p = 0.03) (Table 2). These results suggest that while the GSTM1-null genotype does not independently influence RCC risk, NAT2 polymorphisms does have a modifying effect.
Genotypic Distribution of NAT2 Polymorphisms
Analysis of specific NAT2 polymorphisms revealed significant associations with RCC susceptibility. The WT/M1 genotype was linked to an elevated RCC risk, with carriers showing a 3.667-fold increased likelihood of developing RCC (cOR = 3.667, 95% CI = 1.487-9.043, p = 0.005). The M2/M2 genotype was also associated with an increased RCC risk, and the result was statistically significant (cOR = 4.691, 95% CI = 1.475-14.916, p = 0.009). The WT/M3 genotype, which was more prevalent in RCC cases (34.1%) compared to controls (12.5%), demonstrating a significant 4.8-fold increased RCC risk (cOR = 4.8, 95% CI = 1.831-12.58, p = 0.001). A notable finding was the WT/M3 genotype was significantly associated with RCC risk (aOR=9.1, 95% CI=1.138–72.783; p=0.037). These results suggest that specific NAT2 polymorphisms, particularly WT/M3, do play a crucial role in RCC development, highlighting the need for further research to confirm these genetic associations (Table 2).
Combined Effects of GSTM1 and NAT2 on RCC Risk
Analysis of the combined effects of GSTM1 and NAT2 polymorphisms showed varying degrees of RCC susceptibility (Table 2). Individuals carrying the GSTM1-null/NAT2-low genotype did not exhibit a significant increase in RCC risk (cOR = 1.68, 95% CI = 0.684-4.128, p = 0.258), indicating that this genotype combination alone may not be a major contributing factor. Furthermore, individuals with the GSTM1-positive/NAT2-low genotype demonstrated a notable 3.3-fold increased risk of developing RCC (cOR = 3.3, 95% CI = 1.311-8.327, p = 0.011) with statistical significance. These findings suggest that while GSTM1 and NAT2 polymorphisms cooperate in RCC susceptibility.
Stage, Histology, and Tumor Characteristics
Among RCC patients, the majority were diagnosed at Stage I (56.8%), followed by Stage III (19.3%), Stage IV (12.5%), and Stage II (11.4%), indicating that a significant proportion of cases were detected in the early stages of the disease. Histological classification revealed that clear cell RCC was the predominant subtype, accounting for 87.5% of cases, while chromophobe RCC (5.7%) and papillary RCC (6.8%) were less frequently observed. Tumor volume analysis showed that larger tumors (>40 cm³) were uncommon (2.3%), whereas most tumors (56%) fell within the 10-40 cm³ range, suggesting a wide variation in tumor size at diagnosis (Table 3). These findings highlight the importance of early-stage detection in RCC, with most cases being diagnosed at Stage I and predominantly presenting as clear cell carcinoma.
Modifying Effects of Lifestyle Factors on Genetic Risk
Association Between Genetic Polymorphisms and RCC Stages
Analysis of genetic polymorphisms (GSTM1 and NAT2) by RCC stage revealed notable trends:
GSTM1 Genotype and RCC Stages
- GSTM1-Positive: Most cases were diagnosed at Stage I (56.8%), while fewer were in advanced stages (Stage III: 19.3%, Stage IV: 12.5%).
- GSTM1-Null: A similar proportion was diagnosed at Stage I (52.4%), but more cases appeared in advanced stages (Stage III: 21.4%, Stage IV: 14.3%).
- Although not statistically significant (p=0.876), the GSTM1-null genotype showed a trend toward advanced RCC stages.
NAT2 Genotype and RCC Stages
- NAT2 Low Acetylator: More cases were diagnosed at Stage I (70.5%), with fewer at advanced stages (Stage III: 15.9%, Stage IV: 9.1%).
- NAT2 High Acetylator: Cases were more evenly distributed (Stage I: 43.2%, Stage III: 22.7%, Stage IV: 15.9%).
- The association between NAT2 genotype and RCC stage was statistically significant (p=0.05).
- Combined Effects of GSTM1 and NAT2 Genotypes
- The combination of GSTM1-null and NAT2 low acetylator genotypes was more common in advanced RCC stages (Stage III and IV).
- In contrast, GSTM1-positive and NAT2 high acetylator genotypes were primarily seen at Stage I.
Smoking and RCC Risk
A significant interaction between smoking and genetic polymorphisms was observed in RCC risk. Among smokers, individuals carrying the GSTM1-null genotype exhibited a 4.65-fold increased RCC risk (cOR = 4.65, 95% CI = 1.458-14.86, p = 0.009) which is statistically significant. The risk was more pronounced among smokers with the NAT2-low acetylator genotype, who showed a 6.59-fold increased RCC risk (cOR = 6.596, 95% CI = 2.26-19.255, p = 0.001), further emphasizing the role of smoking as a major environmental trigger in genetically susceptible individuals (Table 4).
Urinary Tract Diseases (UTD) and RCC Risk
A history of urinary tract diseases (UTD) significantly modified RCC susceptibility. Among individuals with the GSTM1-null genotype and a history of UTD, RCC risk was 14.16 times higher (p = 0.014). The effect was also pronounced among NAT2-high acetylators with UTD, who demonstrated 20.72-fold increased RCC risk. The highest risk was observed among NAT2-low acetylators with UTD, with a 35.99-fold increased RCC risk (p = 0.002). These findings highlight the critical role of renal health in modifying genetic susceptibility to RCC, suggesting that individuals with both genetic and clinical risk factors should be prioritized for early detection and preventive interventions (Table 4).
The study identified several significant factors influencing renal cell carcinoma (RCC) susceptibility, highlighting the interplay between genetic polymorphisms and environmental risk factors. Smoking and UTD acted as major contributors, significantly amplifying susceptibility in genetically predisposed individuals. NAT2 polymorphisms, including WT/M1, M2/M2, and WT/M3, were significantly linked to higher RCC risk. The WT/M3 genotype exhibited the strongest association, suggesting that specific NAT2 variants may influence carcinogenesis in renal tissue. The GSTM1-null genotype alone was not significantly associated with RCC risk. However, when combined with smoking and UTD, the GSTM1-null genotype significantly increased RCC susceptibility, emphasizing the importance of gene-environment interactions.
3. Discussion
This study investigated the association between GSTM1 and NAT2 genetic polymorphisms and renal cell carcinoma (RCC) risk in the Mongolian population, with a focus on their interaction with smoking, alcohol consumption, and urinary tract diseases (UTD). Our findings revealed that smoking, alcohol consumption and UTD were the most significant risk factors for RCC, while specific NAT2 polymorphisms exhibited notable effects on susceptibility.
We focused on two key genetic polymorphisms: GSTM1 (glutathione S-transferase M1) and NAT2 (N-acetyltransferase 2). The GSTM1 gene is characterized by a deletion polymorphism, where individuals can be classified as either GSTM1-positive (major allele) or GSTM1-null (minor allele). The GSTM1-null genotype is associated with the absence of GSTM1 enzyme activity, which may impair the body’s ability to detoxify carcinogens, increasing oxidative stress and DNA damage.
The NAT2 gene exhibits polymorphisms that result in different acetylation phenotypes: rapid, intermediate, and slow acetylators. The NAT2 gene has several polymorphic sites, including NAT2*5, NAT2*6, and NAT2*7, which are detected through PCR-RFLP analysis using specific restriction enzymes (KpnI for NAT2*5, TaqI for NAT2*6, and BamHI for NAT2*7). In our study, the NAT2 slow acetylator genotype (composed of combinations of mutant alleles, such as NAT2*5, NAT2*6, and NAT2*7) was identified as the minor allele, while the rapid acetylator genotype (wild-type, WT) was considered the major allele. Individuals carrying two mutant alleles were classified as slow acetylators, while those with at least one wild-type allele were classified as rapid or intermediate acetylators.
Our results indicate that the GSTM1-null genotype was not independently associated with RCC risk (p = 0.869), consistent with previous studies that found no direct link between GSTM1 deletion and RCC [23]. However, the impact of GSTM1-null genotype was amplified in the presence of environmental risk factors, particularly smoking and UTD. Smokers carrying the GSTM1-null genotype had a 4.65-fold increased RCC risk (p = 0.009), supporting prior findings that GSTM1-null individuals may have reduced detoxification capacity for carcinogens in tobacco smoke [23,24]. Furthermore, the GSTM1-null genotype was significantly associated with RCC risk among individuals with a history of UTD (p = 0.014). This suggests that chronic inflammation, oxidative stress, and renal dysfunction may exacerbate genetic susceptibility, ultimately increasing RCC risk [24]. These findings highlight the need for early monitoring of individuals with UTD who carry the GSTM1-null genotype, as they may be at higher risk for RCC progression.
Unlike GSTM1, NAT2 polymorphisms exhibited a more significant association with RCC susceptibility. The NAT2-low acetylator genotype was observed in 50% of RCC cases and 34.1% of controls, indicating a significant RCC risk (p = 0.03). Previous research has linked NAT2-low acetylators with increased susceptibility to bladder cancer due to their reduced ability to detoxify aromatic amines [25,26]. Similarly, our findings suggest that in RCC, NAT2-low acetylators may accumulate fewer carcinogenic metabolites in renal tissue, potentially influencing a different detoxification pathway in kidney cells. Analysis of specific NAT2 polymorphisms revealed that certain genotypes were strongly associated with RCC risk:
WT/M1 genotype was linked to a 3.667-fold increased RCC risk (p = 0.005).
M2/M2 genotype demonstrated a 4.691-fold elevated RCC risk (p = 0.009).
WT/M3 genotype was significantly associated with RCC, with a 4.8-fold increased risk (p = 0.001).
These findings suggest that specific NAT2 polymorphisms impair the detoxification of carcinogens, leading to increased DNA damage and tumor formation in renal tissue. Further studies are needed to explore the functional mechanisms of these polymorphisms in RCC development [27].
Renal cell carcinoma (RCC) is a relatively uncommon malignancy in Mongolia, with an age-standardized incidence rate (ASR) of 4.3 per 100,000 according to GLOBOCAN data. This low incidence limited the available patient population for recruitment in our study, resulting in a modest sample size that may have influenced the statistical power of our findings. Specifically, the smaller sample size could reduce the ability to detect subtle associations between specific gene polymorphisms and RCC risk, potentially overlooking less common but clinically significant genetic variants. This limitation may also impact the generalizability of our findings to broader populations, especially in settings with different environmental exposures or genetic backgrounds.
To mitigate this concern, we adopted a matched case-control design, ensuring an equal distribution of RCC patients and cancer-free controls, matched by age and sex. This approach minimized the influence of confounding variables, enhancing the internal validity of our findings. Nevertheless, the restricted sample size underscores the importance of larger, multi-center studies that can more accurately assess the genetic and environmental determinants of RCC risk. Such studies would provide a more robust evaluation of gene-environmental interactions, improving the reliability of observed associations.
Our study provides preliminary insights into the genetic susceptibility of RCC within a high-altitude population characterized by unique environmental exposures, such as chronic hypoxia, dietary habits, and exposure to heavy metals in drinking water. These factors may amplify the impact of genetic polymorphisms, contributing to RCC development. By focusing on a population with distinct environmental conditions, our findings may offer valuable insights into how genetic and environmental factors collectively influence RCC risk.
Future research should prioritize clear cell RCC (ccRCC), the most prevalent subtype of RCC in Mongolia, given that it accounts for the majority of RCC cases in this population. Investigating ccRCC specifically would allow for a more precise evaluation of the genetic and environmental factors contributing to this subtype’s development. Clear cell RCC is known for its distinct molecular characteristics and response to treatment, making it a critical focus for understanding RCC in Mongolian populations.
In addition to the GSTM1 polymorphism investigated in this study, future research should also explore other glutathione S-transferase (GST) polymorphisms, including GSTT1 and GSTP1 [28]. These enzymes play crucial roles in cellular detoxification by catalyzing the conjugation of glutathione to a wide range of electrophilic compounds, including carcinogens. The GSTT1 and GSTP1 polymorphisms have been extensively studied in various cancers and are known to influence cancer susceptibility through their impact on detoxification capacity. Understanding the combined effects of GSTM1, GSTT1, and GSTP1 polymorphisms on RCC risk could provide a more comprehensive assessment of the role of GST genes in renal carcinogenesis.
Moreover, larger-scale studies should aim to perform detailed subgroup analyses, exploring the interactions between genetic polymorphisms and various environmental exposures, including smoking, hypertension, alcohol consumption, and urinary tract diseases. Such analyses could elucidate how these factors synergize with genetic susceptibility to increase RCC risk. For instance, individuals with NAT2 low acetylator genotypes may exhibit higher RCC risk when exposed to tobacco smoke, while GSTM1-null genotypes could confer increased susceptibility in the presence of urinary tract diseases.
Additionally, future studies should consider the influence of other RCC-related genetic polymorphisms, such as VHL, MET, and PBRM1, which are known to play critical roles in RCC pathogenesis [29]. Expanding the genetic scope of investigation would allow for a more comprehensive understanding of the molecular mechanisms underlying RCC in the Mongolian population.
Given the high-altitude environment of Mongolia, which is associated with chronic hypoxia, further studies could also explore the potential impact of hypoxia-related genes on RCC susceptibility. Hypoxia-inducible factors (HIFs), which regulate cellular responses to low oxygen levels, may interact with genetic polymorphisms to modulate RCC risk. Understanding these interactions could uncover novel insights into the unique aspects of RCC pathogenesis in high-altitude populations.
Previous studies have demonstrated the combined effects of multiple GST polymorphisms (GSTM1, GSTT1, and GSTP1) on susceptibility to urogenital cancers [30]. For instance, a meta-analysis revealed that individuals with GSTM1-null, GSTT1-null, and combined GSTM1/GSTT1 double-null genotypes exhibited an increased risk of bladder cancer. Similar associations were observed in prostate cancer, where individuals carrying both GSTM1 and GSTT1-null genotypes showed higher cancer susceptibility [28]. In renal cell carcinoma, certain combinations, such as GSTM1-GSTT1 and GSTT1-GSTP1 dual null genotypes, were linked to an elevated RCC risk. These findings highlight the importance of investigating multiple GST polymorphisms in future research to fully understand their combined impact on RCC risk in the Mongolian population.
In conclusion, while our study provides valuable insights into the association between GSTM1 and NAT2 polymorphisms and RCC risk in Mongolia, future research should focus on expanding sample sizes, enhancing the diversity of genetic markers analyzed, and exploring the complex interactions between genetic susceptibility and environmental exposures. Such efforts would not only validate our findings but also contribute to the development of personalized risk assessment and prevention strategies for RCC in diverse populations.
Interaction Between Genetic and Environmental Risk Factors
This study found that environmental factors significantly influenced the genetic risk of RCC, demonstrating a strong gene-environment interaction. The most notable associations were observed for:
- Smoking: Individuals carrying the NAT2-low acetylator genotype who smoked had a 6.59-fold increased RCC risk (p = 0.001). This supports the hypothesis that slow acetylators metabolize carcinogens differently, leading to a higher accumulation of toxic metabolites in renal cells [12].
- UTD: The strongest interaction was observed among individuals with both NAT2-low acetylator genotype and UTD, who exhibited a 35.99-fold increased RCC risk (p = 0.002). This suggests that chronic renal dysfunction may heighten the carcinogenic impact of NAT2 polymorphisms, further elevating RCC risk.
These results indicate that genetic polymorphisms alone are insufficient to drive RCC development, but when combined with environmental exposures, they create a high-risk profile for tumor initiation and progression.
Comparison with Other Studies
Our findings are consistent with previous research on GSTM1 and NAT2 polymorphisms in cancer susceptibility, but they also provide new insights specific to renal cell carcinoma in the Mongolian population. Previous studies have primarily focused on bladder cancer, lung cancer, and colorectal cancer, while RCC remains understudied in this context [12].
Compared to other populations, our data indicate higher RCC risk among Mongolians with hypertension, smoking history, alcohol drinking, and UTD, suggesting potential gene-environment interactions unique to this demographic. The high altitude and chronic hypoxia of Mongolia may also contribute to RCC development, warranting further investigation into hypoxia-induced genetic changes and metabolic adaptations.
Strengths and Limitations
Strengths
- This is one of the first comprehensive case-control studies examining GSTM1 and NAT2 polymorphisms in RCC in Mongolia.
- We included a well-matched control group, minimizing potential confounding variables.
- The study explored gene-environment interactions, providing insights into modifiable risk factors for RCC prevention.
Limitations
- The sample size is moderate (88 cases, 88 controls), which may limit the generalizability of the findings.
- The study does not include other RCC-related genetic polymorphisms (e.g., VHL, MET, or PBRM1 mutations).
- Dietary factors, exposure to heavy metals, and air pollution, which may contribute to RCC risk, were not extensively assessed.
Graphical Summary of GSTM1 and NAT2 Polymorphisms and RCC Risk
Study Design: Case-Control Study (88 RCC cases, 88 controls)
Key Findings
- NAT2 Low Acetylator Genotype: Significantly increases RCC risk (cOR=2.077, p=0.03)
- WT/M3 Genotype: Strongest association with RCC (aOR=9.1, p=0.037)
- GSTM1 Positive + NAT2 Low: 3.3-fold increased RCC risk (cOR=3.304, p=0.011)
- Smokers with GSTM1-null: 4.65-fold higher RCC risk (cOR=4.654, p=0.009)
- RCC Risk Factors: Smoking, UTD, Hypertension, Alcohol Consumption
- Focus for Future Research: Clear Cell RCC (ccRCC) and Multi-GST Polymorphisms (GSTM1, GSTT1, GSTP1).
4. Materials and Methods
Study Design and Population
This study was designed as a hospital-based case-control study to investigate the association between GSTM1 and NAT2 genetic polymorphisms and the risk of renal cell carcinoma (RCC) in the Mongolian population. The study included 88 histologically confirmed RCC patients and 88 cancer-free controls, all recruited from the First Central Hospital of Mongolia. The control group consisted of healthy individuals with no prior history of RCC or any other malignancy, matched with cases by age and sex to minimize confounding factors. Participants were recruited between 2019 and 2024, and all provided written informed consent before participation. Ethical approval for the study was obtained from the Scientific Research Committee of the Mongolian National University of Medical Sciences (Approval No.: 2023/04/21–2023/3-04).
Data Collection
A structured questionnaire was used to collect demographic and clinical information, including:
- Age, sex, body mass index (BMI), smoking, alcohol drinking, exercise, and dietary habits
- Medical history of hypertension, diabetes mellitus, and urinary tract diseases (UTD)
Additionally, 3 mL of peripheral blood was collected from all participants for genetic analysis.
Genomic DNA Extraction and Genotyping
Genomic DNA was extracted from white blood cells using the Qiagen Mini Blood DNA Extraction Kit (Qiagen, USA) following the manufacturer’s protocol. The quality and concentration of DNA were assessed using agarose gel electrophoresis and spectrophotometry.
GSTM1 Genotyping
The presence or absence of the GSTM1 gene was determined using the multiplex polymerase chain reaction (PCR) method (Table 5). The presence or absence of the GSTM1 bands indicates the respective gene's presence or null genotype (Figure 1). The albumin band serves as an internal control to confirm successful PCR amplification. PCR was performed in a total reaction volume of 25 µL, containing: Genomic DNA (200 ng), Primers (50 pM), dNTP mix (0.2 mM each), Taq polymerase (1 U, Thermo Fisher Scientific, USA), PCR buffer with MgCl₂ (2.0 mM). Amplification conditions included an initial denaturation at 94°C for 4 minutes, followed by 30 cycles of denaturation at 94°C for 30 seconds, annealing at 57°C for 30 seconds, and extension at 72°C for 1.5 minutes, with a final extension at 72°C for 5 minutes. The PCR products were separated on a 2% agarose gel and visualized under UV light.
NAT2 Genotyping
Polymorphisms in the NAT2 gene were analyzed using the PCR-restriction fragment length polymorphism (PCR-RFLP) method. The NAT2 low acetylator genotype was determined based on the presence of NAT2*5, NAT2*6, and NAT2*7 alleles, identified using restriction enzyme digestion with: KpnI for NAT2*5 allele (incubated at 37°C for 1 hour),TaqI for NAT2*6 allele (incubated at 65°C for 1 hour), BamHI for NAT2*7 allele (incubated at 30°C for 1 hour). The digested products were separated by agarose gel electrophoresis (2.0% for NAT2*5 and NAT2*7, and 3.0% for NAT2*6) and visualized under UV transillumination. Subjects with two wildtype (WT) alleles were classified as high acetylators, while those with two mutant alleles (M1, M2, or M3) were classified as low acetylators. The details of the primer sets are provided in Table 5.
PCR-RFLP used for NAT2 genotyping
N-acetyltransferase 2 (NAT2) gene polymorphisms were analyzed using the PCR-restriction fragment length polymorphism (PCR-RFLP) technique. Briefly, PCR amplification was followed by digestion of the amplified fragment with restriction enzymes (KpnI, TaqI, and BamHI) to detect slow acetylator alleles NAT2*5, NAT2*6, or NAT2*7.
A single polymerase chain reaction (PCR) was performed using the primers specified in Table 5. The PCR mixture (80 µL) contained 200 ng of genomic DNA, primers (50 pM), dNTPs (0.2 mM), Taq polymerase (1 U), PCR buffer, and MgCl₂ (2.0 mM). The reaction was initiated with an initial denaturation at 94°C for 4 minutes, followed by 30 cycles of denaturation at 94°C for 30 seconds, annealing at 57°C for 30 seconds, and extension at 72°C for 90 seconds. A final extension at 72°C for 5 minutes was performed, resulting in a unique amplified fragment of 1093 bp.
Following PCR, 0.02 mL aliquots of the PCR product were digested with the following restriction enzymes:
KpnI (60 minutes at 37°C) for detecting the NAT2*5 allele.
TaqI (60 minutes at 65°C) for detecting the NAT2*6 allele.
BamHI (60 minutes at 30°C) for detecting the NAT2*7 allele.
The digested products were separated on agarose gels (2.0% for NAT2*5 and NAT2*7, and 3.0% for NAT2*6) and visualized using a UV transilluminator. Subjects with two wild-type (WT) alleles were classified as high acetylators, while those with two mutant alleles (such as M1, M2, or M3) were classified as slow acetylators (Figure 2).
Statistical Analysis
All statistical analyses were conducted using Stata 13.0 (StataCorp, USA). Descriptive statistics were used to summarize the demographic, clinical, and genetic characteristics of RCC patients and controls. Categorical variables were expressed as frequencies and percentages, while continuous variables were summarized as means ± standard deviations (SD).
To compare categorical variables, including genotype distributions and lifestyle factors between RCC cases and controls, Pearson’s chi-square test (χ²) was applied. For continuous variables such as age, independent t-tests were used to assess differences between the two groups. The association between GSTM1 and NAT2 genetic polymorphisms and RCC risk was analyzed using univariate logistic regression, estimating crude odds ratios (cORs) and 95% confidence intervals (CIs). To adjust for potential confounders, including age, sex, alcohol consumption, smoking, hypertension, and history of UTD, multivariable logistic regression was performed to calculate adjusted odds ratios (aORs) and 95% CIs. Additionally, gene-environmental interactions were assessed by analyzing the association between GSTM1/NAT2 polymorphisms and RCC risk, stratified by smoking status, alcohol consumption, hypertension, and UTD. A p-value ≤0.05 was considered statistically significant, and all statistical tests were two-tailed. Multiple comparisons were adjusted where necessary to ensure accuracy in the analysis.
Ethical Considerations
The study was conducted in accordance with the Declaration of Helsinki and was approved by the Scientific Research Committee of the Mongolian National University of Medical Sciences. Written informed consent was obtained from all participants before enrollment.
5. Conclusions
This study provides important insights into the relationship between GSTM1 and NAT2 genetic polymorphisms and renal cell carcinoma (RCC) risk in the Mongolian population. Our findings confirm that tobacco smoking, hypertension, and urinary tract diseases (UTD) are major contributors to RCC development, with genetic susceptibility significantly modifying disease risk.
Although the GSTM1-null genotype was not independently associated with RCC, its presence in smokers and individuals with UTD significantly increased RCC susceptibility. In contrast, NAT2 polymorphisms had a notable impact on RCC risk, with specific variants such as WT/M1, M2/M2, and WT/M3 being strongly linked to RCC development. Interestingly, the GSTM1-null genotype appeared protective in the general population but became a significant risk factor in smokers and individuals with urinary tract diseases, highlighting the complex gene-environment interactions involved in RCC pathogenesis.
These results emphasize the importance of integrating both genetic and environmental risk factors into RCC risk assessment and prevention strategies. Individuals carrying high-risk genetic polymorphisms, especially smokers and those with urinary tract diseases and hypertension, may benefit from early screening and targeted interventions. Furthermore, the strong link between hypertension, UTD, and RCC suggests that improved blood management and renal health could play a crucial role in reducing RCC incidence in genetically susceptible individuals.
Author Contributions
G.B, M.T and Sh.A conceived the project and designed the research. G.B, M.P, B.S, N.D, TS.Sh, G.Yu, M.T and Sh.A contributed to study conception, planning experiments and technical support. G.B, M.T and Sh.A conducted data analysis and data interpretation. G.B, M.T and Sh.A participated in the result discussion and technical support. G.B, M.T and Sh.A wrote the manuscript. All authors read and approved the final.
Acknowledgments
We express thanks to all the participants and the support of the FCHM, MCCH, Bionorica and Mongolian National University of Medical Sciences.
References
- J. J. Hsieh et al., “Renal cell carcinoma,” Nat Rev Dis Primers, vol. 3, p. 17009, Mar. 2017. [CrossRef]
- P. Makhov, S. Joshi, P. Ghatalia, A. Kutikov, R. G. Uzzo, and V. M. Kolenko, “RESISTANCE TO SYSTEMIC THERAPIES IN CLEAR CELL RENAL CELL CARCINOMA: MECHANISMS AND MANAGEMENT STRATEGIES,” Mol Cancer Ther, vol. 17, no. 7, p. 1355, Jul. 2018. [CrossRef]
- J. Yang, K. Wang, and Z. Yang, “Treatment strategies for clear cell renal cell carcinoma: Past, present and future,” Front Oncol, vol. 13, p. 1133832, 2023. [CrossRef]
- S. E. T. U. O. D. O. C. R. D. Sandagdorj T, “Cancer Incidence and Mortality in Mongolia - National Registry Data,” Asian Pac J Cancer Prev, no. 11, pp. 1509–1514, 2010.
- W. H. Chow, L. M. Dong, and S. S. Devesa, “Epidemiology and risk factors for kidney cancer,” Nat Rev Urol, vol. 7, no. 5, p. 245, May 2010. [CrossRef]
- T. Qayyum, G. Oades, P. Horgan, M. Aitchison, and J. Edwards, “The Epidemiology and Risk Factors for Renal Cancer,” Curr Urol, vol. 6, no. 4, p. 169, 2013. [CrossRef]
- X. Jin et al., “Pathophysiology of obesity and its associated diseases,” Jun. 01, 2023, Chinese Academy of Medical Sciences. [CrossRef]
- K. T. Flaherty et al., “A prospective study of body mass index, hypertension, and smoking and the risk of renal cell carcinoma (United States),” Cancer Causes and Control, vol. 16, no. 9, pp. 1099–1106, Nov. 2005. [CrossRef]
- M. L. Cote et al., “Cigarette smoking and renal cell carcinoma risk among black and white Americans: effect modification by hypertension and obesity,” Cancer Epidemiol Biomarkers Prev, vol. 21, no. 5, p. 770, May 2012. [CrossRef]
- R. C. Brownson, “A case-control study of renal cell carcinoma in relation to occupation, smoking, and alcohol consumption,” Arch Environ Health, vol. 43, no. 3, pp. 238–241, 1988. [CrossRef]
- B. Shuch and J. Zhang, “Genetic Predisposition to Renal Cell Carcinoma: Implications for Counseling, Testing, Screening, and Management,” J Clin Oncol, vol. 36, no. 36, pp. 3560–3566, Dec. 2018. [CrossRef]
- M. McGrath, D. Michaud, and I. De Vivo, “Polymorphisms in GSTT1, GSTM1, NAT1 and NAT2 genes and bladder cancer risk in men and women,” BMC Cancer, vol. 6, p. 239, Oct. 2006. [CrossRef]
- M. C. Matheson, T. Stevenson, S. Akbarzadeh, and D. N. Propert, “GSTT1 null genotype increases risk of premenopausal breast cancer,” Cancer Lett, vol. 181, no. 1, pp. 73–79, Jul. 2002. [CrossRef]
- S. C. Cotton, L. Sharp, J. Little, and N. Brockton, “Glutathione S-Transferase Polymorphisms and Colorectal Cancer: A HuGE Review,” Am J Epidemiol, vol. 151, no. 1, pp. 7–32, Jan. 2000. [CrossRef]
- T. D. da Silva, A. V. Felipe, J. M. de Lima, C. T. F. Oshima, and N. M. Forones, “N-Acetyltransferase 2 genetic polymorphisms and risk of colorectal cancer,” World Journal of Gastroenterology : WJG, vol. 17, no. 6, p. 760, 2011. [CrossRef]
- J. J. Eggermont, “Epidemiology and Genetics of Hearing Loss and Tinnitus,” Hearing Loss, pp. 209–234, 2017. [CrossRef]
- E. M. McDonagh, S. Boukouvala, E. Aklillu, D. W. Hein, R. B. Altman, and T. E. Klein, “PharmGKB Summary: Very Important Pharmacogene information for N-acetyltransferase 2,” Pharmacogenet Genomics, vol. 24, no. 8, p. 409, 2014. [CrossRef]
- R. L. Yung and B. C. Richardson, “PATHOPHYSIOLOGY OF DRUG-INDUCED LUPUS,” Systemic Lupus Erythematosus, Fourth Edition, pp. 1185–1210, Jan. 2004. [CrossRef]
- S. Pengpid and K. Peltzer, “Trends in concurrent tobacco use and heavy drinking among individuals 15 years and older in Mongolia,” Sci Rep, vol. 12, no. 1, Dec. 2022. [CrossRef]
- O. Dugee et al., “Association of major dietary patterns with obesity risk among Mongolian men and women,” 2009.
- A. W. Bigham, “Genetics Of Human Origin and Evolution: High-Altitude Adaptations,” Curr Opin Genet Dev, vol. 41, p. 8, Dec. 2016. [CrossRef]
- A. Zupa, A. Sgambato, G. Improta, and G. La Torre, “GSTM1 and NAT2 Polymorphisms and Colon, Lung and Bladder Cancer Risk: A Case-control Study.” [Online]. Available: https://www.researchgate.net/publication/24428466.
- L. S. Engel et al., “Pooled Analysis and Meta-analysis of Glutathione S-Transferase M1 and Bladder Cancer: A HuGE Review,” Am J Epidemiol, vol. 156, no. 2, pp. 95–109, Jul. 2002. [CrossRef]
- R. J. Hung et al., “GST, NAT, SULT1A1, CYP1B1 genetic polymorphisms, interactions with environmental exposures and bladder cancer risk in a high-risk population,” Int J Cancer, vol. 110, no. 4, pp. 598–604, Jul. 2004. [CrossRef]
- M. García-Closas et al., “NAT2 slow acetylation, GSTM1 null genotype, and risk of bladder cancer: results from the Spanish Bladder Cancer Study and meta-analyses,” The Lancet, vol. 366, no. 9486, pp. 649–659, Aug. 2005. [CrossRef]
- S. Avirmed, Y. Khuanbai, A. Sanjaajamts, B. Selenge, B. U. Dagvadorj, and M. Ohashi, “Modifying Effect of Smoking on GSTM1 and NAT2 in Relation to the Risk of Bladder Cancer in Mongolian Population: A Case-Control Study,” Asian Pacific Journal of Cancer Prevention, vol. 22, no. 8, pp. 2479–2485, Aug. 2021. [CrossRef]
- M. P. A. Zeegers, F. E. S. Tan, E. Dorant, and P. A. Van Den Brandt, “The Impact of Characteristics of Cigarette Smoking on Urinary Tract Cancer Risk A Meta-Analysis of Epidemiologic Studies,” 2000. [CrossRef]
- M. Gong, W. Dong, Z. Shi, Y. Xu, W. Ni, and R. An, “Genetic Polymorphisms of GSTM1, GSTT1, and GSTP1 with Prostate Cancer Risk: A Meta-Analysis of 57 Studies,” PLoS One, vol. 7, no. 11, p. e50587, Nov. 2012. [CrossRef]
- D. Xie et al., “The molecular code of kidney cancer: A path of discovery for gene mutation and precision therapy,” Mol Aspects Med, vol. 101, p. 101335, Feb. 2025. [CrossRef]
- C. Yu et al., “GSTM1 and GSTT1 polymorphisms are associated with increased bladder cancer risk: Evidence from updated meta-analysis,” Oncotarget, vol. 8, no. 2, p. 3246, 2016. [CrossRef]
Figure 1.
Gel Electrophoresis of GSTM1 Amplification with albumin as Internal Control Lane 1: DNA molecular marker (MW); Lane 2: Null phenotype; Lane 3: GSTM1 positive.
Figure 1.
Gel Electrophoresis of GSTM1 Amplification with albumin as Internal Control Lane 1: DNA molecular marker (MW); Lane 2: Null phenotype; Lane 3: GSTM1 positive.
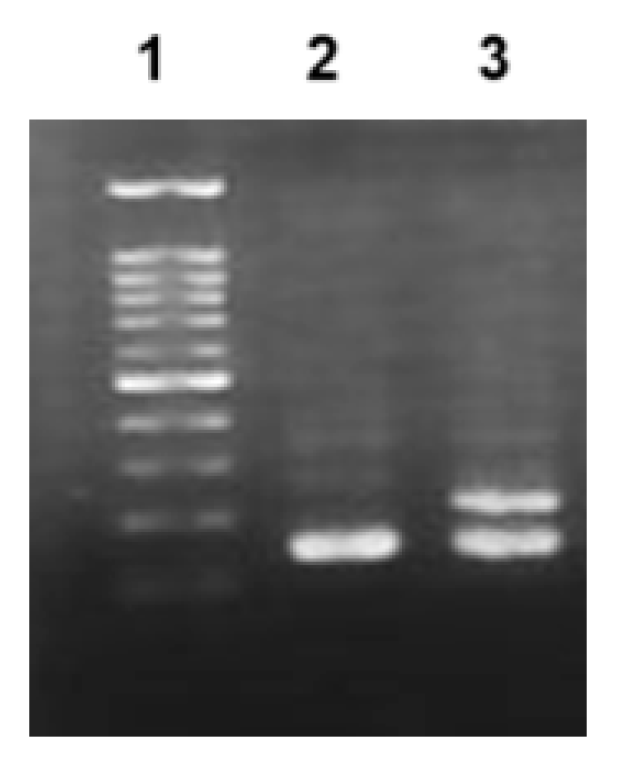
Figure 2.
Analysis of NAT2 polymorphisms by PCR-RFLP analysis. A) KpnI digestion products. Lane 1: DNA molecular marker (MW); Lane 2: wild-type homozygote (660 and 433 bp); Lane 3:) mutant homozygote M1/M1 (1093 bp); Lane 4: heterozygote WT/M1 (660, 433 and 1093 bp. B) TaqI digestion products. Lane 1: MW; Lane 2: mutant heterozygote WT/M2 (380, 317, 226, 170 and 396 bp); Lane 3: wild-type homozygote WT/WT (380, 317, 226 and 170 bp); Lane 4: mutant homozygote M2/M2 (317,380 and 396 bp). C) BamHI digestion products. Lane 1: MW; Lane 2: wild-type homozygote WT/WT (811 and 282 bp); Lane 3: mutant heterozygote WT/M3 (1093, 811 and 282 bp).
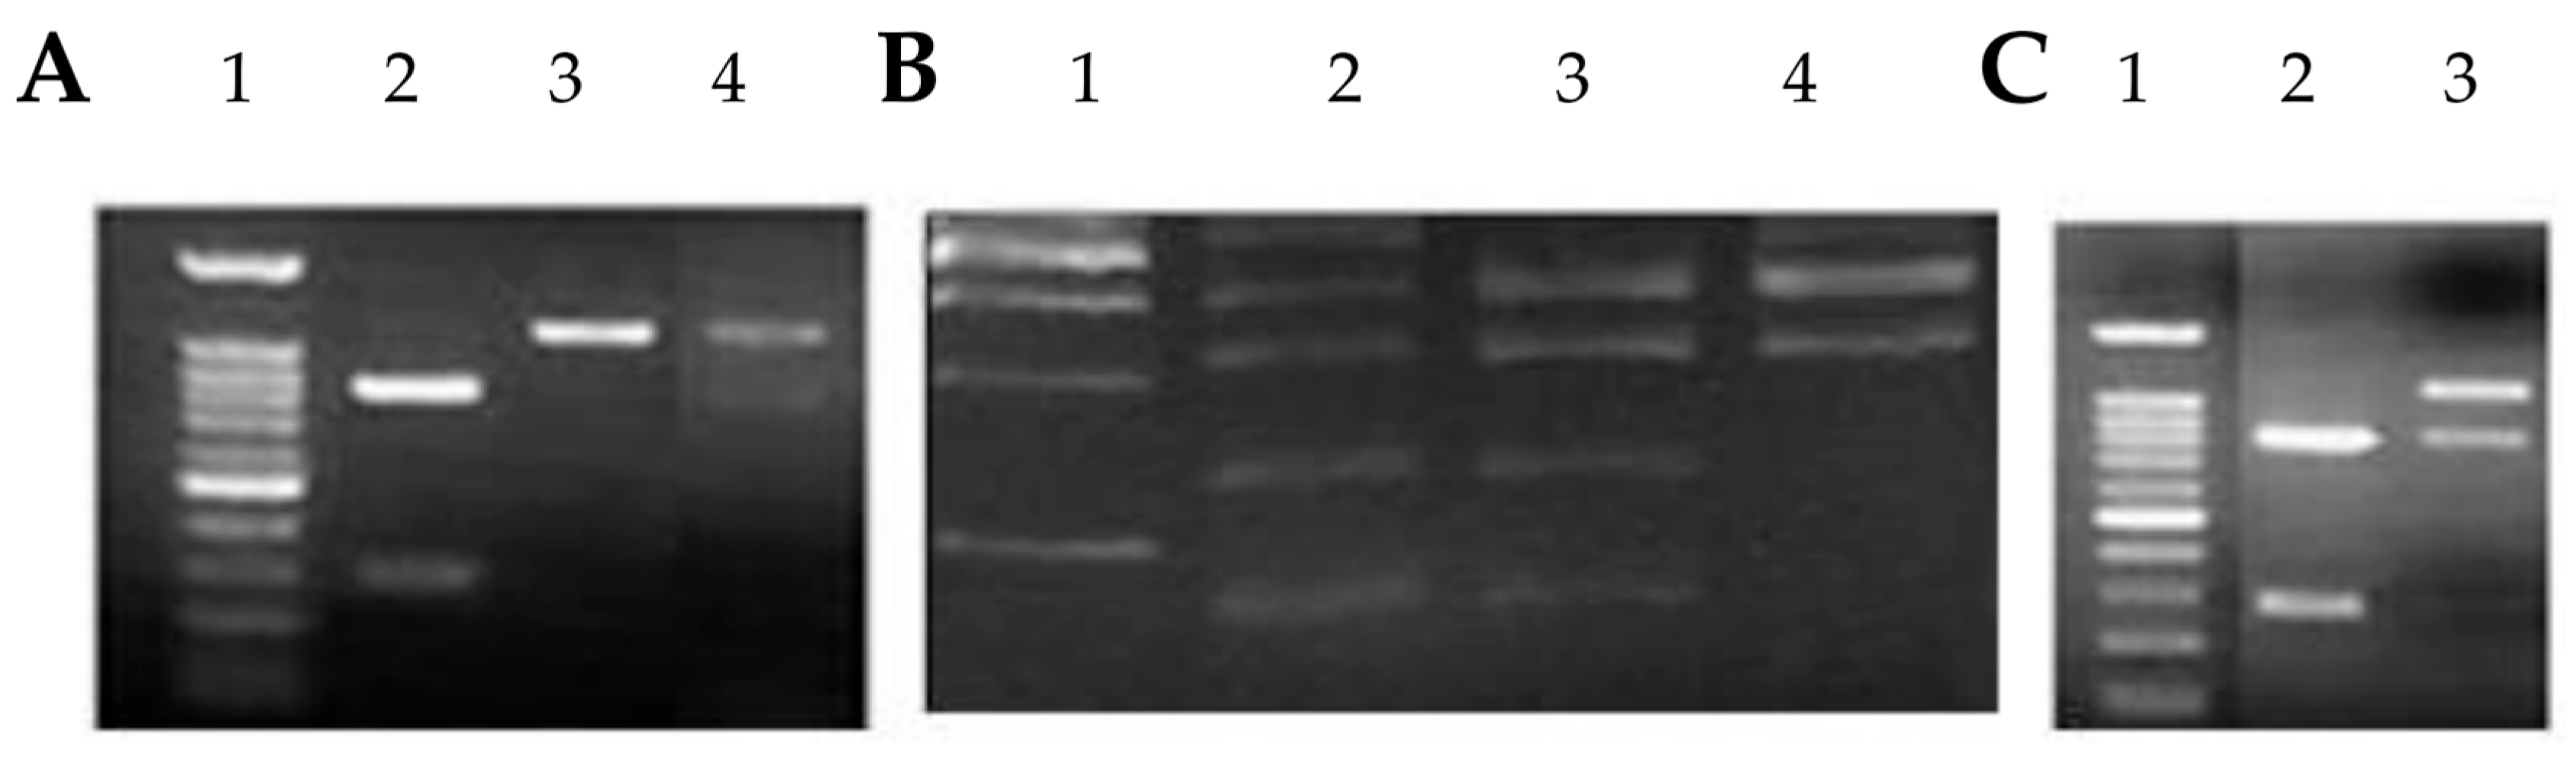

Table 1.
Baseline characteristics of study population.
| Variables | Total | Controls | RCC | P value | |
|---|---|---|---|---|---|
| n (%) | n (%) | n (%) | |||
| Age | 1 | ||||
| 20-29 | 8 (4.5) | 4 (4.5) | 4 (4.5) | ||
| 30-39 | 18 (10.2) | 9 (10.2) | 9 (10.2) | ||
| 40-49 | 56 (31.8) | 28 (31.8) | 28 (31.8) | ||
| 50-59 | 38 (21.6) | 19 (21.6) | 19 (21.6) | ||
| 60-69 | 42 (23.9) | 21 (23.9) | 21 (23.9) | ||
| 70< | 14 (8) | 7 (8) | 7 (8) | ||
| Sex | 1 | ||||
| Male | 68 (38.6) | 34 (38.6) | 34 (38.6) | ||
| Female | 108 (61.4) | 54 (61.4) | 54 (61.4) | ||
| BMI | 0.135 | ||||
| 18.5 - 24.9 | 3 (1.7) | 3 (3.4) | 0 (0) | ||
| 25.0 - 29.9 | 60 (34.1) | 34 (38.6) | 26 (29.5) | ||
| 30.0 - 34.9 | 90 (51.1) | 42 (47.7) | 48 (54.5) | ||
| 35.0< | 23 (13.1) | 9 (10.2) | 14 (15.9) | ||
| Alcohol drinking | 0.001 | ||||
| Yes | 33 (18.8) | 8 (9.1) | 25 (28.4) | ||
| No | 143 (81.3) | 80 (90.9) | 63 (71.6) | ||
| Smoking | <0.001 | ||||
| Yes | 61 (34.7) | 18 (20.5) | 43 (48.9) | ||
| No | 115 (65.3) | 70 (79.5) | 45 (51.1) | ||
| Hypertension | <0.001 | ||||
| Yes | 49 (27.8) | 2 (2.3) | 47 (53.4) | ||
| No | 127 (72.2) | 86 (97.7) | 41 (46.6) | ||
| Diabet | 0.216 | ||||
| Yes | 28 (15.9) | 11 (12.5) | 17 (19.3) | ||
| No | 148 (84.1) | 77 (87.5) | 71 (80.7) | ||
| Exercise | 0.823 | ||||
| Yes | 23 (13.1) | 11 (12.5) | 12 (13.6) | ||
| No | 153 (86.9) | 77 (87.5) | 76 (86.4) | ||
| Coffee use | 0.34 | ||||
| Yes | 60 (34.1) | 33 (37.5) | 27 (30.7) | ||
| No | 116 (65.9) | 55 (62.5) | 61 (69.3) | ||
| History of UTD | <0.001 | ||||
| Yes | 33 (18.8) | 4 (4.5) | 29 (33) | ||
| No | 143 (81.3) | 84 (95.5) | 59 (67) | ||
| Total | 176 (100) | 88 (100) | 88 (100) | ||
P value for Pearson's chi-square test, BMI- body mass index, UTD- urinary tract diseases.
Table 2.
GSTM1 and NAT2 genotypes in relation risk of renal cell carcinoma.
| Variables | Total | Controls | RCC | cOR [95% CI] | P value | aOR [95% CI] | P value |
|---|---|---|---|---|---|---|---|
| n (%) | n (%) | n (%) | |||||
| GSTM1 | |||||||
| Positive | 83 (47.2) | 41 (46.6) | 42 (47.7) | 1 | 1 | ||
| Null | 93 (52.8) | 47 (53.4) | 46 (52.3) | 0.947 [0.497 - 1.805] | 0.869 | 0.727 [0.228 - 2.322] | 0.59 |
| NAT2 | |||||||
| High | 102 (58) | 58 (65.9) | 44 (50) | 1 | 1 | ||
| Low | 74 (42) | 30 (34.1) | 44 (50) | 2.077 [1.072 - 4.025] | 0.03 | 1.916 [0.641 - 5.726] | 0.245 |
| KPN1 | |||||||
| WT/WT | 138 (78.4) | 76 (86.4) | 62 (70.5) | 1 | 1 | ||
| WT/M1 | 36 (20.5) | 10 (11.4) | 26 (29.5) | 3.667 [1.487 - 9.043] | 0.005 | 4.46 [0.949 - 20.959] | 0.058 |
| M1/M1 | 2 (1.1) | 2 (2.3) | 0 (0) | ||||
| WT/M1+M1/M1 | 38 (21.6) | 12 (13.6) | 26 (29.5) | 2.75 [1.224 - 6.177] | 0.014 | 2.637 [0.768 - 9.06] | 0.123 |
| TAQ1 | |||||||
| WT/WT | 137 (77.8) | 77 (87.5) | 60 (68.2) | 1 | 1 | ||
| WT/M2 | 18 (10.2) | 6 (6.8) | 12 (13.6) | 3.077 [0.984 - 9.625] | 0.053 | 1.156 [0.17 - 7.843] | 0.882 |
| M2/M2 | 21 (11.9) | 5 (5.7) | 16 (18.2) | 4.691 [1.475 - 14.916] | 0.009 | 3.8 [0.425 - 33.979] | 0.232 |
| WT/M2+M2/M2 | 39 (22.2) | 11 (12.5) | 28 (31.8) | 3.833 [1.561 - 9.414] | 0.003 | 2.069 [0.517 - 8.281] | 0.304 |
| BAMH1 | |||||||
| WT/WT | 135 (76.7) | 77 (87.5) | 58 (65.9) | 1 | 1 | ||
| WT/M3 | 41 (23.3) | 11 (12.5) | 30 (34.1) | 4.8 [1.831 - 12.58] | 0.001 | 9.1 [1.138 - 72.783] | 0.037 |
| GSTM1/NAT2 | |||||||
| GSTM1-pos / NAT2-high | 54 (30.7) | 33 (37.5) | 21 (23.9) | 1 | 1 | ||
| GSTM1-pos / NAT2-low | 29 (16.5) | 8 (9.1) | 21 (23.9) | 3.304 [1.311 - 8.327] | 0.011 | 3.19 [0.535 - 19.011] | 0.203 |
| GSTM1-null / NAT2-high | 48 (27.3) | 25 (28.4) | 23 (26.1) | 1.369 [0.556 - 3.374] | 0.495 | 1.026 [0.234 - 4.507] | 0.973 |
| GSTM1-null / NAT2-low | 45 (25.6) | 22 (25) | 23 (26.1) | 1.68 [0.684 - 4.128] | 0.258 | 1.18 [0.229 - 6.076] | 0.843 |
1 - reference category, CI - confidence interval, cOR - crude odds ratio for conditional binary logistic regression, aOR - adjusted odds ratio for conditional binary logistic regression (adjusted by smoking, history of UTD).
Table 3.
Stages of renal cell carcinoma cases in the study.
| Variables | GSTM1 | P value | NAT2 | P value | |||
|---|---|---|---|---|---|---|---|
| Pos | Null | High | Low | ||||
| n (%) | n (%) | n (%) | n (%) | n (%) | |||
| Stage | 0.876 | 0.05 | |||||
| Stage I | 50 (56.8) | 22 (52.4) | 28 (60.9) | 19 (43.2) | 31 (70.5) | ||
| Stage II | 10 (11.4) | 5 (11.9) | 5 (10.9) | 8 (18.2) | 2 (4.5) | ||
| Stage III | 17 (19.3) | 9 (21.4) | 8 (17.4) | 10 (22.7) | 7 (15.9) | ||
| Stage IV | 11 (12.5) | 6 (14.3) | 5 (10.9) | 7 (15.9) | 4 (9.1) | ||
| Histology type | 0.259 | 0.225 | |||||
| Clear cell | 77 (87.5) | 39 (92.9) | 38 (82.6) | 37 (84.1) | 40 (90.9) | ||
| Chromopobe | 5 (5.7) | 2 (4.8) | 3 (6.5) | 2 (4.5) | 3 (6.8) | ||
| Papilar | 6 (6.8) | 1 (2.4) | 5 (10.9) | 5 (11.4) | 1 (2.3) | ||
| Cancer volume | 0.578 | 0.802 | |||||
| <10 cm3 | 35 (39.8) | 16 (38.1) | 19 (41.3) | 16 (36.4) | 19 (43.2) | ||
| 10 - 40 cm3 | 49 (55.7) | 25 (59.5) | 24 (52.2) | 26 (59.1) | 23 (52.3) | ||
|
>40 cm3 |
4 (4.5) | 1 (2.4) | 3 (6.5) | 2 (4.5) | 2 (4.5) | ||
Table 4.
Modifying Effects of Lifestyle Factors on Genetic Risk.
| Variables | Total | Controls | RCC | cOR [95% CI] | P value | aOR [95% CI] | P value |
|---|---|---|---|---|---|---|---|
| n (%) | n (%) | n (%) | |||||
| GSTM1/Smoking | |||||||
| GSTM1-pos/non-smoker | 51 (29) | 29 (33) | 22 (25) | 1 | 1 | ||
| GSTM1-pos/smoker | 32 (18.2) | 12 (13.6) | 20 (22.7) | 2.227 [0.845 - 5.871] | 0.106 | 1.468 [0.187 - 11.531] | 0.715 |
| GSTM1-null/non-smoker | 64 (36.4) | 41 (46.6) | 23 (26.1) | 0.67 [0.304 - 1.476] | 0.32 | 0.638 [0.177 - 2.303] | 0.492 |
| GSTM1-null/smoker | 29 (16.5) | 6 (6.8) | 23 (26.1) | 4.654 [1.458 - 14.86] | 0.009 | 2.024 [0.18 - 22.759] | 0.568 |
| NAT2/Smoking | |||||||
| NAT2-high/non-smoker | 70 (39.8) | 46 (52.3) | 24 (27.3) | 1 | 1 | ||
| NAT2-high/smoker | 32 (18.2) | 12 (13.6) | 20 (22.7) | 2.944 [1.229 - 7.05] | 0.015 | 2.662 [0.396 - 17.875] | 0.314 |
| NAT2-low/non-smoker | 45 (25.6) | 24 (27.3) | 21 (23.9) | 1.38 [0.548 - 3.478] | 0.494 | 2.607 [0.651 - 10.44] | 0.176 |
| NAT2-low/smoker | 29 (16.5) | 6 (6.8) | 23 (26.1) | 6.596 [2.26 - 19.255] | 0.001 | 2.368 [0.376 - 14.896] | 0.358 |
| GSTM1/Urinary tract diseases (UTD) | |||||||
| GSTM1-pos/non-UTD | 64 (36.4) | 38 (43.2) | 26 (29.5) | 1 | 1 | ||
| GSTM1-pos/UTD | 19 (10.8) | 3 (3.4) | 16 (18.2) | 14.819 [1.885 - 116.499] | 0.01 | - | - |
| GSTM1-null/non-UTD | 79 (44.9) | 46 (52.3) | 33 (37.5) | 1.126 [0.534 - 2.375] | 0.756 | 0.727 [0.228 - 2.322] | 0.59 |
| GSTM1-null/UTD | 14 (8) | 1 (1.1) | 13 (14.8) | 14.166 [1.723 - 116.467] | 0.014 | - | - |
| NAT2/Urinary tract diseases (UTD) | |||||||
| NAT2-high/non-UTD | 82 (46.6) | 55 (62.5) | 27 (30.7) | 1 | 1 | ||
| NAT2-high/UTD | 20 (11.4) | 3 (3.4) | 17 (19.3) | 20.722 [3.59 - 119.52] | 0.001 | - | - |
| NAT2-low/non-UTD | 61 (34.7) | 29 (33) | 32 (36.4) | 3.077 [1.304 - 7.26] | 0.01 | 1.916 [0.641 - 5.726] | 0.245 |
| NAT2-low/UTD | 13 (7.4) | 1 (1.1) | 12 (13.6) | 35.997 [3.643 - 355.7] | 0.002 | - | - |
1 - reference category, CI - confidence interval, cOR - crude odds ratio for conditional binary logistic regression, aOR - adjusted odds ratio for conditional binary logistic regression (adjusted by smoking, history of UTD).
Table 5.
Primer Sets for GSTM1 and NAT2 Genotyping.
| Gene | Primer type | Primer Sequence (5' - 3') | Expected Product Size (bp) |
|---|---|---|---|
| GSTM1 | Forward | GAACTCCCTGAAAAGCTAAAGC | 419 |
| GSTM1 | Reverse | GTTGGGCTCAAATATACGGTGG | 419 |
| Albumin | Forward | GCCCTCTGCTAACAAGTCCTA | 350 |
| Albumin | Reverse | GCCCTAAAAGAAAATCGCCAATC | 350 |
| NAT2 | Forward | GGAACAAATTGGACTTGG | 1093 |
| NAT2 | Reverse | TCTAGCATGAATCACTCTGC | 1093 |
Disclaimer/Publisher’s Note: The statements, opinions and data contained in all publications are solely those of the individual author(s) and contributor(s) and not of MDPI and/or the editor(s). MDPI and/or the editor(s) disclaim responsibility for any injury to people or property resulting from any ideas, methods, instructions or products referred to in the content. |
© 2025 by the authors. Licensee MDPI, Basel, Switzerland. This article is an open access article distributed under the terms and conditions of the Creative Commons Attribution (CC BY) license (http://creativecommons.org/licenses/by/4.0/).
Copyright: This open access article is published under a Creative Commons CC BY 4.0 license, which permit the free download, distribution, and reuse, provided that the author and preprint are cited in any reuse.


