
Submitted:
13 June 2025
Posted:
13 June 2025
You are already at the latest version
Abstract
Increasing requirements for reducing energy consumption result in thermo-modernisation existing buildings. Modernized buildings have significantly lower transmittation coefficient; infiltration air rate slows down markedly, which may lower indoor air quality (IAQ) noticeable; one gauge with a vane probe measures the air velocity and temperature at a grille in the toilet; second gauge with IAQ probe located in a room measures the mole fraction of carbon dioxide, dry-bulb and wet-bulb temperatures, absolute pressure, and humidity; moreover there are estimated the measurements uncertainties of: the volume flow rate, mole fraction of CO2, temperatures, and humidity. IAQ in a dwelling after thermo-modernization is evaluated in a sixty-year old building; heating system ensures thermal comfort during heating season; ventilation performs poorly, for vapor condenses on the window; carbon dioxide concentration is too high, which curbs mental activity greatly.
Keywords:
indoor air quality (IAQ)
; thermal comfort
; mental activity
; thermo-modernization
1. Introduction
Pettenkofer [27] was the first author who expressed the ventilation requirements per human occupant being in a room. However, the occupying persons are not the only sources of air pollution; Fanger et al. [10] determined the shares of the air pollutions: 20% is caused by the space materials, 42% origin from a ventilation system, 25% is caused by smoking, and only 13% is produced by the occupants.
Fanger [8] determined the percentage of dissatisfied persons using defined by himself new unit called olf that is the emission rate of air pollutants (bioefluents) from a standard person; other sources polluted a space are expressed as a rational number of 1 olf (i.e., standard person causing the same dissatisfaction). Whereas 1 pol is a pollution of 1 olf that is ventilated by 1 l/s of unpolluted air, so 1 pol=1 olf/(l/s), but 1 decipol equals to 1 olf ventilated by 10 l/s. The percentage of dissatisfied persons PD is in correspondence to the ventilation rate q as follows:
Air quality is perceived by two humans’ senses; the olfaction senses the hundreds thousands odorants in the air; also the eyes are sensitive about analogous number of the irritants. The mixed reaction of these two senses is an indicator of a good or poor air quality. The average indicator of air quality is the percentage of dissatisfied that is a fraction of population perceiving this quality as poor just after entering a room.
Carbon dioxide production is proportional to the humans metabolic rate [18], so does water vapour [7]. Although CO2 is inoffensively at low concentrations that occur in the rooms, it is a good indicator of other human bio-effluents that annoy humans [7], [26], [24] [25], yet it equivocally indicates air quality for sources not producing CO2 [7]; it is a unreliable indicator of carbon monoxide or radon. Eq (2) shows a correspondence between the excessive CO2 concentration Χco2 and the percentage of dissatisfied occupants PD of a room where all the pollutions are exhaled by the inactive non-smoking occupants [7]:
Since the human metabolic processes generate CO2, vapour, aldehydes, esters, and alcohols the acceptable long-term CO2 mole fraction should be less than 3500 ppm to avoid the negative health effects [7].
A ventilation system effectiveness depends also on the outdoor quality; the better this quality is the less air flow rate is needed. Table 1 shows distinguishing levels of the felt outdoor air quality in correspondence to the typical outdoor pollutants.
People perceive the air quality to be contented if the inside CO2 mole fraction is not higher than 700 ppm above the outdoor level [3].
Humidity affects the occupants in a direct or indirect way; its high level, vapour condensation, or moisture penetration promote the moulds or other fungi growth; this growth may result in malodorous or even allergy. Raised humidity may intensify chemicals (e.g., formaldehyde) emissions from materials. Also too low humidity may cause a negative consequences for some occupants: dryness perception, skin or mucous membranes irritation [7], irritation in eyes and upper airways [33].
“Thermal comfort is defined as the condition of mind which expresses satisfaction with the thermal environment”; it is closely related to the thermal balance of an entire human’s body that is in a steady state. This balance is affected by the humans’ physical activity and cloth, and also by the thermodynamic parameters: the air temperature, velocity, and humidity as well as the mean surface temperature that affects the radiational heat transfer [9], [11]. However because of individual preferences it is impossible to satisfy everybody simultaneously, so the feeling of comfort should be acceptable by at least 80% of the occupants [11], [1]. Thermal discomfort feeling decreases productivity [15], [12]. Temperature change in the range 18°C - 30°C impacts on: typewriting, learning, and reading performance. Office productivity is stable in the range 21°C - 25°C; it decreases by 2% per 1°C increase in the range of 25-30°C [15].
Alternatively to Fanger [9] the thermal comfort definition is given by de Dear et al. [4] who propose an “adaptive” thermal comfort that includes in the analysis also other factors: demographics (gender, age, economic status), context (building design and function, season, climate, semantics, social conditioning), and cognition (attitude, preference, and expectations). This adaptation is divided into three groups behavioural adjustment, physiological, and psychological. In brief the adaptive thermal comfort takes into consideration an interaction between a human and closest and distant surroundings; people may change clothes or open the windows or fix the radiators, etc. [4]. Thermal comfort depends not only on the individual preferences but it varies geographically according to age, sex, metabolism rate, time of the year, etc. [15]. Higher outdoor temperatures allow for higher indoor ones [28]. Table 2 shows the required air conditions in dependence on the season and activity.
Too high air temperature in summer lowers the labour effectiveness, but cooling increases operating costs [21] and [6].
Development in information technology permits a personal approach to thermal comfort by modelling the individual preferences instead of averaging large populations [19]. Personal comfort models increases median accuracy from 0.51 (for conventional and adaptive thermal comfort) to 0.73 [20].
Temperature, humidity, CO2 concentration, and air speed are the measurable factors of indoor environmental quality (IEQ) [2]. Temperature of 24°C is the most satisfiable one; dissatisfaction under lower temperatures is more significant than under higher temperatures; the proper temperature affects IEQ feeling strongest [12], [34].
Al Horr et al. established eight physical factors affecting occupant satisfaction and productivity in an office environment: indoor air quality (IAQ) and ventilation, thermal comfort, lighting and daylighting, noise and acoustics, office layout, biophilia and views, look and feel, location and amenities; each factor interacts significantly and crosses over to others[15]; however thermal comfort is thought as slightly significant than satisfaction with air quality [11]. IAQ strongly influences office productivity; the better it is the higher work performance is in the following tasks: text typing, proof-reading, and solving mathematical problems. IAQ is a complex set of phenomena for measuring; the parameters that compose IAQ are: relative humidity, temperature, lever of air contaminants; these parameters depend on: outdoor conditions, technology of building construction, HVAC systems performance, quality of indoor space (furnishing, furniture, equipment), and occupants activity. IAQ may be improved by limiting pollutions emissions or by increasing the ventilation rate which is an efficient monitor of IAQ in a building; the higher rates improve IAQ; whereas to low rate, especially lower than 10 l/s, may cause Sick Building Syndrome (SBS) and decrease productivity [15]; however it is not confirmed by other researchers [18].
Prevention against global warming results in the heat losses reduction in the buildings, which simultaneously causes the windows are very tight; the ventilation rates may be reduced if the golden rule “build tight, ventilate right” is satisfied [32].
Briefly summarizing [5] the national guidelines in 28 countries mostly indicates the temperature should be at the range of 20-26°C, relative humidity at 40-70%, and maximal mole fraction CO2 is 1000 ppm.
The aim of the study is extension of the research into stack ventilation performance [14], [13], [29] and IAQ evaluation in lodgings; in particular the determined parameters are: the volume flow rate through the grille in the bathroom, carbon dioxide mole fraction, temperature and humidity in the studied lodgings; measurement uncertainty is estimated for every parameter; the measurements are done in every season. Each determined parameters is compared with the proper regulation, standard, or guideline.
2. Materials and Methods
The study took place in a three-room flat sketched in Figure 1 with the lodging room. This flat is located at the fourth level above the ground storey in sixty-year old building which was thermo-modernized and equipped in the airtight windows at low thermal transmittance; this building is located in Białystok in the IV climatic zone in Poland; the window W1 in the studied room is installed in the western wall.
The volumetric flow rates of the ventilation air in this flat should satisfy the regulation [22] which refers to the standard [31]; their values may not be less than 50 m3/h in the bathroom and 20 m3/h per the design persons number in a flat; the air should flow to the kitchen or hygienic-sanitary rooms from other rooms [22].
Velocity and temperature of the exhaust air were measured, using a van probe of 16 cm with a thermocouple K, on the grille placed in the bathroom; IAQ probe measures the parameters: the absolute pressure, dry bulb, dew point, and psychrometric temperatures, relative humidity, and carbon dioxide mole fraction in a room marked in Figure 1; each probe was connected to a Testo 435-4 gauge. The accuracy of the measurement system is as follows: temperature in the range 0 to +50°C ±0.3°C; relative humidity in the range +2 to +98 % ±2 %; carbon dioxide concentration in the range 0 to +5000 ppm CO2 ±75 ppm CO2 ±3% of a measured value and in the range +5001 to 10000 ppm CO2 ±150 ppm CO2 ±5% of a measured value; atmospheric pressure in the range 600 to 1150 hPa ±10 hPa; air velocity and temperature at the grille were measured by a vane measuring probe which measures velocity in the range 0.3-20 m/s with accuracy ± 0.1 m/s +1.5% of a measured value and temperature in the range 0 to +50°C with accuracy ±0.5°C [30].
The investigations were carried out in the week periods one in each season in the years 2022-23. The data were recorded each 5 minutes; then they were summed or averaged in the one-hour periods to plot in the charts.
Volume flow rate through the grille is determined assuming the constant velocity in every period lasting 300 s:
where:
Fg- the surface area of the grille openings [m2].
Measurement uncertainty of the volume flow rate through the grille is estimated as follows:
where:
δFg=0.001 m2,
δvg i=0.1+0.015vg i [m/s].
Mole fraction of Carbon dioxide is averaged hourly
so the measurement uncertainty of the arithmetic mean determines the formula
for no measurement value exceeds 5000 ppm. The minimal uncertainty equals to 17.89 ppm, and the maximal is 59.21 ppm.
Since the uncertainty of temperature measurement is fixed value, the measurement uncertainty of the arithmetic mean simplifies to
for the IAQ and vane probes respectively.
The measurement uncertainties are plotted with the thin dotted lines; the upper lines show the measurement values plus the uncertainties; the down lines show the measurement values minus the uncertainties; however the δtIAQ values are so small that they would blur the plotted lines, so they are not drawn in the charts.
3. Results
Carbon dioxide mole fraction was measured directly, whereas the volumetric flow rate was determined as the product of a measured air velocity at the grille and one’s surface area; besides these values Figure 2, Figure 3, Figure 4 and Figure 5 show also the maximal recommended CO2 mole fraction of 1000 ppm in the room where IAQ probe was placed and the minimal ventilation air flow of 50 m3/h in the bathroom where the velocity probe was installed. The lengths of the exceedances times enumerated further on were determined from the five-minute measurement periods, so some of them may be invisible in the charts where the one-hour results are plotted.
Between 29th October and 2nd November the occupant returned to his permanent place of residence because of the All Saints' Day, which affects the results clearly.
The carbon dioxide mole fraction was beyond the recommended limit for 22.3% of time in autumn (Figure 2), 50.53% in winter (Figure 3), 23.95% in spring (Figure 4); in summer there was no exceedance (Figure 5). The volumetric air flow rate failed the regulation [30] for 62.56% time in autumn, 0.19% in winter, 2.62% in spring, and 62.86% in summer.
Temperature limits, summer or winter, were established due to meteorological data for weather station Białystok published by IMGW-PIB [33] and [34]; because in April 2023 the outdoor temperatures rose to 21.7°C or fell to -3.8°C both upper limits were plotted.
The temperatures at the grille exceeded always the upper limits except the summer upper limit in April when it crossed this limit.
The temperature in autumn (Figure 6) fall behind the lower limit for 10.32% time; it increased beyond the upper limit for 83.9%; in the next season the respective exceedances were as follows: 8.19% and 6.34% (Figure 7), 44.48% and 14.94%(Figure 8, 0% and 77.16% (Figure 9).
Temperature dropping in a heating season from October to April plotted in Figure 6, Figure 7, Figure 8 and Figure 9 was caused by airing because of the poor air quality, which was correlated with the highest amounts of CO2.
The relative humidity in autumn (Figure 10) rose above the upper limit for 20.31% time; in the winter (Figure 11) it increased beyond the upper limit for 5.89% and fall below the lower limit for 32.60%; in the next season (Figure 12 and Figure 13) the respective exceedances were as follows: 11.23% (in relation to the winter upper limit) and 15.49%, 35.11% and 4.60%.
The air in the given room is ventilated badly, for even when the minimal air flow rate is exceeded by far the CO2 mole fraction is beyond the upper limit (cf. Figure 3 or Figure 4), which suggests the air to the bathroom flows in the overwhelming amount from the staircase; it leads to the conclusion that the flow from the room is severely limited because of the extremely airtight window. Although CO2 and H2O emissions are correlated as the products of human metabolism the relative humidity does not exceed the upper limit such frequently; whereas carbon dioxide was not removed from the room. Figure 7 shows the space heating performs excellently, for the lower temperatures were measured only amid the airings, and the higher values was measured hardly ever.
The occupant reported there was observed frequently vapour condensation on the window, and liquid water flew down on the floor. In the heating season air in the room was stuffily, and it seemed dense and difficult to breath; it lacked in freshness, and also unpleasant smell was detected; hence often airing was necessary. There was observed neither moisture nor mould on the walls. Too high carbon dioxide concentration resulted in tiredness and sleepiness, which intensified after a longer occupation; these tiredness and sleepiness resulted in loosing concentration or performing the tasks required an intellectual effort.
5. Conclusions
It may be stated the heating system and stack ventilation in the bathroom in winter and spring perform correctly; the stack ventilation performance in autumn and summer is insufficient temporarily, for the minimal air flow rates fail the standard. However, the studied room is ventilated extremely poorly, which results in excessive amount of carbon dioxide or vapour condensation; this poorness curbs mental activity significantly.
Thus stack ventilation operation affects IAQ greatly, which influences on the occupant behaviour strongly.
The next research should be made into measuring the air flows through the grilles in the kitchen as well as the infiltration coefficients of the windows and the door into the staircase; also it should be control IAQ in the kitchen.
To improve airing in the particular room a trickle vent should be installed into the window’s frame.
The buildings should not be modernized thermally in a way which simultaneously impairs indoor air quality.
The study concludes the maximal mole fraction of carbon dioxide should be limited by law to 1000 ppm.
Author Contributions
Conceptualization, A.G.; methodology, A.G.; software, A.G. and K.D.; validation, A.G.; formal analysis, A.G.; investigation, K.D.; resources, A.G. and K.D.; data curation, K.D.; writing—original draft preparation, A.G..; writing—review and editing, A.G. and K.D.; visualization, A.G. and K.D.; supervision, A.G.; project administration, A.G.; funding acquisition, A.G.. All authors have read and agreed to the published version of the manuscript.
Funding
The investigations were conducted at Students’ Scientific Society “Heat Engineer” at Bialystok University of Technology. Research was carried out at Bialystok University of Technology as a Rector's project WZ/WB-IIŚ/4/2025 at Department of HVAC Engineering which was subsidised by the Ministry of Science and Higher Education Republic of Poland from the funding for statutory R&D activities. The paper was prepared using equipment which was purchased thanks to either "INNO – EKO – TECH” Innovative research and didactic center for alternative energy sources, energy efficient construction and environmental protection – project implemented by the Technical University of Bialystok (PB), co-funded by the European Union through the European Regional Development Fund under the Programme Infrastructure and Environment or "Research on the efficacy of active and passive methods of improving the energy efficiency of the infrastructure with the use of renewable energy sources" - project was co-financed by the European Regional Development Fund under the Regional Operational Programme of the Podlaskie Voivodship for the years 2007-2013.
Acknowledgments
Meteorological data have been available thanks to a kindness of The Institute of Meteorology and Water Management - National Research Institute (IMGW-PIB).
Conflicts of Interest
The funders had no role in the design of the study; in the collection, analyses, or interpretation of data; in the writing of the manuscript; or in the decision to publish the results.
Abbreviations
The following abbreviations are used in this manuscript:
| IAQ | Indoor air quality |
| PD | Percentage of dissatisfied occupants |
| IEQ | Indoor environmental quality |
References
- ANSI/ASHRAE, Ventilation for Acceptable Indoor Air Quality „ANSI/ASHRAE Stand. 62.1-2016” 2016, 2016, s. 1–60.
- ASHRAE, Special Report 200 - Indoor air quality guide, 14. 2009,.
- Costanzo S., Cusumano A., and Giaconia C., Ventilation rates and unsatisfied percentage from indoor CO 2 concentration „Indoor Built Environ.” 2011, 20(2), s. 232–245. [CrossRef]
- de Dear R., Brager G., and Cooper D., Developing an Adaptive Model of Thermal Comfort and Preference, 1997,.
- Dimitroulopoulou S. et al., Indoor air quality guidelines from across the world: An appraisal considering energy saving, health, productivity, and comfort „Environ. Int.” 2023, 178(April), s. 108127. [CrossRef]
- Dybiński O. and Mijakowski M., Problemy związane z utrzymaniem komfortu w dużych halach przemysłowych w okresie letnim Thermal comfort in huge production halls during summer „Mater. Bud.” 2016, 2016(1), s. 44–47. [CrossRef]
- ECA (European Collaborative Action), Indoor Air Quality & Its Impact on Man - Report No. 11 - Guidelines for Ventilation Requirements in Buildings, 1992,.
- Fanger P. O., Introduction of the olf and the decipol units to quantify air pollution perceived by humans indoors and outdoors „Energy Build.” 1988, 12(1), s. 1–6. [CrossRef]
- Fanger P. O., FUNDAMENTALS OF THERMAL COMFORT [w:] Advances In Solar Energy Technology, Elsevier 1988, s. 3056–3061.
- Fanger P. O., Lauridsen J., Bluyssen P., and Clausen G., Air pollution sources in offices and assembly halls, quantified by the olf unit „Energy Build.” 1988, 12(1), s. 7–19. [CrossRef]
- Frontczak M. and Wargocki P., Literature survey on how different factors influence human comfort in indoor environments „Build. Environ.” 2011, 46(4), s. 922–937. [CrossRef]
- Geng Y., Ji W., Lin B., and Zhu Y., The impact of thermal environment on occupant IEQ perception and productivity „Build. Environ.” 2017, 121, s. 158–167. [CrossRef]
- Gladyszewska-Fiedoruk K. and Adana M. R. De, Improving the Effectiveness of Stack Ventilation by Supplying an Outdoor Air Stream „IOP Conf. Ser. Mater. Sci. Eng.” 2020, 809(1), s. 012008. [CrossRef]
- Gładyszewska-Fiedoruk K. and Gajewski A., Effect of wind on stack ventilation performance „Energy Build.” 2012, 51, s. 242–247. [CrossRef]
- Al Horr Y., Arif M., Kaushik A., Mazroei A., Katafygiotou M., and Elsarrag E., Occupant productivity and office indoor environment quality: A review of the literature „Build. Environ.” 2016, 105, s. 369–389. [CrossRef]
- Instytut Meteorologii i Gospodarki Wodnej Państwowy Instytut Badawczy, Rocznik Meteorologiczny 2022, 2023,.
- Instytut Meteorologii i Gospodarki Wodnej Państwowy Instytut Badawczy, Rocznik Meteorologiczny 2023, Warszawa, 2024,.
- Jones A. P., Indoor air quality and health „Atmos. Environ.” 1999, 33(28), s. 4535–4564. [CrossRef]
- Kim J., Schiavon S., and Brager G., Personal comfort models – A new paradigm in thermal comfort for occupant-centric environmental control „Build. Environ.” 2018, 132, s. 114–124. [CrossRef]
- Kim J., Zhou Y., Schiavon S., Raftery P., and Brager G., Personal comfort models: Predicting individuals’ thermal preference using occupant heating and cooling behavior and machine learning „Build. Environ.” 2018, 129, s. 96–106. [CrossRef]
- Kroner W., Jakubowska P., and Noszczyk P., Ochrona pomieszczeń przed przegrzewaniem w okresie letnim w aspekcie komfortu termicznego „Mater. Bud.” 2019, 2019(9), s. 54–56. [CrossRef]
- Minister of Development and Technology, Notice of the Minister of Development and Technology of 15 April 2022 on the announcement of the unified text of the regulation of the Minister of Infrastructure on the technical conditions to which buildings should comply and their location, Dz. U. 202(1225).
- Minister of Labour and Social Policy (Republic of Poland), Regulation of the Minister of Labour and Social Policy (Republic of Poland) of 29 November 2002 on Maximum Permissible Concentration and Intensity of Agents Harmful to Health in the Working Environment (in Polish), Dz. U.217(poz. 1833). 2002,.
- Möhle G. et al., Development and application of a protocol for the assessment of indoor air quality „Indoor Built Environ.” 2003, 12(3), s. 139–149. [CrossRef]
- Mui K. W., Wong L. T., and Hui P. S., A new sampling approach for assessing indoor air quality „Indoor Built Environ.” 2006, 15(2), s. 165–172. [CrossRef]
- Norbäck D., Björnsson E., Janson C., Widström J., and Boman G., Asthmatic symptoms and volatile organic compounds, formaldehyde, and carbon dioxide in dwellings „Occup. Environ. Med.” 1995, 52, s. 388–395, [Online]. Available: http://ovidsp.ovid.com/ovidweb.cgi?T=JS&PAGE=reference&D=emed3&NEWS=N&AN=1995181268.
- Pettenkofer M., Luftwechsel in wohngebäuden. Der J. G. Cotta’schen buchhandlung, München, 1858,.
- Rupp R. F., Vásquez N. G., and Lamberts R., A review of human thermal comfort in the built environment „Energy Build.” 2015, 105, s. 178–205. [CrossRef]
- Teleszewski T. J. and Gładyszewska-Fiedoruk K., Characteristics of humidity in classrooms with stack ventilation and development of calculation models of humidity based on the experiment „J. Build. Eng.” 2020, 31, s. 101381. [CrossRef]
- Testo SE & Co. KGaA, Data sheet testo 435. Multi-function measuring instrument., 2020,.
- The Polish Committee for Standardization, Ventilation in residential buildings of collective housing and public utility -- Requirements (PN-83/B-03430). 2000,.
- Vardoulakis S. et al., Impact of climate change on the domestic indoor environment and associated health risks in the UK „Environ. Int.” 2015, 85, s. 299–313. [CrossRef]
- Wolkoff P., Indoor air humidity, air quality, and health – An overview „Int. J. Hyg. Environ. Health” 2018, 221(3), s. 376–390. [CrossRef]
- Zomorodian Z. S., Tahsildoost M., and Hafezi M., Thermal comfort in educational buildings: A review article „Renew. Sustain. Energy Rev.” 2016, 59, s. 895–906. [CrossRef]
Figure 1.
The flat with the studied rooms.
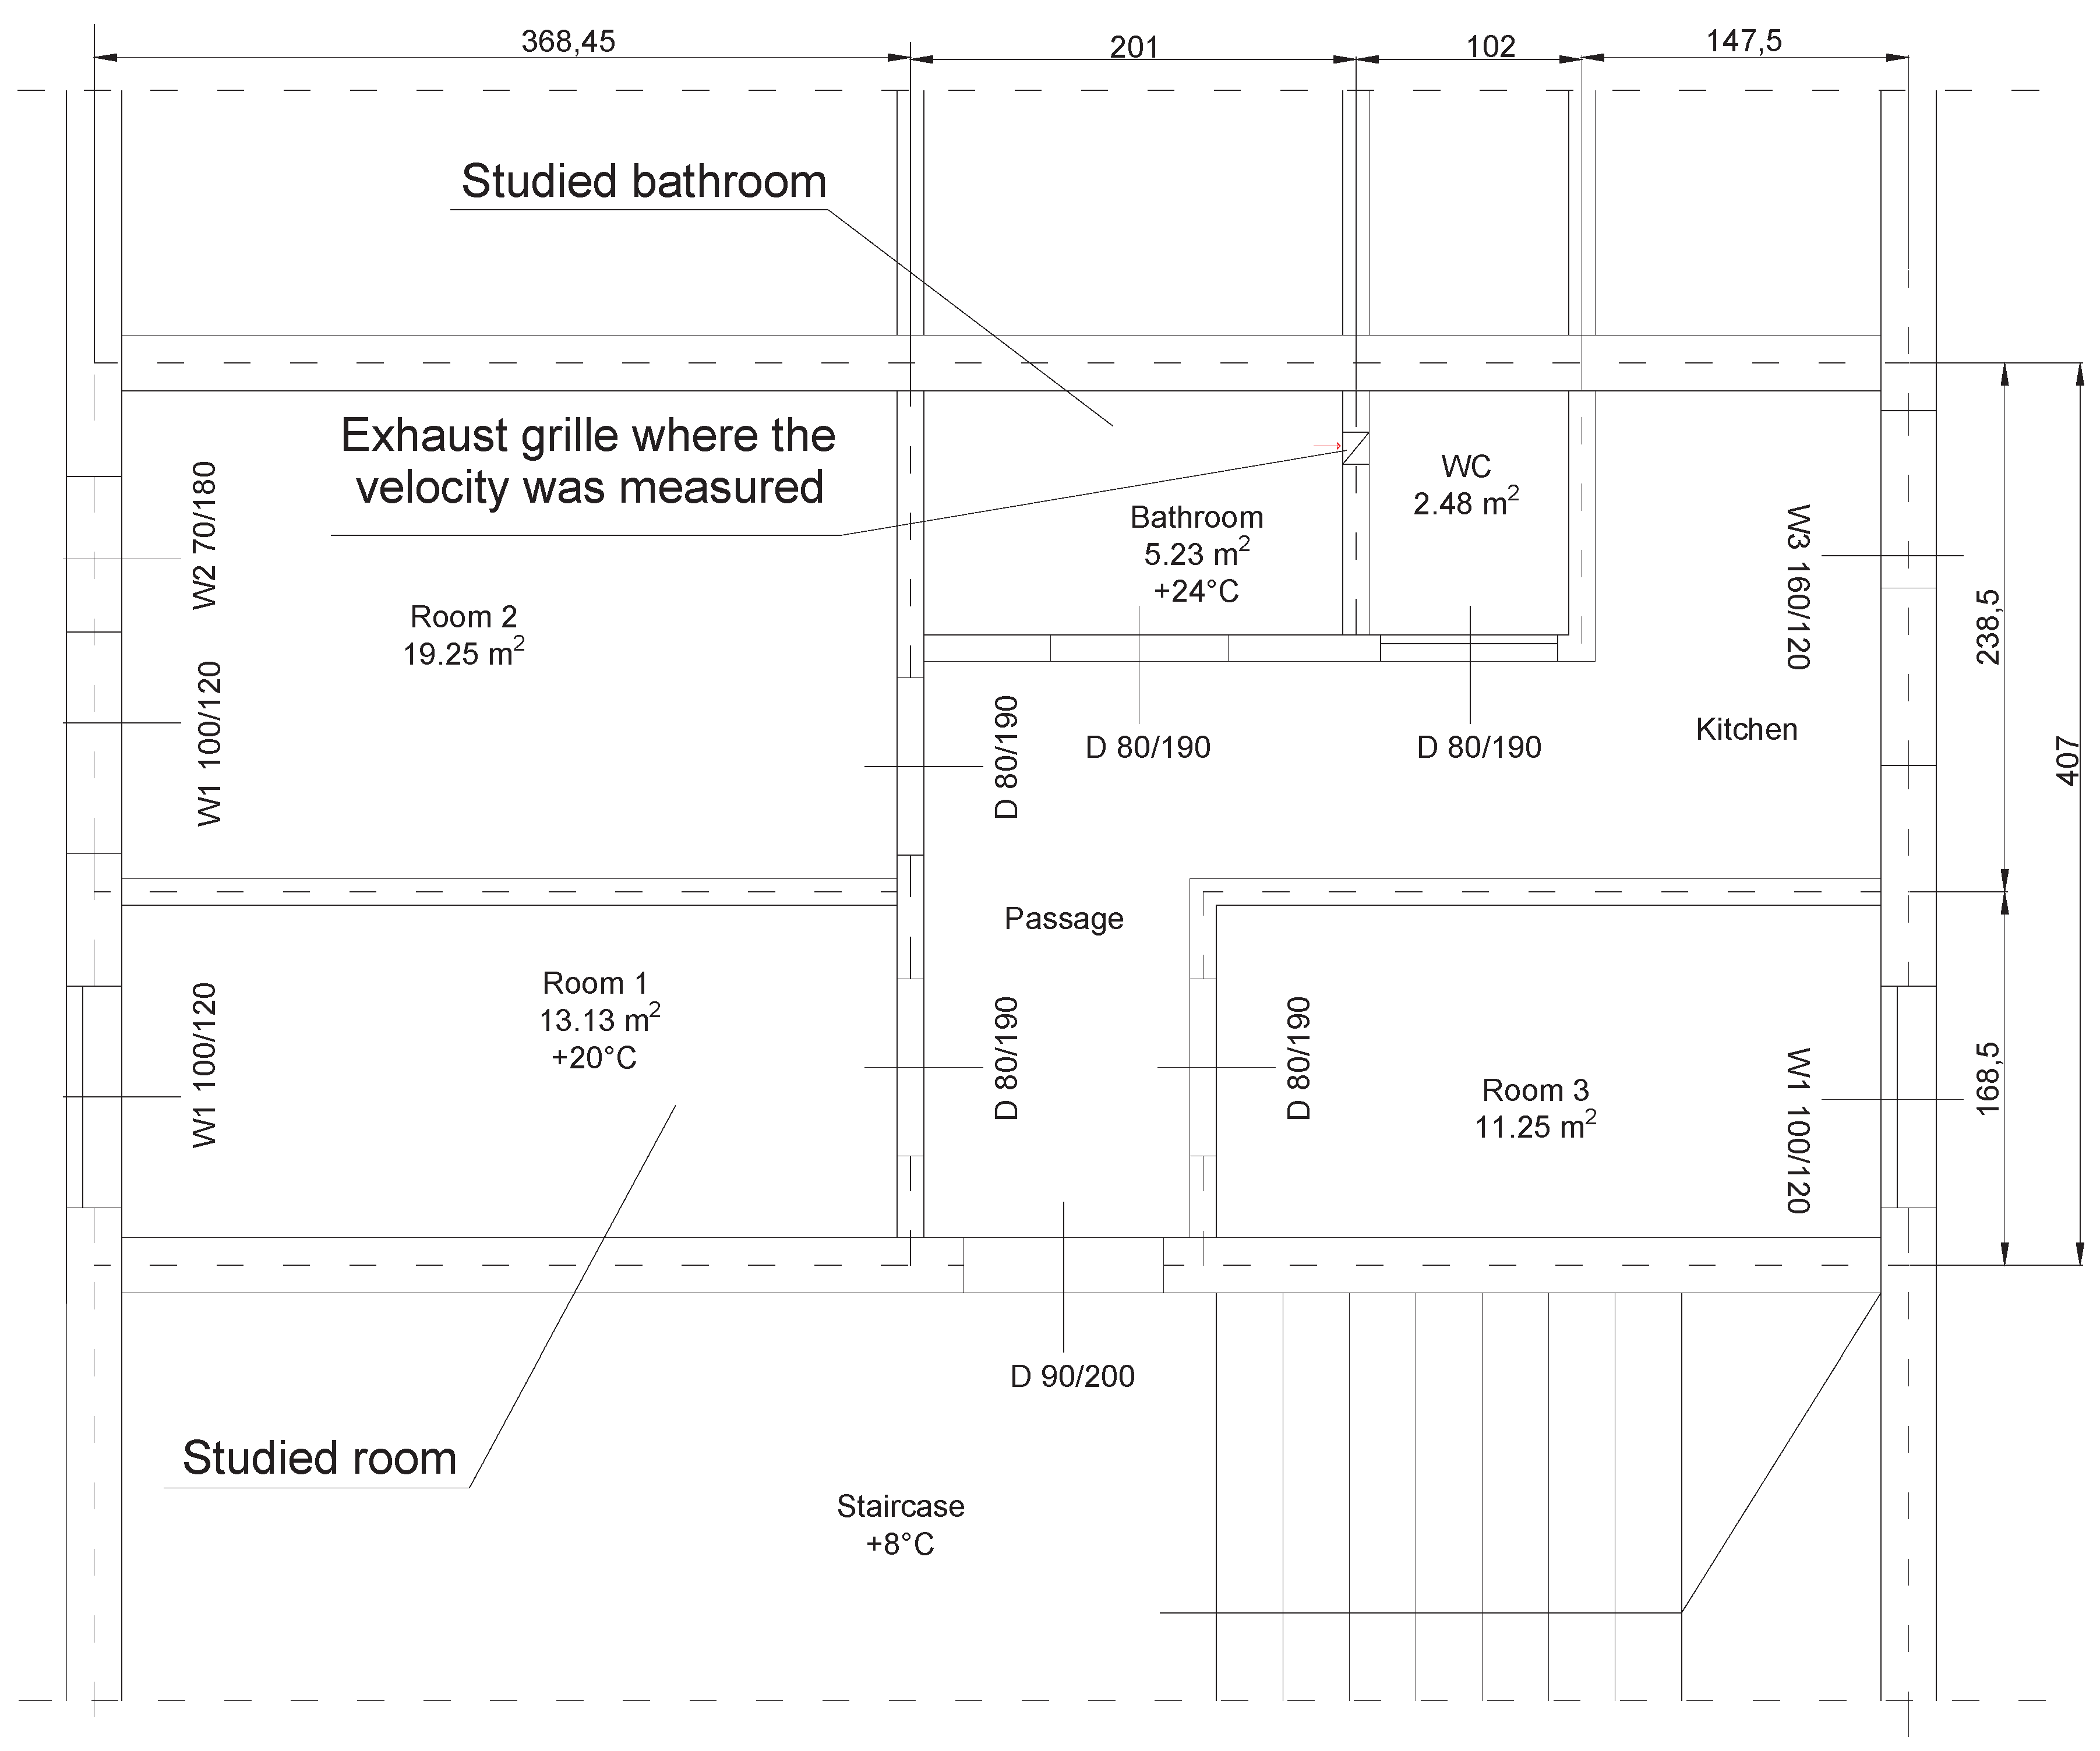
Figure 2.
The carbon dioxide mole fraction and air flow rate in the autumn 2022.
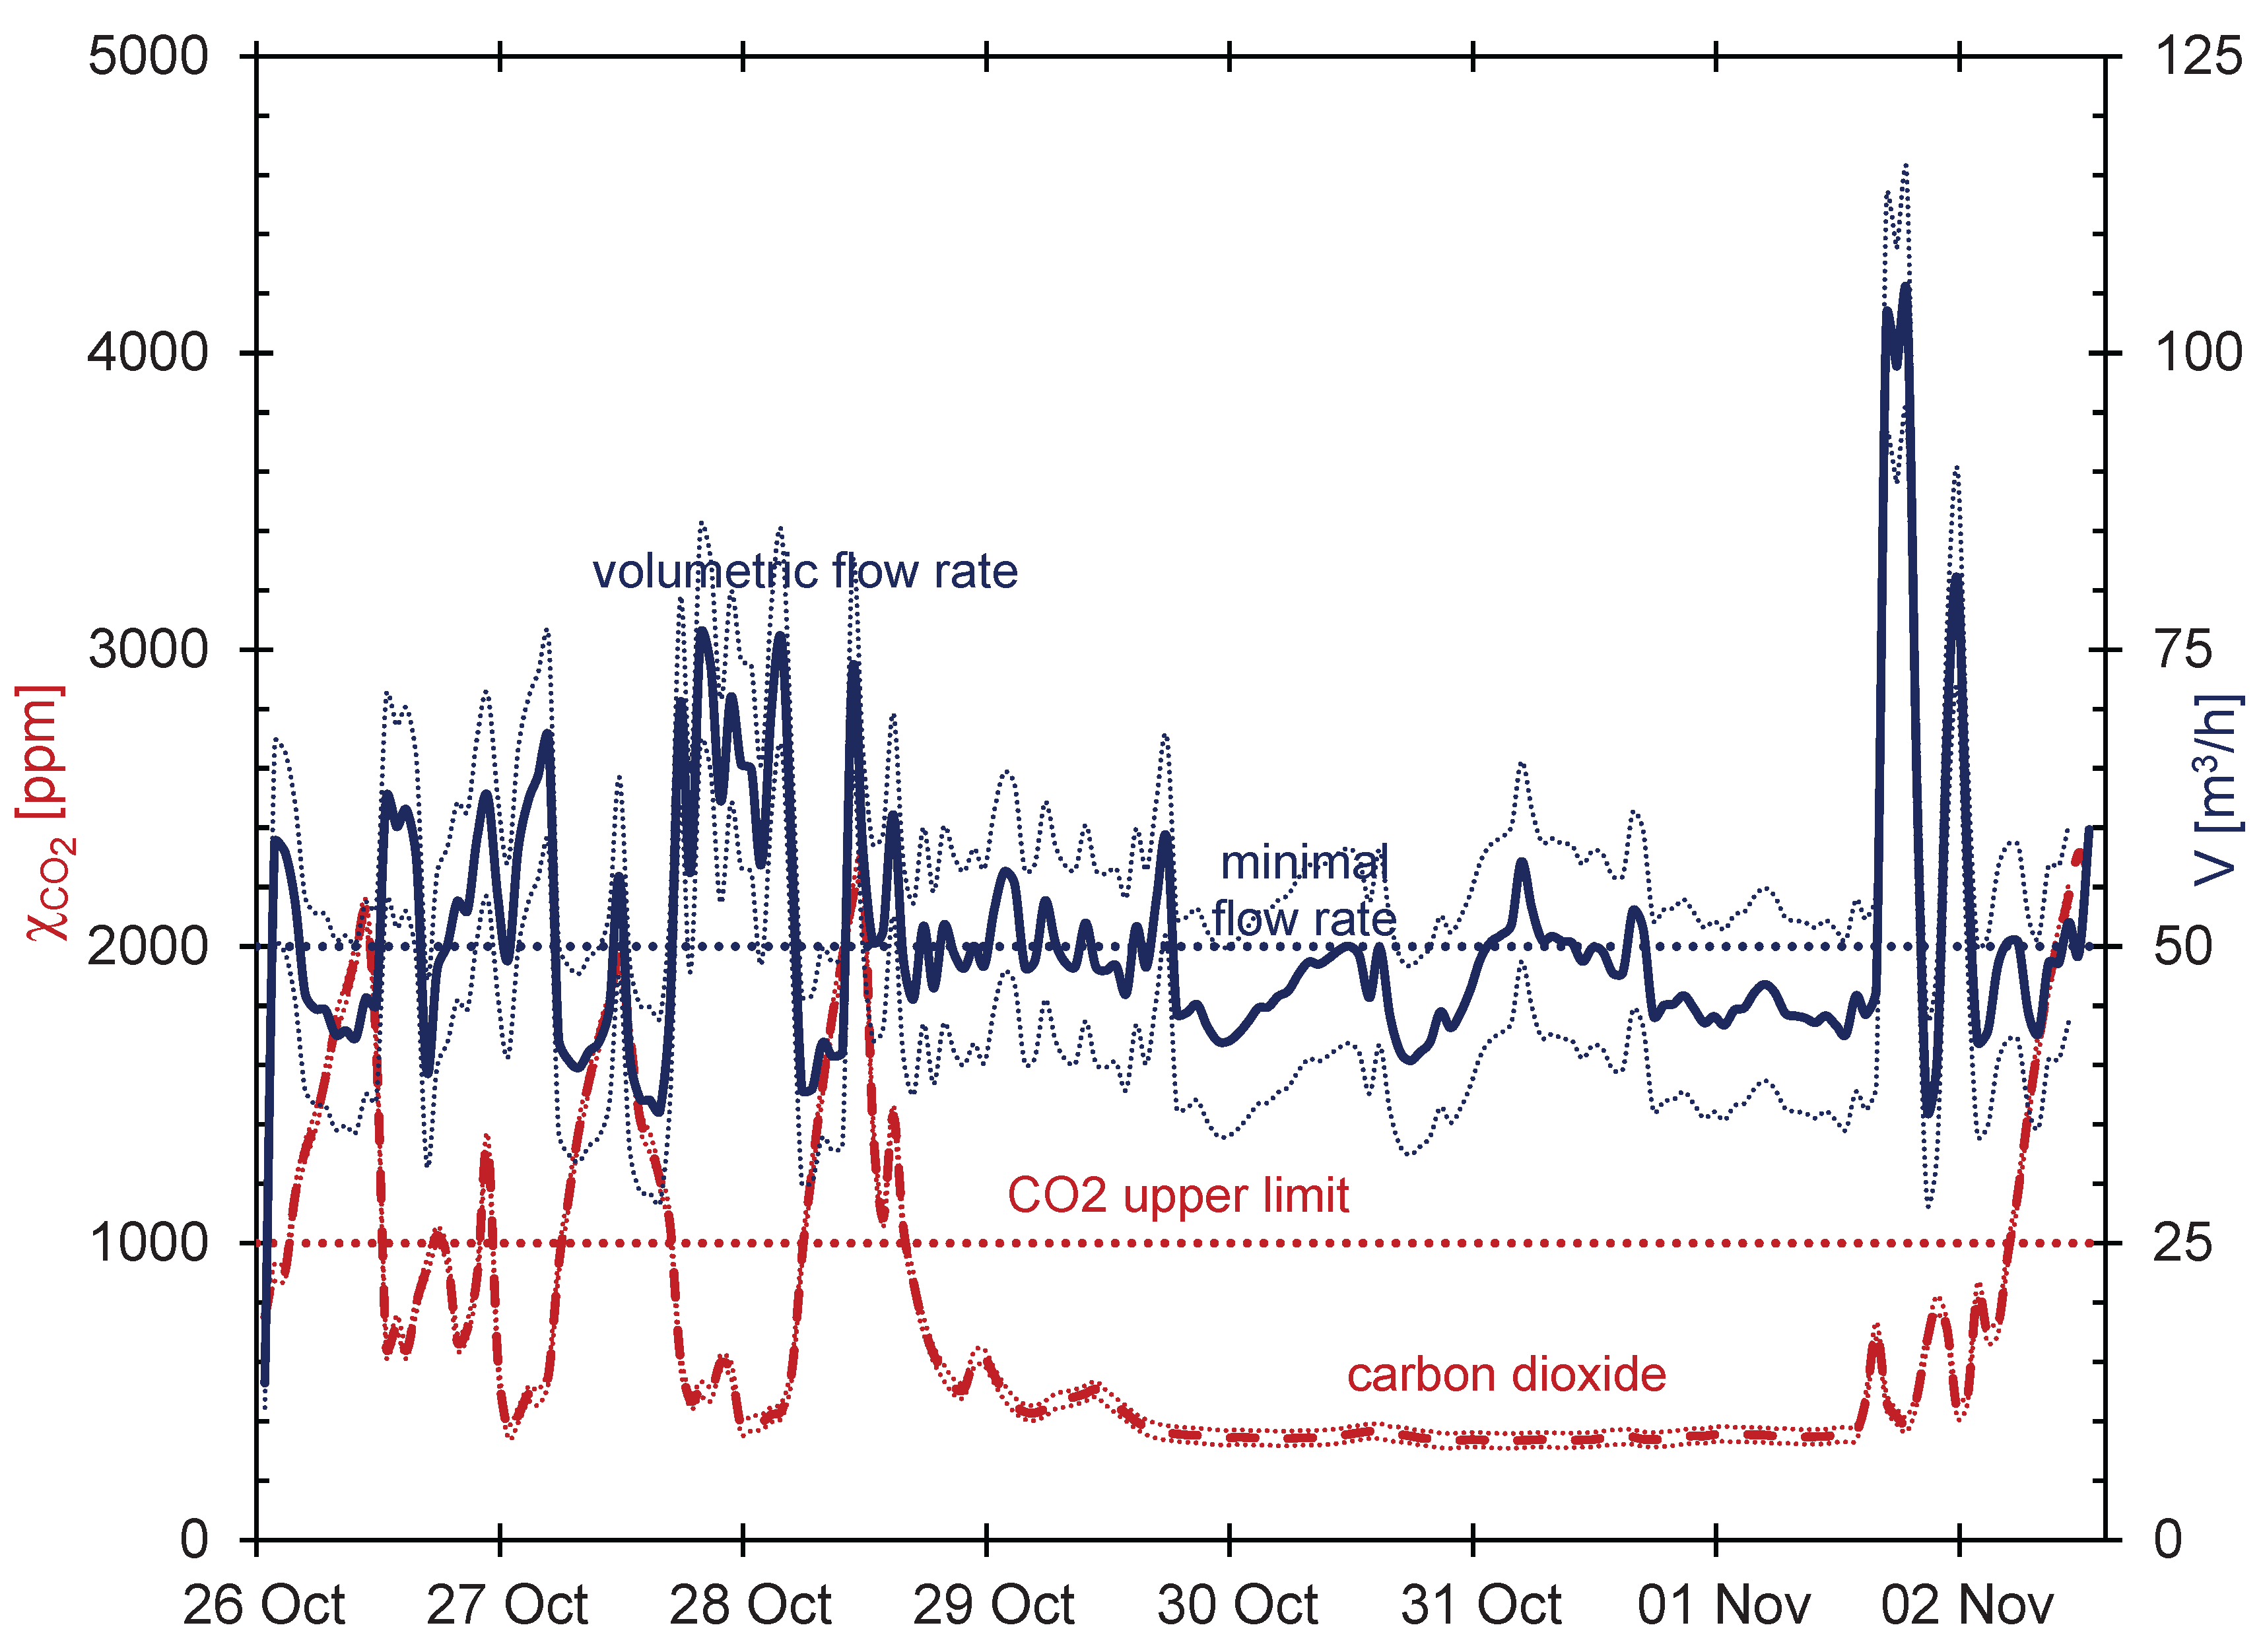
Figure 3.
The carbon dioxide mole fraction and air flow rate in the winter 2023.
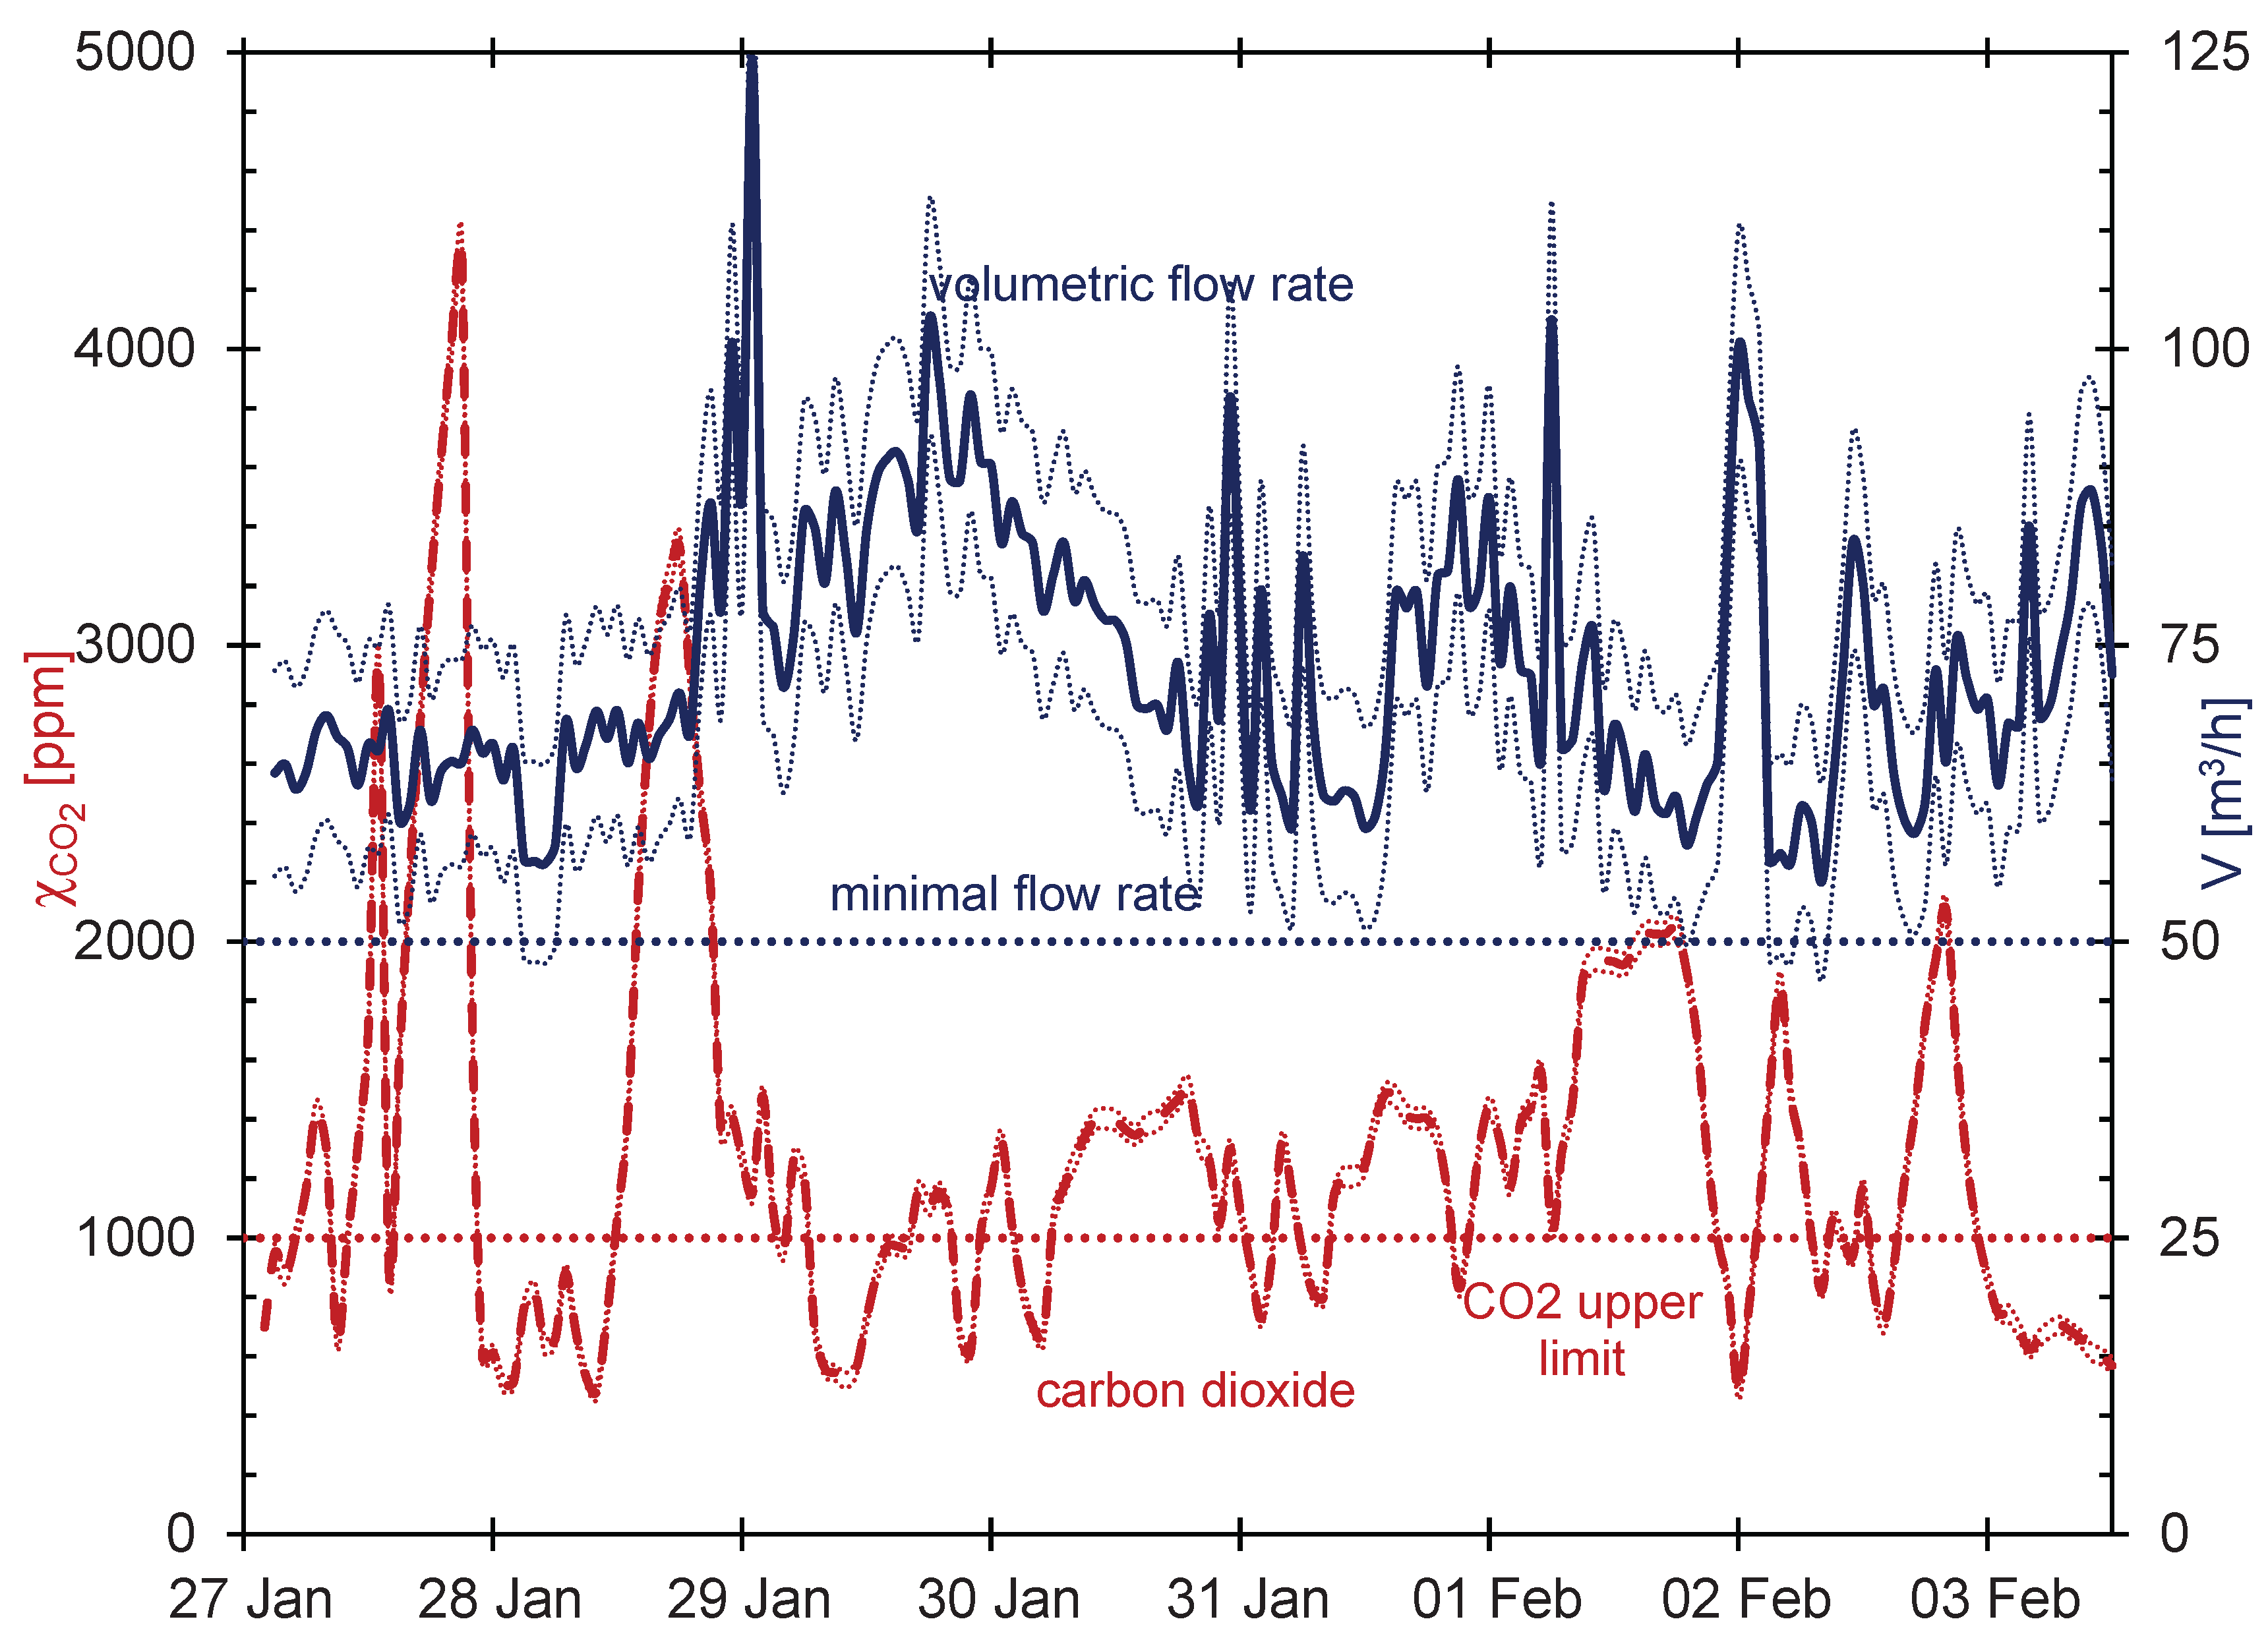
Figure 4.
The carbon dioxide mole fraction and air flow rate in the spring 2023.
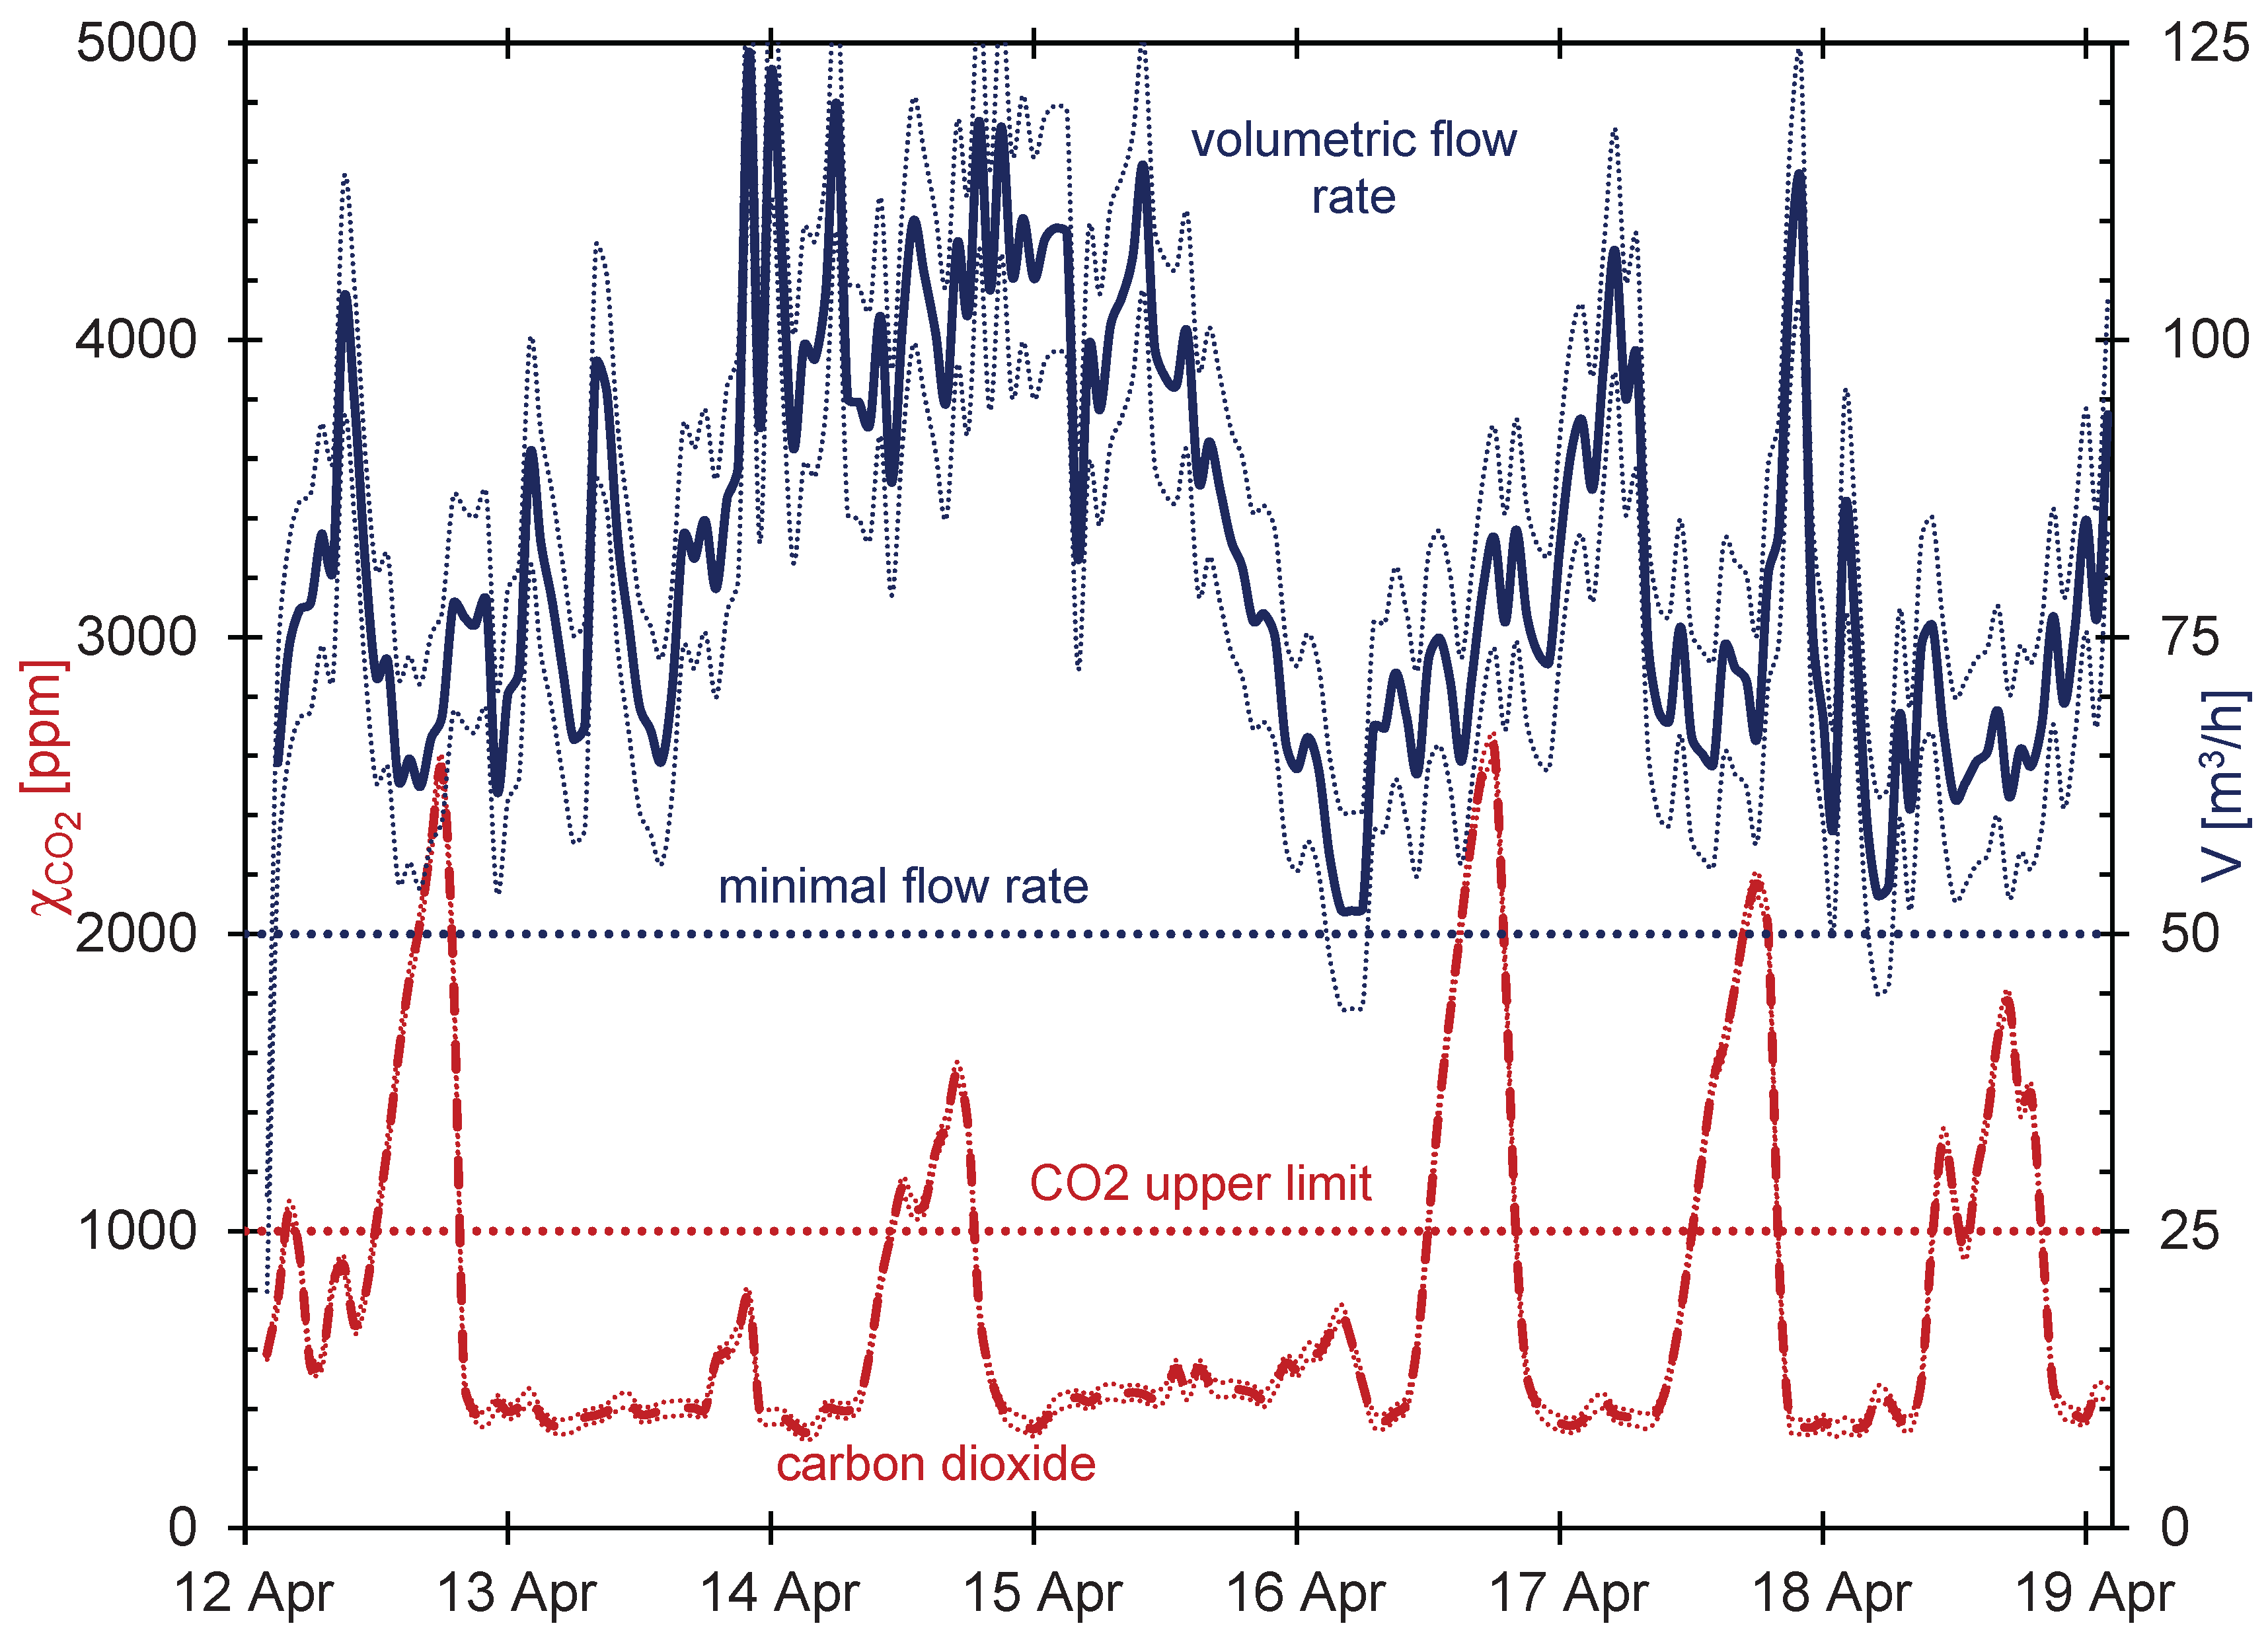
Figure 5.
The carbon dioxide mole fraction and air flow rate in the summer 2023.
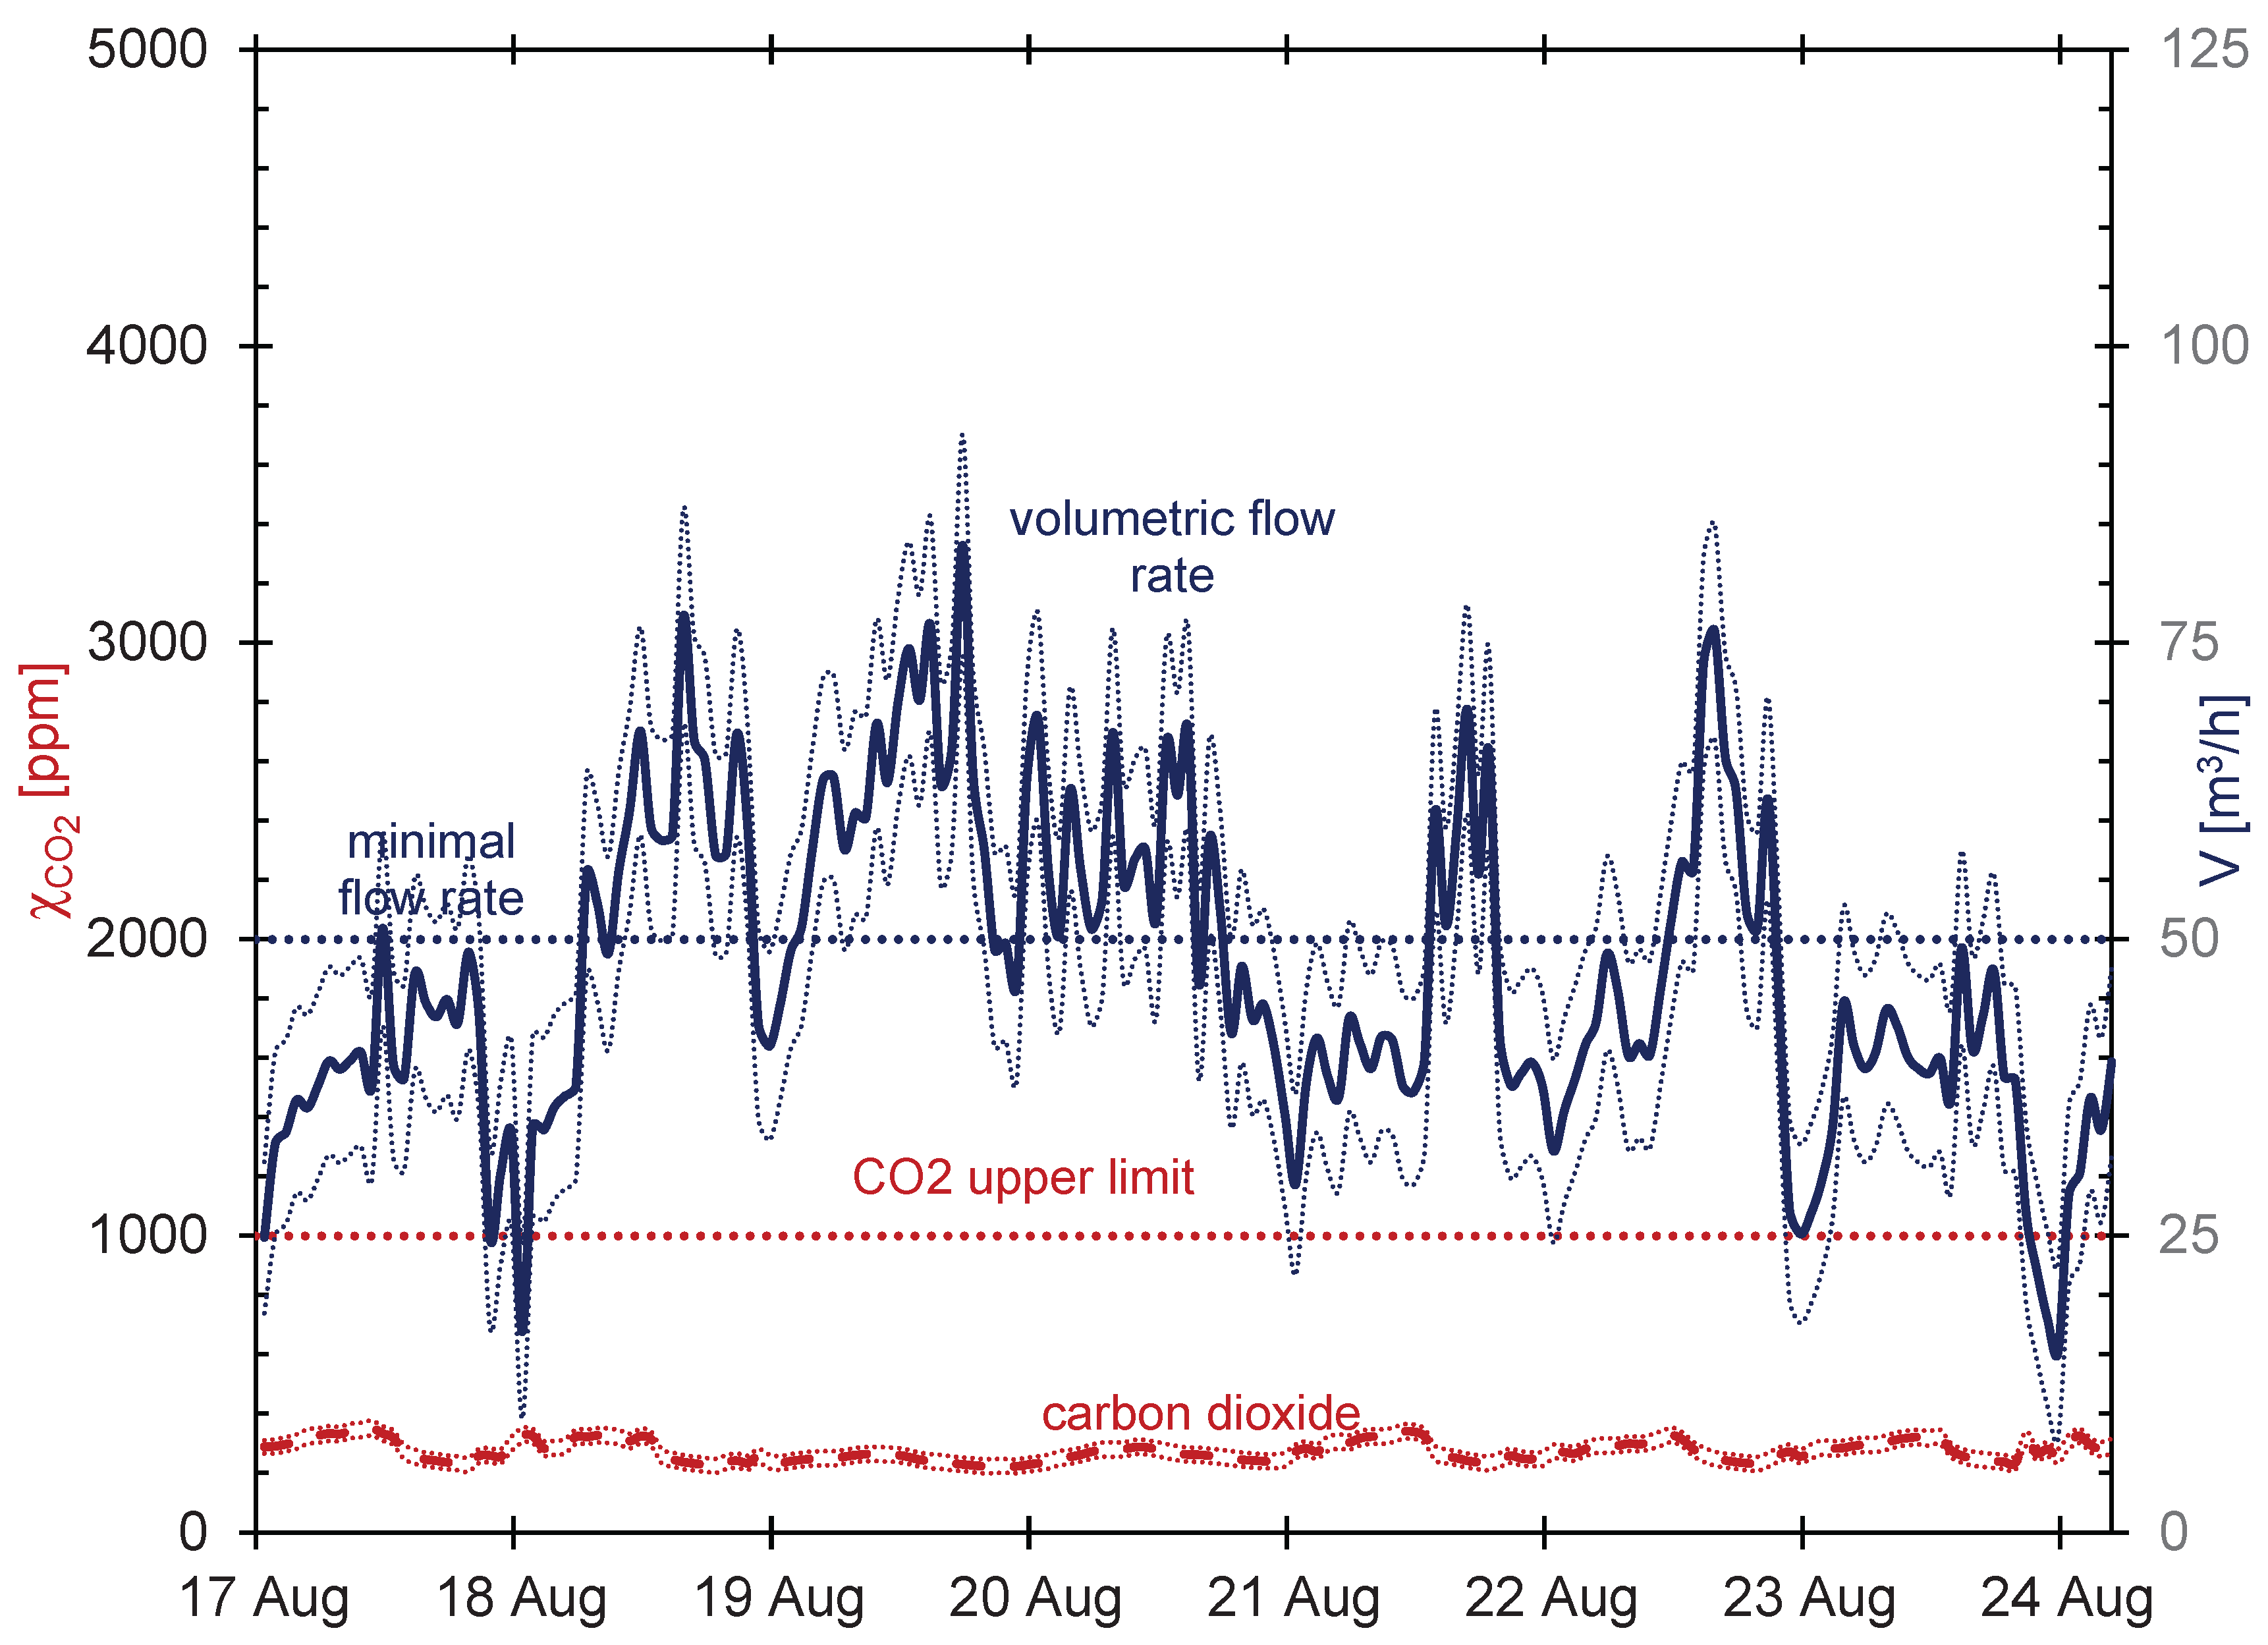
Figure 6.
The temperatures in the autumn 2022.
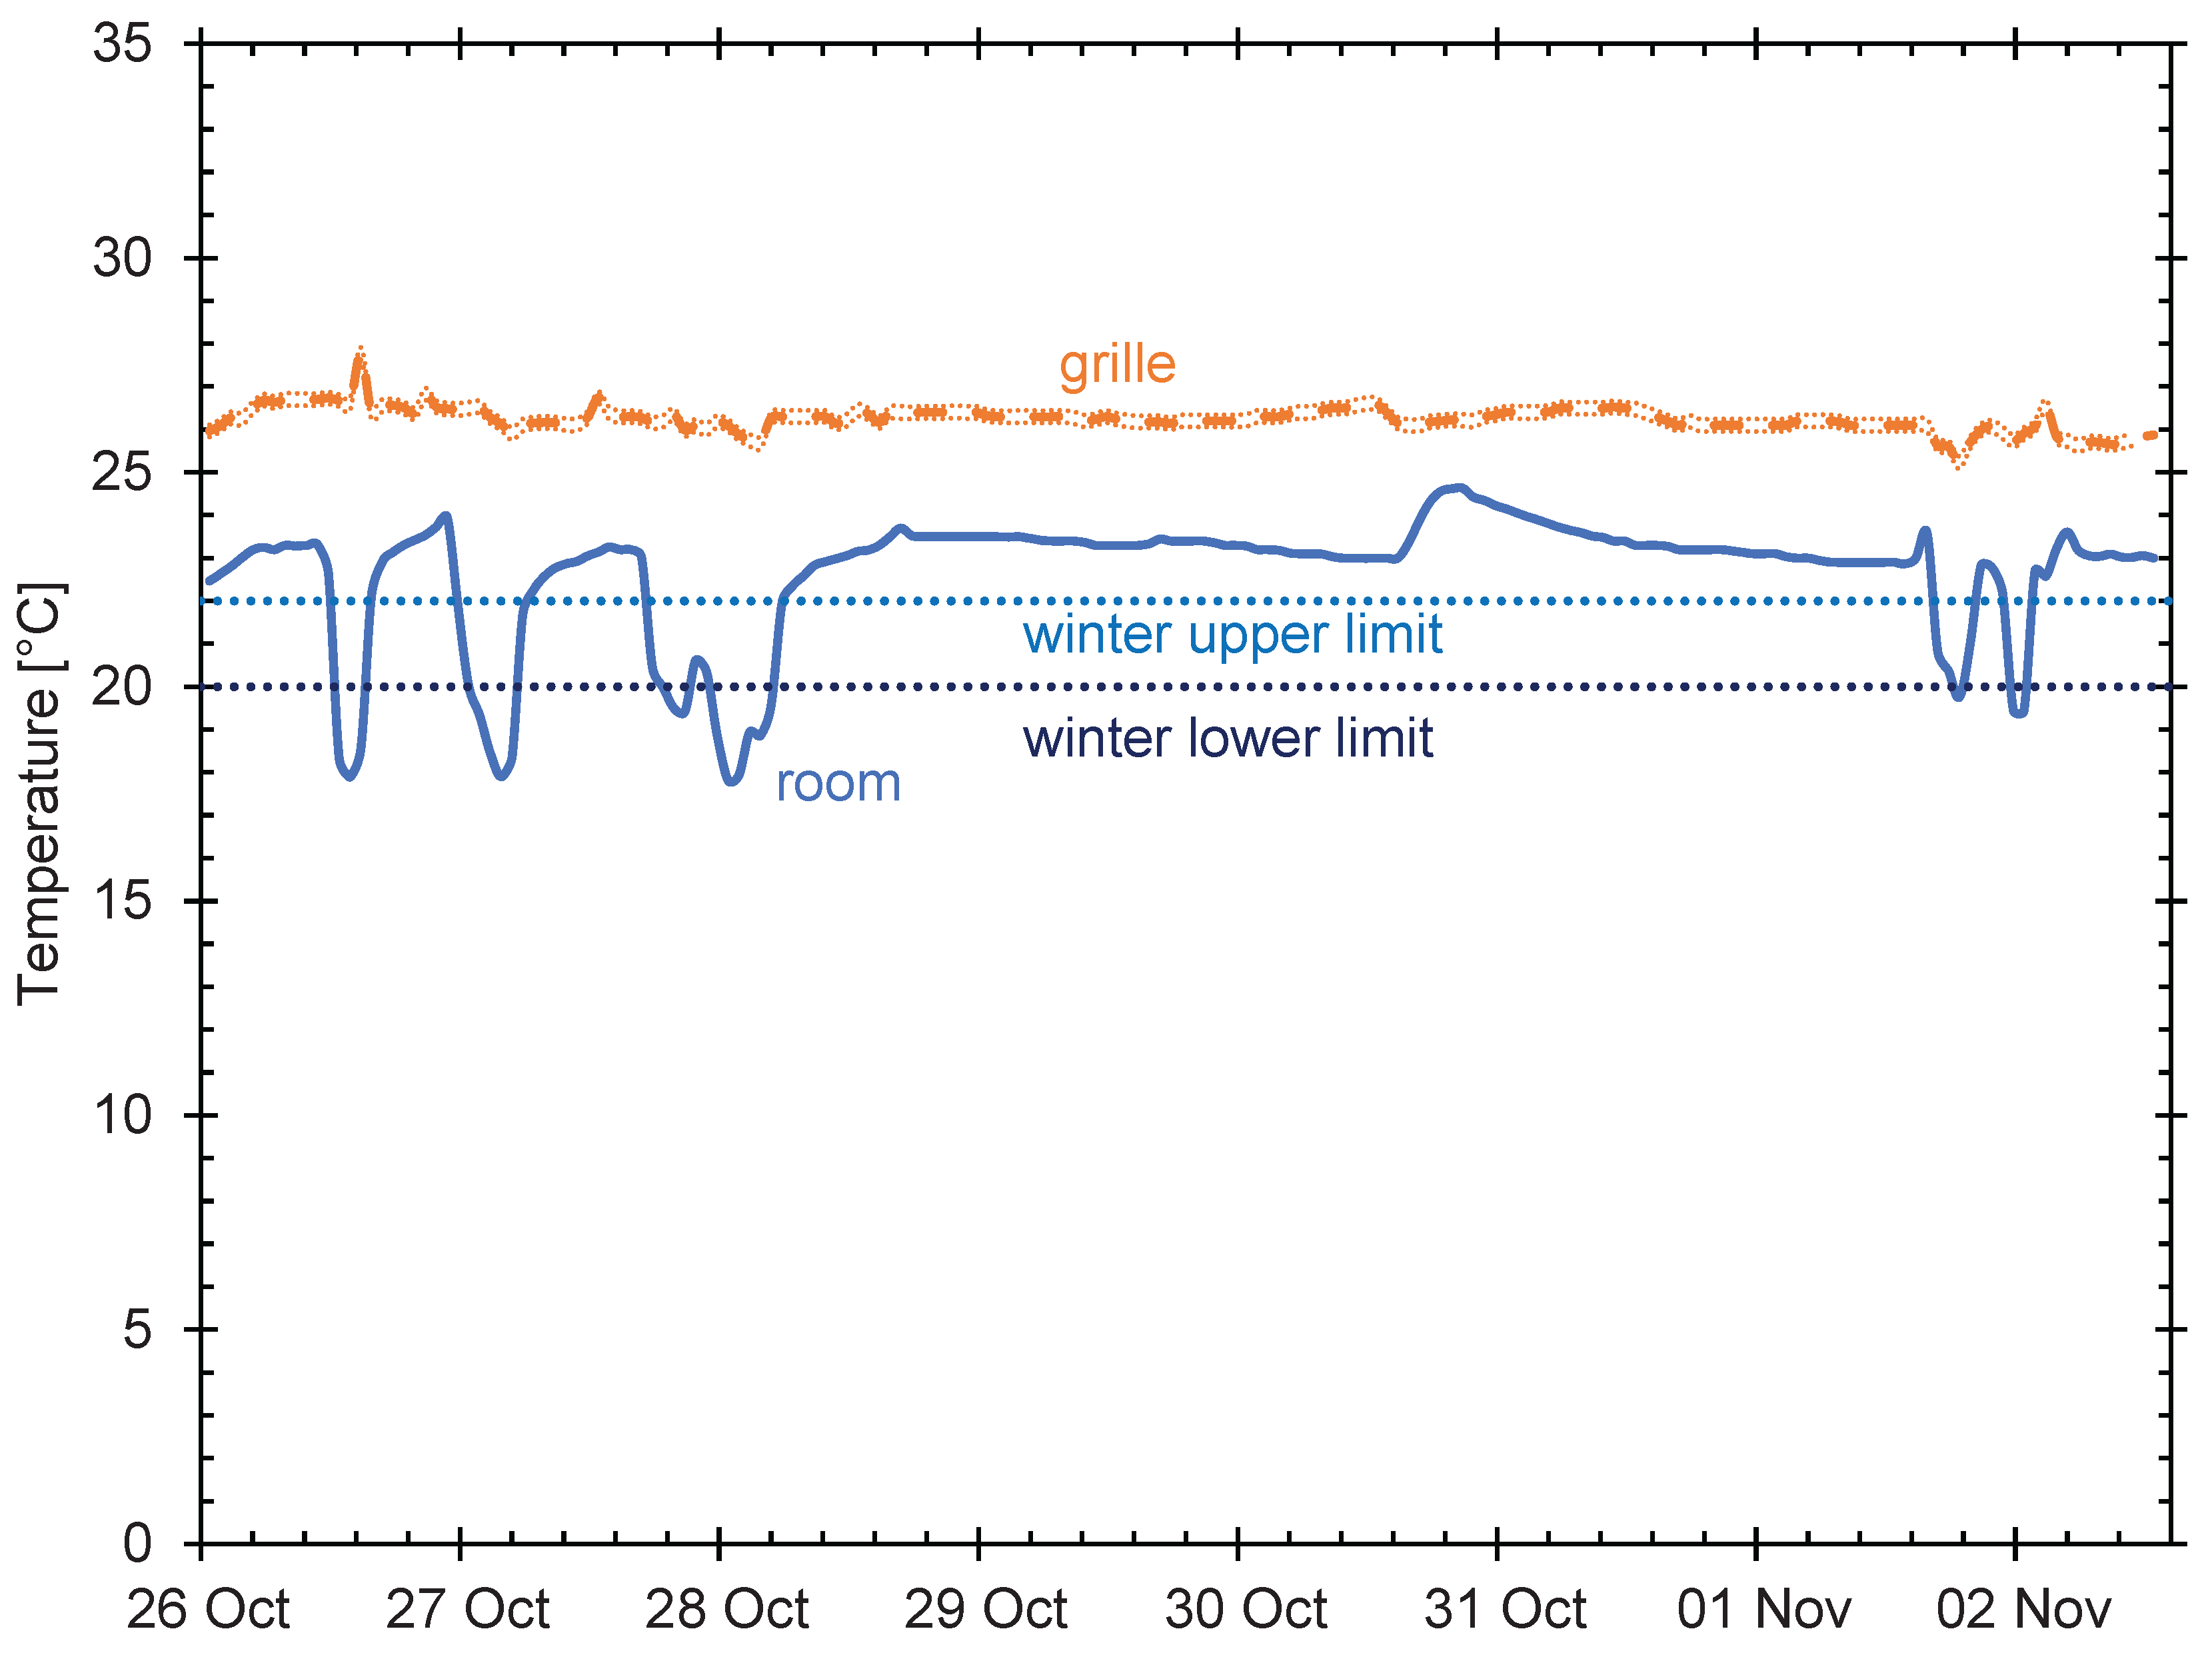
Figure 7.
The temperatures in the winter 2023.
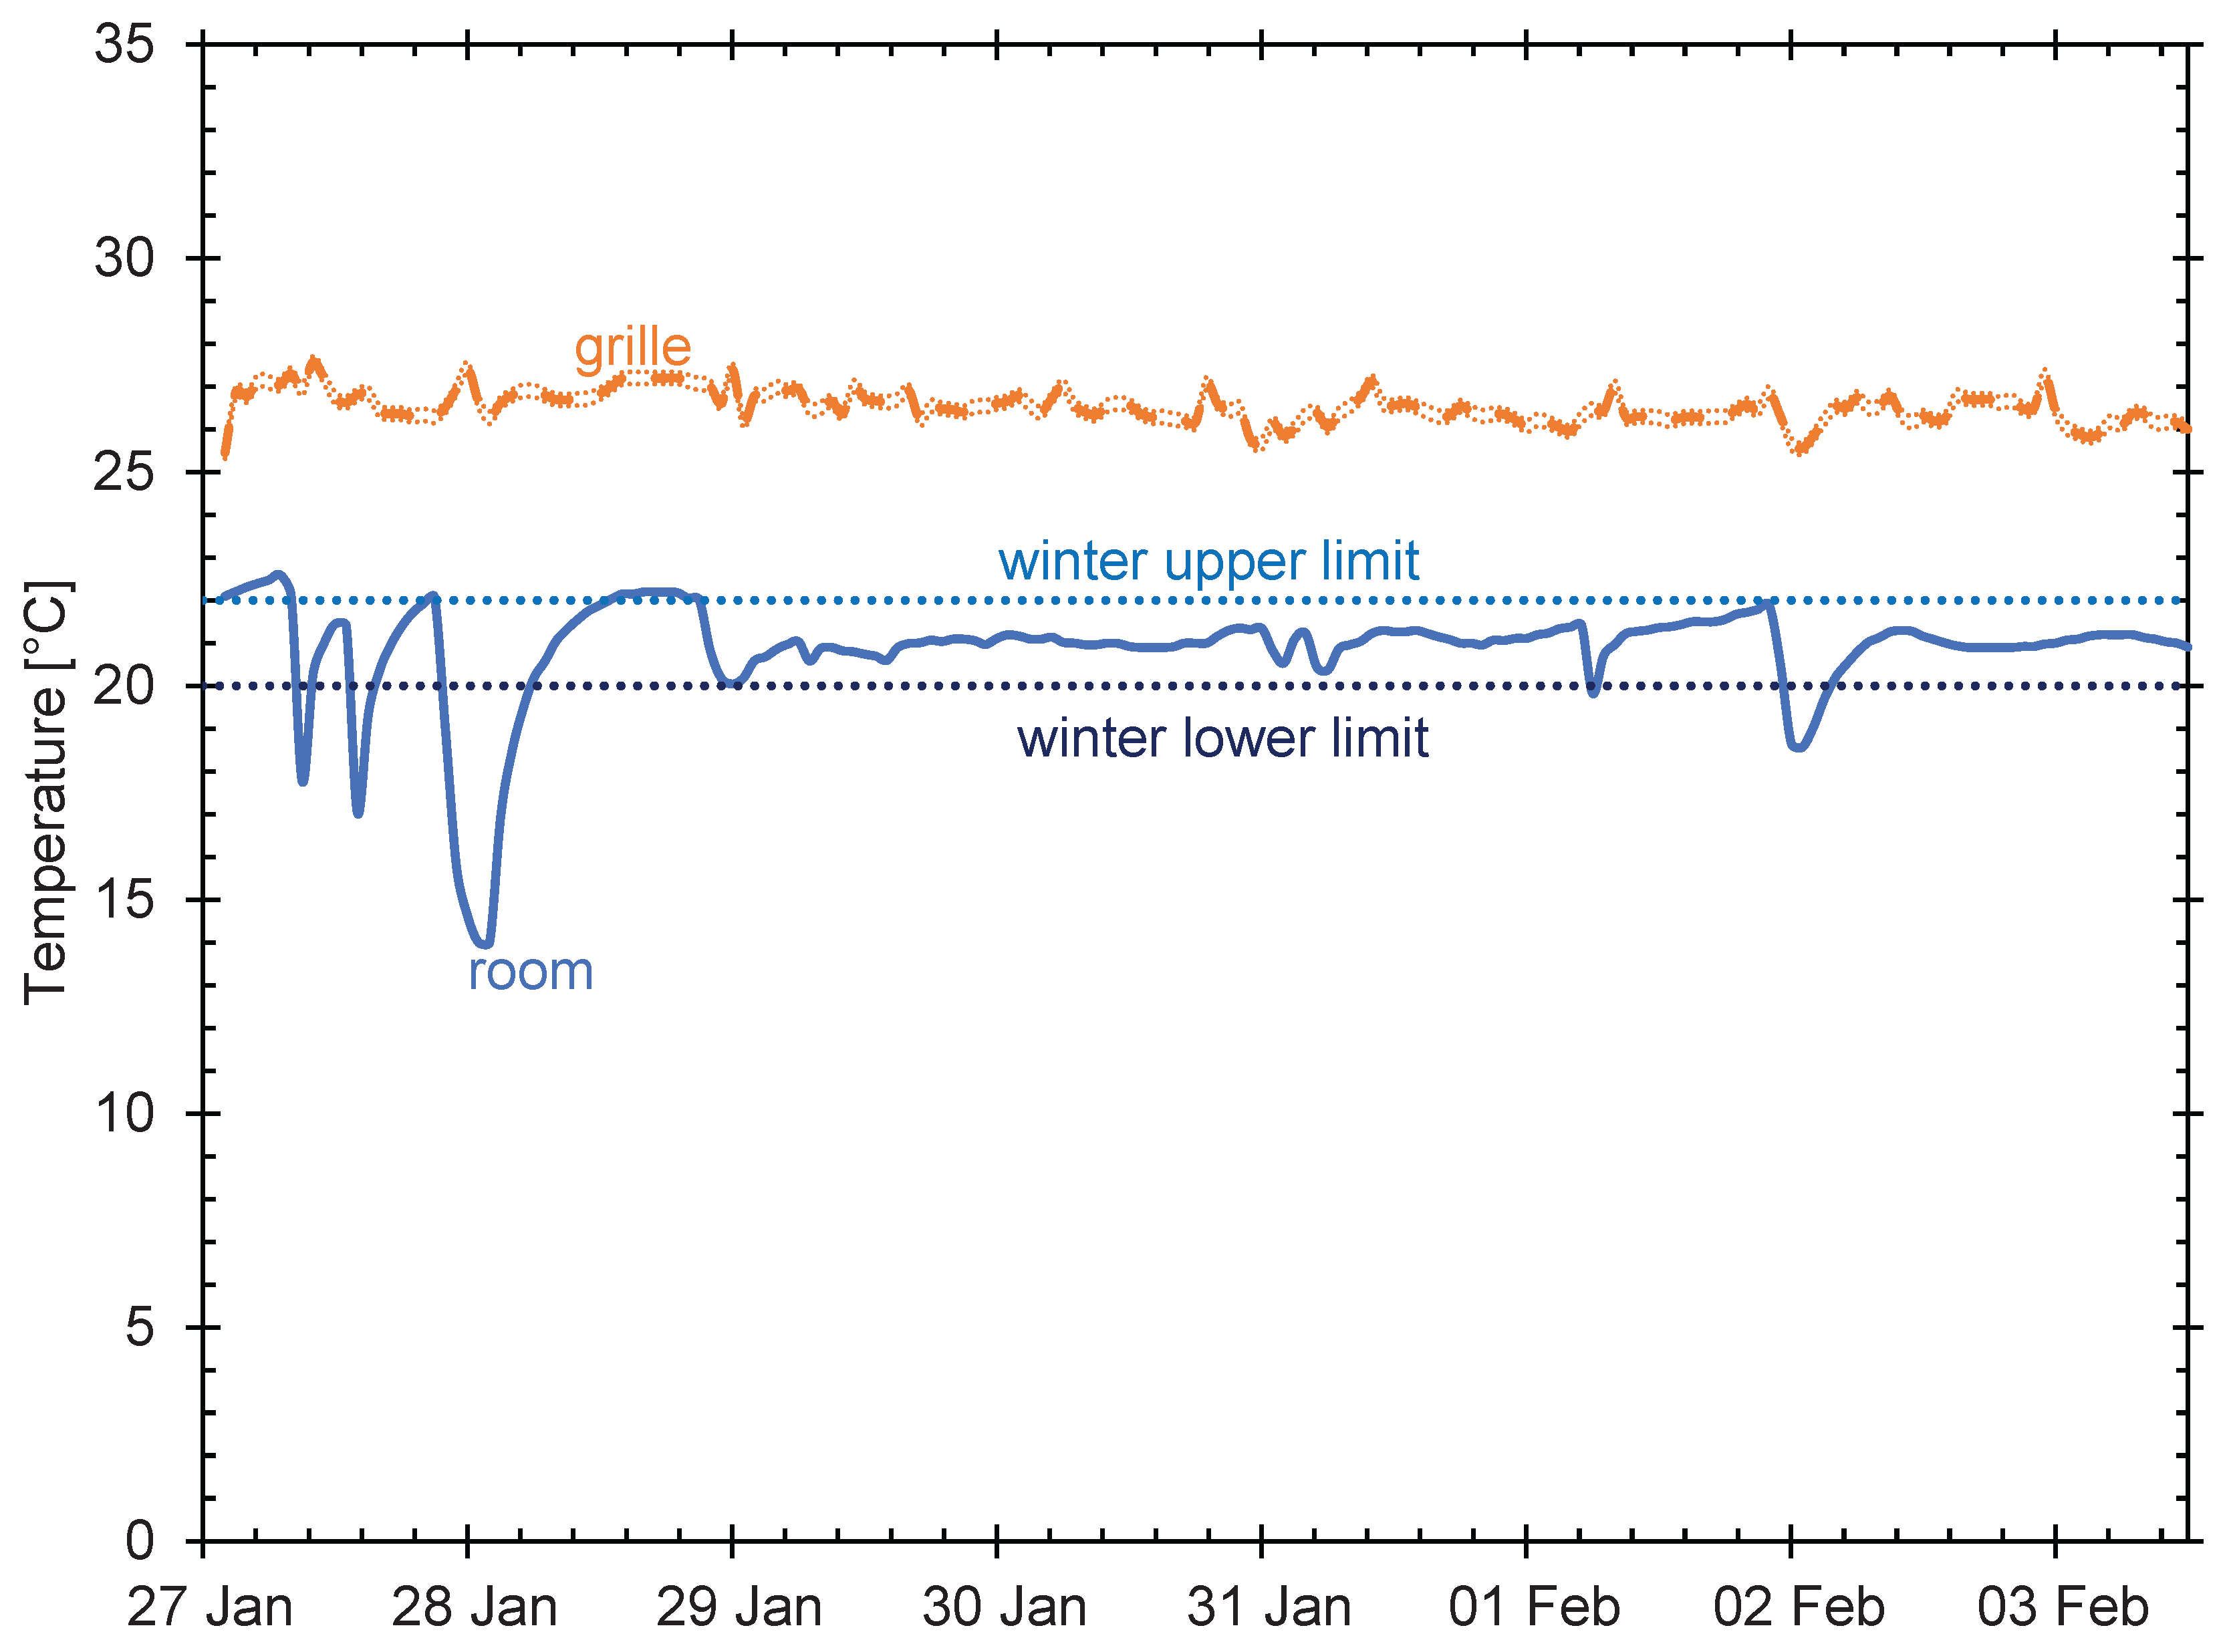
Figure 8.
The temperatures in the spring 2023.

Figure 9.
The temperatures in the summer 2023.
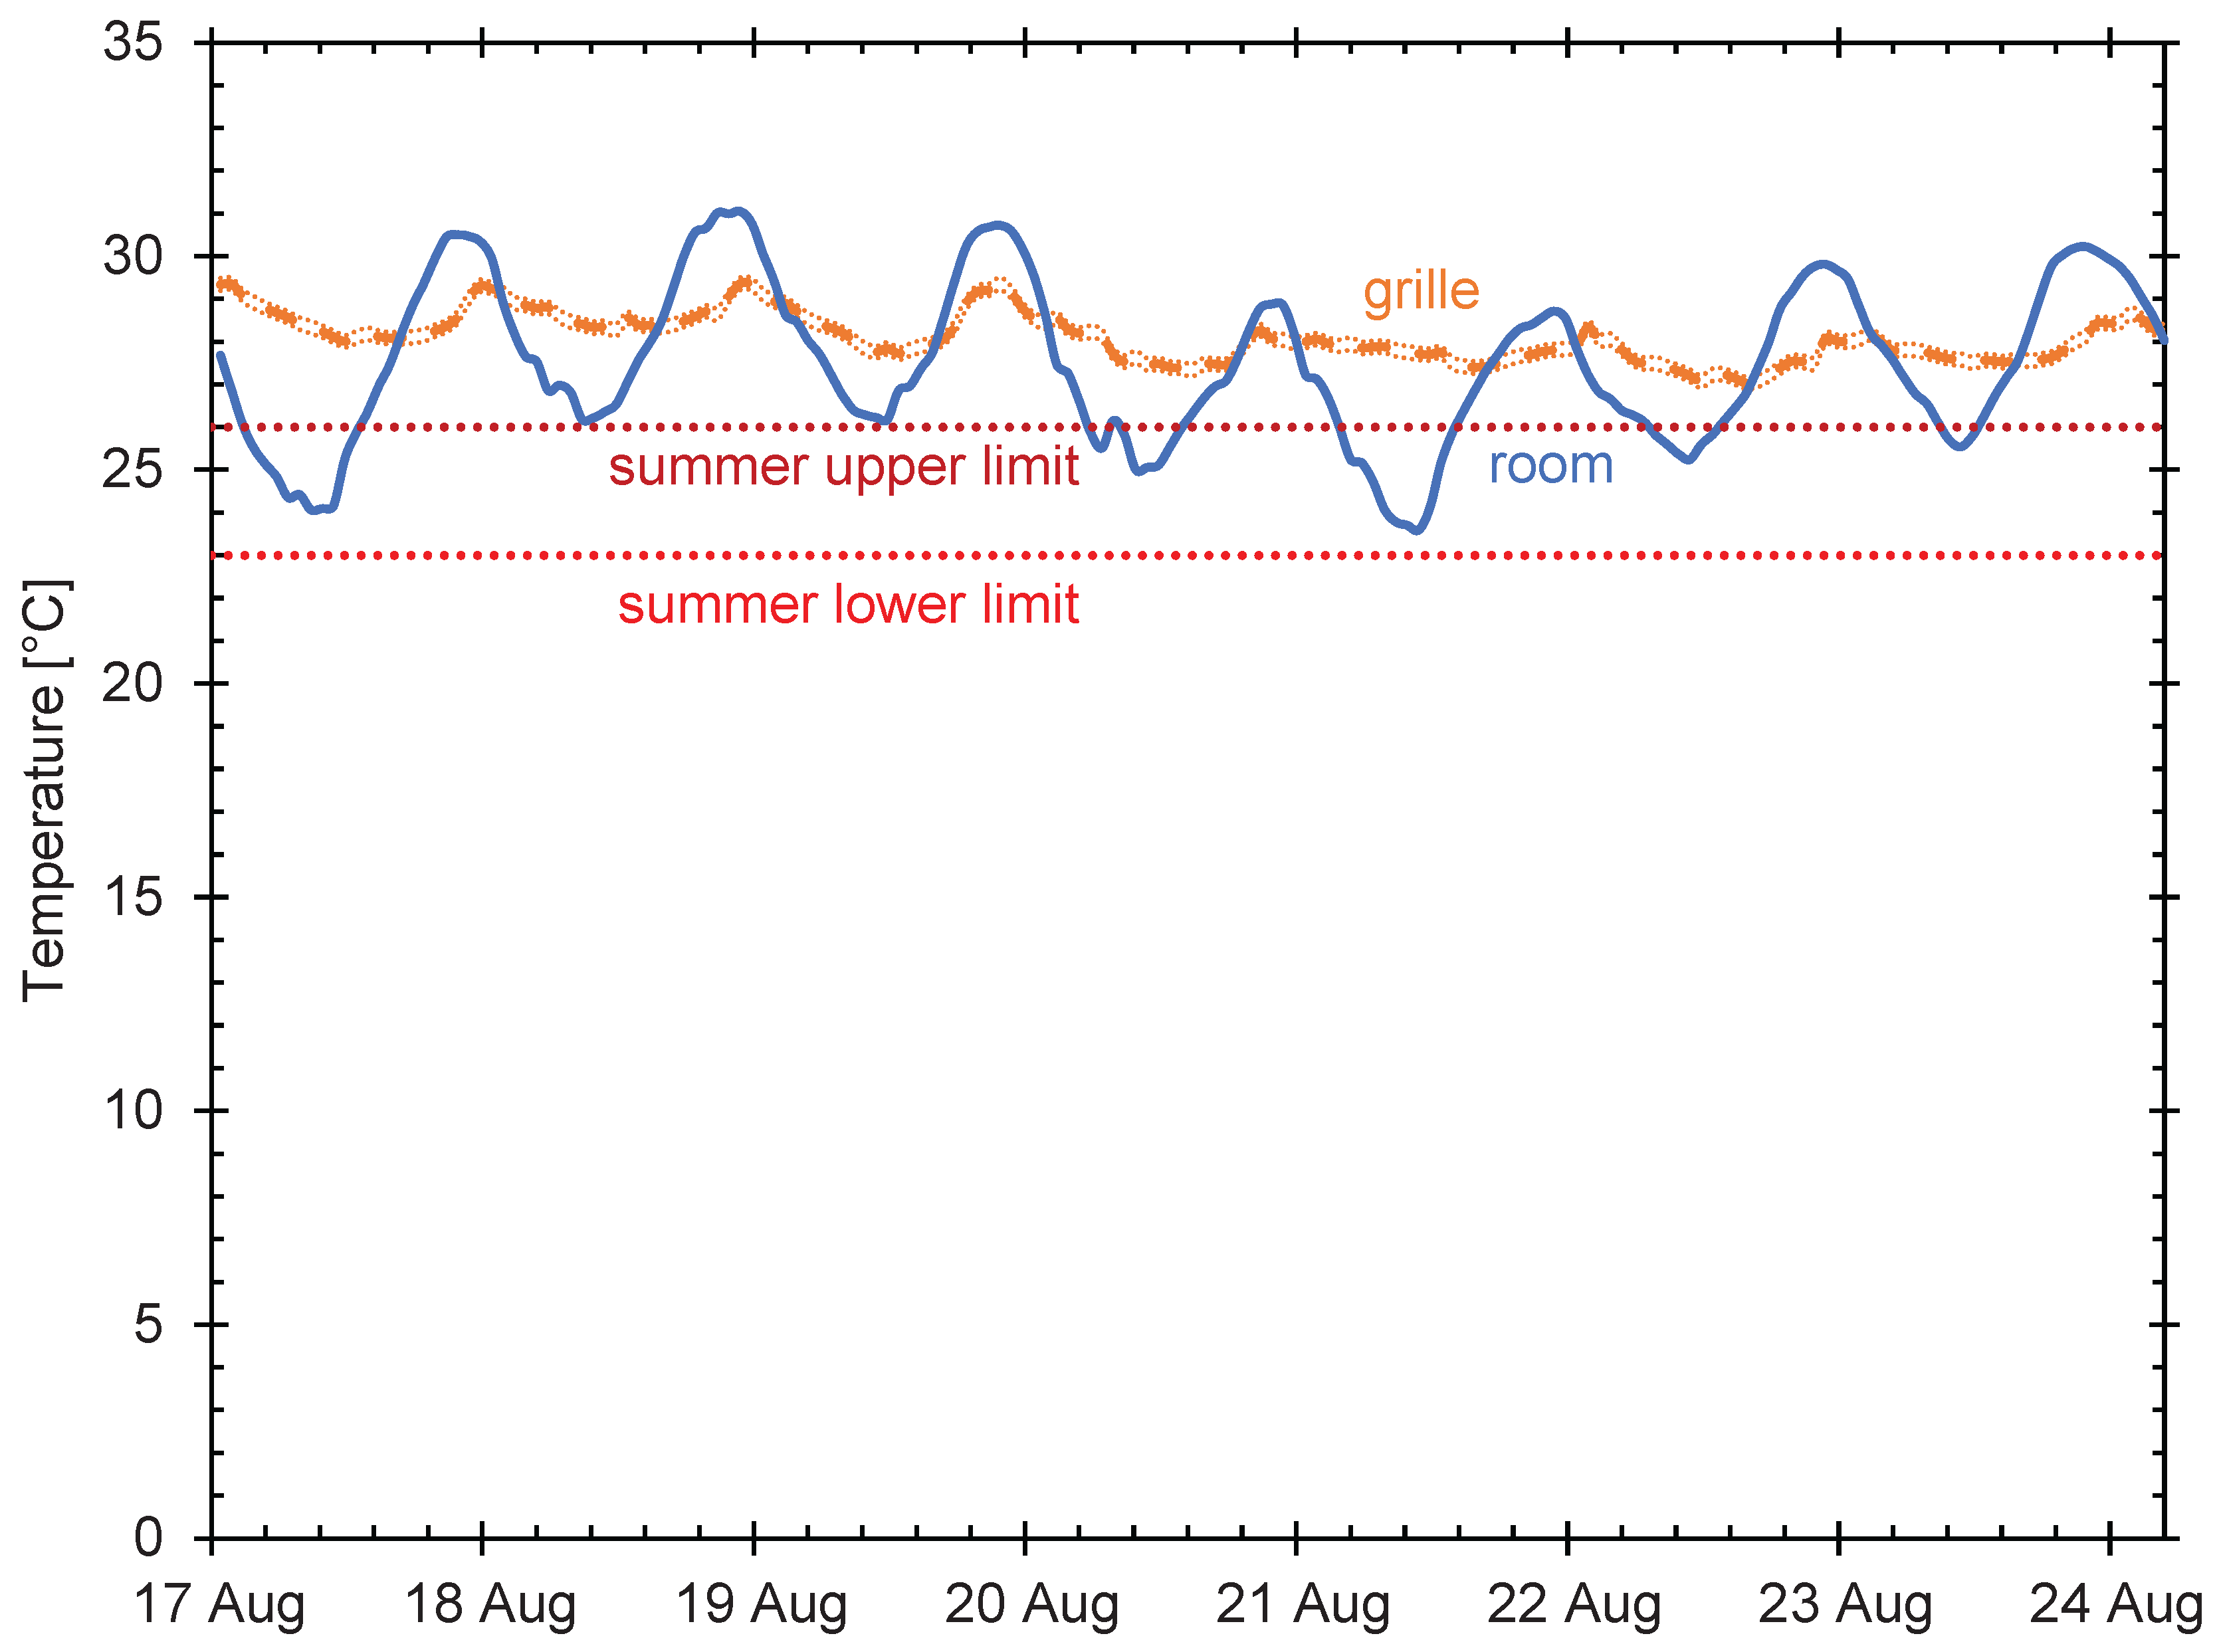
Figure 10.
The relative humidity in the autumn 2022.
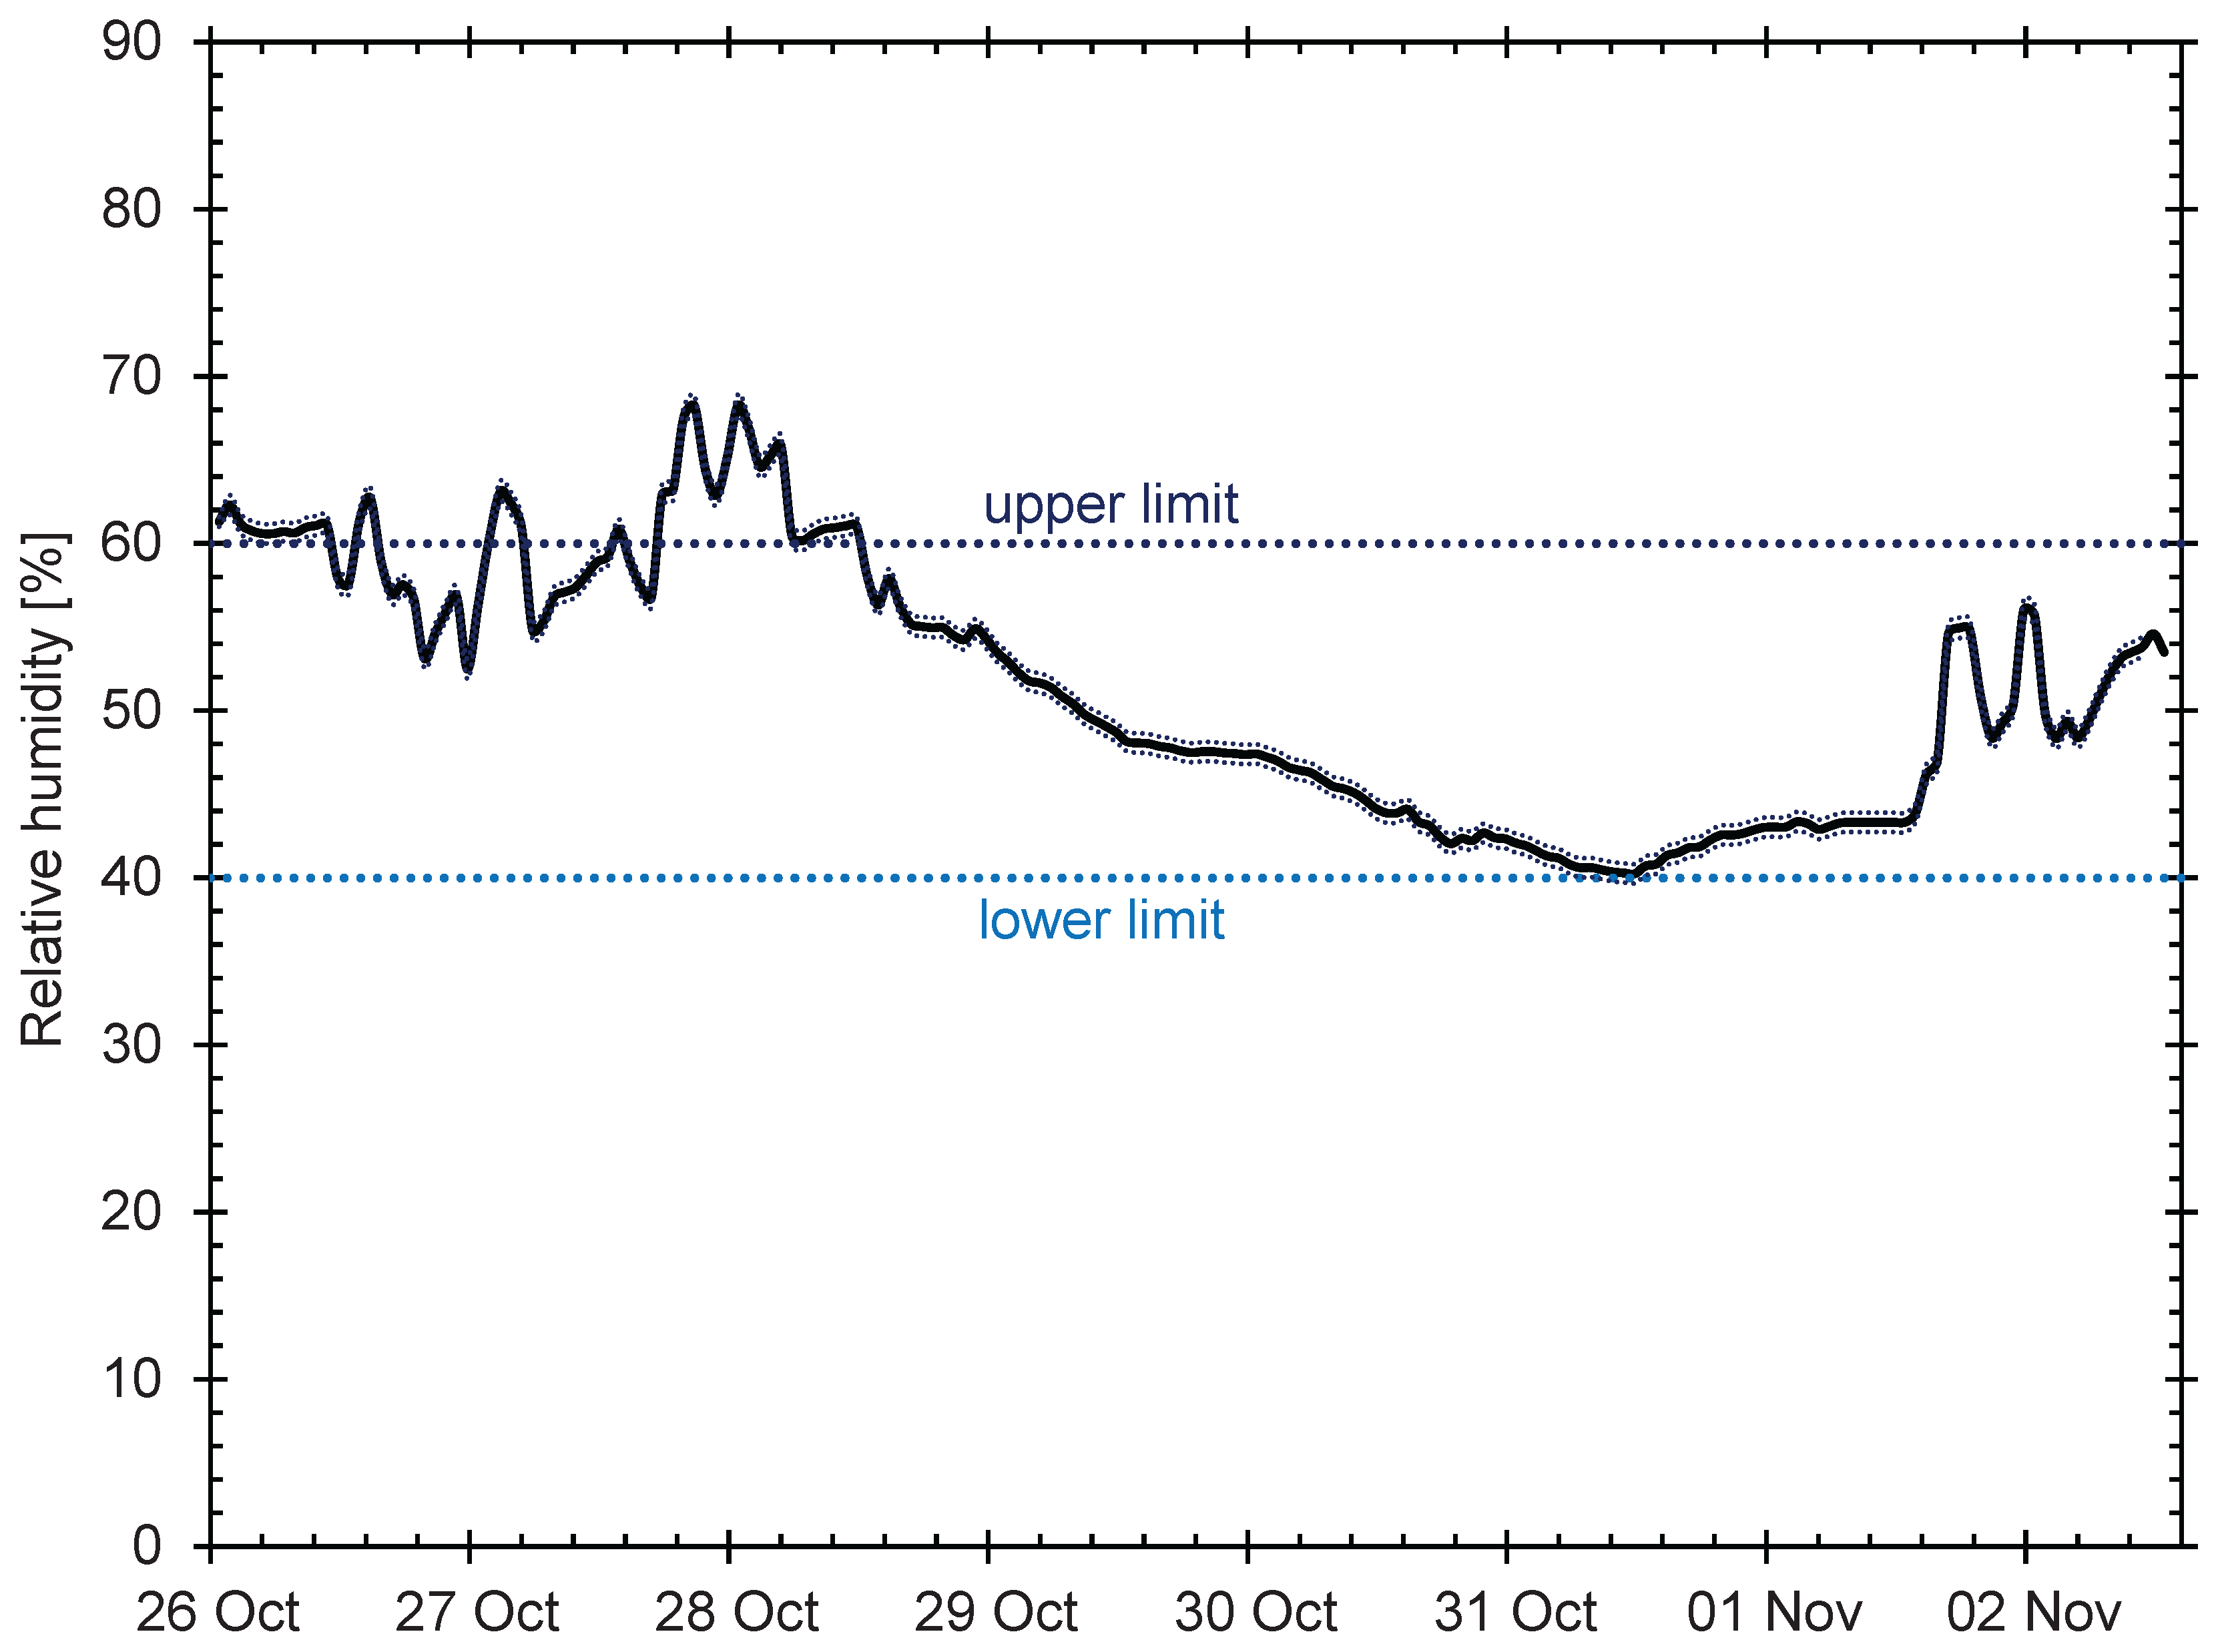
Figure 11.
The relative humidity in the winter 2023.
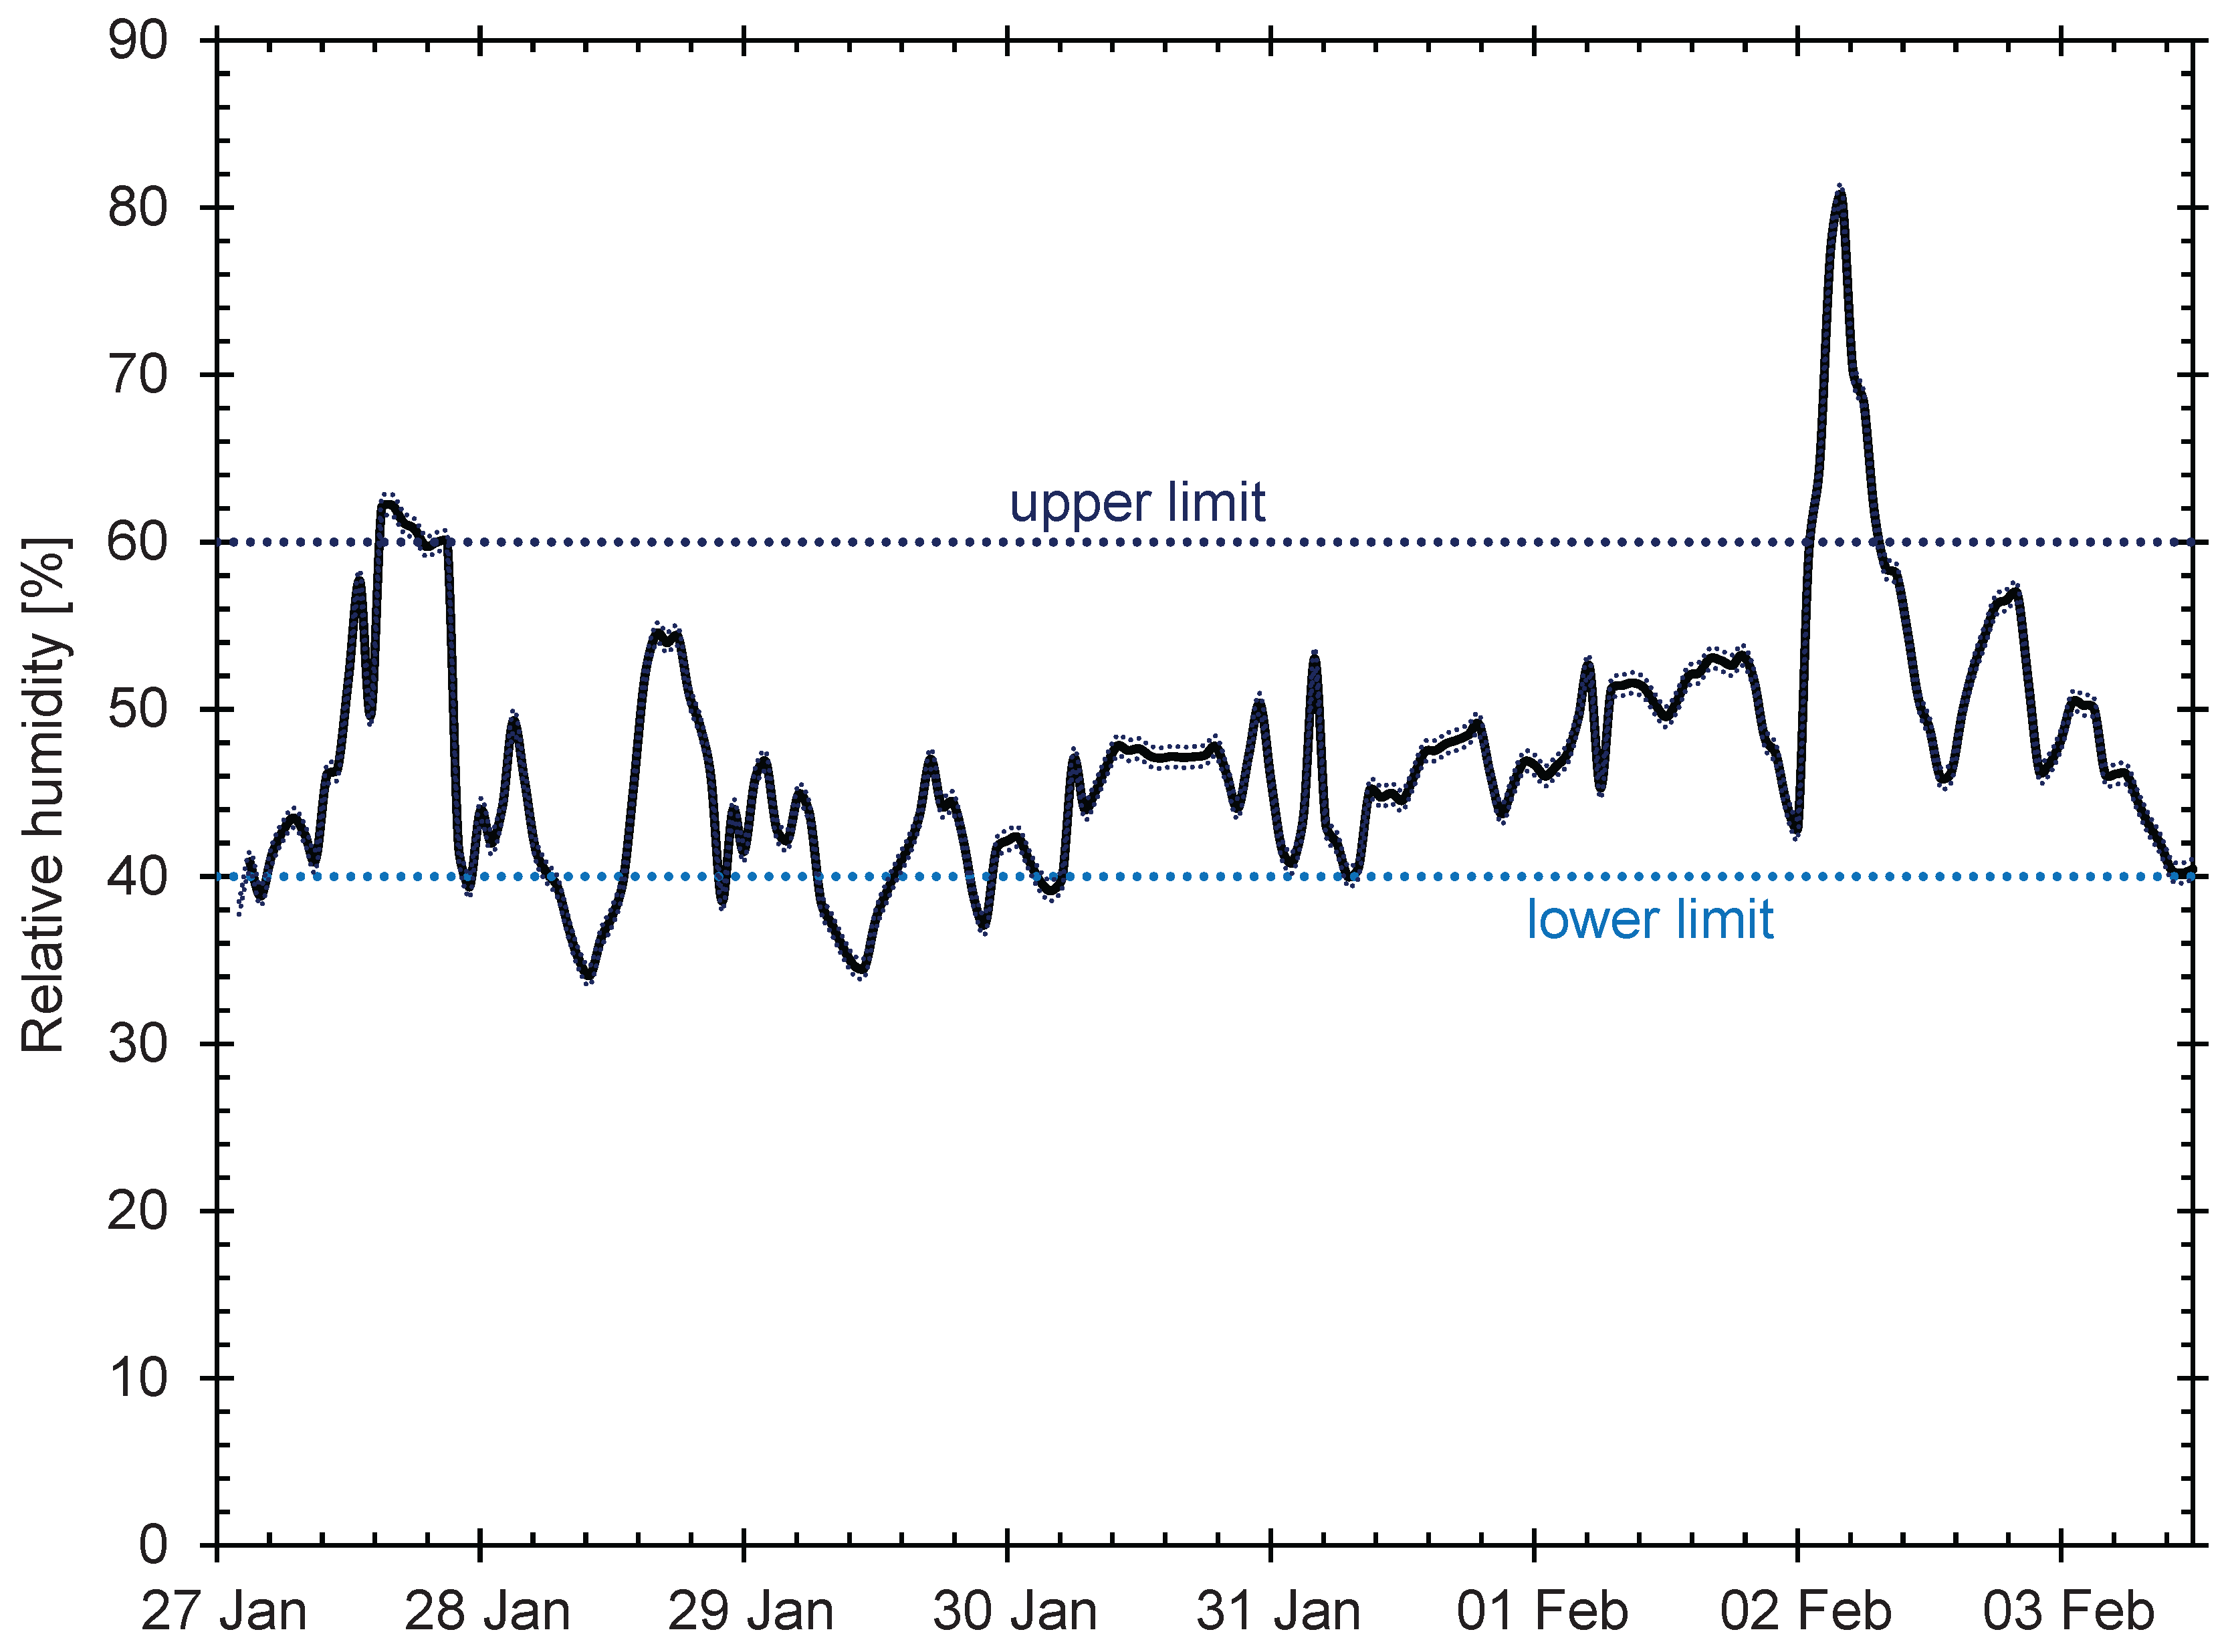
Figure 12.
The relative humidity in the spring 2023.
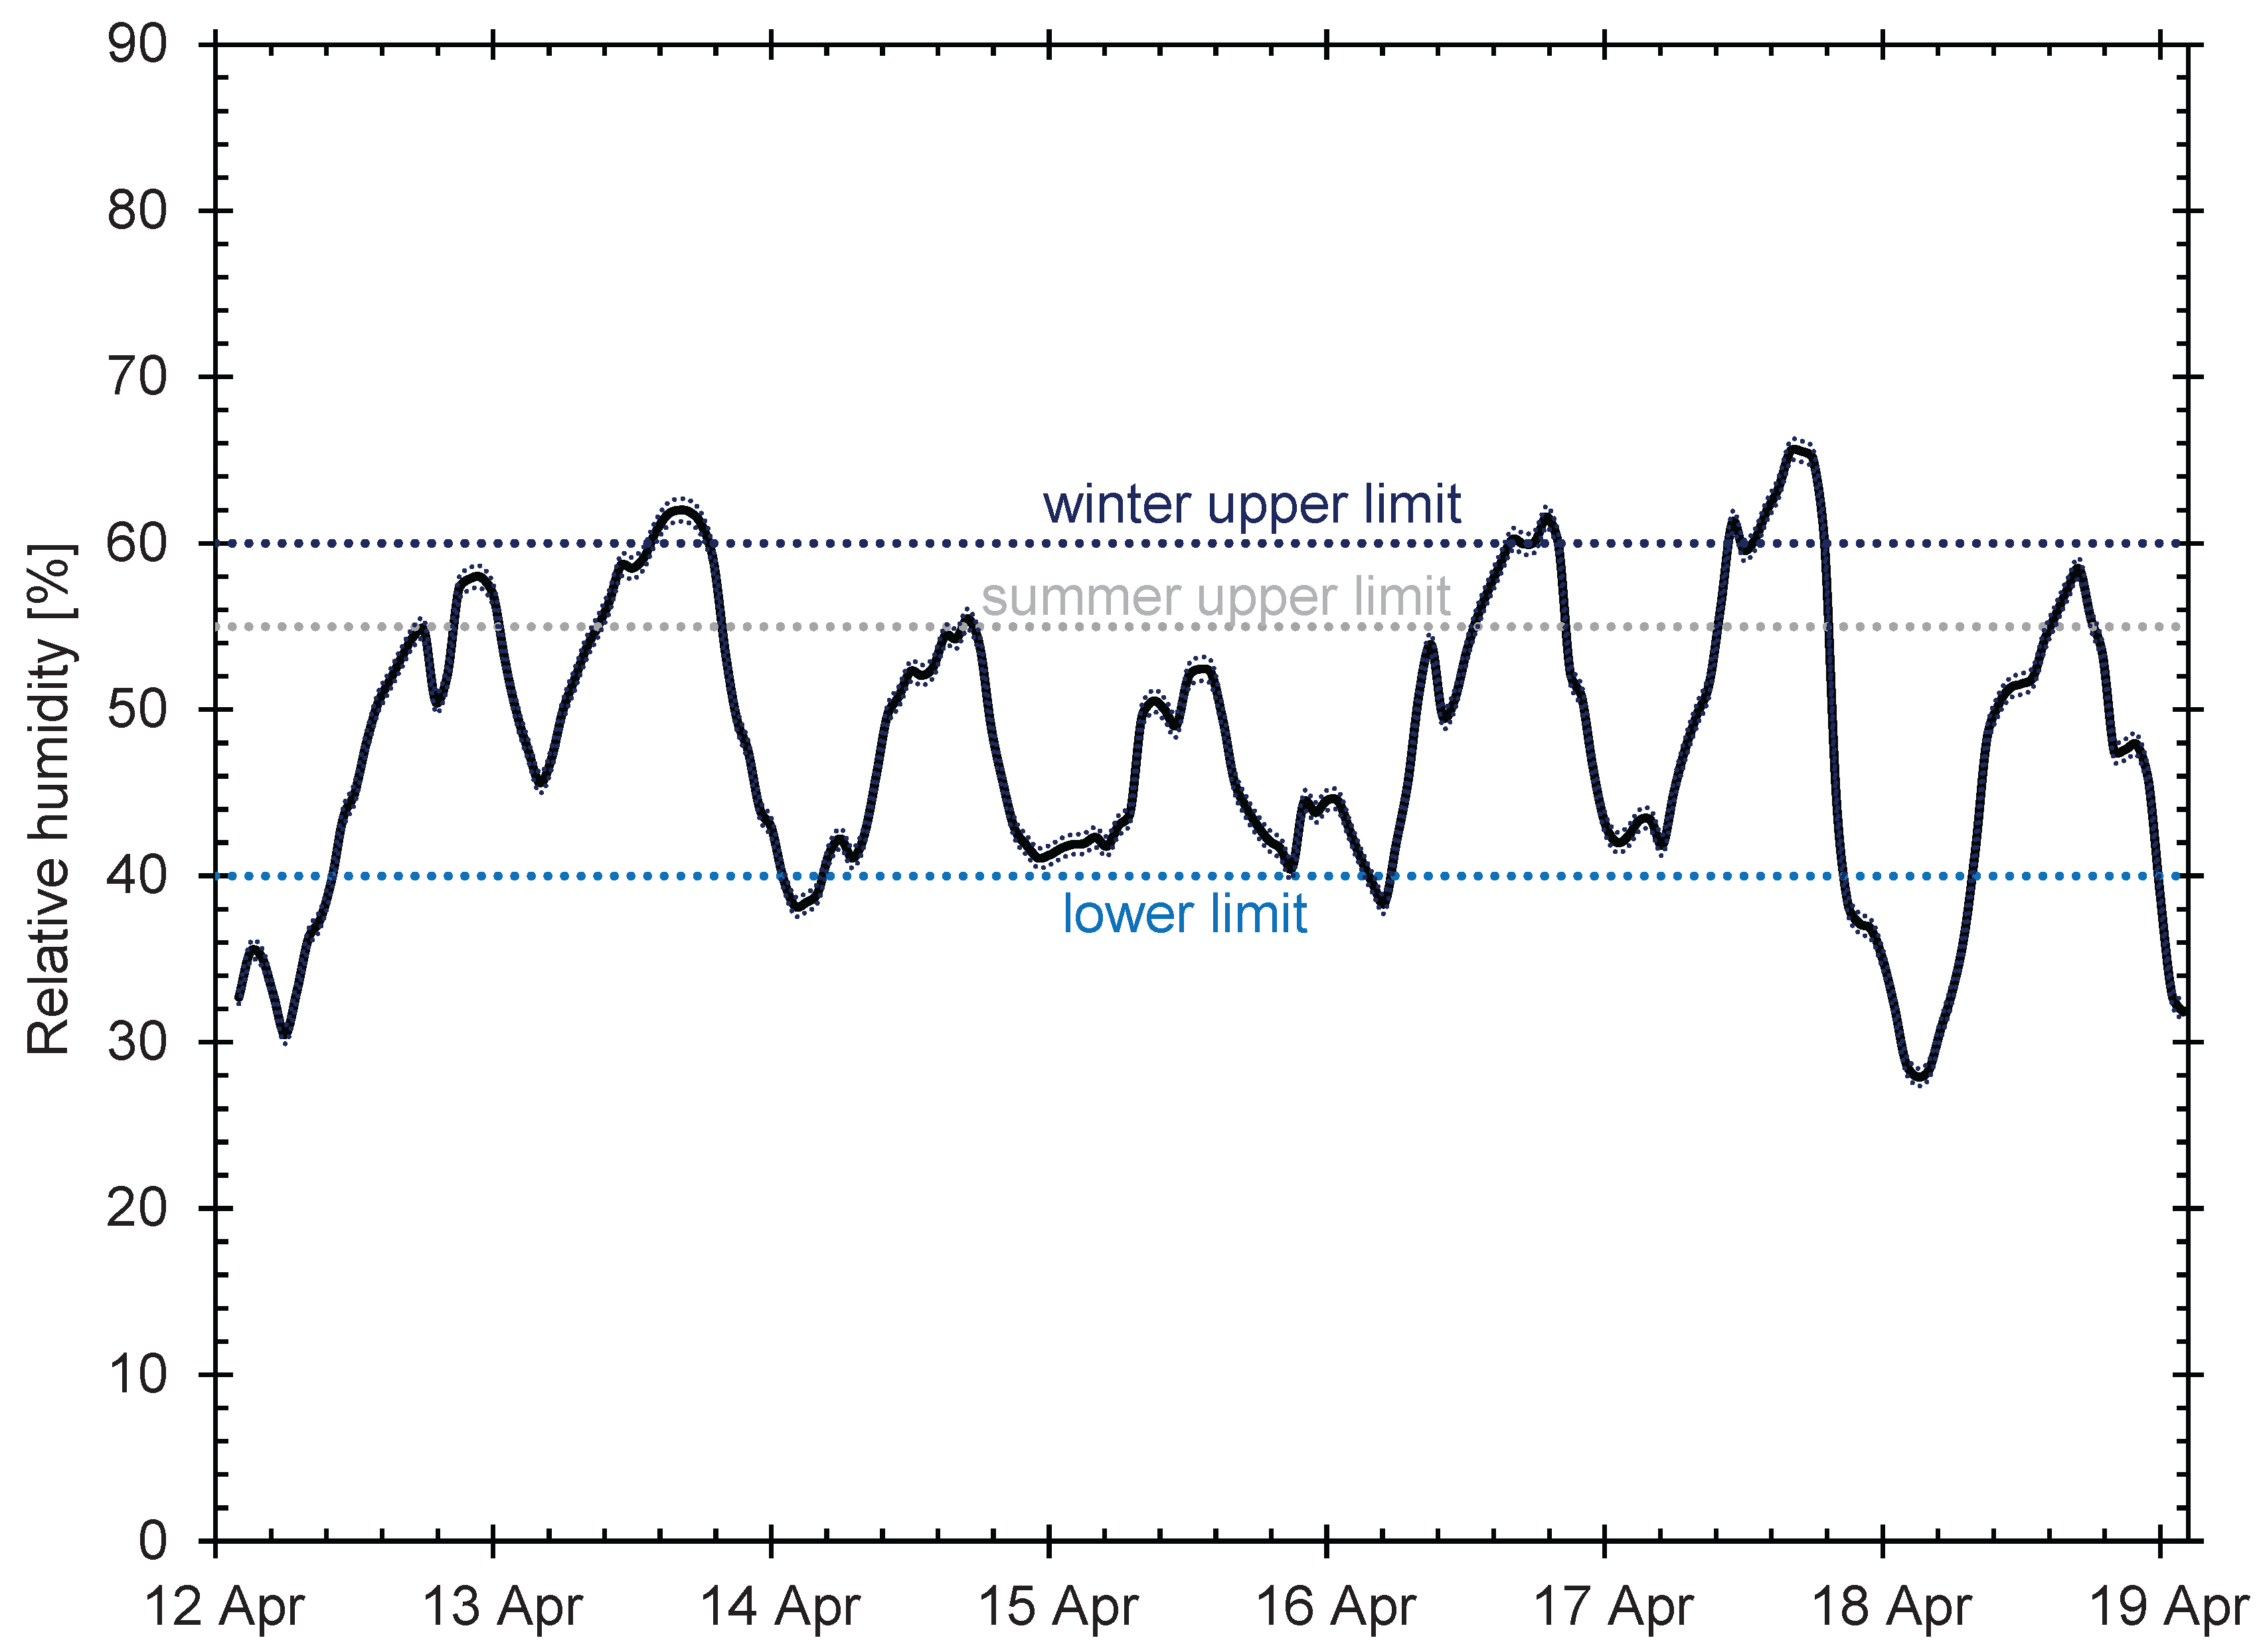
Figure 13.
The relative humidity in the summer 2023.
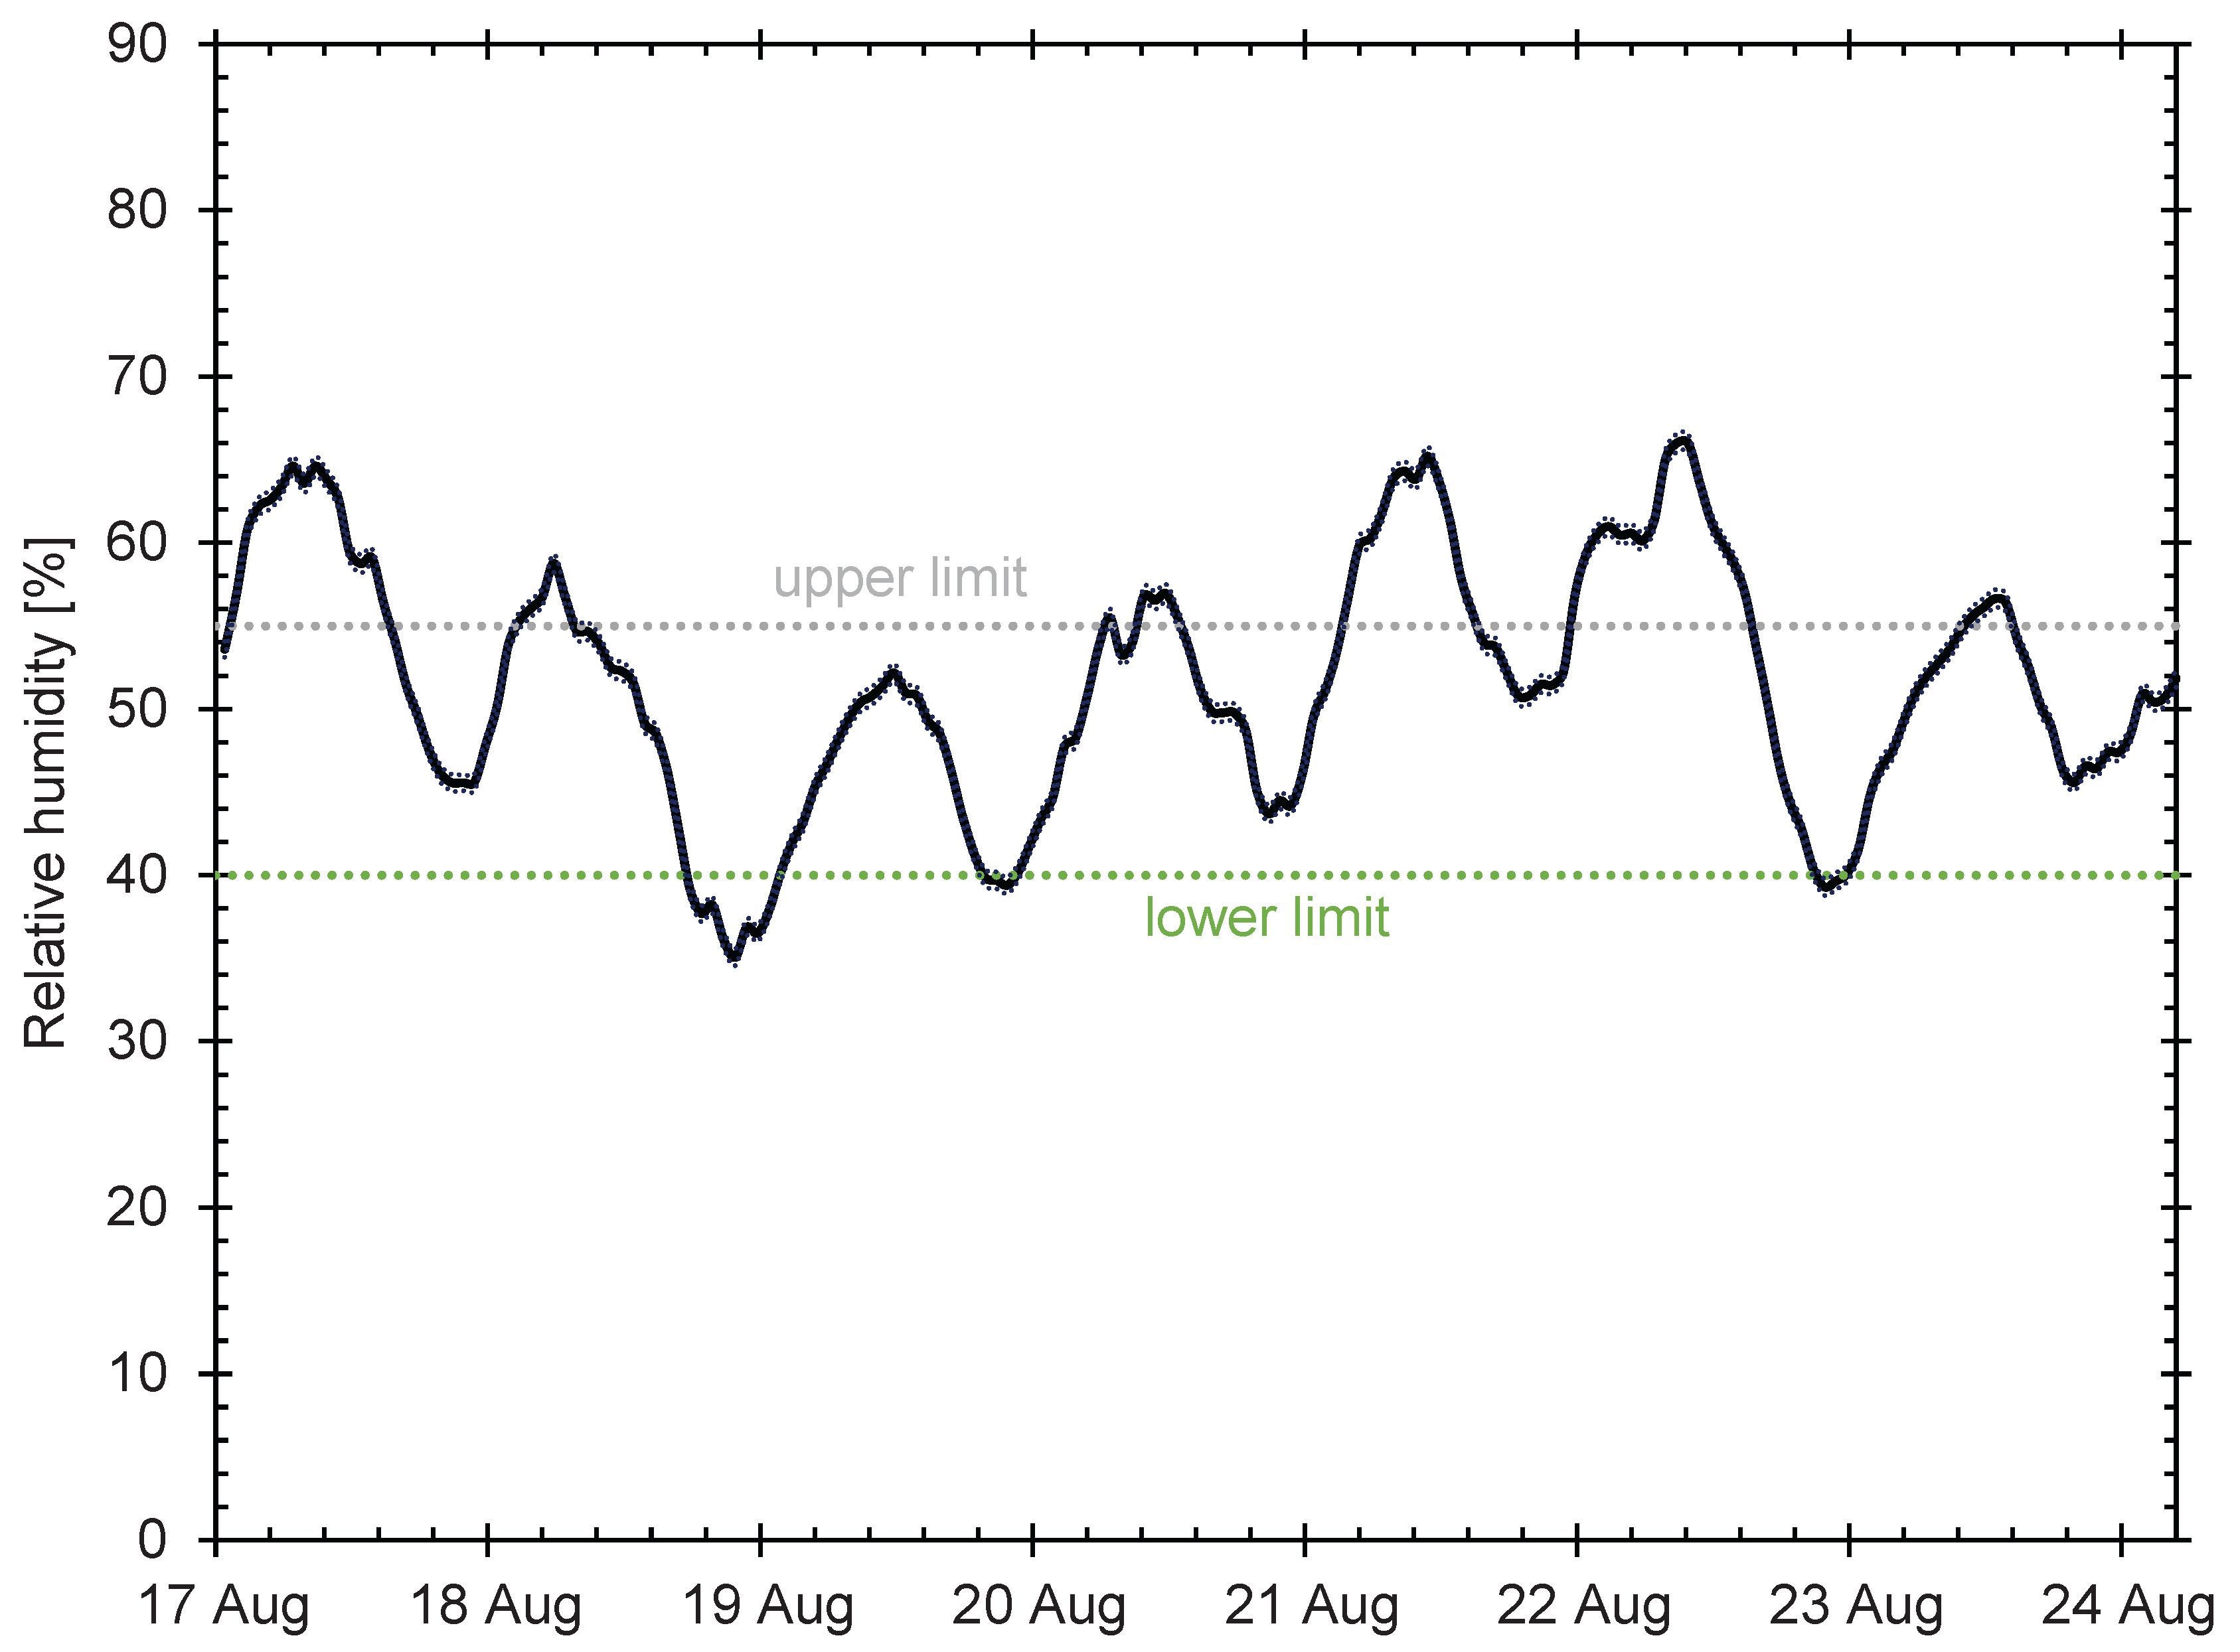

Table 1.
The outdoor levels of air quality [7].
Table 1.
The outdoor levels of air quality [7].
| Perceived air quality | Air pollutant | ||||
| Carbon dioxide | Carbon monoxide | Nitrogen dioxide | Sulfur dioxide | ||
| [decipol] | [mg/m3] | [mg/m3] | [µg/m3] | [µg/m3] | |
| At sea | 0 | 680 | 0-0.2 | 2 | 1 |
| In towns, good air quality | <0.1 | 700 | 1-2 | 5-20 | 5-20 |
| In towns, poor air quality | >0.5 | 700-800 | 4-6 | 50-80 | 50-100 |
Table 2.
Being in force indoor air parameters [23].
Table 2.
Being in force indoor air parameters [23].
| Level of activity | Temperature [°C] | Relative humidity [%] | ||
| summer | winter | summer | winter | |
| low | 23-26 | 20-22 | 40-55 | 40-60 |
| intermediate | 20-23 | 20-22 | 40-60 | 40-60 |
| high | 18-21 | 15-18 | 40-60 | 40-60 |
Disclaimer/Publisher’s Note: The statements, opinions and data contained in all publications are solely those of the individual author(s) and contributor(s) and not of MDPI and/or the editor(s). MDPI and/or the editor(s) disclaim responsibility for any injury to people or property resulting from any ideas, methods, instructions or products referred to in the content. |
© 2025 by the authors. Licensee MDPI, Basel, Switzerland. This article is an open access article distributed under the terms and conditions of the Creative Commons Attribution (CC BY) license (http://creativecommons.org/licenses/by/4.0/).
Copyright: This open access article is published under a Creative Commons CC BY 4.0 license, which permit the free download, distribution, and reuse, provided that the author and preprint are cited in any reuse.


