Submitted:
11 June 2025
Posted:
13 June 2025
You are already at the latest version
Abstract
This study presents the development and validation of a sample preparation and analytical method for the determination of toxic and essential metals in nutraceutical products using inductively coupled plasma mass spectrometry (ICP-MS). Sample digestion was optimized using a microwave-assisted procedure with 5 mL of HNO₃ and 2 mL of H₂O₂, under conditions of 180 °C for 30 minutes. The analytical method demonstrated high linearity (R² > 0.999) and excellent recovery rates ranging from 89.10% to 101.2% across all tested metals, with relative standard deviations (RSDs) within acceptable AOAC limits. The validated method was applied to analyze 17 commercial nutraceutical products and 10 turmeric powder samples collected in Vietnam. The results showed that concentrations of toxic heavy metals such as arsenic (As), cadmium (Cd), mercury (Hg), and lead (Pb) were all below the permissible limits set by Vietnamese regulations. Other trace elements including aluminum (Al), chromium (Cr), manganese (Mn), copper (Cu), and antimony (Sb) were also detected, although no regulatory limits currently exist for these in nutraceuticals. This method is suitable for routine monitoring and quality control of metal content in dietary supplements.
Keywords:
metals
; functional foods
; ICP-MS
1. Introduction
In recent years, the use of multivitamin supplements and various functional food products has become increasingly popular in Vietnam as a means to enhance daily nutrient intake [1,2]. These products are typically enriched with essential nutrients and bioactive compounds that support physiological functions and promote overall health [3,4]. Numerous studies have investigated the efficacy of functional foods [5,6], and such products are now widely recognized as important components in the prevention and management of health conditions [7,8].
However, a significant number of these dietary supplements are derived from herbal and animal sources, whose origins and quality are not always subject to stringent control [9,10], particularly regarding their heavy metal content [11,12,13,14]. Long-term consumption of such products without proper monitoring can pose potential health risks due to the accumulation [11,15].
Trace elements such as zinc (Zn), copper (Cu), and chromium (Cr) play vital roles in various metabolic processes and are essential for human health in small amounts [16,17]. In contrast, certain metals like arsenic (As), cadmium (Cd), lead (Pb), and mercury (Hg) have no known beneficial biological function and can be toxic even at low concentrations [18,19].
The increasing consumption of functional foods and dietary supplements has prompted growing interest in the development and application of analytical techniques to ensure product safety. Inductively Coupled Plasma Mass Spectrometry (ICP-MS) is one of the most powerful and widely used techniques for trace metal analysis due to its high sensitivity, low detection limits, and multi-elemental capability. It has been extensively applied in various matrices, including environmental samples (e.g., water, soil, and air), food products [20,21,22,23], pharmaceutical preparations [24,25,26,27], and biological tissues [11,28,29,30].
Several recent studies have demonstrated the effectiveness of ICP-based techniques in metal quantification. For example, Ji Zhang et al. used Inductively Coupled Plasma Optical Emission Spectrometry (ICP-OES) to determine the concentrations of eight elements (B, Co, Cr, Cu, Li, Na, Ni, and Zn) in maca root samples collected from China and Peru [17]. Similarly, H.S. Canbay and M. Doğantürk analyzed dietary supplements in Turkey for metals such as As, Cr, Zn, Pb, Cd, Co, Ni, Hg, Mn, Fe, Al, and Cu using microwave digestion with a mixed acid solution (HNO₃ + HCl) followed by ICP-OES detection. Their method showed a limit of quantification (LOQ) ranging from 2.5 to 5 μg/L, and recovery rates between 92.12% and 102.08% [16]. In another study, Liane V.V. Bokowski et al. used ICP-MS to determine the concentrations of Se, Cr, Ni, Cd, and Pb in 30 grape leaf samples, achieving recovery rates of 95.5% to 102.4% [16].
This study aims to develop, optimize, and validate a reliable analytical method for the simultaneous determination of multiple metals—including both essential and toxic elements—in nutraceutical products using inductively coupled plasma mass spectrometry (ICP-MS). By refining microwave-assisted sample digestion conditions and evaluating key validation parameters such as recovery, repeatability, and detection limits, the study provides a scientific basis for quality control and safety assessment of functional foods available on the Vietnamese market.
2. Materials and Methods
2.1. Chemicals and Standards
- Nitric acid (HNO₃) 65%, Merck (Germany).
- Hydrogen peroxide (H₂O₂) 30%, Merck (Germany).
- Double-distilled water with conductivity < 18 MΩ.
- Single-element stock standards of Cr, Cd, Hg, and Sb at 100 µg/mL, purchased from AccuStandard.
- Stock standards of As, Cu, Pb, Mn, and Al at 1000 µg/mL, purchased from Inorganic Ventures.
- Working standard solutions with a concentration of 500 ng/mL were prepared by diluting the stock solutions.
- Internal standard mixture containing 10 µg/mL of each Bi, Ge, In, Sc, Tb, Y, and Li in 5% HNO₃.
- Tuning solution containing 10 ng/mL of each Ce, Co, Li, Mg, Tl, and Y in 2% HNO₃.
2.2. Instruments
- MARS 6 microwave digestion system (CEM, USA).
- Purelab Flex-3 ultrapure water purification system (ELGA, UK).
- UN110 drying oven (Memmert, Germany).
- ICP-MS 7900 system (Agilent Technologies).
2.3. Analytical Methods
Calibration Curve Preparation
Calibration standards were prepared by diluting stock standard solutions of As, Cu, Pb, Mn, Al, Cr, Cd, Hg, and Sb with 1% HNO₃ to obtain working standards at 500 ng/mL (freshly prepared daily). The concentration range for the calibration curves of most metals was from 1 ppb to 100 ppb (ng/mL). For mercury (Hg), the calibration range was typically from 0.1 ppb to 10 ppb (ng/mL).
Sample Collection and Storage
Samples were collected between June and July 2017 from various locations selling functional foods in Hanoi. For each batch, two identical samples were collected—one for analysis and one for backup storage. Immediately after collection, samples were carefully packed and transported to prevent damage or quality degradation. All samples were stored in a cool, dry room and analyzed within three months of collection.
Analytical Procedure
Metal contents in the functional food samples were analyzed using microwave-assisted digestion followed by detection with an inductively coupled plasma mass spectrometer (ICP-MS 7900, Agilent Technologies) [11].
The analytical procedure is illustrated in Figure 1. Precisely 5 mL of sample (for liquid forms) or 0.1–0.2 g of powdered sample was weighed into a Teflon digestion vessel. Then, 5 mL of concentrated HNO₃ (65%), 2 mL of H₂O₂ (30%), and approximately 5 mL of distilled water were added. The vessel was sealed tightly and subjected to microwave digestion under the conditions described in Table 1.
After cooling to room temperature, the vessels were carefully opened. The contents were rinsed with ultrapure water and transferred to a 50 mL volumetric flask. The solutions were centrifuged at 3000 rpm for 5 minutes. The supernatant was transferred to clean sample vials and analyzed for metal content using the ICP-MS system [11].
The operating conditions of the microwave digestion system were optimized for metal analysis, using a power setting of 1600 W (100%) and a pressure of 800 psi. The optimized digestion program is detailed below:
ICP-MS Operating Conditions
Metal concentrations were determined using an ICP-MS instrument under the conditions shown in Table 2.
3. Results and Discussion
3.1. Optimization of Digestion Volume
A volume of 2 mL of working standard solution at a concentration of 500 ng/mL of mixed metals was added to the dietary supplement sample. Different volumes of acid mixture and catalyst (1), (2), and (3) were then added, followed by 5 mL of distilled water. The mixture was placed into a Teflon digestion vessel and replicated seven times. Microwave-assisted digestion was performed at 180°C for 30 minutes. After digestion, the solution was diluted to 50 mL and analyzed by ICP-MS.
The results are presented in the following table:

Table 3.
Recovery Efficiency of Metals Using Different Volumes of Digestive Acids.
| Element | 3 mL HNO₃ + 2 mL H₂O₂ (%) |
5 mL HNO₃ + 2 mL H₂O₂ (%) |
7 mL HNO₃ + 2 mL H₂O₂ (%) |
|---|---|---|---|
| Al | 85.3 | 96.8 | 101.2 |
| Cr | 82.9 | 93.4 | 104.8 |
| Mn | 87.5 | 95.2 | 99.7 |
| Cu | 90.7 | 101.2 | 105.9 |
| As | 89.4 | 98.8 | 102.5 |
| Cd | 92.1 | 99.9 | 101.2 |
| Sb | 87.2 | 97.6 | 104.3 |
| Hg | 82.4 | 89.1 | 88.8 |
| Pb | 85.4 | 97.6 | 102.6 |
| Average | 82.4–92.1 | 89.1–101.2 | 88.8–105.9 |
The results show that increasing the amount of acid generally improves the recovery efficiency of metals in the dietary supplement matrix. However, using a mixture of 5 mL HNO₃ and 2 mL H₂O₂ provided acceptable recovery values and consistency across all tested metals. Therefore, we selected this acid mixture ratio for further sample digestion processes. The recovery efficiency of metal elements using the 5 mL HNO₃ and 2 mL H₂O₂ mixture ranged from 89.1% to 101.2%.
3.2. Validation
The recovery efficiency of the method was evaluated using the standard addition approach. A volume of 2 mL of a 500 ng/mL mixed metal standard solution was added to representative dietary supplement samples, followed by 5 mL of HNO₃ and 2 mL of H₂O₂, and then 5 mL of deionized water. The samples were placed in Teflon digestion vessels and digested at 180°C for 30 minutes. This process was repeated seven times. For unspiked real samples, the same digestion procedure was applied. Blank samples were also prepared and processed concurrently throughout the analysis to ensure that the results were not influenced by interferences or contamination.
Based on the analytical results, the recovery percentage, relative standard deviation (RSD %), limit of detection (LOD), and limit of quantification (LOQ) were calculated as follows:
Table 5.
Recovery Efficiency, RSD (%), LOD, and LOQ for Metal Elements. (Standard Addition Method on Real Samples).
Table 5.
Recovery Efficiency, RSD (%), LOD, and LOQ for Metal Elements. (Standard Addition Method on Real Samples).
| Element | Recovery (%) | RSD (%) | LOD (mg/kg) | LOQ (mg/kg) |
|---|---|---|---|---|
| Al | 96.8 | 7.47 | 0.38 | 1.27 |
| Cr | 93.4 | 9.32 | 0.24 | 0.80 |
| Mn | 95.2 | 6.86 | 0.26 | 0.87 |
| Cu | 101.2 | 9.90 | 0.16 | 0.53 |
| As | 98.8 | 1.62 | 0.01 | 0.03 |
| Cd | 99.9 | 2.25 | 0.01 | 0.03 |
| Sb | 97.6 | 9.65 | 0.09 | 0.30 |
| Hg | 89.1 | 13.65 | 0.04 | 0.14 |
| Pb | 97.6 | 5.50 | 0.04 | 0.13 |
| Average | 89.1–101.2 | 1.62–13.65 | 0.01–0.38 | 0.03–1.80 |
The recovery values ranged from 89.1% to 101.2%, and the method's RSD ranged from 1.62% to 13.65%. According to AOAC guidelines [31,32], for a spiked concentration level of 20 ng/mL, the acceptable recovery range is 80–110%, with a maximum allowable RSD of 15%. Thus, all recovery and RSD values fall within the acceptable limits, indicating that this method is suitable for the analysis of metal elements. The LOD values ranged from 0.01 to 0.38 mg/kg for most metals.
3.3. Metals in Functional Foods
After conducting a preliminary study to establish the optimal sample preparation procedure, we analyzed 17 samples of functional foods and 10 samples of turmeric starch. The metal content in various types of products was determined, and the results are presented in Table 6.
The analytical results were compared with the permissible limits established by the Ministry of Health (MoH) for food supplements and functional foods. Some essential metals such as Al, Cr, Mn, Cu, and Sb do not have specific regulatory limits.
Aluminum content was highest in the cardiovascular-supporting supplements group (ranging from 8.24 to 94.90 mg/kg), followed by diabetes-supporting supplements (7.68–45.07 mg/kg), and then liver-supporting supplements (2.85–34.15 mg/kg). Turmeric starch samples had relatively low aluminum levels, except for one sample—Tinh bột nghệ vàng Tân Nam—which reached 20.37 mg/kg.
Chromium levels were generally low, with 9 samples below the detection limit. The remaining 18 samples had concentrations ranging from 0.24 to 0.93 mg/kg. Although low, chromium is essential for carbohydrate and lipid metabolism.
Manganese levels varied widely across supplement groups. Liver-supporting supplements ranged from 1.26 to 86.43 mg/kg. Among the seven cardiovascular-supporting samples analyzed, manganese concentrations ranged from 1.64 to 92.11 mg/kg. Diabetes-supporting supplements ranged from 6.98 to 28.03 mg/kg. In turmeric starch samples, manganese ranged from 0.38 to 59.78 mg/kg. Manganese is vital for bone and nervous tissue development.
Of the 27 samples analyzed, 8 had copper levels below the detection limit—all of which were turmeric starch samples. The remaining 19 samples contained copper in the range of 0.17 to 3.84 mg/kg, which are relatively low values.
For antimony (Sb), 23 of the samples had concentrations below the detection limit. The other samples ranged from 0.10 to 0.12 mg/kg.
Toxic metals including arsenic (As), cadmium (Cd), mercury (Hg), and lead (Pb) were compared against the permissible limits set by Decision 46/2007/QĐ-BYT and QCVN 8-2:2011/BYT [33,34]:
- Arsenic (As): The MoH allows up to 5 mg/kg. None of the samples exceeded this limit. As concentrations ranged from 0.01 to 0.89 mg/kg, with 11 samples below the LOD.
- Cadmium (Cd): Levels ranged from 0.01 to 0.06 mg/kg, with 11 samples below the LOD. The MoH limit is 1 mg/kg, indicating that Cd levels were relatively low in all cases.
- Mercury (Hg): The allowed limit is 0.1 mg/kg. Among the 27 samples, 22 had Hg concentrations below the detection limit. In the remaining 5 samples, Tinh bột nghệ vàng Phủ Quỳ and Tinh nghệ had relatively high levels, close to the regulatory threshold (0.08 and 0.09 mg/kg, respectively).
- Lead (Pb): Of the samples analyzed, 14 had Pb levels below the LOD, while 13 samples ranged from 0.04 to 0.59 mg/kg. The MoH limit for Pb is 3 mg/kg.
In conclusion, all dietary supplement samples had metal concentrations within the allowable limits. The potentially harmful elements were detected at levels far below the regulatory thresholds, suggesting no significant risk to human health from heavy metal contamination in these products.
4. Conclusions
In this study, we developed and validated an analytical procedure for the determination of several metals in dietary supplements using ICP-MS. The method showed recovery efficiencies ranging from 89.10% to 101.2%, with relative standard deviations (RSDs) within the acceptable limits defined by AOAC guidelines, indicating good accuracy and repeatability.
The validated procedure was applied to analyze 27 samples of dietary supplements, including turmeric starch products, collected from the market in Hanoi. The results showed that the concentrations of toxic heavy metals such as arsenic (As), cadmium (Cd), mercury (Hg), and lead (Pb) were all below the permissible limits established by Vietnamese regulations (Decision 46/2007/QĐ-BYT and QCVN 8-2:2011/BYT), indicating a relatively high level of safety with respect to heavy metal contamination.
For essential trace elements such as aluminum (Al), chromium (Cr), manganese (Mn), copper (Cu), and antimony (Sb), which currently do not have specified regulatory limits for dietary supplements in Vietnam, the concentrations varied depending on the product group. However, no abnormally high levels were observed, and the results remained within a reasonable range.
Overall, the proposed analytical method is reliable and suitable for quality control and safety monitoring of metal contents in dietary supplement products available on the market.
References
- Hanh, T.T.H.; Anh, D.H.; Huong, P.T.T.; Thanh, N.V.; Trung, N.Q.; Cuong, T.V.; Mai, N.T.; Cuong, N.T.; Cuong, N.X.; Nam, N.H.; et al. Crinane, augustamine, and β -carboline alkaloids from Crinum latifolium. Phytochemistry Letters 2018, 24, 27–30. [Google Scholar] [CrossRef]
- Quang, T.H.; Phong, N.V.; Anh, L.N.; Hanh, T.T.H.; Cuong, N.X.; Ngan, N.T.T.; Trung, N.Q.; Nam, N.H.; Minh, C.V. Secondary metabolites from a peanut-associated fungus Aspergillus niger IMBC-NMTP01 with cytotoxic, anti-inflammatory, and antimicrobial activities. Natural Product Research 2020, 36, 1215–1223. [Google Scholar] [CrossRef]
- Hanh, T.T.H.; Hang, L.T.T.; Huong Giang, V.; Trung, N.Q.; Thanh, N.V.; Quang, T.H.; Cuong, N.X. Chemical constituents of Blumea balsamifera. Phytochemistry Letters 2021, 43, 35–39. [Google Scholar] [CrossRef]
- Hanh, T.T.H.; Hang, L.T.T.; Huong, P.T.T.; Trung, N.Q.; Cuong, T.V.; Thanh, N.V.; Cuong, N.X.; Nam, N.H.; Minh, C.V. Two new guaiane sesquiterpene lactones from the aerial parts of Artemisia vulgaris. Journal of Asian Natural Products Research 2017, 20, 752–756. [Google Scholar] [CrossRef]
- Bach, M.X.; Minh, T.N.; Anh, D.T.N.; Anh, H.N.; Anh, L.V.; Trung, N.Q.; Minh, B.Q.; Xuan, T.D. Protection and Rehabilitation Effects of Cordyceps militaris Fruit Body Extract and Possible Roles of Cordycepin and Adenosine. Compounds 2022, 2, 388–403. [Google Scholar] [CrossRef]
- Minh, T.N.; Anh, L.V.; Trung, N.Q.; Minh, B.Q.; Xuan, T.D. Efficacy of Green Extracting Solvents on Antioxidant, Xanthine Oxidase, and Plant Inhibitory Potentials of Solid-Based Residues (SBRs) of Cordyceps militaris. Stresses 2022, 3, 11–21. [Google Scholar] [CrossRef]
- Minh, T.N.; Minh, B.Q.; Duc, T.H.M.; Thinh, P.V.; Anh, L.V.; Dat, N.T.; Nhan, L.V.; Trung, N.Q. Potential Use of Moringa oleifera Twigs Extracts as an Anti-Hyperuricemic and Anti-Microbial Source. Processes 2022, 10, 563. [Google Scholar] [CrossRef]
- Quang, T.H.; Phong, N.V.; Anh, D.V.; Hanh, T.T.H.; Cuong, N.X.; Ngan, N.T.T.; Trung, N.Q.; Oh, H.; Nam, N.H.; Minh, C.V. Bioactive secondary metabolites from a soybean-derived fungus Aspergillus versicolor IMBC-NMTP02. Phytochemistry Letters 2021, 45, 93–99. [Google Scholar] [CrossRef]
- Hanh, T.T.H.; Hang, L.T.T.; Huong, P.T.T.; Trung, N.Q.; Cuong, T.V.; Thanh, N.V.; Cuong, N.X.; Nam, N.H.; Minh, C.V. Two new guaiane sesquiterpene lactones from the aerial parts of Artemisia vulgaris. Journal of Asian Natural Products Research 2017, 20, 752–756. [Google Scholar] [CrossRef]
- Hanh, T.T.H.; Anh, D.H.; Quang, T.H.; Trung, N.Q.; Thao, D.T.; Cuong, N.T.; An, N.T.; Cuong, N.X.; Nam, N.H.; Kiem, P.V.; et al. Scutebarbatolides A-C, new neo-clerodane diterpenoids from Scutellaria barbata D. Don with cytotoxic activity. Phytochemistry Letters 2019, 29, 65–69. [Google Scholar] [CrossRef]
- Dang, T.T.; Vo, T.A.; Duong, M.T.; Pham, T.M.; Van Nguyen, Q.; Nguyen, T.Q.; Bui, M.Q.; Syrbu, N.N.; Van Do, M. Heavy metals in cultured oysters (Saccostrea glomerata) and clams (Meretrix lyrata) from the northern coastal area of Vietnam. Marine Pollution Bulletin 2022, 184, 114140. [Google Scholar] [CrossRef] [PubMed]
- Nguyen-Quang, T.; Bui-Quang, M.; Truong-Ngoc, M. Rapid Identification of Geographical Origin of Commercial Soybean Marketed in Vietnam by ICP-MS. Journal of Analytical Methods in Chemistry 2021, 2021, 1–9. [Google Scholar] [CrossRef] [PubMed]
- Bui, M.Q.; Quan, T.C.; Nguyen, Q.T.; Tran-Lam, T.-T.; Dao, Y.H. Geographical origin traceability of Sengcu rice using elemental markers and multivariate analysis. Food Additives & Contaminants: Part B 2022, 15, 177–190. [Google Scholar] [CrossRef]
- Nguyen, T.Q.; Tran-Lam, T.-T.; Nguyen, H.Q.; Dao, Y.H.; Le, G.T. Assessment of organic and inorganic arsenic species in Sengcu rice from terraced paddies and commercial rice from lowland paddies in Vietnam. Journal of Cereal Science 2021, 102, 103346. [Google Scholar] [CrossRef]
- Le, V.N.; Nguyen, Q.T.; Nguyen, T.D.; Nguyen, N.T.; Janda, T.; Szalai, G.; Le, T.G. The potential health risks and environmental pollution associated with the application of plant growth regulators in vegetable production in several suburban areas of Hanoi, Vietnam. Biologia Futura 2020, 71, 323–331. [Google Scholar] [CrossRef]
- Kwon, S.-Y.; Kim, Y.-I.; Kim, Y.-K.; Lee, Y.-B.; Mok, J.H. Microwave-assisted sample preparation for screening of heavy metal elements in food additives by ICP-MS. LWT 2024, 208, 116708. [Google Scholar] [CrossRef]
- Zhang, J.; Wang, H.-M.; Zhao, Y.-L.; Zuo, Z.-T.; Wang, Y.-Z.; Jin, H. Comparison of Mineral Element Content in a Functional Food Maca (Lepidium meyeniiWalp.) from Asia and South America. Journal of Analytical Methods in Chemistry 2015, 2015, 1–4. [Google Scholar] [CrossRef]
- Nardi, E.P.; Evangelista, F.S.; Tormen, L.; Saint´Pierre, T.D.; Curtius, A.J.; Souza, S.S. de, Barbosa. The use of inductively coupled plasma mass spectrometry (ICP-MS) for the determination of toxic and essential elements in different types of food samples. Food Chemistry 2009, 112, 727–732. [Google Scholar] [CrossRef]
- Bokowski, l. V. V.; Sobrinho, R.B.; Armijo, C.J.V.; Dani, C.; Henriques, J.A.P.; Funchal, C. Method validation for determination of metals in Vitis labrusca L. grapevine leaf extracts by inductively coupled plasma mass spectrometry (ICP-MS). Anais Da Academia Brasileira de Ciências 2016, 88, 2247–2255. [Google Scholar] [CrossRef]
- Vu-Duc, N.; Nguyen-Quang, T.; Le-Minh, T.; Nguyen-Thi, X.; Tran, T.M.; Vu, H.A.; Nguyen, L.-A.; Doan-Duy, T.; Van Hoi, B.; Vu, C.-T.; et al. Multiresidue Pesticides Analysis of Vegetables in Vietnam by Ultrahigh-Performance Liquid Chromatography in Combination with High-Resolution Mass Spectrometry (UPLC-Orbitrap MS). Journal of Analytical Methods in Chemistry 2019, 2019, 1–12. [Google Scholar] [CrossRef]
- Hai, Y.D.; Tran-Lam, T.-T.; Nguyen, T.Q.; Vu, N.D.; Ma, K.H.; Le, G.T. Acrylamide in daily food in the metropolitan area of Hanoi, Vietnam. Food Additives & Contaminants: Part B 2019, 12, 159–166. [Google Scholar] [CrossRef] [PubMed]
- Nguyen, T.P.L.; Nguyen, V.T.A.; Do, T.T.T.; Nguyen Quang, T.; Pham, Q.L.; Le, T.T. Fatty Acid Composition, Phospholipid Molecules, and Bioactivities of Lipids of the Mud Crab Scylla paramamosain. Journal of Chemistry 2020, 2020, 1–9. [Google Scholar] [CrossRef]
- Le, L.H.T.; Tran-Lam, T.-T.; Nguyen, H.Q.; Quan, T.C.; Nguyen, T.Q.; Nguyen, D.T.; Dao, Y.H. A study on multi-mycotoxin contamination of commercial cashew nuts in Vietnam. Journal of Food Composition and Analysis 2021, 102, 104066. [Google Scholar] [CrossRef]
- Hanh, T.T.H.; Hang, L.T.T.; Huong, P.T.T.; Trung, N.Q.; Cuong, T.V.; Thanh, N.V.; Cuong, N.X.; Nam, N.H.; Minh, C.V. Two new guaiane sesquiterpene lactones from the aerial parts of Artemisia vulgaris. Journal of Asian Natural Products Research 2017, 20, 752–756. [Google Scholar] [CrossRef]
- Hanh, T.T.H.; Cham, P.T.; Anh, D.H.; Cuong, N.T.; Trung, N.Q.; Quang, T.H.; Cuong, N.X.; Nam, N.H.; Minh, C.V. Dammarane-type triterpenoid saponins from the flower buds of Panax pseudoginseng with cytotoxic activity. Natural Product Research 2021, 36, 4343–4351. [Google Scholar] [CrossRef]
- Van, Pc. P.; Ngo Van, H.; Quang, M.B.; Duong Thanh, N.; Nguyen Van, D.; Thanh, T.D.; Tran Minh, N.; Thi Thu, H.N.; Quang, T.N.; Thao Do, T.; Thanh, L.P.; et al. Stigmastane-type steroid saponins from the leaves of Vernonia amygdalina and their α -glucosidase and xanthine oxidase inhibitory activities. Natural Product Research 2023, 38, 601–606. [Google Scholar] [CrossRef]
- Dang, N.H.; Lan, D.T.N.; Thu Minh, N.T.; Khanh, N.D.; Trang, D.T.; Cuong, P.V.; Hiep, N.T.; Nam, V.D.; Trung, N.Q.; Dat, N.T. Quassinoids and Alkaloids From the Roots of Eurycoma longifolia. Natural Product Communications 2019, 14. [Google Scholar] [CrossRef]
- Janda, T.; Lejmel, M.A.; Molnár, A.B.; Majláth, I.; Pál, M.; Nguyen, Q.T.; Nguyen, N.T.; Le, V.N.; Szalai, G. Interaction between elevated temperature and different types of Na-salicylate treatment in Brachypodium dystachion. PLOS ONE 2020, 15, e0227608. [Google Scholar] [CrossRef] [PubMed]
- Hanh, T.T.H.; Anh, L.N.; Trung, N.Q.; Quang, T.H.; Anh, D.H.; Cuong, N.X.; Nam, N.H.; Van Minh, C. Cytotoxic phenolic glycosides from the seeds of Senna tora. Phytochemistry Letters 2021, 45, 190–194. [Google Scholar] [CrossRef]
- Dang, N.H.; Lan, D.T.N.; Thu Minh, N.T.; Khanh, N.D.; Trang, D.T.; Cuong, P.V.; Hiep, N.T.; Nam, V.D.; Trung, N.Q.; Dat, N.T. Quassinoids and Alkaloids From the Roots of Eurycoma longifolia. Natural Product Communications 2019, 14. [Google Scholar] [CrossRef]
- AOAC - AOAC official method 2015.01. Heavy Metals in Food Inductively Coupled Plasma–Mass Spectrometry First Action (2015).
- AOAC International, How to meet ISO 17025 requirements for method verification, USA (2007).
- Bộ Y tế - QCVN 8-2-2011/BYT: Quy chuẩn kỹ thuật quốc gia đối với các sản phẩm đồ uống không cồn.
- Bộ Y tế - Quyết định 46/2007/QĐ-BYT “Quy định giới hạn tối đa ô nhiễm về sinh học và hóa học trong thực phẩm”.
Figure 1.
Workflow for the Analysis of Metals in Functional Foods.
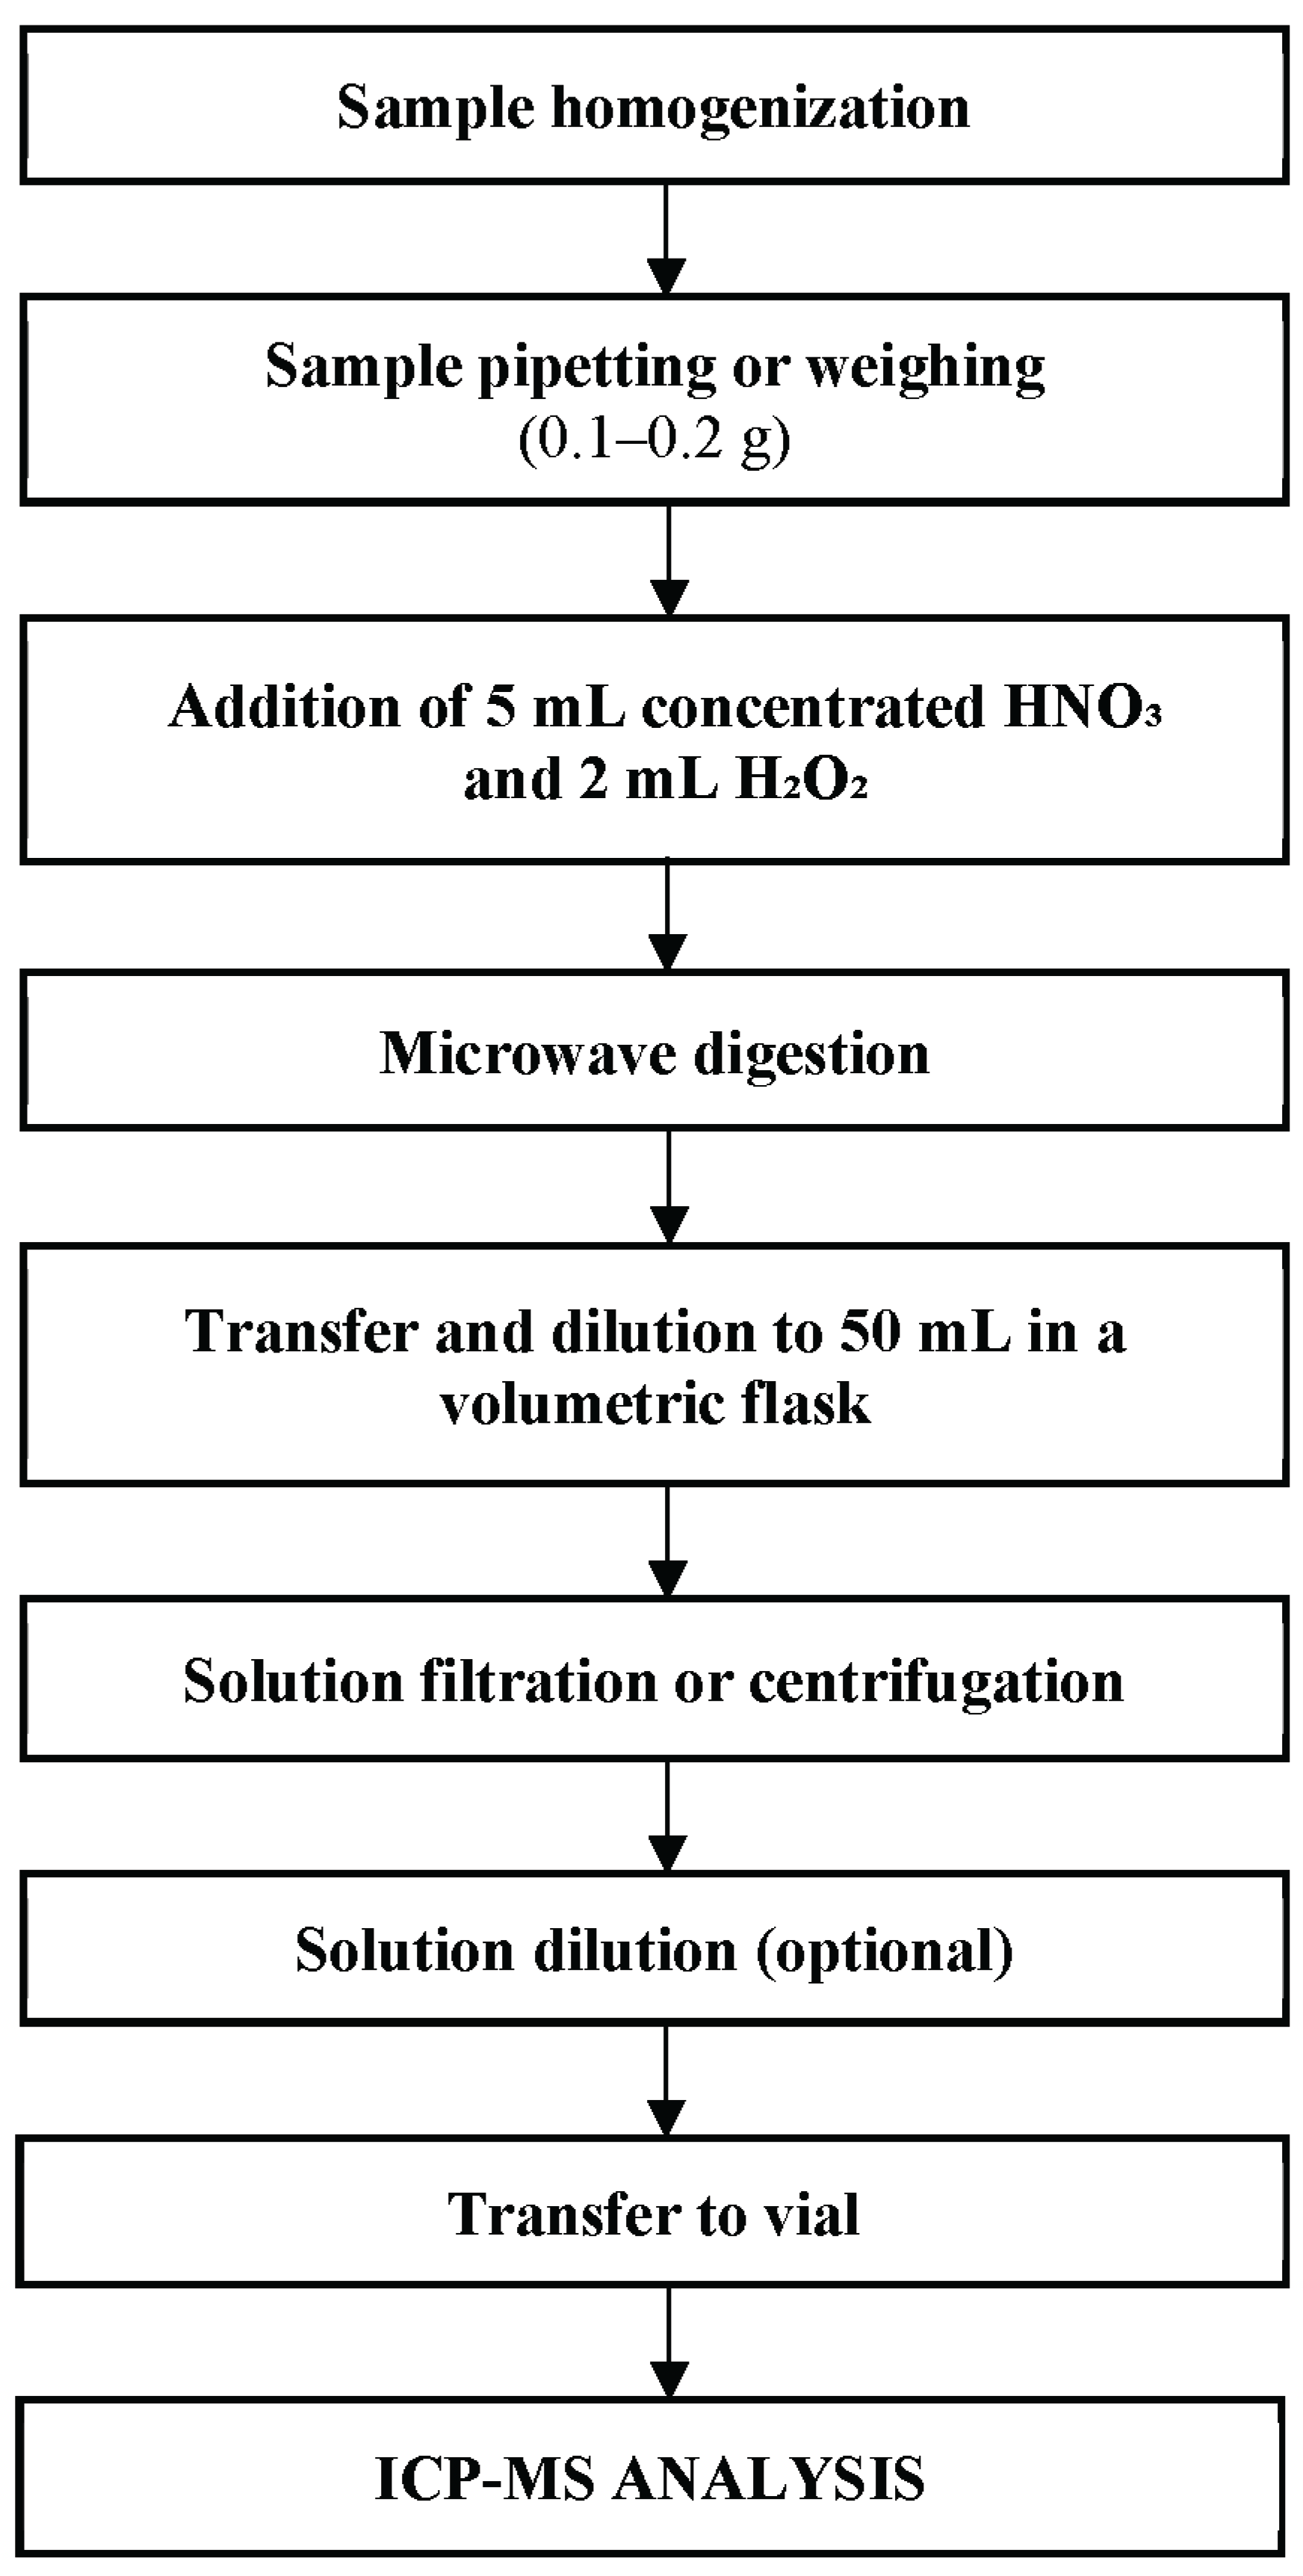
Table 1.
Microwave Digestion Conditions.
| Stage | Temperature (°C) | Ramp Time (min) | Hold Time (min) |
|---|---|---|---|
| 1 | 180 | 15 | 15 |
| 2 | 30 | – | 15 |
Table 2.
ICP-MS Operating Parameters.
| Parameter | Value |
|---|---|
| RF power, W | ~1600 |
| Sampling depth, mm | ~3 |
| Carrier gas flow rate, L/min | ~0.7 |
| Auxiliary gas flow rate, L/min | ~0.3 |
| Nebulizer | MicroMist |
| Spray chamber temperature, °C | 2 |
| Vacuum pressure during analysis, Pa | 5 × 10⁻⁴ |
| Vacuum pressure in standby mode, Pa | 3 × 10⁻⁵ |
| Peristaltic pump speed, mL/min | 0.1 |
| Wash pump speed, rpm | 48 |
| Sample pump speed, rpm | 26 |
| Cooling water temperature, °C | 20 |
| Cooling water power, W | 1750 |
| Acquisition time per replicate, s | 5.8 |
| Wash time, s | 120 |
| Stabilization time, s | 30 |
| Cooling water flow rate, L/min | 2.4 |
| Number of replicates per point | 3 |
Table 6.
Metal Content in Selected Functional Foods. Unit: mg/kg.
| Sample Type | Al | Cr | Mn | Cu | As | Cd | Sb | Hg | Pb |
|---|---|---|---|---|---|---|---|---|---|
| Lyver plus | 2.85 | 0.27 | 1.26 | 0.48 | 0.02 | 0.01 | <0.09 | <0.04 | 0.05 |
| Hewell | 34.15 | <0.24 | 8.41 | 0.89 | 0.06 | 0.01 | <0.09 | <0.04 | <0.04 |
| Newcalver | 5.72 | <0.24 | 47.83 | 0.44 | 0.13 | 0.04 | <0.09 | <0.04 | 0.05 |
| Diệp hạ châu | 12.85 | <0.24 | 86.43 | 0.66 | 0.28 | 0.03 | <0.09 | <0.04 | 0.05 |
| Vinagan | 4.84 | <0.24 | 5.21 | 0.21 | 0.11 | 0.01 | <0.09 | <0.04 | <0.04 |
| Nanogol | 44.64 | 0.93 | 8.46 | 0.93 | 0.18 | <0.01 | 0.10 | <0.04 | 0.04 |
| Ích tâm khang | 25.02 | 0.31 | 7.59 | 0.34 | 0.13 | <0.01 | <0.09 | <0.04 | 0.05 |
| Vương tâm thống | 15.44 | <0.24 | 92.11 | 0.56 | 0.15 | 0.01 | 0.11 | 0.05 | 0.07 |
| Ninh tâm vương | 17.77 | <0.24 | 6.23 | 0.86 | 0.08 | 0.01 | <0.09 | 0.06 | 0.12 |
| An Mạch | 62.50 | 0.39 | 29.56 | 2.46 | 0.24 | 0.06 | <0.09 | <0.04 | 0.26 |
| Hanomax | 94.90 | 0.42 | 78.73 | 2.21 | 0.89 | 0.02 | 0.12 | <0.04 | 0.59 |
| BoniOxy 1 | 8.25 | 0.36 | 1.64 | 1.28 | 0.01 | 0.02 | <0.09 | <0.04 | <0.04 |
| Hộ tạng đường | 19.18 | 0.25 | 6.98 | 0.99 | 0.09 | 0.01 | <0.09 | <0.04 | 0.15 |
| Diabetna | 7.68 | 0.27 | 26.52 | 3.84 | 0.29 | 0.01 | <0.09 | <0.04 | <0.04 |
| Mega pro plus | 25.82 | 0.24 | 28.03 | 2.59 | <0.01 | 0.01 | <0.09 | <0.04 | <0.04 |
| TD care | 45.07 | 0.57 | 26.20 | 3.73 | 0.33 | 0.02 | 0.11 | <0.04 | 0.12 |
| Thanh đường an | 22.92 | 0.40 | 25.95 | 2.96 | <0.01 | 0.04 | <0.09 | <0.04 | 0.05 |
| Tinh bột nghệ ngọc ý | 2.91 | <0.24 | 39.66 | <0.16 | <0.01 | <0.01 | <0.09 | <0.04 | <0.04 |
| Tinh bột nghệ Phủ Quỳ | 1.26 | 0.25 | 18.75 | <0.16 | <0.01 | <0.01 | <0.09 | 0.08 | <0.04 |
| Tinh bột nghệ Nghệ An | 5.40 | 0.29 | 35.54 | <0.16 | 0.01 | <0.01 | <0.09 | 0.05 | <0.04 |
| Tinh bột nghệ Út Em | 5.88 | 0.27 | 8.77 | <0.16 | <0.01 | <0.01 | <0.09 | <0.04 | <0.04 |
| Tinh bột nghệ Tân Nam | 20.37 | 0.20 | 65.31 | <0.16 | <0.01 | <0.01 | <0.09 | <0.04 | 0.05 |
| Nghệ vàng | 4.89 | 0.24 | 59.78 | <0.16 | <0.01 | <0.01 | <0.09 | <0.04 | <0.04 |
| Tinh nghệ | 13.56 | 0.24 | 44.03 | <0.16 | <0.01 | <0.01 | <0.09 | 0.09 | <0.04 |
| Tinh nghệ Sagamin | 8.50 | 0.33 | 2.08 | <0.16 | <0.01 | <0.01 | <0.09 | <0.04 | <0.04 |
| Curcumin | <0.38 | <0.24 | 1.53 | 0.65 | <0.01 | <0.01 | <0.09 | <0.04 | <0.04 |
| Tinh bột nghệ HV quân y | 0.39 | <0.24 | 0.38 | 0.17 | <0.01 | 0.04 | <0.09 | <0.04 | <0.04 |
Disclaimer/Publisher’s Note: The statements, opinions and data contained in all publications are solely those of the individual author(s) and contributor(s) and not of MDPI and/or the editor(s). MDPI and/or the editor(s) disclaim responsibility for any injury to people or property resulting from any ideas, methods, instructions or products referred to in the content. |
© 2025 by the authors. Licensee MDPI, Basel, Switzerland. This article is an open access article distributed under the terms and conditions of the Creative Commons Attribution (CC BY) license (http://creativecommons.org/licenses/by/4.0/).
Copyright: This open access article is published under a Creative Commons CC BY 4.0 license, which permit the free download, distribution, and reuse, provided that the author and preprint are cited in any reuse.


