Submitted:
11 June 2025
Posted:
12 June 2025
You are already at the latest version
Abstract
The recent removal of Canada’s national consumer carbon tax has eliminated a tool that could help guide meaningful reductions in national greenhouse gas (GHG) emissions. Personal lifestyle choices contribute up to 75% of national emissions and yet the GHG inventories included in the National Inventory Report (NIR) of Canada provide a limited window into these choices. Carbon footprint calculators, widely used to estimate individual emissions, vary in their input parameters, output data, and calculation methods. This study assessed five current calculators for compatibility with the NIR to determine which might best support it. A qualitative literature review identified criteria for evaluating each calculator’s ability to inform lifestyle changes and align with the NIR. The selected calculators were then scored quantitatively based on the type and depth of their output data. Results revealed significant disconnects between calculator outputs and the NIR. Most calculators used a consumption-based approach, while the NIR follows a territorial framework. Additionally, many calculators lacked critical data categories, such as the purchase of goods and services, needed to fully understand individual carbon footprints. Overall, the calculator with the strongest opportunity to work in tandem with the NIR was determined to be that offered by Carbon Footprint Ltd.
Keywords:
carbon footprint calculators
; personal greenhouse gas emissions
; Canada
; national inventory report
; low-carbon lifestyle
; climate change
1. Introduction
The introduction should briefly place the study in a broad context and highlight why it is important.
Effective action in reducing greenhouse gas (GHG) emissions is critical as the effects of climate change are becoming undeniably evident. Natural disasters caused due to unexpected rapid shifts in global weather phenomena are destabilizing essential ecosystems and impacting natural resources, one of the cornerstones of the Canadian economy [1]. Canada has been among the leading countries for global environmental stewardship as signatory to the Paris Agreement, the first international agreement to set legally binding targets for GHG emissions reductions at national levels [2]. This agreement mandates that all signatories report annually to the United Nations Framework Convention on Climate Change (UNFCCC) on their national GHG emissions in the standardized format of National Inventory Reports (NIRs). These reports must be written using the 2006 International Protocol on Climate Change (IPCC) Guidelines for National GHG Inventories and contain data on cumulative anthropogenic GHG emissions across major economic sectors within a territorial framework [3]. Canada currently employs a “top-down” inventory approach, where the estimates are calculated at the provincial/territorial level and organized into 5 sectors: (1) Energy, (2) Industrial Processes and Product Use, (3) Agriculture, (4) Land-Use, Land-Use Change and Forestry, and (5) Waste. Developing NIRs has driven change in many countries by allowing policymakers to identify both sources and sinks for GHG emissions, and to set national carbon mitigation strategies accordingly [4]. Canada has seen a decline in national emissions through formulation of climate-smart policies supported by the NIR [5].
While NIRs are pivotal to meeting national GHG emission reduction targets, GHG emissions attributed to personal lifestyle or consumption choices are minimally included in this form of national reporting. Personal GHG emissions, or personal carbon footprints, are the emissions that are associated with an individual’s actions and lifestyle over a given period of time [6]. It has been shown that personal and household emissions can contribute up to 60 – 75% of total national emissions [7,8]. Research has demonstrated that there is a strong association between an individual’s concern about climate change and their knowledge of personal GHG emissions [8,9,10]. Personal lifestyles and daily decisions can be greatly influenced by GHG accounting methods and the presentation of this data [10]. However, when national reports do not provide enough education and awareness needed for individuals to understand personal carbon inventories and reduction strategies, these reports can create frustration and apathy [11].
This has been evidenced in recent alarming drops in public climate change concerns in Canada [12]. The removal of national pricing of carbon emissions in Canada, that included a consumer-facing component as surcharge on carbon-based fuels, will likely exacerbate this issue further [13]. Previously, the act of paying a carbon price gave consumers valuable information related to their carbon footprint and acted as an incentive to choose greener, tax-free options. In the absence of this source of information, it is critical that alternative mechanisms be developed to inform consumers and allow them to support the development of low-carbon sustainable lifestyles. Other imminent policy measures such as the adoption of carbon border adjustment mechanisms [14], further underscore the need for increased reflection of personal emissions and collection of emission data beyond the standard sectoral frameworks outlined in the NIR.
Carbon footprint calculators are digital user-friendly tools readily available for people to estimate their personal or household GHG emissions. There are many organizations such as governments, non-governmental organizations (NGO’s), and businesses that offer carbon footprint calculators as a way for individuals to calculate their personal GHG inventory [15]. These calculators typically focus on household size and energy consumption, travel, food choices, goods and services purchase and other relevant personal activities [16]. In addition, to primary consumption-based outputs, several of these tools also provide important secondary data which enhances user knowledge base around available choices for reduction in personal carbon footprints. Unlike NIRs, these calculators do not have a governing body to mandate their input data, calculation methodologies, or output data [17]. However, academia is rich in studies that aim to create a better understanding and international best-practices for personal carbon calculators. Research has been done to assess calculators from the view of quality of input data [15], governmentality [11,18], consistency and transparency [19], comprehensiveness [15,17], usability [15], and overall effectiveness [8,9]. The lack of standardization of carbon footprint calculator tools is one of the key reasons that constrain their ability to support national mitigation efforts [8]. As stand-alone tools, they cannot be expected to influence change in the absence of supporting policy mechanisms [8,9]. One of the methods to tackle these challenges can be through exploration of avenues that allow for integration of personal emission data obtained through calculators to national GHG goals as reflected in NIRs, which in turn, are standardized under IPCC regulations.
Best practices of carbon footprint calculators and international and national inventory reports draw from the same principles [17]. For example, the use of 100-year Global Warming Potential (GWP) conversion factors. There are, however, also many differences in best practices between NIRs and carbon footprint calculators. The most prominent example of this is in the scope of each of these inventories, where the NIR is a territorial accounting system, and carbon calculators are a consumption-based accounting system. The IPCC indicates that NIR’s are territorial accounting systems and states that they must “include greenhouse gas emissions and removals taking place within national (including administered) territories and offshore areas over which the country has jurisdiction” [20] (p. 5). This means that the Canadian NIR will include any emissions produced within the borders and offshore areas that fall under the jurisdiction of Canada [21]. Conversely, academia has determined that best-practices for carbon footprint calculators are consumption-based inventories [17]. A consumption-based inventory includes the emissions associated with an individual’s consumption practices [21] (p. 2). This creates vastly different inventories in terms of the input data (emission sources) and resulting output data.
The goal of this study is therefore to explore the possibility of incorporating personal carbon footprint calculations with the information from the Canadian NIR to outline and inspire specific and individualized mitigation strategies and lifestyle changes for Canadians to reduce their personal GHG emissions. This goal can be broken down into three research questions: (RQ 1) What pre-existing carbon footprint calculator is the best in the field and what type of output data does it generate, (RQ 2) What types of carbon footprint calculation output data are most critical to inform lifestyle changes for Canadians to reduce GHG emissions, and (RQ 3) Which pre-existing carbon footprint calculator can best inform these lifestyle changes and is also most compatible with the Canadian NIR? Furthermore, for the purpose of this research, this paper defines two types of carbon calculator output data: (1) the numerical carbon footprint data, and (2) the secondary output information. The numerical carbon footprint data refers to any numerical output that represents an individual’s carbon footprint in the unit of carbon dioxide equivalencies (eCO2). The secondary output information refers to any additional information that is provided by the calculator to provide perspective and education to the user as a result of the calculation.
2. Methods
2.1. Research Framework
A combined qualitative and quantitative approach was used to answer the main research questions of this study. Qualitative analysis was used to create the main comparative frameworks in the study and quantitative scoring was then used to evaluate the performance of the selected carbon calculator tools within these frameworks on two critical aspects: (1) compatibility with the Canadian NIR, and (2) potential to inspire lifestyle changes for reduction of personal carbon footprints. Prior to comparison of the calculators, an essential first step was selection of calculators to be analyzed in the study. This was done using a mixed methodology combining online rank-based sorting algorithms as well as previously published academic scoring matrices to yield the most highly ranked calculators. Figure 1 summarizes the workflow of the study.
2.2. Calculator Selection
The scope of this study was limited to digitally available and openly accessible calculators. Two priorities were determined in choosing calculators to analyze: (1) popularity, and (2) best-in-practice. Popularity of the calculators was determined using Google search engine’s PageRank algorithm [22] that prioritizes the relevancy of the search results to present the most popular pages from your search input. Google search was operated in incognito mode to avoid bias based on search history. Furthermore, since the geographical scope of this research is limited to Canada, any calculators found through Google that were specific to a location and used location-dependent emission factors or activities that significantly differed from standard IPCC calculation guidelines, were eliminated from further analysis. This search was conducted on January 3, 2022, and a Google search query for “carbon footprint calculators” was used to determine the top 10 most relevant and popular calculators. Results that were tagged as promoted or sponsored were excluded. The scoring scale was 1-10, increments of 1, with topmost result getting the maximum score of 10 and last result getting the minimum score of 1.
For determining the best-in-practice calculators, two seminal papers by Birnik (2013) [17] and Mulrow et al. (2019) [15] were chosen to score the calculators obtained through online popularity search. The standardization of online available calculator outputs is often contentious, and this is tackled in the work of Birnik (2013) where 13 principles have been defined for accuracy and precision in the calculation of carbon footprint. These principles were used to objectively evaluate existing online calculators. Similarly, Mulrow et al. (2019) developed 15 criteria to evaluate input quality and user engagement to rank carbon footprint calculators. Due to the collective breadth of these studies and their current relevance in academia, this research used these pre-existing comprehensive analysis frameworks to determine the best-in-practice calculators. The scoring scale for this priority category was set to 1-3. The scores assigned to the calculators in Murlow et al. (2019) were scaled to a maximum of 3 to be comparable to Birnik (2013) and were summed for calculators that were common to both these studies.
Finally, a total score was assigned to all calculators using the sum of scores on both priority categories to select the top 5 calculators to be analyzed in this study (1).
Cumulative score for calculator selection = Google PageRank Score + Best-in-practice score
2.3. Development of Comparative Indices for Analysis of Carbon Calculators
2.3.1. Review and Synthesis of Academic Literature
This section may be divided by subheadings. It should provide a concise and precise description of the experimental results, their interpretation, as well as the experimental conclusions that can be drawn. A comprehensive literature review of both academic (Google Scholar, Web of Science) and grey (IPCC and Government of Canada) sources was done to retrieve publications, standards, reports and other relevant forms of information to develop a thorough understanding of international, national, and personal GHG accounting practices. Parallelly, as described in the previous section, literature on carbon footprint calculators was also reviewed, focusing on publications that explored calculator accuracy, their effectiveness in informing mitigation strategies, best-practices in the field, role in governmentality, and quality of input and output data. Furthermore, the calculators selected through the previously described methods were further analyzed to understand the quality of output data and compatibility with the Canadian NIR [23]. The Canadian NIR, in turn, was thoroughly analyzed to outline the existing reporting categories and identify emission sources and sinks that were more closely related to personal lifestyle choices and understand potential compatibility with calculator outputs. Based on this review, three indices were chosen to compare and score the calculators on a comparable scale of 0-3. The scaling method differed for each index and is described in the respective sections.
2.3.2. Index 1: Depth of Calculator Output Values
Prior to compatibility comparison with the Canadian NIR, each of the selected calculators was analyzed to differentiate all discrete emission outputs. Despite differences in the number and types of outputs from the calculators, it was possible to group the outputs under four major categories corresponding to typical lifestyle activities: (1) household, (2) transport, (3) travel and (4) diet. A fifth general category, other, was also defined as a broader grouping of the calculator outputs which could not fit into the other defined categories – mostly related to goods and services purchases. These categories are defined in Figure 2. The number of outputs for a given calculator in these categories was determined. Each category was then assigned a value equal to the average number of outputs across all the calculators. A scale of 0-3 was used then used to convert the number of outputs to scores. A calculator was awarded 3 points if the number of outputs was over the average for a given category, 2 points if it was equal to or within ±1.0 of the average, 1 point if it was below the average, and awarded 0 if there was no relevant output data. Finally, the calculators were assigned a total score equal to the average of scores across all the categories (Figure 3).
2.3.3. Index 2: Compatibility of Calculator Outputs with the Canadian National Inventory Report (NIR)
This index was developed to determine which calculators had the highest number of output values that are directly relatable to any single emission sector, as reported in the Canadian NIR. Briefly, these sectors are defined based on IPCC guidelines and include Energy, Agriculture, Industrial Processes and Product Use (IPPU), Waste and the Land Use, Land-Use Change and Forestry (LULUCF) sectors. The Energy sector further consists of Stationary Combustion, Transport, and Fugitive Sources [23]. To analyze this, the individual calculator emission output values outlined for Index 1 were used and each output was assessed to see if it could be directly associated to one of the emission sectors of the NIR. Following this evaluation, each calculator was again scored on a scale of 0-3 based on the average considering outputs across all calculators. A calculator was awarded 3 points if the number of relevant output data was over the average, 2 points if it was equal to or within ±1.0 of the average, 1 point if it was below the average, and awarded 0 if there was no relevant output data (Figure 4).
2.3.4. Index 3: Potential Effectiveness of Calculators to Inspire Lifestyle Changes
For scoring on this index, six evaluation categories were developed to determine the potential effectiveness of a calculator for inspiring lifestyle changes to reduce personal carbon footprints, through analysis of relevant literature sources [8,9,25]. These categories are summarized in Table 1 and relate to the type of secondary output information that is provided at the end of an analysis from a carbon footprint calculator. Five categories used a binary “yes (3) /no (0)” assessment whereas the sixth category was numerical in nature. Each category was weighted equally, and the calculators then received a score between 0 – 3 for each of these categories. For the sixth evaluation category, a scoring scheme was developed using the range of values of the initial numerical outputs of all the calculators to scale the scores between 0-3. This would make the score comparable to the other evaluation sub-categories. These six categories were then scored individually, and the average was used as the final score for each calculator (Table 1).
2.4. Comparison of Selected Calculators
Lastly, four scores were used to compare the calculators. These included the scores from the three indexes as well as the best-in-practice scores. These four scores were plotted on a radar plot generated in MS-Excel, with the normalized scale of 0-3 across all score categories. A total score for each calculator could then be determined by the area covered by the radar plot. This final score determined the calculator most compatible with the Canadian NIR that had the most potential to inspire reduction of personal GHG emissions.
3. Results
3.1. Selection of Top Five Carbon Footprint Calculators
A combined approach was used to select the calculators that are both already popular and academically sound, as described previously. The popularity search, conducted through Google on January 3, 2022, using the search string “carbon footprint calculators”, was used to determine the top 10 most relevant and popular calculators and assigned a popularity score. Next, the best-in-practice score was determined using previous ratings and scores from the works of Birnik (2013) [17] and Mulrow et al. (2019) [15] respectively. These were scaled to 0-3. In the work of Birnik (2013), a rating of “Strong” was scored at 3, “Average” at 2 and “Weak” at 1 [17] (Table 5). For Mulrow et al. (2019), the calculator with the highest relative original score was assigned a value 3 and other scores scaled accordingly [15] (Figure 1 radar plot score). Any calculators not included in either of these studies were assigned a value of 0. The average of these scores was then used for final best-in-practice score for a given calculator that was present in both the studies (Table 2).
Finally, the cumulative selection score was calculated using the sum of popularity and best-in-practice scores and top 5 calculators were chosen for further analysis in this study (Table 3). Based on the cumulative scores, the top 5 carbon footprint calculators selected for comparison in this study were Carbon Footprint Ltd., The Nature Conservancy, Conservation International, Cool Climate Calculator, and Carbon Independent. During the period of research, it was found that Nature Conservancy recently started to employ the CoolClimate Calculator and therefore Terrapass, was included in this analysis in its place. Terrapass was chosen over US EPA due to a higher best-in-practice score and even though it references EPA conversion factors in its calculations, which can differ at times from IPCC factors, it has location specific data for Canada. Global Footprint Network and Carbonzero were eliminated from cumulative analysis as they were not covered in either of the academic studies.
3.2. The Depth of Outputs Varies Markedly Across Carbon Footprint Calculators
The goal of this evaluation was to determine which carbon calculator had the most output data, or depth. Although the calculators varied drastically in the number and types of outputs, five clear categories emerged in which the outputs could be grouped, as described previously. Interestingly, there was no one calculator which had the highest quantity of outputs across all categories. Carbon Footprint Ltd. had the highest number of outputs in household, transport and other categories and Carbon Independent had the highest number of outputs in the diet category. All calculators had the same number of outputs in the travel category, referring to air travel (Table 4). Where applicable single/point emission source outputs have been identified in the table, due to better compatibility with the Canadian NIR. For details on outputs refer to Table S1 (Supplementary Information).
Subsequently, the scoring of the calculators based on the average output values in each category showed that Carbon Footprint Ltd. and Carbon Independent had the same depth score. This was due to the differing number of outputs of each calculator across the evaluation categories (Table 5).
More output data should, in theory, allow for a more comprehensive translation of personal GHG emissions [17]. A relatively higher number of emission sources and input data would indeed allow for better evaluation of compatibility with the Canadian NIR. To provide effective mitigation strategies, output values must be transparent in what they represent [26]. Therefore, an output value is most valuable to an inventory when it represents a single emission source and this way it can also be most easily related to the NIR.
3.3. Differences in Types of Inventories Limit Compatibility of Carbon Footprint Calculators with the Canadian National Inventory Report (NIR)
The output values of the selected carbon calculators were analysed for compatibility with the Canadian NIR [23]. Only those outputs that represented a single source of emission and could be directly related to the IPCC emission sectors in the NIR were considered. The most relatable outputs therefore fell in the household energy, transport, travel and agriculture categories (Table S1, supplementary information). Outputs encompassing purchase of other goods and services could not be related to the NIR. It should be noted that that calculators follow a consumption-style inventory of emissions and the NIR uses geographic emissions inventory. Despite this difference, for the purpose of this study, the common outputs have been identified to identify areas of alignment through future work. This is discussed further later in the paper (section 4.2).
This analysis showed that Carbon Footprint Ltd. had the highest number of relatable output values to the NIR. This calculator presented individual output values for all the different types of energy used to heat a house, including electricity, natural gas, heating oil, coal, LPG, propane, and wooden pellets [27]. Wooden pellets were not linked with NIR as in the NIR they are included under “Waste” rather than “Energy”sector [23]. This was followed by both Carbon Independent and CoolClimate which scored similarly. Conservation International was found to have only 2 outputs that could be related to the NIR. The calculators were then assigned a scaled score between 0-3 based on the average number of relatable outputs across all the calculators. (Table 6).
3.4. Carbon Footprint Calculators Most Compatible with the Canadian National Inventory Report (NIR) Are Also Most Effective at Inspiring Low-Carbon Lifestyle Changes
The effectiveness of the calculators to inspire low-carbon lifestyle changes was evaluated by analysing the quality of the of secondary output information that is provided to users using these tools. The secondary output information relates to the ability of the calculator to educate and create awareness in users about available choices to reduce carbon footprint in their day-to-day activities. All calculators were found to offer carbon footprint comparisons between typical consumer choices. However, most calculators did not offer options to recalculate emissions after users choose any mitigation strategies, except for CoolClimate (Table 7).
Overall, Carbon Footprint Ltd. and CoolClimate scored similarly and had the highest potential effectiveness for inspiring lifestyle changes. Carbon Footprint Ltd. was also previously demonstrated to be the compatible with the Canadian NIR. However, generally, the ability of all calculators to provide detailed and quality secondary information was found lacking, evidenced by the fact that no calculator attained the highest overall score of 3 (Table 8).
3.5. Carbon Footprint Ltd. Determined as Carbon Footprint Calculator of Choice in a Canadian Context
Each calculator was assigned a final score between 0-3 on all the three evaluation indices. The final comparison also utilised the best-in-practice scores from the calculator selection process. All scores (Table 9) formed the axes of a radar plot (Figure 5). This visualization outlined the respective strengths and weaknesses of the calculators and further outlines the diversity in their outputs. Carbon Footprint Ltd., CoolClimate and Carbon Independent all scored competitively whereas Conservation International and Terrapass score consistently low for all assessments.
Based on the overall area in the radar plot, Carbon Footprint Ltd. emerged as the strongest calculator that can be currently used in tandem with the Canadian NIR. It consistently scored high across all categories. The CoolClimate calculator closely follows in the rankings. However, its low compatibility score makes it less desirable to be used with the NIR. Similarly, Conservation International has competitive scores in all categories except for the potential effectiveness. This means it could be relatively ineffective in inspiring lifestyle practices to reduce personal GHG footprint.
4. Discussion
4.1. Popular Carbon Footprint Calculator Choices Might Not Be the Most Academically Proficient
Carbon footprint calculators are undoubtedly a highly accessible tool to understand personal GHG emissions and carbon intensity of daily life choices [28]. This is especially critical when personal GHG emissions can contribute up to 75% of national emissions, as discussed previously. However, the standardization of these tools to govern the quality of input - output data and calculation methodologies remain elusive even after more than a decade [16,17,29]. Therefore, this study relied on utilizing previous academic literature that have already created exhaustive assessment frameworks for determining the technical operational quality of various calculators [15,17]. Building on this, the popularity of calculators was also demonstrated parallelly in this study, given that the key objective herein is to identify calculators already extensively used by the public. This comparison put Carbon Footprint Ltd. as a clear winner in both aspects. However, it is also important to note that other calculators which might not be as popular, could still be academically very sound, such as the CoolClimate calculator. Conversely, there can also be popular tools, such as Conservation International or US EPA, which score poorly in academic proficiency. The results from these tools must therefore be carefully evaluated by the users. These findings further demonstrate the urgent need for an internationally harmonized standardization frameworks for carbon footprint calculators, to ensure the soundness of their recommendations. This might potentially further help with user uptake, especially in Canada, which remains one of the worst per capita carbon emitters in the world [30] even as ambitious net-zero national targets have been set in legislation since 2019 [31].
4.2. Suggested Improvements to Overcome Challenges in Linking Carbon Footprint Calculator Outputs to the Canadian National Inventory Report (NIR)
The study found that it was generally challenging to associate carbon footprint calculator output values with the NIR. The main driver of this disconnect is the difference in inventory methodology and operational boundaries. Calculators use consumption-based inventories and the NIR uses territorial inventories that are production-based, resulting in vastly different emission data [21]. Furthermore, as noted previously, the lack of standardization in the calculators further creates inconsistencies in the methods used to calculate their inventories, makes even comparisons between different calculator challenging [9,19].
NIRs, on the other hand, are standardized due to governance under the IPCC [19,20], allowing for comparable, and reliable data comparisons from all member countries. However, the standardized frameworks constraint NIR outputs to very specific emission sectors defined under IPCC that focus on computing territorial cumulative emissions [20]. These are undoubtedly crucial for accurate nation-to-nation comparisons. However, the lack of inclusion of personal emission data therein, except for few residential and settlement categories under the major reporting sectors, reduces its potential for public education on how personal lifestyle changes can directly reduce national emissions. This study showed that there is potential for alignment between the outputs of both types of inventories across major emission sectors (section 3.3). However, in the current form, Canadian citizens looking to make significant changes to lifestyle choices to reduce personal impacts will need to appreciate the difference between the two inventories. For example, the fruit and vegetables consumed by Canadians, used to calculate diet-based emissions in calculators, are not entirely represented in the agricultural sector of the Canadian NIR. This is because the Canadian NIR only includes emissions associated with the production of fruits and vegetables that occur within Canadian boundaries. Many of those fruits and vegetables are shipped internationally and not consumed in Canada. For example, ~14% of Canadian potatoes grown in Prince Edward Island are exported [32] (Table 1.1.3). Conversely, up to 75% of fruits and 50% of vegetables (excluding potatoes) consumed by Canadians are shipped from other locations such as the United States and Mexico [33,34]. The emissions from imported fruits and vegetables are included in carbon calculators but only the “made in Canada” agricultural goods can be linked to the NIR.
This example, among others, helps to illuminate GHG emissions accounting discrepancies between the two inventories, creating a wide gap in facilitating public awareness. It also highlights the importance of including good and services data categories, available in carbon footprint calculators but missing from national inventories, in national emission calculations. Currently only emissions from the household energy, transportation/travel categories and some agricultural categories are common with the NIR. While these indeed form the majority source of emissions, the other categories also contribute significantly to personal emissions, as previously noted in academic literature [7]. Therefore, to add value to the carbon calculator academic literature, this study included all discrete output value categories from carbon calculators and not only the ones that were most relatable to the NIR. This should allow future studies to build on this study as carbon calculators and NIRs adapt and change over time. A potential future area of research could be the development of conversion factors to navigate the different forms of emission inventories, allowing citizens to place personal emissions in context of national emissions.
4.3. Quantity and Quality of Personal Emission Data Is Key for Improving Public Knowledge
Within the scope of this study Carbon Footprint Ltd. was identified as the carbon footprint calculator with the strongest opportunity to work in tandem with the Canadian NIR. This was closely followed by CoolClimate calculator. Both these calculators were found to have details on primary and secondary personal emission sources and can be considered as models for other calculators. The study outlined the diversity of outputs that could be obtained from the different calculators and their respective strengths and weaknesses evaluated across four comparative indices. All calculators were found particularly weak in quality and quantity of secondary information categories pertaining to education on emissions and recalculation to show improved results after application of mitigation strategies. The number of emission mitigation strategies that were offered was also limited. These data are critical to be utilized to inspire lifestyle changes. The findings in this study agree with existing literature that have outlined quick declines in user engagement [35] or lack of meaningful takeaways [15] that carbon calculators can offer to their users. Therefore, future standardization efforts can consider utilizing the criteria developed in this study to develop key performance indicators related to effective public engagement and education for carbon footprint calculators. This will also be important for dispelling myths around individual impact on national GHG emissions and create consumer market demands for development of low-carbon alternatives.
Updates to calculators are also common, including for the calculators in this study, perhaps to retain user engagement and to be more reflective of new and emerging sources of personal emissions. While these updates do not change the major findings reported herein, they can be good directional options for updates to standardized international reporting frameworks such as IPCC and NIR. For example, the latest version of Carbon Footprint calculator, found to be the best in this study, now has extensive input options for fuel types for users including bio-based fuels as well as diverse electric vehicle options [36]. The Canadian NIR includes data on rapid expansion of electric vehicles as part of the vehicle fleet in the country, but does not include the related emissions [23].
Lastly, insights from this study can also help Canadian policy recommendations. To the authors’ best knowledge, there has been no systematic study done to date to track use of carbon calculators among Canadians. Emerging Canadian-context specific tools such as the Tree Canada’s Carbon Tracker App [37] reference NIR emission factors but seem to have limited calculation categories offerings [38]. The Government of Canada has very recently developed a Professional Services Carbon Footprint calculator as part of Low-carbon Procurement initiative. This calculator, while offering contract-level analysis depth as opposed to only company-wide, still uses a production and territorial framework and most consumption categories are not included in the analysis [39] (Table 1). While such calculations will most certainly be better aligned with the NIR, they will continue to miss personal consumption data that are also key drivers of overall GHG emissions. Alignment and inclusion of personal consumption data are critical to stay on track for meeting Canadian climate action targets and development of a sustainable low-carbon economy.
5. Conclusion
This study assessed five carbon footprint calculators based on their output data’s overall ability to relate national Canadian emissions from the NIR to personal emissions to educate individuals and inspire lifestyle changes. Providing Canadians access with this information is of particular importance given the removal of the federal consumer carbon price. Depth of Output Values, Output Category Compatibility, and Quality of Secondary Output Information were used to assess the output data of the five calculators. Additionally, an Overall Best-in-Practice Score allowed the analysis to include previous academic research that focused on input values and methodologies. Using these four evaluation categories, the calculator with the strongest opportunity to work in tandem with the NIR is the Carbon Footprint Ltd. CoolClimate and Carbon Independent had competitive scores in various categories, and the diverse structure of all calculators offered lessons in improvement of existing calculators and development of a standardized framework to allow for better comparability across calculators, compatibility with national inventories and collectively inspire low-carbon lifestyle changes with engaged users.
Supplementary Materials
The following supporting information can be downloaded at the website of this paper posted on Preprints.org, Table S1
Author Contributions
Conceptualization, E.A. and W.M.; Methodology, E.A. and W.M.; Validation, E.A., A.A.S and W.M.; Formal Analysis, Investigation and Writing – Original Draft, Review and Editing, E.A. and A.A.S; Project Administration, A.A.S and W.M.; Writing – Review and Editing, Resources, Supervision and Funding Acquisition, W.M. E.A and A.A.S equally contributed to the manuscript. Readers can refer to CRediT taxonomy for explanation of terms.
Funding
This research received no external funding.
Data Availability Statement
The original contributions presented in this study are included in the article/supplementary material. Further inquiries can be directed to the corresponding author.
Acknowledgments
During the preparation of this manuscript/study, the author(s) used Apple Image Playground for the purpose of generating part of an illustrative graphic (Figure 2). The authors have reviewed and edited the output and take full responsibility for the content of this publication.
Conflicts of Interest
The authors declare no conflict of interest.
Abbreviations
The following abbreviations are used in this manuscript:
| GHG | Greenhouse Gas |
| NIR | National Inventory Report |
| UNFCCC | United Nations Framework Convention on Climate Change |
| IPCC | International Protocol on Climate Change |
| NGO | Non-governmental organization |
| GWP | Global Warming Potential |
References
- Natural Resources Canada. Government of Canada Report Shows Climate Change Impacts — and Adaptation Actions — Are Evident in Sectors and Ecosystems in Canada. 2023.
- UNFCC. The Paris Agreement. Available online: https://unfccc.int/process-and-meetings/the-paris-agreement (accessed on 30/01/2021).
- UNFCC. National Inventory Reports. Available online: https://unfccc.int/process-and-meetings/transparency-and-reporting/reporting-and-review/reporting-and-review-under-the-paris-agreement/national-inventory-reports (accessed on 30/01/2021).
- European Evaluation Helpdesk for Rural Development. What is the National Inventory Report (NIR) and why is it essential for the assessment of GHG emissions? 2020.
- Smith, C. National Inventory Report suggests Canada’s climate policies are starting to work. Available online: https://www.pembina.org/blog/national-inventory-report-suggests-canadas-climate-policies-are-starting-work (accessed on 01/02/2025).
- Lin, S.-m. Reducing students’ carbon footprints using personal carbon footprint management system based on environmental behavioural theory and persuasive technology. Environmental Education Research 2016, 22. [Google Scholar] [CrossRef]
- Druckman, A.; Jackson, T. Understanding Households as Drivers of Carbon Emissions. In Taking Stock of Industrial Ecology, Clift, R., Druckman, A., Eds.; Springer: 2016.
- Chuvieco, E.; Burgui-Burgui, M.; Orellano, A.; Otón, G.; Ruíz-Benito, P. Links between Climate Change Knowledge, Perception and Action: Impacts on Personal Carbon Footprint. Sustainability 2021, 13, 8088. [Google Scholar] [CrossRef]
- Burgui-Burgui, M.; Chuvieco, E. Beyond Carbon Footprint Calculators. New Approaches for Linking Consumer Behaviour and Climate Action. Sustainability 2020, 12, 6529. [Google Scholar] [CrossRef]
- Kyllönen, S. Climate Change, No-Harm Principle, and Moral Responsibility of Individual Emitters. Journal of Applied Philosophy 2018, 35. [Google Scholar] [CrossRef]
- Lövbrand, E.; Stripple, J. Making climate change governable: accounting for carbon as sinks, credits and personal budgets. Critical Policy Studies 2011, 5. [Google Scholar] [CrossRef]
- Sheppard, E.; Public concern about Climate Change drops 14-points since last year. Why? Available online: https://abacusdata.ca/from-climate-action-to-immediate-relief/ (accessed on 01/02/2025).
- Lambert, T. Here's what you need to know about the end of the consumer carbon tax. Available online: https://www.cbc.ca/news/canada/edmonton/here-s-what-you-need-to-know-about-the-end-of-the-consumer-carbon-tax-1.7499058 (accessed on 14/05/2025).
- Robertson, L.; Teng, H. What a Carney Government Means for Climate. Available online: https://delphi.ca/2025/05/what-a-carney-government-means-for-climate/ (accessed on 14/05/2025).
- Mulrow, J.; Machaj, K.; Deanes, J.; Derrible, S. The state of carbon footprint calculators: An evaluation of calculator design and user interaction features. Sustainable Production and Consumption 2019, 18, 33–40. [Google Scholar] [CrossRef]
- Salo, M.; Mattinen-Yuryev, M.K.; Nissinen, A. Opportunities and limitations of carbon footprint calculators to steer sustainable household consumption – Analysis of Nordic calculator features. Journal of Cleaner Production 2019, 207. [Google Scholar] [CrossRef]
- Birnik, A. An evidence-based assessment of online carbon calculators. International Journal of Greenhouse Gas Control 2013, 17, 280–293. [Google Scholar] [CrossRef]
- Paterson, M.; Stripple, J.; Matthew Paterson, J.S. My Space: Governing Individuals' Carbon Emissions. Environment and Planning D: Society and Space 2010, 28. [Google Scholar] [CrossRef]
- Padgett, J.P.; Steinemann, A.C.; Clarke, J.H.; Vandenbergh, M.P. A comparison of carbon calculators. Environmental Impact Assessment Review 2008, 28. [Google Scholar] [CrossRef]
- IPCC. 2006 IPCC Guidelines for National Greenhouse Gas Inventories; Japan, 2006.
- Dahal, K.; Niemelä, J. Cities’ Greenhouse Gas Accounting Methods: A Study of Helsinki, Stockholm, and Copenhagen. Climate 2017, 5. [Google Scholar] [CrossRef]
- Wills, S.R. Google’s pagerank: The math behind the search engine. The Mathematical Intelligencer 2006, 28, 6–11. [Google Scholar] [CrossRef]
- Environment and Climate Change Canada. National Inventory Report, 1990–2022: Greenhouse Gas Sources and Sinks in Canada. 2024.
- Apple; Support. Create original images with Image Playground on Mac. Available online: https://support.apple.com/en-ca/guide/mac-help/mchld5412d00/mac (accessed on 05/14/2025).
- Salo, M.; Mattinen, M.K. Carbon footprint calculators for citizens. TemaNord 2017. [Google Scholar] [CrossRef]
- Wee Kean Fong, M.S. , Micheal Doust, Seth Schultz, Ana Marques, Chang Deng-Beck. Global Protocol for Community-Scale Greenhouse Gas Inventories, 2: Resources Institute, 2014. [Google Scholar]
- Carbon Calculator: Carbon footprint calculator for individuals and households.
- Kok, A.L.; Barendregt, W. Understanding the adoption, use, and effects of ecological footprint calculators among Dutch citizens. Journal of Cleaner Production 2021, 326. [Google Scholar] [CrossRef]
- Spandonidis, C.; Belioka, M.-P.; Eriksson, O. Multi-criteria-based evaluation of digital carbon footprint tools from a household user perspective. Journal of Cleaner Production 2024, 481. [Google Scholar] [CrossRef]
- Lewis Akenji, M.B. , Viivi Toivio, Michael Lettenmeier, Tina Fawcett, Yael Parag, Yamina Saheb, Anna Coote, Joachim H. Spangenberg, Stuart Capstick, Tim Gore, Luca Coscieme, Mathis Wackernagel, Dario Kenner. 1.5-Degree Lifestyles: Towards A Fair Consumption Space for All. 2: Cool Institute, Berlin, 2021. [Google Scholar]
- Environment and Natural Resources Canada. Net-zero emissions by 2050. 2024.
- Agriculture and Agri-Food Canada. Potato Market Information Review 2023-2024, 2: Canada, 2023.
- Kaushank Bajaj, N.R. , Edgar Ondati. Tracing Canada’s Food. 2025.
- Wickramasinghe, S. Where do Canada’s fruits and vegetables come from? New website maps the flow into provinces. 2025. [Google Scholar]
- Enlund, J.; Andersson, D.; Carlsson, F.; Enlund, J.; Andersson, D.; Carlsson, F. Individual Carbon Footprint Reduction: Evidence from Pro-environmental Users of a Carbon Calculator. Environmental and Resource Economics 2023 86:3 2023, 86. [Google Scholar] [CrossRef]
- Carbon Footprint Ltd. Sustrax Vita. 2025.
- Media, G.; Labbé, S. Canadians urged to reduce carbon footprint with new tracker. 2024.
- Tree Canada. Carbon Calculator Methodology. Available online: https://treecanada.ca/tree-canada-carbon-calculator-methodology/ (accessed on 01/02/2025).
- Public Services and Procurement Canada. The Carbon Footprint Calculator for Professional Services: User Guide. 2024.
Figure 1.
Overall workflow of research study (icons/logos/images used herein have free reuse permissions).
Figure 1.
Overall workflow of research study (icons/logos/images used herein have free reuse permissions).
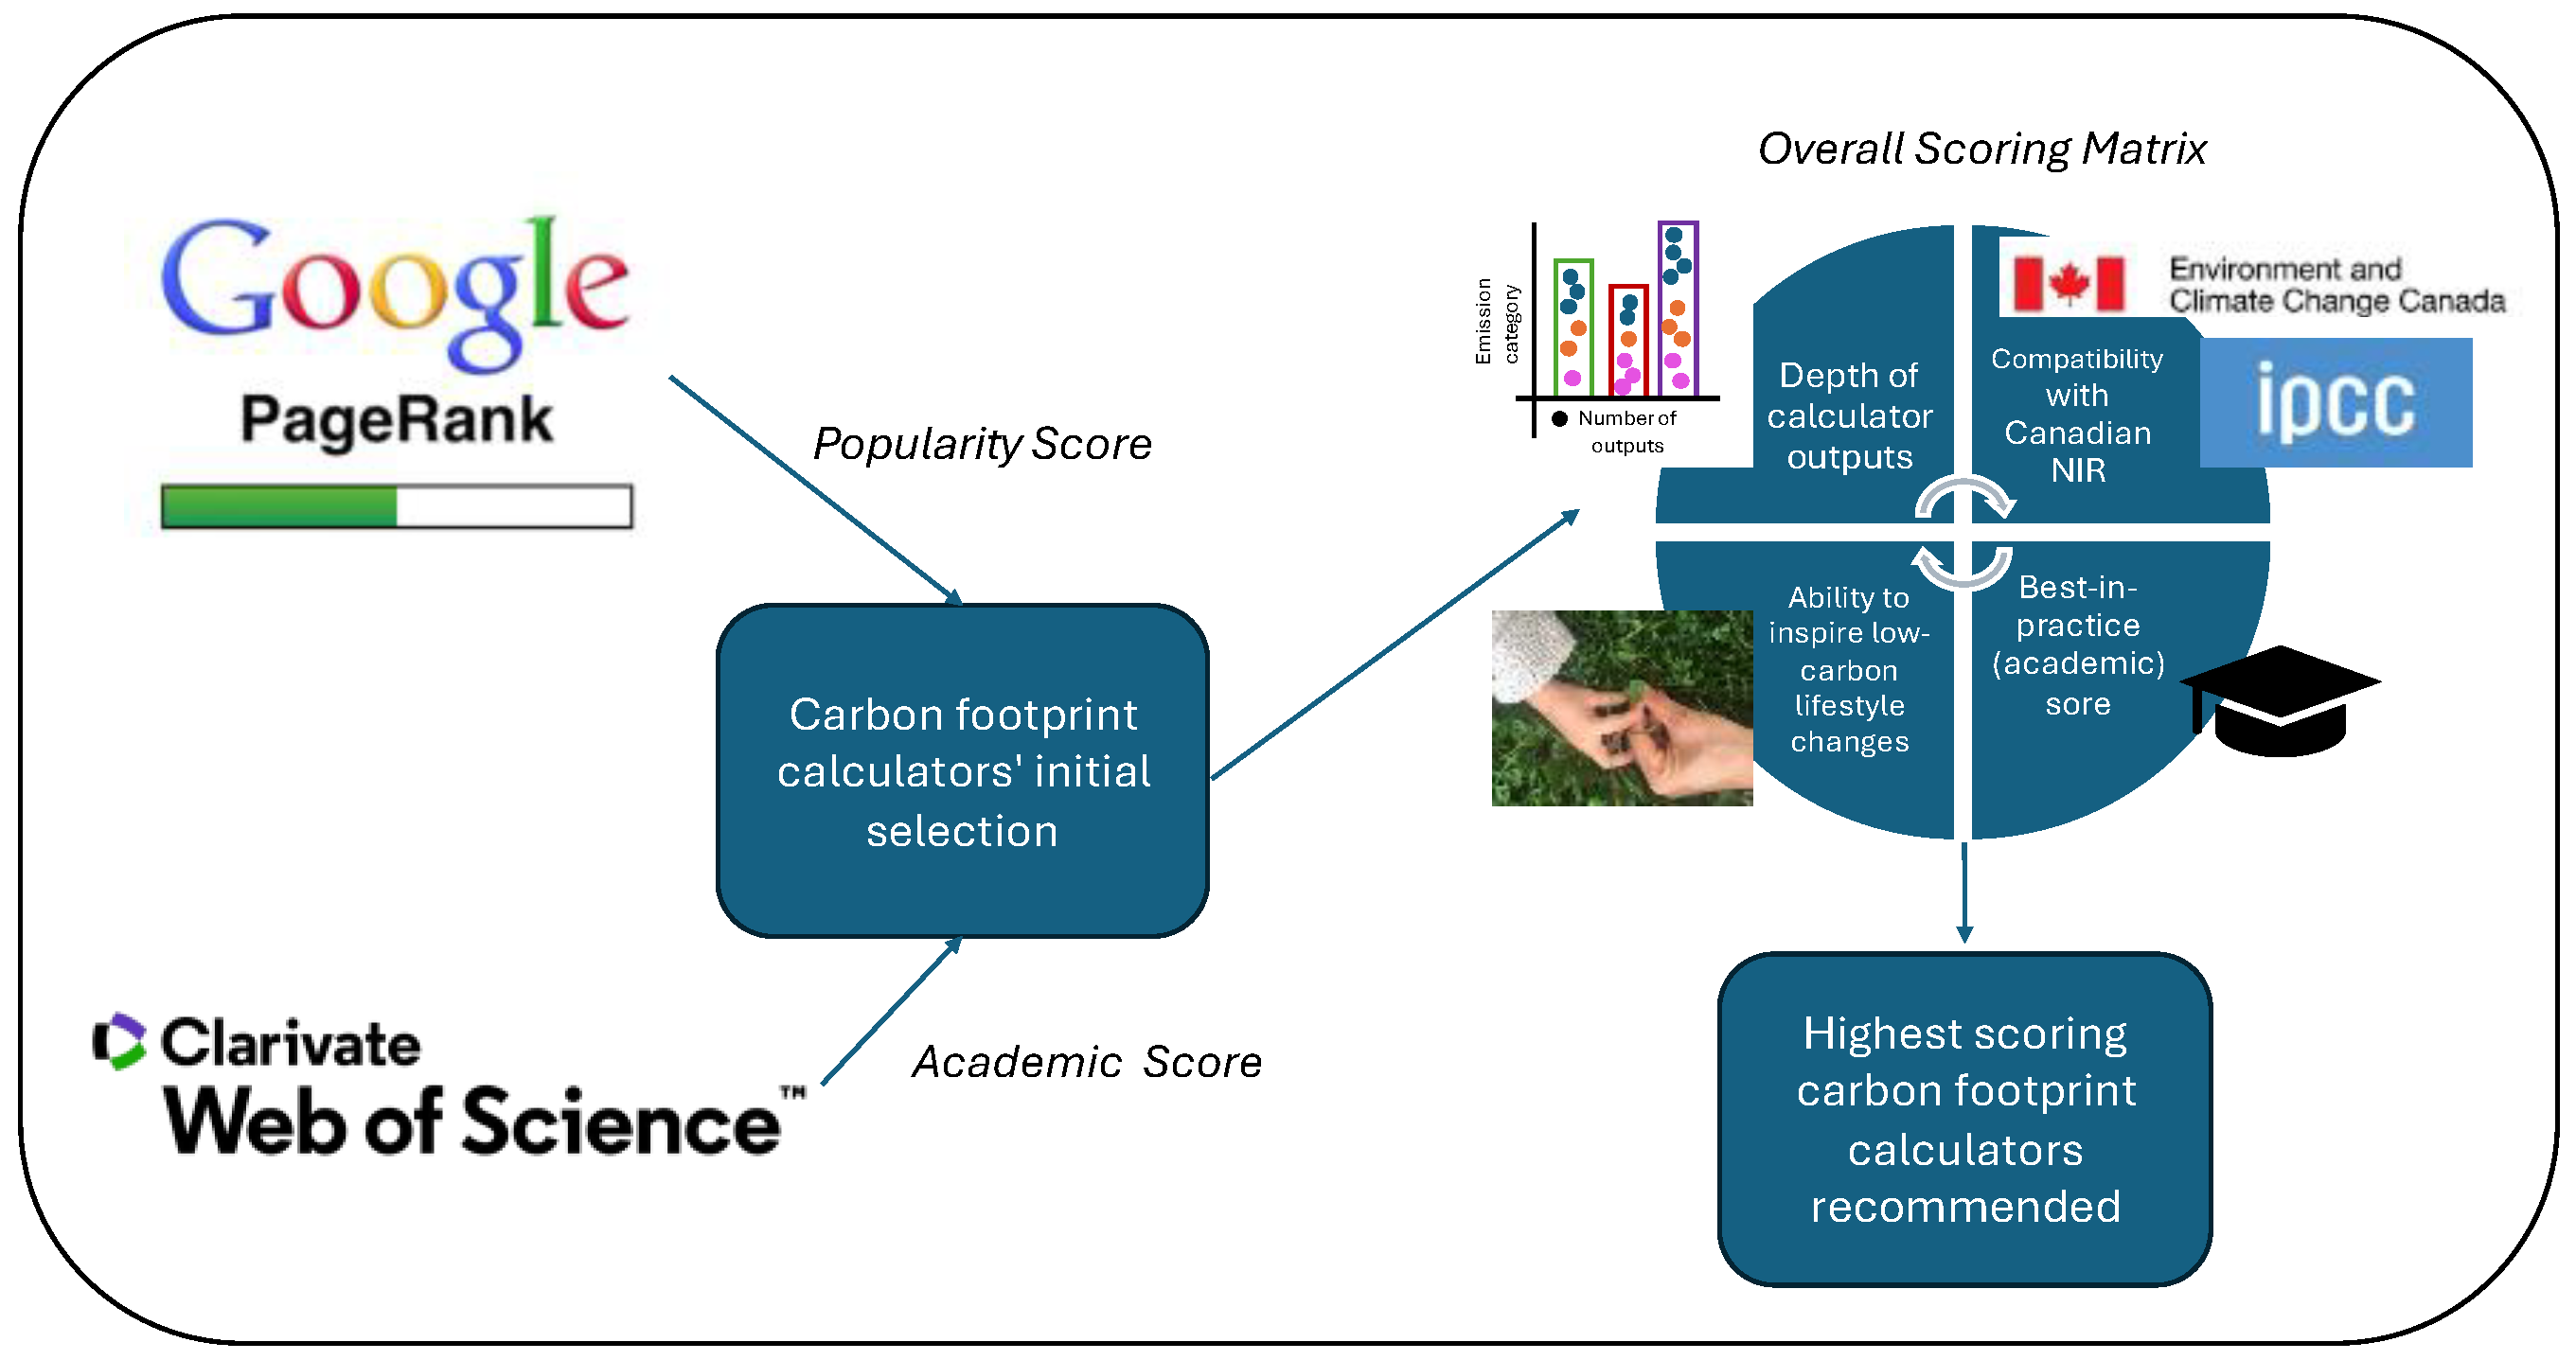
Figure 2.
Definitions of typical personal lifestyle activity categories for grouping of emission outputs from carbon footprint calculators (Illustrations are original images generated using Apple Image Playground application [24]. For illustrative purposes only).
Figure 2.
Definitions of typical personal lifestyle activity categories for grouping of emission outputs from carbon footprint calculators (Illustrations are original images generated using Apple Image Playground application [24]. For illustrative purposes only).
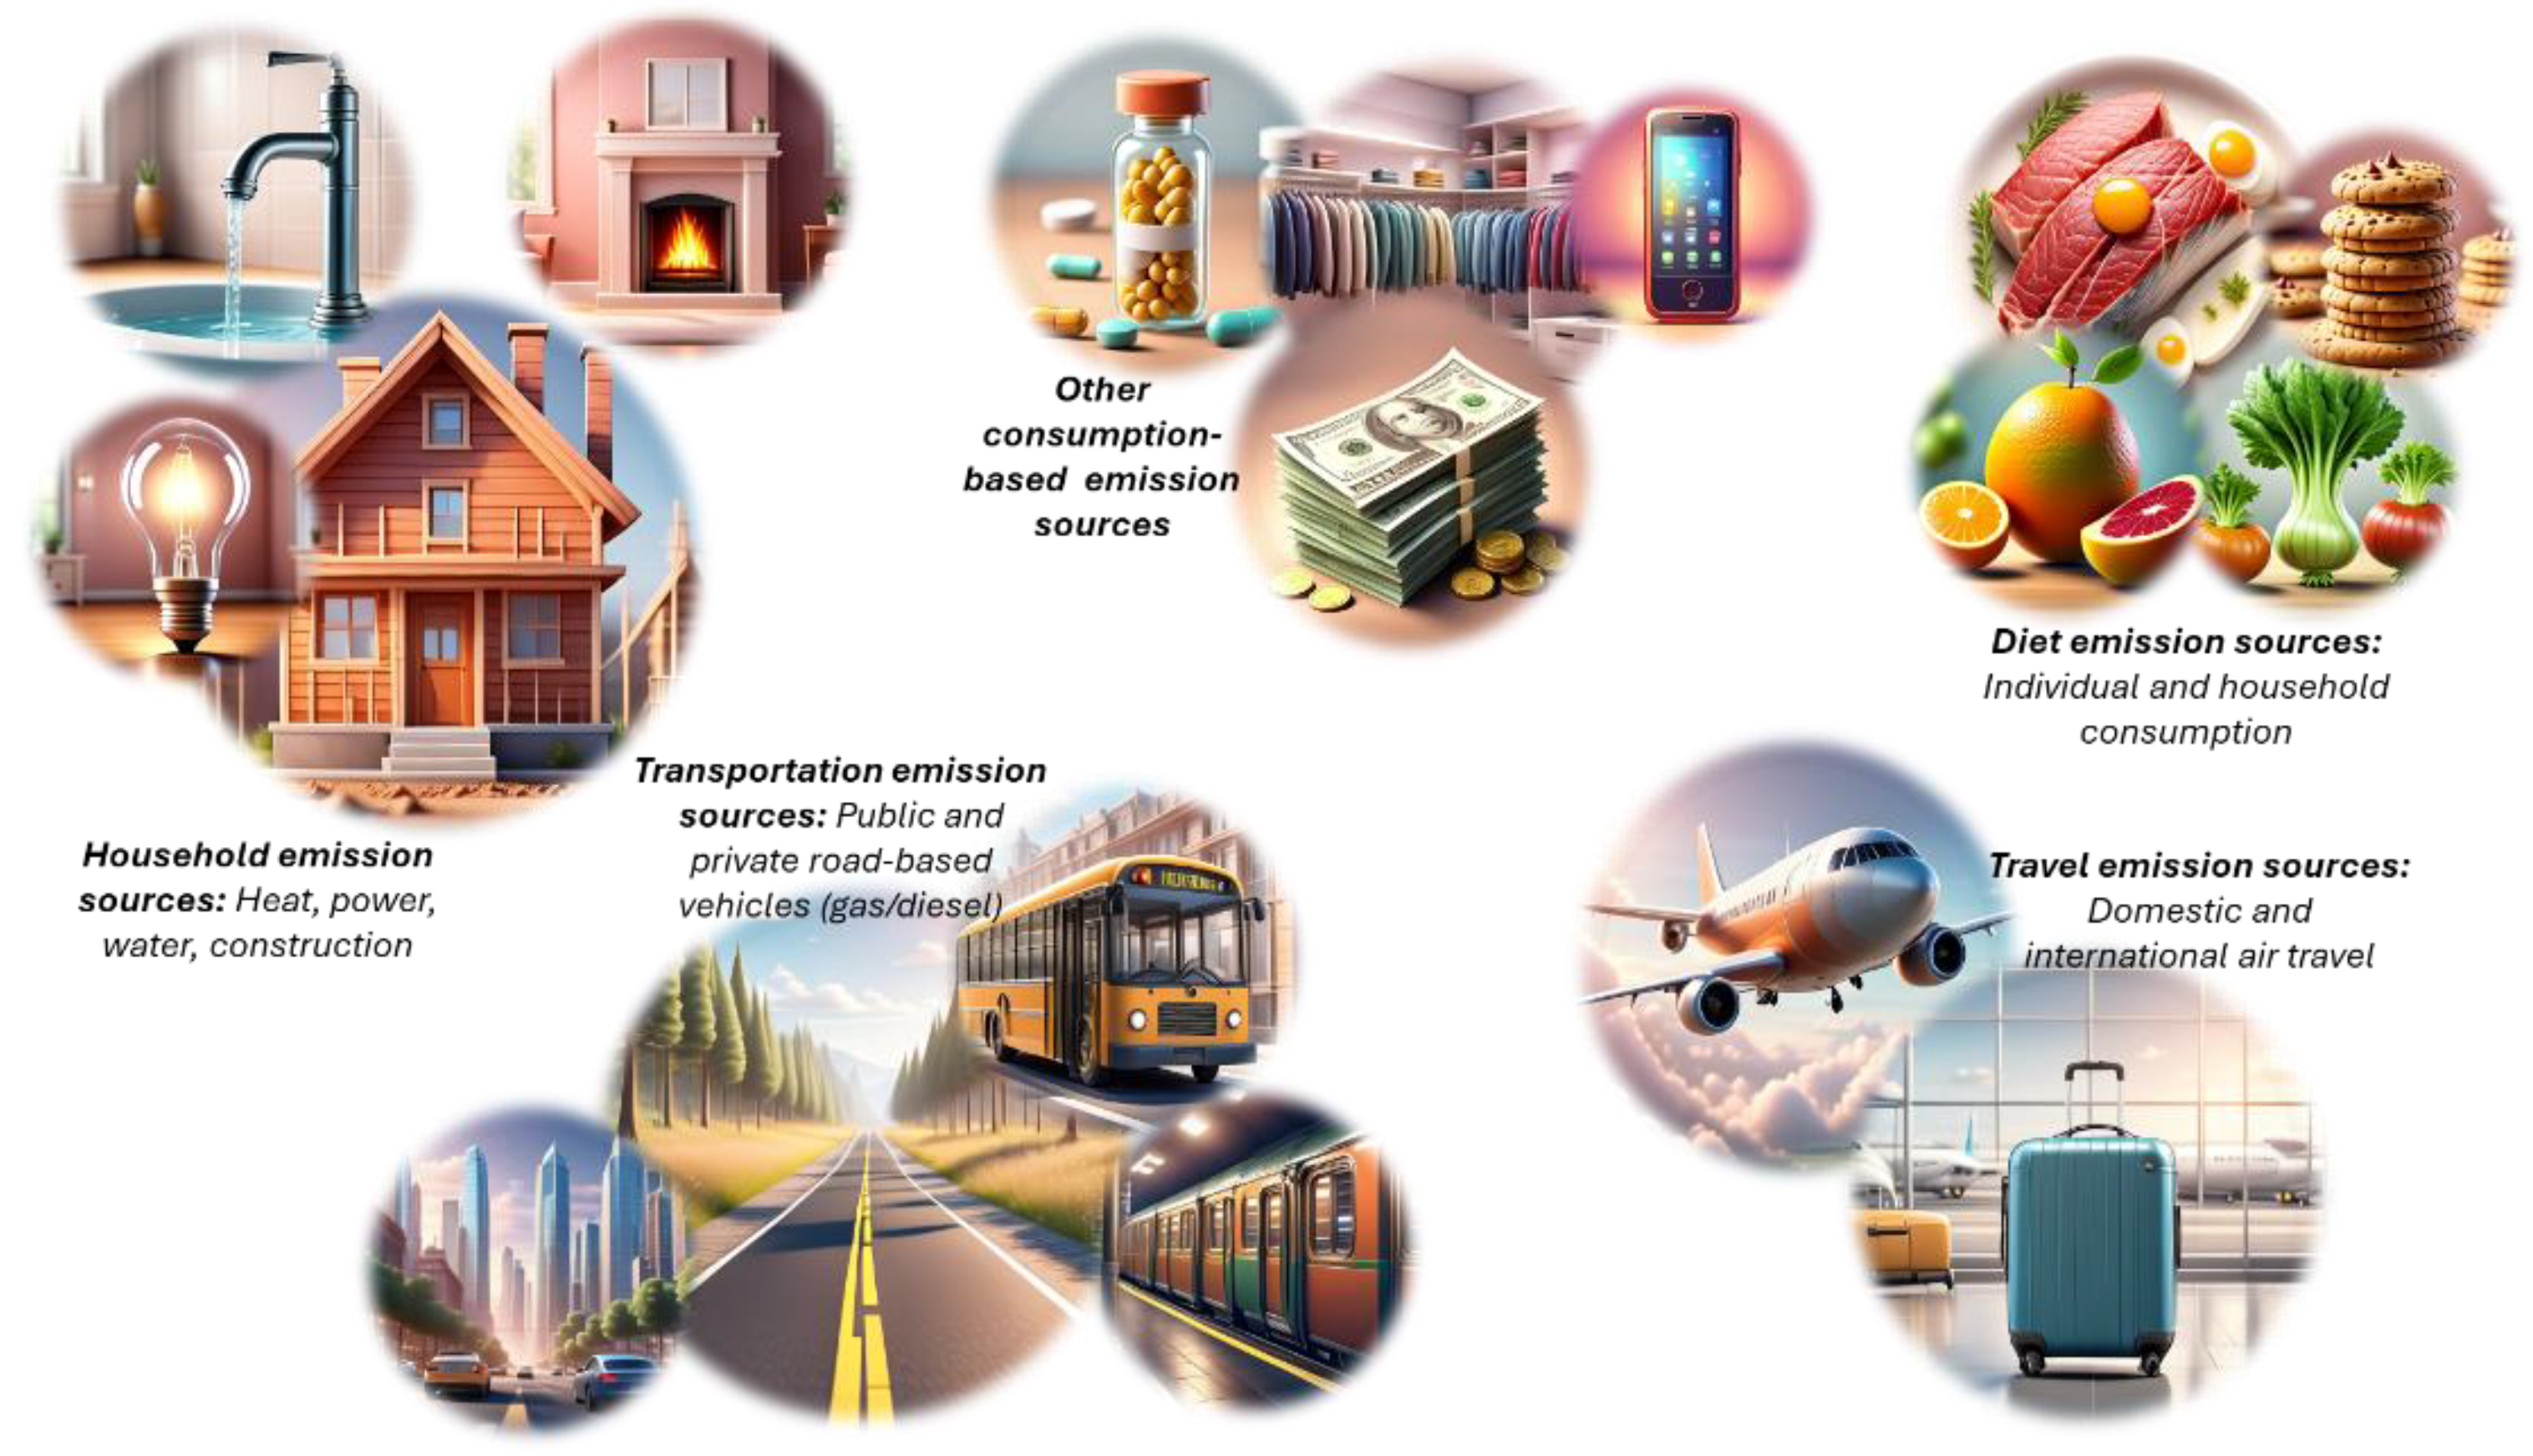
Figure 3.
Scoring workflow for Index 1(Depth score) for a given carbon footprint calculator analyzed in the study. The number of outputs are converted to scaled scores between 0 (no outputs in a given category) and 3 (number of outputs > category average + 1.0) to arrive at the total depth score.
Figure 3.
Scoring workflow for Index 1(Depth score) for a given carbon footprint calculator analyzed in the study. The number of outputs are converted to scaled scores between 0 (no outputs in a given category) and 3 (number of outputs > category average + 1.0) to arrive at the total depth score.
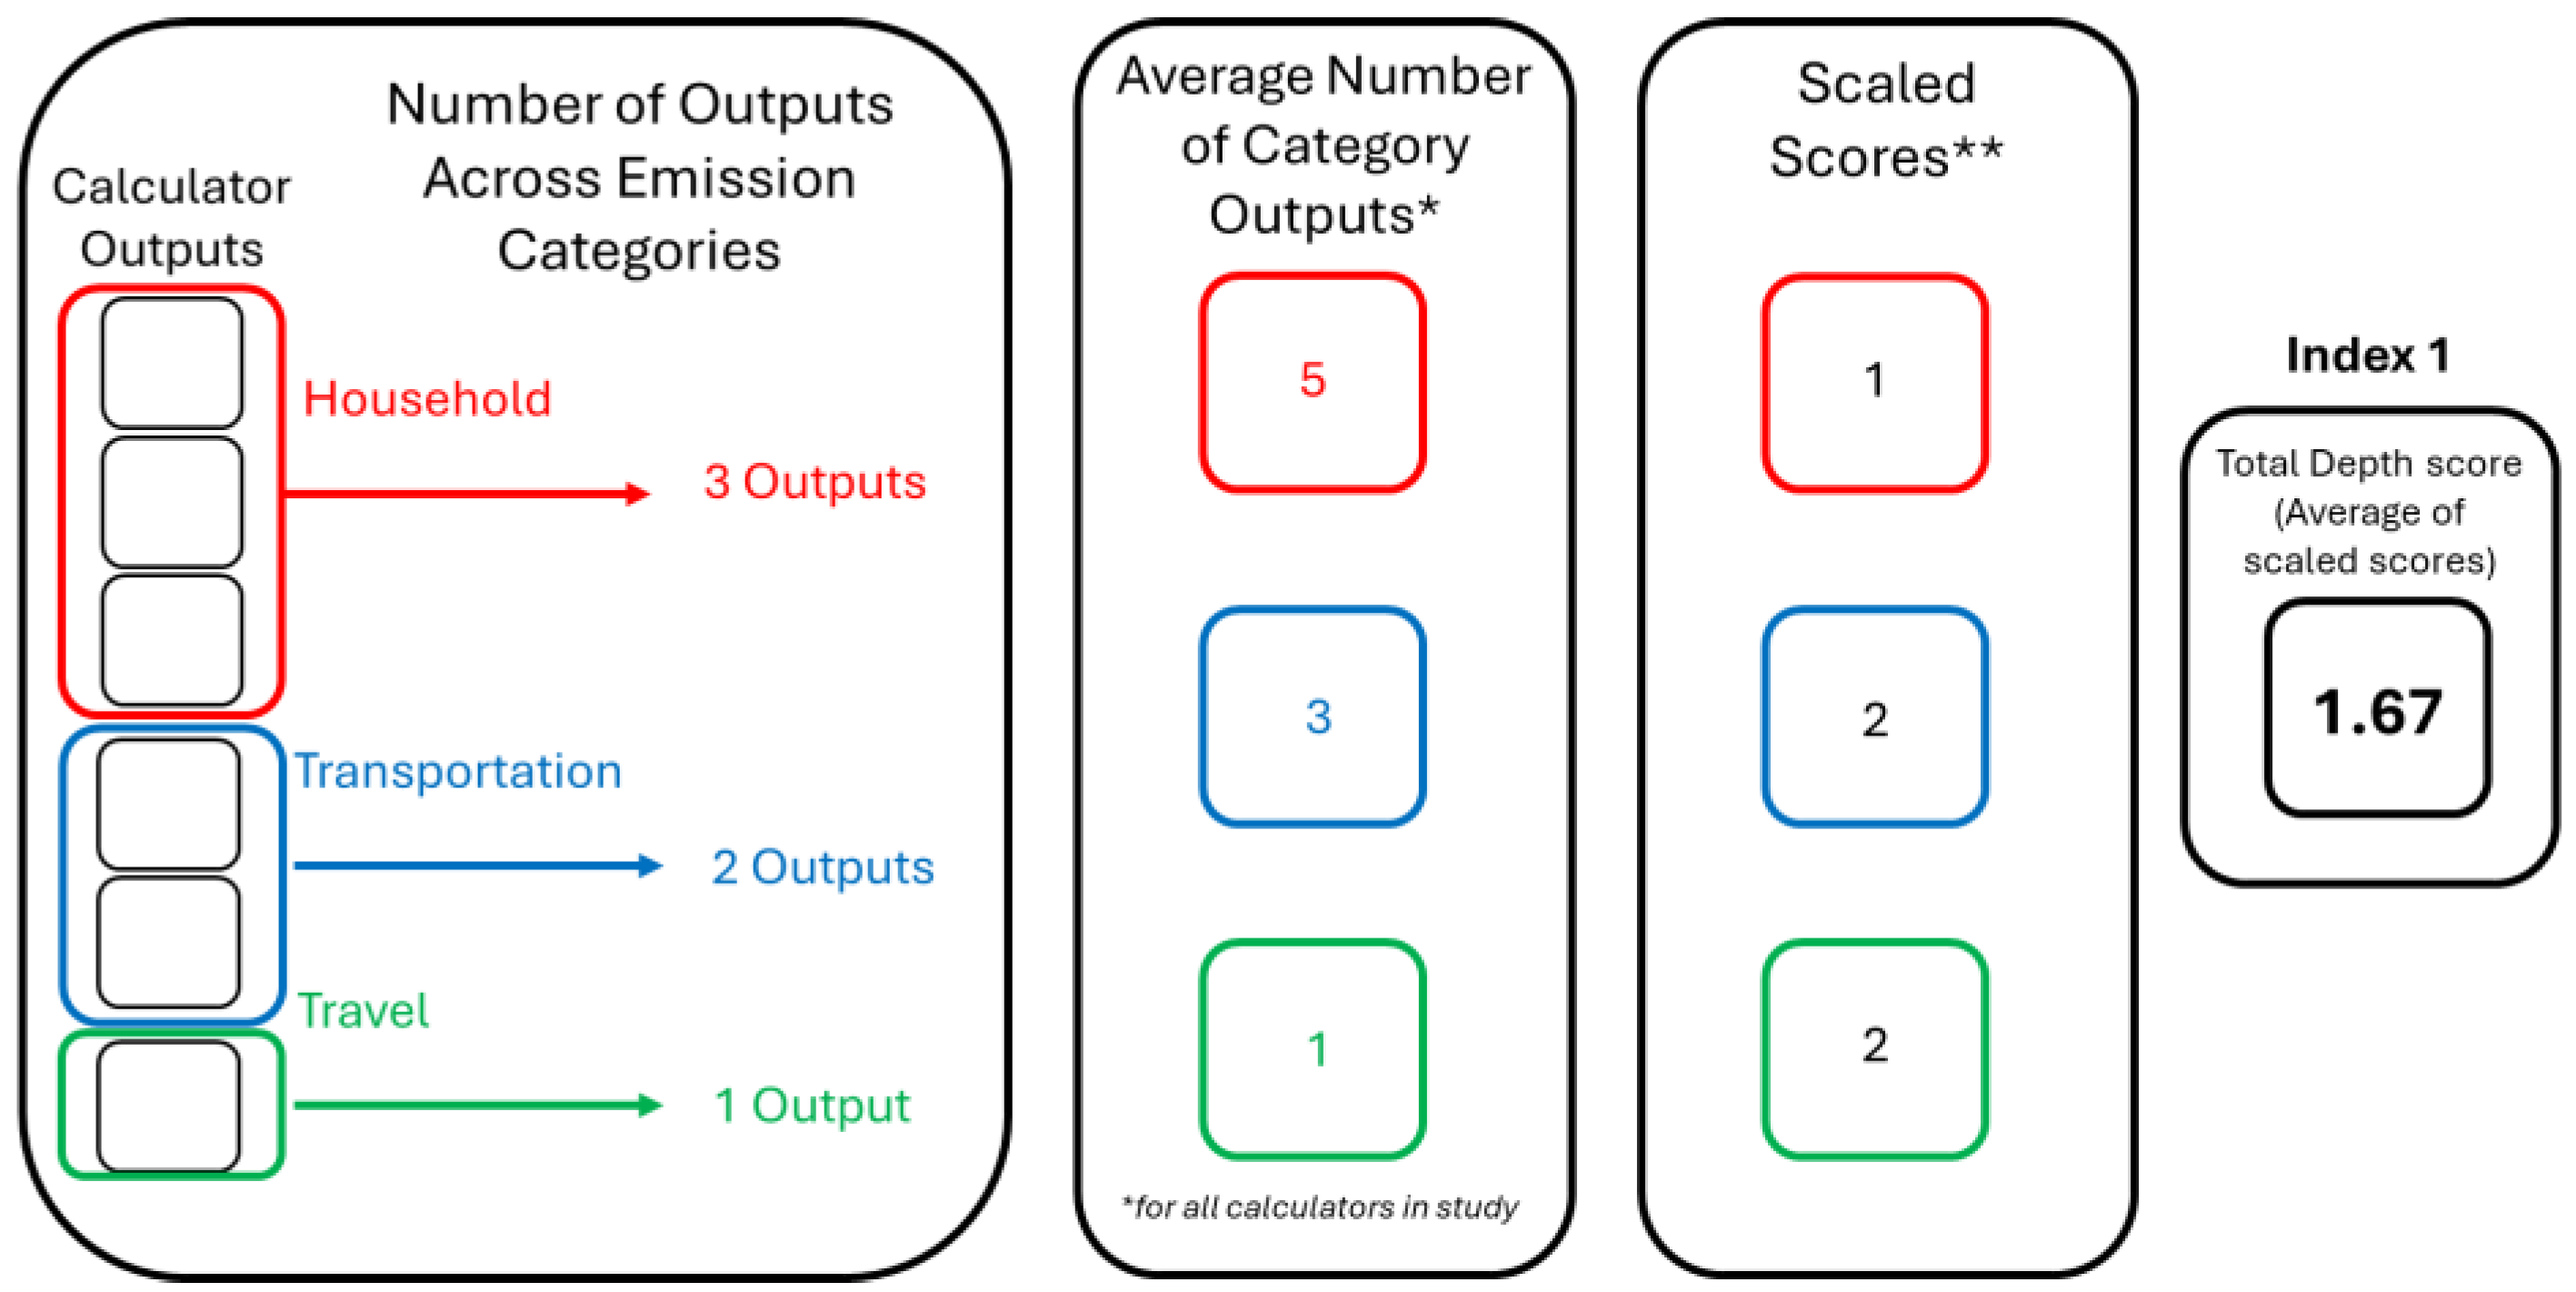
Figure 4.
Scoring workflow for Index 2 (NIR compatibility score) for a given carbon footprint calculator analysed in the study. The number of NIR compatible outputs are converted to scaled final score between 0 (no output compatible with NIR) and 3 (number of NIR compatible outputs > category average + 1.0).
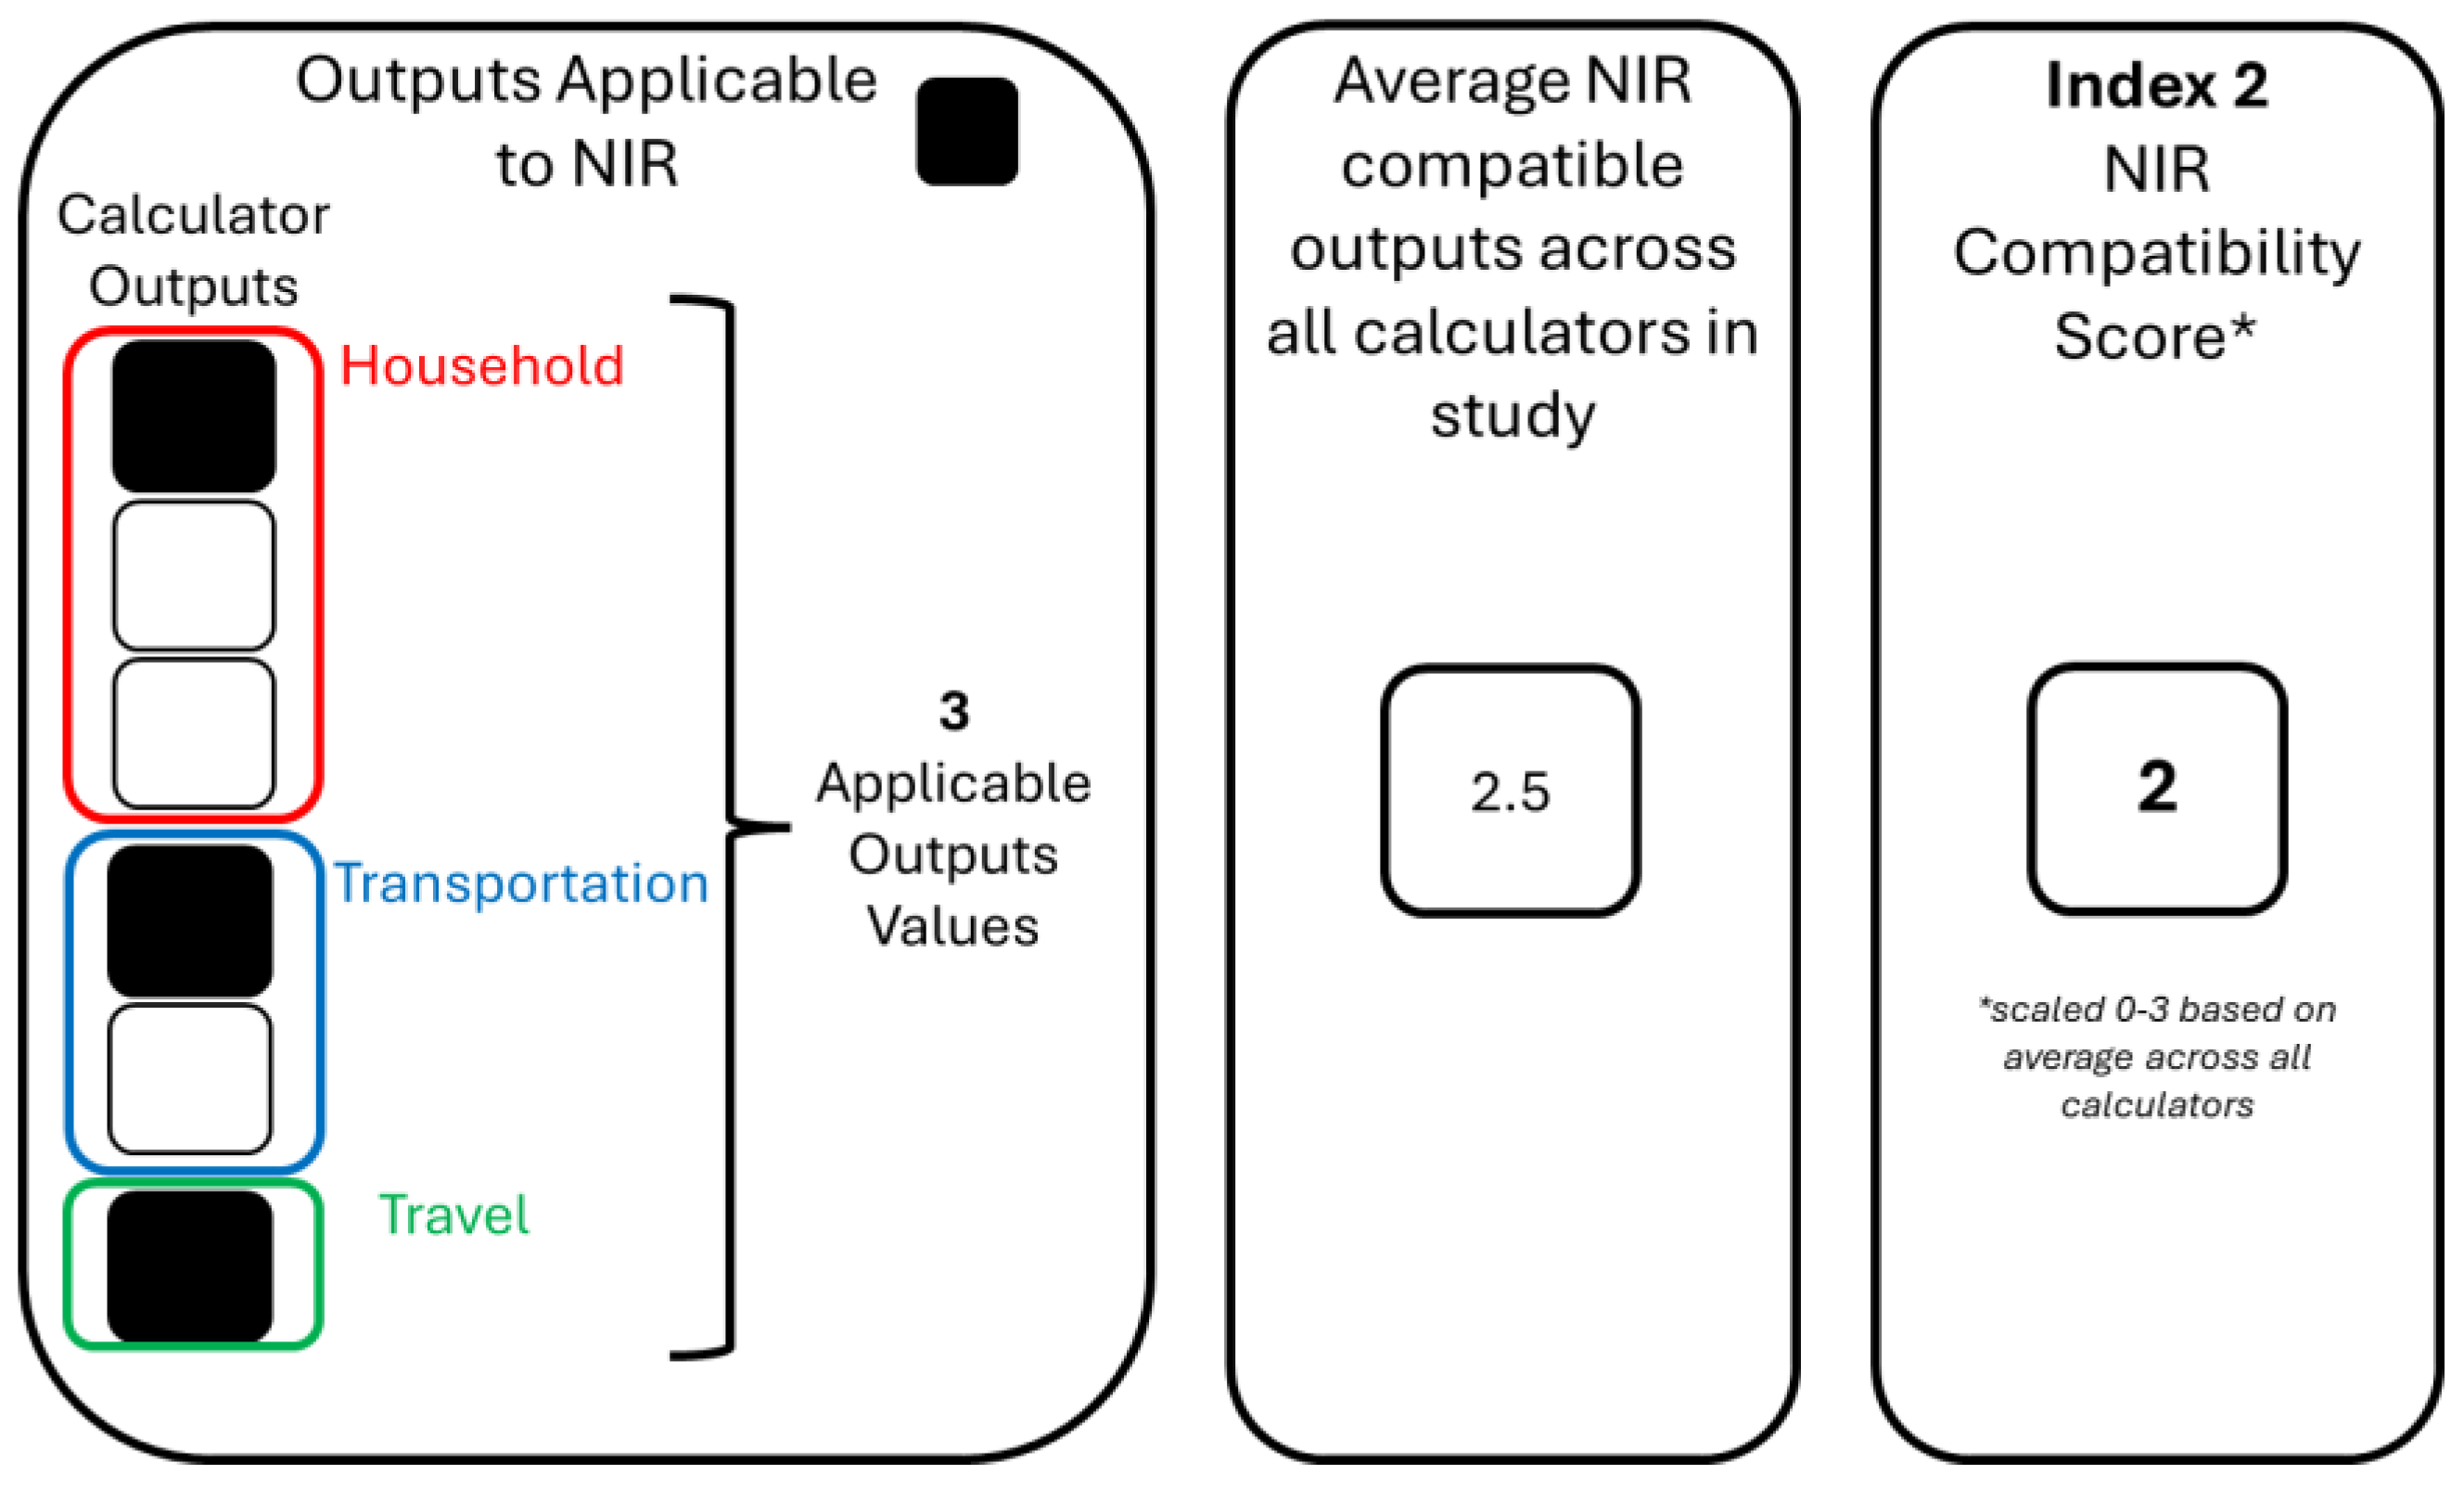
Figure 5.
Radar plot visualization of comparative performance of carbon footprint calculators. All axes were scaled from 0-3 prior to plotting and represent the comparative indices. Colored lines indicate the different calculators.
Figure 5.
Radar plot visualization of comparative performance of carbon footprint calculators. All axes were scaled from 0-3 prior to plotting and represent the comparative indices. Colored lines indicate the different calculators.
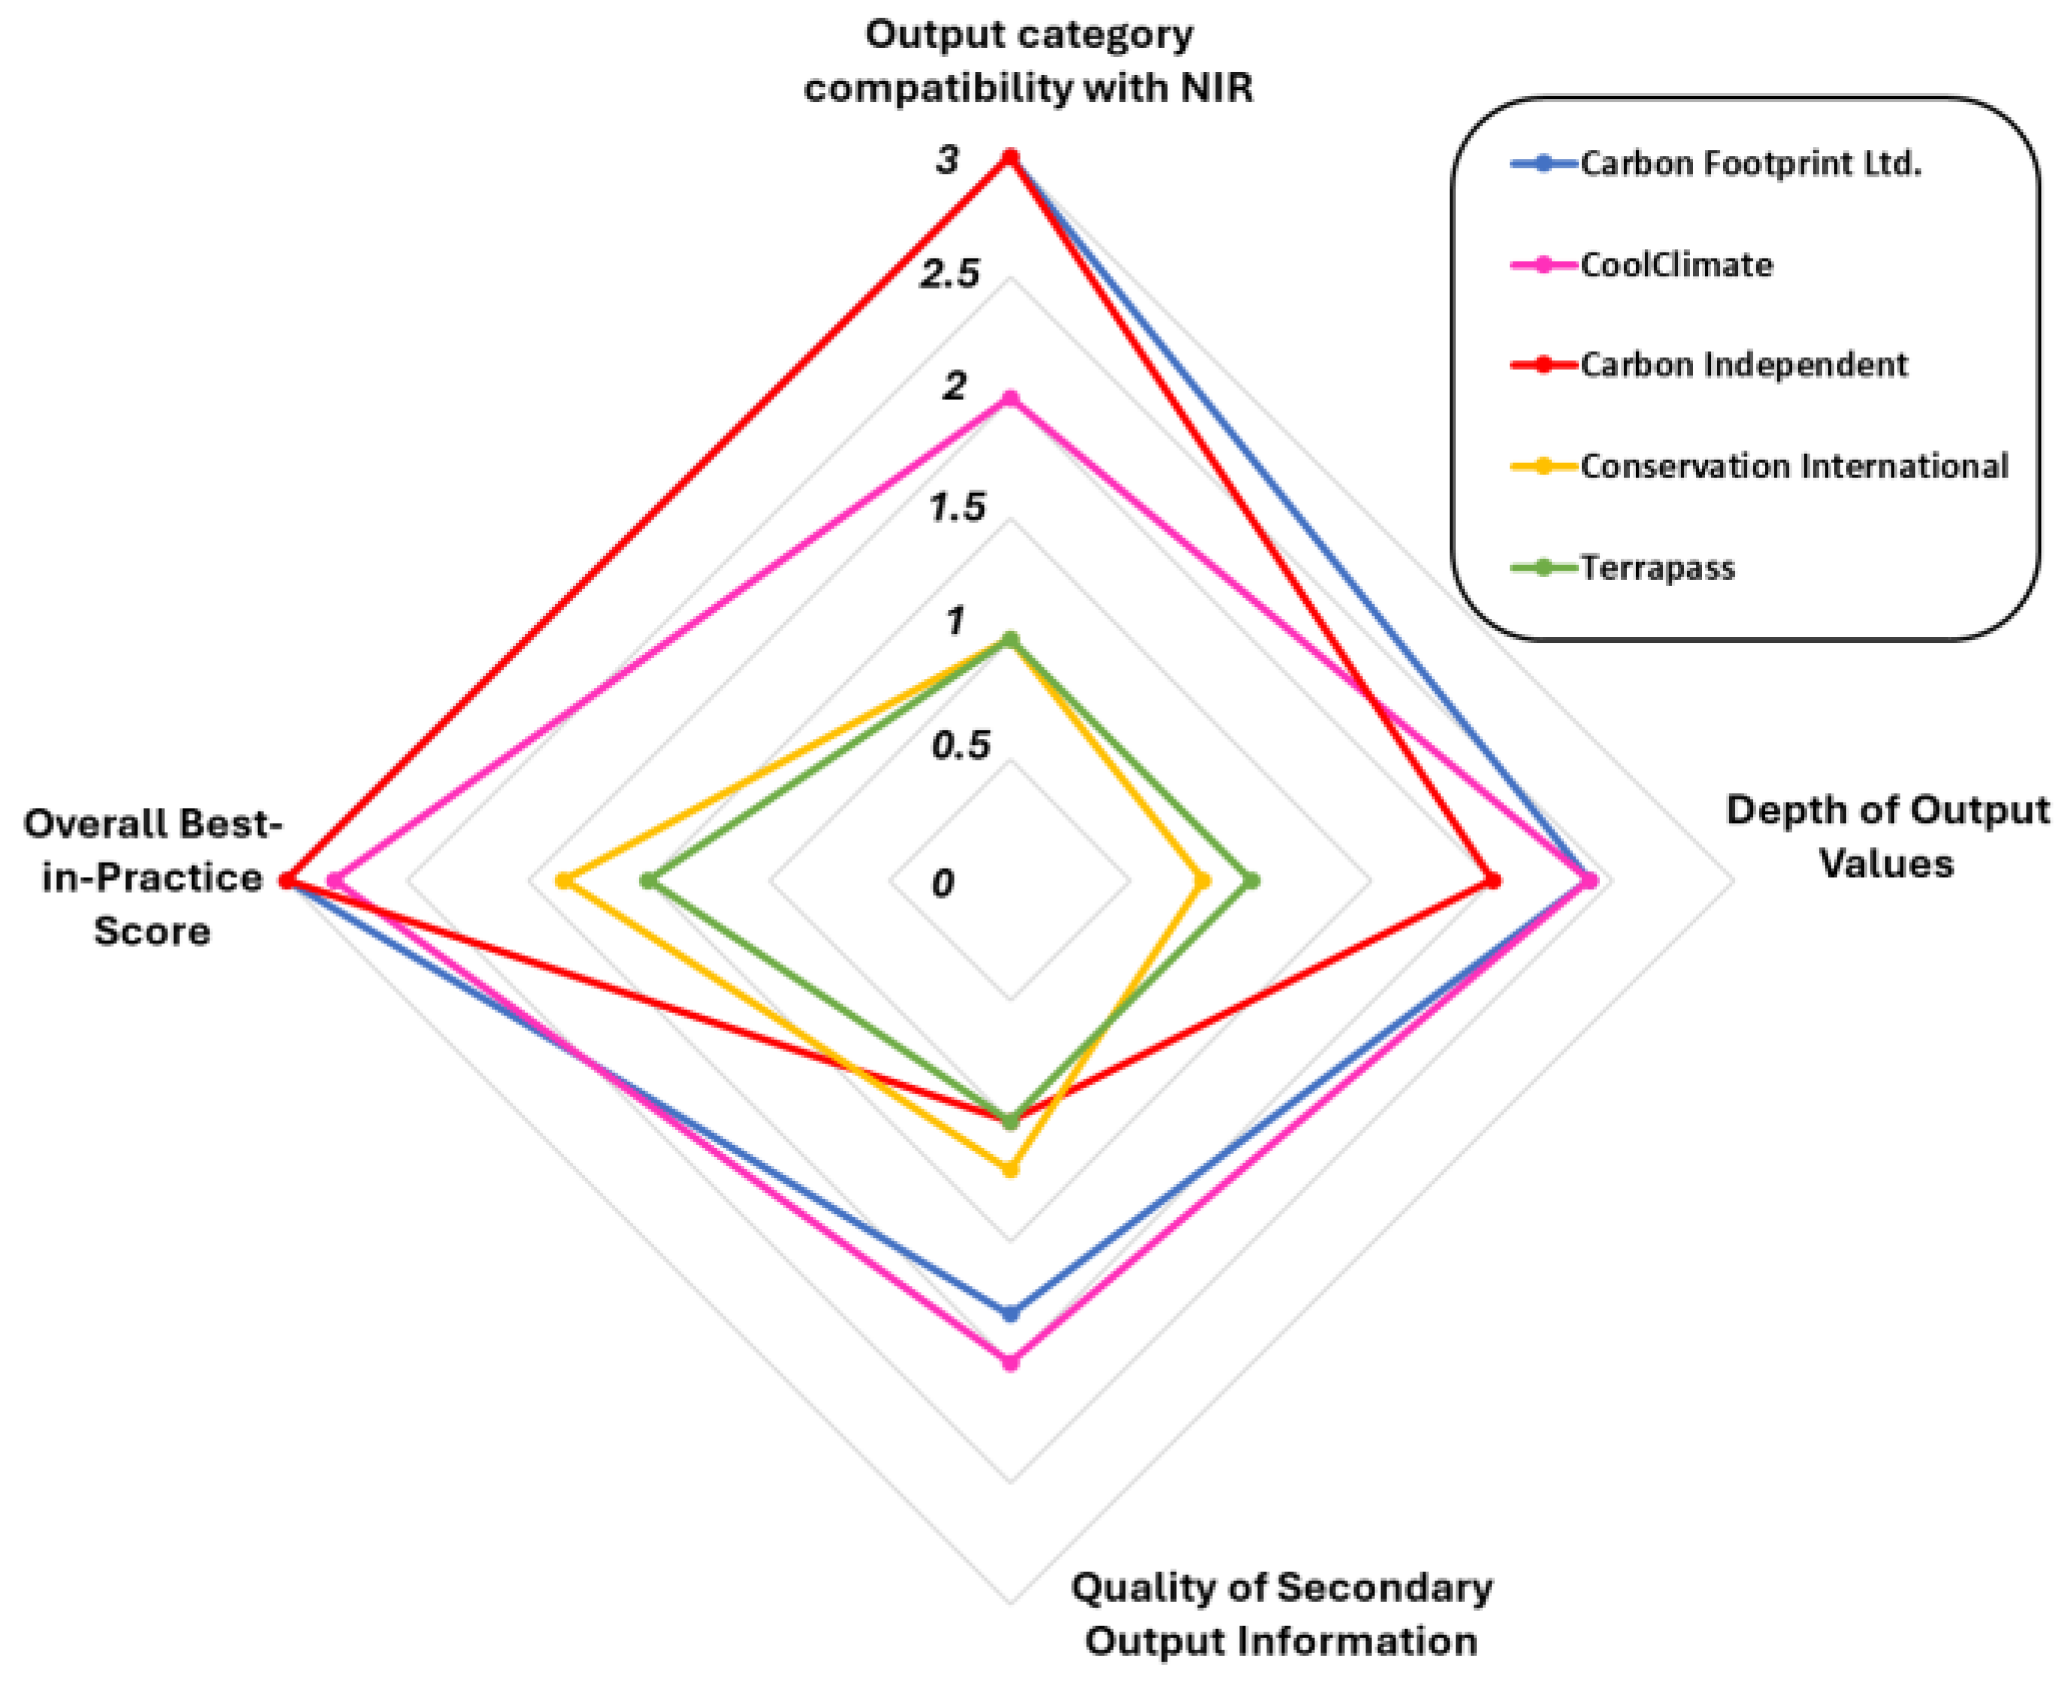

Table 1.
Potential effectiveness and quality of secondary output evaluation scoring criteria.
| Evaluation Sub-Category | Scoring |
|---|---|
| Relates GHG Reductions to Money Savings | 0 – The calculator does not relate personal emissions to personal spending. 3 – The calculator does relate personal emissions to personal spending. |
| Offers Carbon Offsetting Options | 0 – The calculator does not offer carbon offsetting after the calculation. 3 – The calculator offers carbon offsetting after the calculation. |
| Offers Recalculation of Emissions After Mitigation | 0 – The calculator does not recalculate personal emissions for mitigation strategies after the calculation. 3 – The calculator recalculates personal emissions after mitigation strategies are applied. |
| Education on data entry | 0 – The calculator does not guide users on data entry. 3 – The calculator provides extensive guidance on data entry. |
| Carbon Footprint Comparisons | 0 – The calculator does not provide comparisons with one or more carbon footprint after the calculation. 3 – The calculator provides comparisons with one or more carbon footprints after the calculation. |
| Number of Mitigation Strategies Suggested | 0 – No calculator offers no strategies to mitigate personal emissions after the calculation. 1 – The calculator offers 0 – 15 strategies to mitigate personal emissions after the calculation. 2 – The calculator offers 16 – 30 strategies to mitigate personal emissions after the calculation. 3 – The calculator offers 31+ strategies to mitigate personal emissions after the calculation. |
| Total Score for Quality of Secondary Output Information | Average from all sub-category scores. |
Table 2.
Carbon Footprint Calculators initial rankings. N/A denotes calculators not included in either study and such calculators were assigned a score of 0.
Table 2.
Carbon Footprint Calculators initial rankings. N/A denotes calculators not included in either study and such calculators were assigned a score of 0.
| Name | Google PageRank Search Ranking | Popularity Score | Birnik et al. (2013) original rating | Birnik scaled score | Mulrow et al. (2019) original score (Fig. 1 radar plot [15]) |
Mulrow scaled score | Final best-in-practice score |
|---|---|---|---|---|---|---|---|
| Carbon Footprint Ltd. | 1 | 10 | Strong | 3 | 18.51 | 2.9 | 3.0 |
| CoolClimate Calculator | 6 | 5 | Strong | 3 | 17.69 | 2.7 | 2.8 |
| The Nature Conservancy* | 3 | 8 | Average | 2 | 12.00 | 1.9 | 2.0 |
| Carbon Independent | 7 | 4 | N/A | 0 | 19.32 | 3.0 | 3.0 |
| Conservation International | 4 | 7 | Average | 2 | 11.19 | 1.7 | 1.85 |
| Terrapass | 8 | 3 | Weak | 1 | 12.81 | 2.0 | 1.5 |
| US EPA | 5 | 6 | Weak | 1 | 6.51 | 1.0 | 1.0 |
| Global Footprint Network | 2 | 9 | N/A | 0 | N/A | 0 | 0 |
| Henkel** | 10 | 1 | N/A | 0 | 12.20 | 1.9 | 1.9 |
| Carbonzero | 9 | 2 | N/A | 0 | N/A | 0 | 0 |
* Nature Conservancy now employs the CoolClimate Calculator. **Henkel calculator is currently not available for online access.
Table 3.
Cumulative score for calculator selection. Selected calculators highlighted in green.
| Name | Popularity Score | Best-in-practice score | Cumulative score |
|---|---|---|---|
| Carbon Footprint Ltd. | 10 | 3 | 13 |
| The Nature Conservancy | 8 | 2 | 10 |
| Conservation International | 7 | 1.85 | 8.85 |
| CoolClimate Calculator | 5 | 2.8 | 7.8 |
| Carbon Independent | 4 | 3 | 7 |
| US EPA | 6 | 1 | 7 |
| Terrapass | 3 | 1.5 | 4.5 |
| Henkel | 1 | 1.9 | 2.9 |
Table 4.
Quantity of outputs by evaluation sub-category for each calculator evaluated in study.
| Calculator Name | Household | Transport | Travel | Diet | Other |
|---|---|---|---|---|---|
| Carbon Footprint Ltd. | 7 | 8* | 1** | 1 | 13 |
| CoolClimate | 5 | 3* | 1** | 5 | 4 |
| Carbon Independent | 3 | 3* | 1** | 6 | 1 |
| Conservation International | 1 | 1 | 1 | 0 | 0 |
| Terrapass | 1 | 2 | 1** | 0 | 0 |
| Category Average | 3.4 | 3.4 | 1 | 2.4 | 3.6 |
* Indicates that each individual private vehicle has an individual output value. ** Indicates that each flight trip has an individual output.
Table 5.
Depth of output value final scores for each calculator as average of initial scores across all output categories.
Table 5.
Depth of output value final scores for each calculator as average of initial scores across all output categories.
| Calculator Name | Household | Transport | Travel | Diet | Other | Resulting Score |
|---|---|---|---|---|---|---|
| Carbon Footprint Ltd. | 3 | 3 | 2 | 1 | 3 | 2.4 |
| CoolClimate | 3 | 2 | 2 | 3 | 2 | 2.4 |
| Carbon Independent | 2 | 2 | 2 | 3 | 1 | 2 |
| Conservation International | 1 | 1 | 2 | 0 | 0 | 0.8 |
| Terrapass | 1 | 2 | 2 | 0 | 0 | 1 |
Table 6.
Calculator scores for output value compatibility with the Canadian National Inventory Report.
Table 6.
Calculator scores for output value compatibility with the Canadian National Inventory Report.
| Carbon Footprint Calculator | Number of Relatable Output Values | Resulting Scaled Score |
|---|---|---|
| Carbon Footprint Ltd. | 15 | 3 |
| CoolClimate | 10 | 2 |
| Carbon Independent | 11 | 3 |
| Conservation International | 2 | 1 |
| Terrapass | 4 | 1 |
| Average | 8.4 |
Table 7.
Secondary outputs obtained from calculators and assessed across evaluation categories that are indicators of effectiveness to inspire low-carbon lifestyle changes.
Table 7.
Secondary outputs obtained from calculators and assessed across evaluation categories that are indicators of effectiveness to inspire low-carbon lifestyle changes.
| Calculator Name | Relates GHG Reductions to Money Savings | Offers Carbon Offsetting Options | Offers Recalculation of Emissions After Mitigation | Education on data entry | Carbon Footprint Comparison | Number of Mitigation Strategies Suggested |
|---|---|---|---|---|---|---|
| Carbon Footprint Ltd. | Yes | Yes | No | No | Yes | 29 |
| CoolClimate | Yes | No | Yes | No | Yes | 38 |
| Carbon Independent | No | No | No | Yes | Yes | 0 |
| Conservation International | No | Yes | No | No | Yes | 6 |
| Terrapass | No | Yes | No | No | Yes | 0 |
Table 8.
Final scores for potential effectiveness of calculators to inspire personal greenhouse gas (GHG) emission reductions.
Table 8.
Final scores for potential effectiveness of calculators to inspire personal greenhouse gas (GHG) emission reductions.
| Calculator Name | Relates GHG Reductions to Money Savings | Offers Carbon Offsetting Options | Offers Recalculation of Emissions After Mitigation | Education on data entry | Carbon Footprint Comparison | Number of Mitigation Strategies Suggested | Overall Score |
|---|---|---|---|---|---|---|---|
| Carbon Footprint Ltd. | 3 | 3 | 0 | 0 | 3 | 2 | 1.8 |
| CoolClimate | 3 | 0 | 3 | 0 | 3 | 3 | 2.0 |
| Carbon Independent | 0 | 0 | 0 | 3 | 3 | 0 | 1.0 |
| Conservation International | 0 | 3 | 0 | 0 | 3 | 1 | 1.2 |
| Terrapass | 0 | 3 | 0 | 0 | 3 | 0 | 1.0 |
Table 9.
Cumulative scores for each carbon footprint calculator across all comparative indices.
| Name | Overall Best-in-practice Score | Depth of Output Values | Output Category Compatibility | Quality of Secondary Output Information |
|---|---|---|---|---|
| Carbon Footprint Ltd. | 3 | 2.4 | 3 | 1.8 |
| CoolClimate | 2.8 | 2.4 | 2 | 2.0 |
| Carbon Independent | 3 | 2 | 3 | 1.0 |
| Conservation International | 1.85 | 0.8 | 1 | 1.2 |
| Terrapass | 1.5 | 1 | 1 | 1.0 |
Disclaimer/Publisher’s Note: The statements, opinions and data contained in all publications are solely those of the individual author(s) and contributor(s) and not of MDPI and/or the editor(s). MDPI and/or the editor(s) disclaim responsibility for any injury to people or property resulting from any ideas, methods, instructions or products referred to in the content. |
© 2025 by the authors. Licensee MDPI, Basel, Switzerland. This article is an open access article distributed under the terms and conditions of the Creative Commons Attribution (CC BY) license (http://creativecommons.org/licenses/by/4.0/).
Copyright: This open access article is published under a Creative Commons CC BY 4.0 license, which permit the free download, distribution, and reuse, provided that the author and preprint are cited in any reuse.


