Submitted:
07 June 2025
Posted:
10 June 2025
You are already at the latest version
Abstract
Predicting pedestrian crossing intentions at unsignalized intersections remains a critical yet underexplored challenge for autonomous vehicles and Advanced Driver Assistance Systems (ADAS). Although prior research on pedestrian intent prediction exists, much of it relies heavily on image-based datasets and computationally intensive deep learning models, limiting their applicability in resource-constrained real-time environments. This study explores whether classical machine learning and lightweight models, using only trajectory and simple contextual features, can achieve competitive performance in predicting pedestrian crossing intentions. Using the inD drone dataset, we transformed bird's eye trajectories into a car-centric perspective, incorporating occlusion, sensing range, and sensing frequency to simulate realistic ADAS conditions. A novel feature, namely the cutting momentum, is introduced to capture pedestrian movement toward the ego vehicle's projected trajectory. Combined with ego velocity and time-to-collision, these features are used to train a Random Forest classifier. The model achieves a mean accuracy of 91.8\% when evaluated at the observation level, and 38\% recall with precision 100\% when evaluated at the event level, demonstrating its potential for deployment on cost-effective ADAS hardware.
Keywords:
pedestrian intention prediction
; trajectory analysis
; advanced driver assistance systems (ADAS)
; lightweight machine learning
; time-to-collision
; drone dataset
; random forest
1. Introduction
Autonomous vehicles (AVs) must negotiate complex urban environments where pedestrian behavior is often unpredictable. Pedestrian crossing prediction is particularly important to improve safety for intelligent transportation systems. The report of the self-driving car test by [1] hints that the highest number of disengagement of autonomous modes occurs when a self-driving car encounters a pedestrian approaching a crossing, which underscores the challenge of prepredicting the intention to cross. Unsignalized intersections are crossings without signal displays or traffic lights and can be marked (zebra crossings) or unmarked (nonzebra crossings). Compared to signalized intersections, unsignalized intersections lack explicit traffic control mechanisms. In addition, the behavior of pedestrians and vehicles is interdependent at such intersections according to [2]. These conditions complicate the challenge. Predicting the intention of pedestrian crossing at an unsignalized crossing is therefore an important and challenging area for AV deployment.
Many recent works have used deep learning techniques, such as the convolutional neural network (CNN), the recurrent neural network (RNN) and the attention mechanism, to extract pedestrian features from the image-based dataset. These models have achieved state-of-the-art prediction accuracy, but often cannot achieve real-time performance despite the usage of high-end graphics processing units (GPUs), which are rather expensive. Thus, their application in advanced commercial driving assistance systems (ADAS) is limited. To achieve wider adoption, computationally efficient methods should be explored to predict pedestrian crossing intentions using affordable onboard hardware.
A promising approach is to rely primarily on pedestrian trajectory data instead of high-dimensional image data. Models based on trajectory data could capture motion patterns and historical behavior, which are essential to predict the intention to cross. In addition, simple contextual information, such as the distance from the road boundaries or the maximum waiting time, could improve prediction accuracy without significantly increasing computation cost, as demonstrated in the work of [3]. Despite relying on cameras mounted on infrastructures, e.g., light poles, [4] and [5] have shown that classical machine learning techniques like support vector machine and random forest could achieve relatively high accuracy with trajectory data.
This study considers an idealized but realistic scenario: utilizing real-world pedestrian trajectories collected from aerial views, but transforming them into a car-centric perspective. Taking into account occlusions and sensing range limitations, the aim is to evaluate whether trajectory-based prediction can be sufficiently robust for practical deployment. Based on an assumption of the availability of reasonably fast yet accurate pedestrian detection (e.g., Yolo v7 by [6]) and the tracking algorithm (e.g., [7]), this study investigates the feasibility of affordable ADAS hardware. Ultimately, the goal is to determine whether classical machine learning or lightweight neural networks can match or approach the performance of heavier deep learning models but with significantly reduced computational requirements.
2. Literature Review
To understand pedestrian behavior, [8] collected data under various conditions, including several countries, weather, time of day, etc. By manually annotating camera data, the researchers observed that head movement occurred 80% of the time prior to crossing. However, the exact timing of head movement relative to crossing was not reported.
Several studies have explored pedestrian-vehicle interactions in specific environments. For example, [9] examined interactions at a unsignalized intersection in Milan. The researchers categorized the crossing behavior into three phases: approaching, appraising, and crossing, and noted a speed drop during the approaching phase. They also observed that the average accepted time gap was not affected by the number of vehicles, age, or sex. These results emphasize the importance of trajectory data and historical context in predicting crossings. Similarly, [10] investigated the acceptance behavior of gaps on a two-lane highway in Beijing, China. The researcher identified age, group size of pedestrians and near-side time gap as primary predictors of jaywalking. Unlike [9], who did not find such an effect, they found that older pedestrians preferred larger time gaps, highlighting the potential influence of road geometry or cultural differences on crossing behavior. Together, these findings underscore the complexity of pedestrian-vehicle interaction in different contexts. Focusing on signalized intersections, [11] studied the role of maximum waiting time (MWT) in dangerous crossing behavior. By analyzing data collected from thirteen intersections with similar geometry and traffic conditions, the researchers found that a 10% increase in MWT was correlated with a 7.9% increase in the likelihood of dangerous crossings. Although the generalizability of these findings to unsignalized intersections is uncertain, MWT emerges as a factor worth considering in crossing behavior models.
Efforts have also been made to automate the identification of pedestrian-vehicle conflicts. [12] utilized metrics such as time to collision (TTC), post-encroachment time (PET), gap time (GT) and deceleration time to safety (DST) for video data analysis. By combining these metrics, they achieved an 89.5% match with human annotations, though a high false positive rate revealed the need for improved metrics and models.
[2] analyzed interactions between pedestrians and drivers at signalized and unsignalized intersections, and found that pedestrian speed and distance are rather independent of vehicle speeds at signalized intersections, but interdependent at unsignalized intersections. This finding underscores the need to include both vehicle and pedestrian trajectory data to predict crossings at unsignalized intersections.
To understand pedestrian behavior in the context of autonomous vehicles (AVs), [13] conducted an experiment comparing pedestrian reactions to regular vehicles versus AVs. The researchers simulated autonomous vehicles by controlling a vehicle using a joystick in the passenger seat and concluded that vehicle crossing behavior is primarily influenced by the speed and distance of the car rather than the attentiveness of the drivers or the appearance of the vehicle. This suggests that the insights obtained from studies on the regular vehicle-pedestrian interaction may generalize well to those of autonomous scenarios.
The availability of data sets such as JAAD (Joint Attention in Autonomous Driving) provided by [14] and PIE (Pedestrian Intention Estimation) provided by [15] has truly enabled data-driven approaches by providing high-quality data for training and evaluation. The JAAD dataset provides annotated camera data in car-centric views, including bounding boxes, behavior types, and contextual information like weather and time of day. Similarly, the PIE dataset provides comparable information in car-centric camera data, with the addition of pedestrian intention annotation. Although valuable, both datasets are limited to cameras and do not make use of common sensors for autonomous vehicles such as radar and lidars, which could easily provide valuable information like speed or relative distance of a pedestrian. As a result, they are not well suited to address what can be achieved by ADAS. Aerial data sets such as the inD (Intersection Drone Dataset) provided by [16], although also limited to camera data, provide an unobstructed view of all actors. Therefore, it is much better suited to provide idealized yet naturalistic pedestrian trajectories with respect to vehicles.
Based on these data sets, deep neural network-based solutions have shown promising results. [17] proposed a model to connect and reason about the time series evolution of human key points such as shoulder, elbow, knee, etc. By constructing a ’pedestrian graph network’ that relies exclusively on skeletal pose information, they achieved 92% accuracy in the prediction of pedestrian crossings on the JAAD dataset. [18] took it further by incorporating more granular information into the model, including how human key points evolve in a Cartesian coordinate and the euclidean distance between some of these key points. The researchers obtained a precision of 94.4% in the JAAD dataset. These works demonstrated that the skeletal poses of pedestrians likely entail sufficient information to predict crossing behavior in many cases. To take it to the extreme, [19] proposed a model to fuse virtually all the available information provided by the JAAD dataset. They utilized convolutional neural networks (CNN) to extract visual cues, recurrent neural networks (RNN) to process time series data, and attention mechanisms to focus on the most relevant features. The researchers reported state-of-the-art performance. Despite their promising results, the work of [17] and [18] relies on cascaded pyramid networks (CPN) to extract human skeletal poses, which according to [18], could take 60 ms to process a single frame. [19] did not report how much inference time is needed for their model.
More recent work in this area attempts to address the runtime issue by adopting more light-weighted neural networks while preserving its accuracy. [20] represents the bounding boxes, the speed of the ego vehicle, human key points, etc. as graphs of nodes and edges. The graphs are inputs to the graph convolutional networks (GCN), which are more computationally efficient compared to CNN or RNN due to having fewer model parameters. Similarly, [21] avoided direct use of RGB images or image semantic data by converting the information to graphs and feeding it to the temporal convolutional graph convolutional network (TCGC), an improvement of GCN that focuses on temporal dynamics as their model foundation. In addition, the researchers introduced a quasipolar coordinate to address accuracy issues that would otherwise arise in Cartesian coordinates due to vehicle-pedestrian relative motion. They reported 89% accuracy on the JAAD dataset and 94% accuracy on the PIE dataset and a 0.5 ms inference time on the NVIDIA RTX 3060 GPU to predict the intention to cross for a single pedestrian. Although impressive, these models nevertheless rely on at least one, if not multiple, graphics processing unit (GPUs), which may not be feasible on commercially available ADAS hardware.
Machine learning without heavy-weight neural networks is a less computationally intensive alternative. To collect data in a controlled and safe manner, [22] analyzed virtual simulation data to predict pedestrian crossing behavior at unsignalized intersections. They focused on gap selection in nonzebra crossing scenarios and whether pedestrians used crosswalks when available using multiple factors like wait time, walk speed, etc. The neural network with only two hidden layers achieved the best accuracy of 94%. Using a distributed simulator, [23] studied pedestrian behavior at unsignalized intersections. The researchers incorporated both objective (e.g. vehicle arrival time, waiting time) and subjective factors (e.g., age, gender, sensation seeking) to train their models. The results showed that the proposed multilayer perceptron model (MLP) achieved 90% accuracy, outperforming baselines such as logistic regression and random forest. Similarly, [24] investigated the interaction between highly automated vehicles (HAVs) and pedestrians at unmarked intersections using a high-fidelity driving simulator. They analyzed factors that influence the priority of the crossing, such as time gaps, type of crossing, and individual characteristics such as sensation seeker and orientation to social value (SVO). The results show that kinematic cues (e.g., vehicle speed and time gap) outweigh psychological traits in determining pedestrian crossing behavior, which supports the use of trajectory data. Using simulated environments, these studies controlled the test scenarios. However, comparing VR and real-world behavior, [25] observed a behavioral gap in the human-vehicle interaction. Specifically, pedestrians behaved more conservatively in the VR world. They took more time to evaluate whether to cross and move slower in the actual crossing. This study suggests that research based on simulated data could be overly optimistic about pedestrian crossing behavior and would require further tuning at minimum for real-world applications.
Several studies have used machine learning methods to predict the intention of crossing with real-world data. Some of these studies collected their data from infrastructure systems, such as surveillance cameras. [26] collected naturalistic trajectories of different actors at a signalized intersection using wide angle and roadside cameras. They inferred trajectory features like speed and distance, as well as age groups, from the RGB images. The researchers reported that the support vector machine (SVM) achieved the best accuracy of 92% in predicting the probabilities of crossing. Similarly, [5] used surveillance videos to predict red-light crossing intentions. They extracted key features of the body of pedestrians, such as the angles between the ankles and knees, the elbows and shoulders, the speed of walking, and the waiting time. They achieved 92% accuracy using a random forest within a 1-second prediction window. Given that inferring trajectory data from image data could introduce considerable noise, these encouraging studies support a trajectory-based model.
Using monocular camera data, [27] created feature vectors representing the relative positions and angles of key skeletal points, then concatenated these features over time. These vectors were fed into classifiers such as random forests (RF) and support vector machines (SVM), achieving a 80% predictability for crossing intentions 750 milliseconds before the event. Similarly, [28] employed a multistep approach, detecting pedestrians through faster R-CNN, tracking them using Kalman filtering with CNN-based association, estimating skeletal poses on single images, and predicting the result using random forest. They achieved an accuracy of 88% using skeletal pose features in a 14-frame time window on the JAAD data set. The improved results suggest that position tracking is conducive to the prediction of crossing intention. Like their deep neural network counterparts, however, these approaches rely on human (skeletal) pose extraction, which can be time consuming and susceptible to exclusion.
[3] leveraged a combination of visual and contextual cues. They extracted the orientation of the head of the pedestrian and the movement trajectory from the JAAD dataset. By integrating environmental factors such as the presence of crosswalks and traffic signals, the CNN feature extractor plus SVM classifier achieved 90% accuracy in predicting crossing intentions. [29] proposed a method that only relies on contextual cues such as road edges, sidewalks, and waiting areas. They achieved 90% accuracy using a support vector machine (SVM) with a radial basis function (RBF) kernel. Despite crudeness (zebra crossing is a binary variable in the study of [3]) and brittleness ( [29] did not address how relative motion would affect the motion history image) of some of the contextual characteristics, these studies highlight the potential of environmental information.
[30] demonstrated the power of an unobstructed view. Using drone-captured naturalistic driving data, they achieve 98% accuracy in predicting crossing intention up to 3 seconds using random forest algorithm (RF). The input features are simple and minimal: pedestrian position, velocity and heading, as well as a derived distance to the road. Admittedly, car-centric views are subjected to occlusions,which complicates the prediction task, but this study shows trajectory data, combined with simple contextual information could be very powerful.
[31] collected naturalistic trajectories of different actors using RGB camera and lidar data, and classified pedestrians as crossing or noncrossing using automated analysis. They utilized hand-crafted features, e.g. distance to road boundary, relative speed, and distance between pedestrians and vehicles, as well as lidar-based image data as model input. The researchers reported that light-weighted NN achieved up to 96% accuracy, outperforming SVM by 10-20%. However, this study is limited to nonintersection scenarios, whereas our work focuses on unsignalized intersections.
This research aims to address the prediction of pedestrian crossing intentions at unsignalized intersections, a challenging case for using autonomous vehicles. Furthermore, this research attempts to do so using affordable and computationally efficient methods. Unlike previous works that rely heavily on deep learning models with GPU acceleration or time-consuming skeletal pose estimation, this study aims to determine whether classical machine learning techniques or lightweight neural networks can achieve competitive accuracy using primarily trajectory data and a limited set of contextual features. To isolate the prediction task, this research assumes a well-functioning pedestrian detection and tracking system. This study proposes to use aerial trajectory data, which is then transformed into a car-centric perspective while accounting for occlusions and limited sensing range, allowing for a controlled yet realistic examination of the problem. The core hypothesis of this study is that pedestrian crossing intention at unsignalized intersections can be predicted with high accuracy using only trajectory-based features and minimal contextual information. This hypothesis posits that a simpler, more efficient approach could be viable for real-time applications on cost-effective Advanced Driver Assistance Systems (ADAS) hardware.
Furthermore, this research introduces an idealized scenario by leveraging aerial trajectory data, which is then transformed into a car-centric perspective while accounting for occlusions and limited sensing range. This methodological shift allows for a controlled yet realistic examination of the problem, isolating the role of trajectory-based predictions under the assumption of a well-functioning pedestrian detection and tracking system. The core hypothesis of this study is that pedestrian crossing intention at unsignalized intersections can be predicted with high accuracy using only trajectory-based features and minimal contextual information, without requiring computationally expensive deep-learning architectures. This hypothesis examines the possibility that a simpler, more efficient approach could be viable for real-time applications on cost-effective Advanced Driver Assistance Systems (ADAS) hardware.
3. The inD Drone Dataset
This study leverages the public inD dataset provided by [16], a collection of naturalistic road-user trajectories recorded at four unsigned intersections in Aachen, Germany: Bendplatz, Frankenburg, Heckstraße, and Neuköllner Straße. All four sites are intersections with no traffic lights, an ideal setting for studying unsignalized pedestrian behavior. Geometry varies from three-legged T-junctions (Heckstraße, Neuköllner Straße) to four-legged crossings (Bendplatz, Frankenburg) and includes features such as zebra crossings, traffic islands, bus bays, and on-street parking. Drones equipped with 4K cameras hovered up to 100 m above the scene and captured 10 hour of traffic video at 25 Hz, eliminating ground-level occlusions while remaining inconspicuous to road users. Automated semantic segmentation and tracking pipelines convert these videos into pixel-accurate trajectories for five classes: pedestrians, cyclists, cars, buses, and trucks.
In total, there are 33 video segments: 11 on Bendplatz, 12 on Frankenburg, 7 on Neuköllner Straße, and 3 on Heckstraße. Each recording provides: a georeferenced orthophoto background (.png) and three comma-separated value (.csv) files containing recording metadata, per track metadata, and frame state tuples . The spatial quantities are expressed in a local metric coordinate frame tied to the drone image. Physical meters can be converted to pixel units in the downsample background image using two dataset-level calibration constants: orthoPxToMeter = 0.01269 and scale_down = 12, producing an effective scale of 6.5 px per meter.
The inD dataset is well suited for this study for three reasons. Its overhead, high-resolution view offers unobstructed, metrically accurate trajectories, simplifying car-centric transformation and enabling precise distance-to-curb and occlusion queries. It captures unsignalized crossings, where pedestrian decisions hinge on vehicle kinematics—precisely the cues targeted by our lightweight model. Finally, its rich metadata and consistent calibration support allow efficient, vectorised processing without sacrificing accuracy.
4. Data Processing
4.1. Identify Interesting Pedestrians
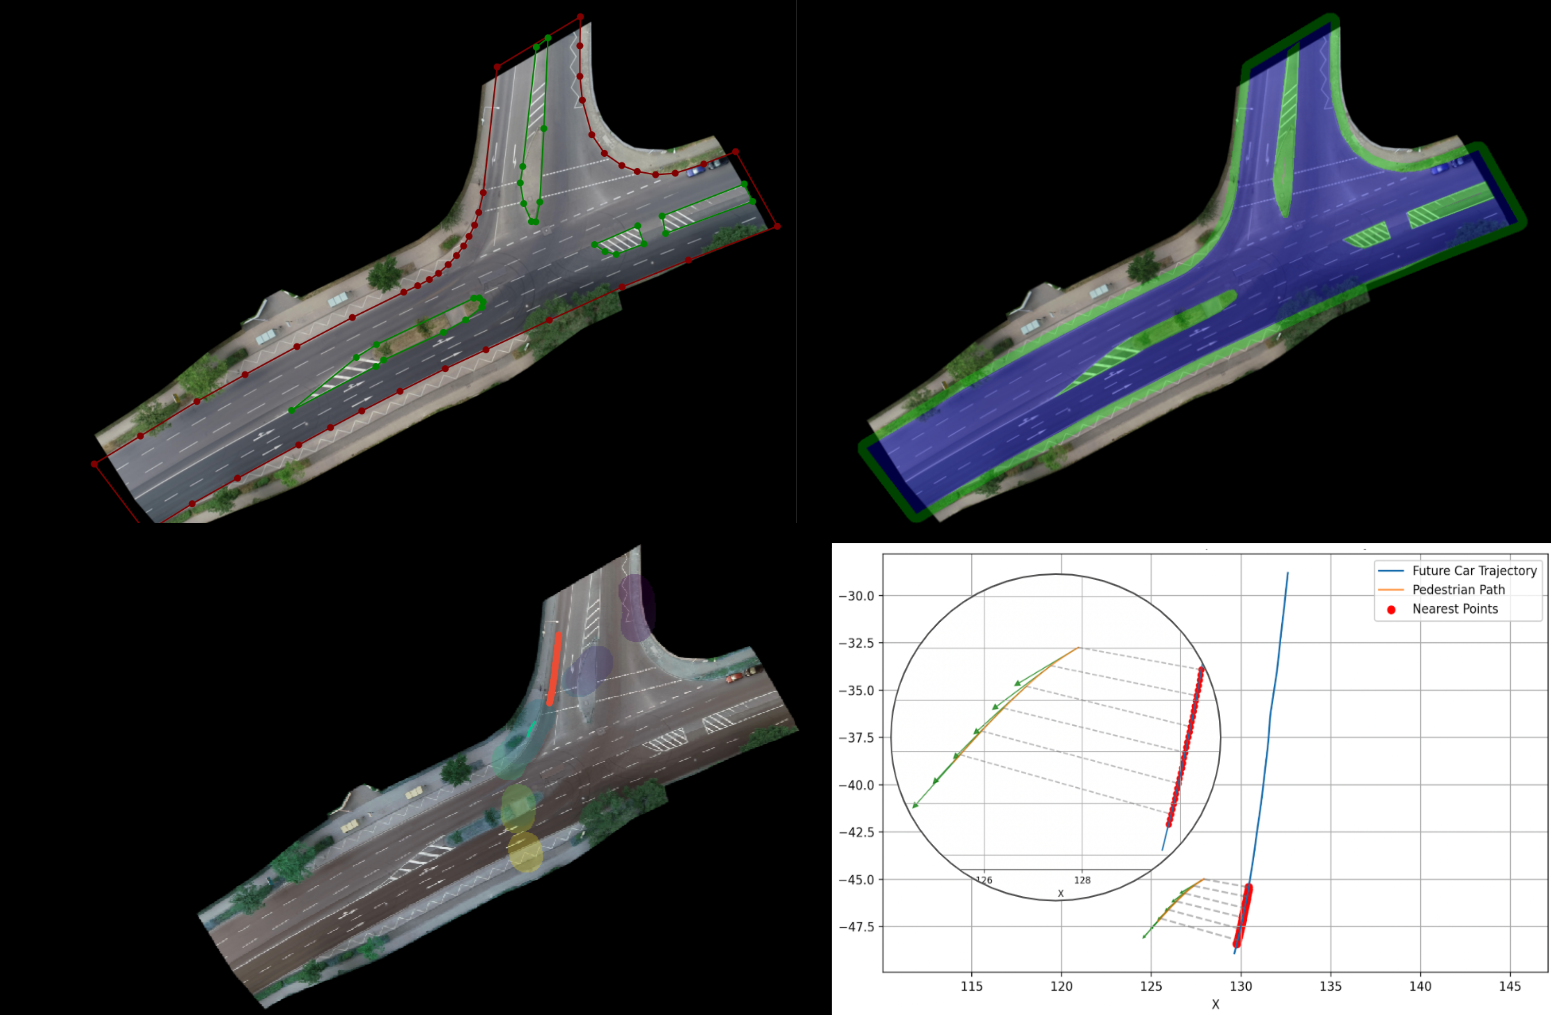
The initial phase involves identifying pedestrians with the potential intention of crossing the street. To facilitate this, the 33 overhead images from the inD dataset were manually annotated using LabelMe, a graphical image annotation tool. These annotations, carried out and reviewed for consistency by the author, delineate the drivable areas and distinguish them from nondrivable regions such as traffic islands. Importantly, marked parking spaces, construction zones, hatched road markings, and other regions where vehicular movement is discouraged are explicitly classified as nondrivable. Figure 1 provides an example of the nondrivable regions and drivable area. Note that the drivable area polygon is extended beyond the background to mitigate potential boundary effects in subsequent analyses.
A pedestrian is defined as of interest to this study if they are located within 2 meters of the annotated drivable boundary but not on the drivable area yet. This threshold is deliberately conservative to restrict the region of interest, thereby reducing computation costs if the algorithm were to be deployed on a resource-limited advanced driver assistance system. Figure 2 illustrates a representative example of such a trajectory. These are referred to throughout the study as interesting pedestrian trajectories.
In terms of data preparation and implementation, the inD data set provides detailed metadata for each trajectory, including categorical labels (e.g. cars, pedestrians, buses, trucks, and bicycles) that are associated with each track via unique track IDs. For the purposes of this study, we retain only the trajectories corresponding to cars and pedestrians, as these are central to the crossing intention prediction task.
Each track contains positional information represented in a physical two-dimensional (x, y) coordinate system specific to the recording site. Although these physical coordinates are essential for understanding real-world spatial relationships, a lot of the postprocessing steps in this work are conducted in the image coordinate space instead. This transformation is motivated by the need to enable efficient vectorized operations, which considerably accelerate the computation required for large-scale data processing. Although conversion from physical to image coordinates results in some loss of precision due to quantization, this compromise is justified by the significant computational benefits.
It is important to clarify that this transformation does not replace the physical coordinates; instead, image-space coordinates are computed solely for processing efficiency, while velocities and positions remain available in the original physical coordinate system for use when needed. The conversion from physical coordinates to image coordinates is governed by the following equations:
- :
- physical coordinates of the object center in meters.
- r:
- the orthoPxToMeter scaling factor, which converts pixel units to meters.
- s:
- the downsampling factor applied to match the resolution of the background image.
The inD data set provides two key calibration parameters for each of its four distinct recording sites: orthoPxToMeter and scale_down. These parameters are critical for accurately interpreting spatial measurements from aerial imagery. Specifically, the orthoPxToMeter value is given as 0.01269, indicating that approximately 78 pixels correspond to one physical meter in the orthorectified image space. Meanwhile, the background imagery used in the dataset has been downsampled by a factor of 12 to reduce file size. As a result, the effective scale in the processing becomes approximately 6.5 pixels per meter.
It is also important to note a coordinate system discrepancy that affects the transformation between camera and physical-world coordinates. In the camera coordinate system, the z-axis conventionally points downward, aligning with the optical axis of the camera. In contrast, physical-world coordinate systems typically define the z-axis as pointing upward. As a result, a sign flip is required, most notably in the y component, when converting between these coordinate frames to ensure consistency with real-world spatial orientation. To identify pedestrian trajectories of interest, we begin by loading manually annotated polygons that delineate the drivable area, hereafter referred to as the drivable mask. To account for spatial proximity to the roadway, we construct a buffered mask by outwardly inflating each drivable polygon by 13 pixels, corresponding to approximately 2 meters in the real world. The buffered mask generation procedure, detailed in Algorithm 1, involves dilating the drivable mask and subtracting an eroded version of the island (nondrivable) mask from the result, thereby isolating the near-road region. Figure 3 illustrates an example of a drivable mask in blue and a buffered mask in green.
Pedestrian trajectories are deemed interesting if they fall within the buffered mask but lie outside the drivable mask, that is, they are near, but not directly on, the drivable area. This spatial filtering process is implemented in a vectorized form to ensure computational efficiency.
| Algorithm 1:Generate Buffered Mask () and Drivable Mask () |
|
Require: labelled polygons L, image size , buffer radius r Ensure: 1: 2: FillPoly FillPoly 3: EllipseKernel 4: Dilate(FillPoly) 5: Erode(FillPoly) 6: 7: return |
4.2. Identify Interacting Cars
With the interesting pedestrian trajectories determined, the next step is to detect scenarios where interactions between pedestrians and vehicles are likely to occur. Specifically, our goal is to find instances in which a vehicle arrives at or passes near a location shortly after a pedestrian has visited it, signaling a potential crossing event that warrants the vehicle’s attention. However, performing an exhaustive comparison between every pedestrian and vehicle trajectory is computationally prohibitive. To address this, we exploit the spatio-temporal structure of the data within the image coordinate space to accelerate the search process.
For each pixel that falls within a defined radius of a pedestrian trajectory, we record two temporal masks: the earliest and latest timestamps when a pedestrian was present near that location. These form two spatio-temporal masks: the lower mask (earliest visit time) and the upper mask (latest visit time). Using these masks, candidate vehicle trajectories are filtered based on whether they intersect the temporal window defined in a given pixel . The radius, corresponding to approximately 4 meters in real-world distance, is selected to encompass both half of a typical lane width (4 meters) and the proximity threshold (2 meters) used to identify relevant pedestrian trajectories near the drivable area.
where:
- : upper mask (latest visit time)
- : lower mask (earliest visit time)
- : "comes no later than" threshold (in seconds)
- : "comes no earlier than" threshold (in seconds)
- f: frame rate (frames per second)
The time window defined above ensures that vehicle–pedestrian interactions are temporally meaningful: the vehicle must arrive sufficiently after the pedestrian has passed through a location to allow for a possible reaction, but not so late that the interaction becomes irrelevant. Using spatial information, specifically the overlap between pedestrian and vehicle trajectories, we identified vehicle tracks that could plausibly interact with selected pedestrian trajectories. However, by definition, the corresponding vehicle time intervals occur after the pedestrian has already completed the crossing. The downstream prediction tasks require a synchronized temporal context between the vehicle and the pedestrian. A straightforward approach to address this issue is to define as the common time window for the potential interaction trajectories of pedestrians and vehicles.
Although this definition of is often appropriate, the naive setting of can include trajectory segments where the vehicle has already passed the pedestrian’s location, scenarios that are no longer relevant for the prediction of intentions. To correct for this, we refine to be the earliest time at which the vehicle trajectory intersects the upper mask. Furthermore, we exclude vehicles whose maximum absolute velocity remains below 0.05 m/s over the interval , as these typically correspond to parked or stationary vehicles and do not constitute meaningful dynamic interactions. Figure 4 illustrates a segment of an identified noncrossing pedestrian trajectory walking around a curbside (solid green), along with the corresponding trajectory of an incoming vehicle (solid red).
4.3. Annotate Crossing Label
The final step is to assign a binary crossing label to each pedestrian. Crucially, we only consider a pedestrian as having the intention to cross if their future trajectory intersects that of an oncoming vehicle. To operationalize this, a crossing label is assigned as true only if all three of the following conditions are met:
- The pedestrian is located within the drivable area at frame ;
- The latest time at which the pedestrian’s trajectory intersects (within a 4-meter radius) the vehicle trajectory is ;
- The earliest time at which the vehicle’s trajectory intersects the pedestrian’s trajectory is also .
This heuristic enforces a spatial sequence through temporal constraints: the pedestrian is considered crossing only if their trajectory intersects the anticipated future path of the interacting vehicle. These temporal conditions are designed to eliminate cases where the pedestrian crosses a lane not related to the future path of the vehicle, such as crossing Lane A from an island while a vehicle later passes through the opposite Lane B. The temporal offset of +5 frames is selected to approximate the moment the pedestrian first steps into the drivable area, while also accommodating brief hesitation or waiting behavior that often precedes an actual crossing attempt.
Despite its practicality, this heuristic approach is inherently imperfect and susceptible to labeling errors. For example, if a pedestrian steps briefly off the curb and then returns to the sidewalk without a genuine intention to cross, the algorithm may still incorrectly classify the event as a crossing. To mitigate such misclassifications, all initial labeled crossing events are subjected to manual verification through visual inspection. This process is carried out using a dedicated visualization tool available on GitHub provided by [32]. Corrections are made where necessary to ensure the reliability of ground-truth labels used in model training and evaluation.
4.4. Simulating Realistic Constraints
Having identified candidate events in which a pedestrian may plausibly interact with a nearby vehicle, we further refine the data set to better reflect the practical sensing and computational constraints faced by real-world Advanced Driver Assistance Systems (ADAS). In operational contexts, it is neither necessary nor computationally viable for an autonomous vehicle to assess the intention of crossing for all pedestrians in view. Instead, we adopt a localized attention model, assuming that the vehicle only considers pedestrians within 4 meters of its current position and projected trajectory over the subsequent 5 seconds.
This assumption aligns with common practices in autonomous driving, where the ego vehicle typically has access to its planned short-term trajectory. Such trajectories are generated by motion planning or prediction modules that incorporate semantic understanding of the environment, including road layout and drivable areas. The semantic context can be derived either through offline map construction combined with online map matching or through real-time semantic segmentation techniques. Notably, these modules can operate at low update rates (e.g., 1 Hz) in background threads, thus imposing minimal computational burden.
By restricting the prediction space to pedestrians in close proximity to the future path of the ego vehicle, the model naturally excludes cases such as pedestrians on the far side of the road or more than one lane away. We argue that this simplification is not only computationally efficient but also behaviorally justified. Pedestrians in such positions would need to cross at least one lane before intersecting the vehicle’s path, affording the system a reaction window even without proactive intention prediction. In contrast, pedestrians approaching from the near side pose a more immediate risk, necessitating timely forecasting and intervention. Consequently, all observations involving pedestrians located more than 4 meters from the current or projected path of the ego vehicle (in the next 5 seconds) are excluded from the data set.
Further adjustments are made to simulate realistic sensor capabilities. Although the inD dataset provides high-frequency trajectory data at 25 Hz, typical onboard sensors such as radar and lidar operate at lower frequencies. To reflect this, we downsample the data to 10 Hz by interpolating observations at 0.1-second intervals. Additionally, only agents within 100 meters of the ego vehicle are retained, as trajectories beyond this range are often unreliable due to sensor limitations. Given that most pedestrian-vehicle interactions occur within this distance, no further filtering is applied.
Lastly, we account for potential occlusions in the vehicle’s line of sight. If another vehicle is placed between the center of the ego vehicle and the target pedestrian, the observation is marked as occluded and excluded from the data set. These filtering steps collectively yield a naturalistic subset of trajectory data that approximates what an autonomous vehicle could realistically perceive and process within its onboard sensing and planning pipeline.
4.5. Processed Data Summary
After applying the data filtering and event selection criteria, the final data set comprises 10,628 observations that correspond to 687 unique pedestrian–vehicle interaction events at unsignalized intersections. These events collectively span approximately 16 minutes of recorded activity. In particular, the distribution of events is highly uneven across recording sites. Most of the interactions, approximately 60% of all observations, originate from Frankenburg, a residential area adjacent to a park that is known to attract substantial pedestrian and bicycle traffic. In contrast, significantly fewer events were captured at Bendplatz and Neuköllner Straße, while Heckstraße in Aachen yielded virtually no relevant crossing events. It is important to clarify that multiple crossings by the same pedestrian within a single recording session are treated as distinct events, provided that each crossing involves a potential interaction with an oncoming vehicle. For example, if a pedestrian first crosses a median island and then proceeds to the opposite side of the street, each crossing is counted as an independent interaction event.
5. Feature Extraction
5.1. Cutting Momentum
Following the post-processing of the data, we proceed to the feature extraction stage. In this study, we introduce a novel hand-made feature called cutting momentum, specifically designed to capture directional pedestrian behaviors indicative of potential road crossing. The feature is computed recursively using the following formulation.
As demonstrated in Figure 5, represents the cutting velocity in time t, defined as the inner product between the pedestrian’s velocity vector and a unit vector pointing from the current position of the pedestrian to the closest point on the future trajectory predicted by the ego vehicle. The future trajectory is constructed by fitting a spline through a sequence of planned waypoints.
The intuition behind cutting momentum is to quantify how much of a pedestrian’s movement is oriented toward intersecting the predicted vehicle path. This reflects the potential intention of a pedestrian to cross in front of the vehicle. Unlike simple geometric heuristics, this feature encodes directional alignment and temporal consistency, making it a more informative and dynamic indicator of crossing behavior.
By computing the cutting momentum recursively, the feature retains a short-term memory of past pedestrian behavior. This design is computationally efficient, enabling the model to infer intent even from a single frame while smoothing over transient noise in velocity estimates. In particular, the feature is defined in a car-centric coordinate system, which makes it invariant to pose drift and is well suited for onboard, real-time computation. As the ego vehicle’s future trajectory is updated (e.g., through replanning), the cutting momentum can be recalculated without reliance on a fixed world frame.
Empirical analysis further supports the utility of this feature. In Figure 6, the distribution of the cutting momentum values is visualized for pedestrian crossing versus noncrossing pedestrians, a clear separation is observed. This indicates that cutting momentum provides strong discriminative power and serves as a valuable input for downstream intent prediction models.
5.2. Ego longitudinal Velocity and Time-to-Collision
Building on prior findings ([13], [12], that a pedestrian’s crossing behavior is influenced by both the distance to an approaching vehicle and the vehicle’s traveling speed, this study incorporates the longitudinal velocity of the ego vehicle and the time to collision (TTC) as predictive features. These variables are intended to quantify the perceived level of risk from the pedestrian’s point of view: specifically, the urgency or feasibility of crossing in front of the ego vehicle given its speed and distance. Intuitively, a slower moving vehicle may signal a lower-risk opportunity to cross, whereas a faster vehicle may deter such behavior.
Figure 7 illustrates the distribution of longitudinal velocity for crossing versus noncrossing pedestrians. In contrast to the cutting momentum feature, which exhibited clear class separation, the longitudinal velocity distributions show substantial overlap. However, a trend can be observed: pedestrians are more inclined to initiate a crossing when the ego vehicle is moving at a lower longitudinal velocity and are correspondingly more hesitant when the vehicle speed is higher, in accordance with risk-averse behavior.
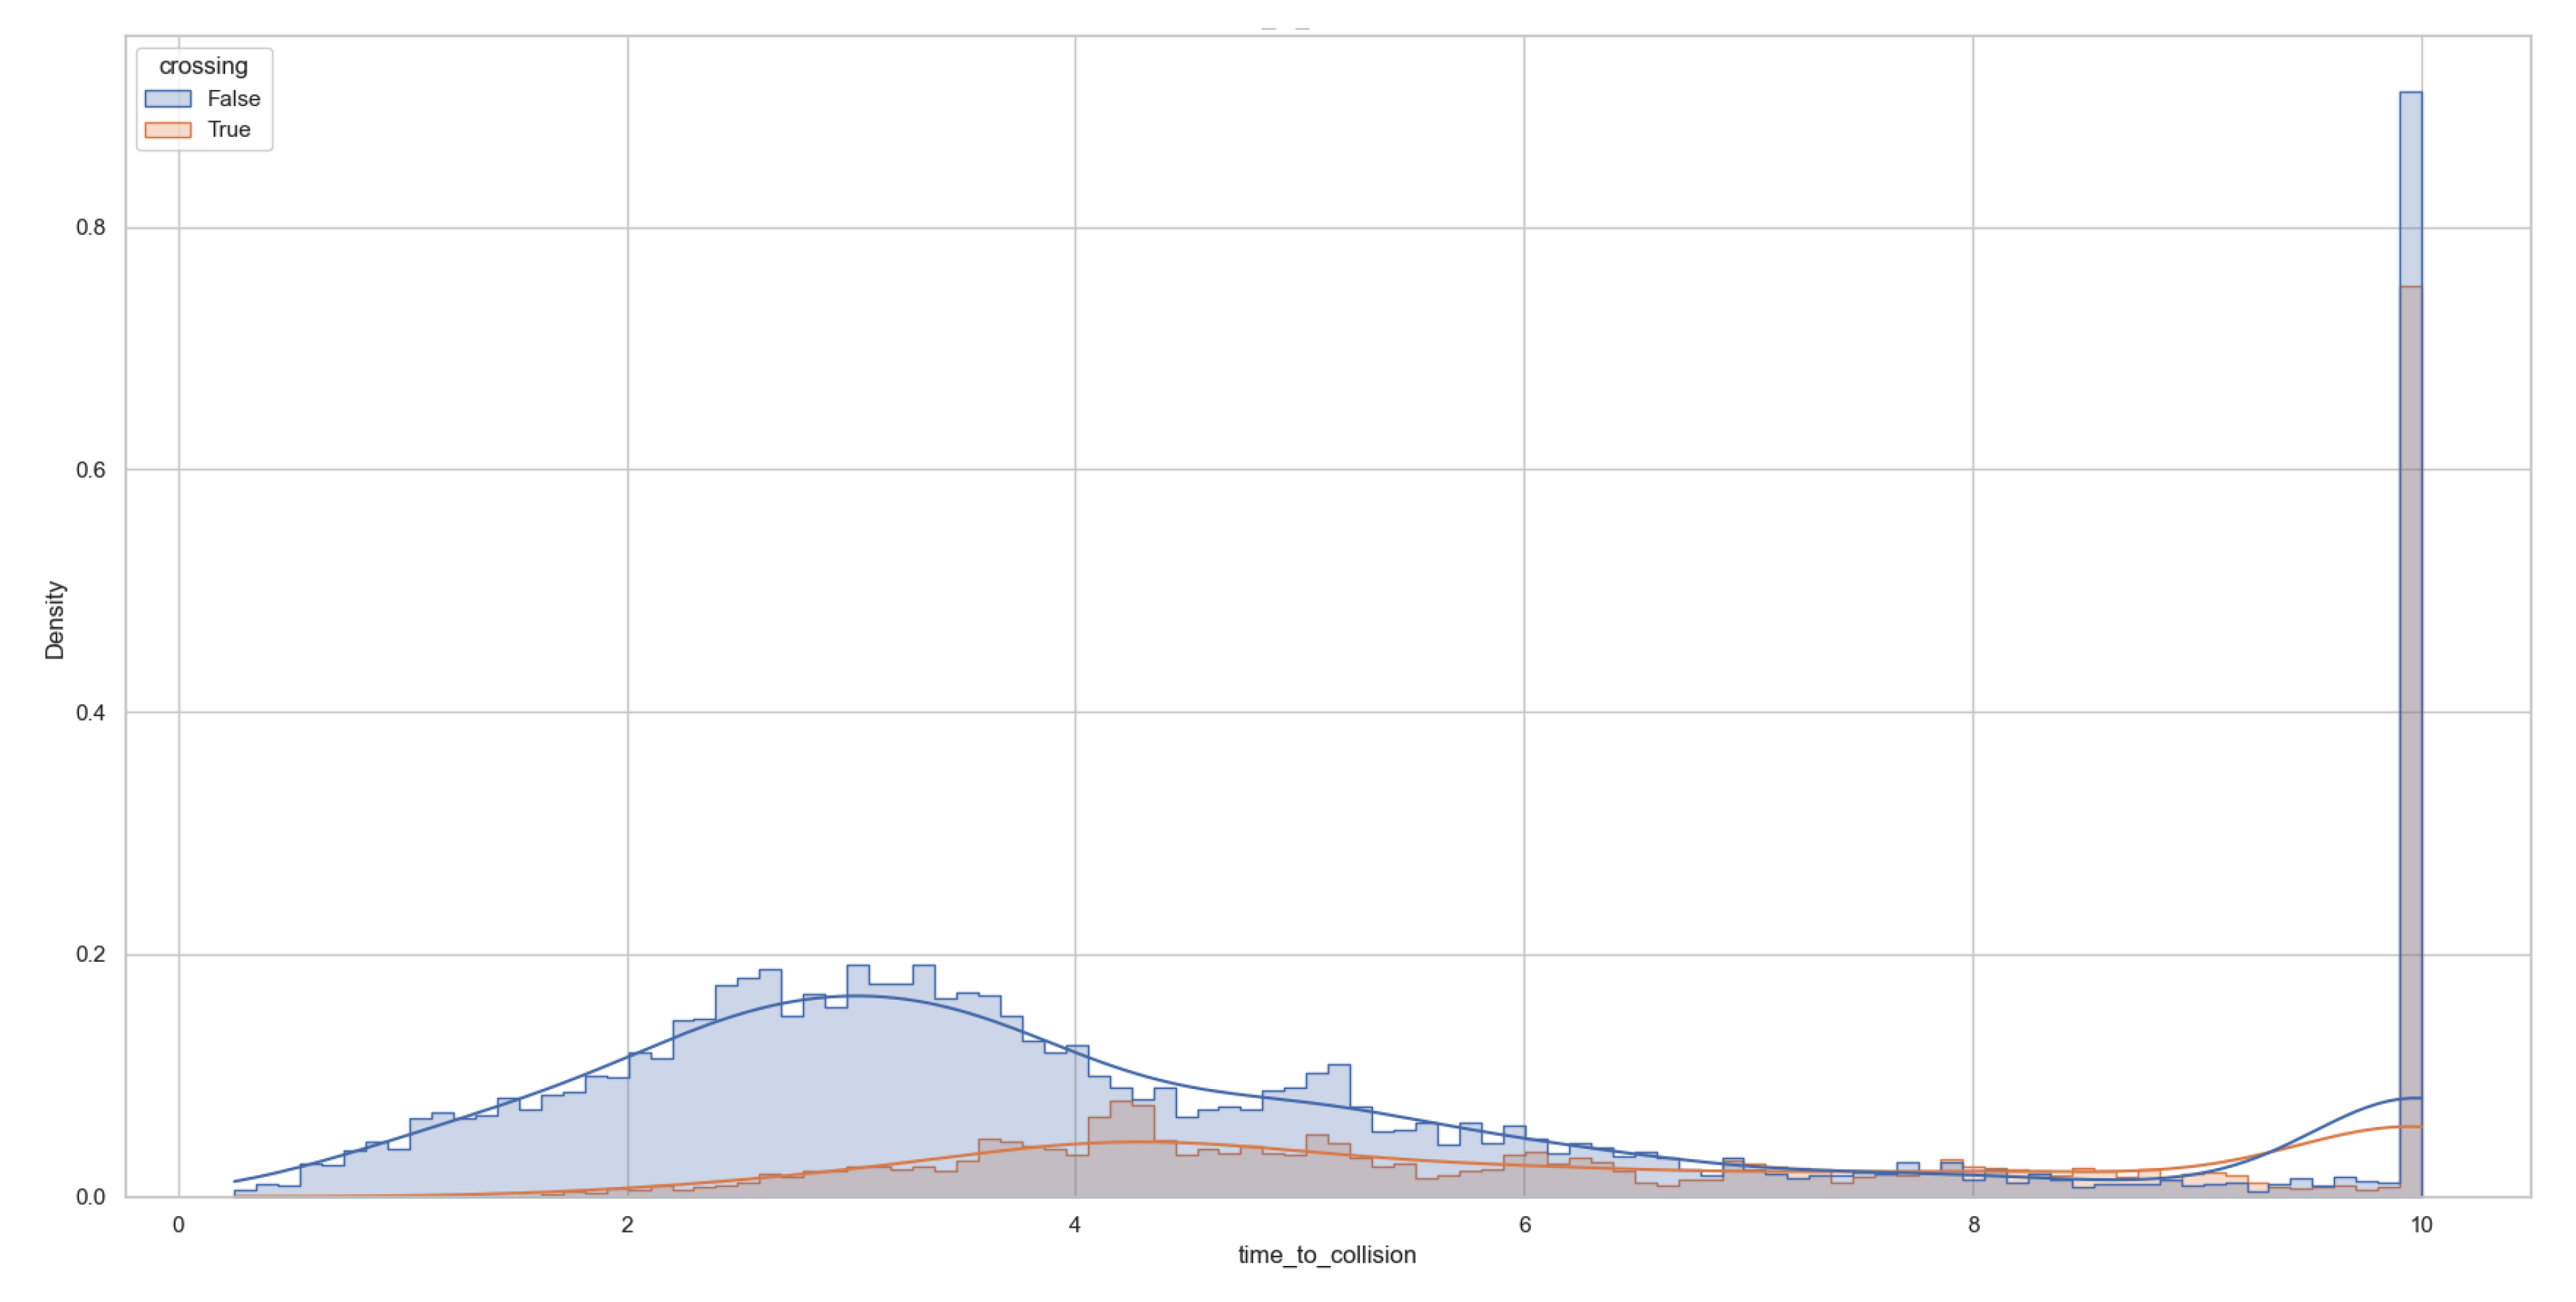
To further capture the temporal dynamics of vehicle-pedestrian interaction, the time to collision is calculated as the relationship of distance to the longitudinal velocity of the ego vehicle. In particular, the distance here is not defined as a simple Euclidean measure but as the accumulated length of the path along the future trajectory of the ego until the point closest to the target pedestrian. This approach yields a more behaviorally relevant and geometrically accurate estimate of collision timing. As shown in Figure 8, the TTC distribution also exhibits considerable overlap between crossing and noncrossing events. However, a critical pattern emerges: virtually no crossing events occur when the TTC is less than two seconds, suggesting that pedestrians are highly unlikely to initiate crossing under conditions of imminent collision risk.
6. Methods and Results
6.1. Random Forest Classification
After extracting the relevant characteristics, this study used a random forest classifier to predict pedestrian crossing intentions. To evaluate model performance, a temporal split strategy was adopted: 7 of the 33 trajectory recordings were uniformly sampled from 3 recording sites (Bendplatz, Frankenburg and Neukollner Strasse) and kept as a test set, while the remaining 25 were used for training. This approach is critical to ensure the temporal independence of the training and testing data. A common but flawed practice is to randomly sample individual observations across the entire dataset for testing. However, such sampling overlooks the strong temporal correlation between nearby frames in a trajectory, effectively allowing the model to be tested on patterns it has already seen during training. This can lead to overly optimistic performance estimates.
The Random Forest classifier was implemented using scikit-learn’s default hyperparameter, with the number of decision trees (estimators) set to 30. To assess robustness and minimize the effect of randomness, the training and evaluation process was repeated five times using different random seeds. For each run, key performance metrics were recorded, including accuracy, standard deviation, precision, recall, and the confusion matrix. The precision, recall and confusion matrix reported in Table 1 corresponds to the run with the median accuracy in the five trials, providing a representative estimate of the performance of the model.
6.2. Aggregated Performance
Across the five repetitions, the RF achieved a mean accuracy of 0.918 ± 0.003. The representative confusion matrix (Table 1) reveals 450 true positives (TP) versus 54 false positives (FP), resulting in an overall precision of 89%, while the comparatively large pool of 509 false negatives (FN) limits the recall to 47%. The abundance of negatives in the data set (TN = 1322) explains why accuracy remains high despite modest sensitivity.

Table 1.
Confusion Matrix and Classification Metrics for Pedestrian Crossing Intention Prediction Using Random Forest (Median Performance Across 5 Runs)
Table 1.
Confusion Matrix and Classification Metrics for Pedestrian Crossing Intention Prediction Using Random Forest (Median Performance Across 5 Runs)
| Confusion Matrix | |
|---|---|
| True Positives (TP) | 450 |
| False Positives (FP) | 54 |
| False Negatives (FN) | 509 |
| True Negatives (TN) | 1322 |
| Evaluation Metrics | |
| Average Accuracy | 0.918 |
| Standard Deviation of Accuracy | 0.003 |
| Precision | 89% |
| Recall | 47% |
6.3. Site-Wise Leave-One-Location-Out Evaluation
To investigate the model’s ability to generalize across different scenarios - a crucial criterion for real-world deployment in unseen environments - we performed a site-wise leave-one-location-out evaluation. In this setup, each of the three locations was held in turn as the test set, while the remaining two sites were used for training. To ensure robustness, each split was repeated five times, and the averaged results are reported in Table 2.
The performance landscape highlights substantial variability between sites, reflecting differences in intersection geometry, pedestrian behavior, and possibly local traffic standards. Neuköllner Straße emerges as the most predictable environment, achieving the highest accuracy (0.966 ± 0.011) and recall (0.870). This suggests that pedestrian behaviors at this location are less variable or more prototypical, allowing the model trained at other sites to generalize well and successfully detect most true crossing instances.
In contrast, Frankenburg presents a more challenging test case. Although it records the lowest accuracy (0.894 ± 0.002), it also yields the highest precision (0.934), implying that the model is highly conservative: when it predicts a pedestrian will cross, it is usually correct, but it tends to underpredict crossing events, as reflected in a lower recall (0.763). This pattern may indicate subtle behavioral cues that are underrepresented in the training data or a more complex decision-making process among pedestrians at this site.
Bendplatz occupies a middle ground, with a balanced performance profile: an accuracy of 0.924 ± 0.003, a precision of 0.682, and a recall of 0.771. These figures suggest a more equitable trade-off between false positives and false negatives, possibly due to intersection features that share moderate similarity with both training sites.
Overall, these results underscore that the proposed feature set, combined with a lightweight Random Forest (RF) architecture, offers a promising degree of spatial transferability. However, the observed site-dependent variation also points to the influence of local context, such as intersection morphology, pedestrian flow patterns, and environmental conditions, on model performance. For practical deployment, these findings advocate adaptive modeling techniques or the inclusion of additional context-sensitive features to mitigate performance degradation in novel locations.
Table 2.
Site-wise Performance Metrics and Confusion Matrices.
| Site | Accuracy | Std | Precision | Recall | TP, FP, FN, TN |
|---|---|---|---|---|---|
| Neuköllner Straße | 0.966 | 0.011 | 0.719 | 0.870 | (100, 39, 15, 1721) |
| Bendplatz | 0.924 | 0.003 | 0.682 | 0.771 | (101, 47, 30, 822) |
| Frankenburg | 0.894 | 0.002 | 0.934 | 0.763 | (1637, 115, 509, 3611) |
6.4. Event-Level Evaluation for High-Precision ADAS Predictions
In the domain of Advanced Driver Assistance Systems (ADAS), ensuring safety while preserving user trust requires a cautious approach to the prediction of intentions. A particularly critical requirement is the elimination of false positives, as even occasional false alarms in semi-autonomous scenarios—where human drivers remain in the control loop—can lead to reduced system credibility, user confusion, and eventual disengagement. This evaluation emphasizes the achievement of precision 100%, with the goal of minimizing false alerts, even at the cost of reduced recall.
To meet this objective, we implement a stricter event-level decision rule that enhances temporal consistency in model predictions. Specifically, an event is classified as positive only if the model outputs 10 consecutive positive predictions within a predefined observation window. Events that do not meet this threshold are classified as negative. A true positive is recorded when a pedestrian eventually crosses, and the model satisfies the 10-frame consistency requirement. This method effectively suppresses transient prediction noise, often originating from sensor variability or ambiguous pedestrian movement, which otherwise would compromise the reliability of real-time ADAS systems.
Unlike previous sections where performance is evaluated per frame basis, the metrics reported here, accuracy and confusion matrix components, are computed at the event level to better reflect practical decision-making contexts in deployed systems. In this formulation, the model achieved perfect precision (0 false positives) and a recall of 37.8% (17 true positives, 28 false negatives), with 107 true negatives and an overall event-level accuracy of 81.6% on the test set of 152 events. The training set comprised 535 annotated events. In particular, both training and test events were sampled uniformly at all three sites to avoid site-specific biases.
6.5. Failure Modes
One of the most common failure modes of the proposed model involves pedestrians who wait at the curbside. It is not unusual for pedestrians to approach the edge of the roadway and pause to observe oncoming traffic before deciding whether to cross. These individuals may remain stationary for several seconds, creating a trajectory pattern that is difficult to interpret. From a modeling perspective, distinguishing between crossing and noncrossing intentions in such scenarios proves challenging, particularly when pedestrians exhibit prolonged waiting behavior. Although waiting time was explicitly included as a feature, it contributed little to no improvement in predictive performance. Furthermore, commonly used trajectory-based methods, such as time-to-collision and vehicle longitudinal velocity, also failed to reliably capture the intentions of these stand-by pedestrians. These limitations suggest that pedestrian behavior in such contexts may be influenced by latent factors such as individual risk tolerance; for example, some pedestrians may choose not to cross in the presence of an approaching vehicle, while others may proceed under identical traffic conditions.
7. Discussion
This study contributes to the growing body of research on the prediction of pedestrian crossing intentions by addressing several key limitations of previous work. The existing literature predominantly relies on image-based datasets such as PIE and JAAD, emphasizing high-dimensional visual features and the estimation of skeletal pose from monocular cameras. These approaches often neglect the potential of commonly available ADAS sensors, such as radar and lidar, which can directly provide motion-related features such as speed and relative distance. In contrast, this work demonstrates that trajectory-based features accessible through such sensors, when combined with lightweight machine learning models, can achieve strong predictive performance without requiring GPU acceleration or deep learning architectures.
A second contribution lies in the proposed data processing pipeline, which transforms drone-captured bird’s-eye-view trajectories into a car-centric frame of reference while simulating realistic sensing constraints, such as occlusion and limited field of view. Compared to drone-based approaches that focus on pedestrians and report higher accuracy (for example 98% in [30]), this study adopts a car-centric perspective, focusing on pedestrians near the future path of the ego vehicle. As a result, ambiguous cases, such as pedestrians waiting at the curb, pose greater challenges and lead to lower reported accuracy (92%). However, the presented framework aligns more closely with practical ADAS deployment scenarios and offers better insight into real-time decision making.
Despite its contributions, the approach has limitations. It assumes access to the short-term future trajectory of the ego vehicle, which in practice requires prior map information or low-frequency semantic perception. The model also excludes other road users, such as cyclists, trucks, and buses, limiting its applicability in more diverse traffic settings. Additionally, while ground-truth labels were manually verified, reliance on spatial heuristics for labeling crossing behavior may still introduce edge-case ambiguities.
Future extensions could incorporate semantic context—such as zebra crossings or curb design—into the feature set to improve performance, especially in ambiguous situations. Lightweight perception modules or map-based overlays could provide this information with minimal computational overhead. Expanding the framework to include diverse agent types and modeling interactions in more complex, multimodal traffic environments also presents a promising direction to improve generalizability.
8. Data Availability
The original inD dataset is publicly available and can be requested through the official website maintained by the creators at https://levelxdata.com/ind-dataset/.
9. Code Availability
The full codebase for data preprocessing, feature extraction, and model training is available at https://github.com/Dung-Han-Lee/ped-crossing-intention.
References
- Google. Disengagements of Autonomous Mode, 2015. Available online: https://www.scribd.com/document/306327663/Report-Annual-15.
- Domeyer, J.E.; Lee, J.D.; Toyoda, H.; Mehler, B.; Reimer, B. Interdependence in Vehicle-Pedestrian Encounters and its Implications for Vehicle Automation. IEEE Transactions on Intelligent Transportation Systems 2022, 23, 4122–4134. [Google Scholar] [CrossRef]
- Varytimidis, D.; Alonso-Fernandez, F.; Duran, B.; Englund, C. Action and Intention Recognition of Pedestrians in Urban Traffic. In Proceedings of the 2018 14th International Conference on Signal-Image Technology & Internet-Based Systems (SITIS), 2018, pp. 676–682. [CrossRef]
- Cai, J.; Wang, M.; Wu, Y. Research on Pedestrian Crossing Decision Models and Predictions Based on Machine Learning. Sensors 2024, 24, 258, (This article belongs to the Topic 3D Computer Vision and Smart Building and City, 2nd Volume). [Google Scholar] [CrossRef] [PubMed]
- Zhang, S.; Abdel-Aty, M.; Wu, Y.; Zheng, O. Pedestrian Crossing Intention Prediction at Red-Light Using Pose Estimation. IEEE Transactions on Intelligent Transportation Systems 2022, 23, 2331–2339. [Google Scholar] [CrossRef]
- Wang, C.Y.; Bochkovskiy, A.; Liao, H.Y.M. YOLOv7: Trainable Bag-of-Freebies Sets New State-of-the-Art for Real-Time Object Detectors 2023. pp. 7464–7475. [CrossRef]
- Kalman, R.E. A new approach to linear filtering and prediction problems. Transactions of the ASME–Journal of Basic Engineering 1960, 82, 35–45. [Google Scholar] [CrossRef]
- Rasouli, A.; Kotseruba, I.; Tsotsos, J.K. Understanding pedestrian behavior in complex traffic scenes. IEEE Transactions on Intelligent Vehicles 2018, 3, 61–70. [Google Scholar] [CrossRef]
- Gorrini, A.; Crociani, L.; Vizzari, G.; Bandini, S. Observation results on pedestrian-vehicle interactions at non-signalized intersections towards simulation. Transportation Research Part F: Traffic Psychology and Behaviour 2018, 59, 269–285. [Google Scholar] [CrossRef]
- Wang, T.; Wu, J.; Zheng, P.; McDonald, M. Study of pedestrians’ gap acceptance behavior when they jaywalk outside crossing facilities. In Proceedings of the 13th International IEEE Conference on Intelligent Transportation Systems, 2010, pp. 1295–1300. [CrossRef]
- Brosseau, M.; Zangenehpour, S.; Saunier, N.; Miranda-Moreno, L. The impact of waiting time and other factors on dangerous pedestrian crossings and violations at signalized intersections: A case study in Montreal. Transportation Research Part F: Traffic Psychology and Behaviour 2013, 21, 159–172. [Google Scholar] [CrossRef]
- Ismail, K.; Sayed, T.; Saunier, N.; Lim, C. Automated analysis of pedestrian–vehicle conflicts using video data. Transportation Research Record 2009, 2140, 44–54. [Google Scholar] [CrossRef]
- Rodríguez Palmeiro, A.; van der Kint, S.; Vissers, L.; Farah, H.; de Winter, J.C.; Hagenzieker, M. Interaction between pedestrians and automated vehicles: A Wizard of Oz experiment. Transportation Research Part F: Traffic Psychology and Behaviour 2018, 58, 1005–1020. [Google Scholar] [CrossRef]
- Rasouli, A.; Kotseruba, I.; Tsotsos, J.K. Are They Going to Cross? A Benchmark Dataset and Baseline for Pedestrian Crosswalk Behavior. In Proceedings of the 2017 IEEE International Conference on Computer Vision Workshops (ICCVW), 2017, pp. 206–213. [CrossRef]
- Rasouli, A.; Kotseruba, I.; Kunic, T.; Tsotsos, J. PIE: A Large-Scale Dataset and Models for Pedestrian Intention Estimation and Trajectory Prediction. In Proceedings of the 2019 IEEE/CVF International Conference on Computer Vision (ICCV), 2019, pp. 6261–6270. [CrossRef]
- Bock, J.; Krajewski, R.; Moers, T.; Runde, S.; Vater, L.; Eckstein, L. The inD Dataset: A Drone Dataset of Naturalistic Road User Trajectories at German Intersections. In Proceedings of the 2020 IEEE Intelligent Vehicles Symposium (IV), 2020, pp. 1929–1934. [CrossRef]
- Cadena, P.R.G.; Yang, M.; Qian, Y.; Wang, C. Pedestrian Graph: Pedestrian Crossing Prediction Based on 2D Pose Estimation and Graph Convolutional Networks. In Proceedings of the 2019 IEEE Intelligent Transportation Systems Conference (ITSC), 2019, pp. 2000–2005. [CrossRef]
- Gesnouin, J.; Pechberti, S.; Bresson, G.; Stanciulescu, B.; Moutarde, F. Predicting Intentions of Pedestrians from 2D Skeletal Pose Sequences with a Representation-Focused Multi-Branch Deep Learning Network. Algorithms 2020, 13. [Google Scholar] [CrossRef]
- Yang, D.; Zhang, H.; Yurtsever, E.; Redmill, K.A.; Özgüner, Ü. Predicting Pedestrian Crossing Intention With Feature Fusion and Spatio-Temporal Attention. IEEE Transactions on Intelligent Vehicles 2022, 7, 221–230. [Google Scholar] [CrossRef]
- Ling, Y.; Ma, Z.; Zhang, Q.; Xie, B.; Weng, X. PedAST-GCN: Fast Pedestrian Crossing Intention Prediction Using Spatial–Temporal Attention Graph Convolution Networks. IEEE Transactions on Intelligent Transportation Systems 2024, 25, 13277–13290. [Google Scholar] [CrossRef]
- Yang, B.; Zhu, J.; Hu, C.; Yu, Z.; Hu, H.; Ni, R. Faster Pedestrian Crossing Intention Prediction Based on Efficient Fusion of Diverse Intention Influencing Factors. IEEE Transactions on Transportation Electrification 2024, 10, 9071–9087. [Google Scholar] [CrossRef]
- Zhang, C.; Sprenger, J.; Ni, Z.; Berger, C. Predicting and Analyzing Pedestrian Crossing Behavior at Unsignalized Crossings. In Proceedings of the 2024 IEEE Intelligent Vehicles Symposium (IV), 2024, pp. 674–681. [CrossRef]
- Zhang, C.; Kalantari, A.H.; Yang, Y.; Ni, Z.; Markkula, G.; Merat, N.; Berger, C. Cross or Wait? Predicting Pedestrian Interaction Outcomes at Unsignalized Crossings. arXiv preprint 2023, arXiv:2304.08260. Accepted in 2023 IEEE Intelligent Vehicles Symposium (IV). [CrossRef]
- Kalantari, A.H.; Yang, Y.; Garcia de Pedro, J.; Lee, Y.M.; Horrobin, A.; Solernou, A.; Holmes, C.; Merat, N.; Markkula, G. Who goes first? A distributed simulator study of vehicle–pedestrian interaction. Accident Analysis & Prevention 2023, 186, 107050. [Google Scholar] [CrossRef]
- Serrano, S.M.; Izquierdo, R.; Daza, I.G.; Ángel Sotelo, M.; Fernández-Llorca, D. Behavioural Gap Assessment of Human-Vehicle Interaction in Real and Virtual Reality-Based Scenarios in Autonomous Driving. International Journal of Human–Computer Interaction 2024, 0, 1–14. [Google Scholar] [CrossRef]
- Cai, J.; Wang, M.; Wu, Y. Research on pedestrian crossing decision models and predictions based on machine learning. Sensors 2024, 24, 258. [Google Scholar] [CrossRef] [PubMed]
- Fang, Z.; Vázquez, D.; López, A.M. On-Board Detection of Pedestrian Intentions. Sensors 2017, 17, 2193. [Google Scholar] [CrossRef] [PubMed]
- Fang, Z.; López, A.M. Is the Pedestrian going to Cross? Answering by 2D Pose Estimation. In Proceedings of the IEEE Intelligent Vehicles Symposium (IEEE IV), 2018, [arXiv:cs.CV/1807.10580]. [CrossRef]
- Schneemann, F.; Heinemann, P. Context-based detection of pedestrian crossing intention for autonomous driving in urban environments. In Proceedings of the 2016 IEEE/RSJ International Conference on Intelligent Robots and Systems (IROS), 2016, pp. 2243–2248. [CrossRef]
- Moreno, E.; Denny, P.; Ward, E.; Horgan, J.; Eising, C.; Jones, E.; Glavin, M.; Parsi, A.; Mullins, D.; Deegan, B. Pedestrian Crossing Intention Forecasting at Unsignalized Intersections Using Naturalistic Trajectories. Sensors 2023, 23, 2773. [Google Scholar] [CrossRef] [PubMed]
- Völz, B.; Behrendt, K.; Mielenz, H.; Gilitschenski, I.; Siegwart, R.; Nieto, J. A data-driven approach for pedestrian intention estimation. In Proceedings of the 2016 IEEE 19th International Conference on Intelligent Transportation Systems (ITSC), 2016, pp. 2607–2612. [CrossRef]
- Institute for Automotive Engineering of RWTH Aachen University.; fka GmbH. drone-dataset-tools. Available online: https://github.com/ika-rwth-aachen/drone-dataset-tools/tree/master2019. GitHub repository.
Figure 1.
Examples of manual annotations using LabelMe on overhead images from the inD dataset. Green polygons represent nondrivable regions—including hatched road markings and traffic islands. The red polygon delineates the drivable area. These annotations were manually created and reviewed by the author to ensure consistency across all 33 images collected from 4 sites.
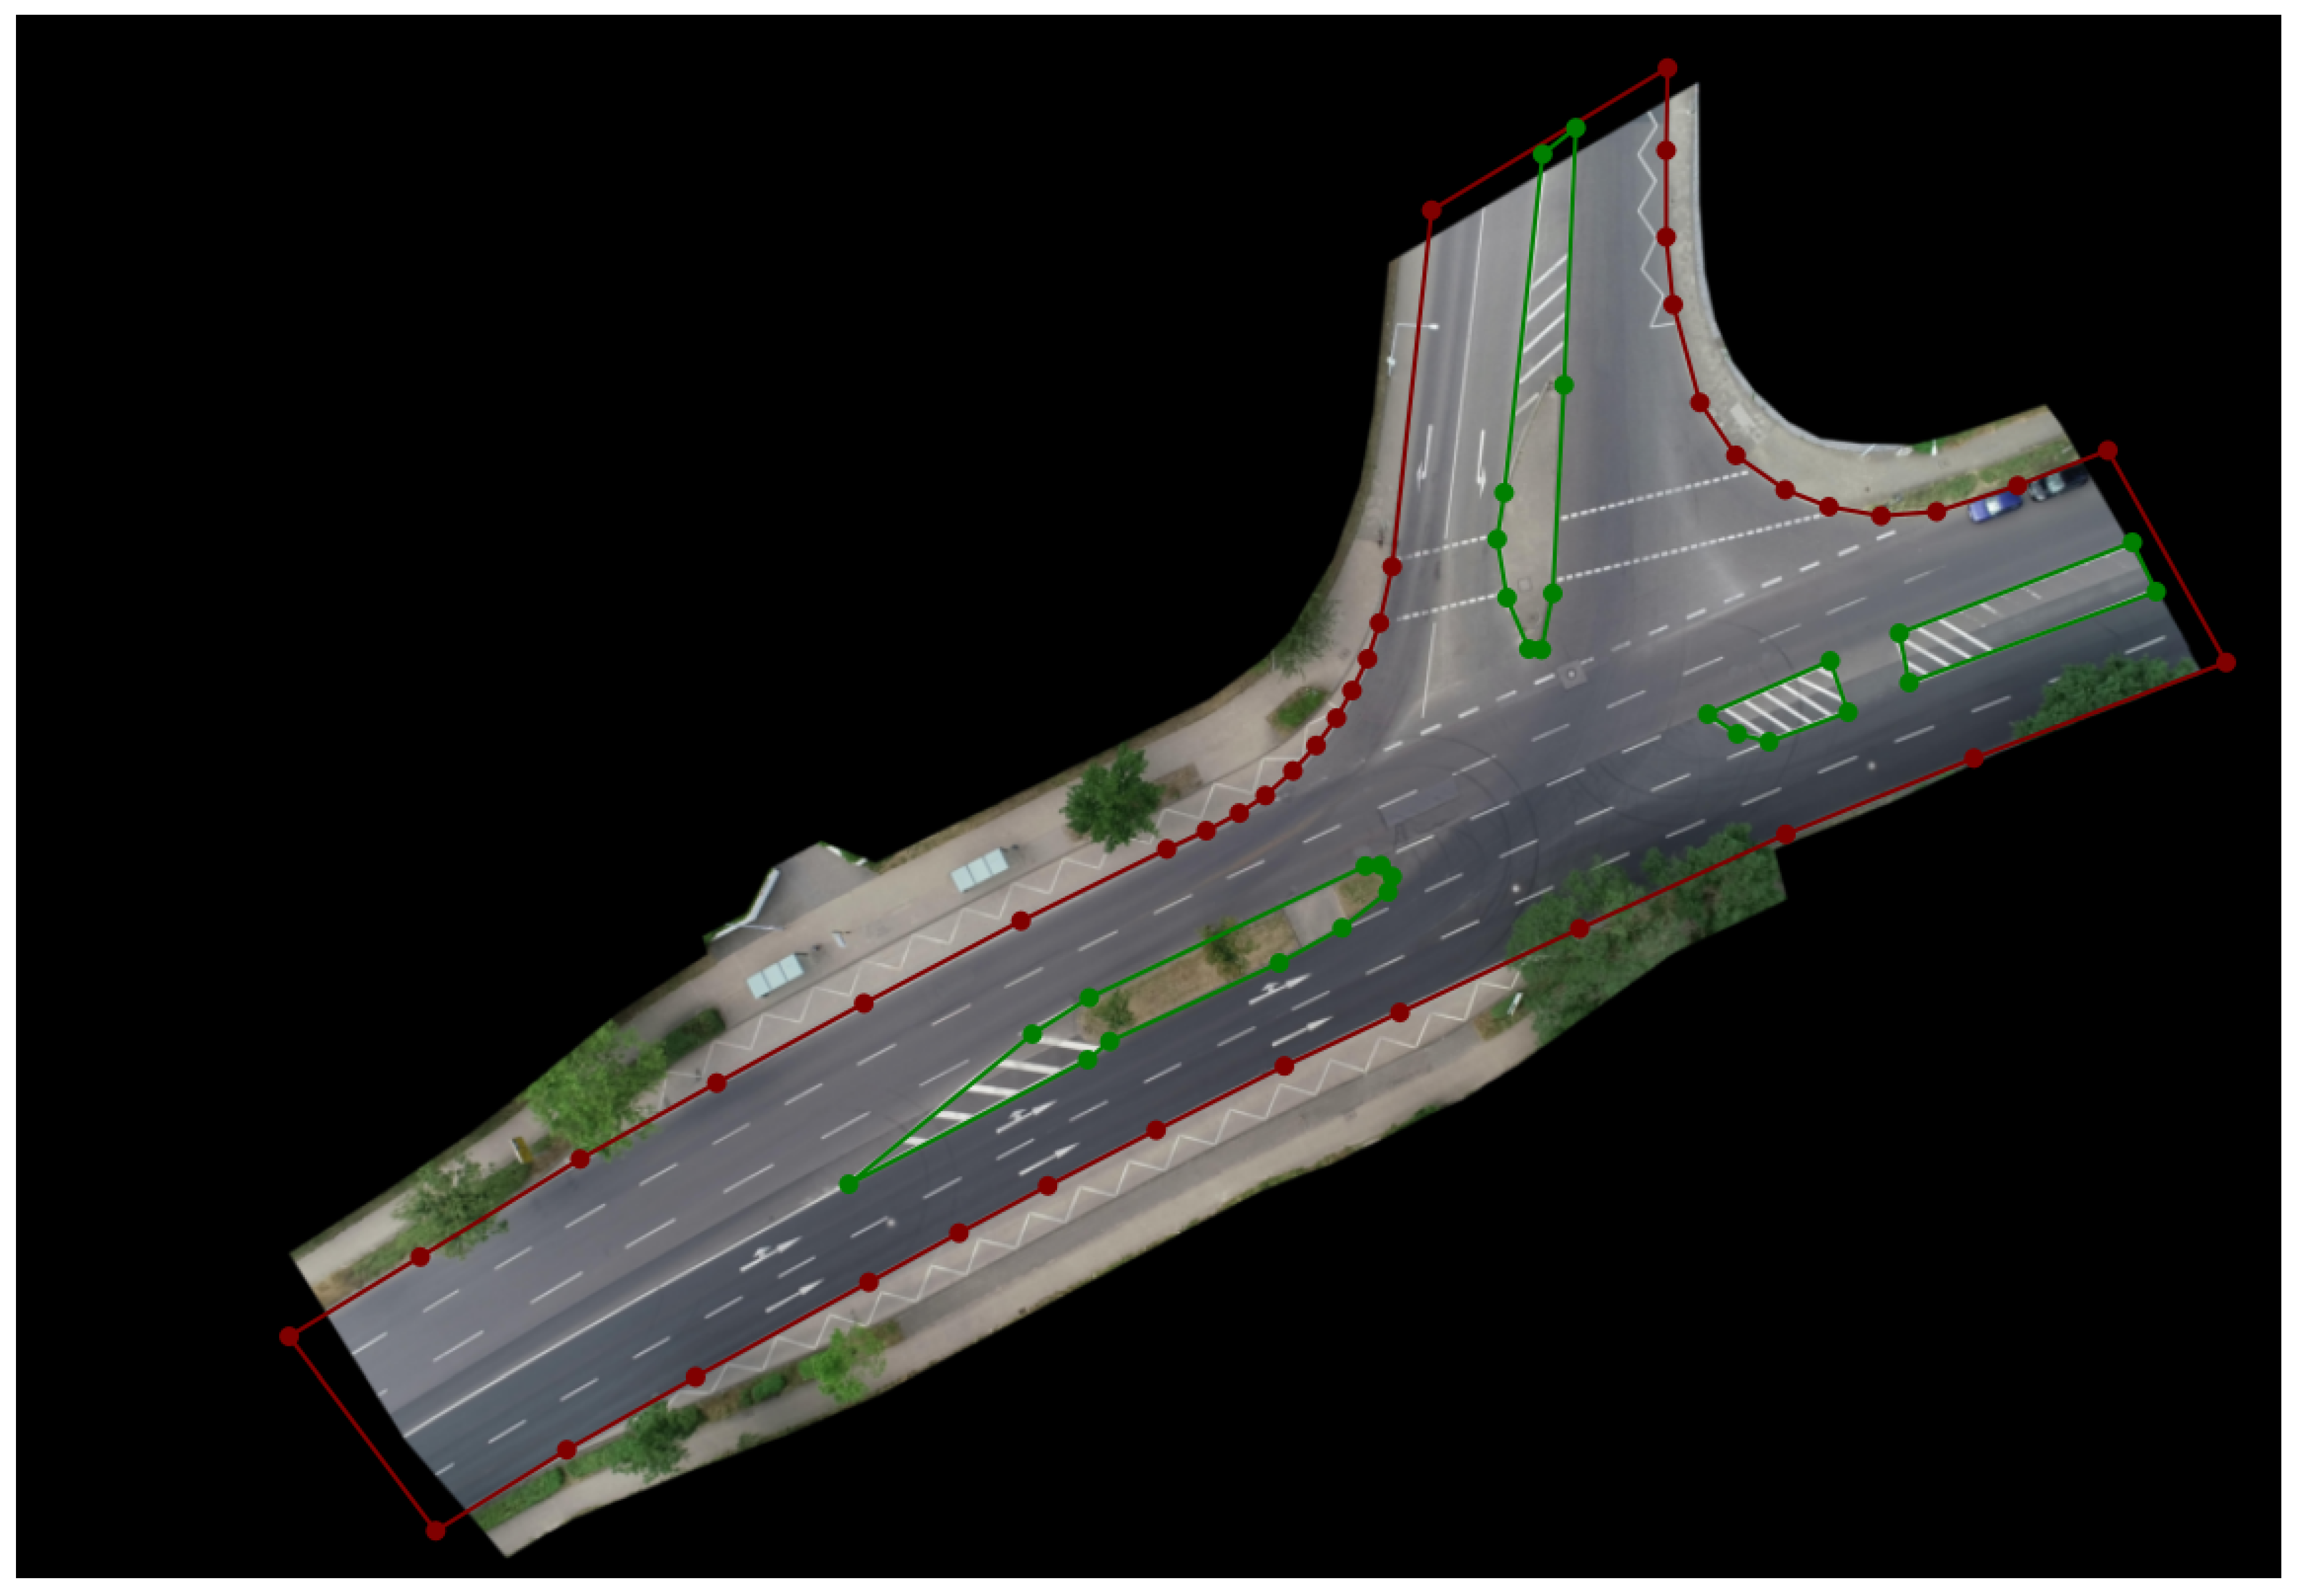
Figure 2.
Example of an interesting pedestrian trajectory. A pedestrian is considered "of interest" if located within 2 meters of the annotated drivable boundary but not yet on the drivable surface. The trajectory is colored chronologically from purple to yellow.
Figure 2.
Example of an interesting pedestrian trajectory. A pedestrian is considered "of interest" if located within 2 meters of the annotated drivable boundary but not yet on the drivable surface. The trajectory is colored chronologically from purple to yellow.
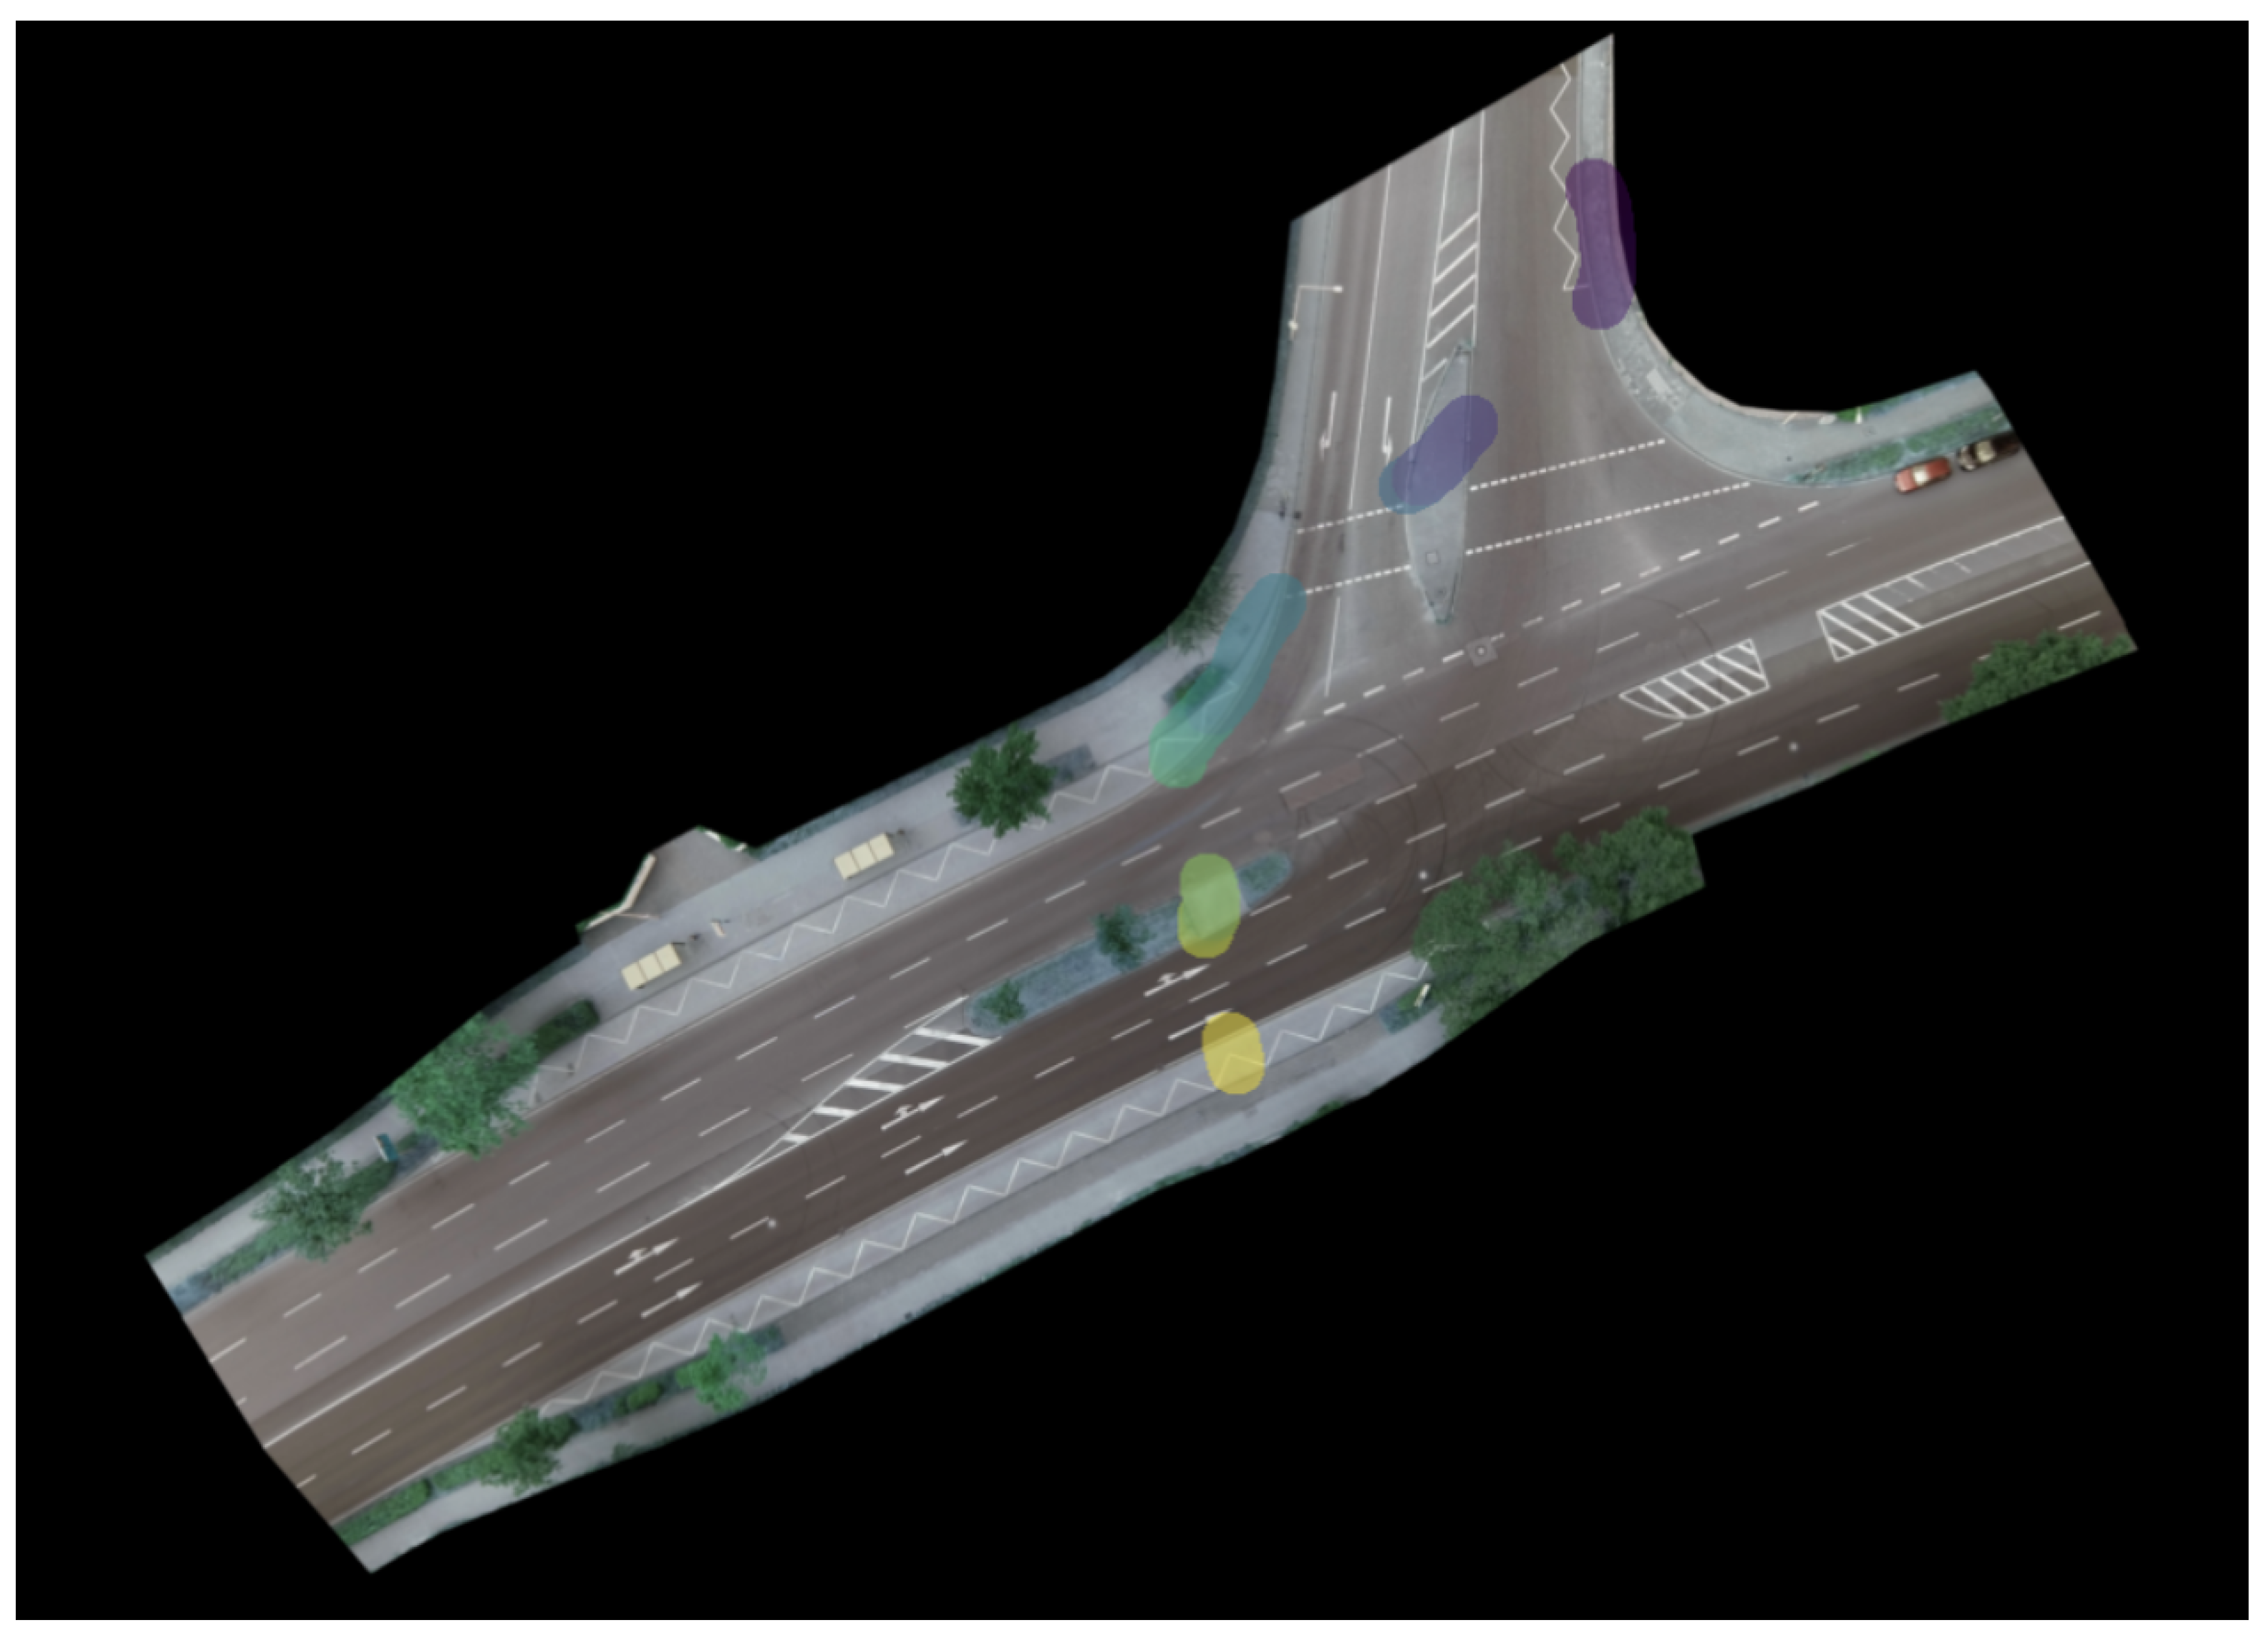
Figure 3.
An example scene showing the drivable mask (blue) and the buffered mask (green).
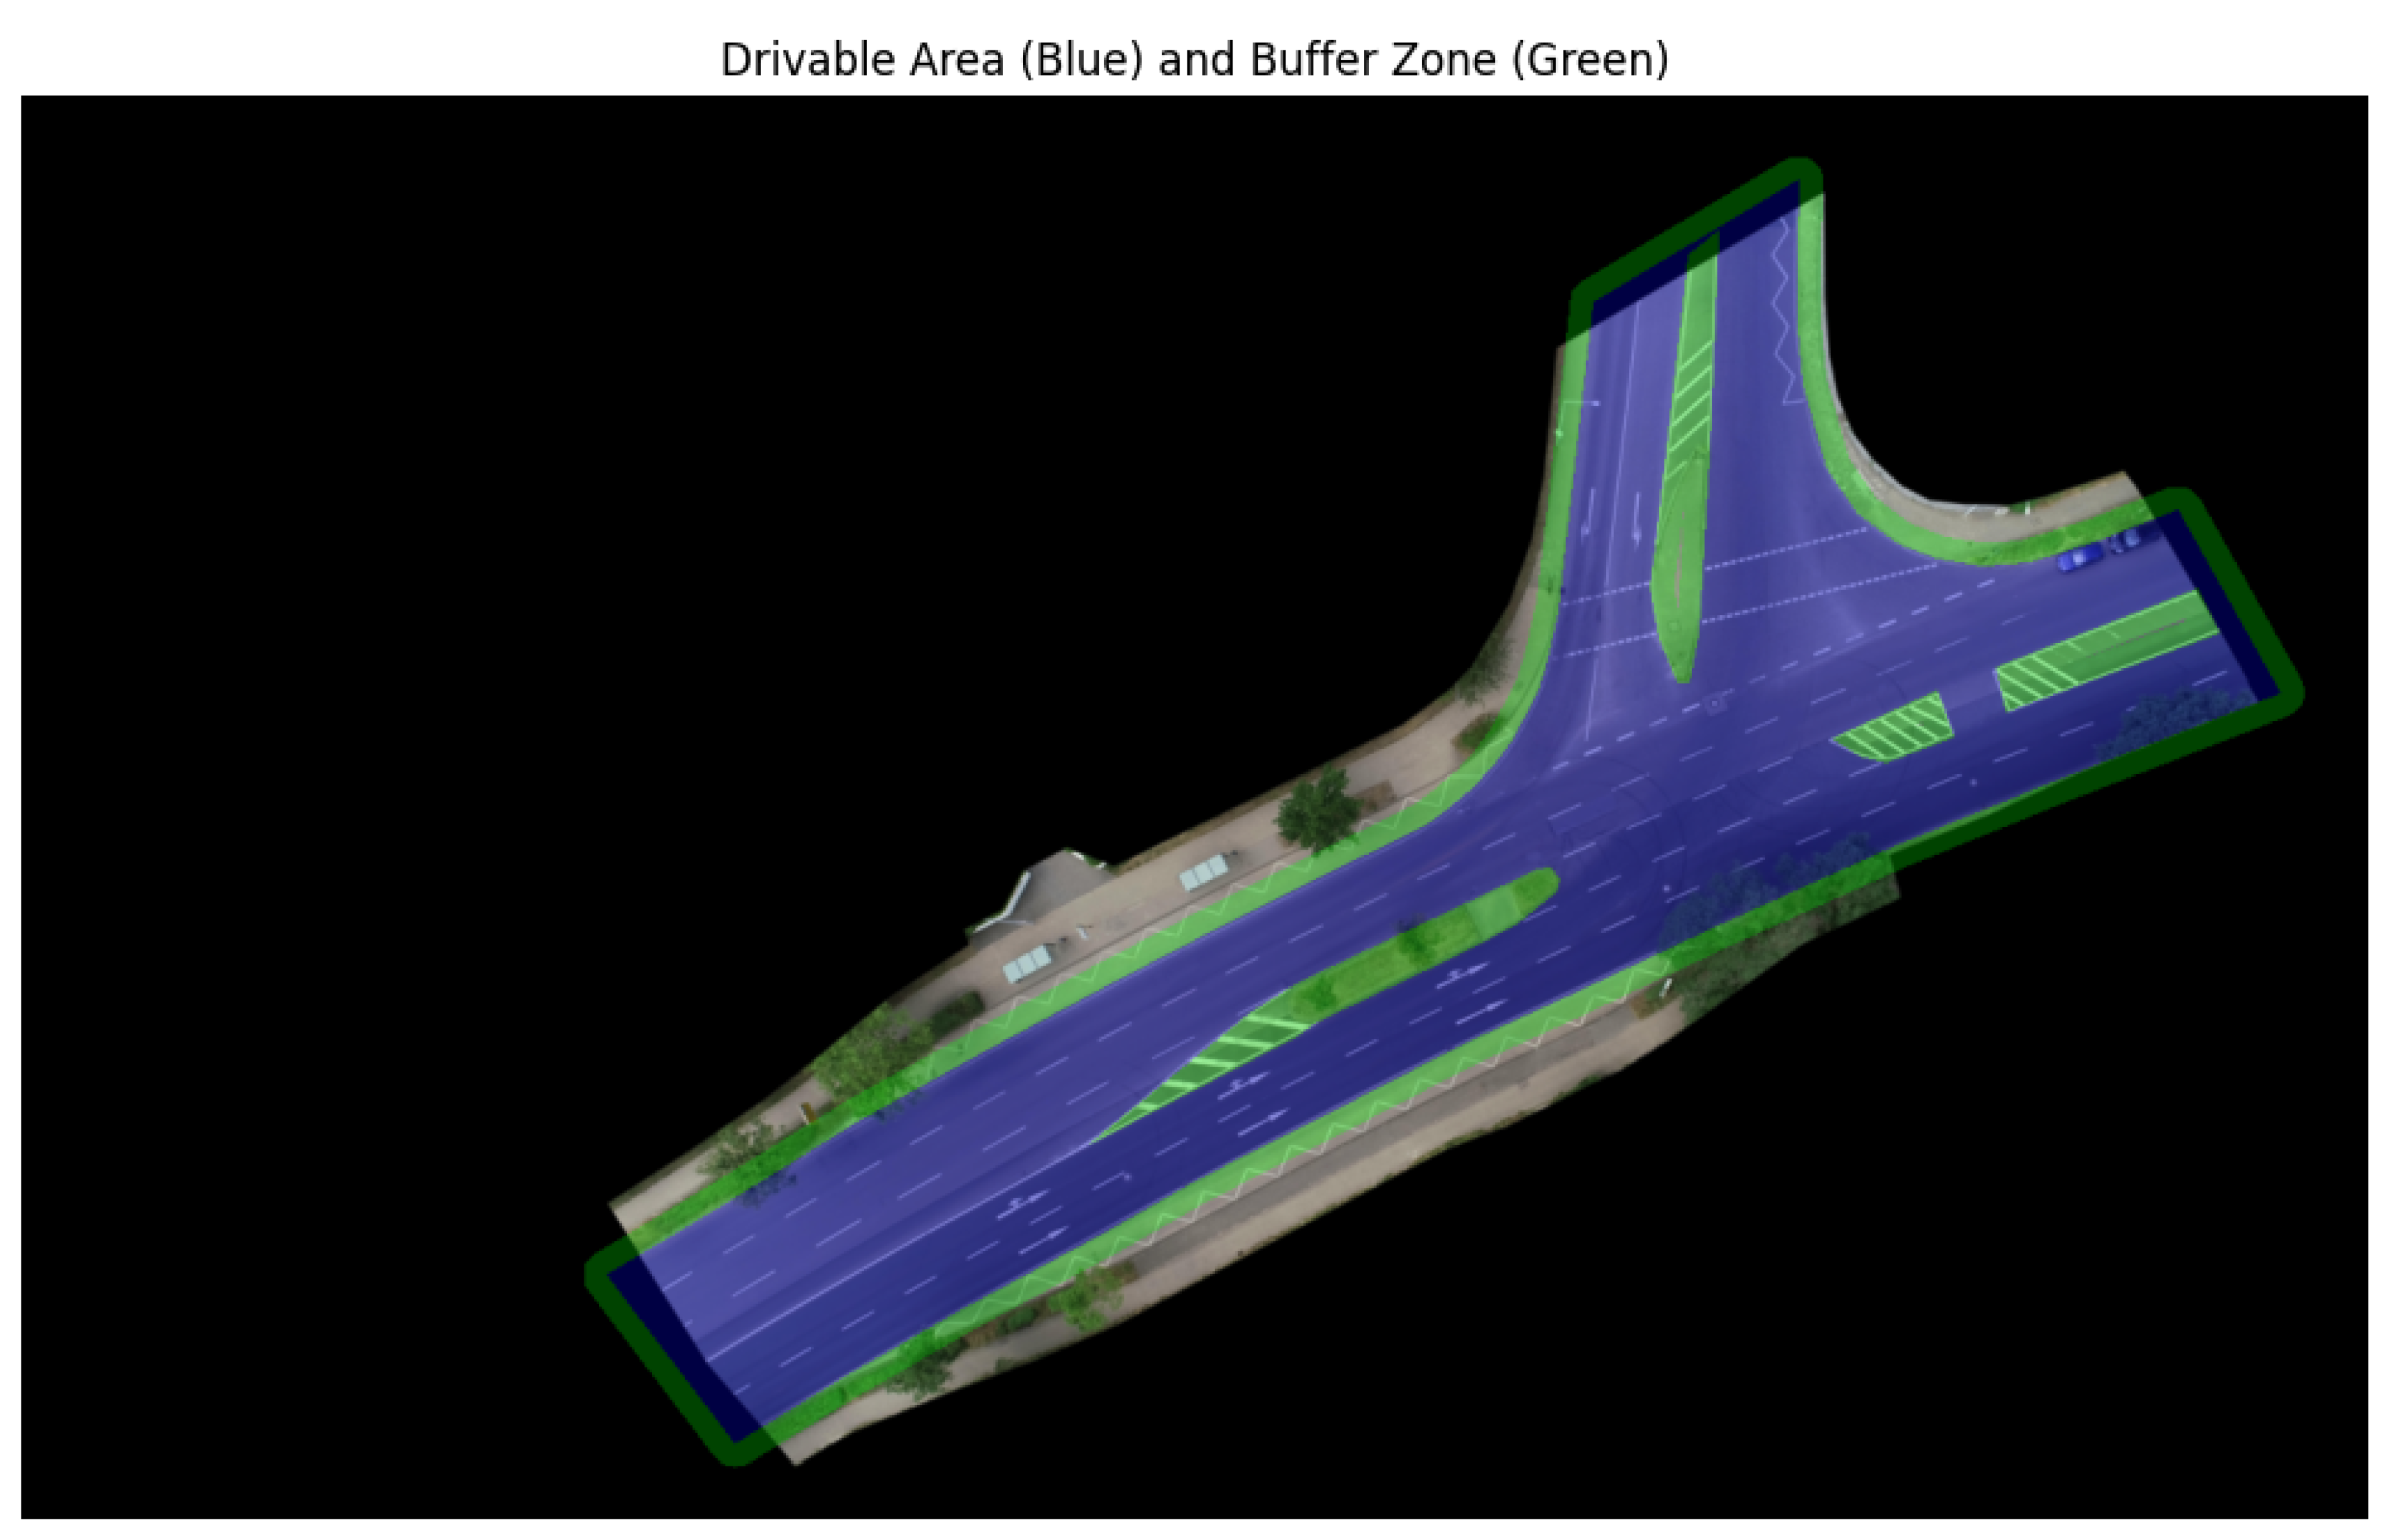
Figure 4.
Example of a selected pedestrian trajectory segment (light green) and its associated interacting vehicle trajectory (solid red), overlaid on the full interesting pedestrian trajectory. The vehicle trajectory is identified based on the spatial overlap and refined to exclude irrelevant post-interaction segments.
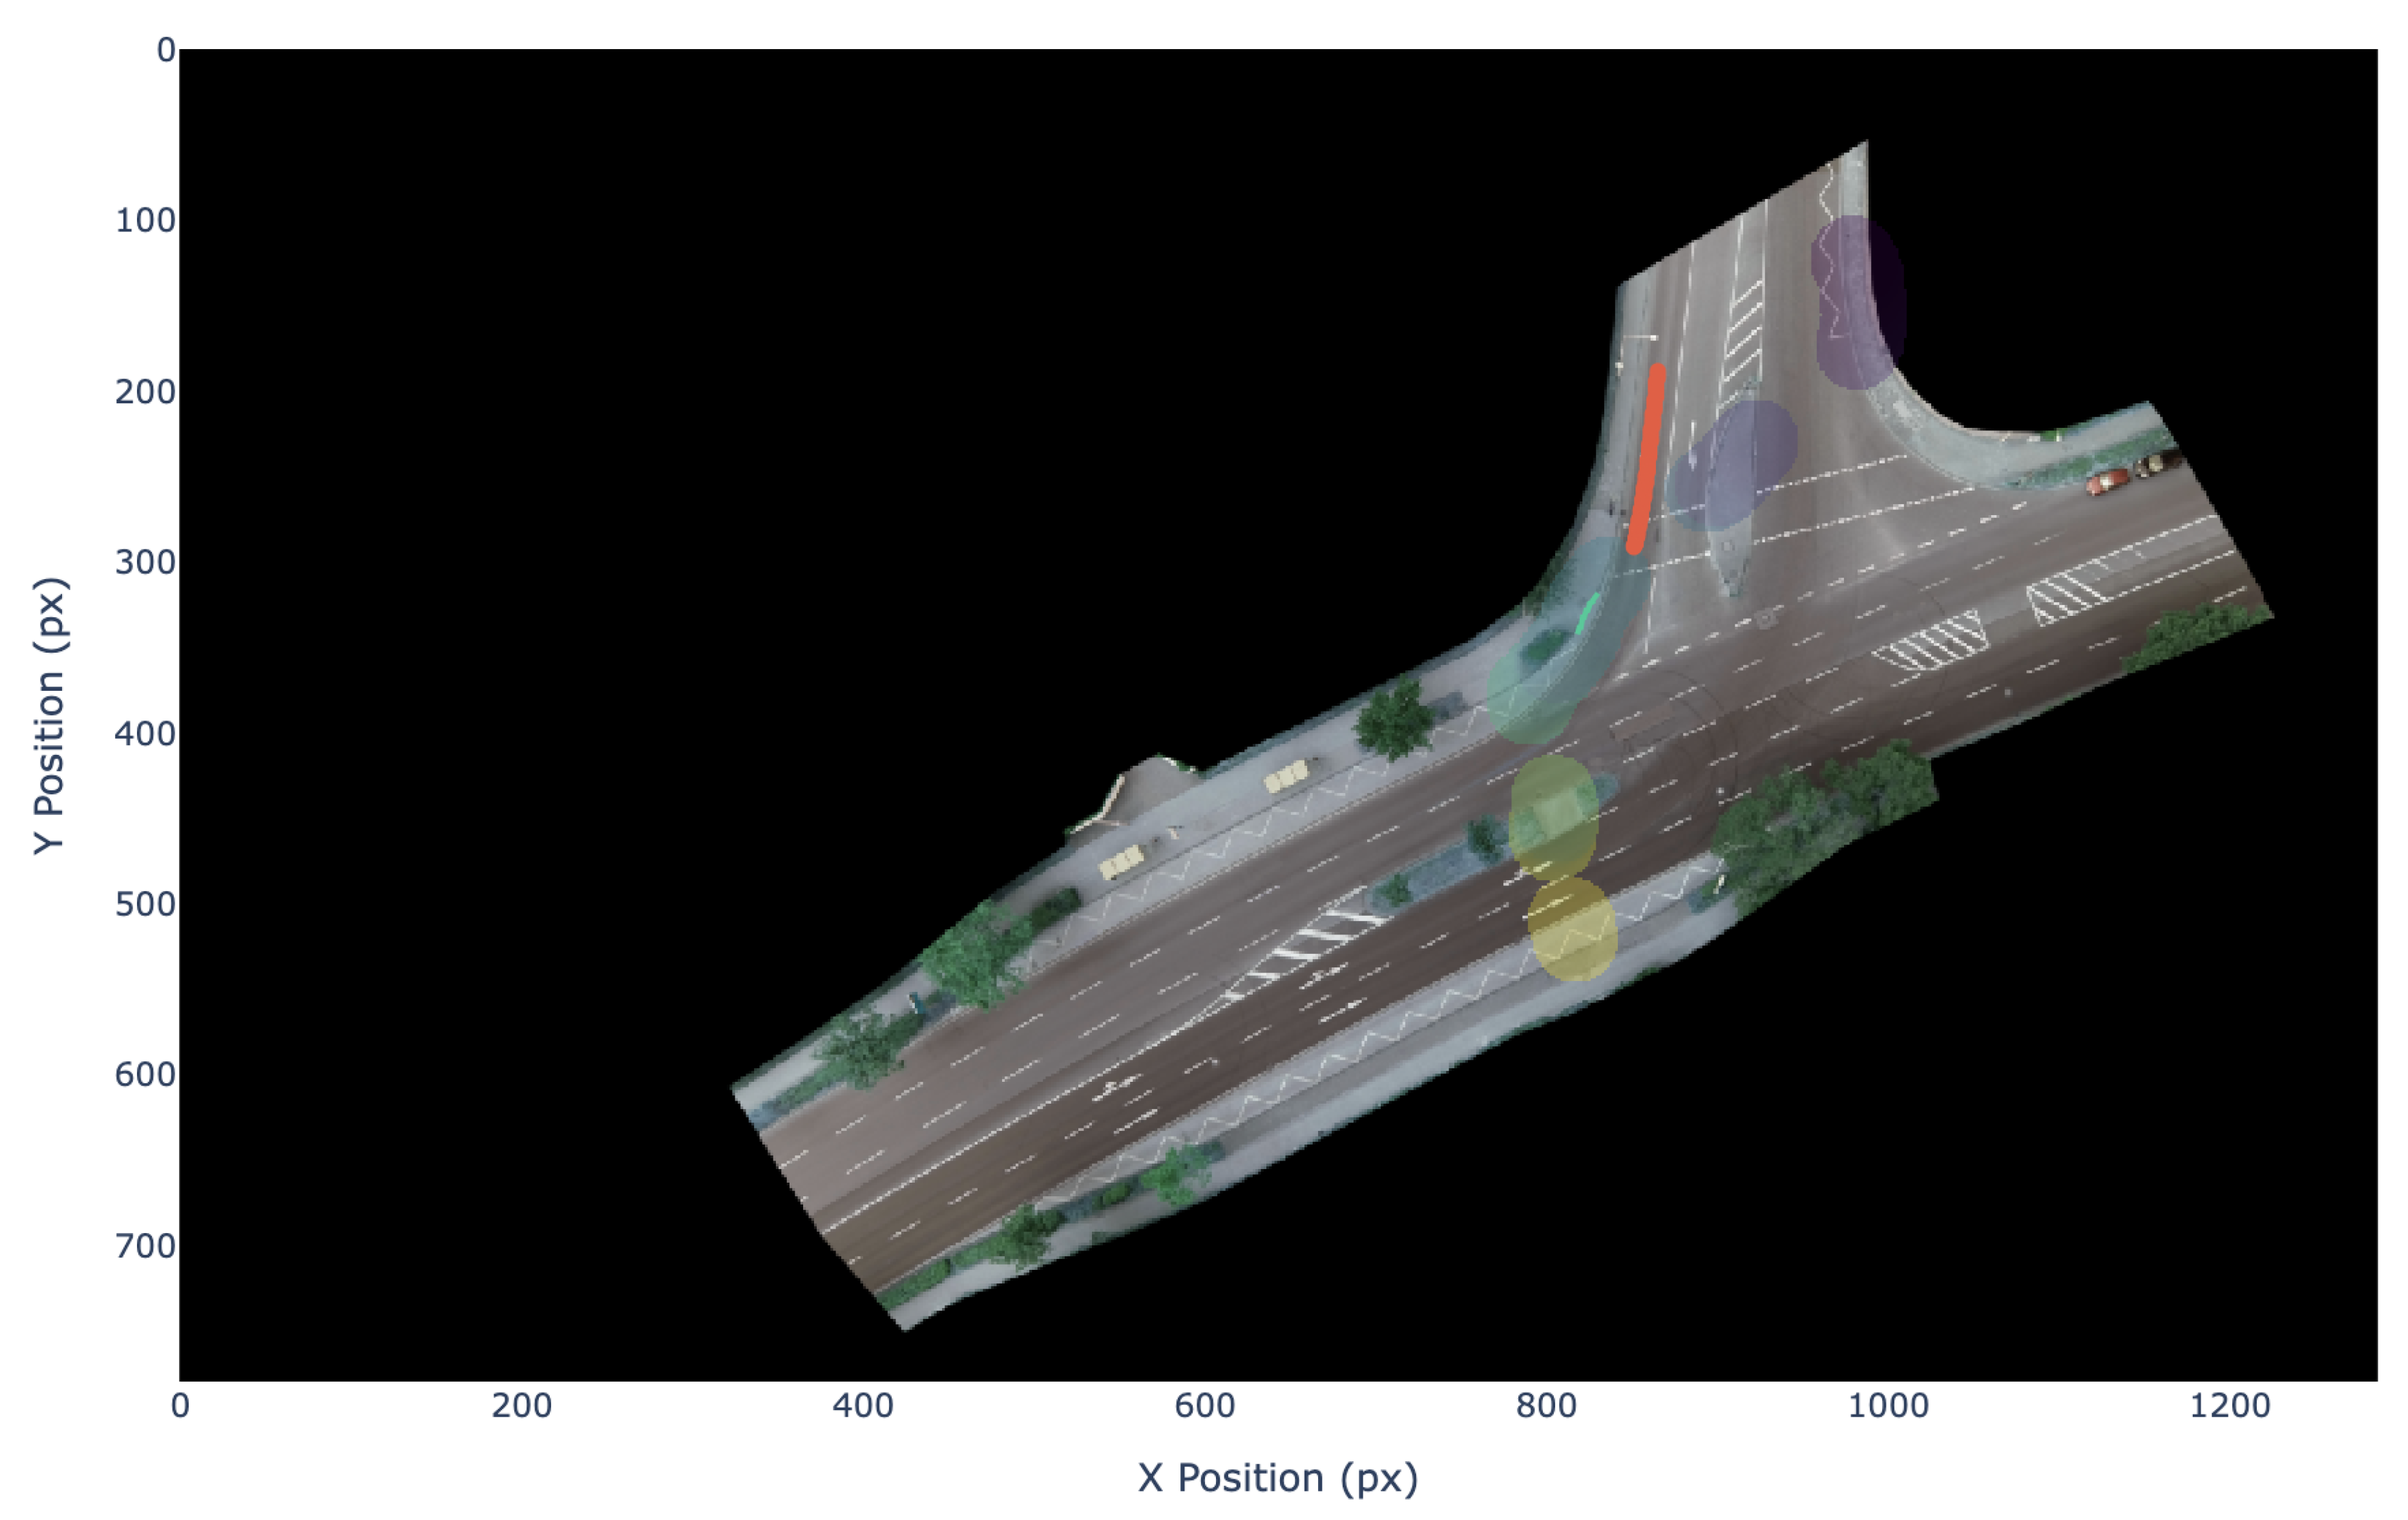
Figure 5.
Pedestrian velocity vectors (green) are projected along unit vectors (gray) that point from each pedestrian’s current position (orange) to the closest points (red) on the ego vehicle’s predicted future trajectory (blue). This projection, termed the cutting velocity, quantifies how much of the pedestrian’s motion is aligned with a path that intersects the vehicle’s future trajectory.
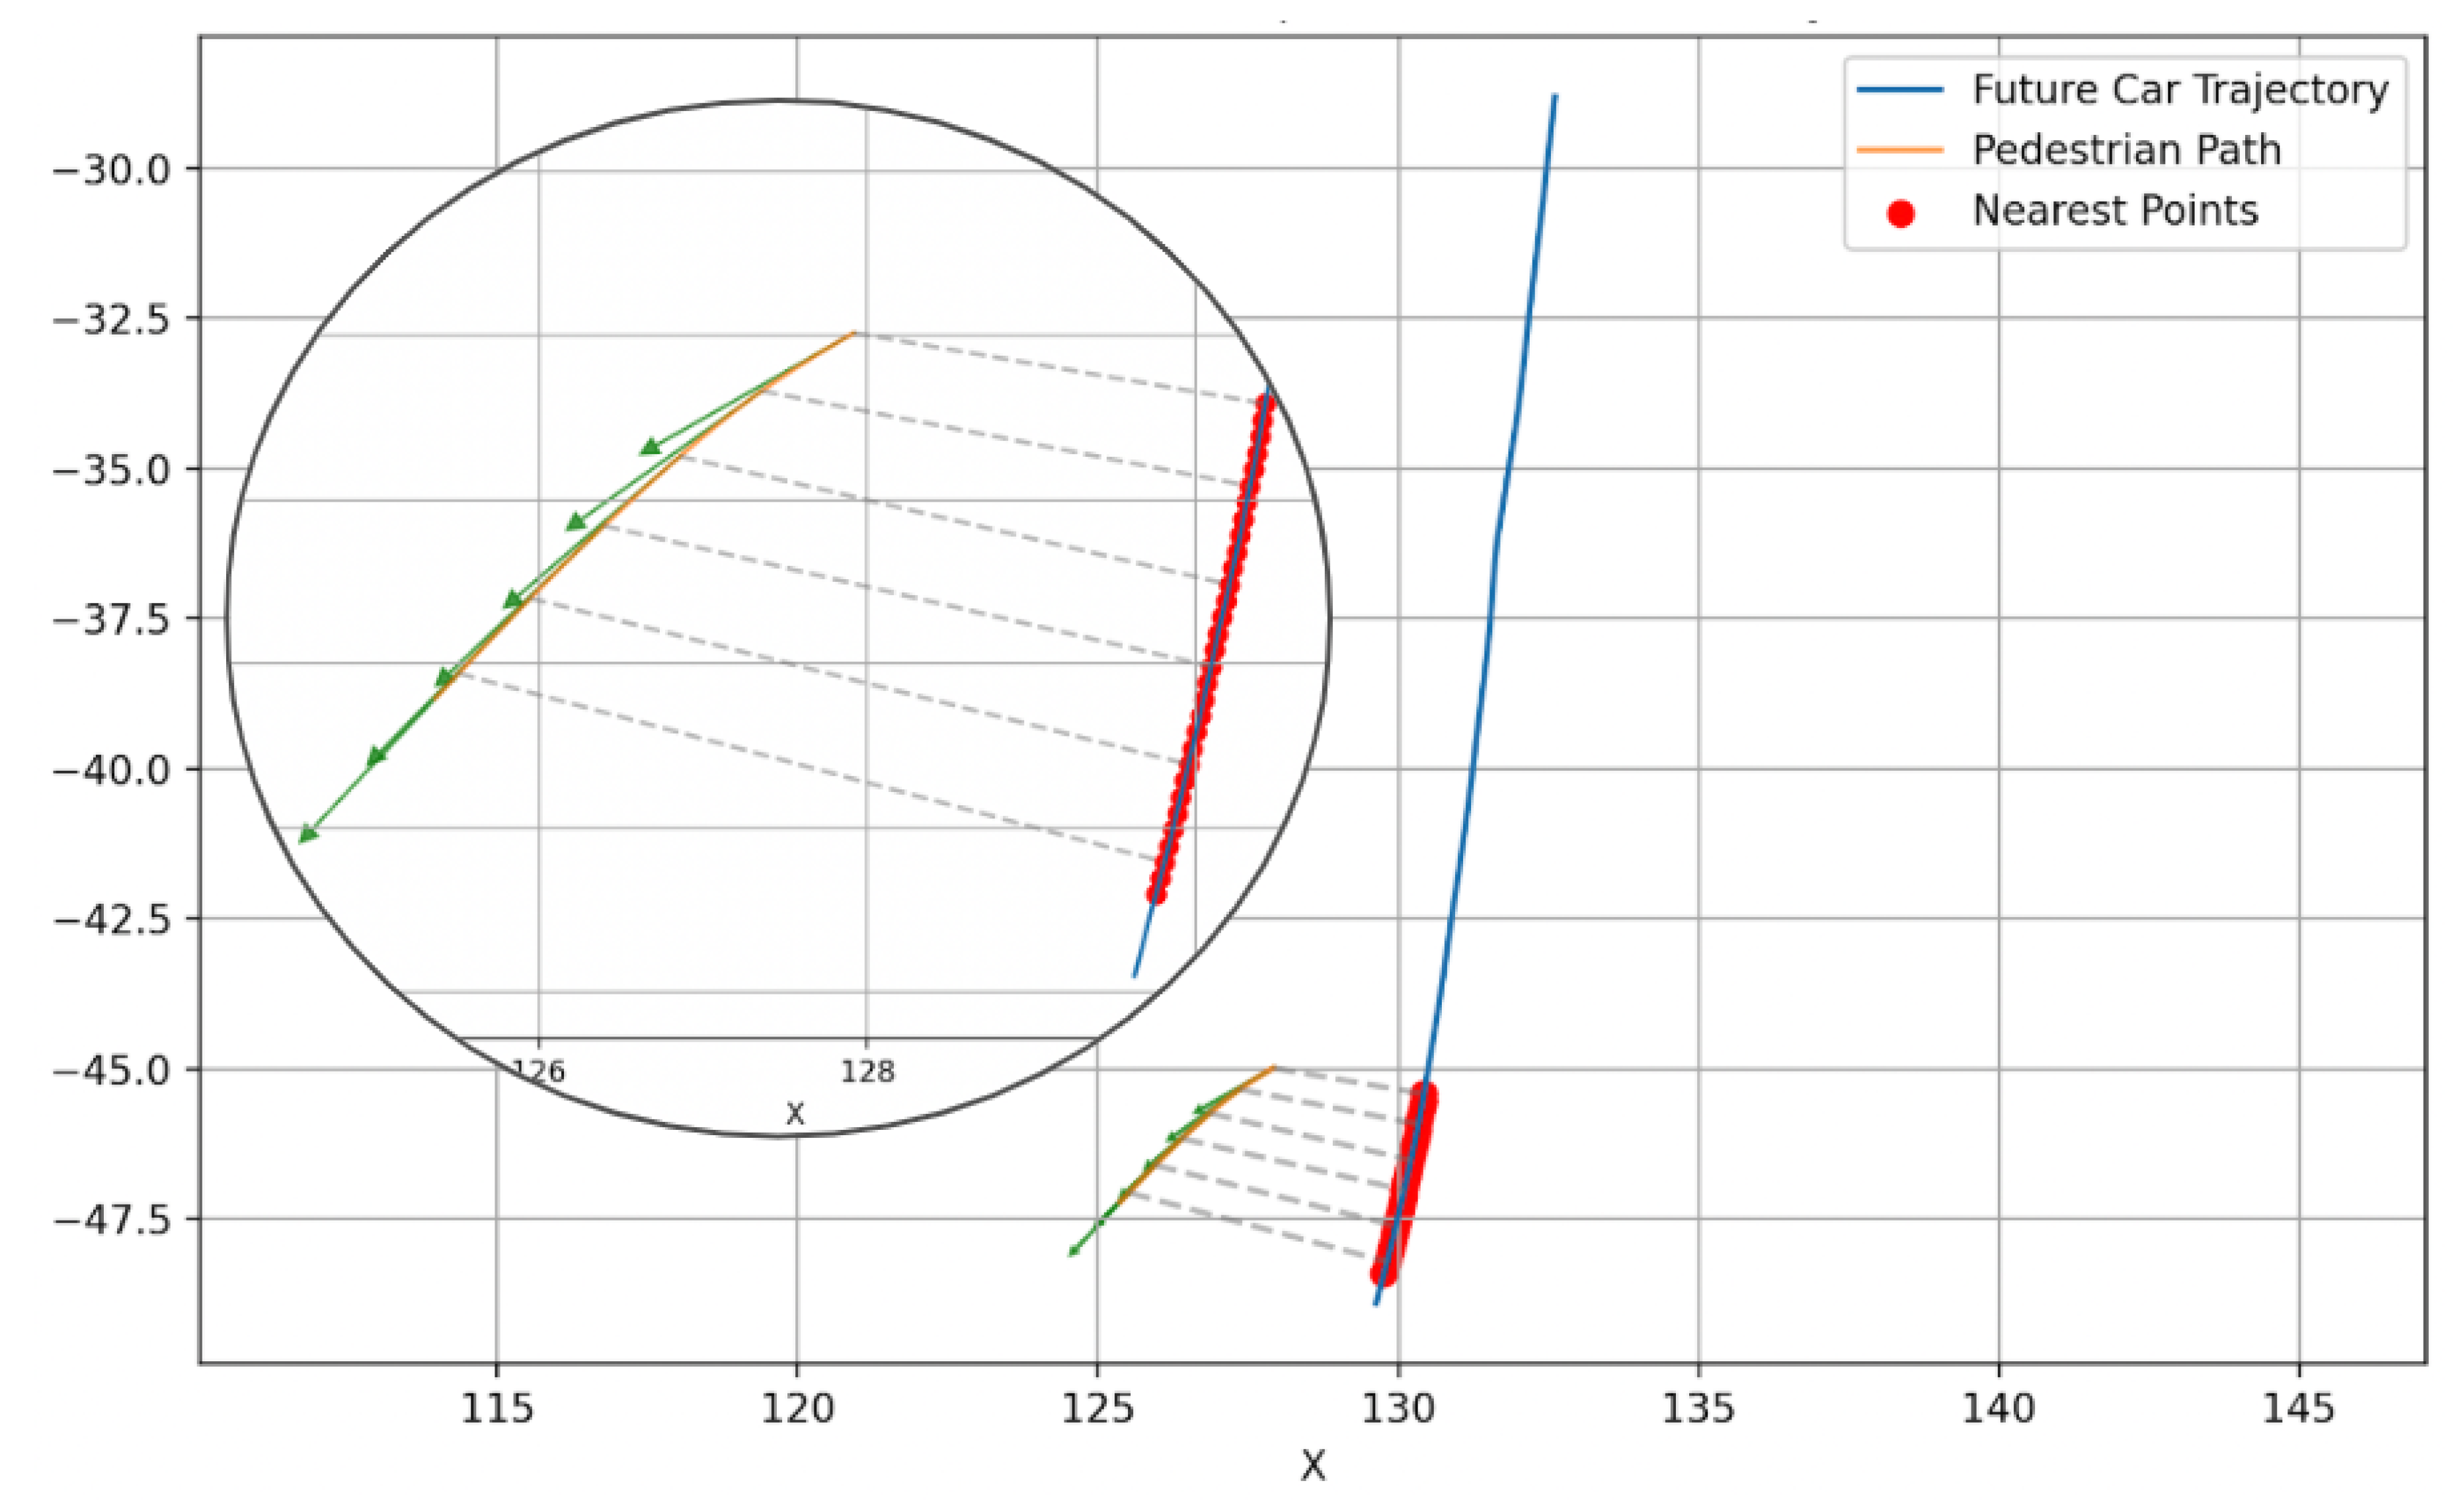
Figure 6.
Histogram of cutting momentum values for crossing (orange) and noncrossing (blue) pedestrians.
Figure 6.
Histogram of cutting momentum values for crossing (orange) and noncrossing (blue) pedestrians.
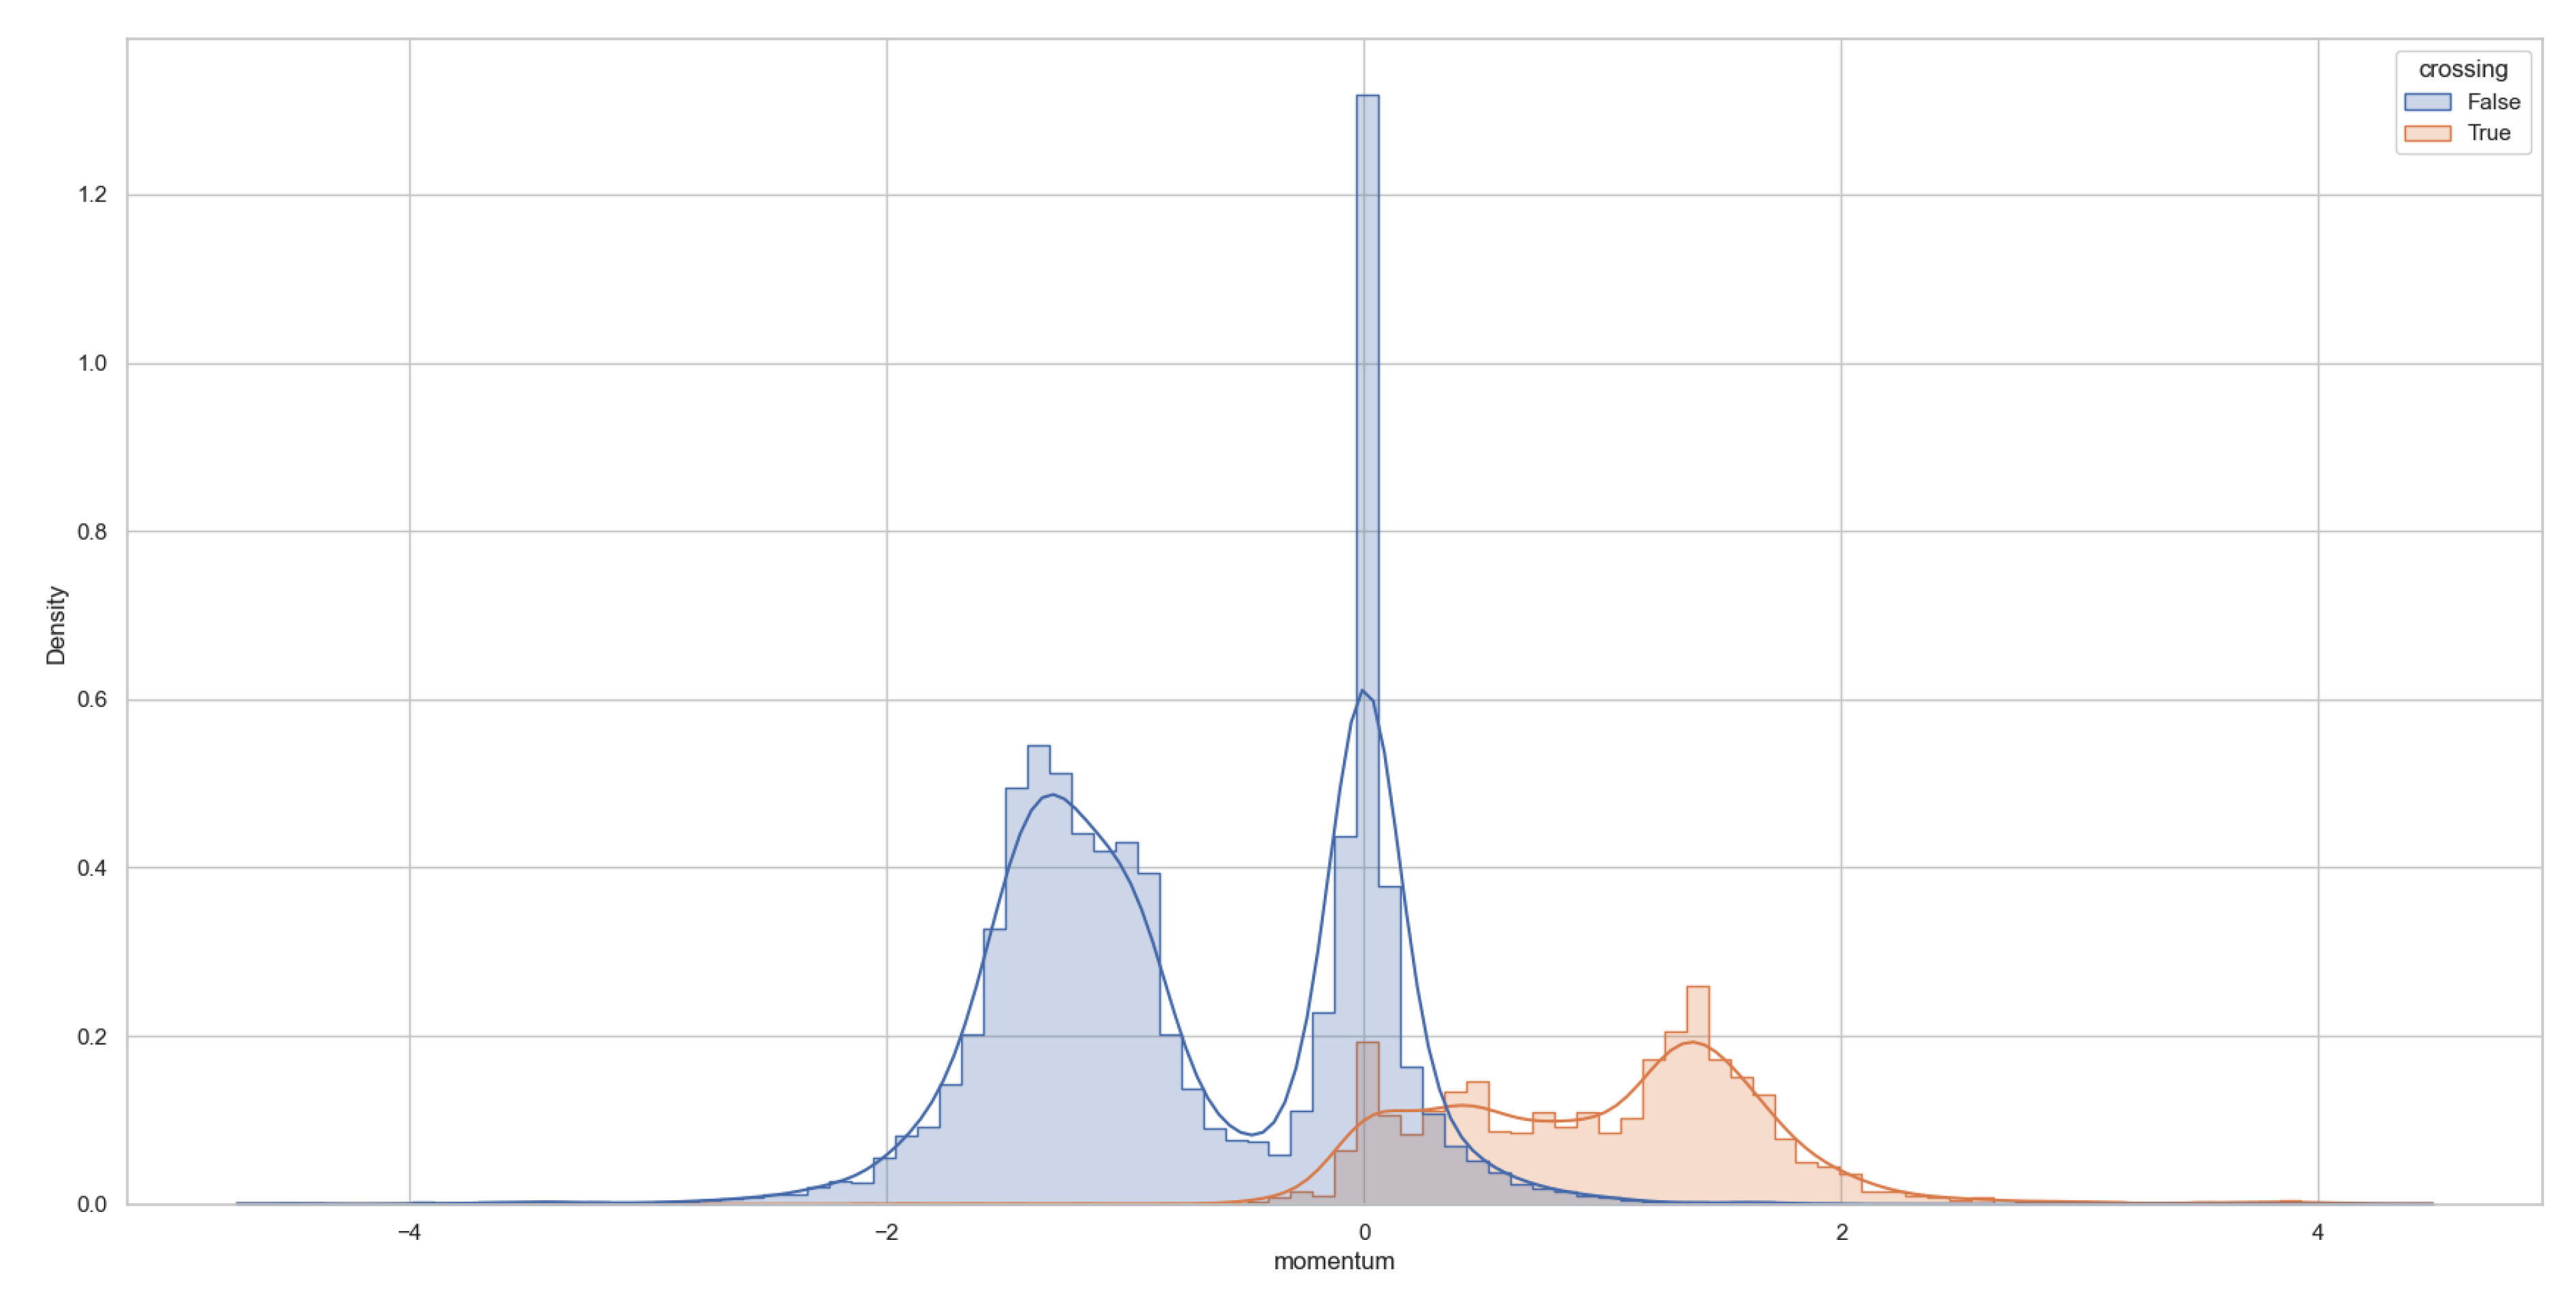
Figure 7.
Histogram of ego vehicle longitudinal velocity values for crossing (orange) and noncrossing (blue) pedestrians.
Figure 7.
Histogram of ego vehicle longitudinal velocity values for crossing (orange) and noncrossing (blue) pedestrians.
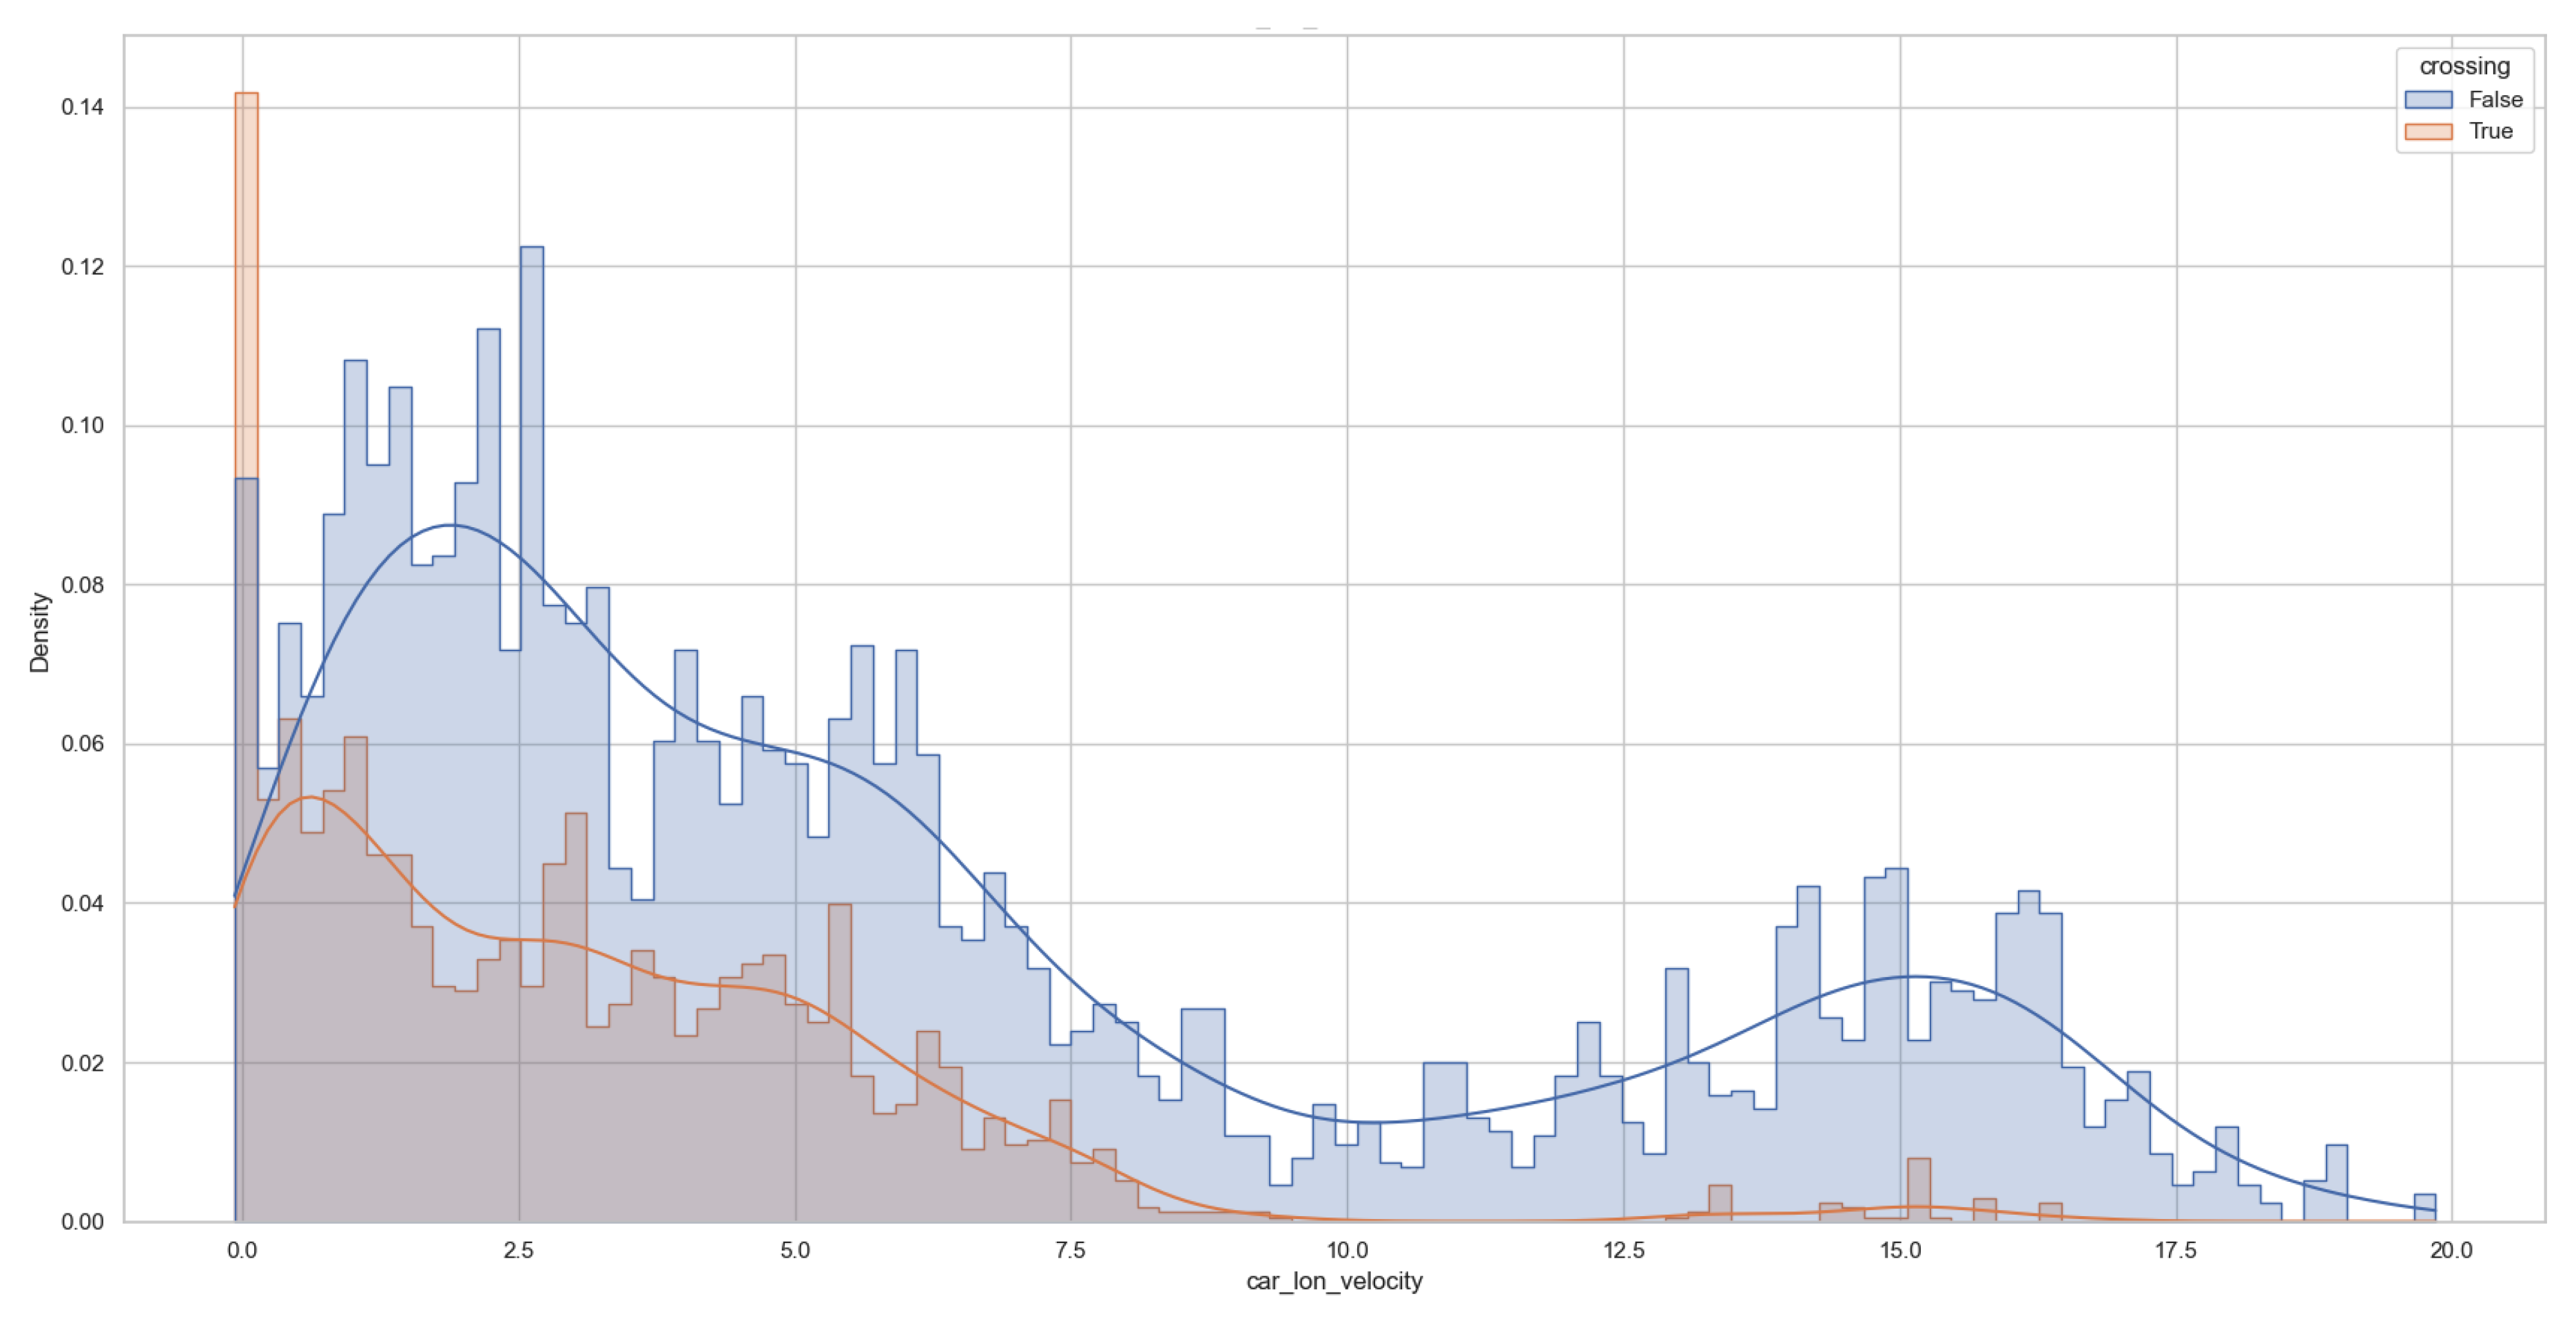
Figure 8.
Histogram of time-to-collision (TTC) values for crossing (orange) and non-crossing (blue) pedestrians. TTC values greater than 10 seconds are capped at 10 seconds during both training and testing
Figure 8.
Histogram of time-to-collision (TTC) values for crossing (orange) and non-crossing (blue) pedestrians. TTC values greater than 10 seconds are capped at 10 seconds during both training and testing
Disclaimer/Publisher’s Note: The statements, opinions and data contained in all publications are solely those of the individual author(s) and contributor(s) and not of MDPI and/or the editor(s). MDPI and/or the editor(s) disclaim responsibility for any injury to people or property resulting from any ideas, methods, instructions or products referred to in the content. |
© 2025 by the authors. Licensee MDPI, Basel, Switzerland. This article is an open access article distributed under the terms and conditions of the Creative Commons Attribution (CC BY) license (http://creativecommons.org/licenses/by/4.0/).
Copyright: This open access article is published under a Creative Commons CC BY 4.0 license, which permit the free download, distribution, and reuse, provided that the author and preprint are cited in any reuse.


