

Submitted:
09 June 2025
Posted:
10 June 2025
You are already at the latest version
Preprints on COVID-19 and SARS-CoV-2
Abstract
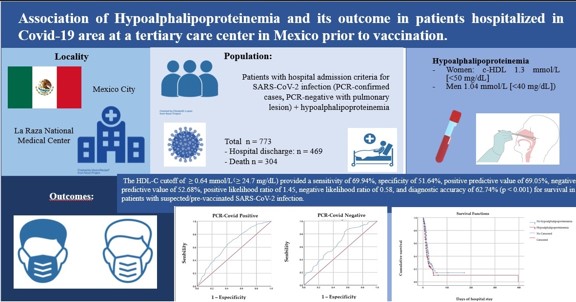
HDL-C has anti-inflammatory properties and low levels are associated with a more severe presentation of COVID-19. Objective: To identify the association of hypoalphalipoproteinemia and outcome in patients hospitalized in the COVID area in a tertiary center in Mexico prior to vaccination. Methods: A cross-sectional, prolective and analytical study was carried out on hospitalized patients with suspected/confirmed SARS COV-2 infection. Inclusion criteria: age 18 or older, with hospital admission criteria for SARS-CoV-2 infection (PCR-confirmed cases, PCR-negative with pulmonary lesion) in a COVID-19 area with hypoalphalipoproteinemia according to international criteria (women c-HDL 1.3 mmol/L [<50 mg/dL], men 1.04 mmol/L [<40 mg/dL]), both sexes. Non-inclusion criteria: pregnancy or breastfeeding. Exclusion criteria: patients whose file is incomplete. Chi-square tests were performed to demonstrate associations in dichotomous qualitative variables (outcome) and Sperman for freely distributed quantitative variables. Kruskal-Wallis and Friedman were used for freely distributed ordinal variables. Finally, Kaplan-Meier survival curves and ROC curves were calculated. Results: Of a total of 822 patients, 773 subjects were eligible. 60.70% (n=469) were discharged home, and 39.30% (n=304) died. Of the patients who died, 96.05% (n=304) had hypoalphalipoproteinemia, with statistical significance (p<0.001), with higher mortality in women, with a HR of 2.40 (95% CI 1.03–5.61; p<0.043). Conclusion: The HDL-C cutoff of ≥ 0.64 mmol/L ( ≥ 24.7 mg/dL) provided a sensitivity of 69.94%, specificity of 51.64%, positive predictive value of 69.05%, negative predictive value of 52.68%, positive likelihood ratio of 1.45, negative likelihood ratio of 0.58, and diagnostic accuracy of 62.74% (p < 0.001) for survival in patients with suspected/pre-vaccinated SARS-CoV-2 infection.
Keywords:
Hypoalphalipoproteinemia
; COVID-19
; SARS-CoV-2
; mortality
1. Introduction
The SARS-CoV-2 pandemic is considered a high-mortality infection. In April 2020, the Centers for Disease Control and Prevention (CDC) determined that the groups at highest risk for severe disease were patients with obesity, asthma, chronic lung disease, diabetes, serious heart conditions, chronic kidney disease, those over 65 years of age, people in nursing homes or long-term care facilities, immunocompromised individuals, and liver disease [1]. Peng et al. found that the severity of the infection increased with higher Body Mass Index (BMI). [2]
The first case of COVID-19 in Mexico was reported on February 27, 2020. Most cases were in Mexico City, and the average age was 46 years. [3] Recently, the General Directorate of Epidemiology of Mexico, rectified the presence of 4,385,415 confirmed cases, 8,166,281 negative cases and 612,236 suspected cases; 301,469 deaths, 3,478,130 recovered and 269,331 active; by sex 50.91% are women and 49.09% men; 14.22% hospitalized and 85.78% outpatients; 13.81% with hypertension, 11.57% obesity, 10.54% diabetes and 6.37% smoking. [4]
The pathogen is known as SARS-CoV-2, a single-stranded, positive-sense, enveloped RNA coronavirus belonging to the Coronaviridae family (subfamily Orthocoronaviridae, order Nidovirales), which includes four genera (α, β, δ, and ϒ). [5] COVID-19 infection is of zoonotic origin (initially bats as intermediate hosts for snakes, pangolins, and turtles). [6] Person-to-person transmission began to be evident in 2019. SARS-CoV, SARS-CoV-2, and the alpha coronavirus HCoV-NL63 bind to the angiotensin 2 receptor (ACE2) via the S1 subunit to enter alveolar epithelial type II cells, macrophages, and other cell types. SARS-CoV-2 has a higher affinity for binding to ACE2 than SARS-CoV, and binding involves a greater number of interaction sites. [7] The incubation period from first contact to symptom onset ranges from 1 to 14 days (with some reported cases as long as 24 days); the median time from exposure to first symptoms is 5.1 days with a mean of 6.1 days; and the duration of viral nucleic acid shedding ranges from 8 to 34 days (median 20) after initial symptoms. [8] The global mortality rate is estimated at 2.3%, with a range of 6–41 days from symptom onset to death. [6]
Zhao et al. found that low High-density lipoprotein cholesterol (HDL-c) levels are associated with lower cardiac index, lower venous oxygen saturation, higher pulmonary vascular resistance, and shorter 6-minute walk distance in patients with SARS-COV2 infection. [9] Wei et al. conducted a retrospective study of 597 patients (from February 1 to March 3, 2020) in which they found that Low-density lipoprotein cholesterol (LDL-c) and Triglyceride (TG) levels were inversely correlated with C-reactive protein (CRP) and interleukin 6 (IL-6) values and positively correlated with lymphocyte counts; the decrease in HDL-C levels begins in patients with mild symptoms and progressively worsens as the disease worsens.
2. Materials and Methods
After signing and authorizing informed consent, a cross-sectional, prolific, and analytical study was conducted at a tertiary care center (Centro Médico Nacional La Raza "Dr. Antonio Fraga Mouret") from October 2020 to March 2021. Approved by the institution's ethics committee under folio R-2020-3501-227.
The study was conducted with patients meeting criteria for hospitalization in the COVID-19 Area as a baseline.
The sample size was calculated using the formula for an infinite population (since the prevalence of the infection was unknown due to the newly emerging pandemic) with a confidence level of 80% and an estimated global prevalence of 22.6%, yielding a total of 115 patients plus 10% of those lost, yielding a total of 127 patients. However, due to growing demand, it was decided to include all subjects who met the inclusion criteria during the study period. A total of 822 patients hospitalized in the COVID-19 area were sampled. 30 participants died before sampling, and 19 did not have HDL-C measured due to a lack of reagents. A total of 773 patients were sampled. (Figure 1)
The primary objective was to measure the association between the presence of hypoalphalipoproteinemia and outcome in patients hospitalized in the COVID-19 area of a tertiary care facility in Mexico prior to vaccination. The secondary objectives were to identify the association between lipid profiles (total cholesterol, triglycerides, HDL, LDL, and non-HDL), lipid ratios (TG/HDL, TC/HDL, non-HDL/HDL, LDL/HDL), and outcome in patients hospitalized in the COVID-19 area.
2.1. Inclusion Criteria
The inclusion criteria were age 18 or older, with hospital admission criteria for SARS-CoV-2 infection (PCR-confirmed cases, PCR-negative with pulmonary lesion) in a COVID-19 area with hypoalphalipoproteinemia according to international criteria (women c-HDL 1.3 mmol/L [<50 mg/dL], men 1.04 mmol/L [<40 mg/dL]).
2.2. Non-Inclusion Criteria
The non-inclusion criteria were: pregnancy or breastfeeding.
2.3. Exclusion Criteria:
Exclusion criteria: patients with incomplete PCR tests and lipid profiles, and incomplete lipid profiles.
2.4. Statistical Analysis
2.4.1. Univariate Analysis
The Komolgorov-Smirnov test was performed to determine the distribution of variables. Freely distributed quantitative variables were expressed as medians and interquartile ranges.
2.4.2. Bivariate Analysis
The chi-square test was performed to demonstrate statistically significant differences in dichotomous qualitative variables (outcome and presence of hypoalphalipoproteinemia). The Mann-Whitney U test and the Kruskal-Wallis test (type of sedation) were used for unrelated freely distributed quantitative and qualitative variables (glucose, creatinine, liver function tests, total cholesterol, triglycerides, HDL, LDL, and non-HDL cholesterol, and lipid ratios: TG/HDL, TC/HDL, non-HDL/HDL, and LDL/HDL). The Friedman test was used for related freely distributed variables (body mass index and HDL-C percentiles).
2.4.3. Multivariate Analysis
Multivariate regression was performed to assess the association between HDL-C levels and outcome according to established international levels associated with the Mexican population and percentiles.
Finally, a ROC curve was used to assess the sensitivity, specificity, positive predictive value, and negative predictive value of HDL-C levels as a predictor of survival.
Microsoft® Excel® was used to create the initial database, and the data were subsequently processed using the Statistical Package for the Social Sciences (SPSS)® v. 25 statistical package.
2.4.4. Bias Control
To avoid biases due to inadequate screening, patients with criteria for hospitalization in a COVID-19 area (suspected and confirmed) were included. To avoid susceptibility bias, all patients admitted to hospital who met the inclusion, exclusion, and non-inclusion criteria were included. Sample maintenance and transfer control: Given the growing demand, it was decided to include the entire population who met the criteria.
Quality of the procedure: To avoid performance bias, patients with an incomplete lipid profile or who had died prior to laboratory testing were excluded. Sample collection, laboratory request, and correct patient identification were performed directly by the medical staff in the COVID area participating in this research.
3. Results
Of a total of 822 patients, 773 subjects were eligible; 30 patients died before completing laboratory sampling, and 19 patients did not have a complete lipid profile due to a lack of reagents at our institution. 60.70% (n=469) were discharged home, and 39.30% (n=304) died.
3.1. Discharge Home
Of the patients discharged, 58.60% (n=275) were male and 41.60% (n=194) were female. The median age was 56.00 years (IQR 18.00–90.00; p<0.0001). According to the BMI, 4.00% (n=2) were underweight, 21.10% (n=99) normal weight, 47.10% (n=221) overweight, 21.30% (n=100) grade 1 obesity, 5.80% (n=27) grade 2 obesity and 4.30% (n=20) grade 3 obesity (p<0.001). The most important comorbidities were 45.40% (213) high blood pressure and 27.10% (n=127) type 2 diabetes. In laboratories the mean glucose was 116.00 (IQR 31.00 - 882.00; p<0.001) and c-HDL 29.00 (IQR5.00 - 62.00; p<0.001). A total of 74.00% (n=347) had a positive PCR (p<0.033) and 7.90% (n=37) were mechanically ventilated (p<0.001). (Table 1)
3.2. Deaths
Of the patients who died, 64.10% (n=195) were male, and 35.90% (n=109) were female. The median age was 62.55 (IQR 20.00–97.00; p<0.001). According to the BMI 0.70% (n = 2) were underweight, 23.70% (n = 72) normal weight, 42.80% (130) overweight, 24.30% (n = 74) obesity grade 1, 6.90% (n = 21) obesity grade 2 and 1.60% (n = 5) obesity grade 3 (p < 0.000). The most important comorbidities were 34.90% (n = 106) arterial hypertension and 21.10% (n = 64) diabetes type 2. In laboratories the average glucose was 133.00 (IQR 5.00 - 849.00; p < 0.001) and c-HDL 24.00 (IQR 5.00 - 66.00; p < 0.001). 80.90% (n=246) had positive PCR (p<0.033) and 76.0% (n=231) had assisted mechanical ventilation (p<0.001).
3.3. HDL Cholesterol and Outcome
The association between HDL-C cholesterol levels and outcome was evaluated. In patients discharged from the hospital, 89.76% (n=397) had hypoalpha-lysine levels, and in patients who died, 96.05% (n=304), with statistical significance (p<0.001); it was more frequent in males in both cases. (Table 1)
3.4. Multivariate Regression Analysis of HDL-C and Outcome
A ROC curve was performed, finding an area under the curve of 65.10% for survival. A cut-off point of c-HDL of 0.64 mmol/L ( ≥ 24.7 mg/dL) was found, which gave a sensitivity of 69.94%, Specificity 51.64%, Positive predictive value 69.05%, Negative predictive value 52.68%, Positive likelihood ratio 1.45, Negative likelihood ratio 0.58, diagnostic accuracy 62.74% (p < 0.001) (Figure 2)
Multivariate regression analysis was performed based on HDL-C values and outcome, and an r value of 0.687 was found, indicating a strong association between HDL-C levels and outcome. In the multivariate regression analysis, statistical significance was found with higher mortality in women, with a HR of 2.40 (95% CI 1.03–5.61; p<0.043) in model 1. (Table 2) In model 2, when HDL-C levels were divided into percentiles, statistical significance was found with HDL-C levels >34.00 mg/dL, HR of 0.44 (95% CI 0.31–0.62; <p0.009). (Table 2)
Finally, a Kaplan-Meier survival curve was performed according to the c-HDL values reported from the ROC Curve, of a total of 773 patients, there were 298 deaths (47.3%) at 19 days of hospital stay, 50% of the outcome was reached (p<0.001). (Figure 3)
3.5. Other Findings
In the multivariate analysis, statistical significance was found for comorbidities such as hypertension HR 3.53 (95% CI 2.04–6.11; p<0.001) and type 2 diabetes HR 2.39 (95% CI 1.19–4.81%; p<0.015).
4. Figures, Tables and Schemes
4. Discussion
SARS-CoV-2 infection is a pandemic that has gained global significance since 2019. It has generated significant costs in several countries. The severity of the infection has been associated with advanced age or multiple comorbidities such as systemic arterial hypertension, type 2 diabetes, obesity, and immunosuppression, among others.
Several studies have demonstrated the association of lipid profile alterations in patients with SARS-CoV-2 infection. This could be explained by the multisystem involvement that generates mild liver inflammation (which causes a decrease in cholesterol synthesis in all its forms), systemic vasodilation (which generates lipid deposits in peripheral tissues), and high lipid concentrations (present in lung exudates).
Wei, X. et al. found that triglyceride levels are affected in patients with SARS-CoV-2 compared to patients with viral pneumonia. [9]
4.1. Hypoalphalipoproteinemia
Hypoalphalipoproteinemia is defined as low HDL-C levels [11]. The cutoff value defined by the Adult Treatment Panel III (ATP III) of the US National Cholesterol Education Program (NCEP) is <40 mg/dL [10]. However, international cutoff values for men are <40 mg/dL and <50 mg/dL for women, which are also used in the definition of metabolic syndrome [11].
In Mexico, thanks to the CARMELA study by Escobedo et al., the main dyslipidemia in Mexico is hypoalphalipoproteinemia, with a prevalence of 22.6% of Mexicans (values <35 mg/dL), followed by hypertriglyceridemia, and thirdly, hypercholesterolemia [12].
Given the aforementioned modifications, the primary objective of our study was to better understand the relationship between the outcomes of patients hospitalized in the COVID area and the presence of hypoalphalipoproteinemia.
In our study, a prevalence of hypoalphalipoproteinemia was found in patients hospitalized in the COVID area of 77.9% of the reported cases. The most frequent comorbidities in patients discharged from the hospital were 45.40% (213) had high blood pressure and 27.10% (n=127) had type 2 diabetes. In patients who died, the most important comorbidities were: 34.90% (n=106) had high blood pressure and 21.10% (n=64) had type 2 diabetes.
4.2. SARS-CoV 2 Infection and Lipid Alterations
HDL-C exhibits vasodilatory activity (stimulates nitric oxide production, promotes prostacyclin release, and decreases reactive oxygen species production); Anti-inflammatory (regulates molecular adhesion molecules, inhibits monocyte activation, decreases proinflammatory macrophages and signaling pathways such as necrosis factor kappa-betta (NFKB) and tumor necrosis factor α (TNF-α); antioxidant (protects against LDL-C oxidation and inhibits cellular superoxide production); cytoprotective (prevents apoptosis and extracellular matrix degradation by serpin peptidase inhibitors); glucose metabolism modulator (stimulates pancreatic insulin secretion and decreases insulin resistance).
These anti-inflammatory, antiatherogenic, antioxidant, and anticoagulant properties of HDL-C, which improve vascular function, have long been recognized. [13] This has led to its usefulness as a biomarker of severity and predictor of survival in various systemic pathologies such as atherosclerosis, pulmonary arterial hypertension, and pulmonary atherosclerosis. Furthermore, HDL-C levels are inversely related to patients' cardiovascular risk.
Nofer et al. demonstrated that HDL-C stimulates nitric oxide release from human endothelial cells and promotes aortic vasodilation thanks to three lysophospholipids present in HDL-C: sphingosylphosphorylcholine, sphingosine-1-phosphate, and lysosulfatide. [14]
Petrilli et al. found that hyperlipidemia was associated with fewer hospitalizations in patients with COVID-19 infection. [16] Wei et al. found that the development of hypolipidemia in patients infected with SARS-CoV-2 begins with mild symptoms and progressively worsens as the disease worsens. [15]
Finally, Xiuqi Wei et al. in 2020, in a retrospective study examining serum LDL-C, HDL-C, and TC levels in 597 patients with COVID-19, found significant decreases in LDL-C, Triglycerides and HDL-C decreased only in critically ill patients; in addition, an inverse relationship was found: the greater the hypolipidemia, the greater the elevation of C-reactive protein. [16]
- SARS-CoV-2 could damage liver function by reducing LDL-C biosynthesis.
- Serum transaminase levels show a moderate increase, which could indicate mild liver inflammation secondary to the presence of proinflammatory cytokines such as TNF-α, interleukin-6 (IL-6), and interleukin 1β (IL-1β), which modulate lipid metabolism.
- Lipids are vulnerable to degradation by free radicals, whose levels are elevated in viral infections.
- There is an alteration in vascular permeability, causing the leakage of cholesterol molecules into tissues such as the alveolar spaces to form exudates.
- Swab analysis shows elevated protein (>2.9 g/dL) and cholesterol (>45 mg/dL) levels due to increased vascular permeability.
Currently, the factors associated with severity in patients infected with SARS-CoV-2 are not fully understood, as they do not appear to be related to viral load. Among the severity profiles, the following have been observed: increased production of IL-6, IL-7, TNF, and chemokines; hyperactivation of monocyte-derived macrophages; a procoagulant state; and elevated levels of fibrin degradation products (D-dimers). [21,22,23] And the presence of lipid abnormalities appears to be associated with early stages of infection and severity. [24,25]
In our study, according to outcome, the prevalence of hypoalphaliporoteinemia was 89.76% (n = 397) in hospital discharges and in 96.05% (n = 304) of functions. It is more common in men than in women, but more severe in women.
A study of survival adjusted by multiple regression showed a higher mortality rate in patients with hypertension (HR 3.53; 95% CI 2.04–6.11; p<0.001), type 2 diabetes (HR 2.39; 95% CI 1.19–4.81; p<0.015), and hypoalphalipoproteinemia (HR 2.40; 95% CI 1.03–5.61; p<0.043).
When performing a ROC curve, a cut-off point of c-HDL of 0.64 mmol/L (24.7 mg/dL) was found, which gave a sensitivity of 69.94%, specificity 51.64%, positive predictive value 69.05%, negative predictive value 52.68%, positive likelihood ratio 1.45, negative likelihood ratio 0.58, diagnostic accuracy 62.74% (p < 0.001) for survival.
5. Conclusions
Statistical significance was found between hypoalphalipoproteinemia and outcome in hospitalized patients in the COVID area. A cutoff of HDL-C ≥ 0.64 mmol/L (≥24.7 mg/dL) has a sensitivity of 69.94% and specificity of 51.64%, positive predictive value of 69.05%, and negative predictive value of 52.68% for survival.
Our data conclude that hypoalphalipoproteinemia occurs in the early stages of the disease, is a positive predictor of severity, and a cut-off point > 0.64 mmol/L (≥24.7 mg/dL) increases the probability of survival, since hypoalphalipoproteinemia appears to present a greater risk factor for mortality in females.
Institutional Ethics Committee Statement
The study was conducted in accordance with the Declaration of Helsinki and was approved by a tertiary care center (Centro Médico Nacional La Raza "Dr. Antonio Fraga Mouret") from October 2020 to March 2021. Approved by the institution's ethics committee under folio R-2020-3501-227.
Author Contributions
Rosa Nayely, Hernández Flandes, Marisela Jiménez Sánchez, María del Pilar, María del Pilar, María del Pilar, and Jose Antonio Morales González: Conceptualization, methodology, writing (original draft preparation and project administration); Tapia González Maria de los Ángeles, Mendoza Martínez Pedro, Sosa Caballero Alex, Alamilla Lugo Lisnday, Hernández Lara Liliana, Herrera Diaz Clauda Itzel, Santoyo Gómez Dennis Lizeth, Hernández Rios Alex Alfonso, González Miranda Blanca Itzel: methodology, formal analysis, supervision, writing (review and editing). All authors have read and agreed to the published version of the manuscript.
Funding
Laboratory tests and imaging studies were provided by the Mexican public health system of the Mexican Social Security Institute.
Acknowledgments
Muñoz Solís Andrés, without whose participation, teaching, guidance, and dedication this protocol would not have been possible. May he rest in peace.
Conflicts of interest
The authors declare no conflicts of interest.
Abbreviations
The following abbreviations are used in this manuscript:
| CDC | Disease Control and Prevention (CDC) |
| ACE | Angiotensin 2 receptor |
| CRP | C-reactive protein |
| IL-6 | Interleukin 6 |
| NFKB | Necrosis factor kappa-betta |
| TNF-α | Tumor necrosis factor α |
| IL-1β | interleukin 1β (IL-1β) |
| BMI | Body Mass Index |
| HDL-c | High-density lipoprotein cholesterol |
| LDL-c | Low-density lipoprotein cholesterol |
References
- Groups at Higher Risk for Severe Illness. Centers for Disease Control and Prevention (CDC). [Online]; 2020. Accessed June 5, 2020. Available at: https://www.cdc.gov/coronavirus/2019-ncov/need-extra-precautions/groups-at-higher-risk.html.
- Peng Y MKGH. Clinical Characteristics and Outcomes of 112 Cardiovascular Disease Patients Infected by COVID-19. Zhonghua Xin Xue Guan Bing Za Zhi. 2020; 48(6): p. 450-455.
- Suárez V, Suárez M, Oros S. Epidemiology of COVID-19 in Mexico: from February 27th to April 30th, 2020. Revista Clínica Española. 2020; X(X).
- Epidemiologia DGd. Covid-19 Mexico. [On-line]; 2020. Accessed June 6, 2020. Available at: http://coronavirus.gob.mx/datos/.
- Orioli L, Hermans M, Thissen J. COVID-19 in diabetic patients: Related risks and specifics of management. Ann Endocrinol. 2020; 81(2-3): p. 101109. [CrossRef]
- Wei X, Zeng W, Su J. Hypolipidemia is associated with the severity of COVID-19. J Clin Lipidol. 2020; X(X): p. 1-8.
- Petrakis D, Margină D, Tsarouhas K. Obesity a risk factor for increased COVID 19 prevalence, severity and lethality (Review). Mol Med Rep. 2020; 22(X): p. 9-19.
- Guzik T, Mohiddin S, Dimarco A. COVID-19 and the cardiovascular system: implications for risk assessment, diagnosis, and treatment options. Cardiovasc Res. 2020; X(X): p. 1-22. [CrossRef]
- Wei, X., Zeng, W., Su, J., Wan, H., Yu, X., Cao, X., Tan, W., & Wang, H. (2020). Hypolipidemia is associated with the severity of COVID-19. Journal of Clinical Lipidology, 14(3), 297–304. [CrossRef]
- Cleeman, J. I. (2001). Executive summary of the third report of the National Cholesterol Education Program (NCEP) expert panel on detection, evaluation, and treatment of high blood cholesterol in adults (adult treatment panel III). Journal of the American Medical Association, 285(19), 2486–2497. [CrossRef]
- Cheng, T. O. (2007). Cardiac syndrome X versus metabolic syndrome X. International Journal of Cardiology, 119(2), 137–138. [CrossRef]
- Escobedo de la Peña J, Pérez R, Schargrodsky H, Champagne B. Prevalence of dyslipidemias in Mexico City and its association with other cardiovascular risk factors. Results of the CARMELA study. Medical Gazette of Mexico. 2014; 150: p. 128-36.
- Zhao Q, Peng F, Wei H. Serum high-density lipoprotein cholesterol levels as a prognostic indicator in patients with idiopathic pulmonary arterial hypertension. Am J Cardiol. 2012; 110(3): p. 433-439. [CrossRef]
- Nofer J, Van der Giet M, Tölle M. J Clin Invest. 2004; 113(4).
- Petrilli C JSYJRH. Factors associated with hospitalization and critical illness among 4103 patients with Covid-19 disease in New York City. BMJ. 2020; 369: p. 1-15.
- Wei, X., Zeng, W., Su, J., Wan, H., Yu, X., Cao, X., Tan, W., & Wang, H. (2020). Hypolipidemia is associated with the severity of COVID-19. Journal of Clinical Lipidology, 14(3), 297. [CrossRef]
- Funderburg, N. T., & Mehta, N. N. (2016). Lipid Abnormalities and Inflammation in HIV Inflection. Current HIV/AIDS Reports, 13(4), 218–225. [CrossRef]
- Hwang, D. M., Chamberlain, D. W., Poutanen, S. M., Low, D. E., Asa, S. L., & Butany, J. (2005). Pulmonary pathology of severe acute respiratory syndrome in Toronto. Modern Pathology, 18(1), 1–10. [CrossRef]
- Genest, J., Bard, J. M., Fruchart, J. C., Ordovas, J. M., & Schaefer, E. J. (1993). Familial hypoalphalipoproteinemia in premature coronary artery disease. Arteriosclerosis, Thrombosis, and Vascular Biology, 13(12), 1728–1737. [CrossRef]
- Lopez D MMSHRABLEG. Diagnostic criteria for hypoalphalipoproteinemia and cut-off point associated with cardiovascular protection in a Mexican mestizo population. Med Clin. 2012; 138(13): p. 551-556.
- Khirfan G, Tejwani V, Wang X. Plasma levels of high density lipoprotein cholesterol and outcomes in chronic thromboembolic pulmonary hypertension. PLoS One. 2018; 13(5): p. 1-14. [CrossRef]
- Jonas K KG. HDL Cholesterol as a Marker of Disease Severity and Prognosis in Patients with Pulmonary Arterial Hypertension. Int J Mol Sci. 2019; 20(14): p. 1-14.
- Zhou Y FBZX. Pathogenic T cell and Inflammatory monoctes incite storm in severe COVID-19 patients. Natl Sci Rev. 2020.
- Merad M, Martin J. Pathological inflammation in patients with COVID-19: a key role for monocytes and macrophages. Nat Rev Immunol. 2020; 20(6): p. 355-362. [CrossRef]
- Tian, S., Hu, W., Niu, L., Liu, H., Xu, H., & Xiao, S. Y. (2020). Pulmonary Pathology of Early-Phase 2019 Novel Coronavirus (COVID-19) Pneumonia in Two Patients With Lung Cancer. Journal of Thoracic Oncology, 15(5), 700–704. [CrossRef]
Figure 1.
Sample size recruitment flowchart.
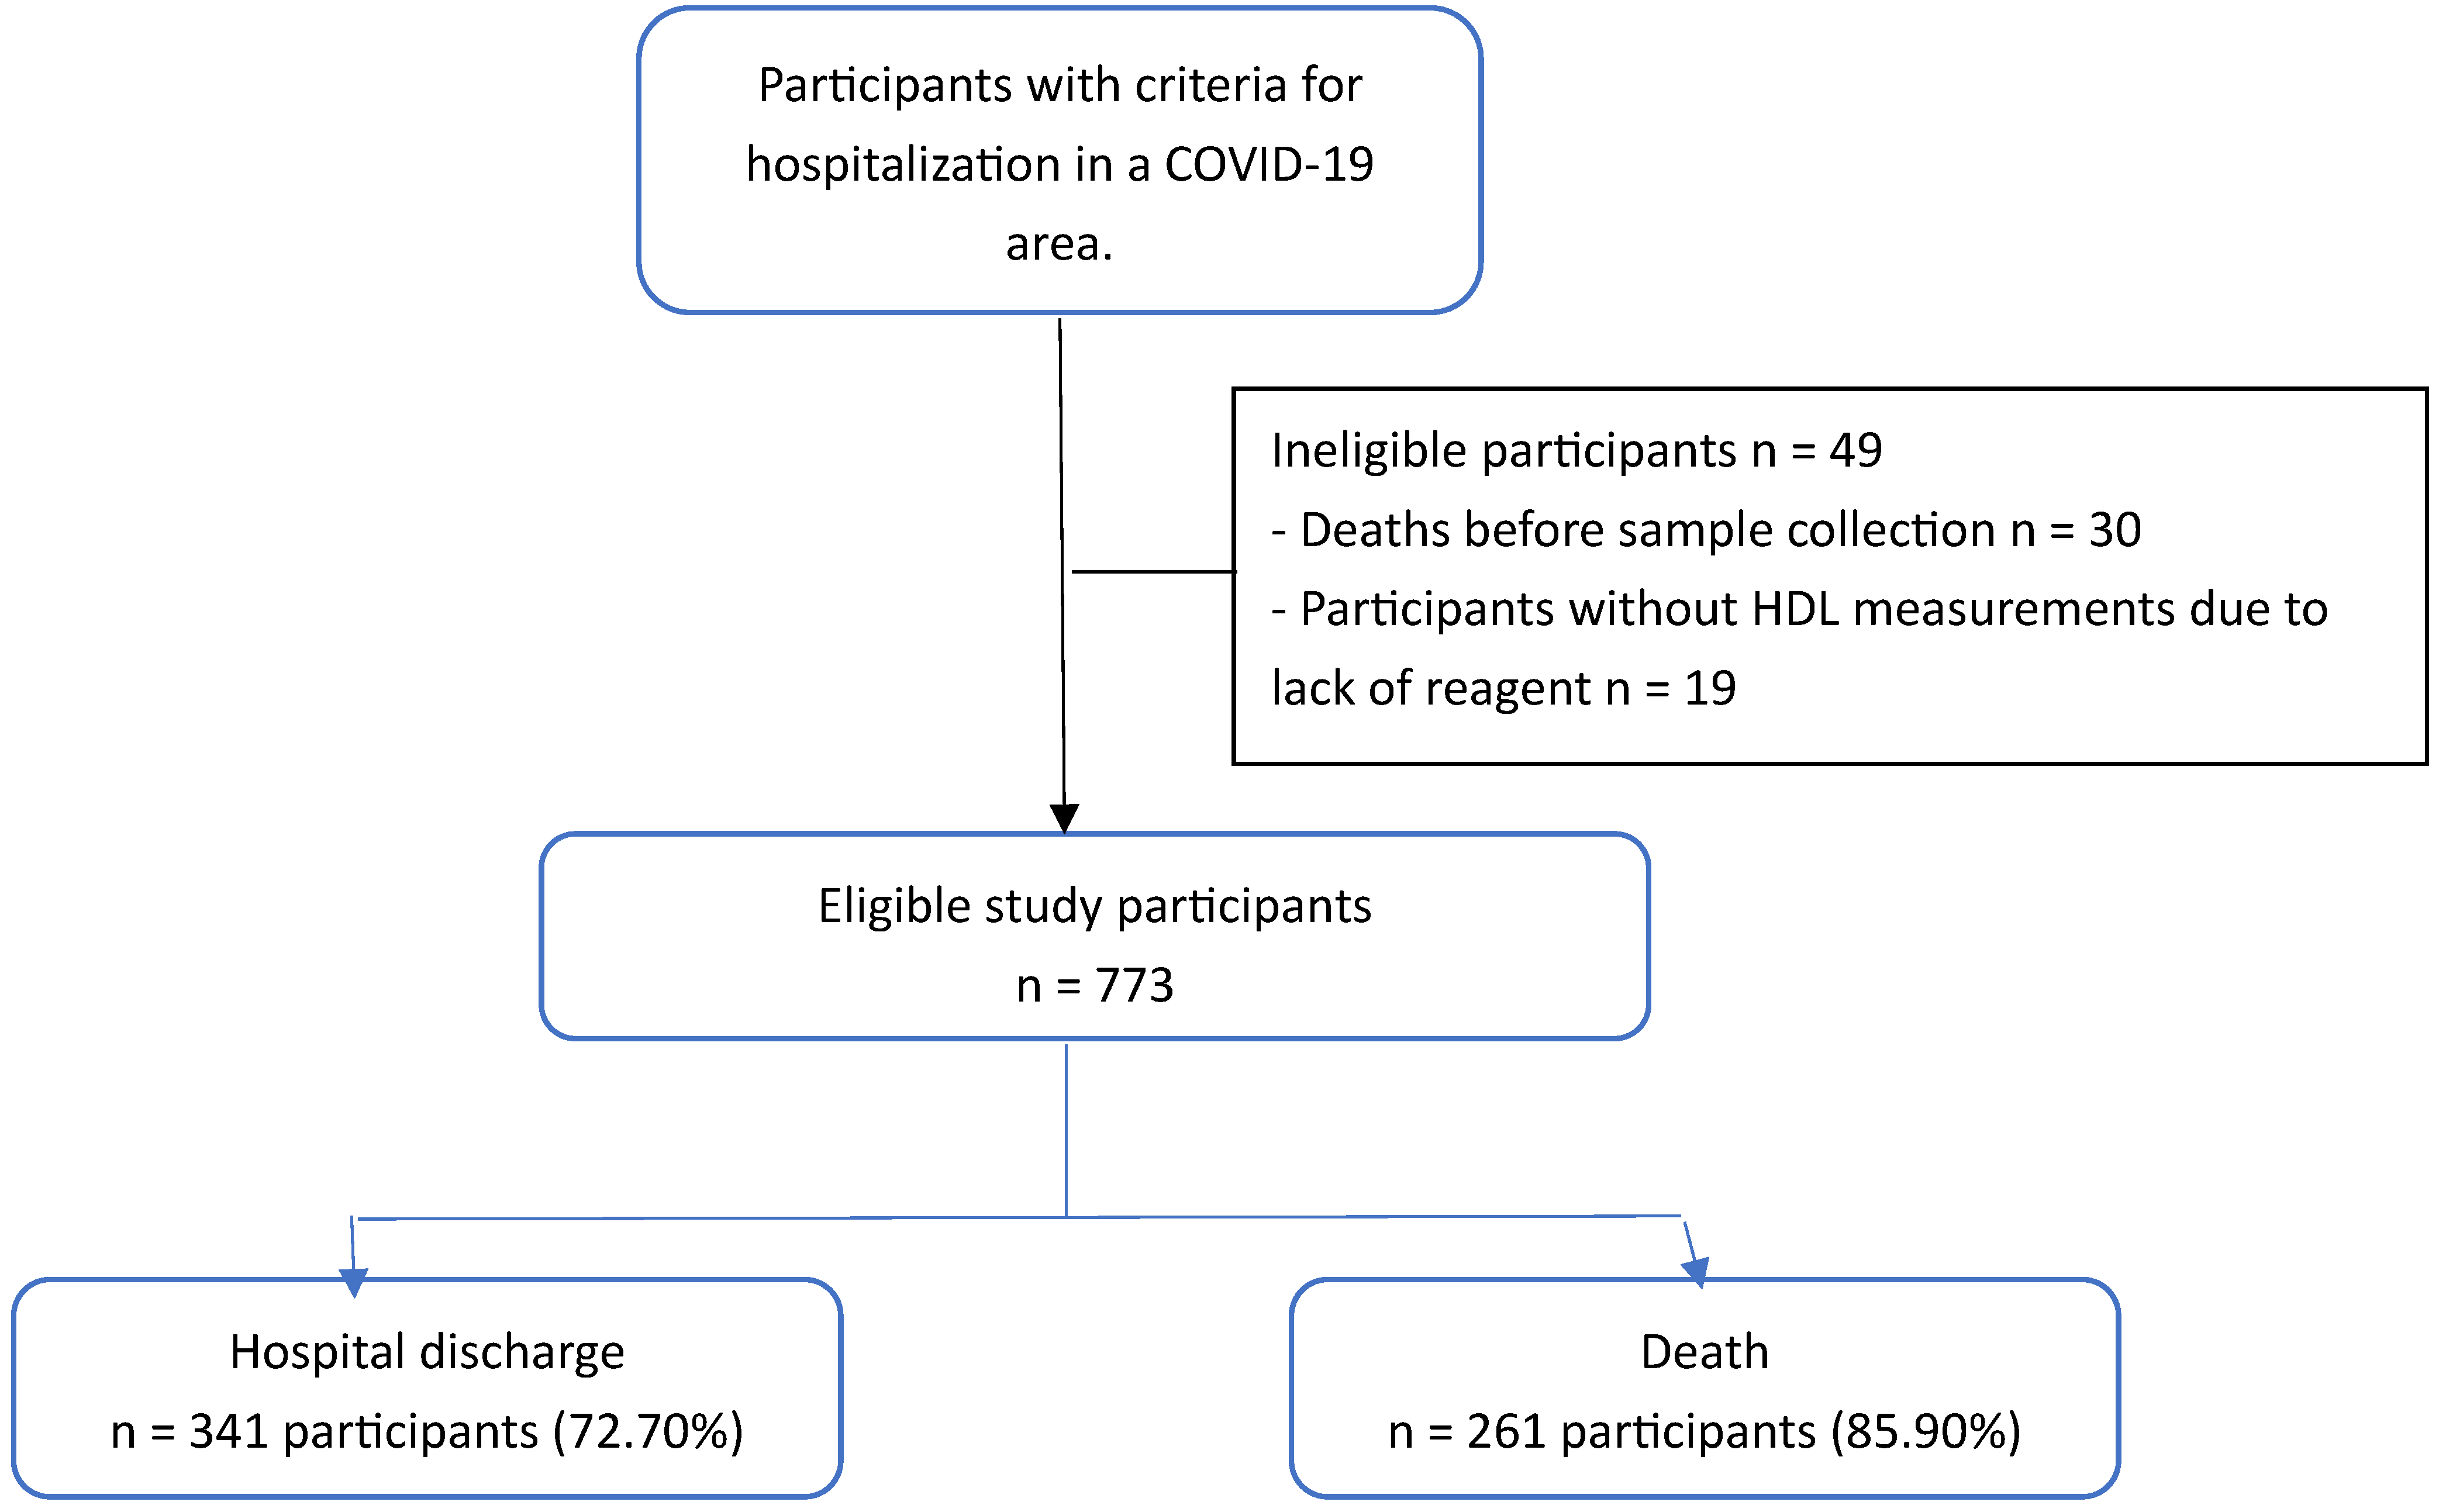
Figure 2.
ROC curve of survival with positive or negative PCR.
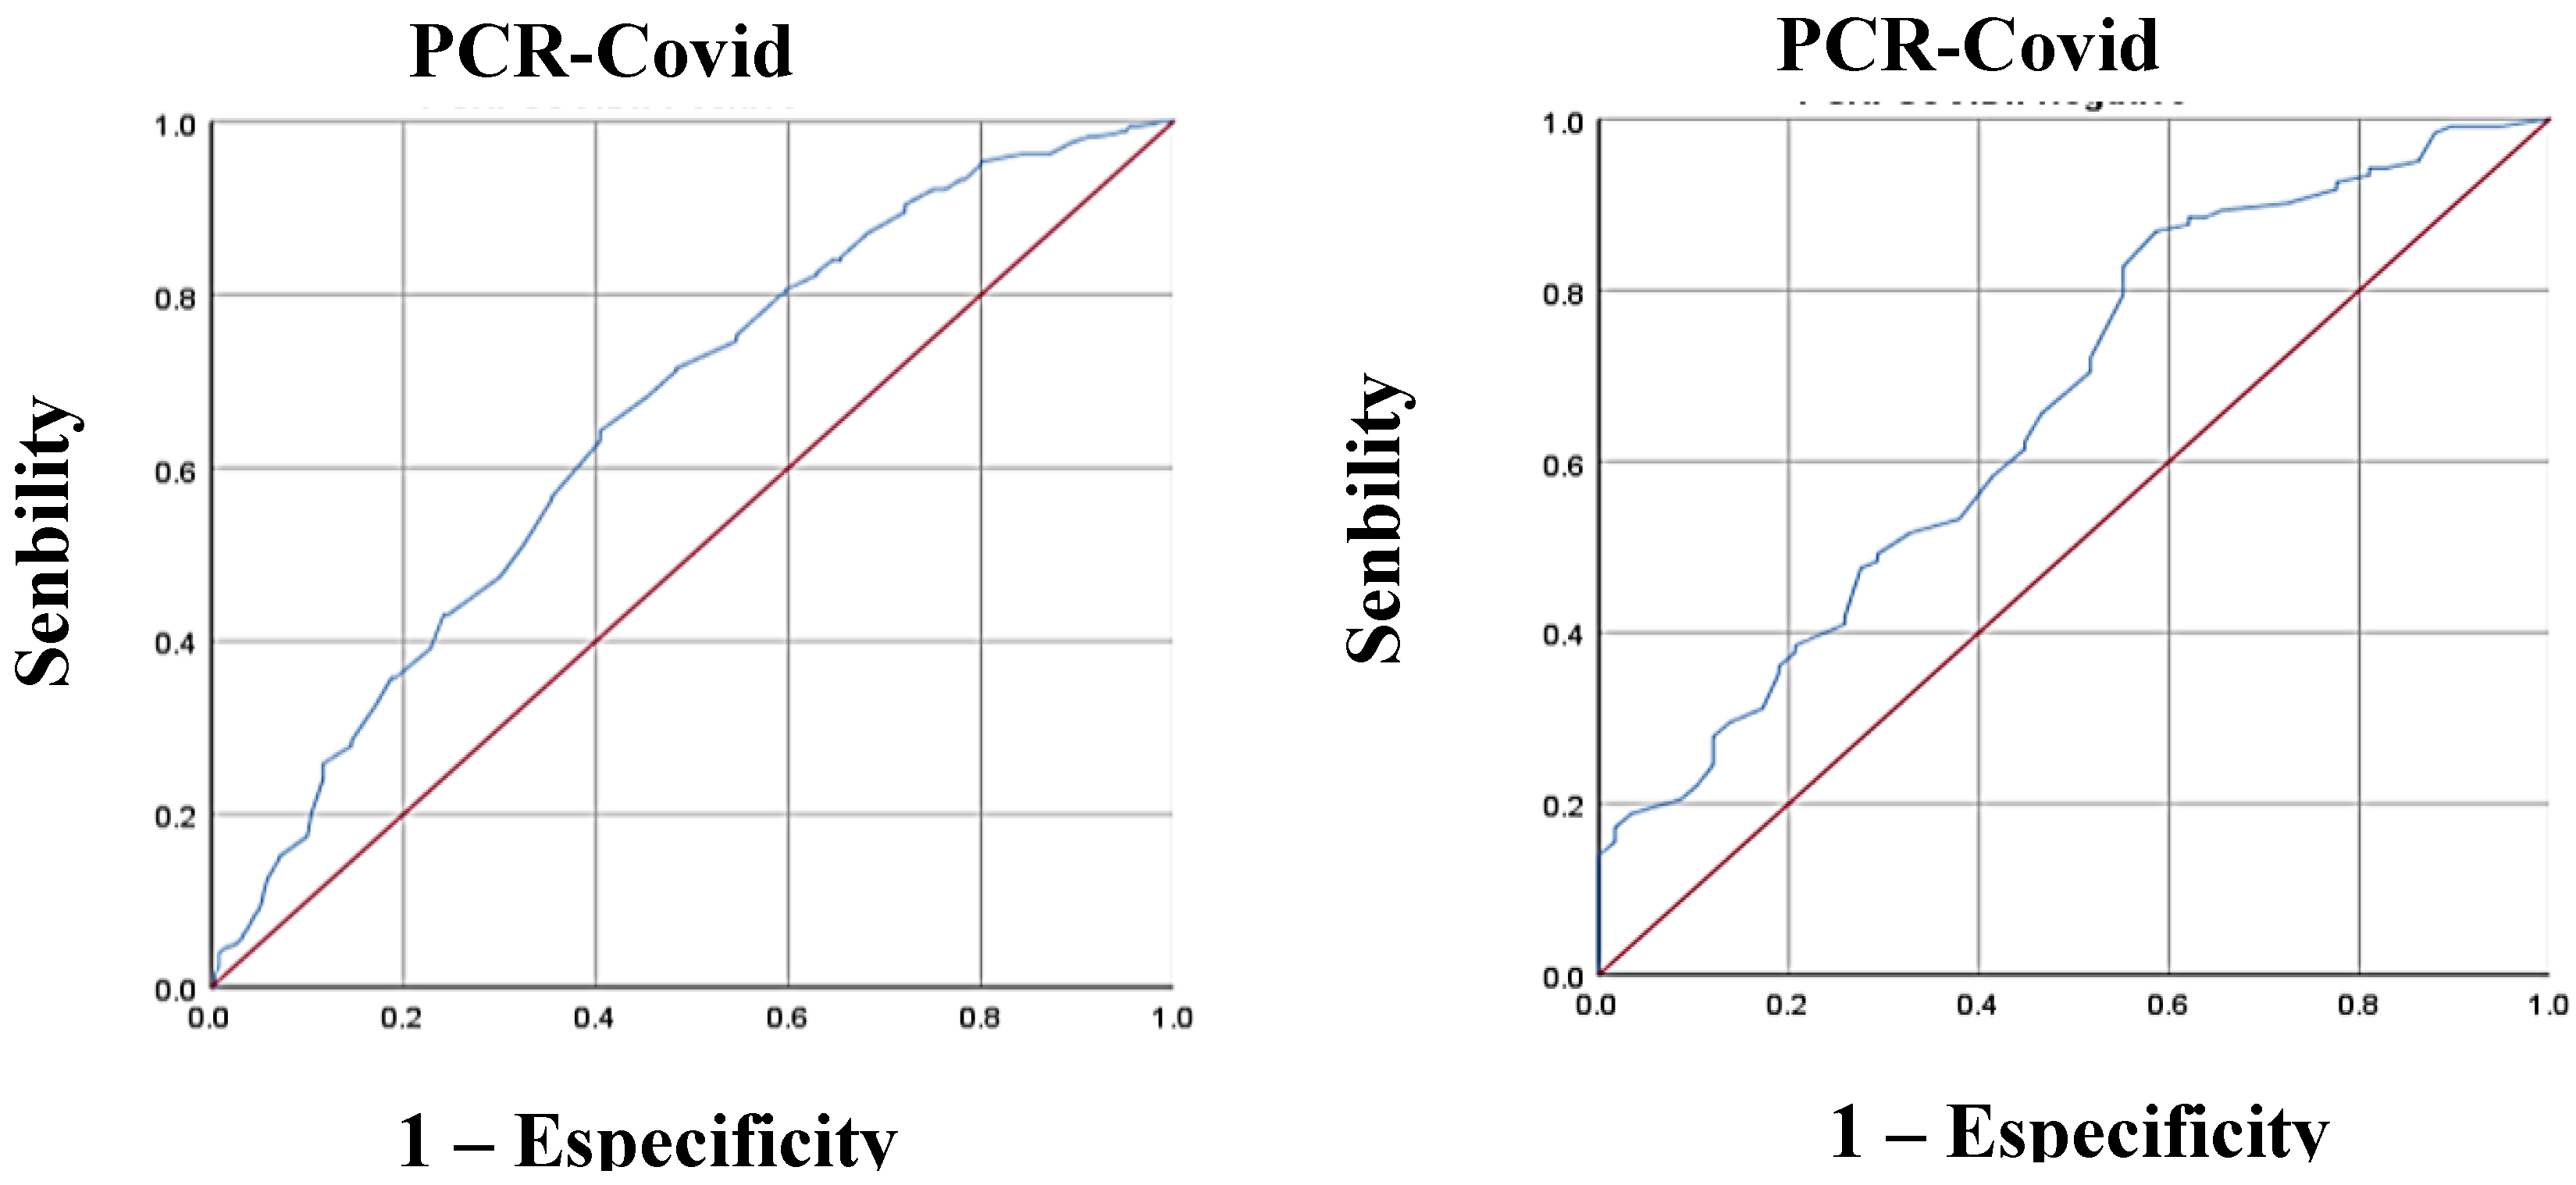
Figure 3.
Kaplan-Meier curves for hypoalpha-proteinemia. Cut-off points established by ROC curve.
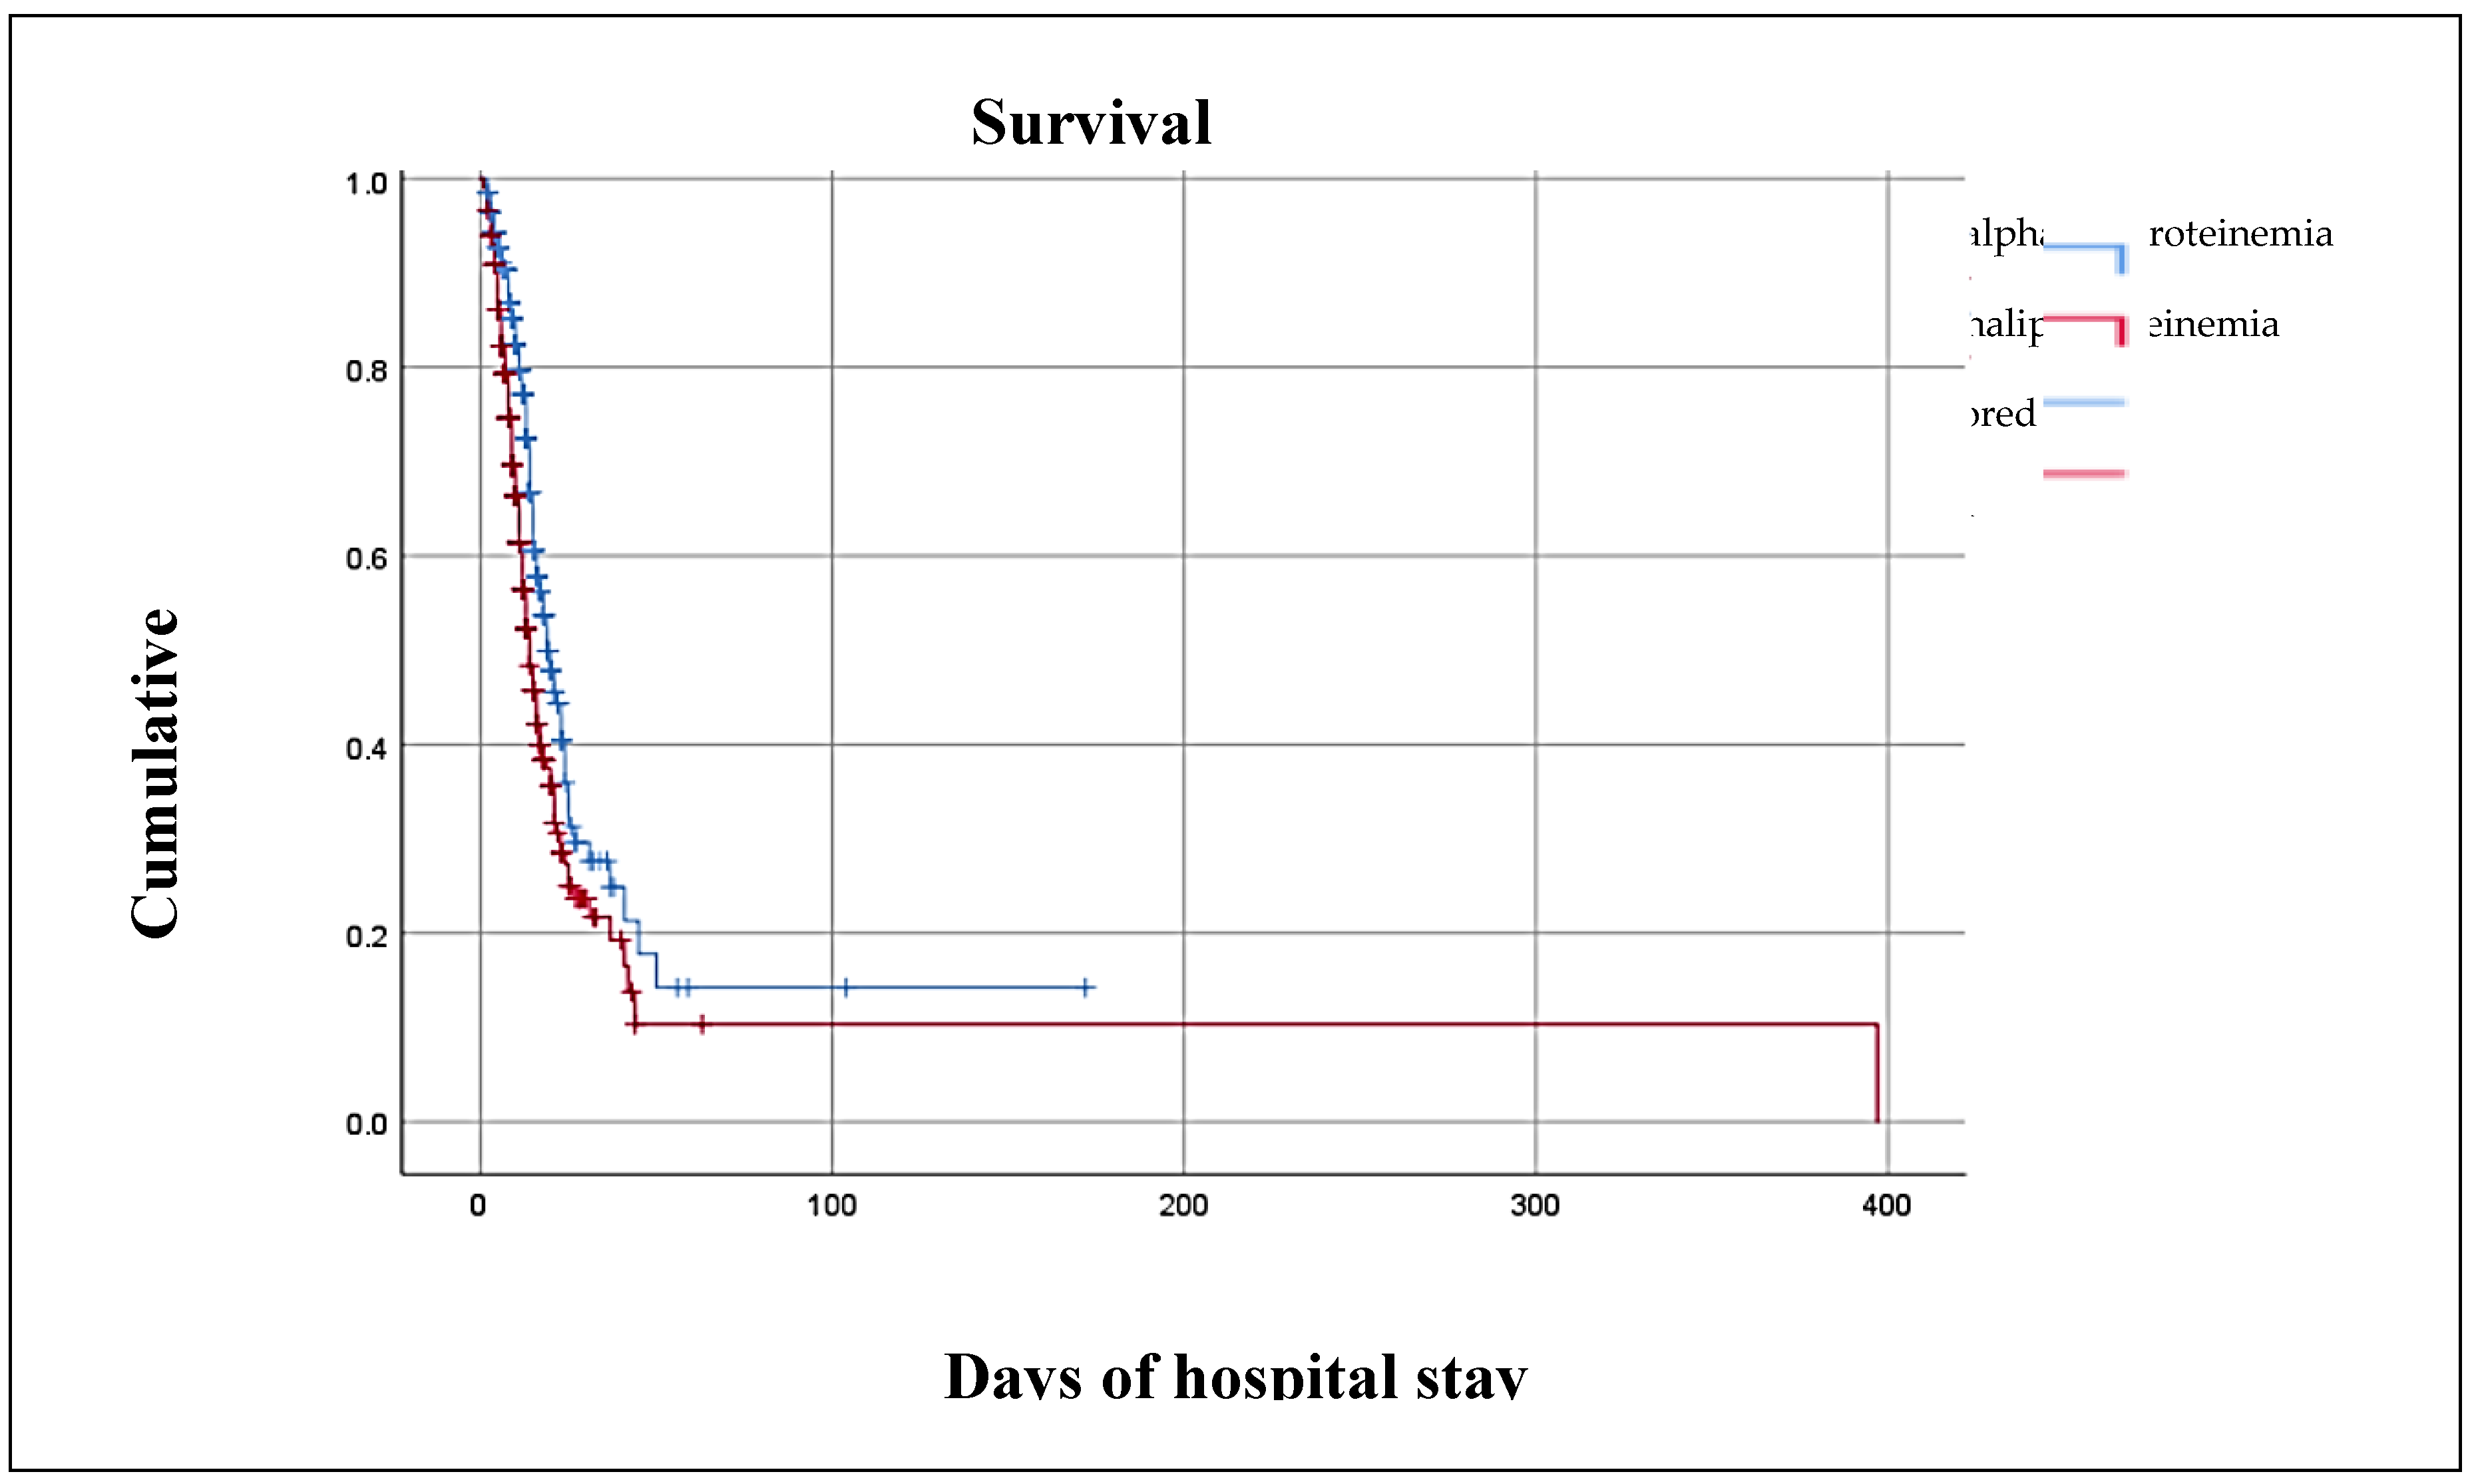

Table 1.
Sociodemographic, clinical and laboratory characteristics by outcome group.
| Variables |
Hospital discharge n = 469 |
Death n = 304 |
p |
|
Age, years 1§ Sex Male 1≠ Female 1≠ Weight, kg § Body Mass Index (kg/m2) 1§ Underweight 1ɷ Normal weight 1 ɷ Overweight 1 ɷ Grade 1 obesity 1ɷ Grade 2 obesity 1ɷ • Grade 3 obesity 1ɷ |
56.00 (18.00 – 90.00) 275.00 (58.60) 194.00 (41.60) 75.00 (39.00 – 160.00) 27.73 (17.15 – 54.69) 2.00(4.00) 99.00 (21.10) 221.00 (47.10) 100.00 (21.30) 27.00 (5.80) 20.00 (4.30) |
62.55 (20.00-97.00) 195.00 (64.10) 109.00 (35.90) 74.00 (40.00 – 120.00) 27.68 (14.88 – 46.05) 2.00 (0.70) 72.00 (23.70) 130.00 (42.80) 74.00 (24.30) 21.00 (6.90) 5.00 (1.60) |
0.000* 0.125 0.572 0.448 0.000* |
| Comorbilities | |||
|
Diabetes Type 1 1≠ Type 21≠ High blood pressure 1≠ Heart disease1 ≠ Autoimmune diseases1 ≠ Neoplasms1 ≠ Hematological diseases1 ≠ Liver disease 1 ≠ Kidney disease1 ≠ Hypothyroidism 1 ≠ Chronic obstructive pulmonary disease (COPD) 1≠ |
2.00 (0.40) 127.00 (27.10) 213.00 (45.40) 31.00 (6.60) 11.00 (2.30) 8.00 (1.70) 17.00 (3.60) 9.00 (1.90) 47.00 (1.00.) 17.00 (3.60) 14.00 (3.00) |
1.00 (0.30) 64.00 (21.10) 106.00 (34.90) 6.00 (2.00) 2.00 (0.70) 4.00 (1.30) 4.00 (1.30) 9.00 (3.00) 18.00 (5.90) 11.0 (3.60) 12.00 (3.90) |
0.162 0.595 0.004* 0.003* 0.075 0.668 0.617 0.524 0.045* 0.996 0.469 |
| Laboratory | |||
|
Glucose (mmol/L) 1§ Creatinine (μmol/L) 1§ Total cholesterol (mmol/L) 1§ High-density lipoprotein cholesterol (HDL-C)(mmol/L)1§ Low-density lipoprotein cholesterol (LDL-C) (mmol/L) 1§ Triglycerides (mg/dl) 1§ TC/HDL 1§ TG/HDL 1§ LDL/HDL 1§ Non-LDL cholesterol/HDL 1§ Total bilirubin (μmol/L)1§ Direct bilirubin )( μmol/L)1§ Indirect bilirubin )(mmol/L)1§ Alanine transaminase (ALT) (U/L) 1§ Aspartate transaminase (AST) (U/L) 1§ Lactic acid dehydrogenase (DHL) (U/L) 1§ Total protein (g/L) 1§ Albumin (g/L) 1§ |
6.44 (1.72 – 48.95) 76.91 (30.94 – 2679.46) 39.00 (4.16 – 77.48) 0.75 (0.13 – 1.61) 2.20 (0.28 – 9.54) 1.76 (0.47 – 10.6) 5.00 (0.05-36.20) 5.087 (0.00 – 111.00) 93.50 (0.55 – 248.54) 4.00 (0.77 – 35.20) 10.26 (1.71 – 1282.5) 5.13 (5.13 – 307.8) 5.13 (5.13 – 171.00) 34.00 (0.40 – 770.00) 36.00 (0.30 – 612.00) 374.00 (4.9 – 17057.00) 36.00 (15.00 – 105.00) 61.00 (20.0 – 120.00) |
7.88 (0.28 – 47.12) 87.52 (38.9 – 2485.52) 36.01 (12.48 – 127.14) 0.62 (0.16 – 1.71) 69.70 (1.81 – 11.97) 2.24 (0.54 – 22.98) 5.72 (0.34-51.02) 8.30 (0.34 – 118.58) 99.93 (0.34 – 118.58) 4.70 (0.79 – 50.02) 10.26 (1.71 – 369.36) 6.84 (1.71 – 251.37) 5.13 (5.13 – 121.41) 39.00 (6.00 – 721.00) 45.00 (6.00 – 4544.00) 491.00 (13.00 – 31468.00) 33.00 (10.00 – 92.00) 60.00 (20.00 – 80.00) |
0.000* 0.000* 0.001* 0.000* 0.000* 0.000* 0.000* 0.000* 0.027* 0.000* 0.327 0.025* 0.749 0.267 0.000* 0.000* 0.000* 0.006* |
| PCR Test | |||
| Positive1≠ | 347.00 (74.00) | 246.00 (80.90) | 0.033* |
| National Early Warning Score 2 (NEWS 2) | |||
|
Low 1ɷ Intermediate 1ɷ High 1ɷ |
206.00 (43.90) 164.00 (35.00) 99.00 (35.00) |
109.00 (35.90) 117.00 (38.50) 78.00 (25.70) |
0.025* |
| Assisted mechanical ventilation | |||
| Yes 1≠ | 37.00 (7.90) | 231.00 (76.00) | 0.000* |
| Days of hospital stay1§ | 10.00 (16.00 – 172.00) | 10.00 (12.00 – 397) | 0.252 |
| Sedation | |||
|
Propofol monotherapy Yes 1≠ No 1≠ Combined propofol Yes 1≠ No 1≠ |
4.00 (10.80) 33.00 (89.20) 27.00 (73.00) 10.00 (27.00) |
54.00 (23.40) 177.00 (76.60) 215.00 (93.10) 16.00 (6.90) |
0.085 0.000* |
| Hypoalphalipoproteinemia | |||
| Yes 1≠ Men 1≠ • Women1≠ |
397.00 (89.76) 268.00 (67.50) 129.00 (32.50)) |
304.00 (96.05) 195.00 (64.15) 109.00 (35.85)) |
0.000* 0.001* 0.000* |
| c-HDL <0.91 (mmol/L) | |||
| Yes1≠ | 330.00 (70.40) | 256.00 (84.20) | 0.000* |
| c-HDL (mmol/L) Percentiles | |||
| < 0.54 (mmol/L) 1ɷ 0.54 – 0.70 (mmol/L) 1ɷ 0.70 – 0.88 (mmol/L) 1ɷ ≥ 0.88 (mmol/L) 1ɷ |
81.00 (17.30) 98.00 (20.90) 132.00 (28.10) 158.00 (33.70) |
116.00 (38.2) 63.00 (20.70) 70.00 (23.00) 55.00 (18.10) |
0.000* |
| c-HDL(mmol/L) ROC curve | |||
| < 0.64 (mmol/L) 1 ≥ 0.64 (mmol/L) 1 |
124.00 (26.40) 345.00 (73.60) |
140.00 (46.10) 164.00 (53.90) |
0.000* |
1 Data are presented as frequencies (percentages) and as medians and interquartile ranges according to the Komolgorov-Smirnov distribution. The ≠ Chi-square test was used for dichotomous variables; § Mann-Whitney U test was used for differences in means for distribution-free quantitative variables; € Kruskal-Wallis test was used for unrelated ordinal qualitative variables; and ɷ Friedman test was used for related ordinal qualitative variables. *Significance is shown in bold and was set at a p-value < 0.05.
Table 2.
0 Modelo de regresión logística binominal ajustado por desenlace.
| Variable | p | OR neto | IC 95% | R2 | P | OR ajustado | IC 95% |
|
Age, years 1§ Body Mass Index (kg/m2) 1§ Underweight 1ɷ Normal weight 1 ɷ Overweight 1 ɷ Grade 1 obesity 1ɷ Grade 2 obesity 1ɷ Grade 3 obesity 1ɷ |
0.000* 0.154 0.425 0.425 0.000* 0.000* 0.000* |
1.022 0.40 1.16 0.86 4.89 0.37 0.38 |
1.01 – 0.03 0.36 – 0.43 0.82 – 1.64 0.61 – 1.22 3.07 – 7.78 0.34 – 0.41 0.35 – 0.41 |
-0.72 -2.611 Reference -0.226 -0.385 -0.959 -0.684 |
0.000* 0.048* 0.767 0.606 0.214 0.437 |
0.93 0.07 0.80 0.69 0.38 0.51 |
0.91 – 0.95 0.01 – 0.98 0.18 – 3.57 0.16 – 2.93 0.08 – 1.74 0.09 – 2.83 |
| Comorbilities | |||||||
|
High blood pressure 1≠ Type 2 diabetes1≠ Heart disease1≠ |
0.003* 0.042* 0.003* |
1.18 1.40 0.69 |
1.05 – 1.32 1.21 – 1.64 0.46 – 1.02 |
1.262 20.710 0.777 |
0.000* 0.015* 0.262 |
3.53 2.39 2.18 |
2-04 – 6.11 1.19 – 4.81 0.56 – 8.46 |
| Laboratory | |||||||
|
Glucose (mmol/L) 1§ Creatinine (μmol/L) 1§ Total cholesterol (mmol/L) 1§ High-density lipoprotein cholesterol (HDL-C)(mmol/L)1§ Low-density lipoprotein cholesterol (LDL-C) (mmol/L) 1§ Triglycerides (mg/dl) 1§ TC/HDL 1§ TG/HDL 1§ LDL/HDL 1§ Non-LDL cholesterol/HDL 1§ Aspartate transaminase (AST) (U/L) 1§ Lactic acid dehydrogenase (DHL) (U/L) 1§ |
0.000* 0.029* 0.005* 0.000* 0.000* 0.000* 0.000* 0.000* 0.031* 0.000* 0.048* 0.046* |
1.00 1.01 0.98 0.99 0.99 1.00 1.41 0.97 1.00 0.77 1.00 1.30 |
0.99 – 1.00 1.04 – 1.11 0.97 – 0.99 0.96 – 1.02 0.99 – 1.02 1.00 – 1.00 0.97 – 2.06 0.95 – 1.00 1.00 – 1.00 0.54 – 1.00 1.00 – 1.00 1.00 – 1.00 |
-0.003 -0.157 0.042 0.005 0.002 -0.002 -1.065 0.032 -0.008 0.928 0.000 0.000 |
0.042 0.000* 0.053 0.875 0.784 0.092 0.197 0.156 0.001* 0.259 0.936 0.490 |
0.99 0.85 1.04 1.00 1.00 0.99 0.35 1.03 0.99 2.53 1.00 1.00 |
0.99 – 1.00 0.78 – 0.94 1.00 – 1.002 0.94 – 1.07 0.99 – 1.02 0.99 – 1.00 0.07-1.74 0.99 – 1.08 0.98 – 0.99 0.50 – 12.70 0.99 – 1.00 1.00 – 1.00 |
| PCR Test | |||||||
| Positive1≠ | 0.033* | 1.46 | 1.03 – 2.09 | 0.096 | 0.737 | 1.10 | 0.63 – 1.93 |
| National Early Warning Score 2 (NEWS 2) | |||||||
|
Low 1ɷ Intermediate 1ɷ High 1ɷ |
0.111 0.052* 0.550 |
Ref. 1.33 1.42 |
– 1.76 1.02 – 1.98 |
Reference 0.580 0.382 |
0.227 0.085 0.258 |
1.79 1.47 |
0.92 – 3-46 0.76 – 2.84 |
| Assisted mechanical ventilation | |||||||
| Yes 1≠ | 0.000* | 5.96 | 4.80 – 7.41 | -3.839 | 0.000* | 0.02 | 0.01 – 0.04 |
| Hypoalphalipoproteinemia | |||||||
| Hombres Mujeres |
0.001* 0.000* |
1.29 2.05 |
1.14 – 1.47 1.60 – 2.61 |
-0.513 0.875 |
0.401 0.043* |
0.60 2.40 |
0.18 – 1.98 1.03 – 5.61 |
| c-HDL(mmol/L) ROC curve – Model 2 | |||||||
| < 0.64 (mmol/L)1 ɣ ≥ 0.64 (mmol/L)1 ɣ |
0.000* 0.000* |
2.38 0.61 |
1.75 – 3.22 0.51 – 0.72 |
-0.515 -0.515 |
0.184 0.000* |
0.60 1.68 |
0.28 – 1.28 0.78 – 3.58 |
| c-HDL (mmol/L) Percentiles - Model 3 | |||||||
| < 0.54 (mmol/L) 1ɷ 0.54 – 0.70 (mmol/L) 1ɷ 0.70 – 0.88 (mmol/L) 1ɷ ≥ 0.88 (mmol/L) 1ɷ |
0.000* 1.000 0.131 0.000* |
2.95 0.99 0.76 0.44 |
2.12 – 4.12 0.69 – 1.41 0.55 – 1.07 0.31 – 0.62 |
1.402 0.989 1.246 Reference |
0.262 0.306 0.111 0.009 |
4.06 2.69 3.47 |
0.35 – 47.00 0.40 – 17.90 0.75 – 16.07 |
Model 1: Adjusted for age, body mass index, high blood pressure, type 2 diabetes, hypothyroidism, heart disease, glucose, creatinine, total cholesterol, HDL-C, LDL-C, triglycerides, TC/HDL ratio, TG/HDL, LDL/HDL, non-HDL/HDL cholesterol, AST, DHL, NEWS-2 score, mechanical ventilation, hypoalphalipoproteinemia, and HDL-C <35 mg/dL. R2 0.759. Model 2: Adjusted for HDL-C cutoff points on ROC curve. Model 3: Adjusted for HDL-C percentiles. *Significance is shown in bold and was set at a p-value <0.05.
Disclaimer/Publisher’s Note: The statements, opinions and data contained in all publications are solely those of the individual author(s) and contributor(s) and not of MDPI and/or the editor(s). MDPI and/or the editor(s) disclaim responsibility for any injury to people or property resulting from any ideas, methods, instructions or products referred to in the content. |
© 2025 by the authors. Licensee MDPI, Basel, Switzerland. This article is an open access article distributed under the terms and conditions of the Creative Commons Attribution (CC BY) license (http://creativecommons.org/licenses/by/4.0/).
Copyright: This open access article is published under a Creative Commons CC BY 4.0 license, which permit the free download, distribution, and reuse, provided that the author and preprint are cited in any reuse.