
Submitted:
09 June 2025
Posted:
10 June 2025
You are already at the latest version
Abstract
Facilitating the comprehensive adoption of manure and sewage resources (MSR) technologies to establish a business model centred on reduction, reuse, and low pollution has become an urgent priority for achieving high-quality development in the animal husbandry industry. This study analyzes survey data from 412 large-scale dairy farms across 23 provinces in China. The CovAHP method is used to measure the adoption intensity of technology and analyze its mechanisms and underlying logic. The results indicate that value perception, particularly economic value perception, is the strongest driver of adoption intensity. While the direct effect of environmental regulation is limited, it can significantly amplify the influence of value perception on adoption intensity, especially in large-scale farms. The study further finds that incentive-based regulations, such as government subsidies, significantly promote the improvement of manure resource utilization technologies, whereas constraint-based regulations (e.g., fines) have a greater impact on small-scale farms. Additionally, demonstration farms play a key role in promoting best practices and accelerating technology adoption. The study suggests that policies should integrate value perception with targeted financial subsidies and regulatory measures to improve technology adoption, especially with support for small-scale farms. By leveraging demonstration farms to promote successful experiences, the comprehensive adoption of manure resource utilization technologies across the industry can be further improved.
Keywords:
scale dairy farms
; manure and sewage utilization
; value perception
; environmental regulation
; technology adoption intensity
1. Introduction
Results from China’s second national census on pollution sources indicate that the comprehensive utilization rate of livestock and poultry manure reached 78% by the end of 2022 [1,2,3,4] The "Action Plan for Agricultural and Rural Pollution Control (2021-2025)" issued by the Ministry of Ecology and Environment of China aims to further increase this rate to over 80% by 2025 [5]. Utilizing livestock MSR not only minimizes discharge but also transforms waste into productive resources, thereby enhancing the economic viability of dairy farming and increasing farmers' income [6]. Optimizing the adoption strategy of MSR utilization technology is essential for achieving agricultural resource conservation and promoting green and low-carbon development. While significant progress has been made in utilizing MSR – with end-of-pipe treatment facilities equipped in nearly all scale dairy farms1, a considerable number of farms still inadequately manage MSR at its source and during the mid-process stages. Additionally, the lack of adequate process control facilities exacerbates technical gaps and inefficiencies in farming operations2. Addressing these challenges is fundamental for enhancing the effectiveness of MSR utilization.
Scholars have extensively studied the factors influencing the technology adoption of MSR utilization. Farms, as primary adopters, are influenced by internal factors such as individual characteristics, farm resources, and behavioural attitudes [7,8,9,10]. On the other hand, MSR utilization presents an externality issue, where external factors like government policies, subsidies, supervision, and agricultural extension services also shape farmer behaviour [11]. However, existing research has not reached a consensus on the direction and extent of these influences. While some studies suggest that government subsidies can encourage green practices and increase MSR utilization [12,13,14,15], others argue that the effectiveness of policies like environmental regulations in promoting MSR utilization and reducing agricultural pollution requires further validation. Wang et al. (2023) propose that while subsidies for equipment purchases or land rentals are helpful [16], they have limited impact on MSR utilization unless combined with penalties or taxes on non-compliant manure and sewage discharge to better internalize production externalities.
In addition, previous research on the adoption of MSR utilization technologies has primarily focused on the impact mechanisms of value perception or environmental regulation on the decision to adopt single end-of-pipe treatment technologies. This approach neglects the interconnections between technologies, overlooking the fact that MSR utilization is a combination of a series of technologies, including source reduction, process control, and end-of-pipe treatment. Although a small number of scholars have examined the comprehensive process of MSR utilization technologies, the assessment of these technologies has predominantly relied on subjective scoring, which lacks objectivity [15]. Therefore, it is essential to adopt a scientific approach to measure the comprehensiveness of MSR utilization technology applications. This will allow us to explore whether the enhancement of MSR utilization technology adoption in farms is primarily driven by intrinsic factors, such as value perception, or by external factors, such as environmental regulation, or whether it results from a combined influence of both. Further investigation into these mechanisms is warranted.
This study is based on field survey data from 412 scale dairy farms across 23 provinces in China. Using the Cov-AHP method, it calculates the adoption intensity index of MSR utilization technology, incorporating source reduction, process control, and end-of-pipe treatment technologies. The study constructs a theoretical analysis framework for farm technology adoption decision-making, systematically examining the intrinsic motivations and external drivers influencing value perceptions of adopting MSR utilization technology. It explores their impact on enhancing adoption intensity, analyses underlying mechanisms and internal logic and provides empirical evidence and guidelines for standardizing MSR utilization behaviour, improving technical systems, and optimizing related policies. The main contributions of this study are twofold. Firstly, in terms of research content, it comprehensively explores the mechanisms influencing technology adoption of MSR utilization in scale dairy farms, integrating internal and external factors to overcome biases of previous single-perspective studies. Secondly, in terms of methodology, it scientifically measures the adoption intensity of integrated technologies for MSR utilization using an enhanced hierarchical analysis method. This approach considers technical aspects of source reduction, process control, and end-of-pipe treatment, thereby making the variables more representative and credible.
2. Theoretical Structure and Research Hypotheses
The Theory of Planned Behaviour states that farm behavioural decisions hinge on attitudes shaped by value perception. According to the Theory of Perceived Value [18], adopting MSR utilization technology on farms results from weighing perceived benefits against risks. Motivation theory suggests that farm technology adoption is influenced by both internal factors and external policies [19]. Government policies act as substitutes and supplements in the market economy, promoting technology adoption through regulations and incentives. This dual role not only boosts adoption intensity but also supports the sustainability of MSR utilization practices on farms.
Value perception and the adoption of MSR utilization technology
Farms' economic choices result from their resource endowment, individual cognition, and external conditions, resulting in what is termed "emotional choice" [20,21]. This process involves evaluating whether economic behaviours meet their expectations, including perceptions of economic, social, and ecological values. Value perception, as defined by perceived value theory [22], emphasizes that enhancing individuals' understanding of the economic benefits and risks associated with certain behaviours promotes decision-making. MSR utilization technology, with its significant externalities aimed at achieving green production and environmental improvements, can see increased adoption rates through improved perceptions of its ecological, environmental, and social impacts [23,24]. Perceived Value Theory posits that individuals make decisions based on perceived benefits and risks. In the case of dairy farms, economic value perceptions (such as profitability and cost-saving) are typically more influential on larger farms, which have the financial capacity to absorb new technologies. In contrast, ecological value perception (such as reducing pollution) might be more relevant for smaller or regionally less developed farms, where environmental sustainability can offer competitive advantages or align with local community norms.
Based on this, the following hypothesis is proposed:
H1: Value perceptions on economic, social, and ecological factors significantly influence the adoption intensity of MSR utilization technology on farms, with economic value perception having a stronger effect on larger farms, while ecological perceptions are more influential for small farms.
Environmental regulation and the adoption of MSR utilization technology
Environmental issues are typical externalities and the implementation of manure utilization on dairy farms exemplifies this. According to Environmental Economics Theory, regulations can internalize externalities by encouraging farms to adopt more sustainable practices. However, their effectiveness is likely to vary based on farm-specific characteristics. For example, incentive-based regulations (such as subsidies or tax breaks) are typically more attractive to larger farms with greater financial flexibility. On the other hand, constraint-based regulations (such as fines or penalties for non-compliance) may have a stronger impact on smaller farms, which often have limited capital and are more vulnerable to financial penalties. Based on this, the following hypothesis is proposed:
H2: Environmental regulations have significant scale heterogeneity in promoting the adoption of MSR utilization technology, with incentive-based regulations being more effective for large-scale farms, while constraint-based regulations have a greater impact on small-scale farms.
Moderating effect of environmental regulation on value perception and adoption of MSR utilization technology
Economic activities entail making rational decisions aimed at maximizing interests within defined institutional frameworks. In studying the adoption behaviour of pig manure utilization across multiple provinces, Si et al. (2023) found that perceived value directly motivates farmers to adopt such technology [25]. However, Zhu et al. (2021b) noted that while social value perception has minimal impact on adoption, environmental regulations significantly influence farmers' choices [26]. In fact, utilizing MSR involves a complex system requiring new technologies and equipment to boost productivity, alongside promoting effective production models to convert potential into tangible productivity [27]. Enhancing farms' value perception plays a crucial role in fostering internal motivation, while robust policy frameworks offer external support. Incentive-based policies (e.g., subsidies, tax breaks) can make the perceived benefits more tangible, directly enhancing the adoption of resource-efficient technologies, especially in farms where cost considerations are more pronounced (usually larger farms). This moderation effect is expected to be less prominent for smaller farms, which might face greater constraints on implementing technology due to financial limitations.
The role of environmental regulations in strengthening or weakening economic value perception depends on the scale of the farm and the type of regulation in place. The use of incentive-based policies is likely to have a stronger moderating effect in larger farms where economic considerations are central, while constraint-type regulations (e.g., penalties for non-compliance) may have a stronger effect on smaller farms, especially if the regulations directly target pollution or waste management. Based on these insights, we propose the following hypothesis
H3: Environmental regulations, particularly incentive-type regulations, moderate the relationship between economic value perception and technology adoption intensity for dairy farms, with stronger effects in larger farms.
Based on the theoretical analysis presented above, a theoretical framework is costructed illustrating the interplay of value perception, environmental regulation, and the adoption decision of MSR utilization technology (Figure 1).
3. Materials and Methods
3.1. Materials
The data for this article comes from a survey conducted by the Institute of Agricultural Information of the Chinese Academy of Agricultural Sciences, covering 420 scale dairy farms across 23 provinces in China from March to June 2023. The survey included five major dairy production areas: North China (Henan, Hebei, Shandong, Shaanxi), Northeast China & Inner Mongolia (Inner Mongolia, Heilongjiang, Liaoning), Northwest China (Shaanxi, Ningxia, Gansu, Xinjiang), Southern China (Anhui, Fujian, Guangdong, Yunnan, Guizhou, Sichuan, Hunan, Jiangsu), and areas around large cities (Beijing, Tianjin, Shanghai, Chongqing). A total of 412 valid questionnaires were collected, with a sample efficiency of 98.1%. Due to the small sample size from areas around large cities (53), the samples from Beijing (8) and Tianjin (8) were reclassified into the North China production area, while Shanghai (2) and Chongqing (23) were included in the production area of Southern China based on geographical location. Among the survey samples, 287 adopted source reduction technology, 275 adopted process control technology, and 309 adopted end-of-pipe treatment technology, accounting for 69.2%, 66.3%, and 74.5% of the total samples, respectively. The distribution of samples is detailed in Table 1.
3.2. Methods
This study examines the impact of perceived value and environmental regulation on the adoption intensity of MSR utilization technology. The adoption intensity of MSR utilization technology serves as the dependent variable, expressed as follows:
In the formula, Y represents the adoption behaviour of MSR utilization technology, VP represents the value perception variable, ER represents the environmental regulation variable, Xi is the control variable, αi is the parameter to be estimated, and εi is the random error term.
To further explore the moderating effect of environmental regulation on the relationship between value perception and the adoption intensity of MSR utilization technology, we introduce the product term of value perception and environmental regulation, showing as follows:
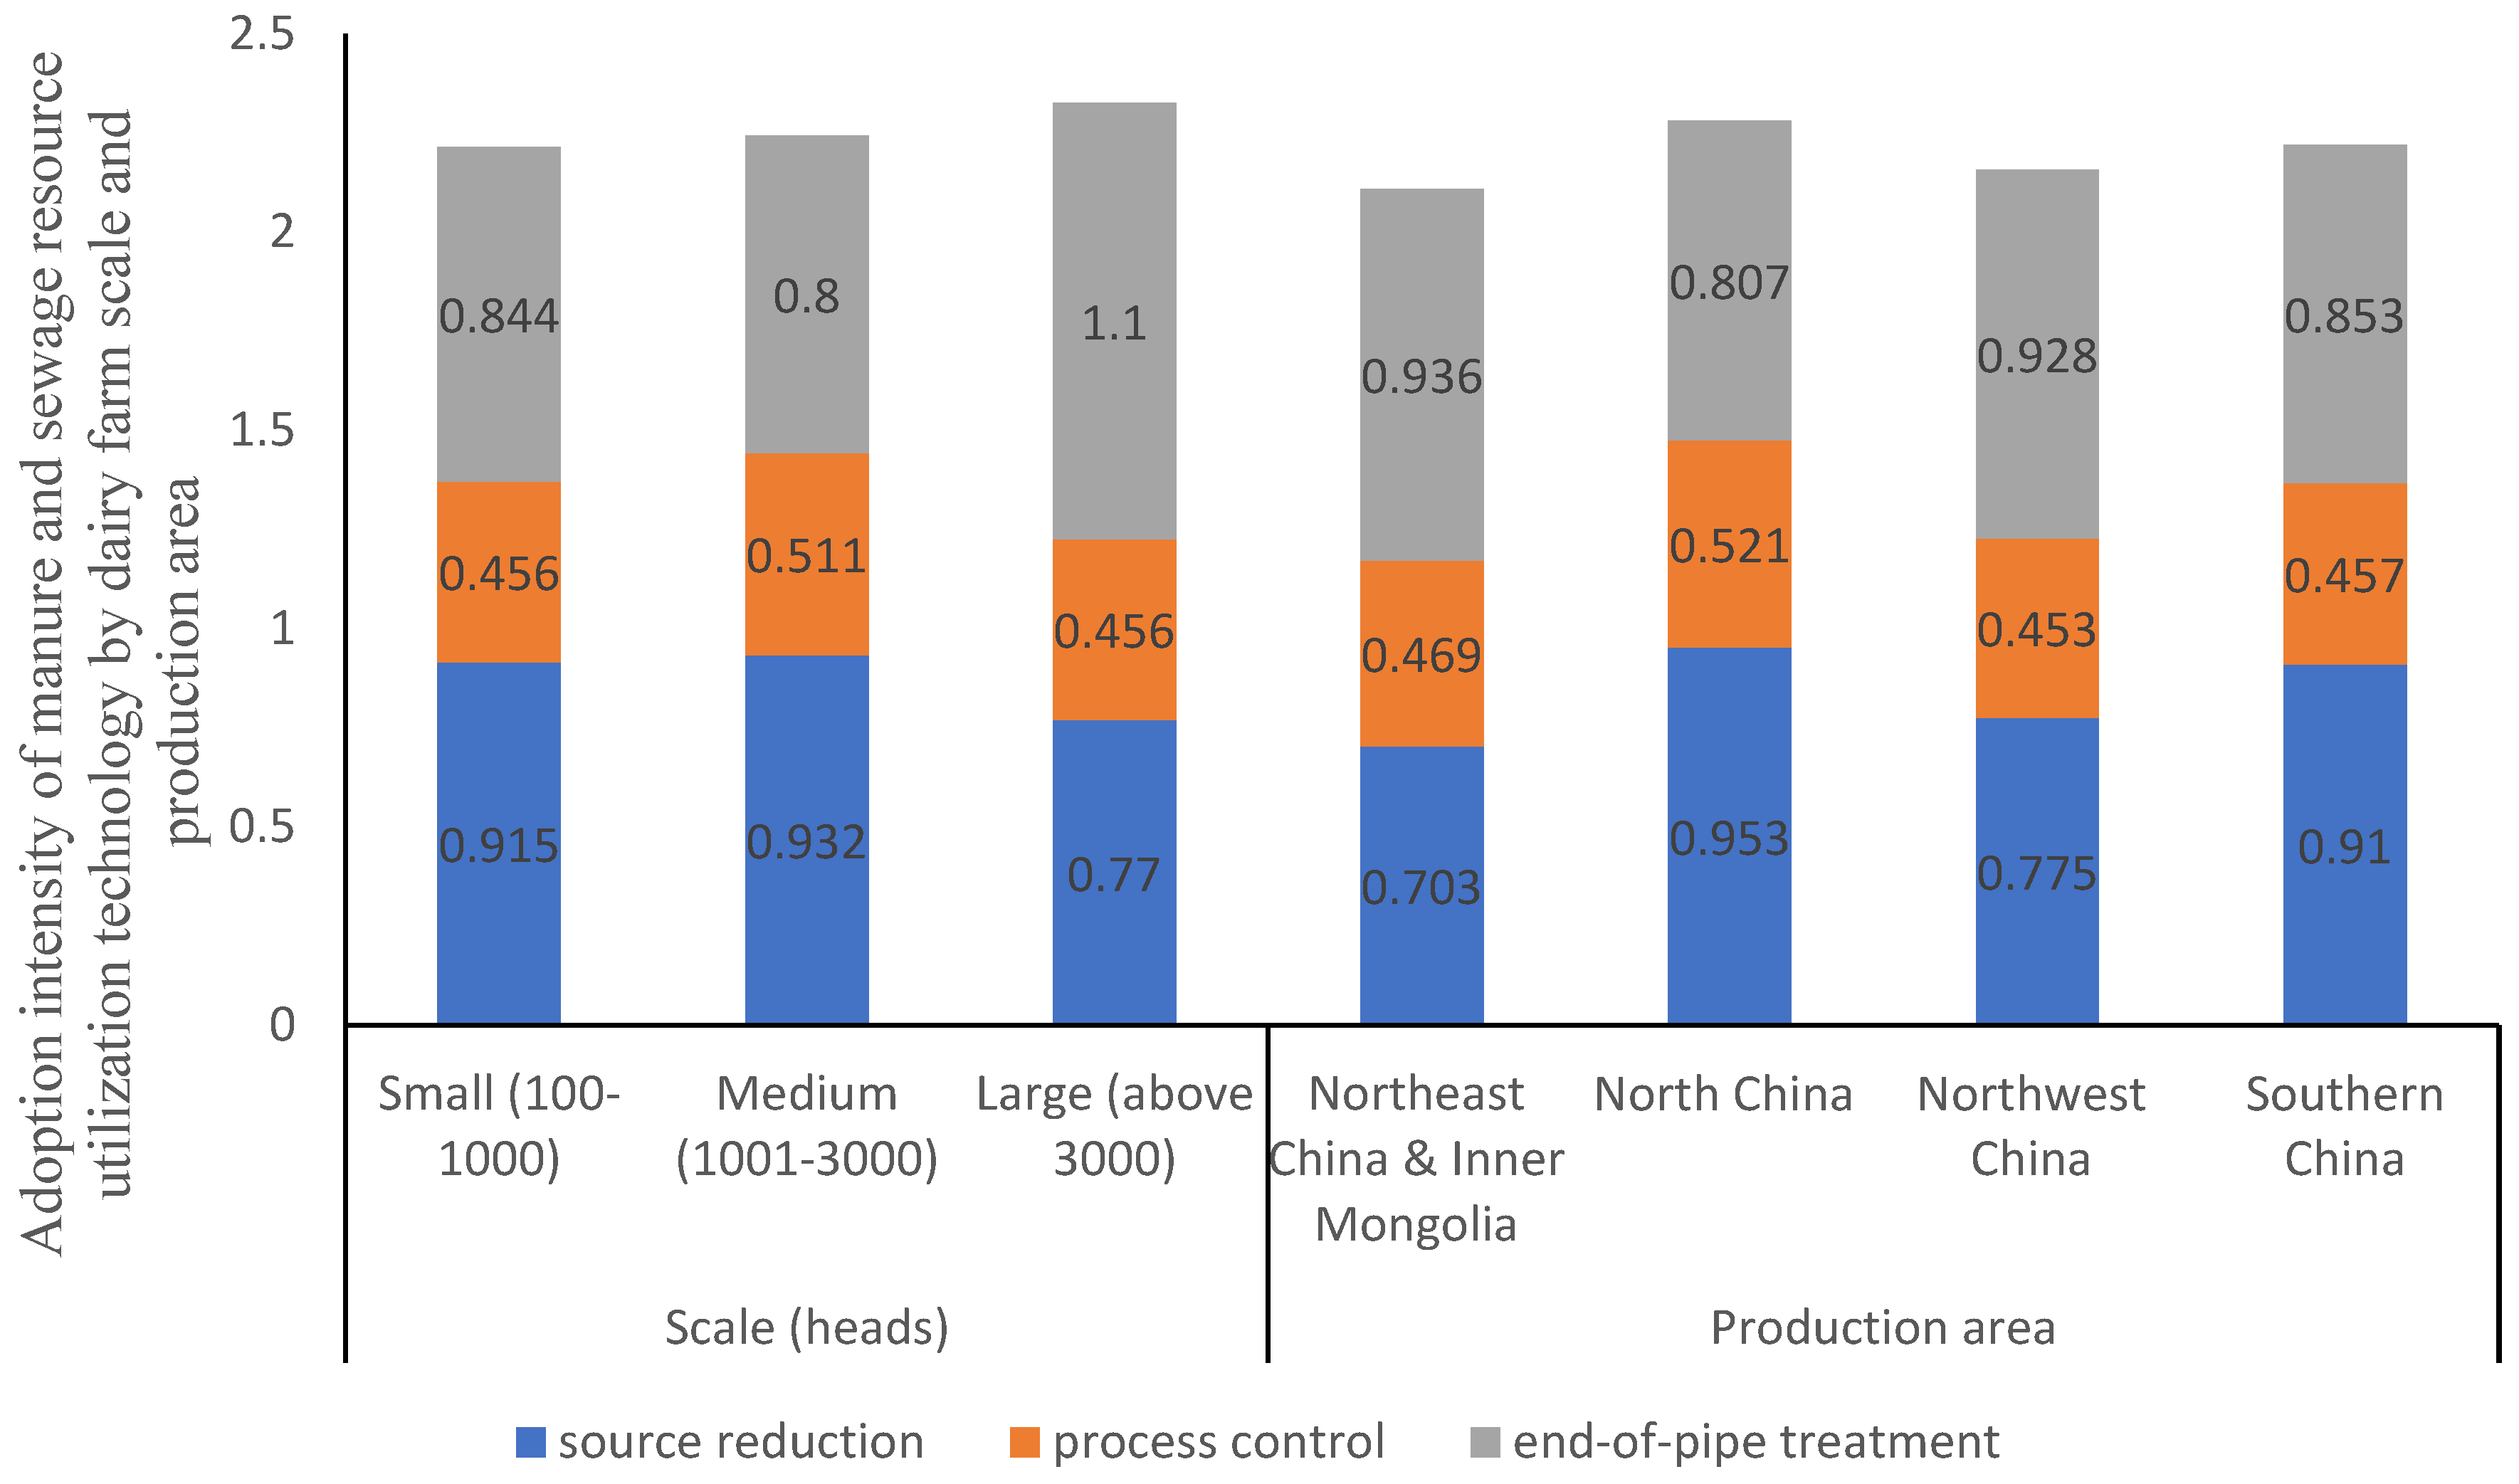
Explained Variables: The explained variable is the adoption intensity of MSR utilization technology in scale dairy farms. According to the "Action Plan for Resource Utilization of Livestock and Poultry Manure (2017-2020)" and related studies [28,29], China's MSR utilization technologies include source reduction (automatic sprinklers, separate sewers, eco-friendly livestock feed, sewage recycling, water-saving drinking fountains), process control (deodorants, manure and sewage treatment bacteria, composting fermentation agents, precision feeding), and terminal treatment (fertilizer production, biogas generation, earthworm breeding, bedding material). Due to variations in adoption and technology types among survey subjects, the study selected the comprehensive application of these technologies as the explained variable. Considering potential dependencies and correlations in adoption decisions [30,31,32], measuring adoption based solely on binary or count data can introduce bias. Thus, the study uses an improved hierarchical analysis method (Cov-AHP) to calculate the adoption intensity of such technologies. Compared to the traditional AHP method, the advantage of Cov-AHP lies in its consistency check of expert scoring, which eliminates data with logical errors. By replacing subjective scores with average covariance, it avoids relying on expert judgment and better integrates the farm technology adoption data, reflecting the actual relationships between technologies, thereby enabling a more reasonable calculation of each farm's technology adoption intensity. The specific calculation steps are as follows: (1) Identify the main technologies for manure resource utilization; (2) Calculate the covariance matrix based on the adoption data of the main technologies, perform transformations, and construct a judgment matrix; (3) Replace subjective scores with average covariance to obtain the weights of each environmentally friendly technology; (4) Measure the CR ratio and perform consistency estimation for the judgment matrix (see the appendix for related results); (5) Calculate the comprehensive weight of each indicator within the overall indicator system. The higher the technology adoption intensity value obtained through this method, the more comprehensive the application of manure resource utilization technologies at the farm, facilitating the synergies between technologies and reducing waste discharge. According to the results, medium-scale dairy farms in North China have higher adoption intensity for source reduction and process control technologies, while large-scale dairy farms in Northeast China and Inner Mongolia exhibit higher adoption intensity for end-treatment technologies. Small-scale farms, however, show relatively inadequate application of manure resource utilization technologies, relying more on extensive direct land application.
Explanatory Variables: The study examines the impact of value perception and environmental regulation on MSR utilization technology adoption, using "value perception" and "environmental regulation" as core explanatory variables. Value perception is assessed across economic, ecological, and social dimensions, each examined through source reduction, process control, and end-of-pipe treatment technologies. Economic value perception includes farming efficiency and income, ecological value perception focuses on reducing harmful emissions and preventing water and soil pollution, and social value perception encompasses the dairy cow welfare, employee well-being, and local living environment improvements. For specific meanings and values, see the Appendix.
Building on existing research [33,34,35], this paper employs exploratory factor analysis to measure the value perception index across different dimensions. Using microdata from farms, which can be influenced by subjective factors and potential missing variables, factor analysis is applied to extract common factors and accurately measure value perception levels. We calculate the ecological, economic, and social value perception indices, with descriptive statistics presented in Table 2.
Environmental regulation is measured in three dimensions: constraint, incentive, and guidance. Constraint regulation is gauged by the number of government inspections per month, incentive regulation by whether the farm receives government subsidies for MSR utilization technology, and guidance regulation by whether the technology is sourced from government promotion. Descriptive statistics for these variables are also shown in Table 2.
Control Variables: The study incorporates control variables such as the farm manager's individual characteristics (age, farming experience, environmental attitude, social status), farm attributes (scale, established years, land area, water cost, type, location), and social network factors. Given the potential influence of herd mentality on farmers' behavioural choices, information acquisition channels are also considered.
4. Results
4.1. Benchmarking Regression
This paper uses Stata 16.0 to ensure the accuracy and validity of the regression results, performing multicollinearity tests on the data prior to regression analysis., revealing a maximum Variance Inflation Factor (VIF) of 2.284, indicating no significant collinearity issues among independent variables. The benchmarking regression results (Table 3, Model 1) demonstrate that value perception, environmental regulation, and control variables significantly influence the adoption intensity of MSR utilization technology in scale dairy farms.
Economic value perception exerts perceived value significantly promotes the adoption intensity of manure resource utilization technology in large-scale dairy farms. Among the three types of perceived value, economic value perception has the most substantial impact, with a marginal effect of 6.461%. This indicates that dairy farms primarily consider economic benefits—such as cost optimization and increased revenue—when deciding to adopt new technologies. In contrast, ecological value perception and social value perception have lower marginal effects of 0.371% and 0.109%, respectively, but still have a positive influence. For example, when farms perceive that the technology can reduce manure emissions and protect the environment, their likelihood of adopting the technology increases. In practice, dairy farms often face cost pressures, particularly in efficiently handling manure. If adopting technology can reduce costs or secure government subsidies, the likelihood of adoption increases. Therefore, promoting manure resource utilization technologies should focus on the economic benefits of the technology while also enhancing the awareness of its ecological and social values to cultivate multi-dimensional value perceptions among farmers.
In terms of environmental regulation, Environmental regulations, especially incentive-based regulations, have a significant positive effect on technology adoption. The study finds that incentive-based regulations (such as government subsidies) promote the adoption of manure resource utilization technologies, with a marginal effect of 12.18%. In comparison, restrictive and guiding regulations have a smaller impact. This finding aligns with real-world practices. Incentive measures, such as subsidies, directly alleviate the financial burden on dairy farms, making the adoption of the technology more feasible. In contrast, restrictive environmental regulations (such as fines or monitoring) may have limited effectiveness on their own due to the practical costs and technical adaptation challenges faced by farms. Therefore, governments should focus on incentive-based policies, such as technological subsidies and tax benefits, to better facilitate the promotion and application of these technologies.
Control variables such as farm manager’s farming years, social position, farm scale, water costs, farm type, and information channels all passed the significance test (Model 1, Table 3). Information acquisition channels, in particular, play a positive role in influencing farm decisions, especially amidst technological adoption hesitancy. This is partly because farms often exhibit a herd mentality [36], adopting a cautious approach to new technologies and being significantly influenced by the decisions of neighbouring farms.
4.2. Endogeneity Treatment
The study acknowledges potential endogeneity issues stemming from causal relationships between value perception and dairy farm’s MRS utilization behaviours, as well as concerns like omitted variables, selection bias and measurement errors. To mitigate these challenges, the entropy weight method was employed to compute comprehensive indices for environmental regulation and value perception, mitigating endogeneity associated with single-dimensional indicators. Additionally, instrumental variable was applied to further test endogeneity, by using "distance between the farm and the regional Agricultural and Rural Bureau in which it is located level" [36]. Generally, closer proximity to the agricultural management department increases the frequency and intensity of environmental regulation perception, aligning with the relevance principle. Meanwhile, the distance to the closest agricultural management department has no direct connection with the adoption of MSR utilization technology, confirming its status as an exogenous variable.
Table 4 show that the instrumental variable is significantly correlated with the endogenous variable at the 1% level, and the F statistic is 15.23, which is greater than 10, indicating there is no weak instrument in the regression. Both environmental regulation and value perception, after controlling for potential endogeneity bias, still have a significant and positive impact on the adoption of manure utilization technology.
4.3. Moderation Effect
The analysis of the moderating effect of environmental regulations on the relationship between economic value perception and technology adoption in dairy farms reveals significant findings (Table 5). Specifically, it was found that economic value perception is positively related to the adoption of manure resource utilization technologies, and this relationship is further strengthened when combined with different types of environmental regulations—constraint-based, incentive-based, and guidance-based regulations. The results show that incentive-based regulations have the strongest moderating effect. The interaction terms between economic value perception and incentive-type environmental regulations are statistically significant at the 1% level. This indicates that when dairy farms perceive potential economic benefits—such as government subsidies or financial support—they are more likely to adopt manure resource utilization technologies. In contrast, constraint-based regulations (such as penalties for non-compliance) also show significant moderating effects, though weaker than incentive-based regulations. This finding aligns with the practical understanding that dairy farmers, as rational actors, tend to prioritize profit maximization. When they are offered direct economic incentives (e.g., subsidies or financial rewards), their perceived economic value of manure resource utilization increases, making them more motivated to adopt the technology. Conversely, the deterrence effect of penalties associated with constraint-based regulations can also amplify economic value perception, prompting stronger adoption of the technologies.
The results also support the H3 that environmental regulations, particularly incentive-based regulations, moderate the relationship between economic value perception and technology adoption intensity, with stronger effects observed in larger farms. This is particularly evident when analyzing the size of dairy farms and their response to environmental regulations. Larger farms, which typically have better access to financial resources and economies of scale, are more likely to respond to economic incentives, leading to a more substantial adoption of manure resource utilization technologies. In contrast, smaller farms, which often face more significant financial constraints, may struggle to adopt such technologies without sufficient incentives. The moderating role of environmental regulations becomes even more crucial in these contexts, where incentive-based policies have a more pronounced effect compared to smaller farms that rely more on regulatory enforcement to compel adoption. This suggests that larger farms benefit more from the direct financial incentives provided by incentive-based regulations, while smaller farms may need a combination of financial support and enforcement-based policies to achieve similar adoption levels.
4.4. Heterogeneity Analysis
The study results show that economic value perception has a significant positive impact on the adoption of manure resource utilization technologies in dairy farms of all sizes, with a notable influence at the 5% level (Table 6). However, ecological and social value perceptions exhibit significant scale heterogeneity, particularly with ecological value perception having no significant effect on small-scale farms. In practice, this suggests that economic considerations—such as cost savings or profitability from adopting new technology—are universally important to dairy farms, regardless of their size. For small-scale farms, the adoption of manure resource utilization technologies might be limited by other factors, such as financial constraints and lack of infrastructure. While large and medium-scale farms are more likely to adopt these technologies due to better financial stability and a stronger focus on economic gains, small-scale farms often struggle to justify the high initial costs of implementing such technologies.
Regarding environmental regulations, the study highlights that incentive-based regulations significantly influence technology adoption in farms of all sizes. Specifically, incentive-type regulations have a positive and significant impact on the adoption of manure resource utilization technologies at the 5% level. On the other hand, constraint-type and guidance-type regulations show scale heterogeneity, with small-scale farms being more dependent on regulatory enforcement to ensure compliance. For small-scale farms, which often use less sophisticated manure management practices and may not have sufficient resources to comply voluntarily, regulatory measures like penalties or government supervision are necessary to enforce adherence to best practices [37]. In contrast, larger farms benefit more from incentive-based policies, such as subsidies, which align better with their ability to invest in and benefit from technology adoption. These findings suggest that regulatory strategies should be tailored to farm size to effectively encourage adoption, with smaller farms requiring stronger enforcement and larger farms benefiting from financial incentives.
The study also examines how regional differences affect the adoption of manure resource utilization technologies (Table 7). Economic value perception significantly influences adoption in all regions, while ecological value perception plays a stronger role in areas with limited land resources, such as North China and Southern regions, where farms face more pressure to manage waste effectively. In these regions, ecological concerns—such as reducing pollution and ensuring sustainable farming practices—become a critical factor in the decision to adopt new technologies.
In contrast, the impact of social value perception is most pronounced in Southern regions, where the social consequences of pollution and waste management are a concern. In these regions, farms are more likely to consider how their practices impact the community and public health, making social value perception an important driver of technology adoption [38].
4.5. Robustness Test
Given the complexity of micro-survey data, there may be inaccuracies leading to underestimations or overestimations, which could result in outliers at both ends of the sample distribution. To address potential biases due to outliers in micro-survey data, we followed established procedures [39,40] and employed the Winsorization method. This approach involved adjusting all variables, by applying 5% and 95% percentile shrinkage. Values exceeding the 95th percentile and falling below the 5th percentile were replaced with these respective percentile thresholds. Regression analyses were then conducted using these adjusted values to ensure that extreme values do not disproportionately affect the results. The results, as presented in Table 3 (Model 2), show consistency with the benchmark regression results, confirming the robustness of our findings. We applied the same method to test the robustness of the environmental regulation moderation effect (Table 8), and the results again showed consistency with the benchmarking regression, confirming the robustness of the findings.
5. Discussion
5.1. Significant Impact of Value Perception
The research finds that value perception plays a crucial role in the adoption of manure and sewage resource (MSR) utilization technologies in dairy farms. It highlights that economic value perception, especially in larger farms, is the strongest driver of technology adoption. This aligns with the observed trend where larger farms prioritize cost-saving and profitability in their decision-making processes. Ecological and social value perceptions are also significant, though their impact is more pronounced in smaller and medium-scale farms. This suggests that smaller farms may be more motivated by ecological and social factors, such as reducing pollution or improving local living conditions, compared to larger farms where economic motivations dominate.
5.2. Limited Effect of Environmental Regulations
Environmental regulations have a somewhat limited direct effect on the adoption of MSR utilization technologies. However, the study finds that regulations—particularly incentive-based ones—can act as a significant amplifier for the effects of value perceptions. In essence, policies that offer subsidies or financial support significantly encourage farms to adopt MSR technologies by enhancing the perceived economic benefits. This suggests that policy design should not rely solely on regulatory measures but integrate incentives that make the adoption of MSR technologies more financially attractive to farms.
5.3. Moderating Role of Environmental Regulation
The moderating role of environmental regulations is evident, especially in larger farms. The interaction between economic value perception and environmental regulation (particularly incentive-based policies) is strong, further promoting technology adoption. Conversely, for smaller farms, policies that focus on penalties or fines (constraint-type regulations) appear to have a more significant influence, especially as they are more sensitive to external pressure due to limited resources. The study also underscores that different environmental regulations (incentive, constraint, and guidance) vary in effectiveness depending on farm size, pointing to a need for targeted policies that consider the scale of operations.
6. Conclusions
The implementation and promotion of MRS utilization should prioritize enhancing farms' value perception while leveraging the driving role of government policies. This comprehensive approach is essential for effectively promoting MSR utilization in dairy farms. Specifically:
6.1. Enhancing Intrinsic Incentives from Value Perception
Promote technological innovation in MSR utilization, summarize successful experiences, and disseminate efficient and practical technical models to eliminate farms' concerns about technical selection and encourage technology adoption.
Strengthen publicity and guidance on source reduction and process control technologies, increase subsidies for related technologies, and encourage financial institutions to provide appropriate policy preferences to related industries, scientific research, and infrastructure construction.
6.2. Strengthening the Regulatory Role of Policy Tools
Future policy design should fully integrate the dual roles of value perception and policy tools, incorporating both into a unified framework. This approach will maximize the driving force of economic subsidies and authority inspections on farmers' value perception. For farms with low levels of value perception, specific policy preferences can be implemented to enhance their motivation for adopting MSR utilization technology.
6.3. Leveraging Demonstration Farms
Encourage demonstration farms to showcase their successful adoption of MSR utilization technology through diverse channels, promoting the spread of demonstration effects. Build communication and exchange platforms between farms and guide non-demonstration farms to visit and learn from demonstration farms through industry associations and government training programs. This will facilitate the dissemination of best practices and promote broader adoption of MSR utilization technology across the industry.
Author Contributions
All authors contributed to the writing of the article. Liu Hao was responsible for method selection, data collation, writing (original draft, review and editing) and correspondence and revision; Xiaoxia Dong was responsible for review, funding acquisition and supervision; Jing Zhang was responsible for review and translation; Hua Peng was responsible for review and project management. Liu Hao and Jing Zhang contributed equally to this work and are considered co-first authors.
Data Availability Statement
This paper provides all the micro-survey data required for the study, which can be found in the 'MDPI Research Data Policies' section.
Acknowledgments
In this section, you can acknowledge any support given which is not covered by the author contribution or funding sections. This may include administrative and technical support, or donations in kind (e.g., materials used for experiments).
Conflicts of Interest
The authors declare no conflicts of interest.
Appendix A

Table A1.
Characteristics of Farm Managers.
| Characteristic | Category | Number of Samples | Percentage (%) |
| Age | Under 40 years | 135 | 32.5 |
| 40-49 years | 132 | 31.8 | |
| 50-59 years | 131 | 31.5 | |
| 60 years and above | 17 | 4.1 | |
| Education level | High school or below | 172 | 41.5 |
| Associate degree or bachelor's degree | 233 | 56.1 | |
| Master's degree or higher | 10 | 2.4 | |
| Years in dairy farming | Up to 10 years | 86 | 20.7 |
| 10-19 years | 217 | 52.3 | |
| Over 20 years | 112 | 27.0 | |
| Concern for environmental issues | 1= Not at all concerned | 13 | 3.1 |
| 2 = Not concerned | 4 | 1.0 | |
| 3 = Neutral | 26 | 6.3 | |
| 4 = Somewhat concerned | 71 | 17.1 | |
| 5 = Very concerned | 301 | 72.5 | |
| Evaluate current rural environmental conditions | 1 = very poor | 4 | 1.0 |
| 2 = poor | 6 | 1.4 | |
| 3 = average | 106 | 25.5 | |
| 4 = good | 173 | 41.7 | |
| 5 = very good | 126 | 30.4 |
Source: Survey data compilation.
Table A2.
Value perception index construction.
| Indicator | Item | Scale | Mean | Standard Deviation |
| Value Perception | ||||
| Social Value Perception | Impact on reducing dairy cow disease occurrences | 1=No impact; 2=Minor impact; 3=Neutral; 4=Impactful; 5=Highly impactful | 3.47 | 0.84 |
| Impact on improving employee satisfaction | 4.31 | 0.93 | ||
| Impact on enhancing the living quality of local residents | 4.08 | 0.99 | ||
| Economic Value Perception | Impact on increasing farm income | 1=No impact; 2=Minor impact; 3=Neutral; 4=Impactful; 5=Highly impactful | 3.87 | 0.88 |
| Impact on improving farm production efficiency | 4.61 | 0.58 | ||
| Impact on increasing operational costs | 4.24 | 0.87 | ||
| Ecological Value Perception | Impact on reducing manure emissions and improving the surrounding environment | 1=No impact; 2=Minor impact; 3=Neutral; 4=Impactful; 5=Highly impactful | 3.41 | 0.83 |
| Impact on improving the surrounding ecological environment | 3.69 | 1.11 | ||
| Impact on reducing pollutant emissions and preventing water and soil contamination | 4.06 | 0.99 | ||
Table A3.
Covariance matrix of the multivariate probit regression equation.
| Technology | EFF | RSS | AS | DFC | WR | DMS | CFA | MTM | BPT | FPT | BMP | MEF |
|---|---|---|---|---|---|---|---|---|---|---|---|---|
| EFF | 1 | |||||||||||
| RSS | 0.372 | 1 | ||||||||||
| AS | 0.138 | 0.374 | 1 | |||||||||
| DFC | 0.381 | 0.133** | 0.017* | 1 | ||||||||
| WR | 0.382 | 0.273* | 0.028 | -0.144 | 1 | |||||||
| DMS | -0.033* | 0.284 | 0.033 | 0.194 | 0.163 | 1 | ||||||
| CFA | 0.234 | 0.199 | 0.018 | 0.032** | 0.134 | 0.143* | 1 | |||||
| MTM | 0.145 | 0.464 | 0.004 | 0.175 | 0.174 | 0.174 | 0.003 | 1 | ||||
| BPT | 0.163 | 0.433** | 0.015 | 0.104 | 0.003 | 0.293 | 0.002 | 0.163* | 1 | |||
| FPT | 0.132 | 0.371 | 0.197 | 0.177 | 0.112 | 0.177 | 0.100** | 0.184 | 0.017** | 1 | ||
| BMP | 0.093 | 0.184 | 0.103 | 0.145 | 0.132 | 0.362 | 0.023* | 0.273 | 0.008*** | 0.003 | 1 | |
| MEF | 0.034 | 0.283 | 0.043 | 0.171 | 0.185 | 0.037 | 0.005 | 0.083 | 0.170 | 0.173 | 0.183 | 1 |
| Likelihood ratio test of rho21 = rho31 = rho32 = 0 chi2(4)= 24.621 Prob > chi2 = 0.027 | ||||||||||||
EFF: Eco-Friendly Feed; RSS: Rainwater-Sewage Separation; AS: Automatic Sprinkler; DFC: Dry Fecal Cleaning; WR: Wastewater Recovery; DMS: Deodorization of Manure and Sewage; CFA: Compost Fermentation Agent; MTM: Manure Treatment Microorganism; BPT: Biogas Production Technology; FPT: Fertilizer Production Technology; BMP: Bedding Materials Production; MEF: Manure for Earthworm Farming.
Figure A1.
Adoption Intensity of Manure Resource Utilization Technologies in Dairy Farms of Different Scales and Production Regions.
Figure A1.
Adoption Intensity of Manure Resource Utilization Technologies in Dairy Farms of Different Scales and Production Regions.
Appendix B
All appendix sections must be cited in the main text. In the appendices, Figures, Tables, etc. should be labeled starting with “A”—e.g., Figure A1, Figure A2, etc.
References
- Su, W. 2013. Second National Communication of the People's Republic of China on Climate Change. People's Republic of China second national communication on climate change.
- He, K.; Li, F.L.; Chang, H.Y. Building a low-carbon community: local consensus and participation of large-scale pig farmers in agricultural carbon trading: the case of a rural biogas CCER carbon trading project. China Rur. Obs. 2021, (05), 71–91. [Google Scholar]
- Zhu, R.; He, K.; Zhang, J.B. How Environmental Regulation Affects the Decision of Large-scale Pig Farmers on the Resource Utilization of Pig Manure: Based on the Perception Perspective of Large-scale Pig Farmers. China Rur. Obs. 2021, 6, 85–107, China Rur. Econ. (05):62-73.. [Google Scholar]
- Ye, X.Q.; Cheng, Yu.; Zhang, X.; Zhang, Y.M.; Cheng, G.Y. Changes in the supply and demand trend of important agricultural products in China and strategies for improving supply security capacity. Reform 2024, (04), 1–18. [Google Scholar]
- He, K.; Zhang, J.B. Ecological Value of Agricultural Waste Resource Utilisation: A Comparative Analysis of the Willingness to Pay of New Generation Farmers and Previous Generation Farmers. China Rur. Econ. 2014, (05), 62–73. [Google Scholar]
- Sardianou, E.; Genoudi, P. 2013. Which factors affect the willingness of consumers to adopt renewable energies? RENEW ENERG 57(sep.):1-4.
- Subashini, K.K.P.; Fernando, S.; Subashini, K.K.P.; Fernando, S. 2018. Empowerment of Farmers Through ICT Literacy.in Information Technology Conference.
- Mao, H.A.; Luo, X.F.; Tang, L.; Huang, Y.Z. Adoption Decisions of Multiple Green Production Technologies: Influencing Factors and Correlation Analysis. J. China Agri. Uni. 2021, 26, 231–244. [Google Scholar]
- Chen, Q. Aquaculture green and healthy farming initiatives: farmers' choice preferences and their sources of heterogeneity - an analysis based on the optimal-inferior choice experiment method. Agricultural Technology and Economics 2023, (05), 64–79. [Google Scholar]
- Su, Y.Q.; Qin, S.J.; Shu, Q.F. Mechanism of Institutional Path Integration to Activate Collective Action in Rural Ecological Environment Governance: Based on the Analytical Framework of Nested Institutional System. China Rur. Econ. 2024, (07), 161–184. [Google Scholar]
- Jian, X.U.; Liang-Wen, X.; Yu, T. 2018. Study on Supply and Demand Model for Green Supply Chain Based on Government Subsidies. Resource Development & Market.
- Jiang, G.H.; Hu, H. Preference Heterogeneity, Farmer Participatory Programme Creation and Resource Utilisation of Farming Waste: A Choice Experiment from Farmers' Farming Integration. J. Nanj. Agri. U. (Social Science Edition) 2024, 24, 161–173. [Google Scholar]
- Wang, J.H.; Tao, J.Y.; Chen, L. Research on resource treatment methods and influencing factors of livestock and poultry waste of farmers. Chinese Res. Env. 2019, 29, 127–137. [Google Scholar]
- Yu, T.; Yu, F.W. Analysis of the impact of cognition of resource utilization of livestock and poultry breeding waste on farmers' willingness to participate in the context of environmental regulation policy. China Rur. Econ. 2019, 8, 91–108. [Google Scholar]
- Wang, X.G.; Si, W.; Feng, X.L.; Zhao, Q.R. The Effect of Soybean Producer Subsidies on Farmers' Land Input Decisions: An Empirical Analysis Based on the Survey Data of National Rural Fixed Observation Points. China Rur. Obs. 2023, (01), 20–39. [Google Scholar]
- Lalani, G.W.E. 2016. Smallholder farmers' motivations for using Conservation Agriculture and the roles of yield, labour and soil fertility in decision making. AGR SYST 146(Null).
- MARA. Notice of the Ministry of Agriculture on Printing and Distributing the Action Plan for Resource Utilization of Livestock and Poultry Manure (2017-2020). P. R. C. MARA 2017, (08), 21–28. [Google Scholar]
- Mcinnes, M.; Ramakrishnan, R.T.S. A decision-theory model of motivation and its usefulness in the diagnosis of management control systems. ACCOUNT ORG SOC 1991, 16(2), 167–184. [Google Scholar] [CrossRef]
- Mo, J.M.; Zhang, S.M. The Practical Logic of Agricultural Green Entrepreneurship of Returnees: A Multi-case Analysis Based on the Perspective of Effect Logic. Agri. Econ. Issues 2024, 1–13. [Google Scholar]
- RAO, X.P. Theoretical Debate and Integration of Rural Households' Economic Rationality. Guangxi Soci. Sci. 2012, (07), 52–56. [Google Scholar]
- Valarie and, A. and Zeithaml. Consumer Perceptions of Price, Quality, and Value: A Means-End Model and Synthesis of Evidence. J MARKETING 1988, 52, 2–22. [Google Scholar]
- Yu, F.W. Research on the Motivations, Cores and Countermeasures of Agricultural Green Development in the New Era. China Rur. Econ. 2018, 5, 19–34. [Google Scholar]
- Zhou, J.; Du, H.M. Research on the configuration path of improving the behavioral effect of manure resource utilization of farmers. Arid Land Res. Envi. 2024, 38(02), 51–61. [Google Scholar]
- Si, R.S.; Yu, X.; Liu, M.Y. The Effect of Combined Policy Interventions on Antimicrobial Overuse Behavior of Large-scale Farmers: An Empirical Analysis from Pig Farmers. J. Agri. Fore. Econ. Manage 2023, 1–12. [Google Scholar]
- Fei, H.M.; Sun, M.H.; Wang, L. Farmers' decision-making on conservation tillage behaviour on blackland: value perception or policy-driven? Natural Res. 2022, 37(09), 2218–2230. [Google Scholar]
- Yu, C. 2019. Research on cleaner production behavior of large-scale pig farms. Shand. Agri. Uni.
- Zhang, Y.Y.; Zhou, K.F.; Yu, C.; Sun, S.M. Analysis of cleaner production behavior and mechanism of large-scale pig farms. J. Anim. Hus. 2019, 55, 146–151. [Google Scholar]
- Yang, H.T.; Ma, J. Environmental Investment in Standardized Farms and Its Demonstration Effect: An Empirical Analysis Based on Endogenous Transformation Model and Spatial Autocorrelation Model. J. Huaz. Agri. Uni.(Social Sciences) 2019, (06), 97–105. [Google Scholar]
- Zhang, F.Y.; Yan, T.Y.; Zhang, J.B. The Impact of Social Interaction on Farmers' Green Technology Adoption Behavior: An Analysis Based on 1004 Farmer Survey Data in Hubei Province. J. Ecol. Rur. Envi. 2022, 38, 43–51. [Google Scholar]
- Zhao, J.J.; Liu, L.Z. A Study on Environmental Regulation, Reputation Appeal and Pro-Environmental Behavior Performance. China Envi. Sci. 2023, 43, 1473–1488. [Google Scholar]
- Dasgupta, S.C. Meisner and M. Huq. A Pinch or a Pint? Evidence of Pesticide Overuse in Bangladesh. J AGR ECON 2010, 58. [Google Scholar]
- Damania, R.; Fredriksson, P.G.; List, J.A. Trade liberalization, corruption, and environmental policy formation: theory and evidence. Journal of Environmental Economics & Management 2003, 46, 490–512. [Google Scholar]
- Vaishnavee, S. Investigation of The Effects of Value Perception on Purchase Intention of Luxury Cars. Anthropologist 2018, 31. [Google Scholar] [CrossRef]
- Jiang, D.H.; Fang, Q.B.; Cui, K.; Ma, Z.F.; Song, X. Manure treatment and recycling in mink farming in Jiaozhou City. Shand. Anim. Hus. & Vet. Med. 2020, 41, 32–36. [Google Scholar]
- Wang, Y.; Yan, J.H.; Zhang, Y.J. Research on Ecological Compensation Preference for Resource Utilization of Beef Cattle Breeding Waste. Agro. Techno. Econ. 2023, 21, 1–14. [Google Scholar]
- Ren, Z.; Guo, Y. The Influence of Environmental Regulation and Social Capital on Farmers' Adoption of Low-carbon Agricultural Technologies. J. NAT. RES. 2023, 38, 2872–2888. [Google Scholar]
- Xu, J.B. 2023. Research on the driving mechanism of green transformation of China's dairy farming industry. Northeast Agri. Uni.
- Xu, Q.H.; Zhang, G.S. Spatial Spillover Effect of Agricultural Mechanization on Agricultural Carbon Emission Intensity: An Empirical Evidence Based on Panel Data from 282 Cities. Chinese · Res. Env. 2022, 32, 23–33. [Google Scholar]
- Liao, W.M.; Chen, C.; Li, X. Village Identity, Relationship Network and Willingness to Improve Rural Human Settlements: A Case Study of 501 Rural Households in Jiangxi Province. J. China Agri. Uni. 2023, 28(11), 264–278. [Google Scholar]
- Zhao, J.J.; Liu, L.Z. Research on the Impact of Environmental Regulation on the Environment-Friendly Behavior of Farmers in Different Organizational Forms: Based on the Manure Resource Treatment Behavior of Broiler Duck Farmers. China Agri. Reso. Reg. P. 2022, 43, 28–38. [Google Scholar]
Figure 1.
A decision-theoretic framework for MSR utilization technologies adoption on scale farms.
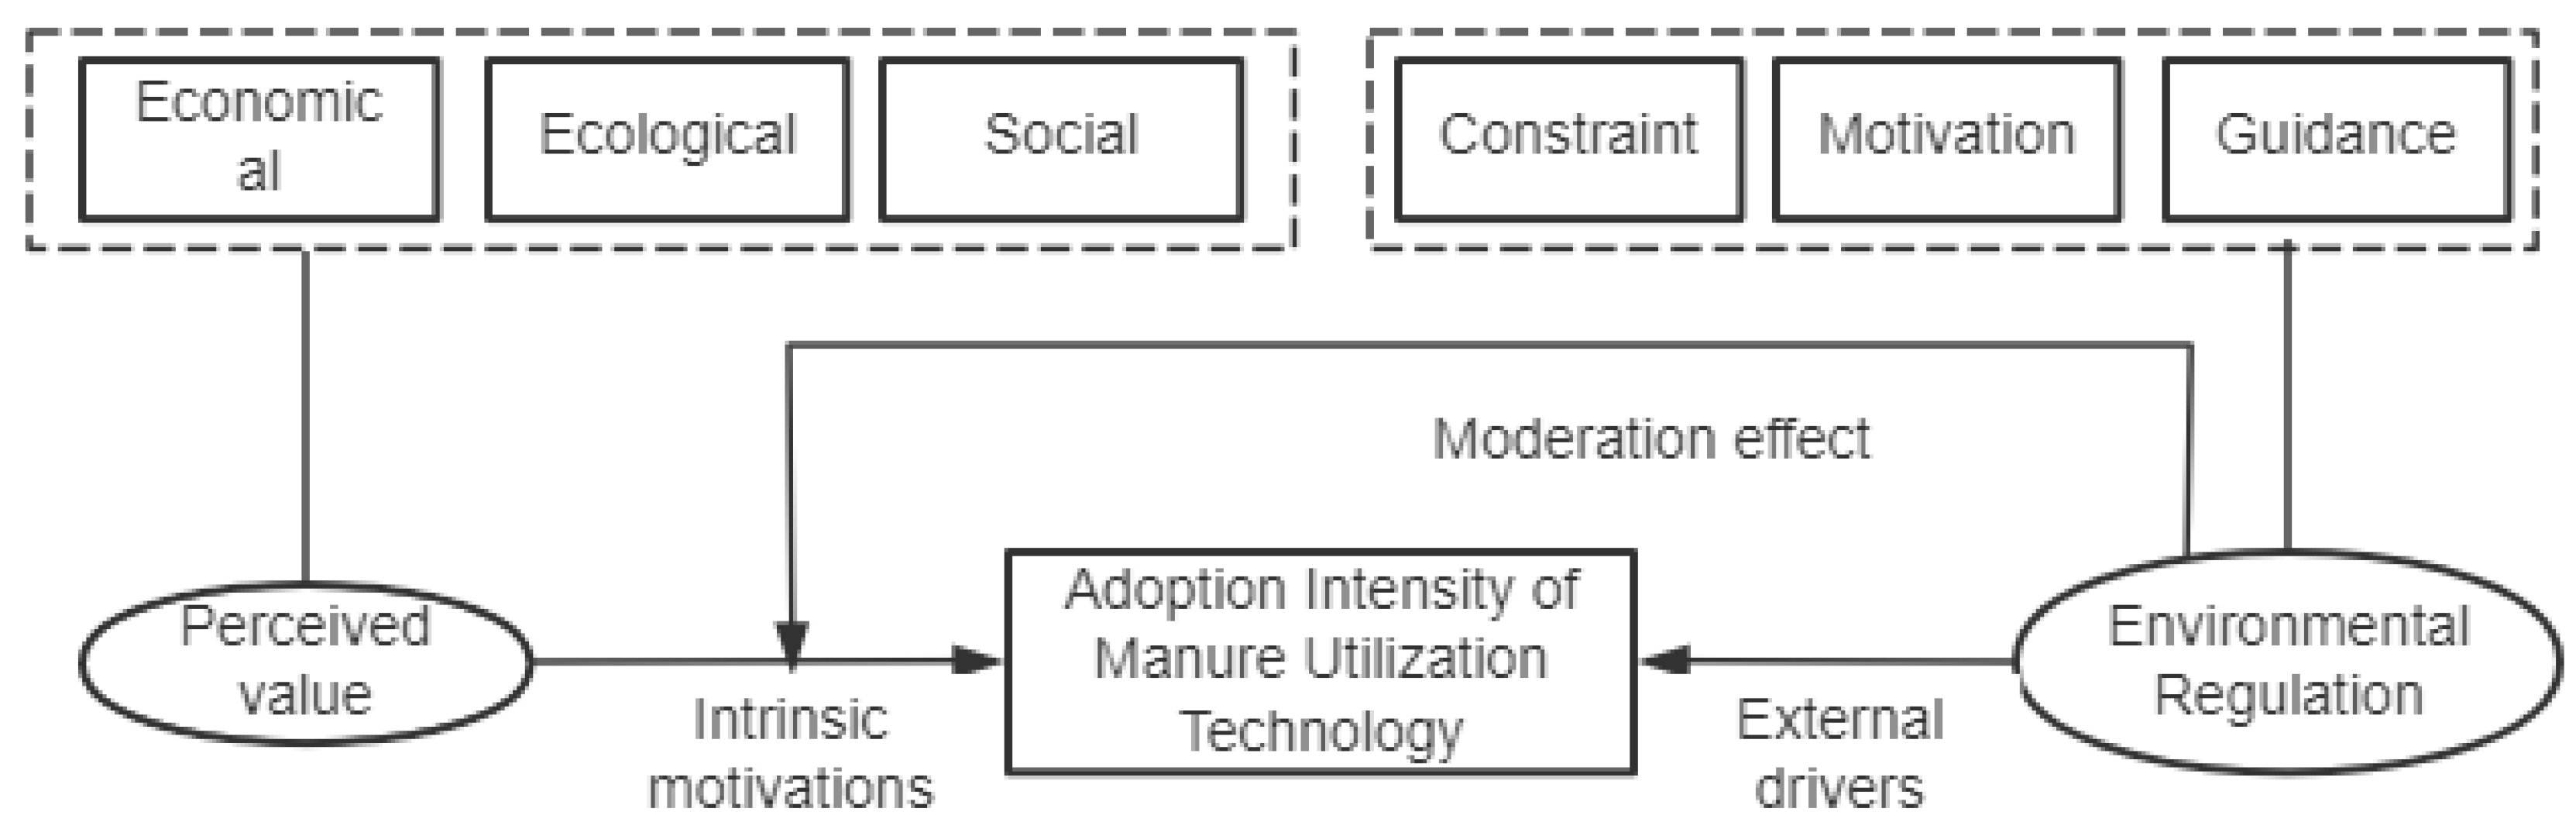
Table 1.
Sample distribution.
| Type | Number of samples | Proportion (%) | |
|---|---|---|---|
| Production area | North China | 172 | 41.7 |
| Northeast China & Inner Mongolia | 86 | 21.2 | |
| Northwest China | 76 | 18.3 | |
| Southern China | 78 | 18.9 | |
| Scale (heads) | Small (100-1000) | 197 | 47.4 |
| Medium (1001-3000) | 138 | 33.3 | |
| Large (above 3000) | 80 | 19.3 | |
| Types of technologies for MSR utilization | Source reduction | 287 | 69.2 |
| Process control | 275 | 66.3 | |
| End-of-pipe treatment | 309 | 74.5 |
Data source: Survey data collation.
Table 2.
Descriptive statistics of variables.
| Variable | Meaning and value assignment | Mean | Standard deviation | |
|---|---|---|---|---|
| Explained Variable | ||||
| Adoption Intensity of MSR Utilization Technology | Measured by Cov-AHP | 2.215 | 1.145 | |
| Core Explanatory Variables | ||||
| Perceived value(VP) | Economical | Factor analysis | 0 | 1 |
| Ecological | Factor analysis | 0 | 1 | |
| Social | Factor analysis | 0 | 1 | |
| Environmental Regulation(ER) | Constraint | Number of environmental inspections conducted on farms by authorities each month | 7.163 | 9.183 |
| Motivation | Whether the farms received government subsidies for adopting MSR utilization technologies (0 = no, 1 = yes) |
0.351 | 0.713 | |
| Guidance | Whether the information on MSR utilization technologies came from government promotion (0 = no, 1 = yes) |
0.479 | 0.763 | |
| Control Variables | ||||
| Personal Characteristics | Age | Years old | 44.764 | 9.063 |
| Years of farming | Years | 14.457 | 7.271 | |
| Environmental attitude | Degree of emphasis on environmental protection (1~5 = very little attention ~ very much attention) | 4.549 | 0.899 | |
| Social position | Do you hold a social position other than farm manager (e.g. alliance leaders of dairy industry, technical experts, or local administrators)? (0 = no, 1 = yes) |
0.376 | 0.485 | |
| Farm Characteristics | Farming scale | Heads | 2394.154 | 1654.653 |
| Years established | Years | 12.107 | 7.377 | |
| Plant area | 100 mu | 3.813 | 8.613 | |
| Water cost | 1~5 = very low ~ very high | 3.135 | 0.923 | |
| Farm type | 0 = non-agent farm, 1 = agent farm | 1.677 | 0.468 | |
| Farm location | Distance from the farm to the nearest settlement in kilometers | 16.581 | 6.122 | |
| Social network | Information channels | Whether the relevant information comes from other farms (0 = no, 1 = yes) |
0.485 | 0.754 |
| Dummy variable for production area | 1 = Northeastern & Inner Mongolia (control group) 2 = North China 3 = South China 4 = Northwest China |
2.334 | 1.001 | |
Table 3.
Benchmark regression results.
| Variable | Model 1 | Model 23 |
|---|---|---|
| Economic-VP | 6.461***(0.405) | 6.217**(3.172) |
| Ecological-VP | 0.371**(0.189) | 0.409**(0.209) |
| Social-VP | 0.109*(0.066) | 0.117*(0.071) |
| Constraint-ER | 0.712*(0.263) | 0.689*(0.419) |
| Incentive-ER | 12.176***(0.534) | 12.003***(0.257) |
| Guidance-ER | 0.946(0.600) | 0.870 (0.529) |
| Age of farm manager | -2.918(1.800) | -2.278(1.385) |
| Manager's farming years | -0.245**(0.125) | -0.216*(0.131) |
| Environmental attitude | 0.514(0.361) | 0.464(0.332) |
| Manager's social position | 0.052**(0.027) | 0.036**(0.018) |
| Farm scale | -0.966*(0.528) | -0.844**(0.431) |
| Years established of farm | -0.187(0.477) | -0.128(0.428) |
| Water cost | 0.483*(0.293) | 0.446*(0.271) |
| Farm type | 1.056**(0.499) | 1.019**(0.520) |
| Farn location | -0.723(0.429) | -0.704(0.429) |
| Information channels | 0.110**(0.056) | 0.075*(0.046) |
| Provincial dummy variables | YES | YES |
| Constant | -5.469(4.027) | -5.164(3.735) |
| R2 | 0.278 | 0.228 |
Note: *, **, and *** represent the 10%, 5%, and 1% significance levels respectively, and the values in parentheses are standard errors.
Table 4.
Endogeneity test results.
| Variables | Model 3 | |
|---|---|---|
| Coefficient | Standard Error | |
| Environmental regulation | 0.572* | 0.098 |
| Value perception | 0.539*** | 0.087 |
| Control variables | Yes | |
| Provincial dummy | Yes | |
| R2 | 0.291 | |
| Stage-one regression results | ||
| Environmental regulation instrumental variable | 0.662*** | 0.122 |
| F statistics | 15.23 | |
Note: *, **, and *** represent the 10%, 5%, and 1% significance levels respectively, and the values in parentheses are standard errors.
Table 5.
Test results of the regulatory effect of environmental regulation.
| Variable | Model 4 | Model 5 | Model 6 | Model 7 | Model 8 | Model 9 |
|---|---|---|---|---|---|---|
| Economic-VP | 0.621***(0.241) | 0.145**(0.071) | 0.311***(0.121) | 0.215**(0.104) | 0.220***(0.115) | 0.108**(0.052) |
| Ecological-VP | 0.118*(0.194) | 0.336(0.243) | 0.138*(0.081) | 0.291(0.313) | 0.103*(0.063) | 0.271(0.229) |
| Social-VP | 0.051(0.022) | 0.029(0.072) | 0.093(0.057) | 0.019(0.011) | 0.009(0.015) | 0.011(0.023) |
| Constraint-ER | 0.062**(0.031) | 0.084*(0.051) | ||||
| Incentive-ER | 0.786**(0.305) | 0.684**(0.331) | ||||
| Guidance-ER | 0.946*(0.574) | 0.870*(0.529) | ||||
| Economic-VP *Constraint-ER | -0.934**(0.390) | |||||
| Ecological-VP *Constraint-ER | 0.456(0.265) | |||||
| Social-VP *Constraint-ER | 0.264(0.162) | |||||
| Economic-VP *Incentive-ER | 0.014**(0.005) | |||||
| Ecological-VP *Incentive-ER | 0.467(0.371) | |||||
| Social-VP *Incentive-ER | -0.098(0.256) | |||||
| Economic-VP *Guidance-ER | 0.093(0.101) | |||||
| Ecological-VP *Guidance-ER | 0.054*(0.041) | |||||
| Social-VP *Guidance-ER | 0.009**(0.005) | |||||
| Control variables | YES | YES | YES | YES | YES | YES |
| Provincial dummy | YES | YES | YES | YES | YES | YES |
| Constant | -0.167***(0.056) | -0.253***(0.098) | -2.238***(0.869) | -0.652**(0.318) | -0.236***(0.082) | -0.289***(0.112) |
| R2 | 0.214 | 0.198 | 0.187 | 0.183 | 0.223 | 0.214 |
Note: *, **, and *** represent the 10%, 5%, and 1% significance levels respectively, and the values in parentheses are standard errors.
Table 6.
Regression results by farm scale.
| Variable | Model 10 | ||
|---|---|---|---|
| Small (100-1000) | Medium (1001-3000) | Large (above 3000) | |
| Economic-VP | 0.083(0.071) | 0.045(0.867) | 0.081**(0.041) |
| Ecological-VP | 0.084*(0.051) | 0.075**(0.038) | 0.087(0.053) |
| Social-VP | 0.083(0.051) | 0.010*(0.006) | 0.081(0.193) |
| Constraint-ER | 0.011***(0.004) | 0.107**(0.043) | 0.029(0.193) |
| Incentive-ER | 0.283(0.301) | 0.188*(0.101) | 0.123***(0.048) |
| Guidance-ER | 0.198(0.124) | 0.143*(0.087) | 0.108**(0.055) |
| Control variable | Yes | Yes | Yes |
| Provincial dummy | Yes | Yes | Yes |
| R2 | 0.219 | 0.198 | 0.227 |
Note: *, **, and *** represent the 10%, 5%, and 1% significance levels respectively, and the values in parentheses are standard errors.
Table 7.
Regression results by production area.
| Variable | Model 11 | |||
|---|---|---|---|---|
| Northeast China & Inner Mongolia | North China | Southern China | Northwest China | |
| Economic-VP | 0.025**(0.012) | 0.022**(0.011) | 0.045**(0.023) | 0.003**(0.001) |
| Ecological-VP | 0.023(0.136) | 0.076*(0.047) | 0.156**(0.076) | 0.204(0.172) |
| Social-VP | 0.003(0.004) | 0.002(0.013) | 0.027*(0.016) | 0.083(0.017) |
| Constraint-ER | -0.028(0.233) | 0.019(0.273) | 0.007(0.003) | 0.021(0.032) |
| Incentive-ER | 0.067**(0.026) | 0.042***(0.016) | 0.237***(0.092) | 0.083**(0.073) |
| Guidance-ER | 0.083**(0.050) | 0.034(0.124) | 0.004**(0.002) | 0.011(0.043) |
| Control variable | Yes | Yes | Yes | Yes |
| Provincial dummy | Yes | Yes | Yes | Yes |
| R2 | 0.199 | 0.214 | 0.242 | 0.198 |
Note: *, **, and *** represent the 10%, 5%, and 1% significance levels respectively, and the values in parentheses are standard errors.
Table 8.
Robustness test of environmental regulation’s moderation effect.
| Variable | Model 12 | Model 13 | Model 14 | Model 15 | Model 16 | Model 17 |
|---|---|---|---|---|---|---|
| Economic-VP | 0.621*** (0.137) |
0.145** (0.124) |
0.311*** (0.115) |
0.215** (0.096) |
0.220*** (0.111) |
0.108** (0.108) |
| Ecological-VP | 0.118* (0.338) |
0.336 (0.243) |
0.138* (0.456) |
0.291 (0.313) |
0.103* (0.388) |
0.271 (0.229) |
| Social-VP | 0.051 (0.022) |
0.029 (0.072) |
0.093 (0.034) |
0.019 (0.009) |
0.009 (0.093) |
0.011 (0.023) |
| Constraint-ER | 0.062** (0.054) |
0.084* (0.056) |
||||
| Incentive-ER | 0.786** (0.376) |
0.684** (0.531) |
||||
| Guidance-ER | 0.946* (0.217) |
0.870* (0.178) |
||||
| Economic-VP *Constraint-ER | -0.934** (0.239) |
|||||
| Ecological-VP *Constraint-ER | 0.456 (0.265) |
|||||
| Social-VP *Constraint-ER | 0.264 (0.162) |
|||||
| Economic-VP *Incentive-ER | 0.014** (0.006) |
|||||
| Ecological-VP *Incentive-ER | 0.467 (0.371) |
|||||
| Social-VP *Incentive-ER | -0.098 (0.256) |
|||||
| Economic-VP *Guidance-ER | 0.093 (0.101) |
|||||
| Ecological-VP *Guidance-ER | 0.054* (0.041) |
|||||
| Social-VP *Guidance-ER | 0.009** (0.001) |
|||||
| Control variables | Yes | Yes | Yes | Yes | Yes | Yes |
| Provincial dummy | Yes | Yes | Yes | Yes | Yes | Yes |
| Constant | -0.167*** (0.223) |
-0.253*** (0.137) |
-2.238*** (0.157) |
-0.652** (0.289) |
-0.236*** (0.734) |
-0.289*** (0.689) |
| R2 | 0.214 | 0.198 | 0.187 | 0.183 | 0.223 | 0.214 |
Note: *, **, and *** represent the 10%, 5%, and 1% significance levels respectively, and the values in parentheses are standard errors.
| 1 | In 2023, the Ministry of Agriculture and Rural Affairs (MARA) reported that China has approximately 15,000 scale dairy farms, which are defined as farms with an inventory exceeding 100 head of dairy cows [17]. |
| 2 | In 2017, China's Ministry of Agriculture issued the Action Plan for Resource Utilisation of Livestock and Poultry Manure (2017-2020), which puts forward the technical measures of "source reduction, process control and end-of-pipe treatment" [17], of which the source reduction includes the application of environmentally friendly feeds, rainwater-sludge separation, dry manure measures, automatic spraying, sewage recovery and recycling, etc. Process control includes the use of composting and fermentation agents, deodorants and bacterial agents for faecal water treatment; and end-of-pipe management includes the use of measures to fertilise faecal waste, biogas production from faecal waste, earthworm farming from faecal waste, and the production of bedding material from faecal waste. |
| 3 | Model (2) represents the robustness test results, with data re-aggregated by Winsorizing the upper and lower 5% of idiosyncratic values. |
Disclaimer/Publisher’s Note: The statements, opinions and data contained in all publications are solely those of the individual author(s) and contributor(s) and not of MDPI and/or the editor(s). MDPI and/or the editor(s) disclaim responsibility for any injury to people or property resulting from any ideas, methods, instructions or products referred to in the content. |
© 2025 by the authors. Licensee MDPI, Basel, Switzerland. This article is an open access article distributed under the terms and conditions of the Creative Commons Attribution (CC BY) license (http://creativecommons.org/licenses/by/4.0/).
Copyright: This open access article is published under a Creative Commons CC BY 4.0 license, which permit the free download, distribution, and reuse, provided that the author and preprint are cited in any reuse.


