
Submitted:
10 June 2025
Posted:
10 June 2025
You are already at the latest version
Abstract
Accurately predicting corporate financial distress is a critical aspect of modern financial risk management, especially amid growing economic uncertainty. Traditional analytical methods often rely on limited financial indicators and expert judgment, which cannot capture complex, nonlinear patterns. To address these limitations, this study develops a comprehensive machine learning framework using a dataset comprising 3,672 samples and 83 financial features. Multiple predictive models were constructed and evaluated, with XGBoost demonstrating superior performance (F1-score = 0.242, ROC-AUC = 0.910). To enhance interpretability, SHAP (SHapley Additive exPlanations) was employed post hoc to identify influential features and provide transparent, actionable insights into model decision-making. The analytical pipeline includes data preprocessing, correlation-based feature selection, model training, and performance evaluation. SHAP analysis further highlights the significance of features such as x36, x44, and x13, underscoring the framework’s utility as a reliable tool for financial risk assessment.Beyond technical performance, the framework offers practical significance for small and medium-sized enterprises (SMEs), which often lack access to advanced risk forecasting tools due to resource constraints. By enhancing early warning capabilities and decision- making transparency, this cost-effective solution supports operational resilience, informed financial planning, and long-term economic sustainability.
Keywords:
Data mining
; Financial distress prediction
; Machine learning
; SHAP
; XGBoost
; Model interpretability
1. Introduction
Small and medium-sized enterprises (SMEs), which play a vital role in economic vitality and supply chain stability, often lack access to advanced financial risk management tools. Without the ability to detect early signs of financial distress, SMEs are vulnerable to inefficient resource allocation, unexpected bankruptcy, and cascading supply chain disruptions—factors that ultimately erode overall economic resilience. Cost constraints further restrict their ability to invest in conventional risk forecasting systems. Predicting financial distress for such entities is particularly challenging due to the complexity, diversity, and limited interpretability of available financial data.
To address these challenges, this study proposes an interpretable machine learning framework for enterprise financial distress prediction, with a particular emphasis on enhancing decision transparency for SMEs. By integrating predictive modeling with explainable artificial intelligence techniques, the proposed framework aims to provide scalable, cost- effective, and auditable risk assessment solutions tailored to the needs of resource-constrained organizations.
Enterprise financial distress prediction has long been a critical research focus in the financial and economic domains [5,7]. In an increasingly volatile global economic environment, early and accurate identification of at-risk firms is essential for stakeholders such as investors, creditors, regulators, and corporate managers [1,3]. Effective prediction can aid in investment decision-making, credit risk control, and macroeconomic policy development.
Traditional financial analysis methods largely depend on expert experience and a small subset of financial indicators, which are often insufficient for capturing the complex, nonlinear relationships in modern corporate data [4,6]. Such approaches are limited in scalability and generalizability, particularly when facing high-dimensional, heterogeneous data arising from diverse industries and economic regions [2,12].
In recent years, machine learning (ML) has emerged as a powerful tool for financial prediction tasks, offering improved predictive capabilities through advanced algorithmic modeling [8, 10]. Studies in both healthcare and energy economics have validated the effectiveness of ML in high-stakes decision scenarios involving large-scale and multivariate datasets [13,15,16]. However, the application of ML models in finance is still hindered by their lack of interpretability— commonly referred to as the “black-box” problem [11,14]. This is particularly problematic in regulatory or risk-sensitive domains where model transparency is essential [17,19].
To overcome this challenge, explainable artificial intelligence (XAI) techniques such as SHAP (SHapley Additive exPlanations) have been introduced to enhance the interpretability of complex models while maintaining predictive performance [9,18]. These methods allow for a granular understanding of feature importance and decision logic, offering traceability that is crucial for financial compliance and auditability [20].
Against this backdrop, the present study develops a robust and interpretable machine learning framework for enterprise financial distress prediction. By leveraging structured financial datasets and applying SHAP-based post hoc analysis, we aim to identify not only which firms are at risk but also why. This dual objective of accuracy and transparency provides practical value for financial institutions seeking to integrate AI-based solutions into their risk assessment and management pipelines.
2. Methodology
2.1. Data Preprocessing and Feature Engineering
The dataset used in this study consists of financial data from 422 companies across different time periods, comprising a total of 3,672 observation samples and 83 feature variables.
As shown in Figure 1, a comprehensive workflow for financial distress prediction is established, including key steps such as data collection, data preprocessing, correlation analysis, model evaluation, optimal model selection, model visualization, and SHAP analysis. This workflow forms a complete analytical chain from data input to result interpretation.
Initially, missing values are handled by applying mean imputation for numerical variables and mode imputation for the categorical variable x80. The dataset is then standardized to ensure comparability among features with different units. The target variable is defined as follows:
Enterprise Financial Distress Prediction Based on Machine Learning and SHAP Interpretability Analysis
The dataset exhibits a significant class imbalance, with distressed companies accounting for only 3.700% of the total samples. Therefore, the SMOTE (Synthetic Minority Oversampling Technique) is employed to perform oversampling on the minority class samples.
2.2. Feature Selection and Correlation Analysis
To identify the key features most relevant to enterprise financial distress, this study first calculates the Pearson correlation coefficients between all features and the target variable, and constructs a correlation heatmap for visual analysis.
As shown in Figure 2, the top 15 features most strongly correlated with financial distress are visualized. Features such as x81, x48, and x25 exhibit strong positive correlations with financial distress, with correlation coefficients of 0.440, 0.440, and 0.380, respectively. In contrast, features like x64, x54, and x61 display negative correlations, with coefficients of -0.170, -0.170, and -0.160, respectively.
Based on the correlation analysis, the Recursive Feature Elimination (RFE) method is further employed to select the optimal subset of features. The formula for computing feature importance is given by:
where Im(xi) denotes the importance score of feature xi in the m-th model, and M is the total number of models.
This method effectively identifies features that contribute most to the prediction of financial distress and provides a solid foundation for model construction.
3. Experiments
3.1. Model Construction and Training
Multiple machine learning models are constructed in this study for enterprise financial distress prediction, including Decision Tree, Random Forest, Gradient Boosting, XGBoost, Logistic Regression, Support Vector Machine (SVM), K-Nearest Neighbors (KNN), and Naive Bayes. The dataset is randomly split into a training set and a testing set in a ratio of 7:3.
For the XGBoost model, the key parameters are set as follows: the learning rate (learning_rate) is 0.100, the maximum tree depth (max_depth) is 6, and the subsample ratio (subsample) is 0.800. The objective function of the model is defined as:
where l (yi , i) denotes the loss function, and Ω(fk) represents the regularization term. Hyperparameters are optimized using grid search and cross-validation techniques to ensure the model achieves optimal performance.
3.2. Model Performance Evaluation
Considering the imbalanced nature of the dataset, this study adopts multiple evaluation metrics to comprehensively assess model performance, including Accuracy, Precision, Recall, F1-Score, and ROC-AUC.
Figure 3 shows the confusion matrix of the Decision Tree model. It correctly predicts 1,023 healthy enterprises and 15 distressed ones, but also misclassifies 26 samples as false positives and 38 as false negatives.
As shown in Figure 4, the ROC curve of the Decision Tree model has an AUC value of 0.630, indicating moderate classification performance. The ROC curve illustrates the trade-off between the true positive rate and false positive rate under different thresholds, and a larger area under the curve reflects better model performance.
As shown in Table 1, the XGBoost model performs best in most metrics, with an accuracy of 0.946, precision of 0.615, recall of 0.150, F1-score of 0.242, and ROC-AUC of 0.910. Although Logistic Regression achieves a higher accuracy (0.956), it performs poorly on imbalanced data, with an F1-Score of only 0.290. The Decision Tree model has relatively lower performance (F1-Score of 0.319) but is appreciated for its interpretability.
3.3. SHAP-Based Interpretability Analysis
To better understand the decision-making mechanism of the model, this study applies the SHAP method to interpret the best-performing model.
Figure 5 presents the SHAP importance ranking. Feature x36 has the highest mean SHAP value (approximately 0.500), indicating its most significant impact on the model prediction, followed by x44 (0.300) and x13 (0.150).
Figure 6 shows the SHAP value distributions of different features. Red dots represent high feature values and blue dots low values. The x-axis indicates the influence of SHAP values on model output. Features like x36, x44, and x13 generally have a positive effect, increasing the likelihood of distress prediction, while features like x64 and x54 show negative impacts.
Figure 7 displays the dependence plot of the most important feature x36, illustrating the relationship between its value and SHAP contribution. A sharp change in SHAP values is observed near 0, especially in the range of -0.200 to 0.200, indicating that this feature has the greatest impact on prediction within this interval.
Financial Interpretation of SHAP Results. To enhance practical interpretability, we mapped the top-ranked SHAP features to their corresponding financial indicators. Feature x36, for instance, corresponds to the interest coverage ratio, a measure of a firm’s ability to meet its interest obligations. A low or negative value in this ratio indicates financial stress and insolvency risk, which aligns with the observed SHAP pattern where negative values sharply increase the predicted distress probability.
Feature x44 represents the net profit margin, reflecting the profitability of core business operations. Firms with persistently low profit margins may experience difficulties in maintaining liquidity and operational sustainability, which makes this indicator a strong predictor of financial distress.
Feature x13 is linked to the current ratio, an indicator of short-term liquidity. When this ratio falls below industry thresholds, it signals potential working capital issues, thus increasing the likelihood of distress. SHAP results confirm that lower values of this feature are associated with higher distress predictions.
These findings are consistent with traditional financial theory: profitability, liquidity, and solvency ratios are key determinants of a firm’s financial health. Integrating SHAP analysis with financial domain knowledge not only improves model interpretability but also enhances its trustworthiness and practical applicability for financial managers and analysts.
4. Conclusions
This study presents a comprehensive machine learning-based framework for enterprise financial distress prediction, with a focus on both predictive performance and interpretability. The framework integrates standard preprocessing techniques, feature engineering, and an ensemble learning approach, and enhances transparency through SHAP (SHapley Additive exPlanations) analysis.
Manuscript submitted to ACM
Experimental evaluations demonstrate that the XGBoost model delivers superior predictive performance in identifying distressed firms within a complex financial dataset, achieving a ROC-AUC score of 0.910. Such high accuracy indicates the model’s strong ability to distinguish between healthy and financially troubled enterprises, making it a valuable tool for early warning and financial risk management systems deployed by banks, investors, and regulators.
Importantly, this framework offers practical benefits for small and medium-sized enterprises (SMEs), which often operate with limited financial risk management resources. By improving the visibility of early warning signals and offering interpretable results, the proposed method helps SMEs better understand and mitigate potential financial threats. This contributes to enhanced resilience, reduced bankruptcy risk, and greater continuity across supply chains—key factors in maintaining broader economic stability.
Future research directions include extending the current framework by incorporating advanced deep learning architectures, such as recurrent neural networks (RNNs) and transformer-based models, which are capable of modeling sequential patterns in financial time series data. Additionally, combining multimodal inputs (e.g., textual disclosures, macroeconomic indicators) may further improve predictive accuracy and real-world applicability in complex financial environments.
References
- R. B. Nozari, et al., “A novel behavior-based recommendation system for e-commerce,” arXiv preprint arXiv:2403.18536, 2024.
- V. Pleskach, et al., “An e-commerce recommendation systems based on analysis of consumer behavior models,” in Proc. IntSol, 2023.
- S. S. Li and E. Karahanna, “Online recommendation systems in a B2C e-commerce context: A review and future directions,” J. Assoc. Inf. Syst., vol. 16, no. 2, pp. 2, 2015. [CrossRef]
- S. Sameena, et al., “Personalized product recommendation system for e-commerce platforms,” in ITM Web Conf., vol. 74, EDP Sciences, 2025.
- J.-P. Cabrera-Sánchez, et al., “Online recommendation systems: Factors influencing use in e-commerce,” Sustainability, vol. 12, no. 21, pp. 8888, 2020. [CrossRef]
- Y. Wu and Y. Yusof, “Emerging trends in real-time recommendation systems: A deep dive into multi-behavior streaming processing and recommen- dation for e-commerce platforms,” J. Internet Serv. Inf. Secur., vol. 14, no. 4, pp. 45–66, 2024. [CrossRef]
- M. A. Raji, et al., “E-commerce and consumer behavior: A review of AI-powered personalization and market trends,” GSC Adv. Res. Rev., vol. 18, no. 3, pp. 66–77, 2024.
- J. B. Schafer, J. A. Konstan, and J. Riedl, “E-commerce recommendation applications,” Data Min. Knowl. Discov., vol. 5, pp. 115–153, 2001. [CrossRef]
- S. Somavarapu and V. Gupta, “Analyzing and visualizing user behavior in e-commerce: A machine learning approach,” unpublished, 2025.
- S. Iseal and M. Halli, “Customer behavior analysis and purchase prediction in e-commerce,” unpublished, 2025.
- P. Pande, A. K. Kulkarni, and V. Ramalingam, “Big data analytics in e-commerce driving business decisions through customer behavior insights,” in ITM Web Conf., vol. 76, EDP Sciences, 2025.
- Z. Liu, et al., “Development and validation of interpretable machine learning models for triage patients admitted to the intensive care unit,” PLoS One, vol. 20, no. 2, pp. e0317819, 2025. [CrossRef]
- Q. Sun, et al., “Machine learning-based assessment of diabetes risk,” Appl. Intell., vol. 55, no. 2, pp. 1–13, 2025. [CrossRef]
- H. Jiang, et al., “ReIU: An efficient preliminary framework for Alzheimer patients based on multi-model data,” Front. Public Health, vol. 12, pp. 1449798, 2025. [CrossRef]
- C. Xu, et al., “Research on the nonlinear relationship between carbon emissions from residential land and the built environment: A case study of Susong County, Anhui Province using the XGBoost-SHAP model,” Land, vol. 14, no. 3, pp. 440, 2025. [CrossRef]
- O. Folorunsho, et al., “Explainable ensemble deep learning model for predicting diabetic retinopathy based on APTOS 2019 eye pack dataset,” LAUTECH J. Eng. Technol., vol. 19, no. 1, pp. 1–14, 2025.
- C. Huang, et al., “Development and validation of an interpretable machine learning model for predicting left atrial thrombus or spontaneous echo contrast in non-valvular atrial fibrillation patients,” PLoS One, vol. 20, no. 1, pp. e0313562, 2025.
- M. M. Monowar, et al., “Advanced sleep disorder detection using multi-layered ensemble learning and advanced data balancing techniques,” Front. Artif. Intell., vol. 7, pp. 1506770, 2025. [CrossRef]
- Y. Cheng and K. Wang, “A high-precision machine learning-based prediction model for delayed graft function (DGF) in Chinese kidney transplant patients: A multicenter study,” unpublished, 2025.
- T. R. Noviandy, et al., “An explainable multi-model stacked classifier approach for predicting hepatitis C drug candidates,” Sci, vol. 6, no. 4, 2024. [CrossRef]
Figure 1.
Financial Distress Prediction Workflow.
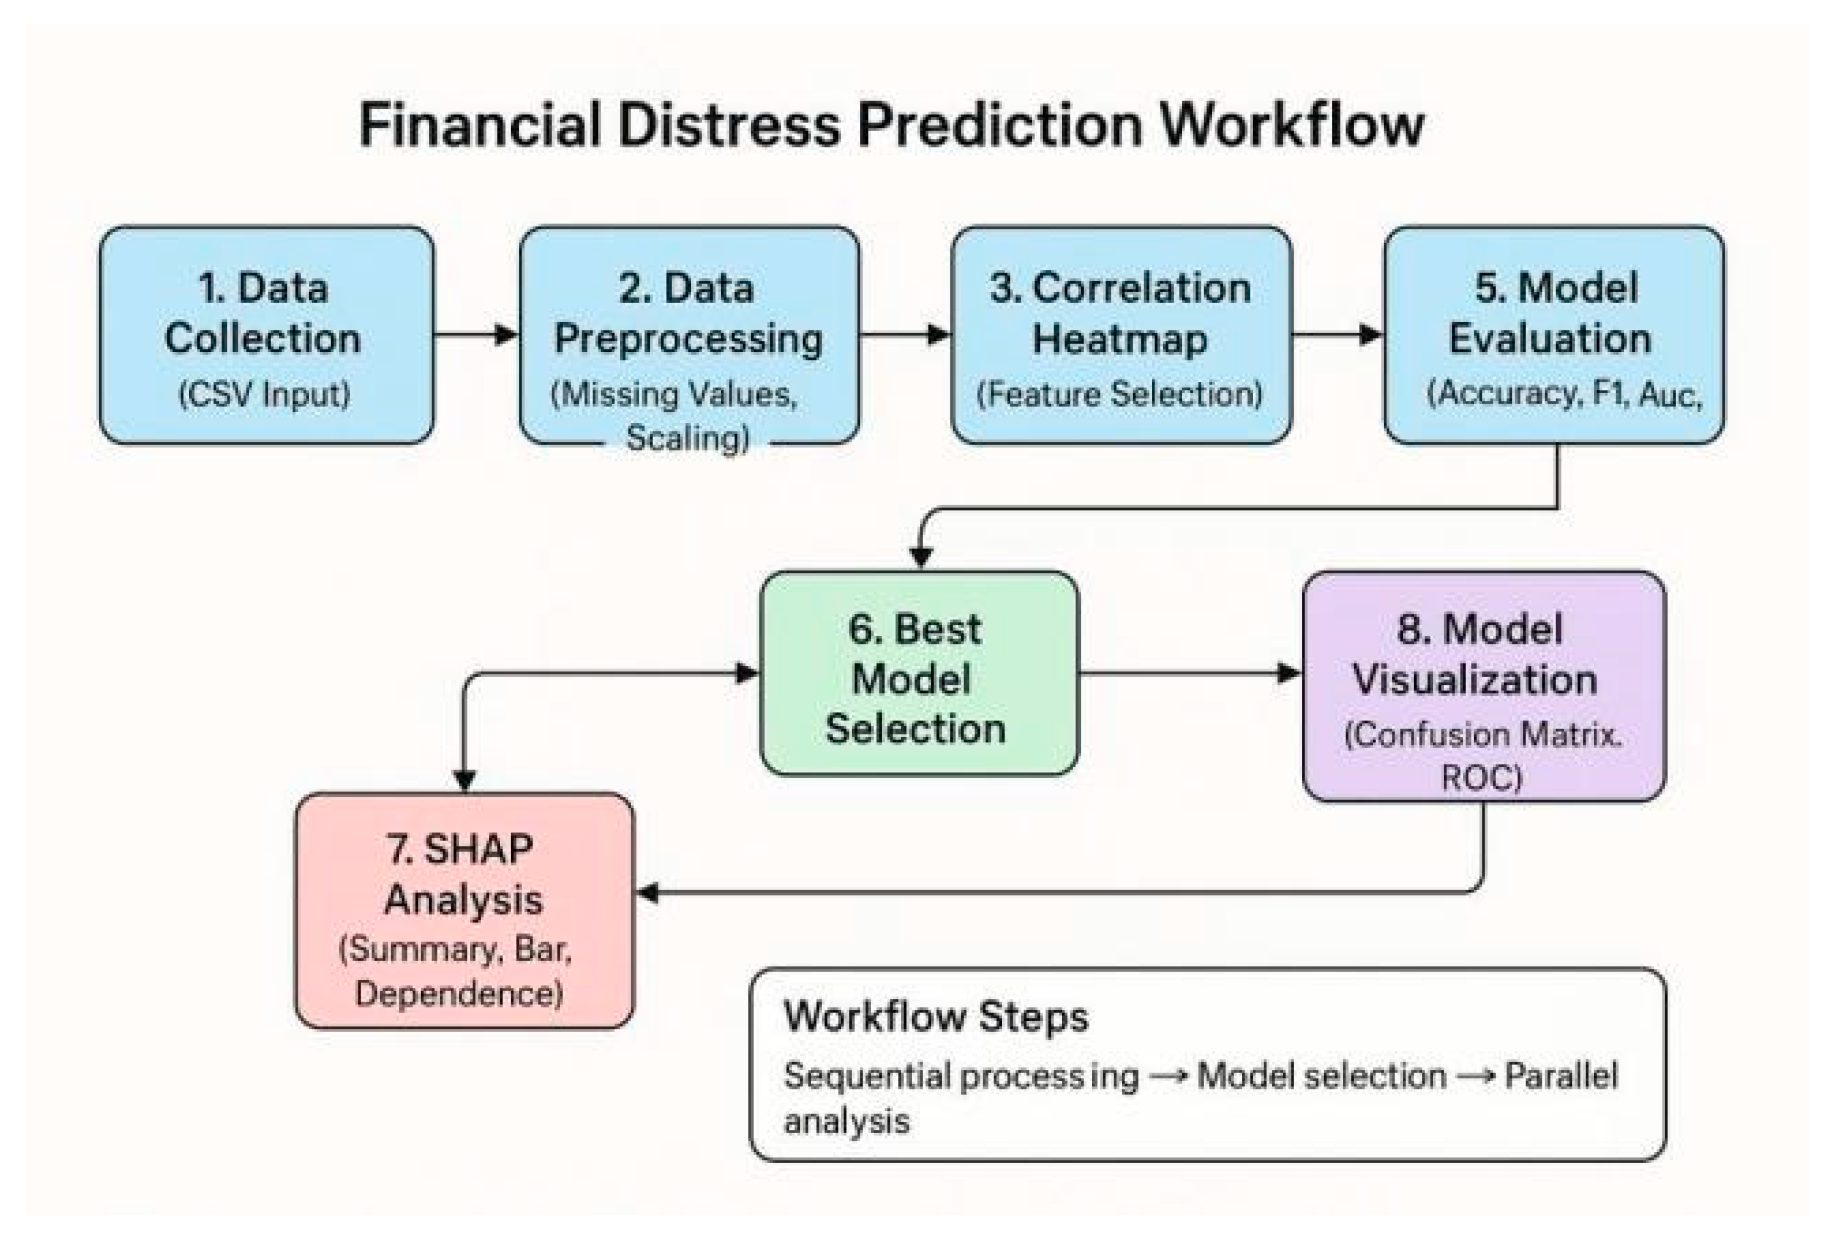
Figure 2.
Top 15 Correlated Features with Financial Distress.
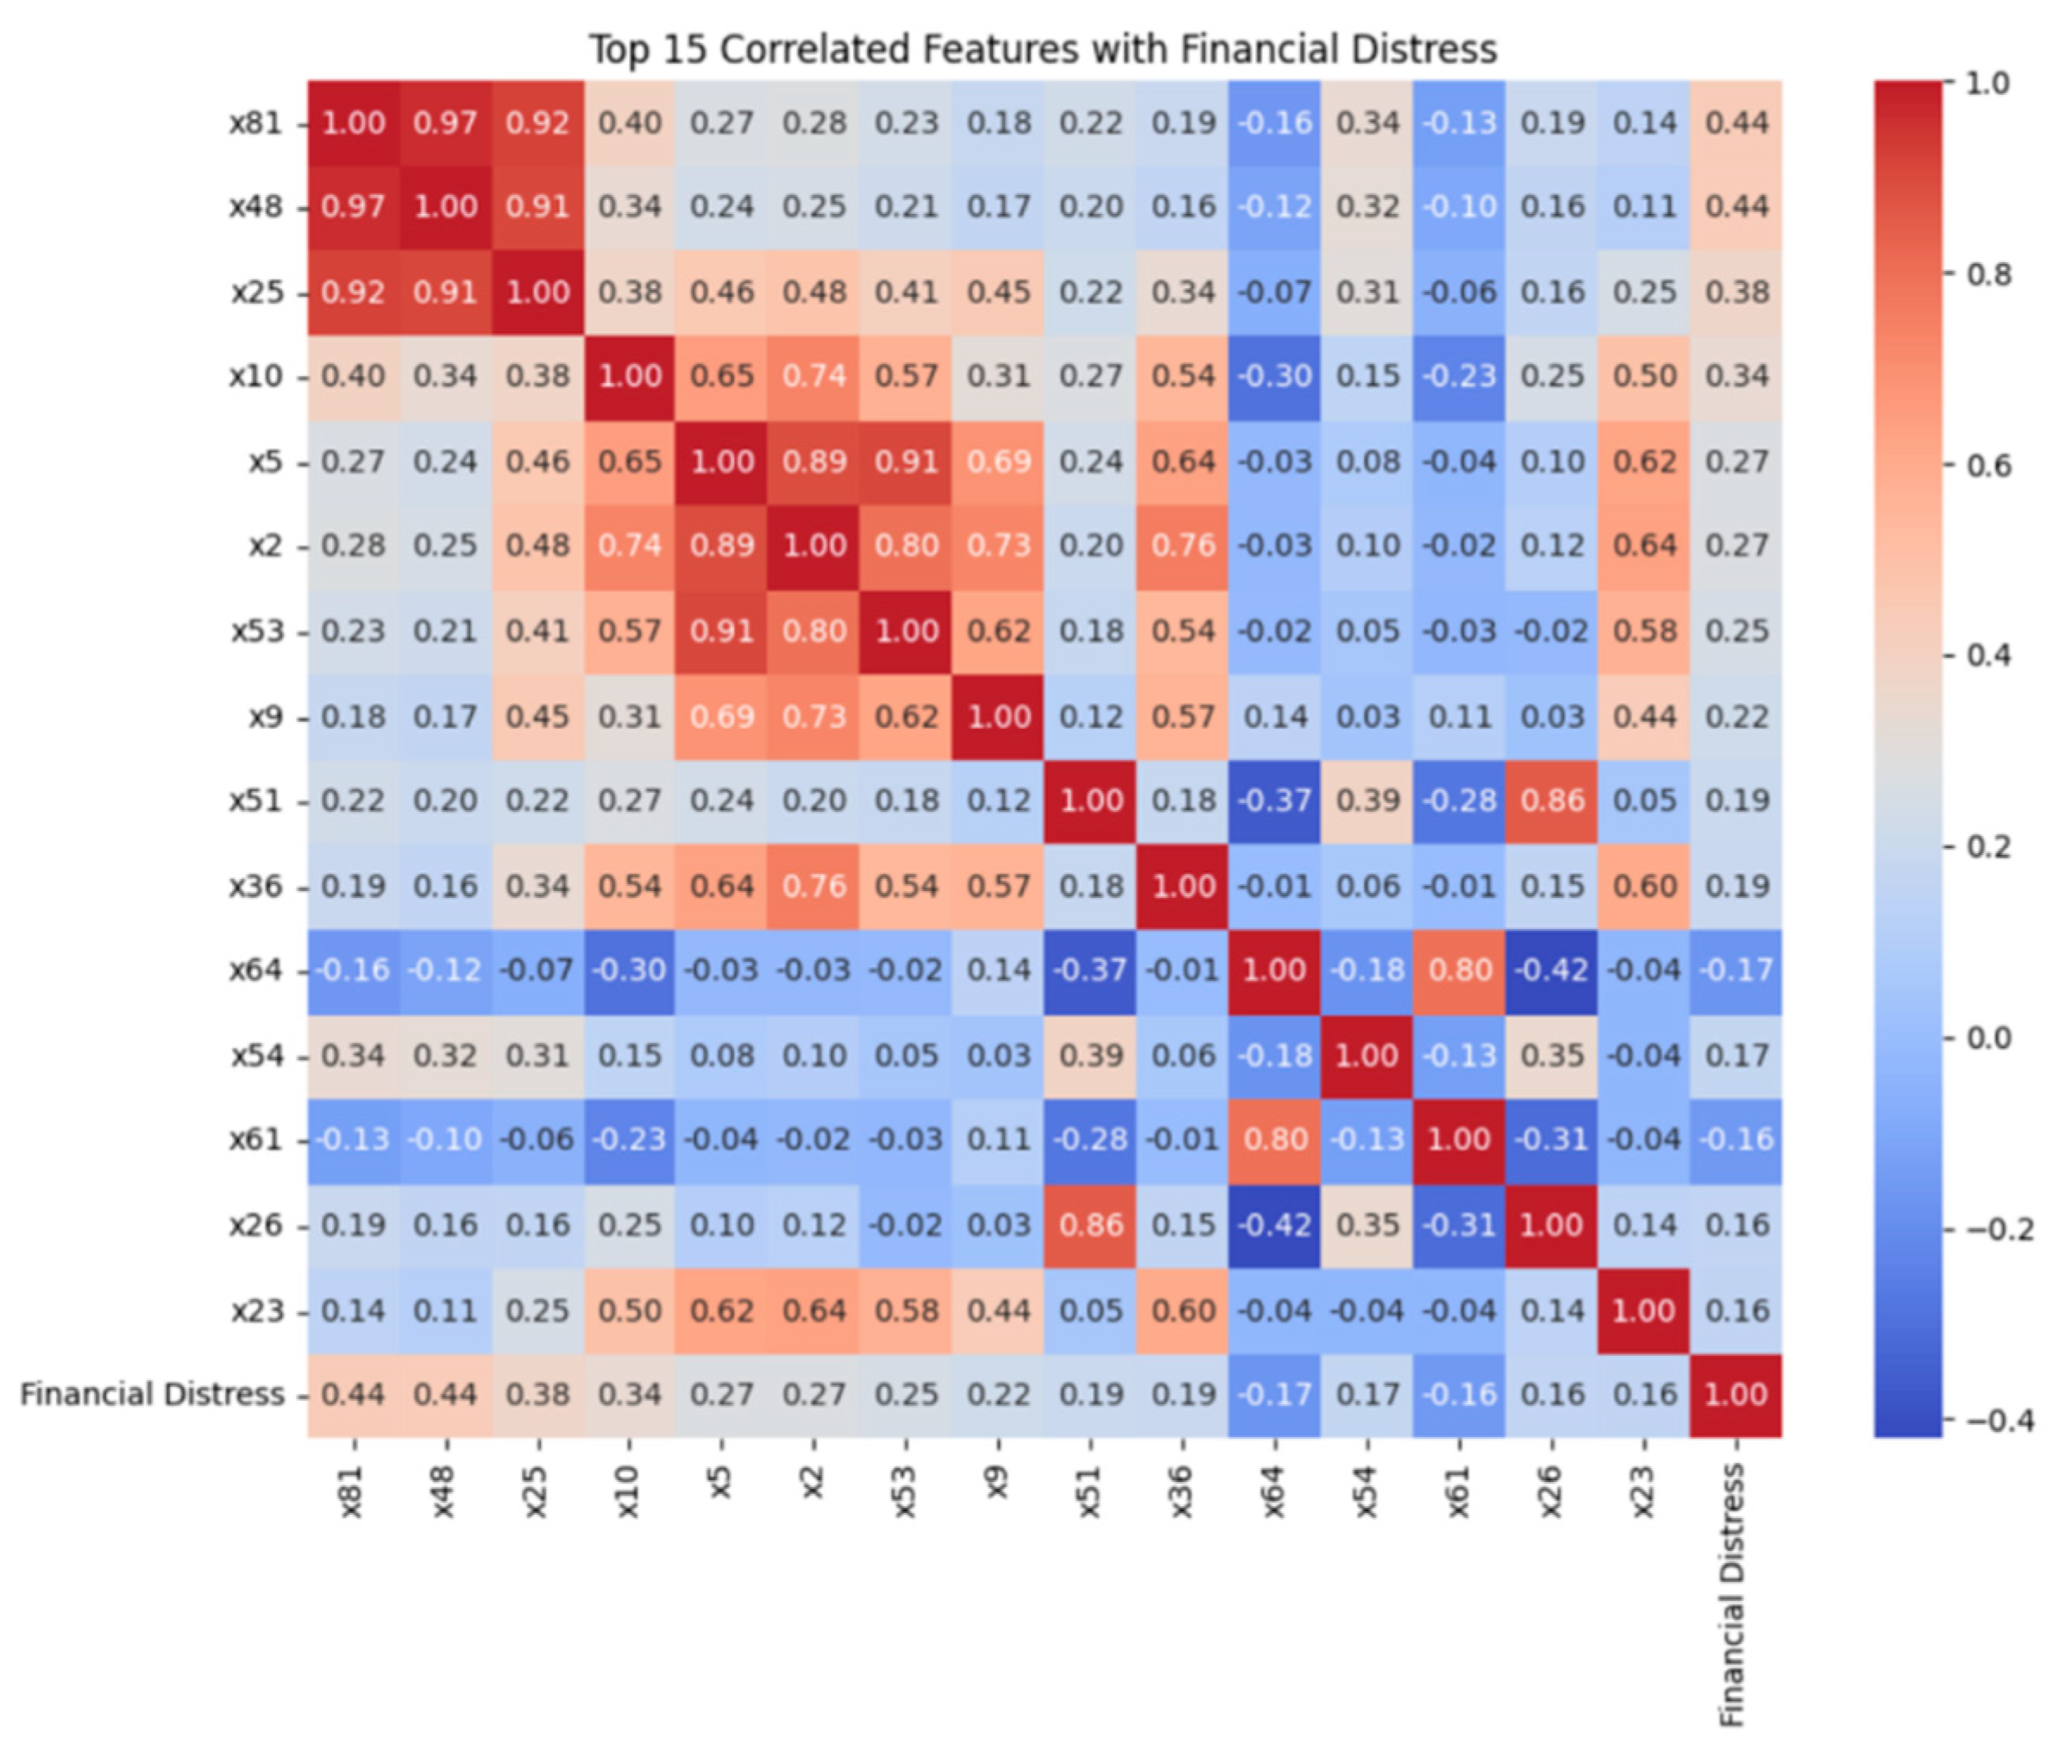
Figure 3.
Confusion Matrix - Decision Tree.
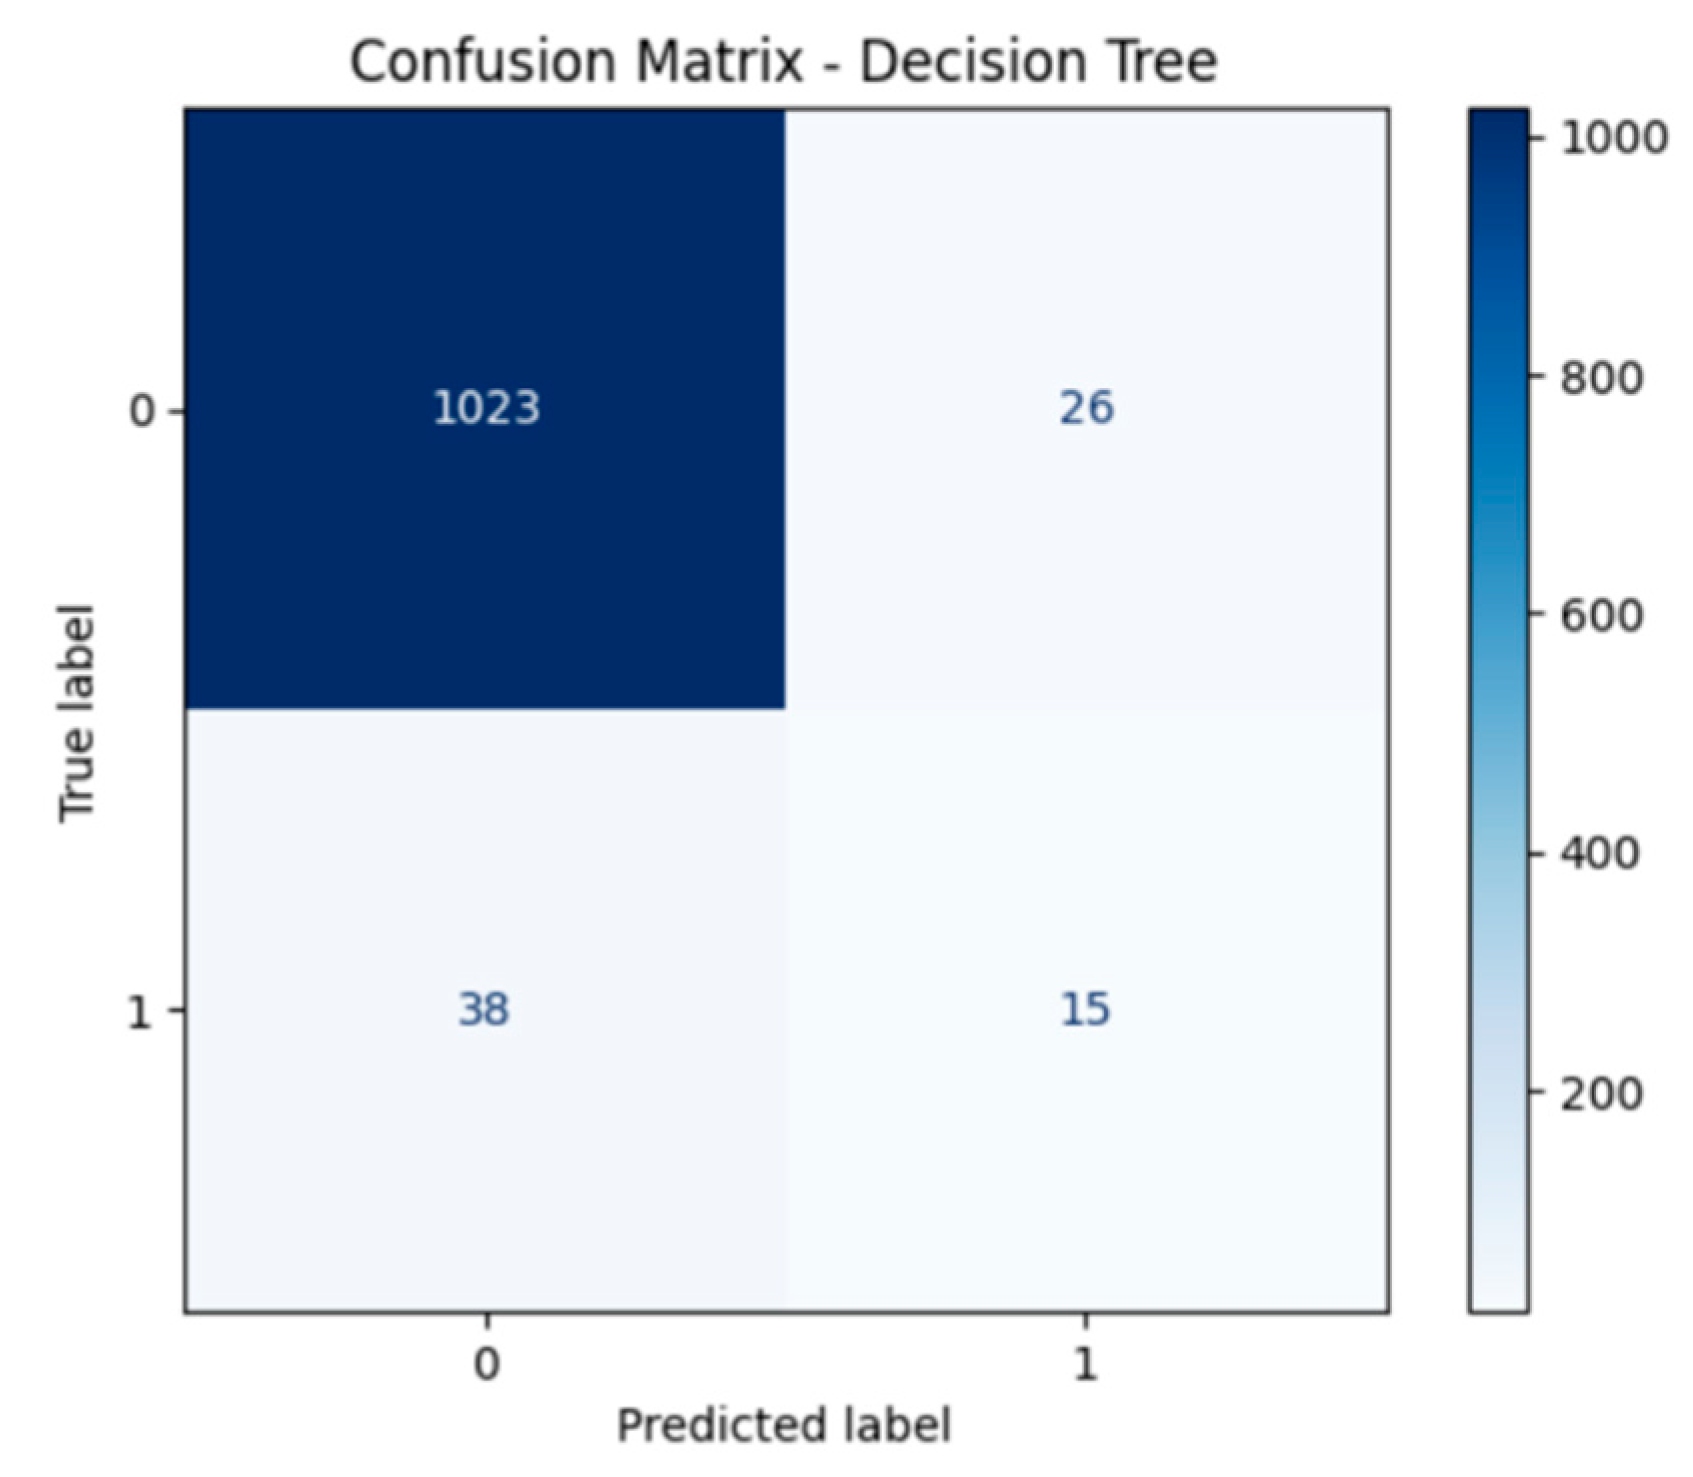
Figure 4.
ROC Curve - Decision Tree.
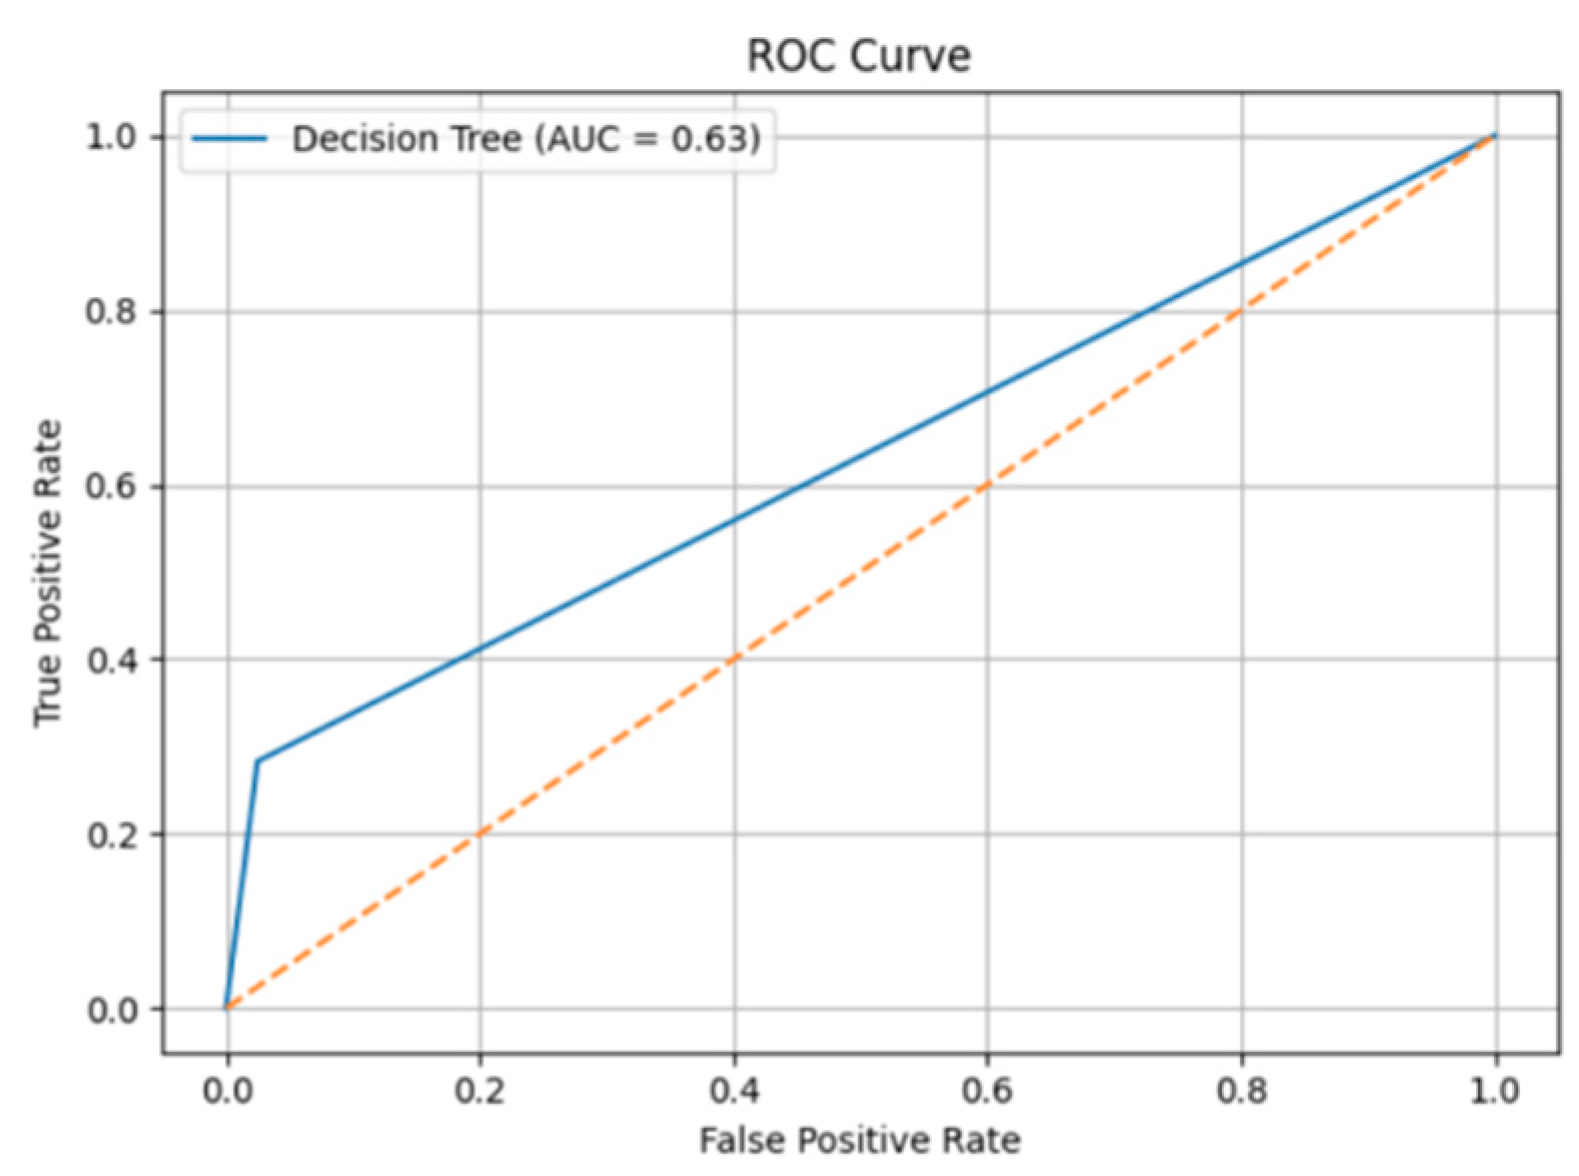
Figure 5.
SHAP Feature Importance.
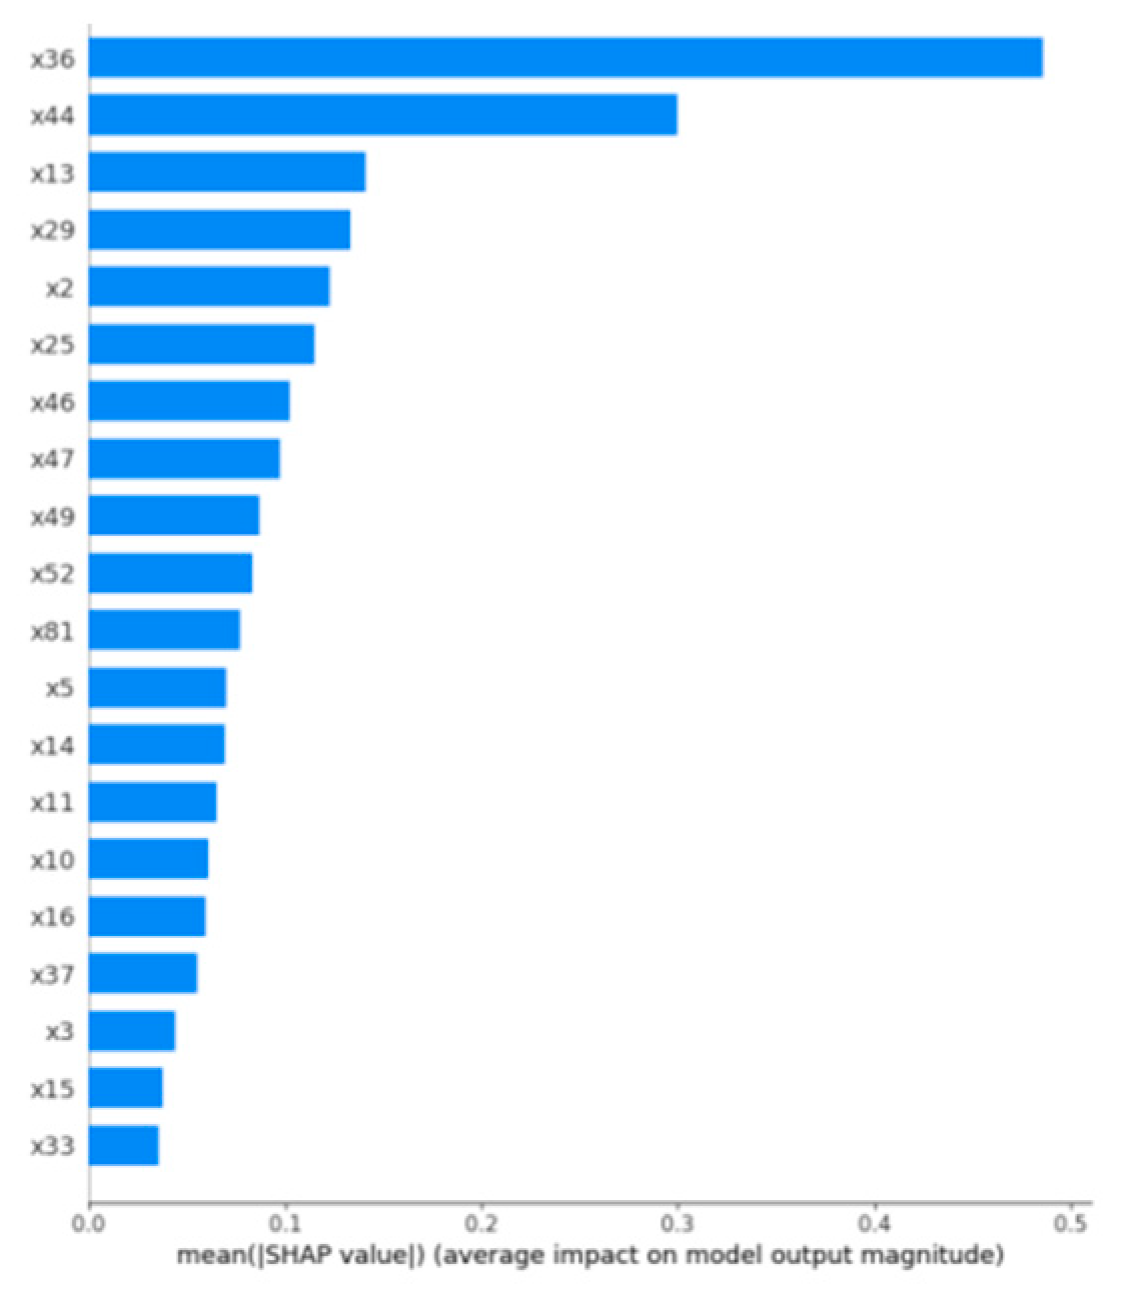
Figure 6.
SHAP Summary Plot.
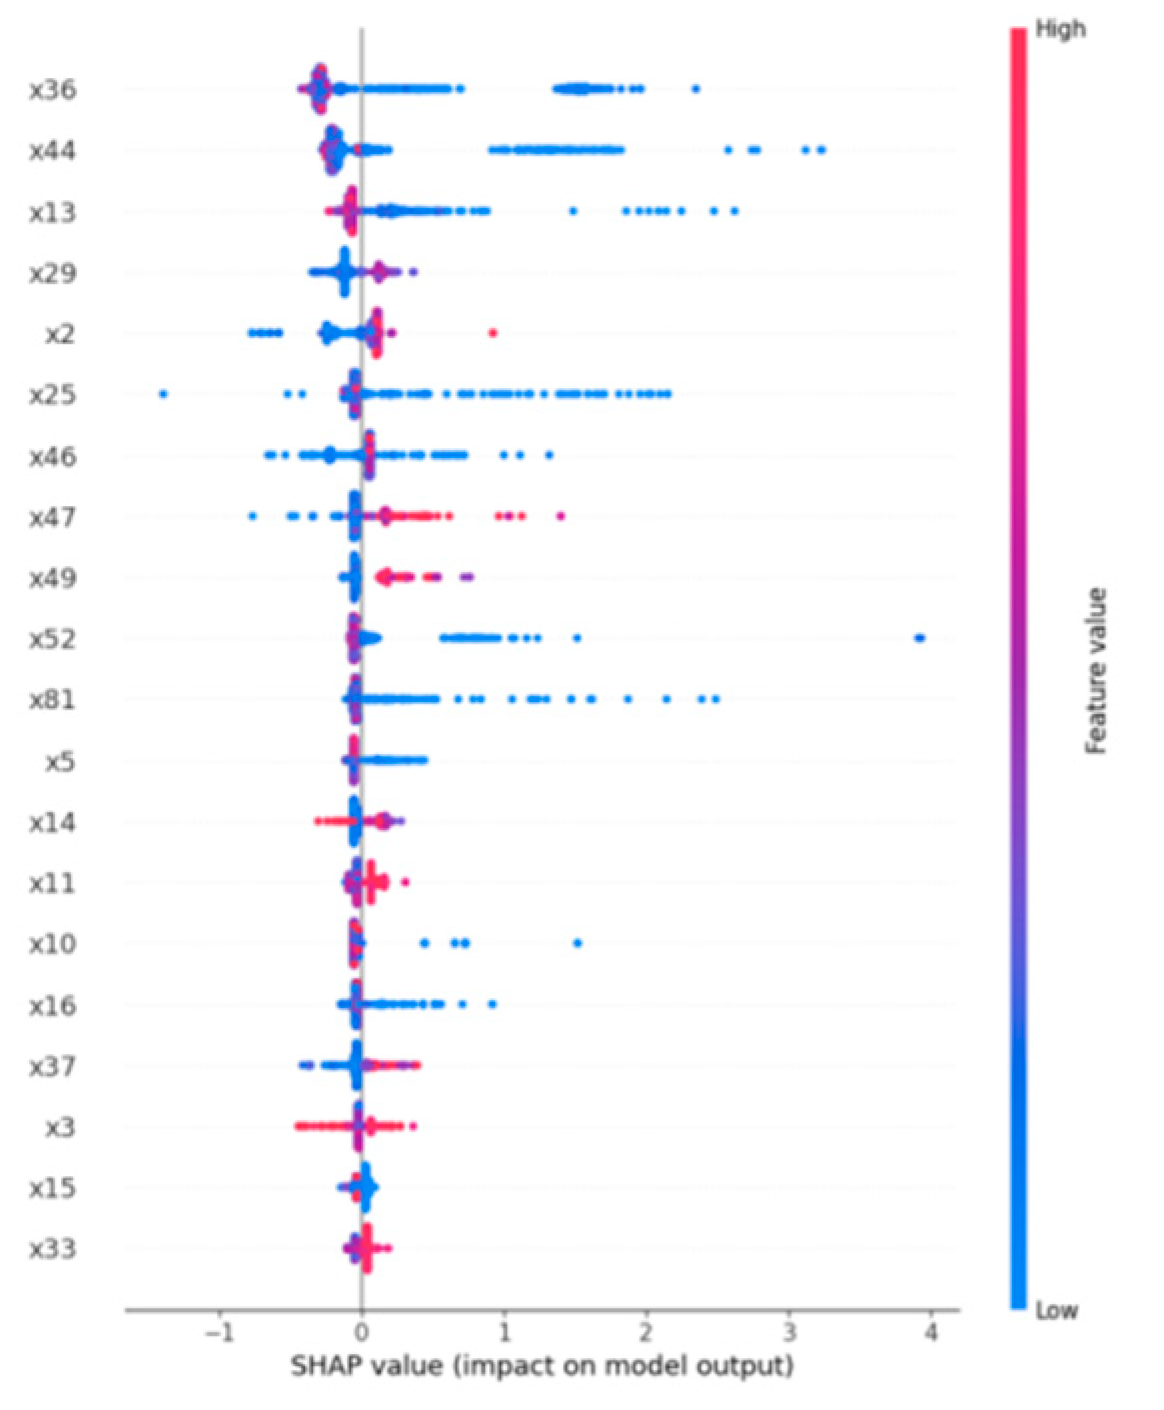
Figure 7.
SHAP Dependence Plot for x36.
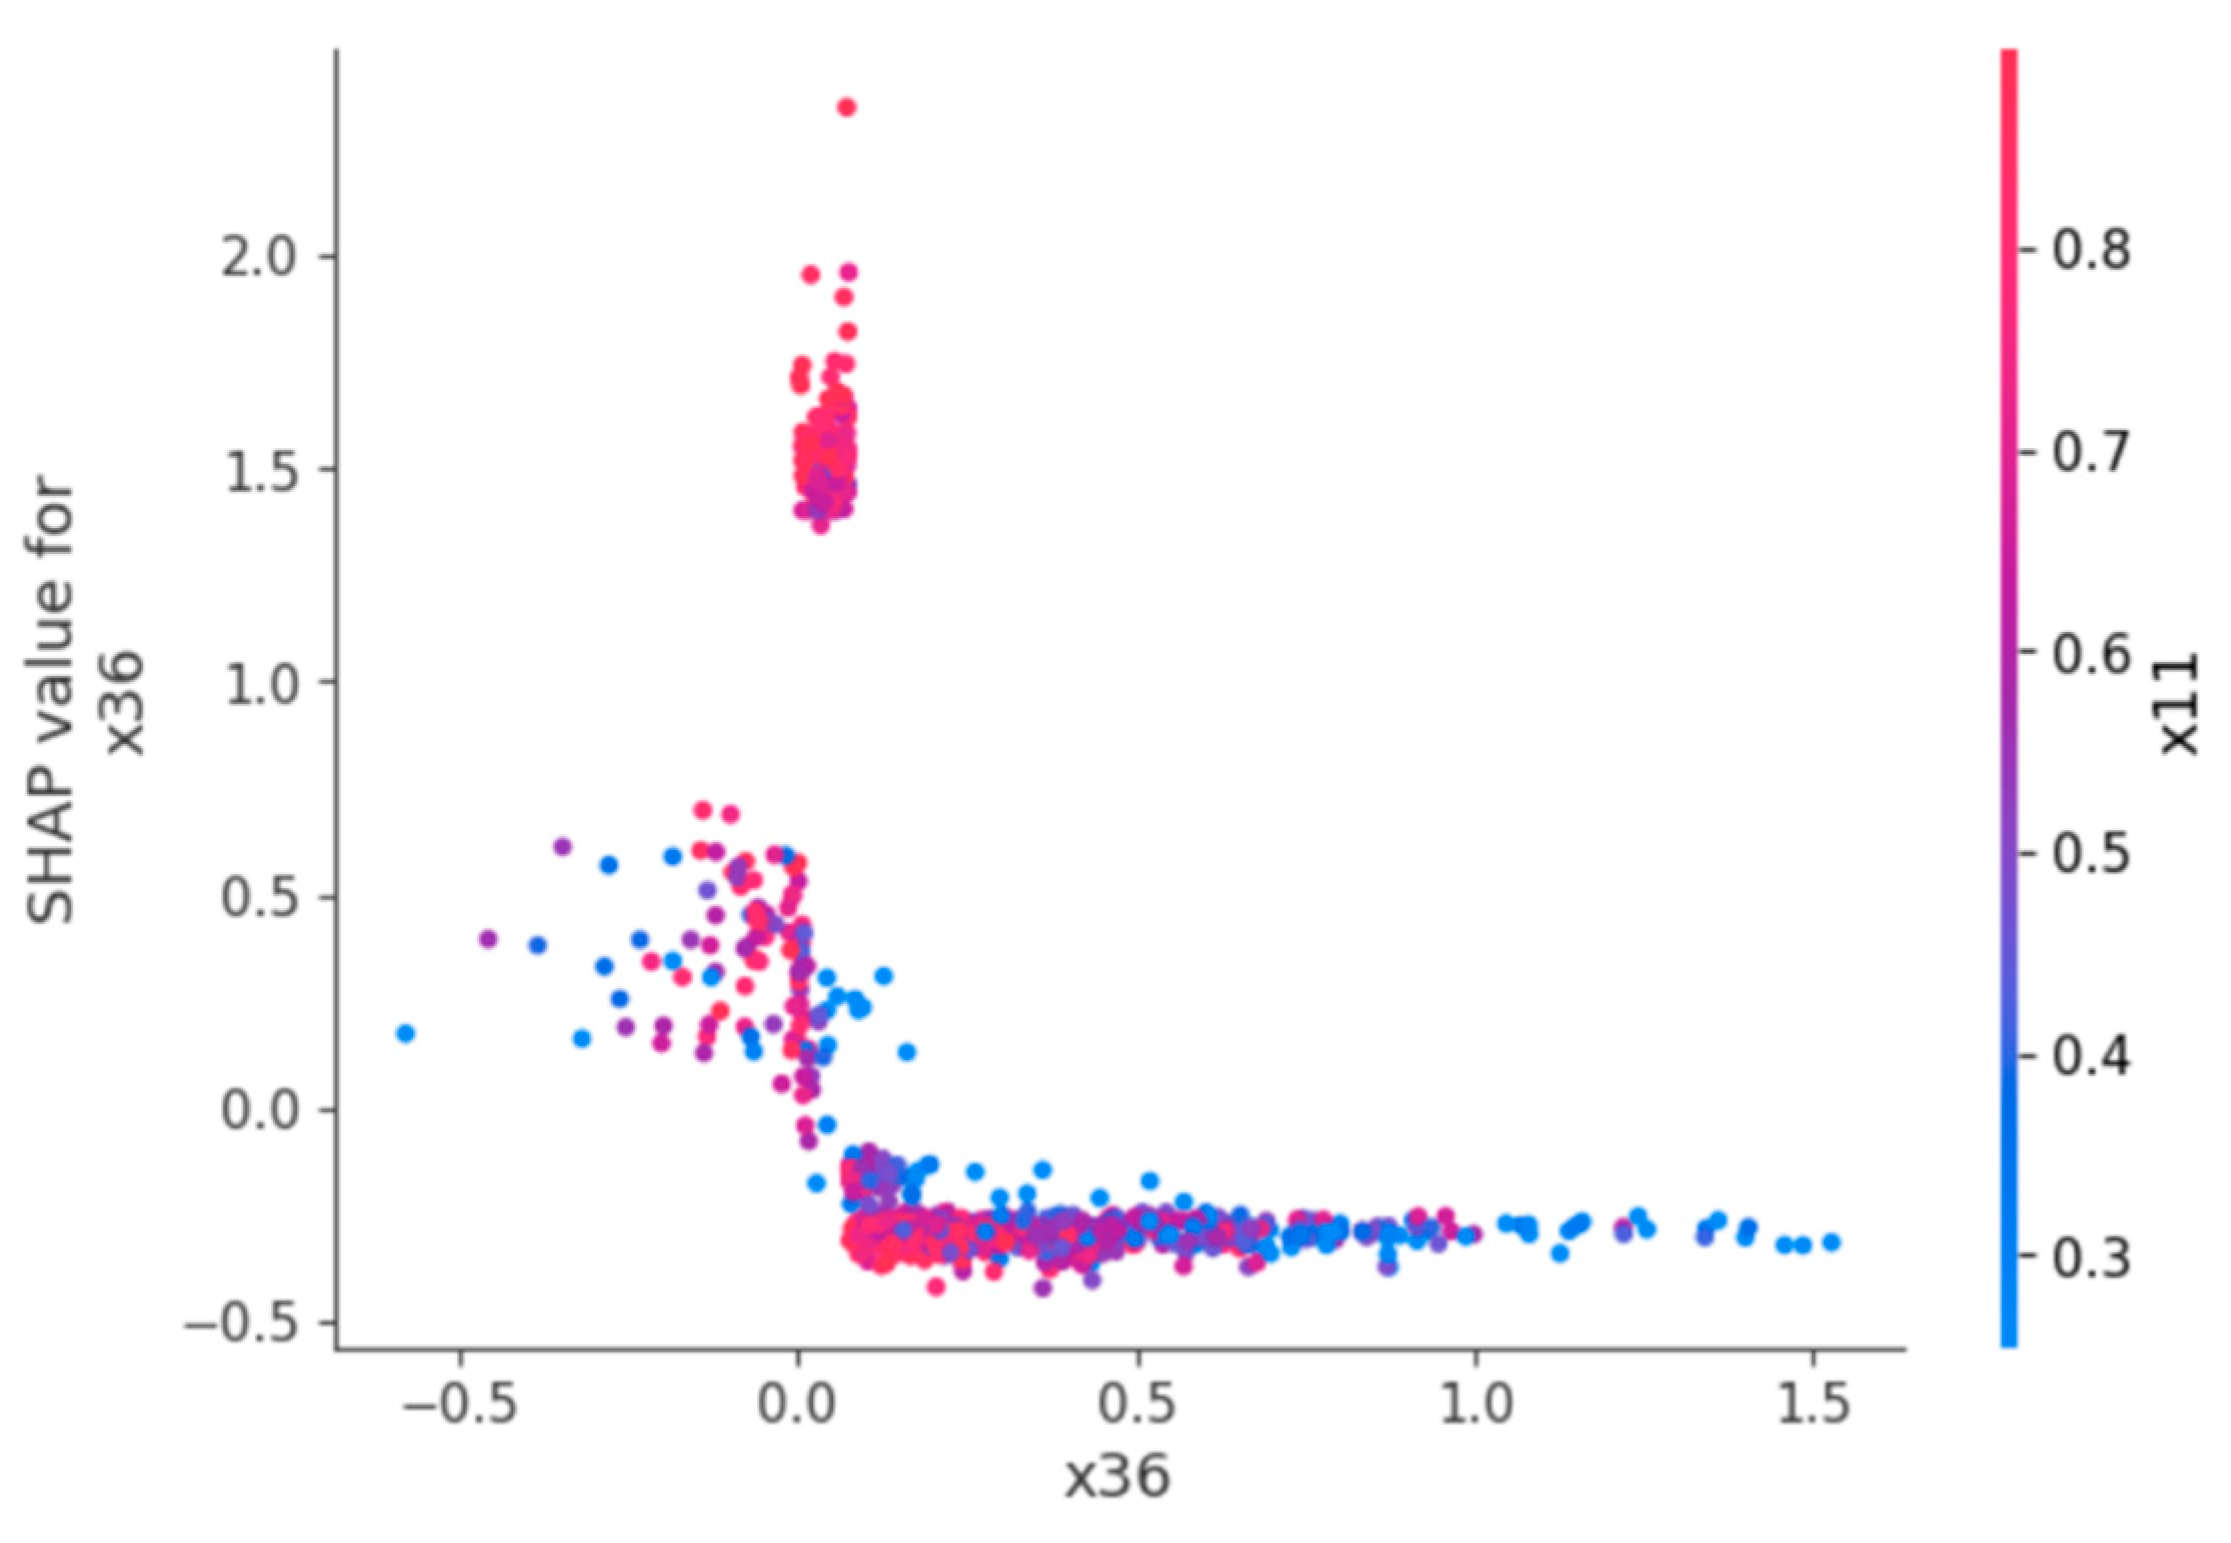

Table 1.
Model Performance Comparison.
| Model | Accuracy | Precision | Recall | F1-Score | ROC-AUC |
| Decision Tree | 0.941 | 0.366 | 0.283 | 0.319 | 0.629 |
| Gradient Boosting | 0.951 | 0.688 | 0.207 | 0.318 | 0.916 |
| Logistic Regression | 0.956 | 0.625 | 0.189 | 0.290 | 0.926 |
| XGBoost | 0.946 | 0.615 | 0.150 | 0.242 | 0.910 |
| Random Forest | 0.955 | 0.750 | 0.113 | 0.197 | 0.895 |
| Naive Bayes | 0.393 | 0.067 | 0.906 | 0.125 | 0.685 |
| KNN | 0.952 | 0.667 | 0.038 | 0.071 | 0.689 |
| SVM | 0.952 | 0.000 | 0.000 | 0.000 | 0.881 |
Disclaimer/Publisher’s Note: The statements, opinions and data contained in all publications are solely those of the individual author(s) and contributor(s) and not of MDPI and/or the editor(s). MDPI and/or the editor(s) disclaim responsibility for any injury to people or property resulting from any ideas, methods, instructions or products referred to in the content. |
© 2025 by the authors. Licensee MDPI, Basel, Switzerland. This article is an open access article distributed under the terms and conditions of the Creative Commons Attribution (CC BY) license (http://creativecommons.org/licenses/by/4.0/).
Copyright: This open access article is published under a Creative Commons CC BY 4.0 license, which permit the free download, distribution, and reuse, provided that the author and preprint are cited in any reuse.


