Submitted:
09 June 2025
Posted:
10 June 2025
You are already at the latest version
Abstract
Background: Alcohol-associated liver disease (ALD) is a primary global health concern, exacerbated by oxidative stress, inflammation, and gut barrier dysfunction. Conventional phytocompounds exhibit hepatoprotective potential but are hindered by low bioavailability. This study aimed to evaluate the hepatoprotective and gut barrier-restorative effects of green-synthesized silver nanoparticles (AgNPs) derived from Enicostemma littorale, a medicinal plant known for its antioxidant and anti-inflammatory properties. Methods: AgNPs were synthesized using aqueous leaf extract of E. littorale and characterized by UV-Vis, XRD, FTIR, DLS, and SEM. HepG2 (liver) and Caco-2 (colon) cells were exposed to 0.2 M ethanol, AgNPs (1–100 µg/mL), or both, to simulate ethanol-induced toxicity. A range of in vitro assays was performed to assess cell viability, oxidative stress (H₂DCFDA), nuclear and morphological integrity (DAPI and AO/EtBr staining), lipid accumulation (Oil Red O), and gene expression of pro- and anti-inflammatory, antioxidant, and tight junction markers using RT-qPCR. Results: Ethanol exposure significantly increased ROS, lipid accumulation, and expression of inflammatory genes, while decreasing antioxidant enzymes and tight junction proteins. Green AgNPs at lower concentrations (1 &10 µg/mL) restored cell viability, reduced ROS levels, preserved nuclear morphology, and downregulated CYP2E1 and SREBP expression. Notably, AgNPs improved the expression of Nrf2, HO-1, ZO-1, and IL-10, and reduced TNF-α and IL-6 expression in both cell lines, indicating protective effects on both liver and intestinal cells. Conclusions: Green-synthesized AgNPs from E. littorale exhibit potent hepatoprotective and gut barrier-restoring effects through antioxidant, anti-inflammatory, and antilipidemic mechanisms. These findings support the therapeutic potential of plant-based nanoparticles in mitigating ethanol-induced gut–liver axis dysfunction.
Keywords:
Green synthesis
; AgNPs
; Enicostemma littorale dried leaves
; hepatoprotective activity
; gut barrier
; alcohol associated liver disease
1. Introduction
Over the past several years, plant-derived materials and natural compounds have been widely utilized for their anti-inflammatory and antioxidant properties in the treatment of various diseases. For example, curcumin has been employed as an anti-inflammatory agent in conditions such as atherosclerosis, arthritis, and inflammatory bowel disease [1]. In addition, other compounds like silymarin, resveratrol, quercetin, and apigenin have demonstrated beneficial effects in a range of diseases, particularly as hepatoprotective agents [2]. Despite their therapeutic potential, a significant limitation of these plant-based compounds is their poor bioavailability, which greatly reduces their effectiveness. Oral and intestinal absorption of these compounds is typically low, ranging between 20–40% [3,4,5]. As a result, their protective efficacy at lower doses diminishes, often necessitating administration at higher concentrations, an approach that is not always feasible or safe.
To address this challenge, many researchers have proposed the green synthesis of nanoparticles as a promising strategy. Specifically, synthesizing nanoparticles from the same plant extracts that contain the bioactive natural compounds can significantly enhance their bioavailability. The green synthesis of metal nanoparticles using plant extracts has gained increasing attention in recent years due to its numerous advantages. These nanoparticles are generally more cost-effective to produce than chemically synthesized counterparts, and they exhibit improved absorption, a larger surface area, and reduced toxicity [6]. Additionally, green-synthesized nanoparticles incorporate plant-derived functional groups such as proteins, flavonoids, saponins, amino acids, and polyphenols that assist in both the reduction of metal ions and the stabilization of nanoparticles [7,8]. Owing to their enhanced bioactivity, such nanoparticles are being explored as therapeutic agents for a wide range of diseases.
Several hepatic diseases have been identified, including metabolic dysfunction-associated fatty liver disease (MAFLD), ALD, drug-induced liver injury, hepatic encephalopathy, and hepatitis. These conditions commonly impair liver metabolism and its regenerative capacity. Among the two major types of fatty liver disease, a drug targeting MAFLD has been approved by the Food and Drug Administration (FDA), whereas therapeutic options for ALD are still undergoing clinical evaluation. Silymarin, a key bioactive compound derived from Silybum marianum, is currently in Phase III clinical trials, while other treatments such as probiotics and fecal microbiota transplantation are also being assessed for their therapeutic potential. However, a significant limitation of silymarin is its poor water solubility, which leads to low bioavailability. To overcome this challenge, various nanoparticle-based approaches have been investigated for both MAFLD and ALD. Among these, formulations combining herbal compounds or green-synthesized nanoparticles have shown promising results in both in vitro and in vivo models [9,10]. In the case of ALD, chronic alcohol consumption leads to metabolic dysfunction, including the activation of cytochrome P450E1 (CYP2E1) and the overproduction of reactive oxygen species (ROS), thereby initiating an inflammatory cascade [11]. Furthermore, alcohol disrupts intestinal tight junctions, contributing to gut barrier dysfunction, which is often considered a secondary mechanism of liver injury. The resulting permeability allows toxic metabolites to translocate from the gut to the liver, exacerbating hepatic inflammation. These metabolites also induce immune responses that further harm gut epithelial cells. Therefore, an ideal therapeutic agent should be both non-toxic and anti-inflammatory to counteract the damage caused by ethanol. Considering their beneficial properties, green-synthesized silver nanoparticles (AgNPs) may serve as effective candidates to protect the gut–liver axis from alcohol-induced injury.
In this study, we used leaf extract from the Mamejavo plant (Enicostemma littorale), which is traditionally employed in the treatment of diabetes. This plant also exhibits potential anti-nephrotic activity, primarily attributed to the bioactive compound swertiamarin [12]. Given the therapeutic properties of both the plant extract and its active compound, their green synthesized AgNPs may serve as effective hepatoprotective agents. We hypothesize that AgNPs synthesized via green chemistry from E. littorale can help ameliorate ethanol-induced cellular damage. By restoring gut metabolites and reinforcing tight junction integrity, these nanoparticles may prevent secondary liver injury and mitigate the progression of liver disease.
2. Materials and Methods
2.1. Materials:
Silver nitrate was procured from Loba Chemicals (Mumbai, India). DAPI was obtained from Sigma-Aldrich (St. Louis, MO, USA), while H₂DCFDA was purchased from Merck (Darmstadt, Germany). Acridine orange (AO) and ethidium bromide (EtBr) were sourced from SRL, and Oil Red O (ORO) powder was obtained from HiMedia (Mumbai, India). Reagents used for gene expression analysis included RNAiso Plus (Cat. No. 9109) from Takara (Kusatsu, Japan), the Verso cDNA synthesis kit (Cat. No. AB1453) from Thermo Scientific, and PowerUp SYBR Green Master Mix from Thermo Scientific (Waltham, MA, USA). The HepG2 and Caco-2 cell lines were acquired from the National Centre for Cell Science (NCCS), Pune, India. MEM medium was purchased from HiMedia (Mumbai, India) and Gibco (Billings, MT, USA). Trypsin-EDTA, the antibiotic-antimycotic solution, and fetal bovine serum (FBS) were all obtained from Gibco.
2.2. Methodology
2.2.1. Synthesis of Green AgNPs from Plant Extract
For the preparation of plant extract, 2.5 g of dried powdered leaves of Enicostemma littorale were used. Dried powder leaves were further added to 100 mL of sterile distilled water and stirred on a magnetic hot plate stirrer for 30 mins at 60°C and 250 RPM. After stirring on a magnetic stirrer, the water extract was filtered through a Whatman No. 1 filter paper. The extract was further filter sterilized in a clean, sterile tube using a 0.2 µm syringe filter. The sterile water extract can be stored at 4°C for future use [13].
For the synthesis of AgNPs, 2 mL of the aqueous plant extract was mixed with 60 mL of a 1 mM silver nitrate (AgNO₃) solution and incubated at 50 °C for 6 hours. The entire process was carried out in a dark room to prevent any photoactivation of AgNO₃. The initiation of nanoparticle formation was indicated by a visible color change of the solution from pale yellow to dark brown upon completion of incubation. To separate the synthesized nanoparticles, the reaction mixture was centrifuged at 15,000 × g for 20 minutes. The supernatant was discarded, and the resulting pellet, containing the AgNPs, was collected. Finally, the pellet was air-dried to obtain dry nanoparticle powder, which was then used for further characterization and experimental procedures.
For experimental purposes, AgNPs were weighed and suspended in Milli-Q water, which was then further filtered and sterilized in a new sterile tube using a 0.2 µm syringe filter. The suspension was further bath sonicated for 20 to 30 min prior to the experiments. This would facilitate the proper dispersion of nanoparticles in culture media.
2.2.2. Determination of AgNPs
Prior to characterization, the synthesized silver nanoparticles (AgNPs) were suspended in distilled water and sonicated in a bath sonicator for 30 min to ensure uniform dispersion. Optical properties were assessed using a UV–Visible spectrophotometer (Shimadzu UV-1800, Japan) in the spectral range of 300–700 nm. Distilled water was used as the reference solvent since AgNPs were dispersed in it. The absorbance spectrum was used to evaluate the quality and confirm the synthesis of AgNPs from the plant extract.
To determine the hydrodynamic diameter and polydispersity index (PDI), dynamic light scattering (DLS) analysis was performed at a scattering angle of 90°, based on the principle of Brownian motion. The crystalline nature of the nanoparticles was examined using X-ray diffraction (XRD) in the 2θ range of 20° to 80°, based on Bragg’s law, where 2θ represents the angle between the incident and reflected X-rays.
Fourier-transform infrared spectroscopy (FTIR) was employed to identify functional groups involved in the reduction and stabilization (capping) of AgNPs. The conventional potassium bromide (KBr) pellet method was used for sample preparation. For morphological analysis, the nanoparticle suspension was drop-cast onto a coverslip and imaged using scanning electron microscopy (SEM) and FE-SEM to observe the shape and surface structure of the silver nanoparticles [13].
2.2.3. Cell Culture Studies
For cell culture experiments, human-derived HepG2 (hepatocellular carcinoma) and Caco-2 (colorectal adenocarcinoma) cell lines were obtained from the National Centre for Cell Science (NCCS), Pune. HepG2 cells were cultured in Minimum Essential Medium (MEM) supplemented with 10% fetal bovine serum (FBS) and 1× non-essential amino acids. Caco-2 cells were maintained in low-glucose Dulbecco’s Modified Eagle Medium (DMEM) supplemented with 20% FBS and 1× antibiotic-antimycotic solution containing penicillin, streptomycin, and amphotericin B. For experimental treatments, cells were incubated in low-serum media. All cell lines were maintained at 37 °C in a humidified incubator with 5% CO₂.
Cell viability study via 3-(4,5-dimethylthiazol-2-yl)-2,5-diphenyltetrazolium bromide (MTT):
The cytotoxicity of AgNPs was evaluated using the MTT assay on HepG2 and Caco-2 cell lines. Approximately 11,000–15,000 Caco-2 cells and 20,000–25,000 HepG2 cells were seeded into 96-well plates and incubated for 24 hours. Once the cells reached 45–50% confluency, they were treated with varying concentrations of AgNPs (1–100 µg/mL), both alone and in combination with 0.2 M ethanol (prepared in culture medium). The final volume in each well was maintained at 100 µL.
After 24 hours of treatment, cells were washed with PBS and incubated with fresh medium containing MTT reagent at a final concentration of 0.5 mg/mL. The plates were incubated at 37 °C in the dark for 1 to 4 hours. Following incubation, the MTT-containing medium was removed, and formazan crystals were solubilized using 100% DMSO. Absorbance was measured at 570 nm using a multimode ELISA plate reader, and cell viability was calculated using the following equation [14]:
where, As = Absorbance of test
Ac = Absorbance of control
Cell damage study:
AO/EtBr dual staining:
Acridine orange (AO) and ethidium bromide (EtBr) dual staining was employed to assess cell death, nuclear morphological changes, and the formation of apoptotic bodies. The same number of HepG2 and Caco-2 cells as used in previous assays were seeded into 96-well plates. Once the cells reached 40–50% confluency, they were treated with 0.2 M ethanol, AgNPs alone, or a combination of ethanol and AgNPs. After 24 hours of treatment, the cells were washed with phosphate-buffered saline (PBS) and stained with a 100 µg/mL AO/EB solution. The stained cells were immediately visualized under a fluorescence inverted microscope (Nikon Eclipse 3000) using FITC and TRITC filters. Live cells with intact membranes appeared green under merged channel imaging. Cells showing chromatin condensation (dense green nuclei) indicated early apoptosis, while those with compromised membrane integrity fluoresced red, signifying late apoptosis or necrotic cell death [15].
DAPI staining for nuclear morphology study:
HepG2 and Caco-2 cells were seeded into 96-well plates at a density of 20,000–25,000 and 11,000–15,000 cells per well, respectively. After reaching the appropriate confluency, the cells were treated with 0.2 M ethanol and one µg/mL of AgNPs, followed by incubation for 24 h. Post-treatment, cells were gently washed with 1X phosphate-buffered saline (PBS) and fixed using 4% formaldehyde. Residual fixative was removed by subsequent washes with distilled water and PBS. The cells were then stained with 100 µM DAPI in the dark for 15 minutes. Following staining, excess DAPI was removed by washing with PBS. Fluorescence imaging was performed using a fluorescence microscope, and the emission intensity was quantified using a multimode reader (PerkinElmer) at an excitation wavelength of 385 nm. Fold change in fluorescence intensity was calculated relative to untreated control cells [14].
Reactive oxygen species (ROS) estimation:
ROS levels were measured using the fluorescent probe 2′,7′-dichlorodihydrofluorescein diacetate (H₂DCFDA). HepG2 and Caco-2 cells were seeded in 96-well plates at the same densities as previously described. After reaching the appropriate confluency, cells were treated with 0.2 M ethanol and 1 µg/mL of AgNPs and incubated for 24 h. Following treatment, the cells were washed with 1X PBS and fixed with 4% formaldehyde. Residual fixative was removed with additional PBS washes. The cells were then incubated with 20 µM H₂DCFDA in the dark for 1 hour. After staining, excess dye was removed by washing with PBS. Fluorescence intensity was recorded using a microplate reader (Perkin Elmer, MA, USA) at an excitation/emission wavelength of 480/530 nm [14,16] and fold change was calculated against normal untreated control cells.
Lipid accumulation estimation:
Ethanol exposure can induce intracellular lipid accumulation, which can be detected using lipophilic dyes such as ORO. To quantify lipid content, HepG2 and Caco-2 cells were seeded in 96-well plates at the previously mentioned densities and incubated until they reached 40–50% confluency. The cells were then treated with 0.2 M ethanol, AgNPs (1 µg/mL), and their combination to evaluate the protective effect of AgNPs against ethanol-induced lipid accumulation. After 24 hours of treatment, cells were stained with ORO following the protocol established in our previous study [14]. For quantitative analysis of lipid content, the retained stain within the cells was extracted using 100% isopropanol (IPA), and the absorbance was measured to determine total lipid accumulation.
Gene expression:
RNA isolation:
As ethanol damages cells and increases the levels of proinflammatory cytokines while decreasing the levels of anti-inflammatory cytokines, this can be further estimated through gene expression analysis. For that 6 well plates were used, and in those plates, HepG2 cells were seeded at approximately 7- 8 × 10⁶, and Caco-2 cells were seeded at approximately 5-6 × 10⁶. As the cells reached the proper confluency, they were treated with ethanol and AgNPs and incubated for 24 h. After the incubation period was completed, the cells were exposed to the cell lysis solution. Here, we used RNA isoplus from Takara for cell lysis. Briefly, 1 mL of RNAiso Plus was added to each well and incubated at room temperature for 2 minutes to lyse the cells. The lysate was then transferred to microcentrifuge tubes, followed by the addition of chloroform. After vigorous mixing, the samples were centrifuged at 12,000 × g for 15 minutes at 4°C. After the centrifugation, the top transparent layer was collected in a clean microcentrifuge tube and further combined with 100% IPA. These tubes were further incubated at RT for 10 mins and then again centrifuged at 12000 g for 10 minutes at 4°C. At the bottom, a pellet would appear after centrifugation, which was further washed with 75% ethanol and centrifuged at 7500g for 5 min at 4°C. The supernatant was discarded, and the pellet was resuspended in nuclease-free sterile water. The pure total RNA can be stored at -80°C for future use and better stability.
cDNA synthesis
For the cDNA synthesis process, the total RNA concentration was checked using a Nanodrop (Nanodrop 2000, Thermo Fisher). The ratios of 260/280 and 260/230 should be close to 2.0 for pure RNA. Further cDNA was synthesised using the Verso cDNA synthesis kit from Thermo Scientific. 1 µg of total RNA was used to synthesize cDNA.
qPCR for gene expression analysis:
Quantitative real-time PCR (qPCR) was performed using 5 ng of synthesized cDNA as the template in a total reaction volume of 10 μL. Each reaction contained 500 nM of both forward and reverse primers, as well as SYBR Green master mix. The thermal cycling conditions were initiated with a hold at 95 °C for enzyme activation, followed by 40 cycles of denaturation at 95 °C for 30 seconds, annealing at 60 °C for 45 seconds, and extension at 72 °C for 1 minute. Relative gene expression was calculated using the 2^ΔΔCt method. 18S rRNA was used as the internal housekeeping control. Gene expression analysis was conducted in both HepG2 and Caco-2 cell lines. The list of primer sequences used is provided in Table 1.
2.3. Statistical Analysis
All experiments were conducted independently at least three times to ensure reproducibility and reliability. Data were analyzed using GraphPad Prism software version 9.0. Statistical analysis was performed using one-way or two-way ANOVA, followed by appropriate multiple comparison tests, depending on the experimental design. Results are expressed as mean ± standard deviation (SD) from three to six individual replicates.
3. Results
3.1. Synthesis and Characterisation of AgNPs
3.1.1. Synthesis of Nanoparticles
Green synthesis method has been used for the formation of AgNPs. The synthesis can be observed without any difficulty, as this color change from light yellow to dark brown (Figure 1) indicates the reduction of Ag+ to metallic Ag°, which is a characteristic feature of silver. This reduction is due to the plant extract present.
3.1.2. Characterisation of AgNPs
The color change of the suspension from pale yellow to dark brown indicates the visual confirmation of AgNPs formation. To further validate this, UV–Visible spectroscopy was employed to analyse the optical properties of the nanoparticles in aqueous solution. The absorbance spectra were recorded in the range of 300–700 nm. A distinct peak was observed at 445 nm (Figure 2A).
The diffractogram illustrating the characteristics of AgNPs was obtained through X-ray diffraction (XRD) analysis to validate the crystalline structure of the AgNPs. The resultant spectrum revealed prominent peaks observed at 2θ = 37.98 °, 46.08°, 64.69°, and 76.54°, corresponding to the Bragg reflections indicative of the face cantered cubic arrangement of silver lattice planes, specifically the (111), (200), (220), and (311) planes, respectively (Figure 2B).
The hydrodynamic size and polydispersity index of the AgNPs in suspension were determined by using Dynamic light scattering (DLS). The peak size is 155.8 d.nm, and the z-average size was 119.5 d.nm (Figure 2C). A polydispersity index (PdI) lower than 0.7 indicates that the sample is monodispersed in nature [17].
The FTIR plot shows the peaks at 3448, 2924, 2854, and 2735 cm-1. Furthermore, the peaks at 1729, 1608, and 1438 cm-1 correspond to the peak of the extracted component. Peaks at 1380, 1329, 1250, and 1039 cm-1 correspond to the presence of alkaloids in the extract compound. The peak from 850 to 600 cm-1 is related to other organic compounds present in the extract (Figure 3C). The peak at 548 cm-1 is due to the presence of Ag-O [18].
The morphology of the AgNPs with Enicostemma littorale was determined with the help of SEM. Here, the AgNPs demonstrate uniformity in shape, which is spherical. The results from another research paper that synthesizes AgNPs with plant extracts are almost identical to those in this study, showing a similar spherical morphology (Figure 3A,B).
3.2. Cell Culture
3.2.1. Cell Viability Study
Green-synthesized AgNPs were initially evaluated for their cytotoxicity. Cells were treated with AgNPs alone for 24 hours, as well as in combination with 0.2 M ethanol. Comparable cell viability was observed in both conditions. When treated with AgNPs alone, a gradual decline in viability was noted beyond 10 µg/mL, with a sharp drop observed at 20 µg/mL. In ethanol-treated cells, viability remained at approximately 75% in HepG2 and 82% in Caco-2 cells. Interestingly, co-treatment with AgNPs and ethanol resulted in increased cell viability at concentrations of 1 and 10 µg/mL, reaching up to 100%, suggesting a protective effect of AgNPs against ethanol-induced cytotoxicity. However, at concentrations above 10 µg/mL, cell viability significantly dropped to around 20% in both conditions, indicating potential toxicity of AgNPs at higher doses (Figure 4).
3.2.2. Cell Damage Study
AO/EtBr Dual Staining
The dual staining technique provided clear visual evidence of ethanol-induced cellular damage and death. In contrast, cells treated with lower concentrations of AgNPs alone maintained intact morphology, indicating minimal harm. When cells were co-treated with AgNPs and ethanol, the damage caused by ethanol was significantly reduced, and signs of cell proliferation were observed. As shown in Figure 5, both cell lines exhibited substantial damage upon exposure to ethanol. However, this effect was notably reversed in the co-treatment group. Quantitative analysis revealed that approximately 20 ± 3 out of 100 cells were damaged in the ethanol-treated group, whereas only about 10 ± 2 cells were affected in the co-treated group, demonstrating a significant reduction in cellular damage. The double staining method employed acridine orange and ethidium bromide, two fluorescent DNA-binding dyes that differentiate between live and damaged cells. Ethanol-compromised cells, having lost membrane integrity, absorbed the red dye, resulting in red-stained nuclei. In contrast, co-treatment with AgNPs significantly reduced the number of red-stained cells, further confirming the protective effect of AgNPs against ethanol-induced cytotoxicity.
DAPI Staining for Nuclear Morphology
As ethanol concentration increased, cells exhibited distorted nuclear morphology, as observed in Figure 6. Ethanol-treated cells displayed clear signs of apoptosis, including nuclear fragmentation and the presence of apoptotic bodies, indicating ethanol-induced cellular damage. In contrast, cells treated with 1 µg/mL of AgNPs alone maintained normal nuclear morphology, comparable to that of untreated control cells. In the treatment group, where cells were exposed to both ethanol and AgNPs, the nuclei remained largely intact, with only a few cells exhibiting nuclear distortion. Furthermore, analysis of DAPI fluorescence intensity revealed that treated cells exhibited reduced fluorescence, suggesting preserved nuclear integrity and reduced DNA damage.
ROS Estimation
Intracellular ROS levels were assessed using the fluorescent probe H₂DCFDA. Ethanol-treated cells exhibited a marked increase in fluorescence intensity relative to the control group, indicating elevated ROS production. ROS oxidizes H₂DCFDA to form the fluorescent compound 2′,7′-dichlorofluorescein, thereby serving as an indicator of oxidative stress. Cells exposed to AgNPs alone showed no significant change in fluorescence, suggesting that the nanoparticles do not induce oxidative stress. Notably, co-treatment with ethanol and AgNPs resulted in a reduced fluorescence intensity, indicating that AgNPs effectively attenuate ethanol-induced ROS generation (Figure 7).
Lipid Accumulation Study
As shown in Figure 8, ethanol-treated HepG2 and Caco-2 cells exhibited a marked increase in intracellular lipid accumulation compared to the control group, with a fold change of approximately 0.7. Cells treated with AgNPs alone displayed lipid levels comparable to those of the control, as determined by both microscopic visualization and quantitative analysis, indicating no adverse effect on lipid metabolism. In the co-treatment group, lipid accumulation was notably reduced relative to the ethanol-only group, suggesting that AgNPs effectively mitigate ethanol-induced lipid buildup and potentially contribute to improved cell viability.
Gene Expression Study
Ethanol exposure in HepG2 cells resulted in a significant upregulation of CYP2E1 expression, showing nearly a fivefold increase compared to control cells. However, co-treatment with AgNPs markedly reduced CYP2E1 expression levels. As CYP2E1 plays a key role in generating ROS and activating lipogenic transcription factors such as SREBP1c, its reduction suggests a protective effect. Similarly, SREBP2, which regulates de novo lipogenesis, was upregulated in ethanol-treated cells but downregulated upon AgNPs treatment. Ethanol-induced oxidative stress also led to the suppression of antioxidant markers such as Nrf2 and HO-1, both of which were restored upon AgNPs co-treatment, indicating a re-establishment of redox balance. Furthermore, ethanol triggered an increase in pro-inflammatory cytokines and a concurrent decrease in the anti-inflammatory cytokine IL-10. AgNPs treatment reversed this trend, enhancing IL-10 expression and supporting the restoration of anti-inflammatory homeostasis (Figure 9A).
Given that colonic inflammation and increased intestinal permeability exacerbate liver damage in vivo, we evaluated the expression of tight junction proteins, including ZO-1 and claudin, in colonic cells. Ethanol-treated cells exhibited significant downregulation of these proteins, consistent with previous reports [19,20]; indicating impaired barrier integrity. However, co-treatment with AgNPs restored their expression, demonstrating a protective effect on epithelial integrity. Additionally, the expression of pro-inflammatory cytokines TNF-α and IL-6 was reduced in the treatment group, suggesting attenuation of ethanol-induced inflammation (Figure 9B). These findings highlight that even at low concentrations, AgNPs can mitigate ethanol-induced damage and help preserve intestinal barrier function.
4. Discussion
Among the various types of nanoparticles, AgNPs have been extensively studied for their potent antimicrobial and therapeutic properties. In the green synthesis approach, plant-derived bioactive compounds facilitate the reduction of silver ions (Ag⁺) to elemental silver (Ag⁰). This reduction process is primarily driven by naturally occurring phytochemicals such as tannins, carboxylic acids, aldehydes, and phenolic groups, which act as both reducing and stabilizing (capping) agents. Under optimal conditions of pH and temperature, these plant metabolites promote the formation of uniformly shaped nanoparticles [21]. Due to their multifunctional properties, green-synthesized AgNPs have been explored as potential agents with antimicrobial [22], anti-inflammatory, antioxidant, and anti-diabetic [23] effects.
The formation of Green AgNPs particles depends on the environment present at the time of synthesis. The concentration of AgNO3, temperature, and incubation time with the plant extract contribute to the formation of nanoparticles. Based on all these parameters, the shape, size, and distribution are formed. To date, there are significantly fewer known reasons behind the formation of green nanoparticles. As plant compounds and phytochemicals help in the reduction of AgNO3 and act as a capping agent, providing the nanoparticles stability [24].
Further characterization of nanoparticles is essential to determine their size, shape, and physicochemical properties. In this study, green-synthesized AgNPs were characterized using UV–Visible spectroscopy, X-ray diffraction (XRD), Fourier-transform infrared spectroscopy (FTIR), and scanning electron microscopy (SEM/FE-SEM). UV–Visible spectral analysis revealed a distinct absorption peak at 454 nm, which falls within the typical range of 400–500 nm for AgNPs and corresponds to the surface plasmon resonance (SPR) phenomenon, confirming the formation of AgNPs [25]. SPR arises from the collective oscillation of free electrons on the surface of metal nanoparticles when excited by light. The strong and narrow absorption peak at 445 nm indicates that the synthesized AgNPs were isotropic and relatively uniform in size. A broader and higher wavelength peak shows the larger size of nanoparticles [26,27]. Along with that the XRD data also suggest that the 2θ values corresponds to silver lattice planes. A comparative analysis was facilitated by referencing the obtained data against the Joint Committee on Powder Diffraction Standards (JCPDS) database, specifically file number. 04-0783, as documented by [13]. Additionally, two supplementary peaks, discernible with asterisks at 27.64° and 31.91°, potentially signify the presence of additional compounds within the plant extract, eliciting intense peak responses [28]. Furthermore, the FTIR spectra exhibited the same peaks as those of the plant extract (see supplementary material), indicating that the particles possess similar characteristics to those of the plant extract. We also observed that the peaks from plant extracts were much sharper than those obtained from nanoparticles. As the particles are formed during the reduction process, the OH banding is observed at 3448 cm-1, which is attributed to the presence of the OH group and -C=O activity. Green nanoparticles synthesis is based on the oxidation and reduction process of extract molecule and metal solution. Here, the presence of the OH group may facilitate the reduction process that forms the nanoparticles [25,29,30]. The peaks at 2924 and 2825 cm-1 indicate the -C-H stretching due to phytoconstituents such as phytochemicals, tannins, and flavonoids [31,32]. Peaks at near 1380 and 1039 cm-1 correspond to -C-N- vibration, showing the presence of aliphatic and amine groups [33]. The presence of aromatic -C-C-, -C-H- , and -C-O- corresponds to 1608, 1438, and 1250 cm-1, respectively. The -C-H- stretching at 2924 and 2854 cm-1 is due to the presence of methylene asymmetric, which is prominent in plant extract [34]. A stretch bending at 1329 cm-1 corresponds to the -N-H- amide linkage, which is also present in the plant extract [25]. The peak at 548-900 cm-1 is attributed to aromatic group and alkyl halides, suggesting the presence of bioactive compounds on nanoparticles [35].
Morphological examinations were conducted using SEM and FE-SEM, which revealed that the nanoparticles were spherical in nature and had an average size of approximately 110±20 nm. The size confirmation further done using DLS. The DLS data showed a peak at 155.8 d.nm, and the z-average size was 119.5 d.nm. The hydrodynamic size of the nanoparticles may be influenced by the phytochemicals present in the leaf extract. To minimize background scattering during analysis, the nanoparticles were properly diluted [36]. The single peak obtained indicates that the sample exhibits size uniformity, suggesting that the particles are not aggregated. The PdI is 0.22 which states that sample is monodispersed and uniform throughout the solution also particles with sizes below 150 nm and a PdI close to 0.3 are generally considered suitable for efficient cellular uptake [37].
Various nanoparticles are synthesised via a green method, showing hepatoprotective effects [18,38]. Excessive ethanol exposure leads to significant liver injury, primarily by damaging hepatocytes through the induction of pro-inflammatory cytokines. This process is initiated by the activation of cytochrome P450 2E1 (CYP2E1), a key enzyme responsible for ethanol metabolism and a major contributor to ethanol-induced hepatotoxicity [39]. CYP2E1 activation leads to the generation of ROS, which in turn causes oxidative stress, resulting in lipid peroxidation, DNA damage, and eventual cell death [40]. The liver's capacity to counteract this oxidative damage through antioxidant defenses becomes insufficient under chronic ethanol exposure, leading to a disruption in redox homeostasis. Consequently, the liver, being the central organ for ethanol metabolism, undergoes substantial damage and loses its ability to maintain physiological balance [41] As the green-synthesized nanoparticles showed a positive response, they may be useful in combating diseased conditions.
Here, a cell viability study was done in both conditions. The cells were treated with different concentrations of AgNPs, and in addition, 0.2 M ethanol media was provided to the cells. Cells with higher concentrations of AgNPs exhibited higher cell death, whereas those with lower concentrations showed better cell viability, even after exposure to ethanol. This effect may be attributed to the size-dependent properties of the nanoparticles. Smaller nanoparticles possess a higher surface area-to-volume ratio, which enhances their cellular uptake and interaction, potentially leading to increased cytotoxicity at higher concentrations. In contrast, larger nanoparticles exhibit a lower surface area-to-volume ratio, limiting their cellular internalization and reducing their overall biological activity. While larger AgNPs may enter cells via ion channels, smaller nanoparticles can more readily diffuse across the cell membrane, as reported in previous studies [42,43]. Consequently, cell viability tends to decrease with increasing nanoparticle dosage. In the present study, green-synthesized AgNPs demonstrated protective effects against ethanol-induced cytotoxicity at lower concentrations, promoting cell survival and proliferation.
Ethanol exposure adversely affects cellular and nuclear morphology by increasing membrane permeability, primarily due to the generation of oxidative stress, as previously reported [11,44]. Green-synthesized AgNPs have been shown to exhibit protective effects against ethanol-induced cytotoxicity, thereby enhancing cell viability and potentially mitigating nuclear damage. Larger-sized AgNPs synthesized via green methods are generally unable to penetrate the nuclear membrane, thereby reducing the risk of interfering with nuclear processes. Consequently, cells treated with AgNPs exhibit a nuclear morphology comparable to that of untreated control cells (Figure 6). In addition to their biocompatibility, green-synthesized AgNPs possess intrinsic antioxidant properties, contributing to their cytoprotective effects. These nanoparticles have been reported to preserve DNA integrity even at relatively high concentrations. Studies have shown that AgNPs derived from plant extracts support genomic stability and may aid in maintaining nuclear architecture [45,46] thus offering therapeutic potential in disease amelioration [47]. By preserving nuclear integrity, these nanoparticles may help sustain a healthier cellular environment, reducing the expression of pro-inflammatory cytokines and promoting the production of anti-inflammatory and antioxidant molecules in liver and colonic cells.
Along with that AgNPs have different properties. They have shown promising potential in wound healing by exhibiting anti-necrotic activity, promoting cell proliferation, and enhancing cell migration, all of which contribute to improved cell survival and disease amelioration [48]. Ethanol exposure is known to activate necrotic pathways, particularly through the upregulation of pro-inflammatory mediators such as tumor necrosis factor-α (TNF-α). Enicostemma littorale plant extract has been reported to exert protective effects against necrosis by downregulating TNF-α expression and facilitating tissue regeneration [49,50]. Given that the AgNPs in the current study were synthesized using this plant extract, it is plausible that they possess similar bioactive properties. However, due to their nanoscale size, these particles are likely to exhibit enhanced bioavailability and increased biological activity compared to the crude extract. Concerning colonic injury, ethanol-induced damage to intestinal epithelial cells can indirectly exacerbate liver pathology in vivo by releasing pro-inflammatory cytokines. These molecules contribute to colonic inflammation and further compromise gut–liver axis integrity. In this study, treatment with green-synthesized AgNPs appeared to mitigate cellular damage, enhance viability, and potentially interrupt this pathological cascade, thereby supporting their therapeutic potential (Figure 5).
Green-synthesized nanoparticles exhibit intrinsic antioxidant activity, effectively inhibiting the formation of ROS such as hydrogen peroxide (H₂O₂), superoxide anion (O₂⁻), and hydroxyl radicals (•OH). These ROS can interact with cellular macromolecules, including DNA, proteins, and lipids, leading to structural modifications and functional impairments that contribute to cellular damage and apoptosis. Ethanol metabolism in cells, primarily via CYP2E1, results in the production of acetaldehyde, which in turn elevates ROS levels and promotes the expression of pro-inflammatory cytokines while suppressing antioxidant defense mechanisms. In this study, both HepG2 and Caco-2 cells exposed to ethanol demonstrated elevated ROS levels (Figure 7). However, treatment with green-synthesized AgNPs significantly reduced ROS production, indicating their potent antioxidant effect. Compared to chemically synthesized AgNPs, green-synthesized variants exhibit enhanced antioxidant capacity, attributed to their ability to effectively donate or accept electrons, thereby stabilizing free radicals and mitigating oxidative damage [51,52]. This electron transfer capability enables them to quench ROS and maintain cellular redox homeostasis efficiently.
Ethanol exposure predominantly affects lipid metabolism by altering the expression of key regulatory genes such as Peroxisome Proliferator-Activated Receptor alpha (PPAR-α) and Sterol Regulatory Element-Binding Protein 1c (SREBP1c). Under ethanol-induced stress, PPAR-α, a gene responsible for promoting lipid catabolism, becomes downregulated, while SREBP1c, which promotes lipogenesis, is upregulated. This dysregulation contributes to hepatic fat accumulation and steatosis [53]. Moreover, the impact of ethanol is not limited to hepatic tissue; colonic epithelial cells are also adversely affected, partly due to lipid accumulation. Several studies have indicated that ethanol induces the formation of lipid species such as ceramides and hexosylceramides, which, when elevated, can disrupt cellular function, contribute to insulin resistance, and exacerbate inflammation [54,55]. These alterations further impair tissue homeostasis and are associated with the progression of metabolic and inflammatory disorders. As the green-synthesized AgNPs treatment was administered to ethanol-treated cells, it exhibited better lipolysis than cells treated with ethanol alone (Figure 8). The antilipidemic activity exhibited by the green-synthesized AgNPs may be attributed to the presence of swertiamarin, a bioactive flavonoid found in the Enicostemma littorale plant extract used for nanoparticle synthesis. Swertiamarin not only plays a role in the reduction and stabilization of AgNPs during green synthesis but may also impart its intrinsic biological properties to the nanoparticles. Notably, swertiamarin has been reported to possess hepatoprotective and lipid-regulating properties, primarily through modulation of cholesterol metabolism and enhancement of lipolysis. Thus, the observed lipid-lowering effects of the AgNPs may result from the combined physicochemical properties of the nanoparticles and the bioactivity conferred by phytochemicals such as swertiamarin [56].
Excessive alcohol consumption primarily leads to its metabolism through the CYP2E1 pathway, resulting in the generation of ROS. These ROS trigger lipid peroxidation, inducing damage to cellular components, including DNA, proteins, and lipids, which further amplifies oxidative stress and inflammatory responses. Elevated ROS levels impair the function of endogenous antioxidant systems, notably nuclear factor erythroid 2-related factor 2 (Nrf2) and heme oxygenase-1 (HO-1), diminishing their protective activity [57]. In parallel, ethanol suppresses anti-inflammatory cytokines such as interleukin-10 (IL-10), thereby skewing the balance towards a pro-inflammatory state [58,59]. Additionally, ethanol promotes de novo lipogenesis while inhibiting β-oxidation, resulting in intracellular lipid accumulation.
Beyond hepatic effects, ethanol also compromises intestinal barrier integrity by disrupting tight junction proteins such as ZO-1, occludin, and claudin. This disruption is partly mediated by increased tyrosine kinase activity, which downregulates ZO-1 expression and impairs the functionality of tight junctions. Ethanol also inhibits hypoxia-inducible factor 1-alpha (HIF-1α), leading to epithelial cell injury in the colon [60]. The resulting epithelial damage elevates local inflammation, promoting the release of pro-inflammatory interleukins, which further deteriorate tight junction integrity and exacerbate intestinal permeability, contributing to systemic inflammation.
Since ethanol disrupts both hepatic and intestinal homeostasis, it is essential to target the underlying mechanisms in both organs. Given the gut's secondary yet significant role in disease progression, a therapeutic strategy that addresses both hepatic and intestinal cellular dysfunctions is crucial for effective intervention.
5. Conclusions
Ethanol-induced liver damage is a significant global health concern, contributing to a high mortality rate among liver-related disorders. It is primarily a lifestyle-associated disease caused by excessive alcohol consumption, which not only impairs liver function but also disrupts gut homeostasis by damaging tight junction proteins and triggering intestinal inflammation. This breakdown in gut barrier integrity facilitates the translocation of pro-inflammatory cytokines and toxic metabolites to the liver via the portal circulation, thereby accelerating disease progression. To address this, green-synthesized nanoparticles have emerged as promising therapeutic agents, particularly because many plant-derived compounds suffer from poor water solubility and limited intestinal absorption. Nanoparticle formulation enhances their bioavailability and therapeutic efficacy. In this study, green-synthesized AgNPs derived from Enicostemma littorale extract demonstrated potent antioxidant, anti-inflammatory, anti-lipidemic, and cell-proliferative activities in both hepatic and colonic cell models (Figure 10). These properties collectively contributed to mitigating the damage caused by ethanol. For future studies, in vivo validation is recommended to authenticate the protective effects of green-synthesized AgNPs further and to explore their potential as a therapeutic strategy for alcohol-associated liver and gut dysfunction.
Supplementary Materials
The following supporting information can be downloaded at the website of this paper posted on Preprints.org, Figure S1: title; Table S1: title; Video S1: title.
Author Contributions
Conceptualization, and validation H.A.; methodology, investigation, formal analysis, H.A. and S.S.; Data visualization, M.P. and S.S.; Data curation, Validation, Formal analysis, Writing - review & editing, S.S., P.C and M.P..; writing—original draft preparation, H.A. and S.S.; Methodology and data visualization, D.P. and H.A.; Supervision, project administrator, resources, data curation and formal analysis P.M.
Funding
This research received no external funding.
Data Availability Statement
The data presented in this study are available on request from the corresponding author.
Acknowledgments
The authors gratefully acknowledge Pruthvi Patel for assistance with data collection and interpretation. The authors also extend their appreciation to P. D. Patel Institute of Applied Sciences for providing the necessary infrastructure and support to carry out the experimental work efficiently. Additionally, the authors would also like to thank www.servier.com and https://bioicons.com for generation of biological image.
Conflicts of Interest
The authors declare no conflicts of interest.
References
- Peng Y, Ao M, Dong B, Jiang Y, Yu L, Chen Z, et al. Anti-inflammatory effects of curcumin in the inflammatory diseases: Status, limitations and countermeasures. Vol. 15, Drug Design, Development and Therapy. 2021.
- Yaqub A, Ditta SA, Anjum KM, Tanvir F, Malkani N, Yousaf MZ. Comparative Analysis of Toxicity Induced by Different Synthetic Silver Nanoparticles in Albino Mice. Bionanoscience. 2019;9(3). [CrossRef]
- Javed S, Kohli K, Ahsan W. Bioavailability augmentation of silymarin using natural bioenhancers: An in vivo pharmacokinetic study. Brazilian Journal of Pharmaceutical Sciences. 2022;58. [CrossRef]
- Xie Y, Zhang D, Zhang J, Yuan J. Metabolism, transport and drug–drug interactions of silymarin. Vol. 24, Molecules. 2019. [CrossRef]
- Siegel AB, Stebbing J. Milk thistle: Early seeds of potential. Vol. 14, The Lancet Oncology. 2013.
- Khan MF, Khan MA. Plant-Derived Metal Nanoparticles (PDMNPs): Synthesis, Characterization, and Oxidative Stress-Mediated Therapeutic Actions. Future Pharmacology. 2023;3(1). [CrossRef]
- Xulu JH, Ndongwe T, Ezealisiji KM, Tembu VJ, Mncwangi NP, Witika BA, et al. The Use of Medicinal Plant-Derived Metallic Nanoparticles in Theranostics. Vol. 14, Pharmaceutics. 2022. [CrossRef]
- Marslin G, Siram K, Maqbool Q, Selvakesavan RK, Kruszka D, Kachlicki P, et al. Secondary metabolites in the green synthesis of metallic nanoparticles. Vol. 11, Materials. 2018. [CrossRef]
- Leng M, Jiang H, Zhang S, Bao Y. Green Synthesis of Gold Nanoparticles from Polygahatous Polysaccharides and Their Anticancer Effect on Hepatic Carcinoma through Immunoregulation. ACS Omega. 2024 May 14;9(19):21144–51.
- Abbasi E, Vafaei SA, Naseri N, Darini A, Azandaryani MT, Ara FK, et al. Protective effects of cerium oxide nanoparticles in non-alcoholic fatty liver disease (NAFLD) and carbon tetrachloride-induced liver damage in rats: Study on intestine and liver. Metabol Open. 2021;12.
- Aghara H, Chadha P, Zala D, Mandal P. Stress mechanism involved in the progression of alcoholic liver disease and the therapeutic efficacy of nanoparticles. Front Immunol. 2023;14.
- Parwani K, Patel F, Patel D, Mandal P. Protective effects of swertiamarin against methylglyoxal-induced epithelial-mesenchymal transition by improving oxidative stress in rat kidney epithelial (NRK-52E) cells. Molecules. 2021;26(9). [CrossRef]
- Raj S, Chand Mali S, Trivedi R. Green synthesis and characterization of silver nanoparticles using Enicostemma axillare (Lam.) leaf extract. Biochem Biophys Res Commun. 2018;503(4).
- Aghara H, Chadha P, Mandal P. Mitigative Effect of Graphene Oxide Nanoparticles in Maintaining Gut–Liver Homeostasis against Alcohol Injury. Gastroenterol Insights. 2024 Jul 2;15(3):574–87.
- Kasibhatla S, Amarante-Mendes GP, Finucane D, Brunner T, Bossy-Wetzel E, Green DR. Acridine Orange/Ethidium Bromide (AO/EB) Staining to Detect Apoptosis. Cold Spring Harb Protoc. 2006;2006(3).
- Chadha P, Aghara H, Johnson D, Sharma D, Odedara M, Patel M, et al. Gardenin A alleviates alcohol-induced oxidative stress and inflammation in HepG2 and Caco2 cells via AMPK/Nrf2 pathway. Bioorg Chem. 2025 Jul 1;161.
- Danaei M, Dehghankhold M, Ataei S, Hasanzadeh Davarani F, Javanmard R, Dokhani A, et al. Impact of particle size and polydispersity index on the clinical applications of lipidic nanocarrier systems. Vol. 10, Pharmaceutics. 2018.
- Eswaran A, Muthukrishnan S, Mathaiyan M, Pradeepkumar S, Mari KR, Manogaran P. Green synthesis, characterization and hepatoprotective activity of silver nanoparticles synthesized from pre-formulated Liv-Pro-08 poly-herbal formulation. Applied Nanoscience (Switzerland). 2023;13(3).
- Patel F, Parwani K, Rao P, Patel D, Rawal R, Mandal P. Prophylactic Treatment of Probiotic and Metformin Mitigates Ethanol-Induced Intestinal Barrier Injury: In Vitro, in Vivo, and in Silico Approaches. Mediators Inflamm. 2021;2021.
- Patel D, Desai C, Singh D, Soppina V, Parwani K, Patel F, et al. Synbiotic Intervention Ameliorates Oxidative Stress and Gut Permeability in an In Vitro and In Vivo Model of Ethanol-Induced Intestinal Dysbiosis. Biomedicines. 2022 Dec 1;10(12).
- Liaqat N, Jahan N, Khalil-ur-Rahman, Anwar T, Qureshi H. Green synthesized silver nanoparticles: Optimization, characterization, antimicrobial activity, and cytotoxicity study by hemolysis assay. Front Chem. 2022;10.
- Ghasemi S, Dabirian S, Kariminejad F, Koohi DE, Nemattalab M, Majidimoghadam S, et al. Process optimization for green synthesis of silver nanoparticles using Rubus discolor leaves extract and its biological activities against multi-drug resistant bacteria and cancer cells. Sci Rep. 2024;14(1).
- Abbigeri MB, Thokchom B, Singh SR, Bhavi SM, Harini BP, Yarajarla RB. Antioxidant and anti-diabetic potential of the green synthesized silver nanoparticles using Martynia annua L. root extract. Nano TransMed. 2025 Dec 1;4.
- Jain S, Mehata MS. Medicinal Plant Leaf Extract and Pure Flavonoid Mediated Green Synthesis of Silver Nanoparticles and their Enhanced Antibacterial Property. Sci Rep. 2017;7(1).
- Melkamu WW, Bitew LT. Green synthesis of silver nanoparticles using Hagenia abyssinica (Bruce) J.F. Gmel plant leaf extract and their antibacterial and anti-oxidant activities. Heliyon. 2021;7(11).
- Alharbi NS, Alsubhi NS, Felimban AI. Green synthesis of silver nanoparticles using medicinal plants: Characterization and application. J Radiat Res Appl Sci. 2022;15(3).
- de Barros CHN, Cruz GCF, Mayrink W, Tasic L. Bio-based synthesis of silver nanoparticles from orange waste: Effects of distinct biomolecule coatings on size, morphology, and antimicrobial activity. Nanotechnol Sci Appl. 2018;11.
- Giri AK, Jena B, Biswal B, Pradhan AK, Arakha M, Acharya S, et al. Green synthesis and characterization of silver nanoparticles using Eugenia roxburghii DC. extract and activity against biofilm-producing bacteria. Sci Rep. 2022;12(1).
- Javan bakht Dalir S, Djahaniani H, Nabati F, Hekmati M. Characterization and the evaluation of antimicrobial activities of silver nanoparticles biosynthesized from Carya illinoinensis leaf extract. Heliyon. 2020;6(3).
- Asefian S, Ghavam M. Green and environmentally friendly synthesis of silver nanoparticles with antibacterial properties from some medicinal plants. BMC Biotechnol. 2024;24(1).
- Mishra AK, Tiwari KN, Saini R, Kumar P, Mishra SK, Yadav VB, et al. Green Synthesis of Silver Nanoparticles from Leaf Extract of Nyctanthes arbor-tristis L. and Assessment of Its Antioxidant, Antimicrobial Response. J Inorg Organomet Polym Mater. 2020;30(6).
- Martínez-Cisterna D, Chen L, Bardehle L, Hermosilla E, Tortella G, Chacón-Fuentes M, et al. Chitosan-Coated Silver Nanocomposites: Biosynthesis, Mechanical Properties, and Ag+ Release in Liquid and Biofilm Forms. Int J Mol Sci. 2025 May 1;26(9).
- Anandalakshmi K, Venugobal J, Ramasamy V. Characterization of silver nanoparticles by green synthesis method using Pedalium murex leaf extract and their antibacterial activity. Applied Nanoscience (Switzerland). 2016;6(3).
- Kowsalya R, Vinoth A, Ramya S. Antibacterial activity of silver and zinc nanoparticles loaded with Enicostemma Littorale. ~ 335 ~ Journal of Pharmacognosy and Phytochemistry. 2019;2.
- Shyamalagowri S, Charles P, Manjunathan J, Kamaraj M, Anitha R, Pugazhendhi A. In vitro anticancer activity of silver nanoparticles phyto-fabricated by Hylocereus undatus peel extracts on human liver carcinoma (HepG2) cell lines. Process Biochemistry. 2022;116.
- Hemlata, Meena PR, Singh AP, Tejavath KK. Biosynthesis of Silver Nanoparticles Using Cucumis prophetarum Aqueous Leaf Extract and Their Antibacterial and Antiproliferative Activity against Cancer Cell Lines. ACS Omega. 2020;5(10).
- Cervantes B, Arana L, Murillo-Cuesta S, Bruno M, Alkorta I, Varela-Nieto I. Solid lipid nanoparticles loaded with glucocorticoids protect auditory cells from cisplatin-induced ototoxicity. J Clin Med. 2019;8(9).
- Zhang H, Jacob JA, Jiang Z, Xu S, Sun K, Zhong Z, et al. Hepatoprotective effect of silver nanoparticles synthesized using aqueous leaf extract of Rhizophora apiculata. Int J Nanomedicine. 2019;14.
- Ha Y, Jeong I, Kim TH. Alcohol-Related Liver Disease: An Overview on Pathophysiology, Diagnosis and Therapeutic Perspectives. Vol. 10, Biomedicines. 2022.
- Salete-Granado D, Carbonell C, Puertas-Miranda D, Vega-Rodríguez VJ, García-Macia M, Herrero AB, et al. Autophagy, Oxidative Stress, and Alcoholic Liver Disease: A Systematic Review and Potential Clinical Applications. Vol. 12, Antioxidants. 2023.
- Hyun J, Han J, Lee C, Yoon M, Jung Y. Pathophysiological aspects of alcohol metabolism in the liver. Vol. 22, International Journal of Molecular Sciences. 2021.
- Nie P, Zhao Y, Xu H. Synthesis, applications, toxicity and toxicity mechanisms of silver nanoparticles: A review. Vol. 253, Ecotoxicology and Environmental Safety. 2023.
- Kotteeswaran V, Ponsreeram S, Mukherjee A, Sadagopan A, Anbalagan NK. Green Synthesis of Silver Nanoparticles using Cardiospermum Halicacabum Leaf Extract and its Effect on Human Colon Carcinoma Cells. Biomedical and Pharmacology Journal. 2024;17(2):949–63.
- Osna NA, Donohue TM, Kharbanda KK. Alcoholic Liver Disease: Pathogenesis and Current Management. Vol. 38, Alcohol research : current reviews. 2017.
- Gur T. Green synthesis, characterizations of silver nanoparticles using sumac (Rhus coriaria L.) plant extract and their antimicrobial and DNA damage protective effects. Front Chem. 2022;10.
- Blaškovičová J, Labuda J. Effect of Triclosan and Silver Nanoparticles on DNA Damage Investigated with DNA-Based Biosensor. Sensors. 2022;22(12).
- Manzoor SI, Jabeen F, Patel R, Alam Rizvi MM, Imtiyaz K, Malik MA, et al. Green synthesis of biocompatible silver nanoparticles using Trillium govanianum rhizome extract: comprehensive biological evaluation and in silico analysis. Mater Adv. 2024 Dec 18;
- Al-Nadaf AH, Awadallah A, Thiab S. Superior rat wound-healing activity of green synthesized silver nanoparticles from acetonitrile extract of Juglans regia L: Pellicle and leaves. Heliyon. 2024;10(2).
- Saranya R, Thirumalai T, Hemalatha M, Balaji R, David E. Pharmacognosy of Enicostemma littorale: A review. Asian Pac J Trop Biomed. 2013;3(1).
- Sadique J, Chandra T, Thenmozhi V, Elango V. The anti-inflammatory activity of Enicostemma littorale and Mollugo cerviana. Biochem Med Metab Biol. 1987;37(2).
- Vishwanath R, Negi B. Conventional and green methods of synthesis of silver nanoparticles and their antimicrobial properties. Vol. 4, Current Research in Green and Sustainable Chemistry. 2021.
- Akhter MS, Rahman MA, Ripon RK, Mubarak M, Akter M, Mahbub S, et al. A systematic review on green synthesis of silver nanoparticles using plants extract and their bio-medical applications. Vol. 10, Heliyon. Elsevier Ltd; 2024.
- You M, Arteel GE. Effect of ethanol on lipid metabolism. Vol. 70, Journal of Hepatology. 2019.
- Jayaprakash J, Siddabasave SG, K. Shukla P, Gowda D, Nath LR, Chiba H, et al. Sex-Specific Effect of Ethanol on Colon Content Lipidome in a Mice Model Using Nontargeted LC/MS. ACS Omega. 2024 Apr 9;9(14):16044–54.
- Wang S, Jin Z, Wu B, Morris AJ, Deng P. Role of dietary and nutritional interventions in ceramide-associated diseases. Vol. 66, Journal of lipid research. 2025. p. 100726.
- Xu L, Li D, Zhu Y, Cai S, Liang X, Tang Y, et al. Swertiamarin supplementation prevents obesity-related chronic inflammation and insulin resistance in mice fed a high-fat diet. Adipocyte. 2021;10(1).
- Li W, Yang S, Zhao Y, Di Nunzio G, Ren L, Fan L, et al. Ginseng-derived nanoparticles alleviate alcohol-induced liver injury by activating the Nrf2/HO-1 signalling pathway and inhibiting the NF-κB signalling pathway in vitro and in vivo. Phytomedicine. 2024;127.
- Seitz HK, Moreira B, Neuman MG. Pathogenesis of Alcoholic Fatty Liver a Narrative Review. Vol. 13, Life. 2023.
- Contreras-Zentella ML, Villalobos-García D, Hernández-Muñoz R. Ethanol Metabolism in the Liver, the Induction of Oxidant Stress, and the Antioxidant Defense System Ethanol Metabolism in the Liver, the Induction of Oxidant Stress, and the Antioxidant Defense System. Vol. 11, Antioxidants. 2022.
- Kuo CH, Wu LL, Chen HP, Yu J, Wu CY. Direct effects of alcohol on gut-epithelial barrier: Unraveling the disruption of physical and chemical barrier of the gut-epithelial barrier that compromises the host–microbiota interface upon alcohol exposure. Vol. 39, Journal of Gastroenterology and Hepatology (Australia). 2024.
Figure 1.
The plant dried leaf powder was suspended in water and stirred for a few minutes at high temperature to ensure the compound was present in the water extract. Further combining this with a silver nitrate solution resulted in the formation of nanoparticles in the presence of biomolecules in the solution. The color change of the solution after the incubation period indicates the formation of nanoparticles.
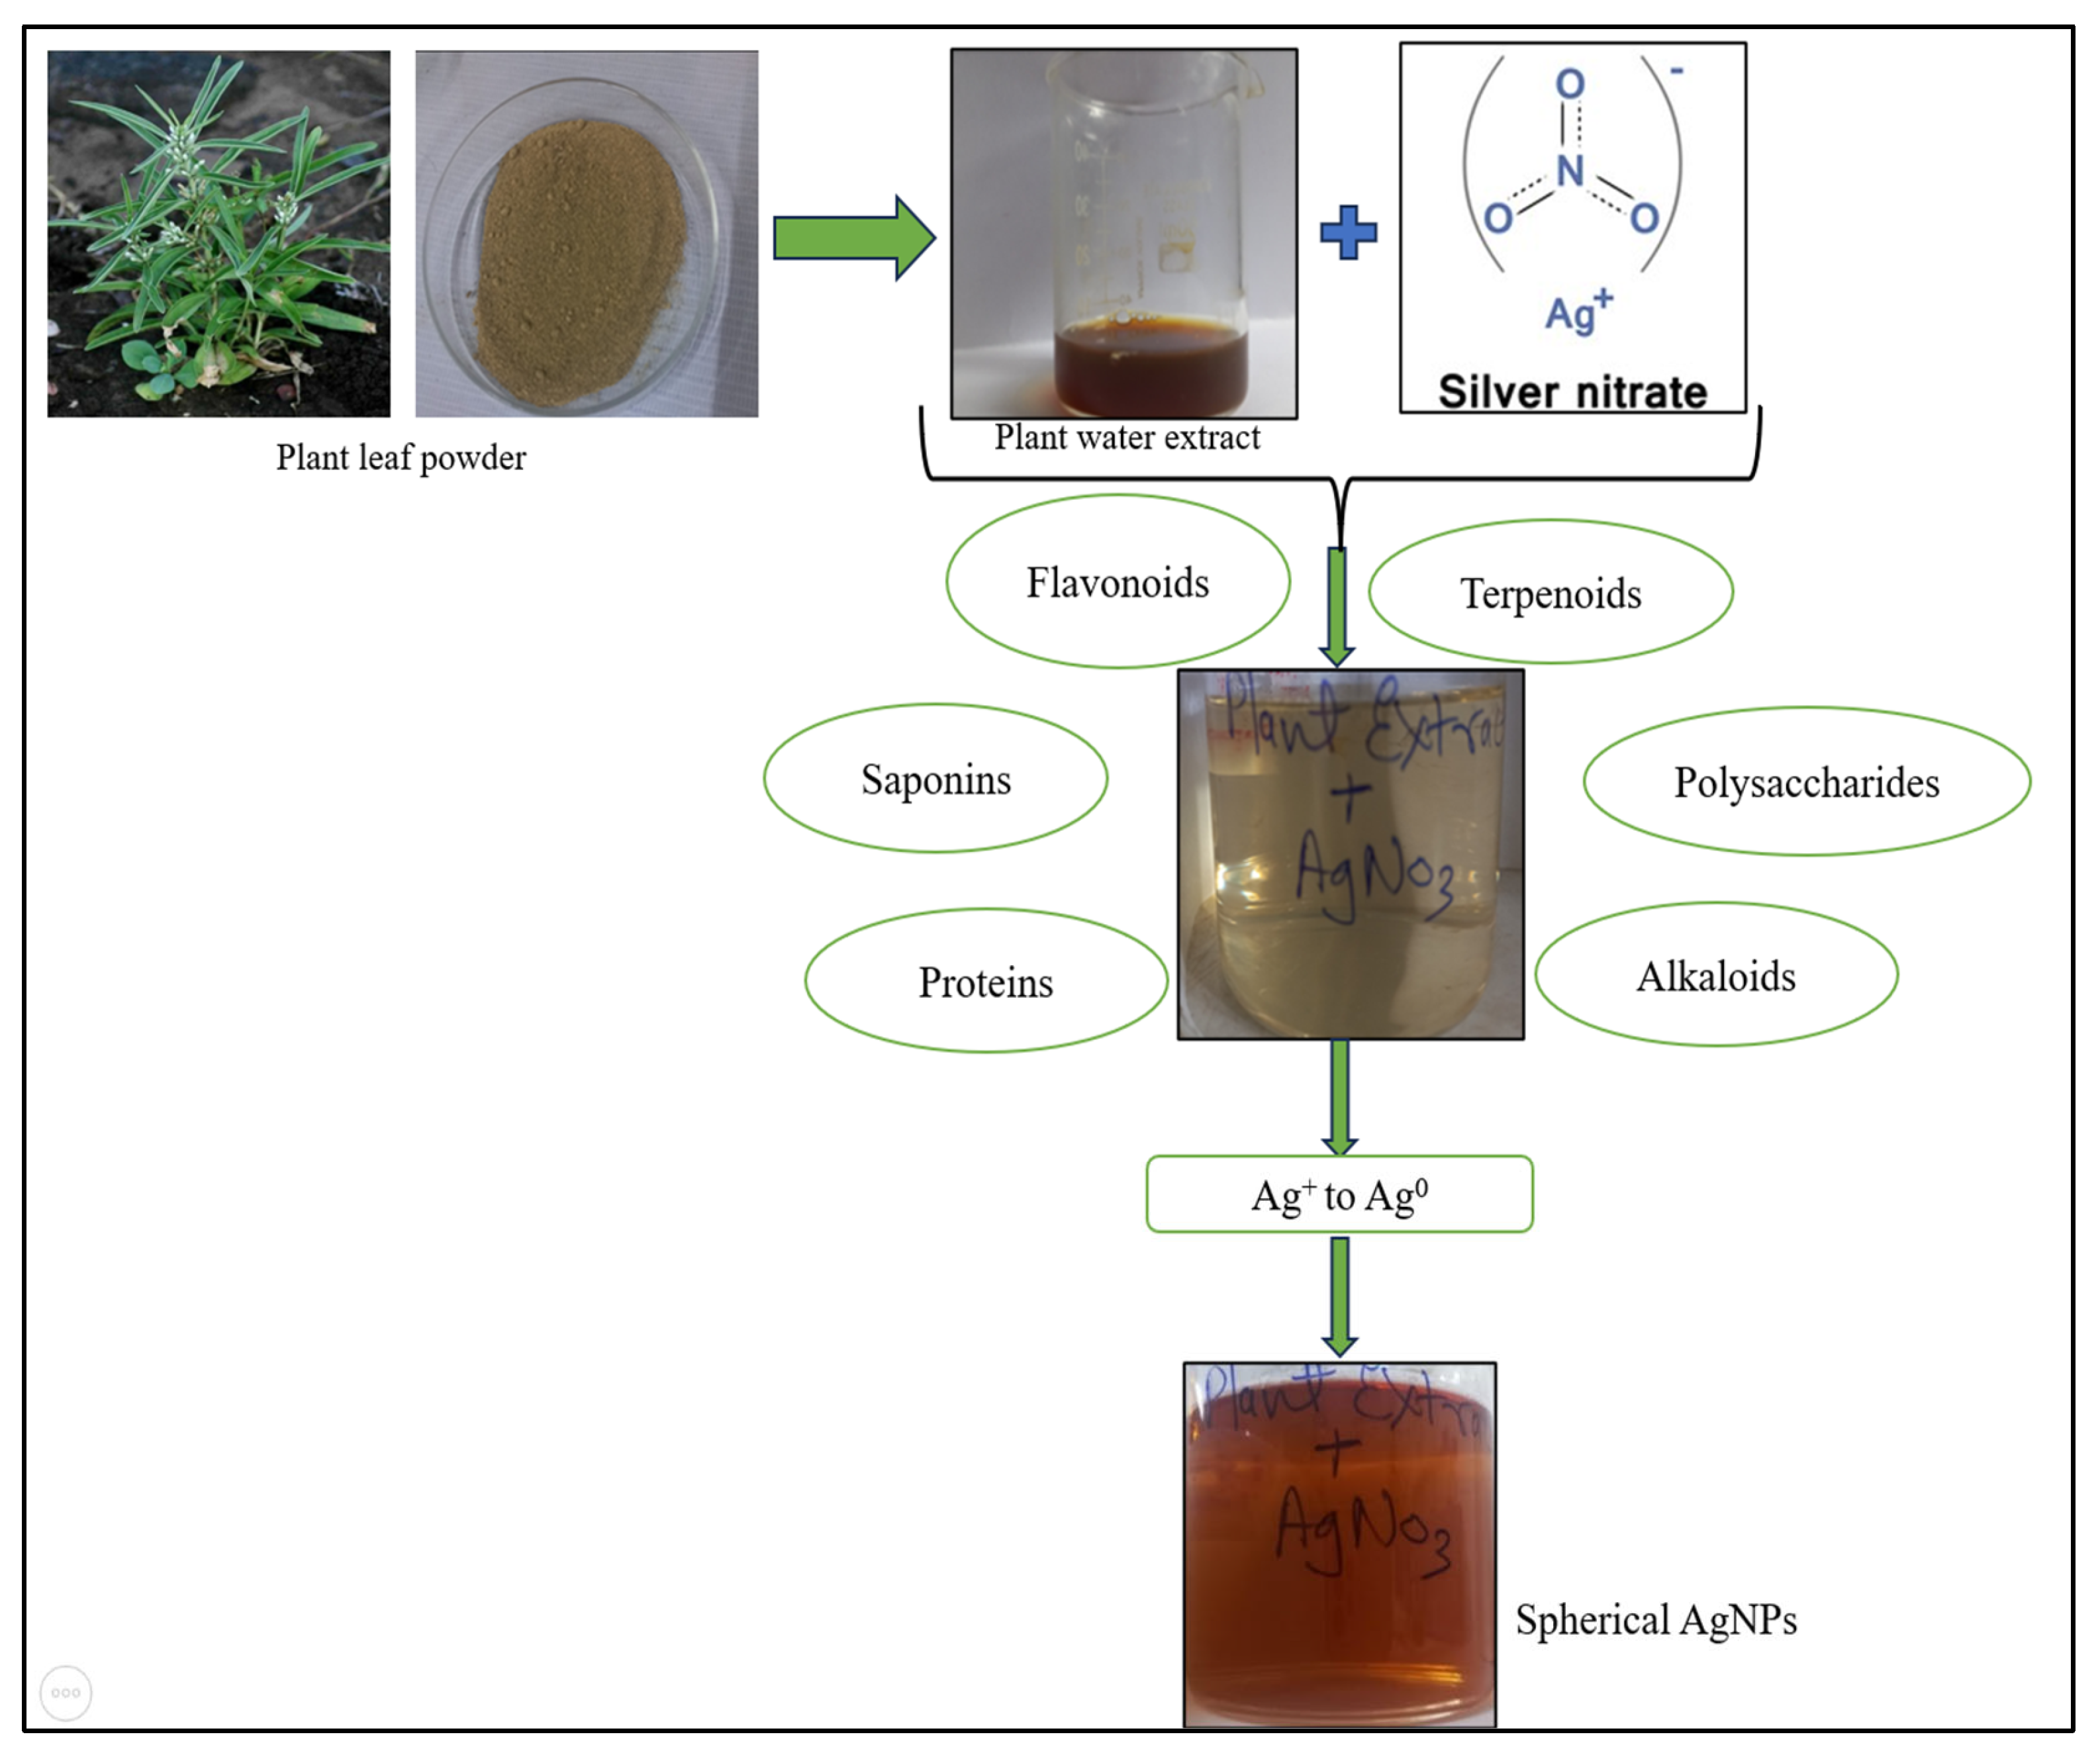
Figure 2.
Characterisation of AgNPs synthesised from plant leaf extract. A) UV-Visible spectroscopy of green AgNPs synthesised from plant extract showing a prominent peak at 445 nm. B) X-ray diffraction pattern of synthesised AgNPs. C) Size distribution of green AgNPs.
Figure 2.
Characterisation of AgNPs synthesised from plant leaf extract. A) UV-Visible spectroscopy of green AgNPs synthesised from plant extract showing a prominent peak at 445 nm. B) X-ray diffraction pattern of synthesised AgNPs. C) Size distribution of green AgNPs.
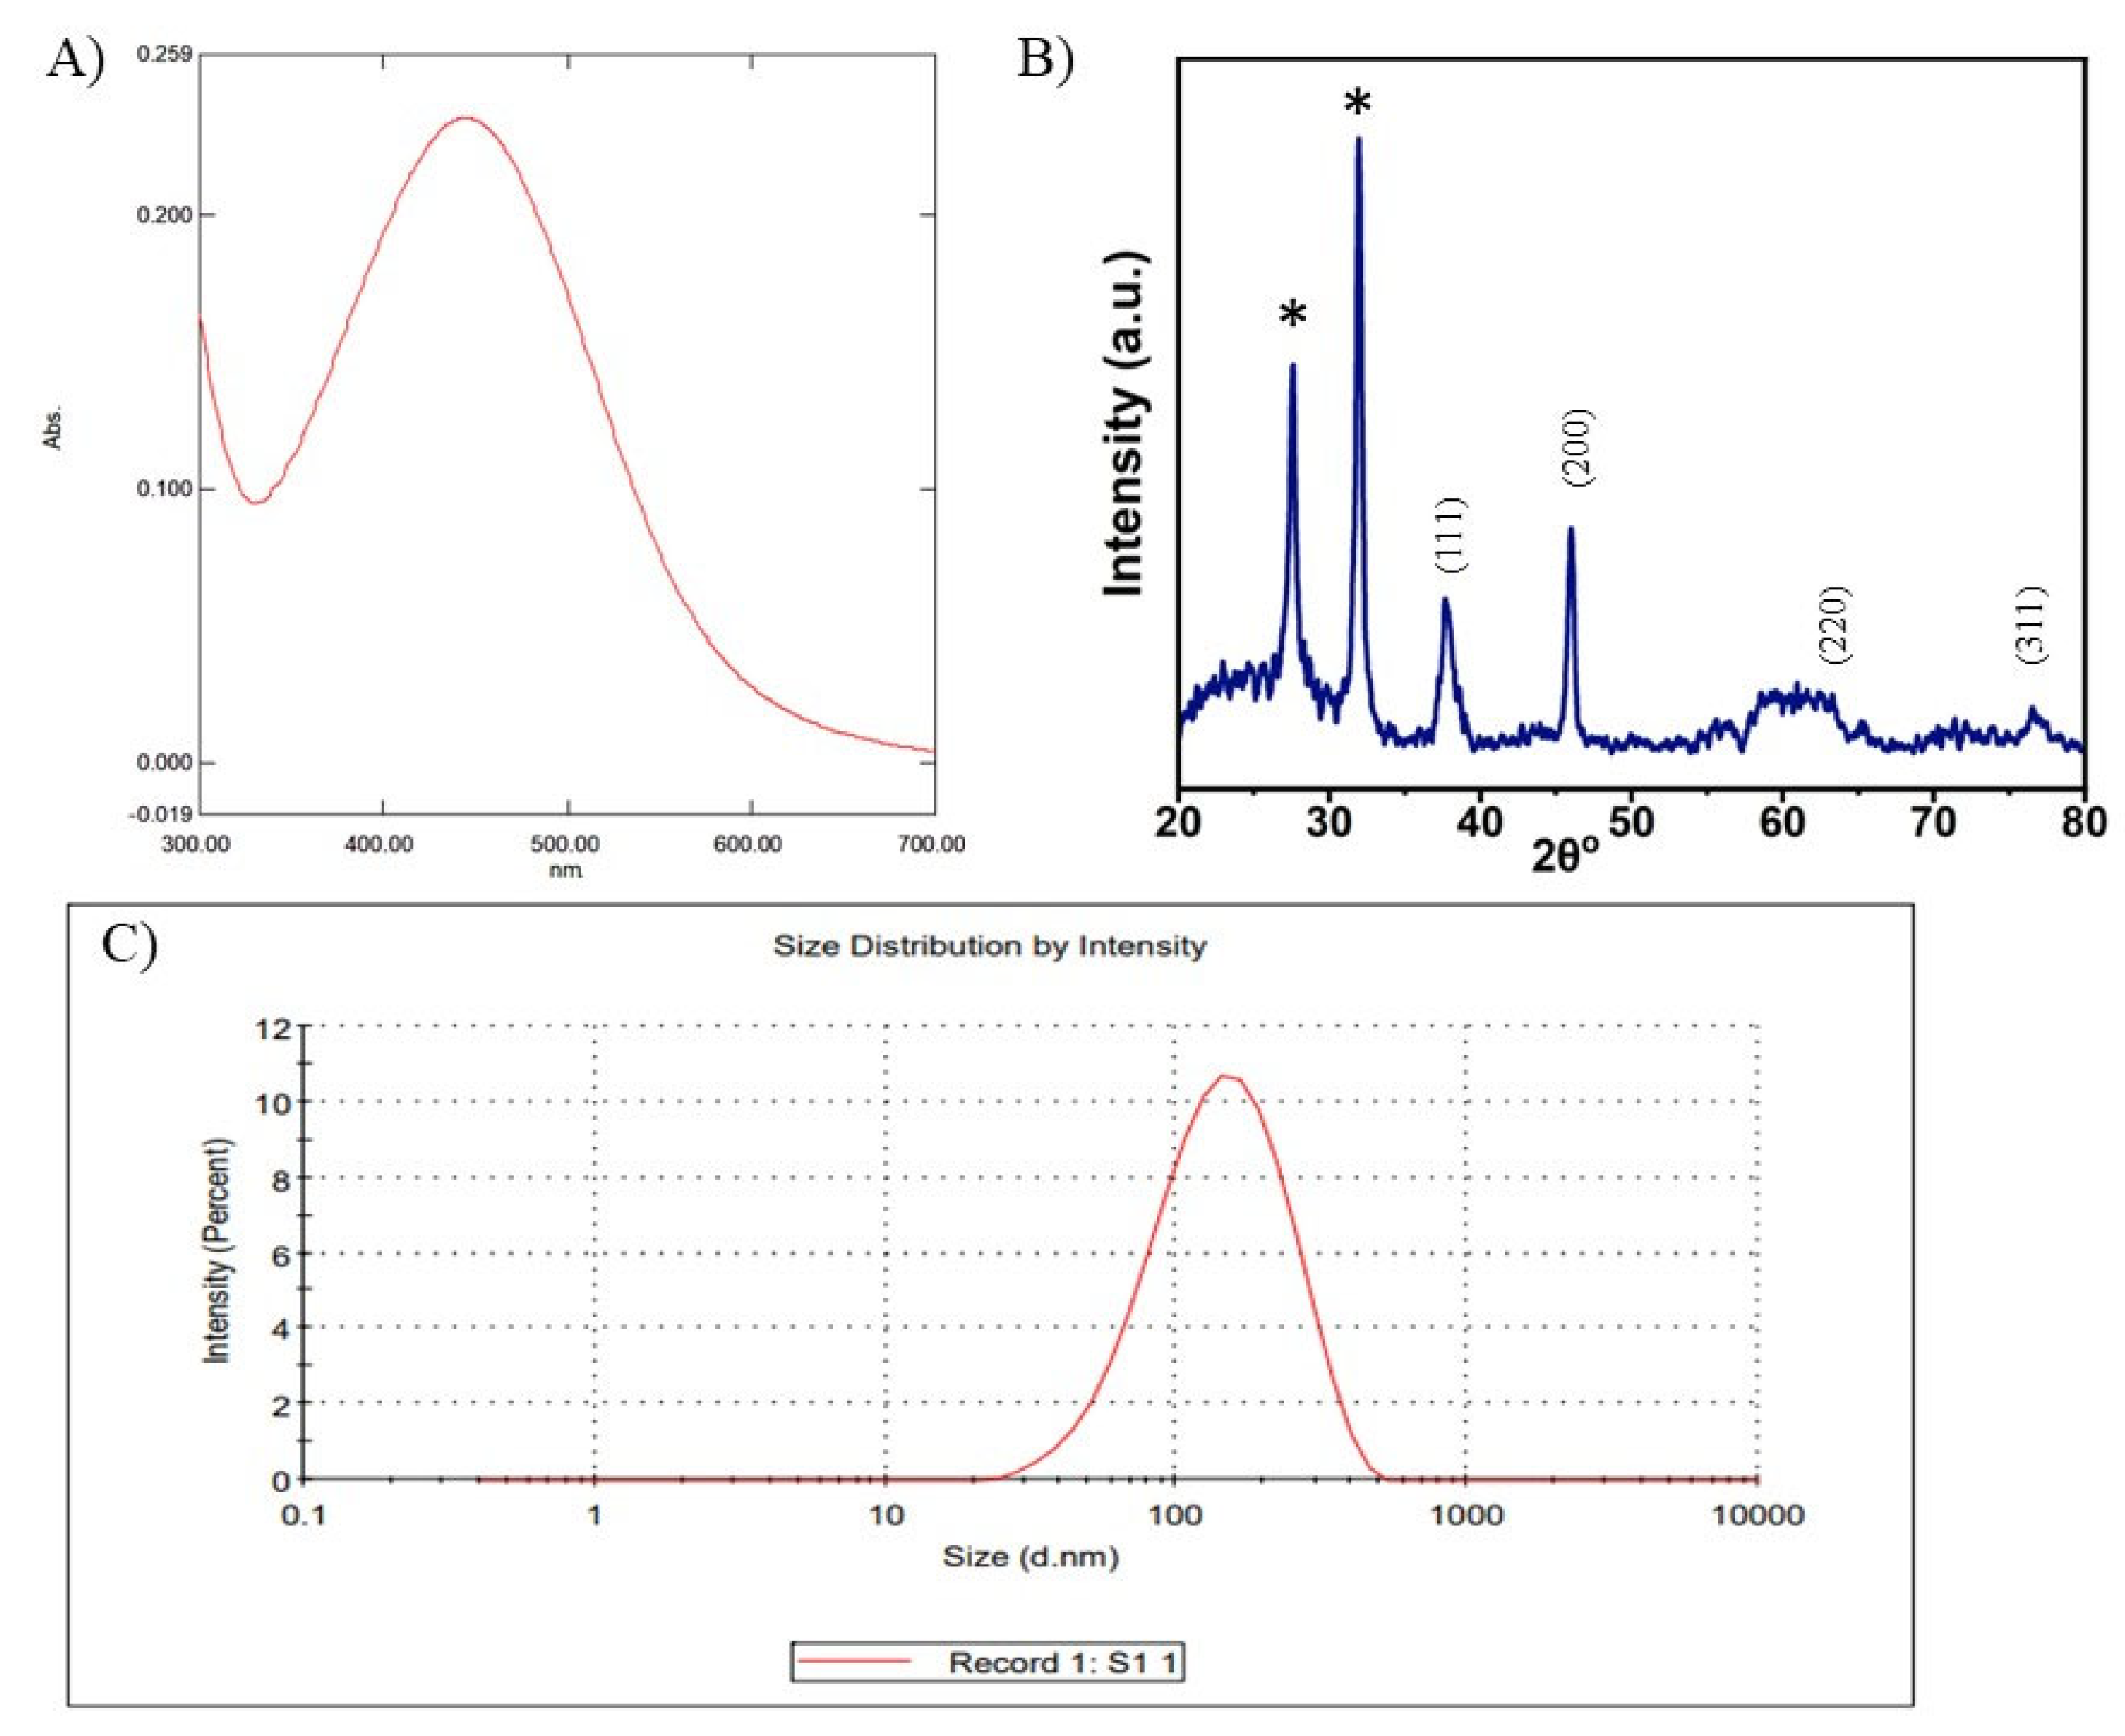
Figure 3.
Characterisation of AgNPs. A) shows the SEM image of AgNPs at 5 µm resolution. B) FE-SEM image of green AgNPs at 1.5 µm resolution. C) FTIR analysis of green AgNPs showing the peaks.
Figure 3.
Characterisation of AgNPs. A) shows the SEM image of AgNPs at 5 µm resolution. B) FE-SEM image of green AgNPs at 1.5 µm resolution. C) FTIR analysis of green AgNPs showing the peaks.
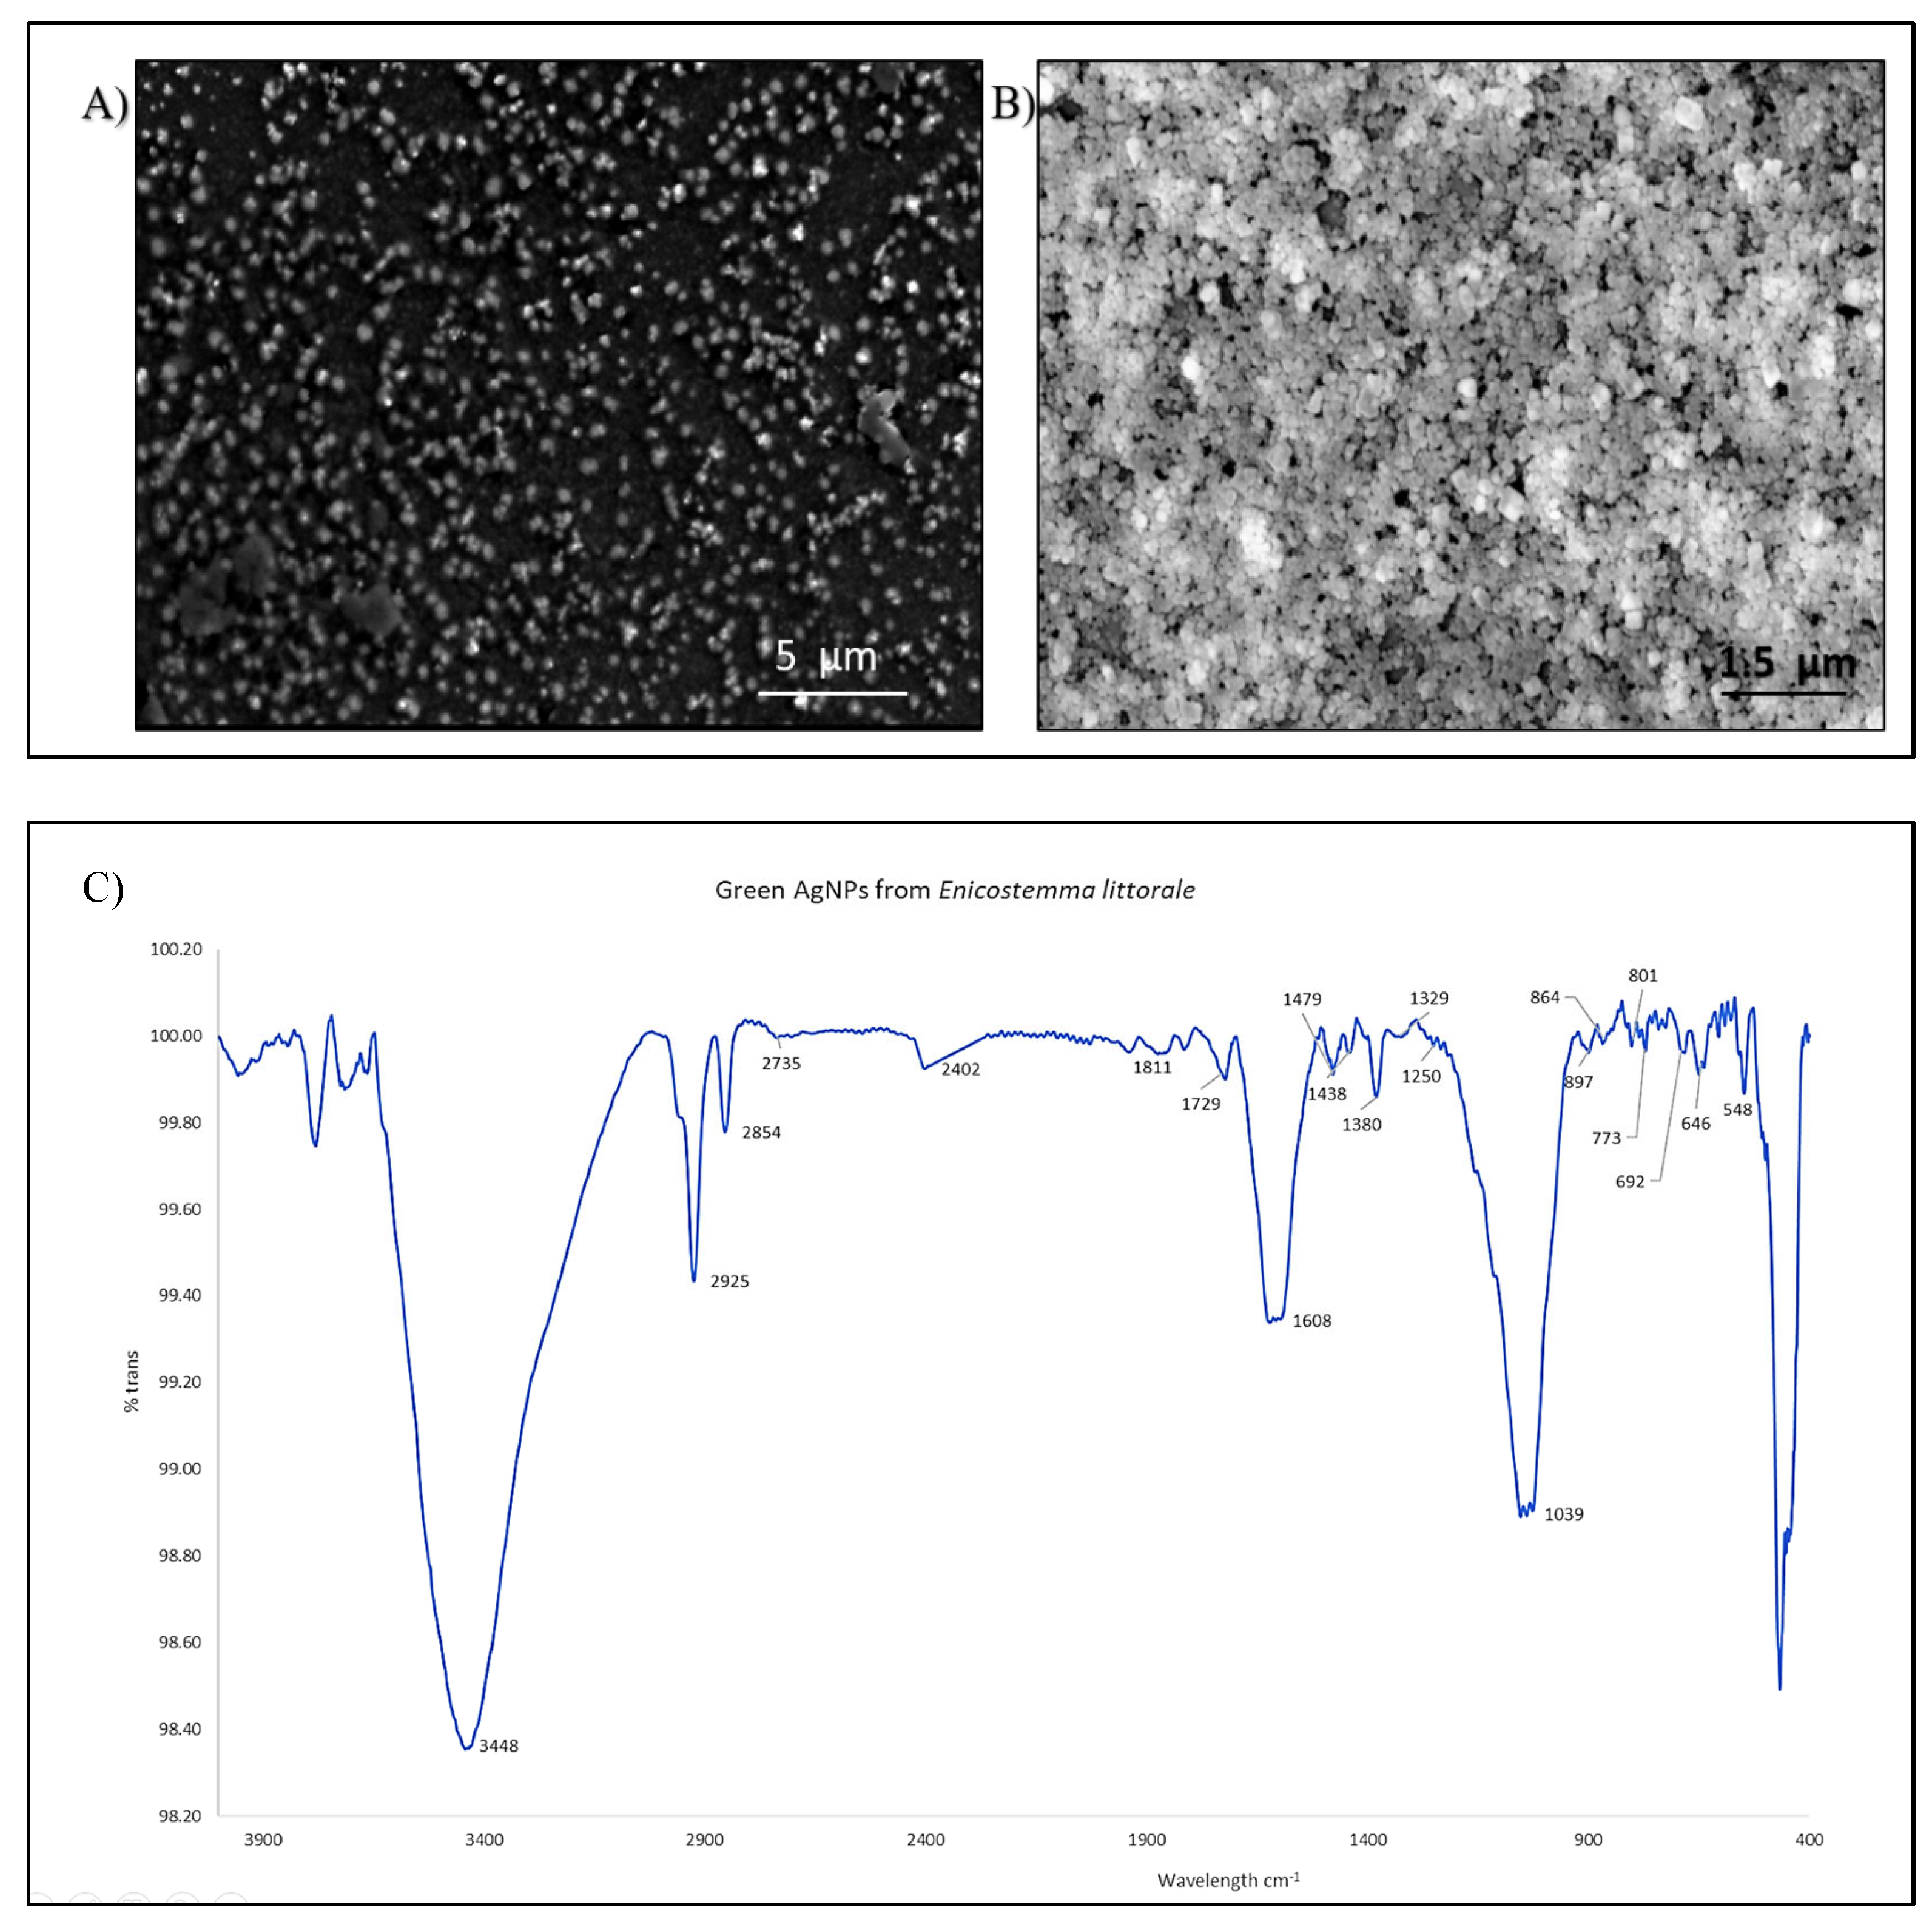
Figure 4.
Cell viability study of green AgNPs on both cell lines, HepG2 and Caco-2. Cell viability was studied for AgNPs alone and in combination with 0.2 M ethanol.
Figure 4.
Cell viability study of green AgNPs on both cell lines, HepG2 and Caco-2. Cell viability was studied for AgNPs alone and in combination with 0.2 M ethanol.
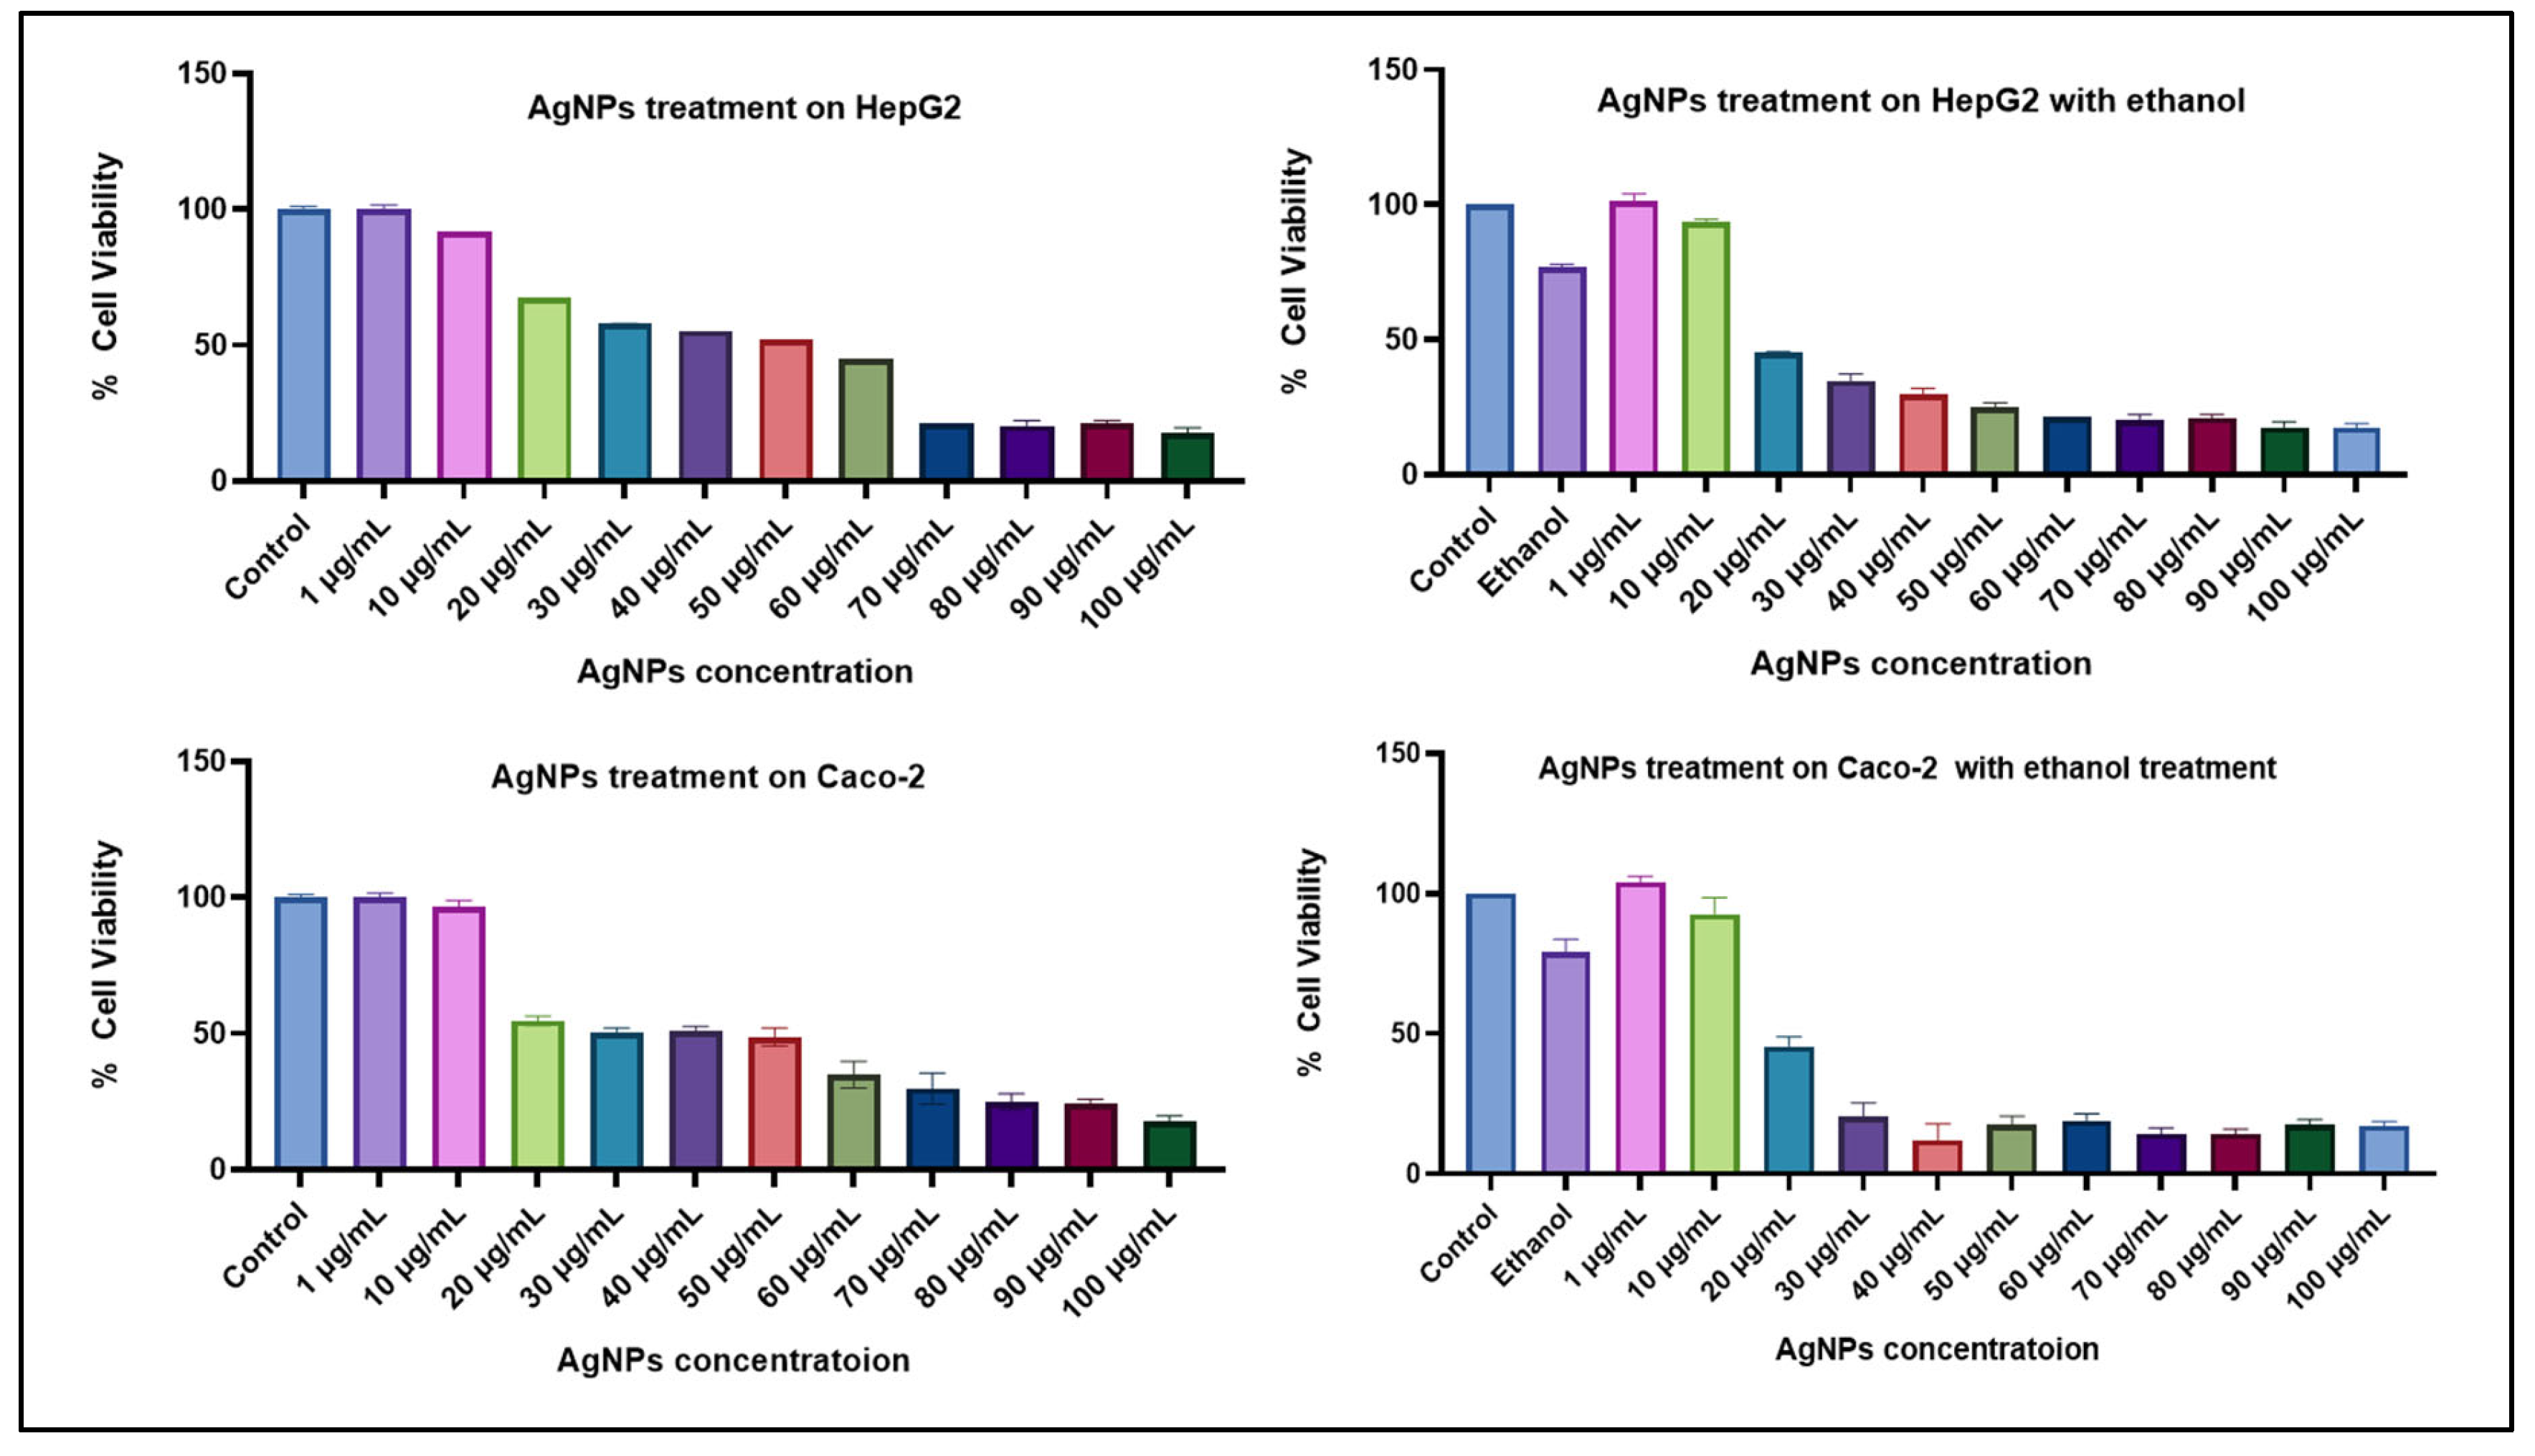
Figure 5.
AO/EtBr staining of HepG2 and Caco-2 cells. In both cell types, ethanol-treated cells showed more damage, whereas in the treatment, less damage was observed. The image was taken with a fluorescent microscope at a resolution of 100 µm. The experiment was carried out in triplicate.
Figure 5.
AO/EtBr staining of HepG2 and Caco-2 cells. In both cell types, ethanol-treated cells showed more damage, whereas in the treatment, less damage was observed. The image was taken with a fluorescent microscope at a resolution of 100 µm. The experiment was carried out in triplicate.
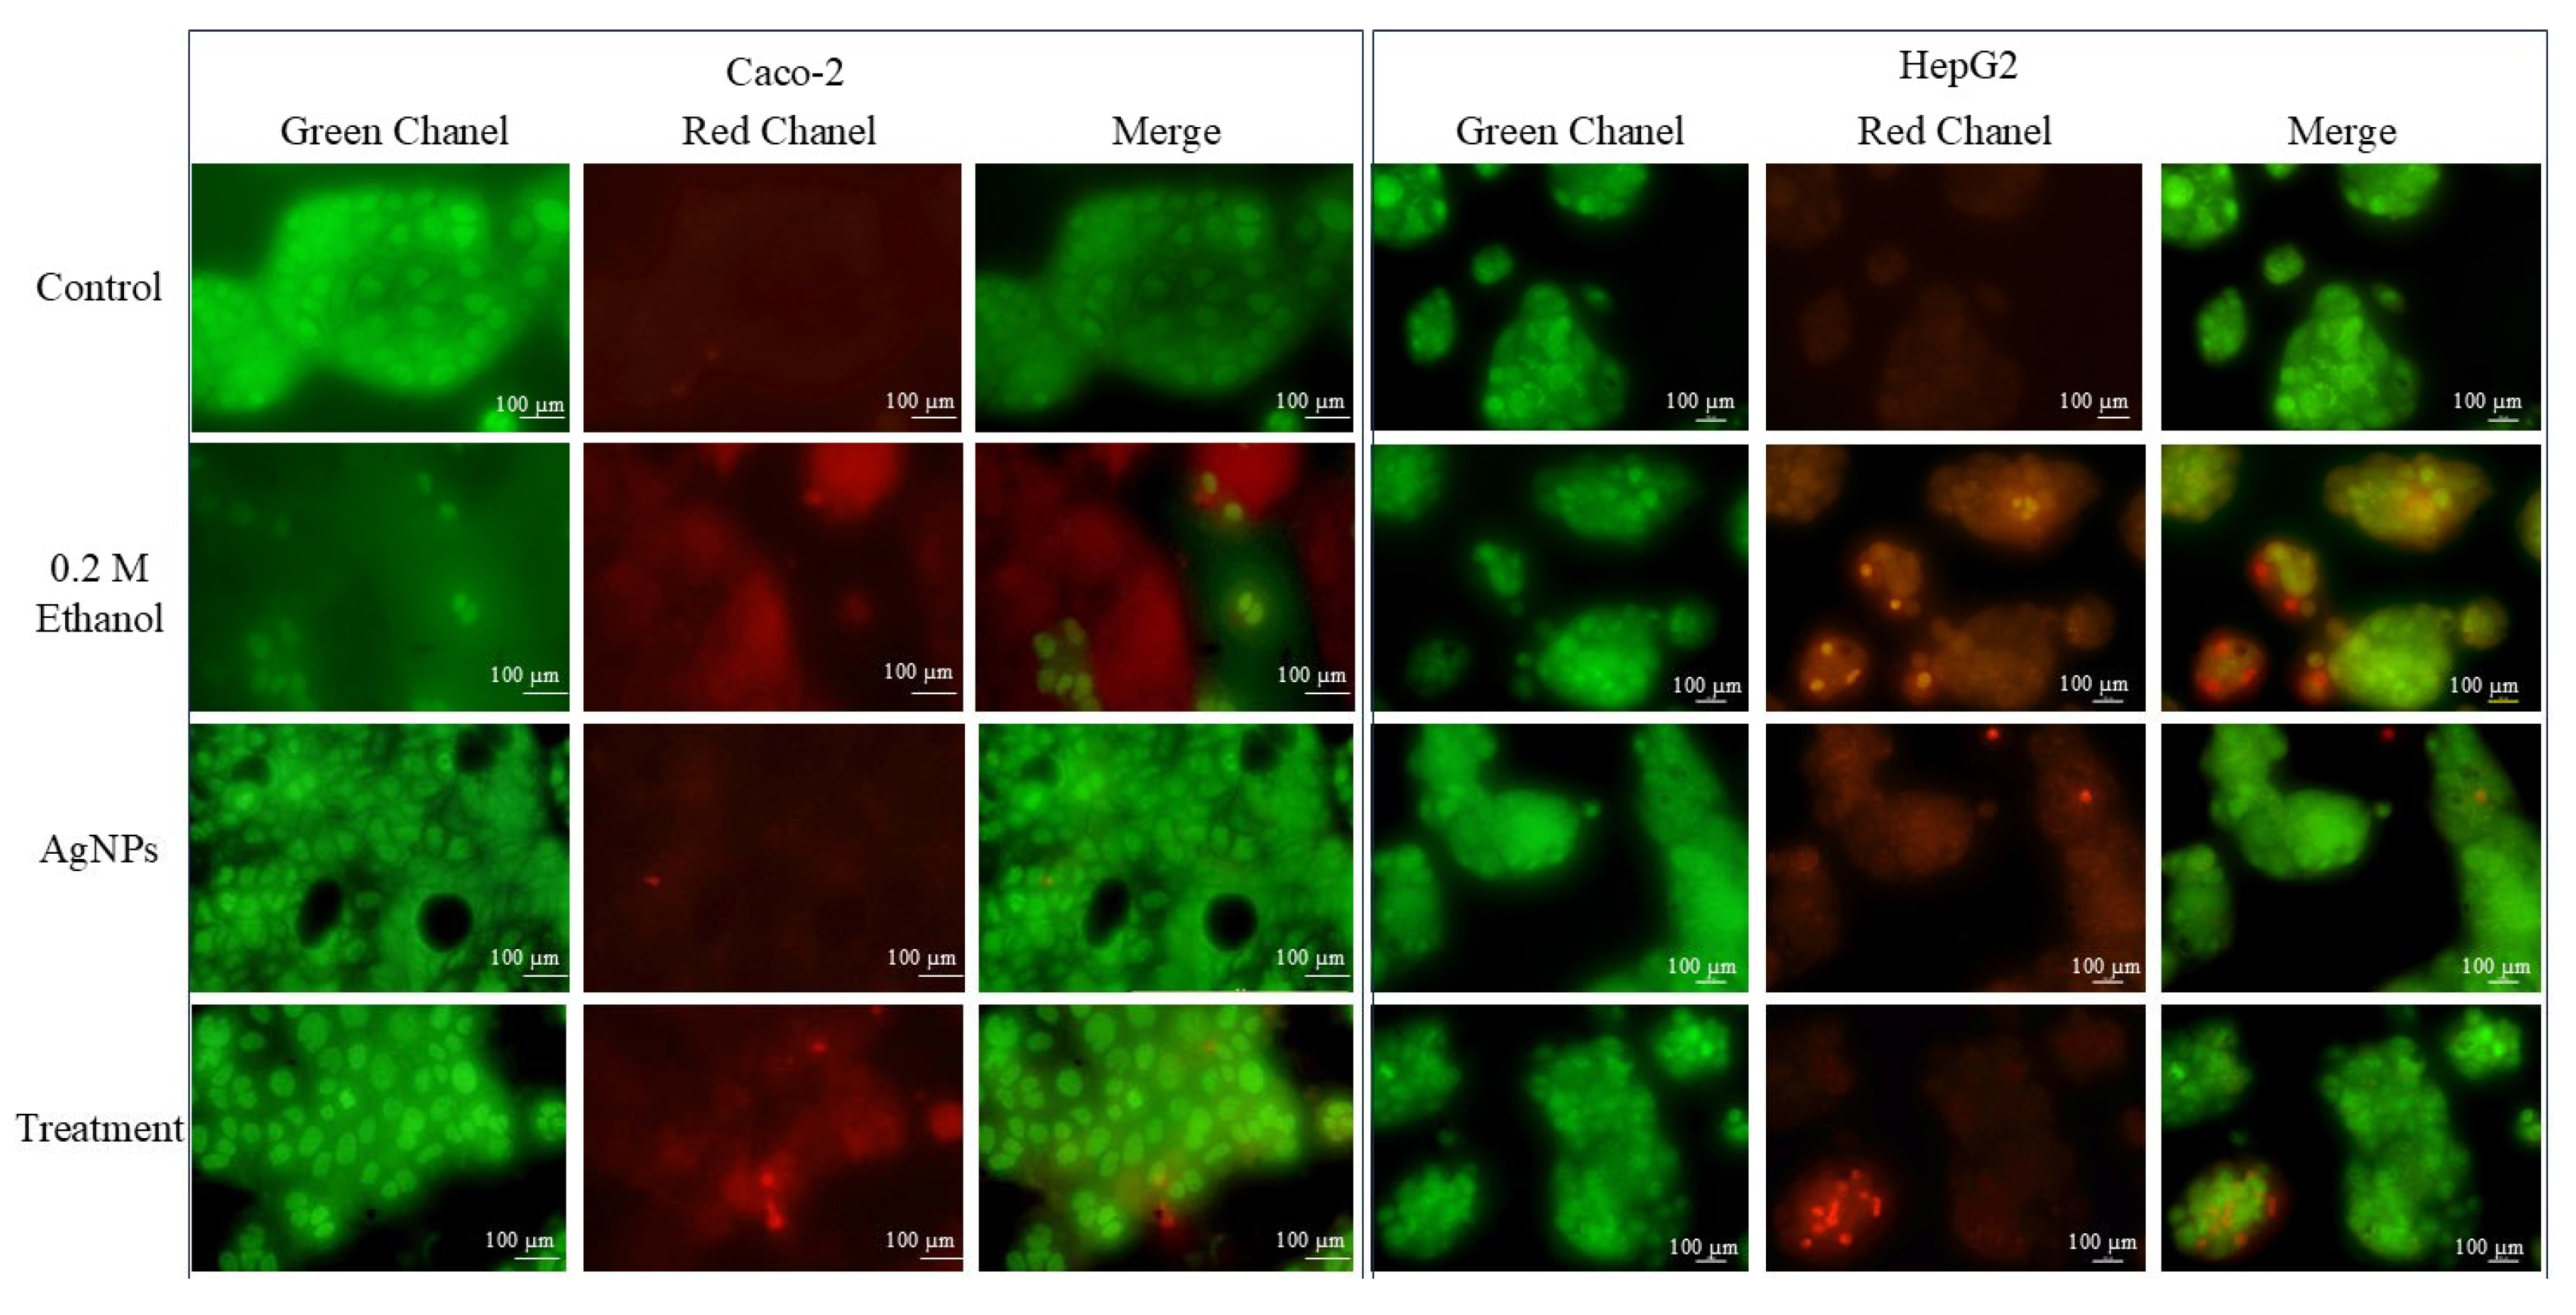
Figure 6.
DAPI staining shows that ethanol exposure caused nuclear damage in HepG2 and Caco-2 cells, while AgNPs preserved nuclear integrity. Co-treatment with AgNPs reduced ethanol-induced damage, as reflected by restored nuclear morphology and decreased DAPI fluorescence intensity. Statistical analysis: one-way ANOVA with Dunnett's post hoc test; compared to ethanol group where, **p < 0.01, ***p < 0.001.
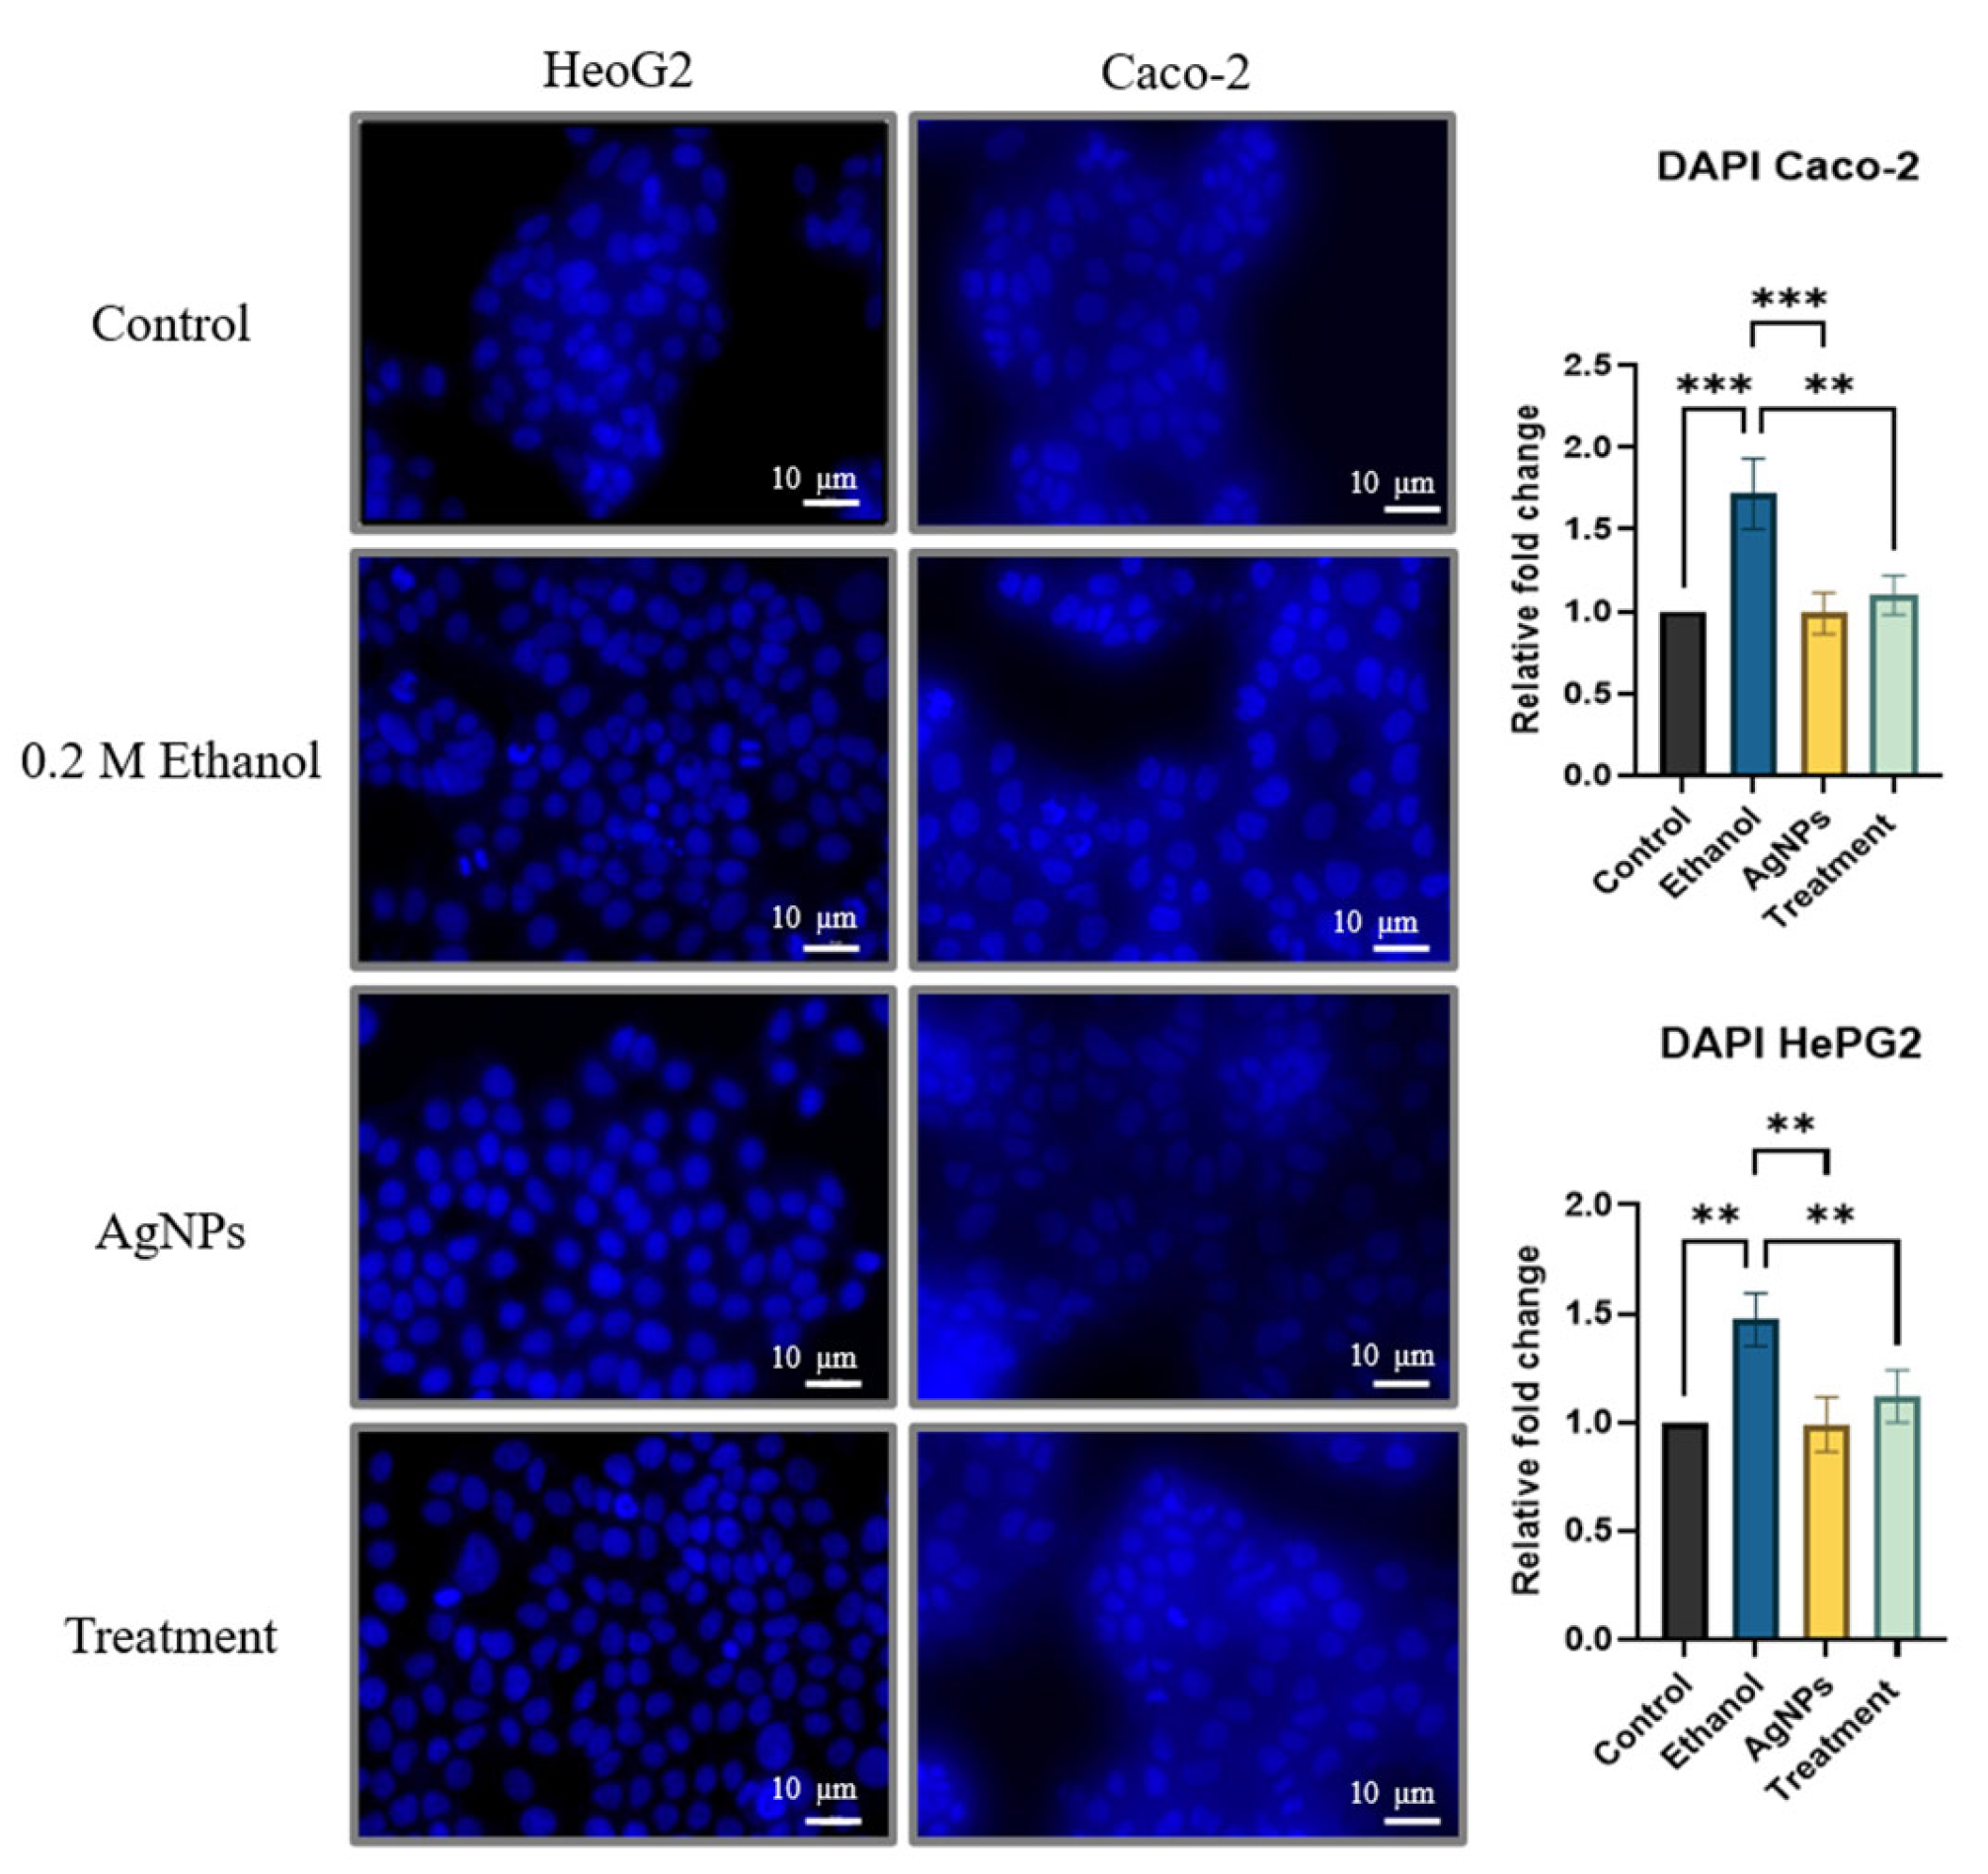
Figure 7.
Quantitative ROS estimation showing a higher relative ratio in ethanol-treated cells, while the ratio decreased in the treatment group. Statistical analysis: one-way ANOVA with Dunnett's post hoc test; compared to the ethanol group, where **p < 0.01, *p < 0.05.
Figure 7.
Quantitative ROS estimation showing a higher relative ratio in ethanol-treated cells, while the ratio decreased in the treatment group. Statistical analysis: one-way ANOVA with Dunnett's post hoc test; compared to the ethanol group, where **p < 0.01, *p < 0.05.
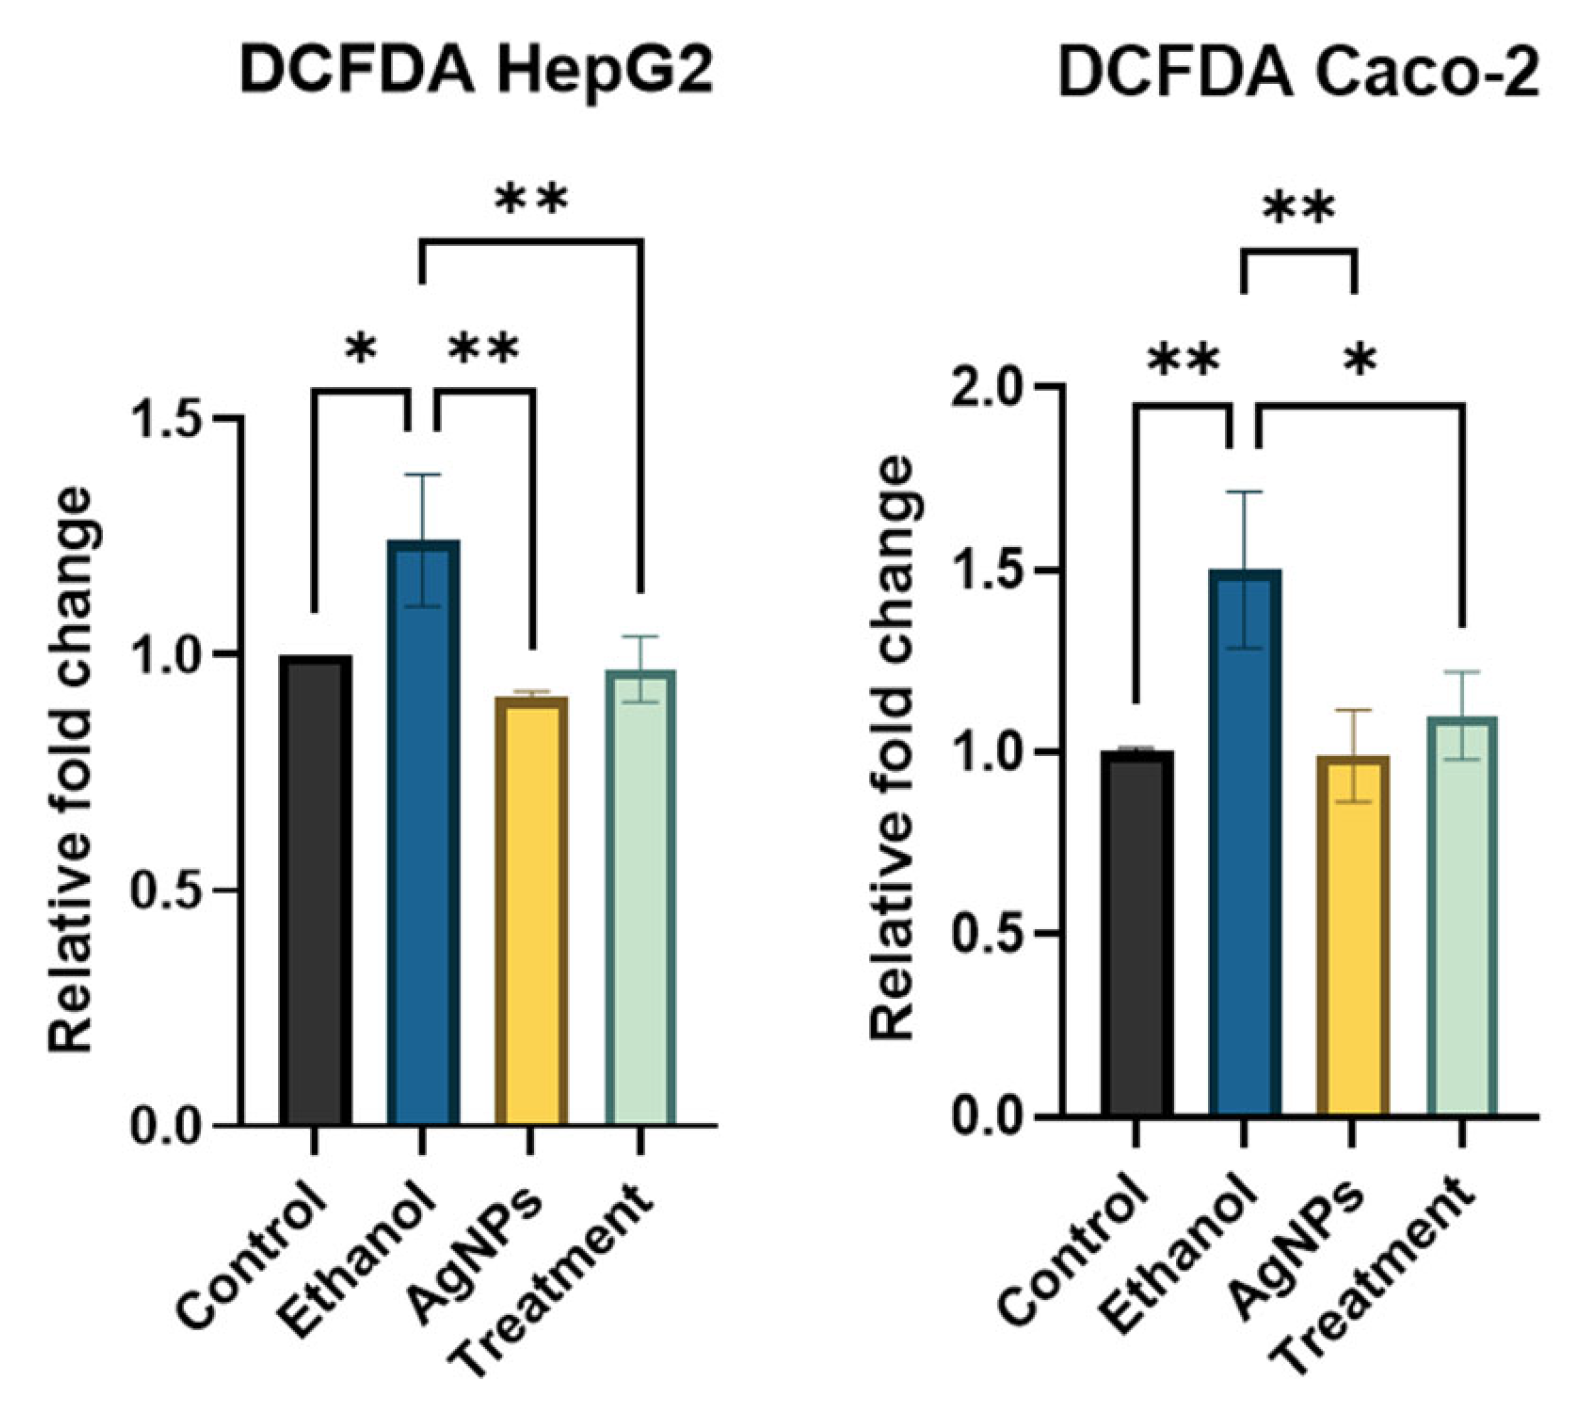
Figure 8.
ORO staining to assess intracellular lipid accumulation in HepG2 and Caco-2 cells. Cells were treated with 0.2 M ethanol, AgNPs (1 µg/mL), or a combination of both (Treatment), and compared to untreated controls. Ethanol-treated cells exhibited significant lipid accumulation, evident as dense, red-stained droplets in the cytoplasm. AgNPs alone did not alter lipid levels compared to control, while co-treatment with AgNPs reduced ethanol-induced lipid accumulation. Statistical analysis: data are presented as mean ± SD, one-way ANOVA with Dunnett's post hoc test; compared to the ethanol group, where *p <0.05, **p < 0.01, *** p < 0.001.
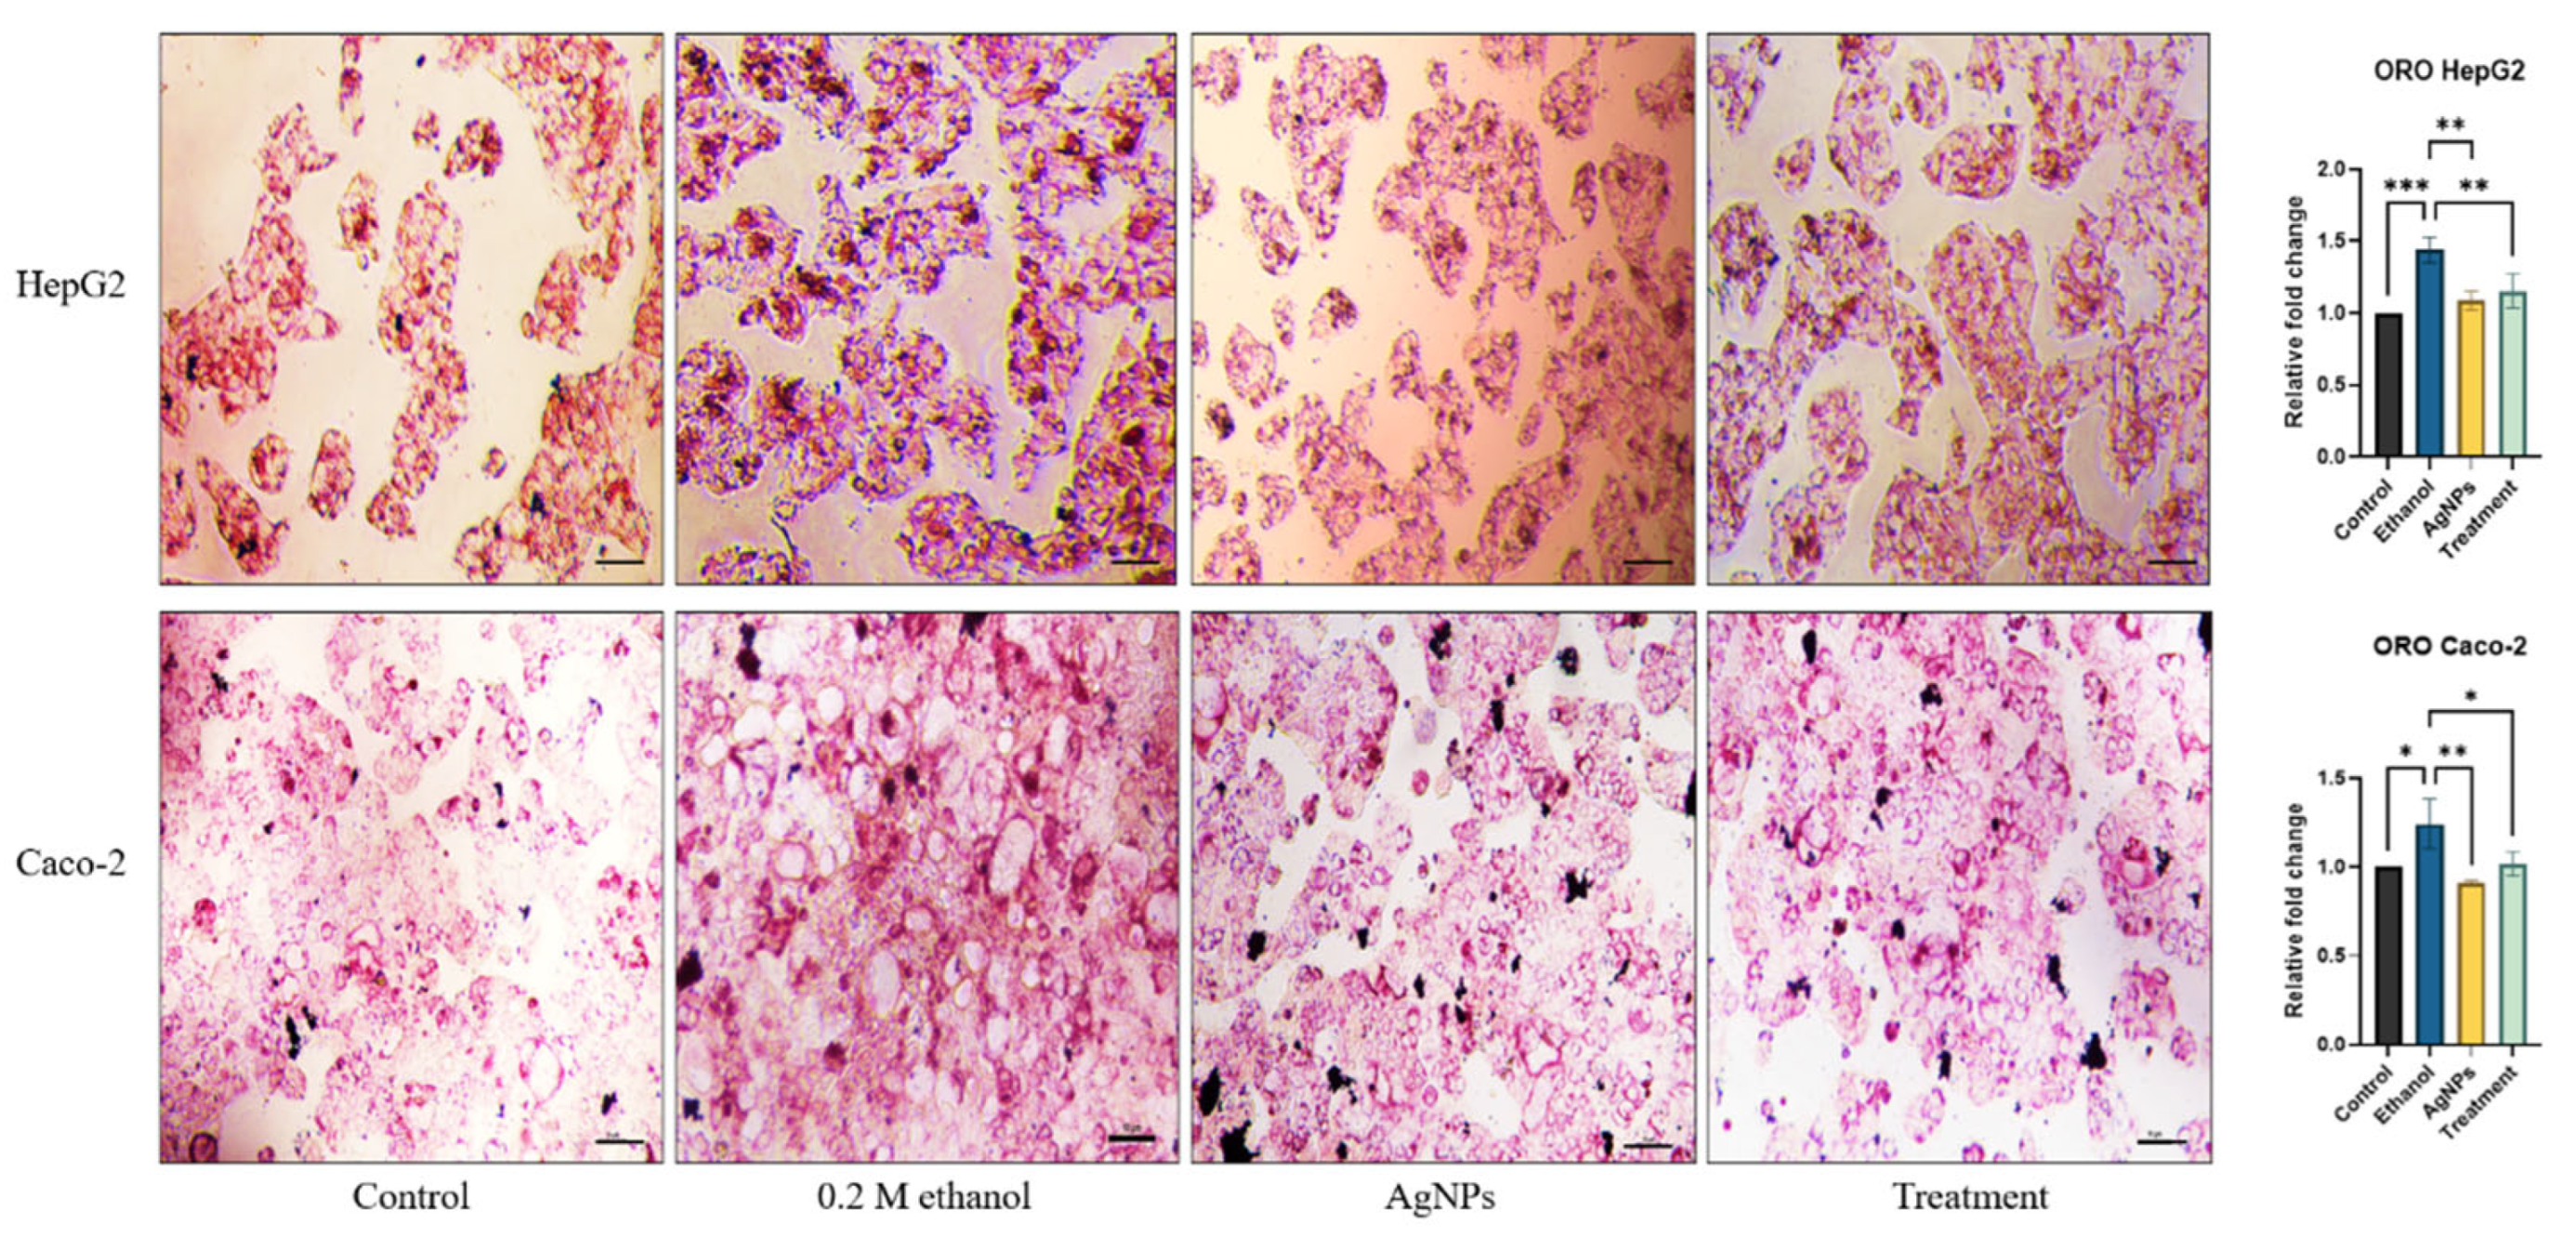
Figure 9.
Gene expression analysis in HepG2 and Caco-2 cells with and without ethanol exposure. (A) HepG2 cells: relative mRNA expression of CYP2E1, SREBP2, pro-inflammatory (e.g., TNF-α, IL-6), anti-inflammatory (e.g., IL-10), and antioxidant (Nrf2, HO-1) genes. (B) Caco-2 cells: gene expression of tight junction markers (ZO-1, claudin) and pro-inflammatory cytokines. Data are presented as mean ± SD (n = 3); statistical analysis was performed using one-way ANOVA with Dunnett's post hoc test. Comparisons were made against the ethanol-treated group, where *p < 0.05, **p < 0.01, ***p < 0.001, and ****p < 0.0001.
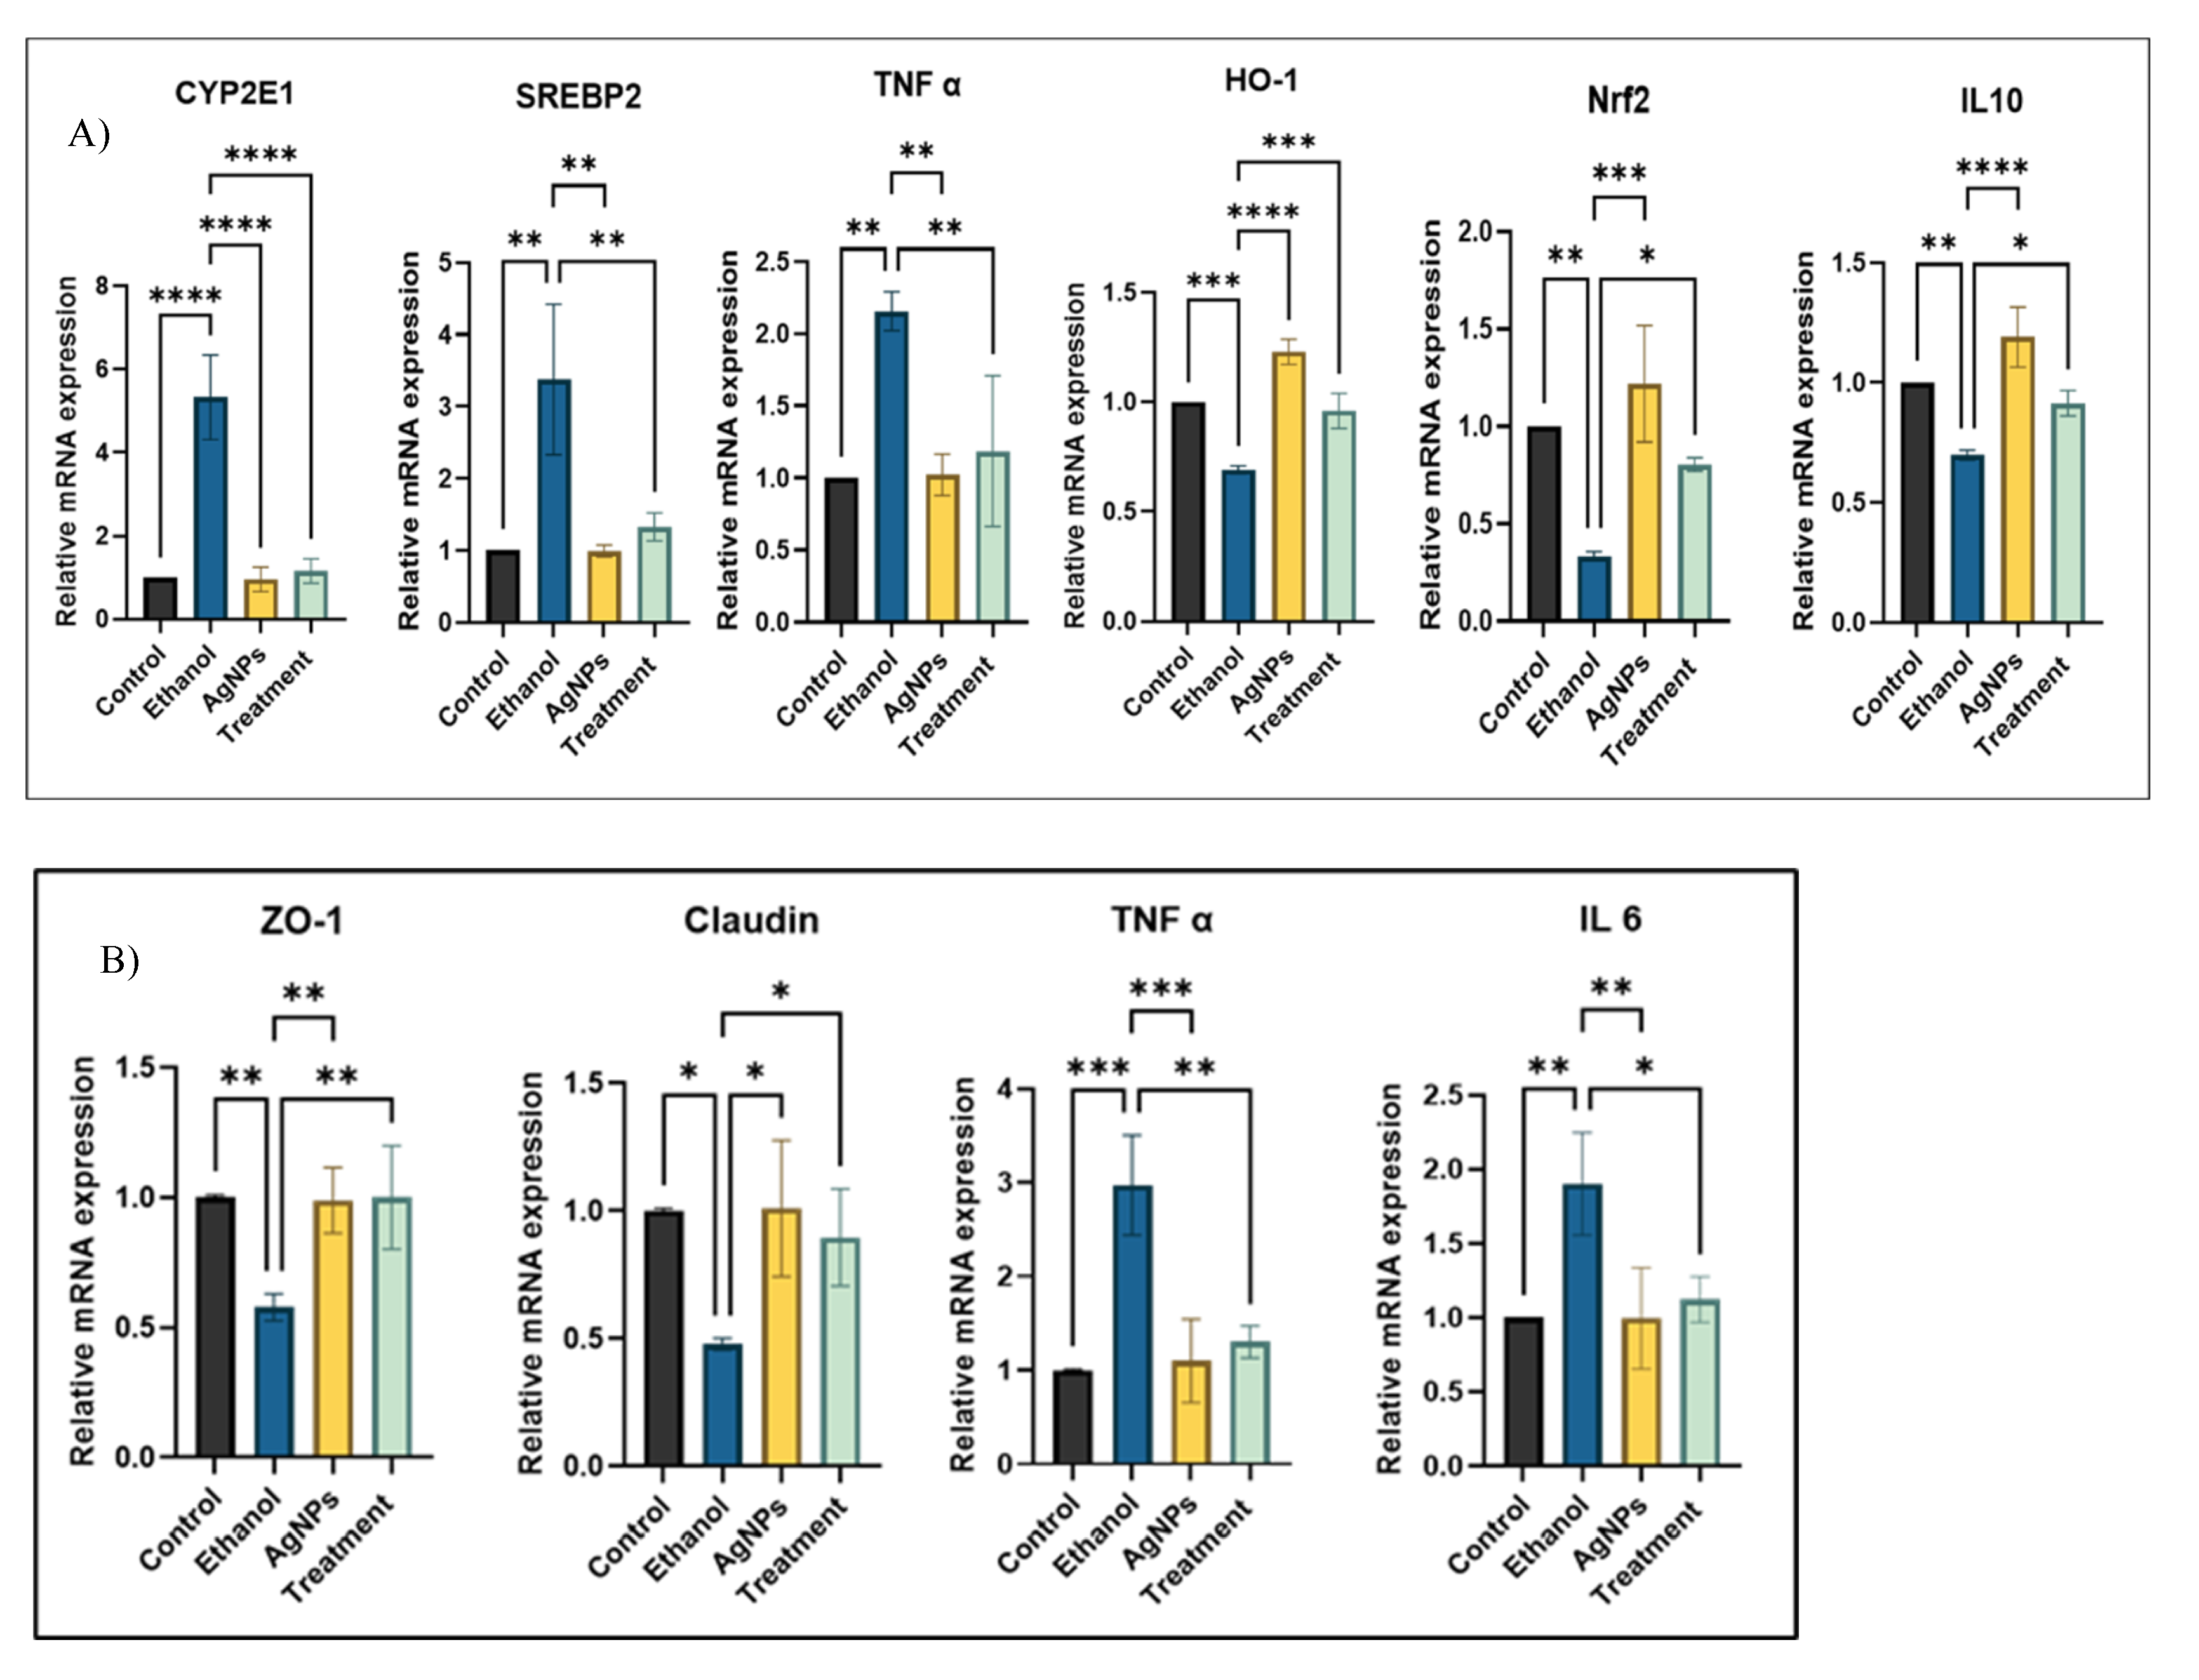
Figure 10.
The liver and colon are interconnected via the portal vein, enabling ethanol-induced pro-inflammatory cytokines and toxins from the colon to reach the liver. Ethanol also directly increases hepatic ROS, inflammation, and disrupts lipid metabolism. Green-synthesized AgNPs help reverse both primary liver injury and secondary gut-derived inflammation.
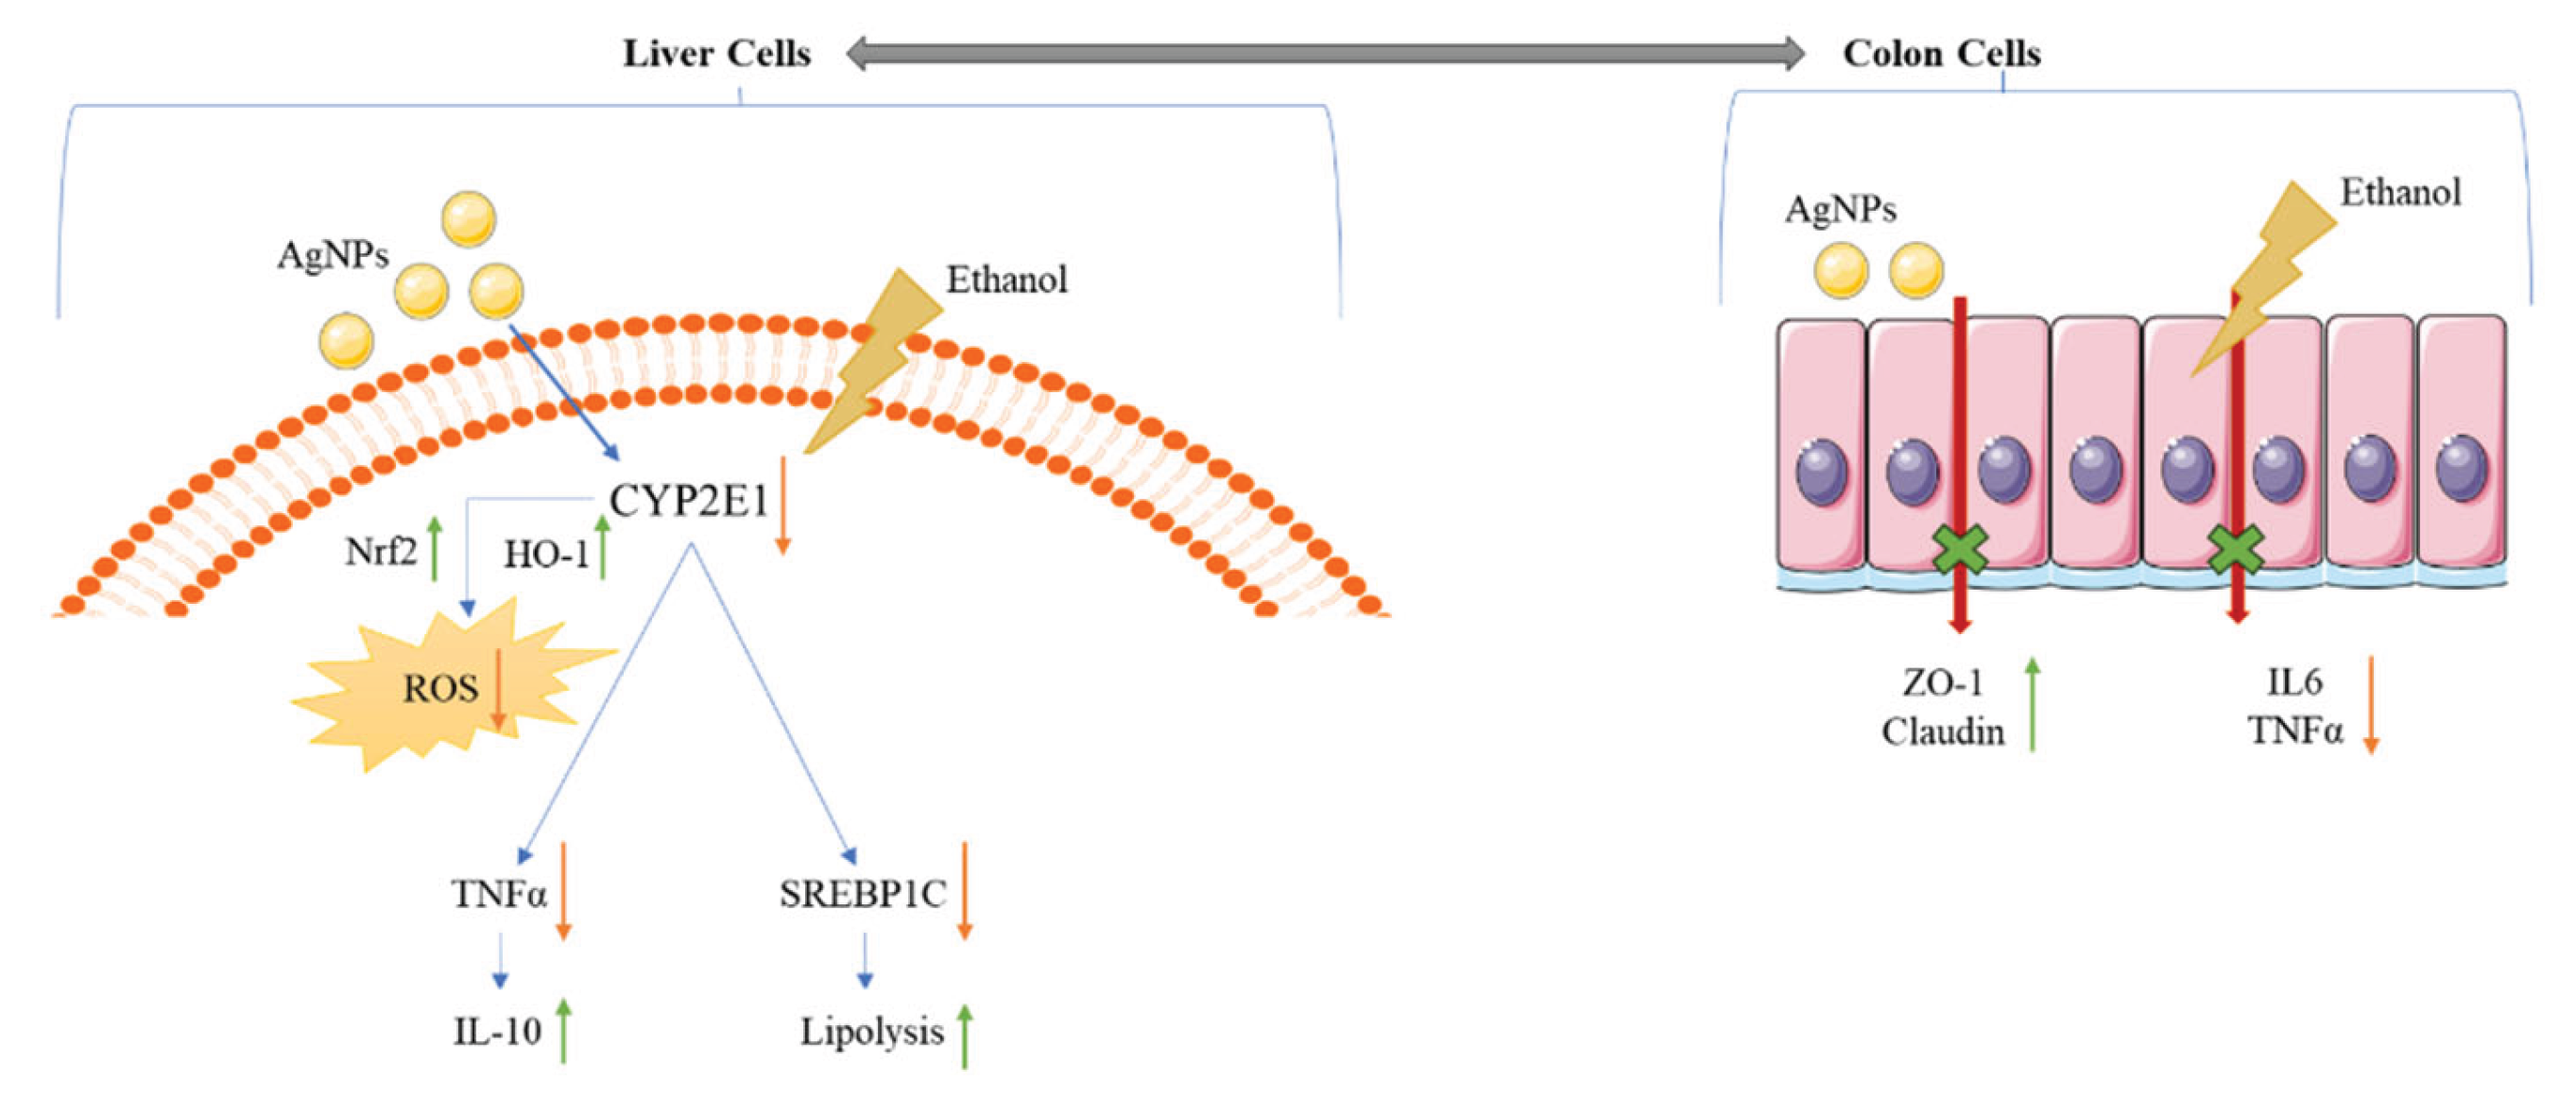

Table 1.
Human primer sequence list.
| Gene name | Forward primer (5’-3’) | Reverse Primer (5’-3’) |
|---|---|---|
| 18s | GATGGTAGTCGCCGTGCC | GCCTGCTGCCTTCTTGG |
| TNF-α | CTCTTCTGCCTGCTGCACTTG | ATGGGCTACAGCTTGTCACTC |
| ZO-1 | TATTATGGCACATCAGCACG | TGGGCAAACAGACCAAGC |
| Claudin-1 | CCATCAATGCCAGGTACGAAT | TTGGTGTTGGGTAAGAGGTTGTT |
| IL6 | CATCCTCGACGGCATCTCAG | GCAGAAGAGAGCCAACCAAC |
| IL10 | ACTGCTAACCGACTCCTTA | TAAGGAGTCGGTTAGCAGT |
| NrF2 | GAGAGCCCAGTCTTCATTGC | TGCTCAATGTCCTGTTGCAT |
| CYP2E1 | AACTGTCCCCGGGACCTC | GCGCTCTGCACTGTGCTTT |
| SREBP2 | CTCCATTGACTCTGAGCCAGGA | GAATCCGTGAGCGGTCTACCAT |
Disclaimer/Publisher’s Note: The statements, opinions and data contained in all publications are solely those of the individual author(s) and contributor(s) and not of MDPI and/or the editor(s). MDPI and/or the editor(s) disclaim responsibility for any injury to people or property resulting from any ideas, methods, instructions or products referred to in the content. |
© 2025 by the authors. Licensee MDPI, Basel, Switzerland. This article is an open access article distributed under the terms and conditions of the Creative Commons Attribution (CC BY) license (http://creativecommons.org/licenses/by/4.0/).
Copyright: This open access article is published under a Creative Commons CC BY 4.0 license, which permit the free download, distribution, and reuse, provided that the author and preprint are cited in any reuse.


