Submitted:
07 June 2025
Posted:
09 June 2025
You are already at the latest version
Abstract
The influence of carbon nanotubes sponges (CNT–sponges) content at 0.1 wt.%, 0.3 wt.% and 0.5 wt.% on rheological properties of three series of polymeric solutions of poly (styrene-co-acrylonitrile) P(S:AN) was evaluated. For that, amplitude and frequency sweeps were made in order to determine the storage (G’) and loss (G’’) moduli, loss factor (tan δ), structural changes and homogeneity of polymeric composite solutions as function of polymeric content P(S:AN) 0:100, 20:80, 40:60 and 50:50 wt%:wt%. For polymeric composite solutions (PCS) of pristine polyacrylonitrile, the rheological measurements show a Newtonian behavior at low shear rates and non-Newtonian behavior at higher values, meanwhile, all copolymeric PCS perform a non-Newtonian (shear thinning) behavior with a viscosity range of 0.8 < η /Pa·s < 20. The loss factor indicates a liquid-like behavior for solutions with 0.1 wt.% and 0.3 wt.% of CNT–sponges content, meanwhile a solid-like behavior was observed for 0.5 wt.% concentration. Finally, the polymeric composite solutions were processed in an electrospinning system to obtain fibers and were analyzed by SEM technique, CNT-sponges agglomerations were found into fibers with 0.5 wt.% content. The aim of this rheological analysis was carried out to predict the viscoelastic parameters and the suitability of solutions to electrospun process.
Keywords:
polymer composite solutions (PCS)
; rheology analysis
; CNT-sponges
; electrospinning
1. Introduction
Composites solutions [1] are materials made up of two or more compounds chemically and/or physically linked through compounding process, showing distinct traits such as high durability, hardness, toughness, fluidity, viscosity, flexibility, environmental degradation-resistance as well as low density, corrosivity and electrical conductivity, among others [2,3,4,5,6,7]. These materials keeps different proportions and separated by diverse interfaces [2,6,7]. This means, they are not soluble in each other and maintain their initial characteristics, forming a synergy of final properties [4]. The main constituents of composite materials are the matrix structure (continuous phase) that can be classified according to their metallic, ceramic or polymeric nature [6,8] and, the reinforcement material in the form of fillers including particles, flakes, laminas or fibers which are scattered, embedded and surrounding by the matrix phase, thus becoming a mostly complex system [2,3,4,6]. Thereby, their final physico-chemical and rheological features of these reinforced composites are related to the concentration, distribution, homogeneity, orientation, size and shape of reinforcements [6]. In particular, a polymer-matrix composites (PMCs) can be modified by dispersing nanofillers such as metals, nanoparticles, nanofibers, nanoclays, nanocrystals, nanorods and/or nanotubes in the polymeric solution [6,9,10,11,12,13,14]. Therefore, PMCs exhibit improved structural and functional characteristics compared to their corresponding unfilled counterparts [14]. Especially, the addition of carbon nanotubes sponges (CNT–sponges) into the PMCs structure may affect the matrix properties and their rheological behavior in different ways, depending on their loading, proportion and possible orientation within the host matrix [14]. This is because CNT–sponges have the characteristics of a stable skeleton, good chemical stability, high conductivity, porosity, elasticity, flexibility, and light weight [15]. Further, their anisotropic geometry makes them appropriate for reinforcing the polymeric matrices and turn them into oriented systems capable of mimicking the structure of natural materials [15,16]. Nevertheless, because their nano-size and large length-diameter ratio, they have difficulty dispersing into the polymeric matrix, especially at high loadings ( ≥ 5 wt. %) [17]. Despite this, polymeric composite solutions reinforced with CNT–sponges are often spun into fibers by different ways, including gel spinning and electrospinning techniques [16,18]. Some rheological properties are important parameters to fabricate fibers from these techniques and are related to the deformation of matter under applied stresses and varying the shear rates [19]. For this reason, the rheology can be an effective and efficient indicator to characterize the flow, homogeneity and dispersion properties of fillers into the polymer [19]. Through rheology measurements, the influence of fillers and mixing proportions on the fluidity can be effectively evaluated by means of the linear viscoelastic region (LVER) in the flow curves, relating viscosity, shear rate, yield stress and angular frequency [19,20]. Further, a powerful tool for assessing the state of dispersion of the nanofillers in the polymeric matrix structure, as well as the filler–polymer interactions established at the interface, is the evaluation of the rheological behavior through the Han plot of polymeric composite solutions (PCS) which shows a linear correlation in the plot of log storage (G’) versus log loss (G”) moduli [14,21,22]. Hence, the rheological parameters of polymeric composite solutions reveal fundamental information about the internal arrangement of nanofilled polymers, allowing a complete understanding of the evolution of their structure and specific properties [14]. The viscoelastic behavior depends on various factors such as length, diameter, ratio, flexibility, volume fraction of fillers as well as the concentration and the total solids content of polymers [23]. In the current study, rheological data of poly(styrene-co-acrylonitrile)/carbon nanotubes sponge solutions were evaluated to determine if polymeric composites solutions (PCS) can be used in an electrospinning process for nanofibers formation. The analysis revealed that the viscosity of polymeric composites solutions (PCS) reinforced with CNT–sponges ranging from 1 Pa·s to 20 Pa·s is a key property during the fiber production. Moreover, the PCS with a 0.1 wt.% and 0.3 wt.% CNT–sponges content showed a liquid like-behavior capable of being electrospun. Otherwise, PCS containing 0.5 wt.% of CNT–sponges presents a solid like-behavior attributed to their mostly elastic nature, making them difficult to use during the electrospinning technique. In brief, polymer composites solutions with a low percentage of CNT–sponges have a better performance for the production of nanofibers by electrospinning for several applications.
2. Materials and Methods
2.1. Materials
The synthesis of poly(styrene-co-acrylonitrile) P(S:AN) solutions and carbon nanotubes sponges (CNT–sponges) were reported and explained separately in previous works [24,25]. N,N- dimethylformamide (DMF) (Mw ~73.09 g/mol) purchased from Sigma-Aldrich, St. Louis, MO, USA. Ethanol from Alquimia Mexicana, Mexico City, Mexico. Deionized water from Meyer, Mexico City, Mexico. All materials were used without further purification.
2.2. Carbon Nanotubes Sponges Characterization
2.2.1. X-Ray Diffraction (XRD) of Carbon Nanotubes Sponges
The crystalline structure of CNT–sponges was identified by X-ray diffraction using a Bruker D8 Focus (Bruker, Madison, WI, USA), with high–intensity monochromatic Cu Kα radiation (λ = 1.541 Å), operating at 2 ≤ 2θ/° ≤ 120 and a scan rate of 2° min-1.
2.2.2. Scanning Electron Microscopy (SEM) of Carbon Nanotubes Sponges
The morphology and structure of CNT – sponges were observed by SEM (JEOL JSM-7800F, Tokyo, Japan) at 10 kV and 2 kV using a working distance of 9.7 mm and 3.0 mm, respectively. The CNT–sponges for SEM analysis were dispersed with ethanol using an ultrasonic bath for 20 min. A drop of the prepared solution was deposited on a copper grid and dried using a visible light bulb at 25 °C. Statistical analysis measurements were performed manually using ImageJ ver. 1.52a (Research Services Branch, NIMH, Bethesda, MD, USA). Every SEM image was calibrated using the scale bar.
2.2.3. Rheological Characterization of Carbon Nanotubes Sponges
Rheological measurements of storage (G’) and loss (G’’) moduli of CNT–sponges were done in a Modular Compact Rheometer MCR 502 (Anton Paar, Graz, Austria) using the parallel plate geometry with a 25 mm diameter on top, performing a shear strain γ=1 % and angular frequency (ω) range of 100 to 0.1 rad/s at 25 °C.
2.3. Preparation of P(S:AN)/Carbon Nanotubes Sponges Solutions
The content of CNT–sponges for all polymeric composites solutions (PCS), (0:100, 20:80, 40:60, and 50:50 P(S:AN), wt.%:wt.%) was varied at 0.1 wt.%, 0.3 wt.% and 0.5 wt.% with respect to polymer weight. Samples of 0.001 g, 0.003 g, and 0.005 g of CNT–sponges were ground in a mortar and pestle, then were weighed and well-dispersed by a sonication tip (Ultrasonic processor VCX500, Sonics & Materials, Newtown, CT, USA) in DMF for 2 h at 25 °C. Subsequently, 1 g of polymer was weighed and dissolved in the previous dispersion by mechanical stirring at 80 °C overnight. This protocol ensures the homogenization of solutions and evaporation of the excess solvent.
2.4. Rheological Properties of P(S:AN)/Carbon Nanotubes Sponges Solutions
All solutions of poly(styrene-co-acrylonitrile)/carbon nanotubes sponges were characterized rheologically as function of CNT-sponges content and polymeric composition by a Modular Compact Rheometer MCR 502 (Anton Paar, Graz, Austria) using the parallel plate geometry (PP25) with a 25 mm diameter on top and a Peltier plate for temperature control on the bottom with a 1 mm gap size between them. An evaporation blocker ring was used to avoid air disturbance during measurements. For the first set of experiments, viscosity measurements were made by performing a shear rate (γ ̇) from 0.1 s-1 to 100 s-1 at 25 °C. In the second set of experiments, the linear viscoelastic range (LVER) was determined by performing an amplitude sweep with a steady angular frequency (ω) of 1 rad/s and a shear strain range (γ) 0.1 % – 100 % at 25 °C. To confirm the stability and homogeneity of polymeric composite solutions, a third set of experiments was performed (frequency sweep) by measuring the storage modulus (G'), loss modulus (G''), and loss factor (tan δ) at a shear strain within the LVER, γ=1 % , and an angular frequency range of 300 to 0.1 rad/s.
2.5. Electrospinning Process
The PCS were placed in a 10 mL glass syringe (Dosys 155, SOCOREX, Ecublens, Switzerland), connected to a stainless-steel needle (21 G x 32 mm, Becton Dickinson, NJ, USA) through polytetrafluoroethylene (PTFE) tubing. The needle and the collector were separated with a work distance of 8 cm and connected as electrodes to a high-voltage power supply (ES30P-10W, Gamma High Voltage Research Inc., FL, USA). The applied voltage was set at 18 kV. Afterwards, the polymeric composite solutions were fed at 1 mL/h using a syringe pump (NE-1000, New Era Pump Systems Inc., NY, USA) and finally, the polymer materials were electrospun until the fibers were obtained for 10 min at 25 °C.
2.5.1. Scanning Electron Microscopy (SEM) of Fibers
The morphology and diameter of fibers were observed by SEM (JEOL JSM-7800F, Tokyo, Japan) at 28 kV, using a working distance of 3.0 mm. To prepare samples, the fibers were dried at 60 °C and coated with thin gold layer by sputtering during 15 s.
3. Results and Discussion
Three series of polymeric composite solutions (PCS) of poly(styrene-co-acrylonitrile) with different monomer ratios and several CNT–sponges contents were prepared. The codes and compositions of materials are summarized in Table 1. The PCS were prepared by direct sonication of CNT in DMF and mechanical stirring as described above. After preparation, black and homogeneous polymeric fluids were obtained. Additionally, the diameter, shape and crystalline structure of CNT–sponges were characterized before dispersing and mixing them into the polymeric matrix.
3.1. Carbon Nanotubes Sponges Characterization
The crystallographic structure of CNT–sponges was analyzed by powder X-ray diffraction. Simultaneously, Figure 1 shows the X-ray pattern of commercial multiwalled CNTs (Baytubes C150 P, Bayer Materials Science, Leverkusen, Germany) and the previously prepared CNT–sponges. It is observed that the diffraction pattern showed two main characteristic reflections at 25.85° (JCPDS: 96-101-1061) and 42.77° (JCPDS: 41-1487) corresponding to the graphite structure [26,27]. It is noticed that the intensity of the peak in the (002) plane indicates a higher crystallinity degree for the obtained CNT–sponges, almost twice the intensity reported for commercial CNT, meanwhile, the intensity of the peak in the (100) plane results to have the same intensity values.
Morphology and size distributions of CNT–sponges were observed by SEM (Figure 2). The CNT–sponges show a tridimensional bamboo-like structure in Figure 2 (a). Some authors attribute this behavior to foreign nitrogen atoms within the graphitic lattices. This means these atoms promote the growth of additional carbon nanotubes in a zigzag pattern, leading to their entanglement and interconnection [23,26,27]. Thereafter, a statistical analysis of CNT diameter distribution was determined from SEM images. The data obtained were grouped into two classes. The smallest diameters were 316.1 nm while the largest were 658.1 nm. After performing the statistical calculations for grouped data, an average diameter of 557.6 ± 42.2 nm was found for class 1, meanwhile for class 2, was 364.1 ± 29.6 nm. As an example, Figure 2 (b) shows CNT–sponges with a diameter of 351.8 nm belonging to class 2. Thus, the diameter distribution as a histogram is presented in Figure 3.
Storage (G') and loss (G'') modulus measurements were made to evaluate the elasticity of CNT–sponges structures. Figure 4 shows the viscoelastic moduli as function of angular frequency (ω). Along with the entire frequency sweep, the storage modulus dominates and keeps a constant plateau at 1550 kPa ± 60 kPa above the parallel plateau corresponding to the loss modulus at 195 kPa ± 8 kPa. This is a clear behavior of a stable elastic/solid structure in the prepared sponges, where all the energy applied during the frequency sweep is stored by the tridimensional carbon nanotubes. Afterwards, when the sweep was retired, the energy is dissipated and CNT–sponges maintained their initial structure [28].
3.2. Rheological Behavior of Polymeric Composites Solutions
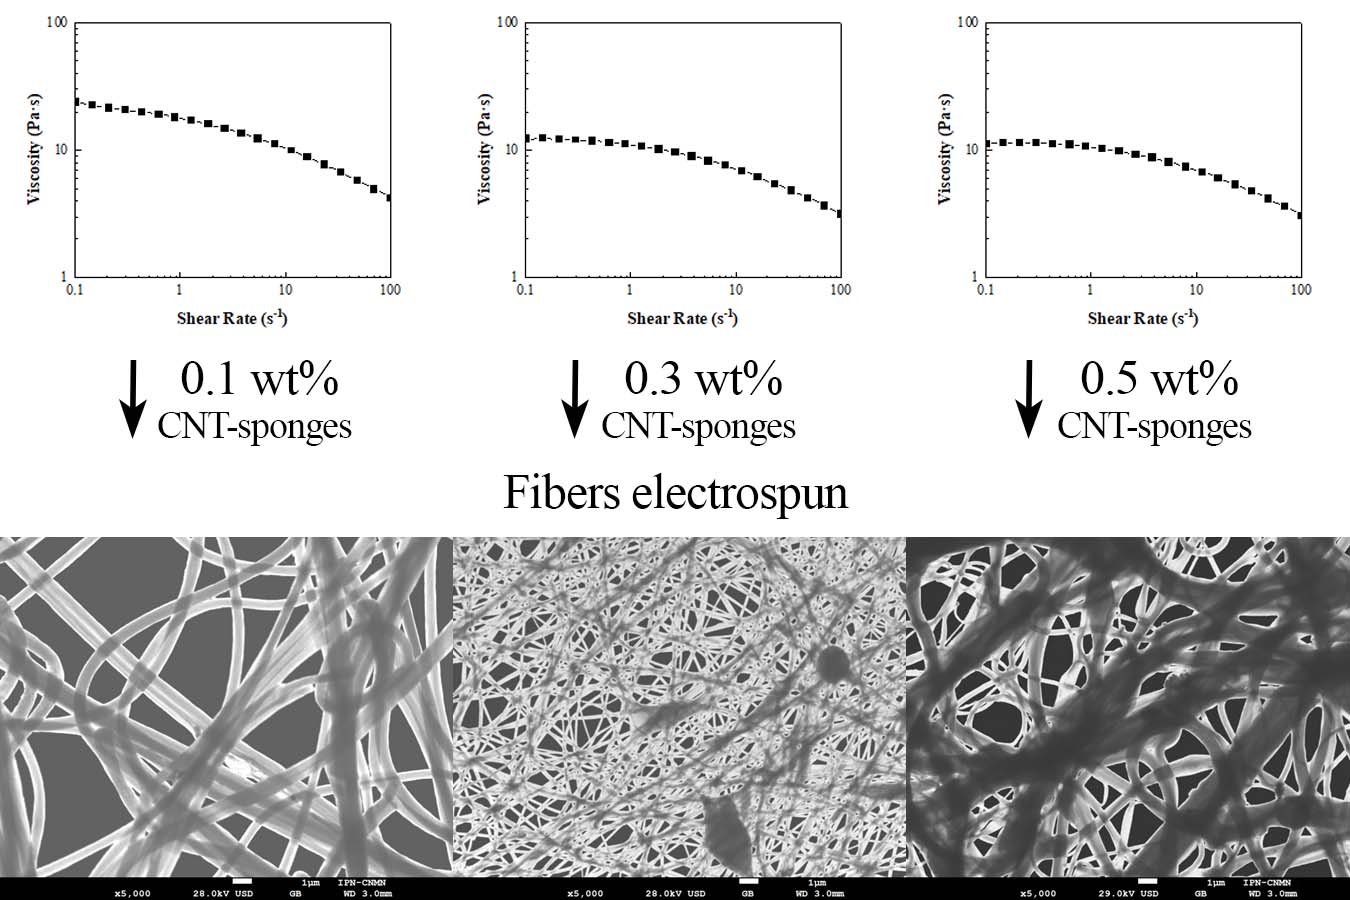
Figure 5 shows the viscosity (η) of poly(styrene-co-acrylonitrile)/carbon nanotubes-sponge solutions at 25 °C. In general, once studying the viscosity concerning the polymeric matrixes, the pristine polyacrylonitrile matrix (0:100, wt.%:wt.%) exhibits average values at 16 Pa·s ± 6 Pa·s, as depicted in Figure 5 (a). It is noteworthy that in the pristine matrix, there is a distinct transition from a viscosity plateau (Newtonian behavior) at low shear rates (0.1 – 1.0 s-1) to a shear-thinning region (non-Newtonian behavior) at higher shear rates (1.0 – 100 s-1). This smooth transition has been previously documented in polymeric composite solutions and is attributed to the re-alignment of carbon nanotubes. This phenomenon is commonly referred to as the rheological percolation of the CNT network within the polymeric matrix [29,30]. In contrast, the remaining polymeric composites solutions (20:80, 40:60, and 50:50, wt.%:wt.%) shown in Figure 5 (b-d), present significantly lower viscosity values up to 1.5 Pa·s ± 0.5 Pa·s, nearly tenfold lower than the viscosity values exhibited by pristine matrix (0:100, wt.%:wt.%). Therefore, as the concentration of styrene increases in the polymeric solution, the viscosity decreases. Besides, these polymeric composites solutions (PCS) also reveal a consistent and gradual shear-thinning behavior across the entire shear rate range (0.1-100 s-1) as shown in Figure 5 (b-d).
Upon further analysis of the results presented in Figure 5, it is evident that there is a dependence between viscosity and the concentration of CNT–sponges in the polymeric solutions. This is more noticeable, as the polyacrylonitrile and CNT–sponges concentration rise within the polymer matrix. Analyzing once again the PCS, the polyacrylonitrile matrix (0:100, wt.%:wt.%) presents approximate viscosity values of 10 ± 4 Pa·s at 0.1 wt.% and 0.3 wt.% of CNT–sponges while with increasing CNT–sponges proportion in the polymeric solution, the viscosity reaches values up to 20 ± 4 Pa·s at 0.5 wt.%. This behavior is attributed to three factors: (i) saturation effect where at low concentrations of CNT, the viscosity is decreased. This is, as there are fewer CNTs available in the system, they interact less with the polymeric matrix. Contrary, if the amount of CNTs increases, the viscosity rises. Nonetheless, as the CNT concentration becomes even higher, the viscosity does not change significantly. This is because a saturation point is reached and, the interaction sites are limited by the excess of CNT. (ii) dispersion and interaction, both phenomena of CNTs within the polymeric matrix plays a crucial role. That is to say, at lower concentrations, it is usually easier to achieve an uniform and homogeneous dispersion of CNTs, leading to stronger interactions between individual nanotubes and the polymer chains. However, as the proportion of CNTs increases, their dispersion in the system is more difficult and therefore, the CNTs do not contribute to the increase in viscosity. (iii) polymer-CNT interaction, the type, proportion and the affinity of polymer towards carbon nanotubes is reflected in secondary (non-covalent) interactions generated between them. Hence, a high affinity and concentration of polymer drastically change viscosity behavior due to greater existing non-covalent bonds [28,31].
Dynamic oscillatory experiments were conducted to evaluate the homogeneity of CNT–sponges within the polymer matrix. The strain applied should fall within the linear viscoelastic region of the material, in this case at γ=1%, across a frequency range of 300-0.1 rad/sec. Figure 6 depicts the curves of storage modulus (G’) as function of loss modulus (G’’), commonly referred to as Han’s plot. This provides a quantitative assessment of solution homogeneity as the slope curve is positive, null or negative. In most polymeric composites solutions (PCS) shown in Figure 6 (a-d), a positive slope (value close to 1.37) was observed. This indicates a uniform dispersion of CNT–sponges within the main polymer matrix. It is noticeable, the storage modulus increases proportionally to the loss modulus, and the yield point is situated at higher frequencies. Particularly, a null slope (horizontal line) was obtained for SAN5.4 as shown in Figure 6 (c) and (d). This null value indicates the presence of CNT agglomerates, reducing homogeneity of the solution [6].
Further analysis in the Han’s plot, is possible to indicate the state behavior of polymeric composite solution with a moduli relation over the entire frequency range. The G' = G'' ratio reveals a viscoelastic behavior of the material (denoted by a dashed line in the plots). Curves above this line (G’ > G’’) indicate a solid-like state, while those below (G’ < G’’) suggests a liquid-like state [32]. Initially, the solutions exhibit a liquid-like state, but with increasing frequency, their behavior approaches a viscoelastic-like state. The only instances of a solid-like state occur in solutions with a 0.5 wt. % of CNT–sponges shown in Figure 6 (c) and (d), aligning with the previously described analysis and attributed to the presence of agglomerations [33].
The loss factor (tan δ) is a parameter obtained from frequency sweep that describes the PCS dissipation energy. This means, when tan δ<1, the PCS presents a solid-like behavior, if tan δ = 1 behaves as a viscoelastic material, but when tan δ>1 a liquid-like behavior is found [28]. Figure 7 shows the tan δ (G’/G’’) as a function of frequency (ω). It is observed that pristine matrix with 0.1 wt.% and 0.3 wt.% of CNT content shown in Figure 7 (a) presents loss factor (tan δ) values above 1 across the entire frequency range, showing a viscoelastic behavior. Except, the polymeric composite solution with 0.5 wt.% of CNT which performance a mostly elastic behavior because it undergoes a transition from a solid phase to a predominantly liquid phase [28]. Meanwhile, polymeric composite solutions (PCS) shown in Figure 7 (b), (c) and (d) reveal tan δ data under 1 at low frequencies (ω), but these values increase as long as ω is higher. This represents, a transition from a solid-like to liquid-like behavior, attributed to the facility of CNT-sponges to be realigned and flow in the polymer matrix.
3.3. Fiber Morphology
In order to observe the morphology and physical structure of reinforced fibers, all the materials were analyzed by SEM (Figure 8). The fibers were deposited overlapped and entangled on a drum collector, obtaining a yarn-like structure.
In general, micrographs show a smooth and cylindrical morphology in the polymeric fibers with an average diameter of 650 nm ± 100 nm, when were electrospun from PCS within viscosity range of 1.5 ≥ η/Pas ≥ 20, denotating that viscosity is an important indicator for processing homogenous fibers by electrospinning technique. Reinforced fibers with a polymeric matrix 0:100 of P(S:AN) wt.%:wt.% present a structure free of agglomerations and protrusions (Figure 8 a-c). However, composites with a polymeric matrix 50:50 of P(S:AN) wt.%:wt.% have agglomerations of CNT–sponges inside and/or attached outside of fibers (Figure 8 b-d). This is because CNT do not show a complete compatibility with the polymeric solutions. These results agree with the rheological values obtained from the frequency sweep analysis where the affinity between polymeric matrix and CNT–sponges plays a crucial role in the formation of fibers.
4. Conclusions
After analyzing the rheological results, it is possible to predict if polymeric composite solutions of poly(styrene-co-acrylonitrile)/carbon nanotubes sponges will be suitable for electrospinning. First, it is necessary to use viscosity within a range between 1 Pa·s and 20 Pa·s, if viscosity overpasses this range, possible segregation of polymeric matrix and reinforcement phases are obtained, producing agglomerations, hence, this will cause clogging of the spinning needle, preventing the production of fibers or the modification of their morphology with the CNT-sponges encapsulation, as the fringe case of dope SAN5.1 (η = 20 ± 4 Pa·s). On the other hand, if viscosity undergoes the electrospinnable range, the dope is electrosprayed instead, producing micro-nanodroplets of the polymeric solution, and no fibers are produced, as the case of SAN1.2 and SAN 3.2 dopes (η = 0.8 ± 0.05 Pa·s). A second rheological study could define if the dopes present a viscoelastic, solid or liquid like- behavior. Besides, the loss factor (tan δ) for dopes with 0.1 wt. % and 0.3 wt. % of CNT-sponges content, remained above 1 across the entire frequency range probed presenting a liquid like- behavior acceptable for electrospinning. On the contrary, the dopes with 0.5 wt. % content presents a solid like- behavior, which made the dispersion more elastic and therefore, hinders the electrospun process.
Author Contributions
R.C.-B. and M.A.P.-C. synthesized copolymers, prepared polymeric composite solutions, electrospun yarns, collected and interpreted data. R.C-B. and L.R.-V. prepared rheological experiments. E.M.-S. and H.M.-G. prepared samples and evaluated SEM experiments, collected and interpreted data. M.C. and G.M.-M performed experiments, collected and interpreted data. The manuscript was written by R.C.-B. and M.C. and revised by L.R.-V. All authors have read and agreed to the published version of the manuscript.
Funding
This research was funded by Instituto Politécnico Nacional (SIP projects 20242529 and 20240655).
Data Availability Statement
Not applicable.
Acknowledgments
The authors would like to acknowledge Centro de Nanociencias y Micro-Nanotecnologías (CNMN) from Instituto Politécnico Nacional for the SEM assays and the Advanced Materials Division from Instituto Potosino de Investigación Científica y Tecnológica for the CNT-sponges.
Conflicts of Interest
The authors declare no conflict of interest.
Abbreviations
The following abbreviations are used in this manuscript:
| CNT | Carbon nanotubes |
| P(S:AN) | Poly(styrene-co-acrylonitrile) |
| PCS | Polymeric composite solution |
| PMC | Polymeric matrix composite |
| SEM | Scanning electron microscopy |
| LVER | Linear viscoelastic region |
| G’ | Storage modulus |
| G’’ | Loss modulus |
| DMF | N,N- dimethylformamide |
| XRD | X-ray diffraction |
| PP | Parallel plate |
| PTFE | Polytetrafluoror |
| JCPDS | Joint committee on powder diffraction standards |
References
- Alibakhshi, S.; Youssefi, M.; Hosseini, S. Significance of thermodynamics and rheological characteristics of dope solutions on the morphological evolution of polyethersulfone ultrafiltration membranes. Polymer Engineering and Science 2021, 61, 742–753. [Google Scholar] [CrossRef]
- Madej-Kiełbik, L.; Gzyra-Jagieła, K.; Józwik-Pruska, J.; Dziuba, R.; Bednarowicz, A. Biopolymer Composites with Sensors for Environmental and Medical Applications. Materials 2022, 15, 7493. [Google Scholar] [CrossRef] [PubMed]
- Ru-Min, W.; Shui-Rong, Z.; Yujun, G. Polymer Matrix Composites and Technology. 2011. Woodhead Publishing Limited.
- Sajan, S.; Philip Selvaraj, P. A review on polymer matrix composite materials and their applications. Materials Today Proceedings 2021, 47, 5493–5498. [Google Scholar] [CrossRef]
- Kangishwar, S.; Radhika, N.; Sheik, A.A.; Abhinav, C.; Hariharan, S. A comprehensive review on polymer matrix composites: material selection, fabrication, and application. Polymer Bulletin 2023, 80, 47–87. [Google Scholar] [CrossRef]
- Thomas, S.; Muller, R.; Abraham, J. Rheology and processing of polymer nanocomposites. John Wiley & Sons, Inc. 2016.
- Adib Bin, R.; Mahima, H.; Mohaimenul, I.; Rafi Uddin, L. Nanotechnology-enhanced fiber-reinforced polymer composites: Recent advancements on processing techniques and applications. Heliyon 2024, 10, e24692. [Google Scholar]
- Kessler, M. Polymer Matrix Composites: A Perspective for a Special Issue of Polymer Reviews. Polymer Reviews 2012, 52, 229–233. [Google Scholar] [CrossRef]
- Ramkumar, Y.; Mayank, S.; Deepika, S.; Seul-Yi, L.; Soo-Jin, P. The role of fillers to enhance the mechanical, thermal, and wear characteristics of polymer composite materials: A review. Composites Part A: Applied Science and Manufacturing 2023, 175, 107775. [Google Scholar]
- Tong, W.; Shuang, L.; Kunpeng, W.; Peng, Y.; Mike, C. Multi-scale hybrid polyamide 6 composites reinforced with nano-scale clay and micro-scale short glass fibre. Composites Part A: Applied Science and Manufacturing 2013, 50, 31–38. [Google Scholar]
- Janak, S.; Mehdi, J.; Christoph, W.; Johan, F. Reinforcing Poly(ethylene) with Cellulose Nanocrystals. Macromolecular Rapid Communications 2014, 35, 1747–1753. [Google Scholar]
- Sapkota, J.; Martínez, J.C.; Lattuada, M. Reinterpretation of the mechanical reinforcement of polymer nanocomposites reinforced with cellulose nanorods. Journal of Applied Polymer Science 2017, 134, 45254. [Google Scholar] [CrossRef]
- Garima, M.; Vivek, D.; Kyong, Y.; Soo-Jin, P.W. A review on carbon nanotubes and graphene as fillers in reinforced polymer nanocomposites. Journal of Industrial and Engineering Chemistry 2015, 21, 11–25. [Google Scholar]
- Rossella, A.; Giulio, M. Rheological Behavior of Polymer/Carbon Nanotube Composites: An Overview. Materials 2020, 13, 2771. [Google Scholar] [CrossRef]
- Wenqi, Z.; Zhan, G.; Yifan, Z.; Boyu, Y.; Yunting, W.; Yiying, C.; Shukai, D. ; High mass loading pitch-derived porous carbon embedded in carbon nanotube sponge for lithium ion capacitor cathodes. Carbon 2025, 235, 120059. [Google Scholar]
- Deng, H.; Fu, Q.; Bilotti, E.; Peijs, T. The use of polymer-carbon nanotube composites in fibres. Polymer-Carbon Nanotube Composites: Preparation, properties and applications. Woodhead Publishing Series. 2011, 657-675.
- Peng-Cheng, M.; Jang-Kyo, K.Carbon Nanotubes for Polymer Reinforcement. CRC Press. 2011, 224.
- Yaodong, L.; Satish, K. Polymer/Carbon Nanotube Nano Composite Fibers−A Review. ACS Applied Materials and Interfaces 2014, 6, 6069–6087. [Google Scholar]
- Nazar, S.; Yang, J.; Thomas, B.; Azim, I.; Ur Rehman, S. Rheological properties of cementitious composites with and without nano-materials: A comprehensive review. Journal of Cleaner Production 2020, 272, 122701. [Google Scholar] [CrossRef]
- Starkova, O.; Aniskevich, A. Limits of linear viscoelastic behavior of polymers. Mechanics of Time-Dependent Materials 2007, 11, 111–126. [Google Scholar] [CrossRef]
- Mohammadi, M.; Yousefi, A.; Ehsani, M. Thermorheological analysis of blend of high- and low-density polyethylenes. Journal of Polymer Research 2012, 19, 9798. [Google Scholar] [CrossRef]
- Whala, F.; Lamnawar, K.; Maazouz, A.; Jaziri, M. Rheological, Morphological and Mechanical Studies of Sustainably Sourced Polymer Blends Based on Poly(Lactic Acid) and Polyamide 11. Polymers 2016, 8, 61. [Google Scholar] [CrossRef]
- Tadashi, Y.; Shogo, N.; Masayuki, Y. Rheological properties of polymer composites with flexible fine fibers. Journal of Rheology 2011, 55, 1218. [Google Scholar]
- Caro-Briones, R.; García-Pérez, B.E.; Báez-Medina, H.; Martín-Martínez, E.S.; Martínez-Mejía, G.; Jiménez-Juárez, R.; Martínez-Gutiérrez, H.; Corea, M. Influence of monomeric concentration on mechanical and electrical properties of poly(styrene-co-acrylonitrile) and poly(styrene-co-acrylonitrile/acrylic acid) yarns electrospun. Journal of Applied Polymers Science 2020, 137, 49166. [Google Scholar] [CrossRef]
- Muñoz-Sandoval, E.; Cortes-López, A.J.; Flores-Gómez, B.; Fajardo-Díaz, J.; Sánchez-Salas, R.; López-Urías, F. Carbon sponge-type nanostructures based on coaxial nitrogen-doped multiwalled carbon nanotubes grown by CVD using benzylamine as precursor. Carbon 2017, 115, 409–421. [Google Scholar] [CrossRef]
- Soleimani, H.; Baig, M.K.; Yahya, N.; Khodapanah, L.; Sabet, M.; Demiral, B.M.; Burda, M. Impact of carbon nanotubes based nanofluid on oil recovery efficiency using core flooding. Results in Physics 2018, 9, 39–48. [Google Scholar] [CrossRef]
- Saleh, T.A.; Elsharif, A.M.; Asiri, S.; Mohammed, A.R.; Dafalla, H. Synthesis of carbon grafted with copolymer of Acrylic Acid and Acrylamide for Phenol removal. Environmental Nanotechnology, Monitoring & Management 2020, 14, 100302. [Google Scholar]
- Gui, X.; Wei, J.; Wang, K.; Cao, A.; Zhu, H.; Jia, Y.; Shu, Q.; Wu, D. Carbon Nanotube Sponges. Advanced Materials 2010, 22, 617–621. [Google Scholar] [CrossRef]
- Koziol, K.; Shaffer, M.; Windle, A. Three-dimensional internal order in multiwalled carbon nanotubes grown by chemical vapor deposition. Advanced Materials, 2005, 17, 760–763. [Google Scholar] [CrossRef]
- Devasahayam, S.; Bandyopadhyay, S. New Developments in Polymer Composites Research: Evolution of novel size-dependent properties in polymer-matrix composites due to polymer filler interactions. Nova Science Publishers, Inc. 2013, 1-32.
- Lu, M.; Liao, J.; Gulgunje, P.V.; Chang, H.; Arias-Monje, P.J.; Ramachandran, J.; Breedveld, V.; Kumar, S. Rheological behavior and fiber spinning of polyacrylonitrile (PAN)/Carbon nanotube (CNT) dispersions at high CNT loading. Polymer 2021, 215, 1–7. [Google Scholar] [CrossRef]
- Lu, M.; Gulgunje, P.V.; Arias-Monje, P.J.; Luo, J.; Ramachandran, J.; Sahoo, Y.; Agarwal, S.; Kumar, S. Structure, properties, and applications of polyacrylonitrile/carbon nanotube (CNT) fibers at low CNT loading. Polymer Engineering and Science 2020, 9, 2143–2451. [Google Scholar] [CrossRef]
- Bagheri, B.; Abdouss, M.; Shoushtari, A.M. New procedure for preparation of highly stable and well separated carbon nanotubes in an aqueous modified polyacrylonitrile. Mat.-wiss. u. Werkstofftech 2010, 41, 234–240. [Google Scholar] [CrossRef]
Figure 1.
XRD pattern comparison for commercial CNTs (···) and CNT–sponges (—).
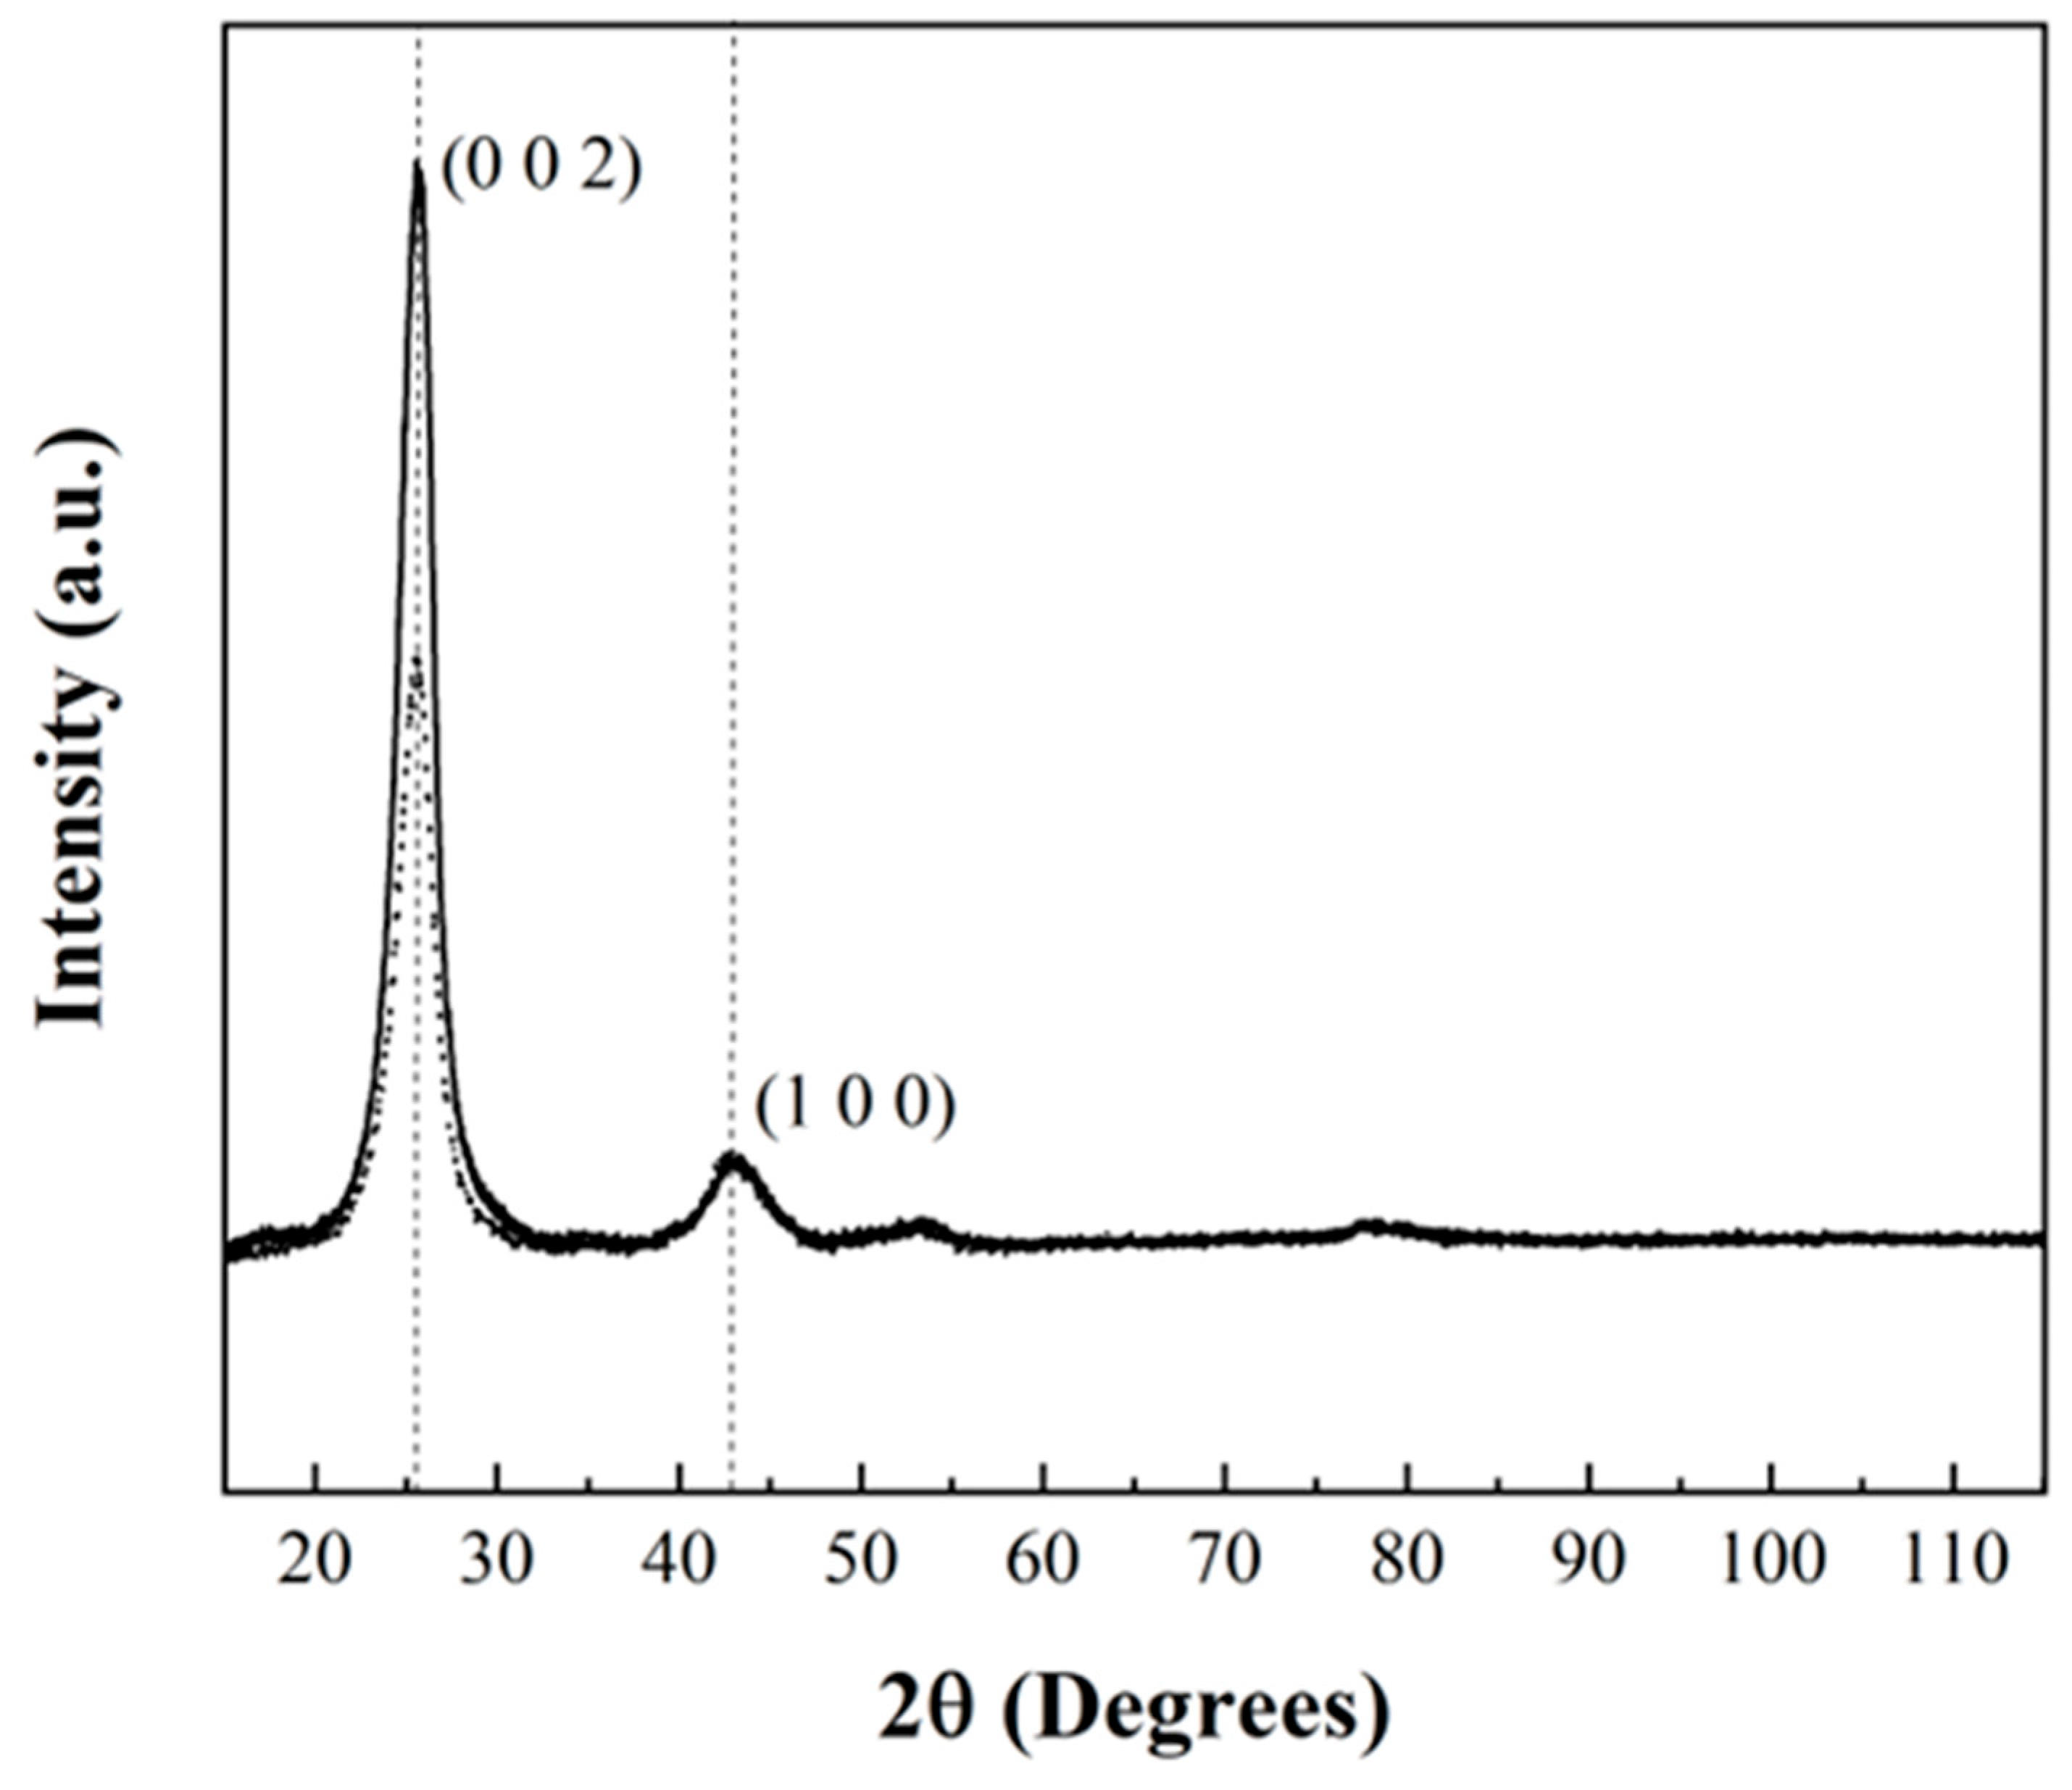
Figure 2.
SEM micrographs of CNT-sponges under different magnifications: a) x2,000 and b) x50,000.
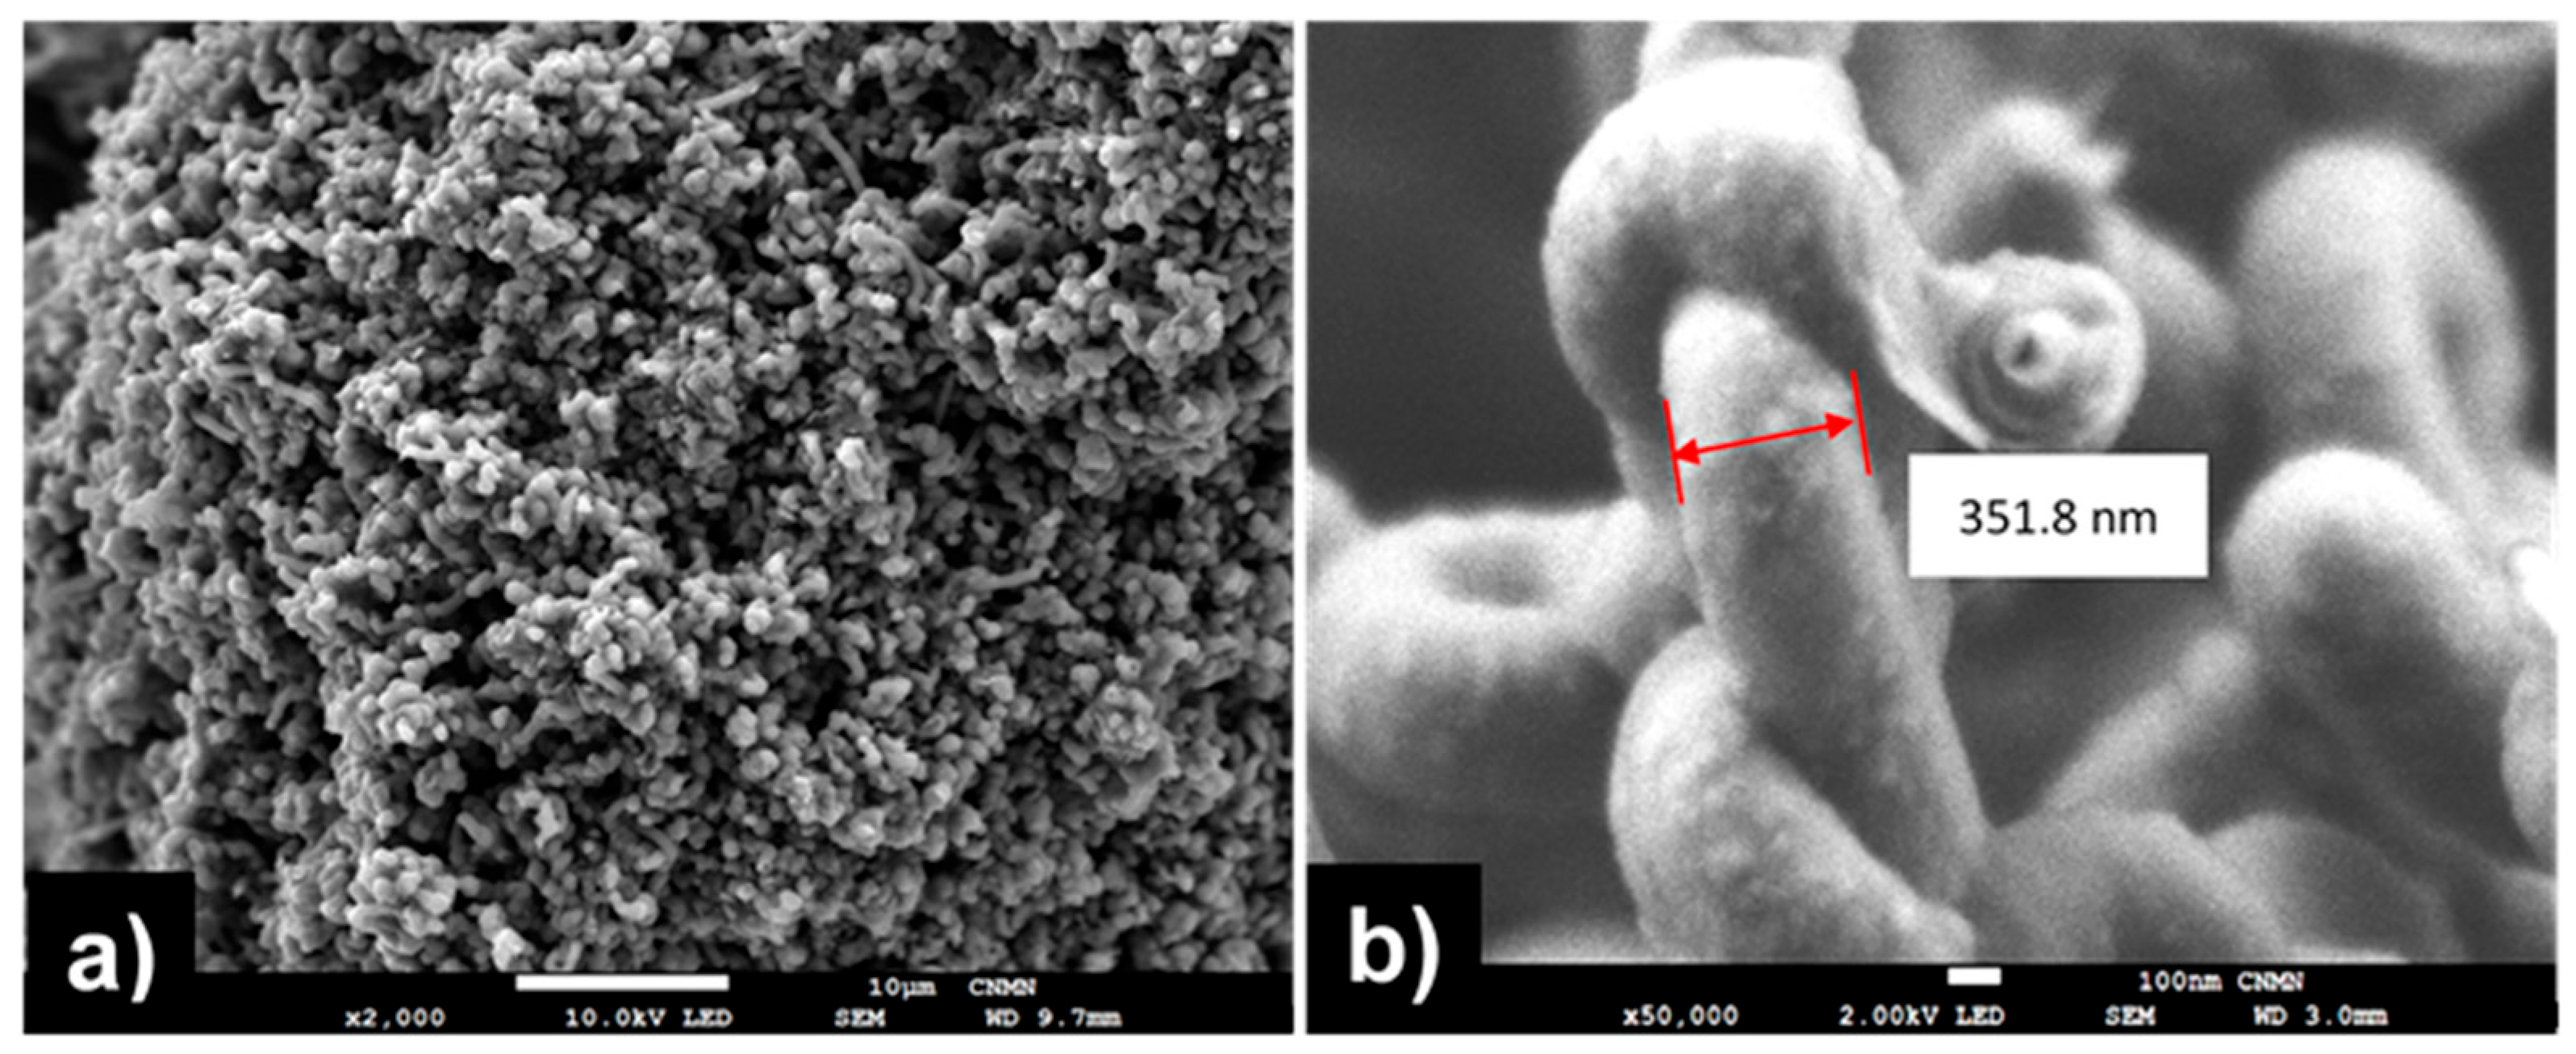
Figure 3.
Statistical analysis of CNT diameter distribution from SEM image (Figure 2).
Figure 3.
Statistical analysis of CNT diameter distribution from SEM image (Figure 2).
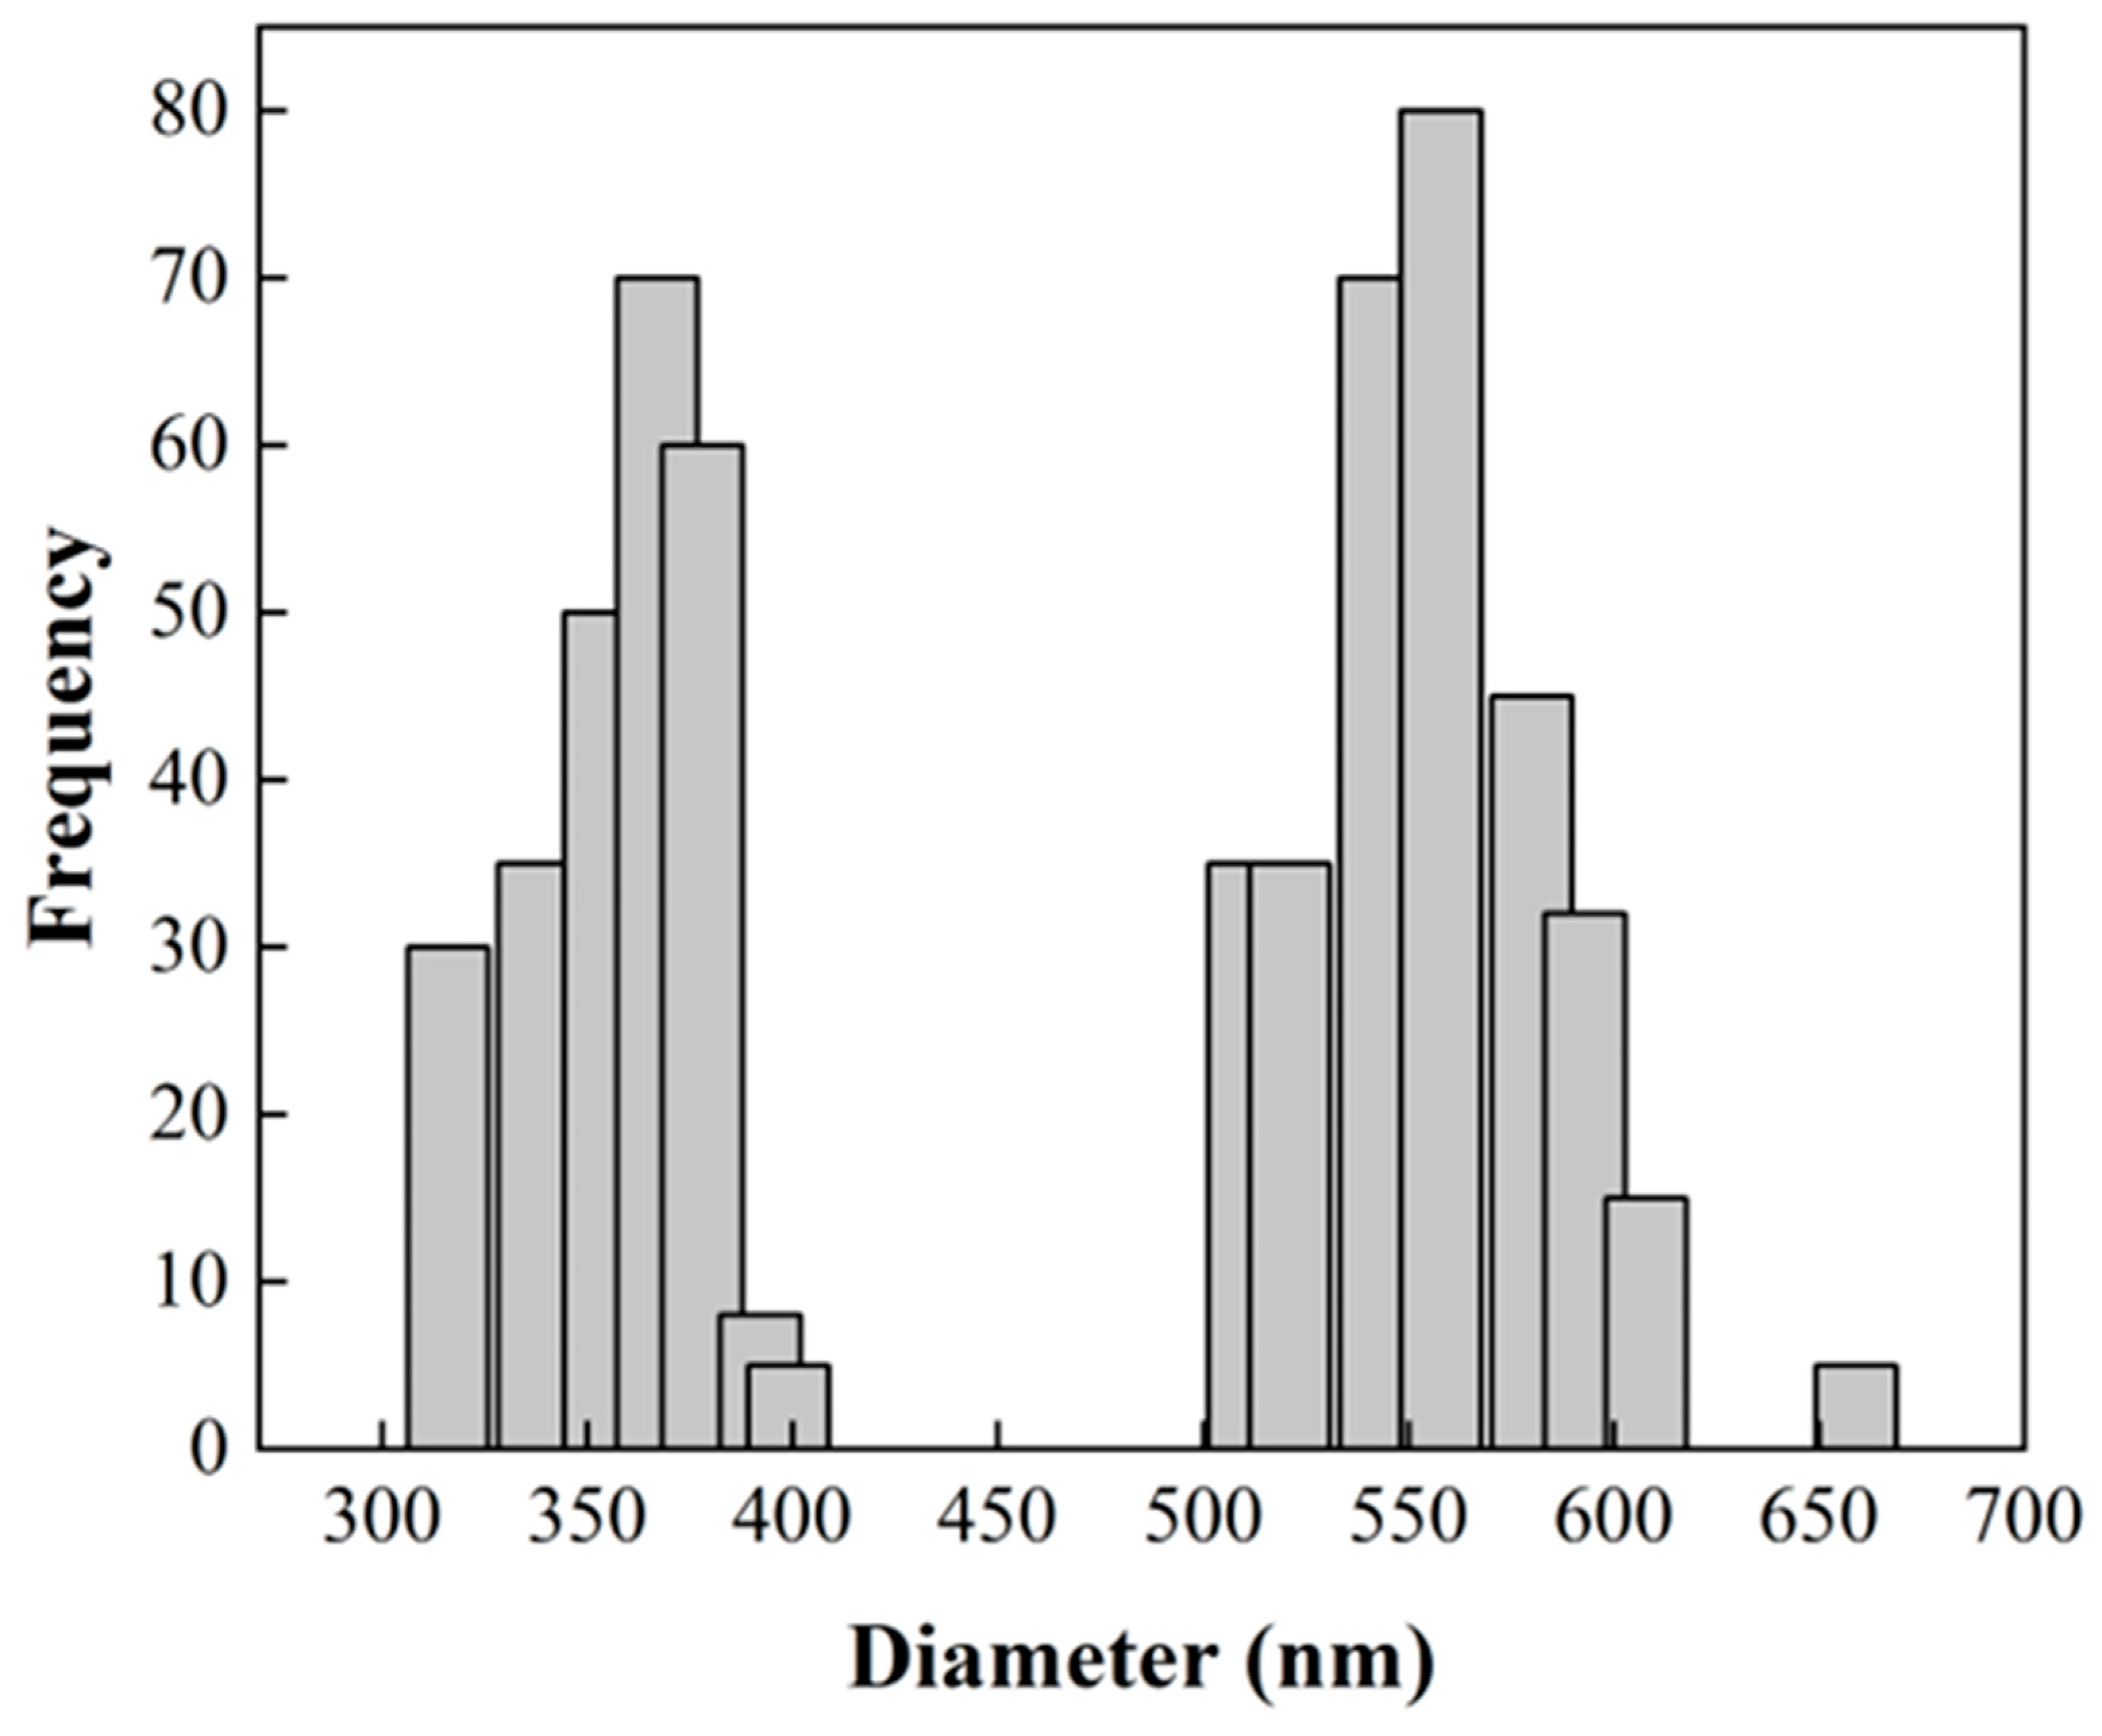
Figure 4.
Storage (■) and loss (▲) moduli as a function of the angular frequency (ω) of CNT–sponges.
Figure 4.
Storage (■) and loss (▲) moduli as a function of the angular frequency (ω) of CNT–sponges.
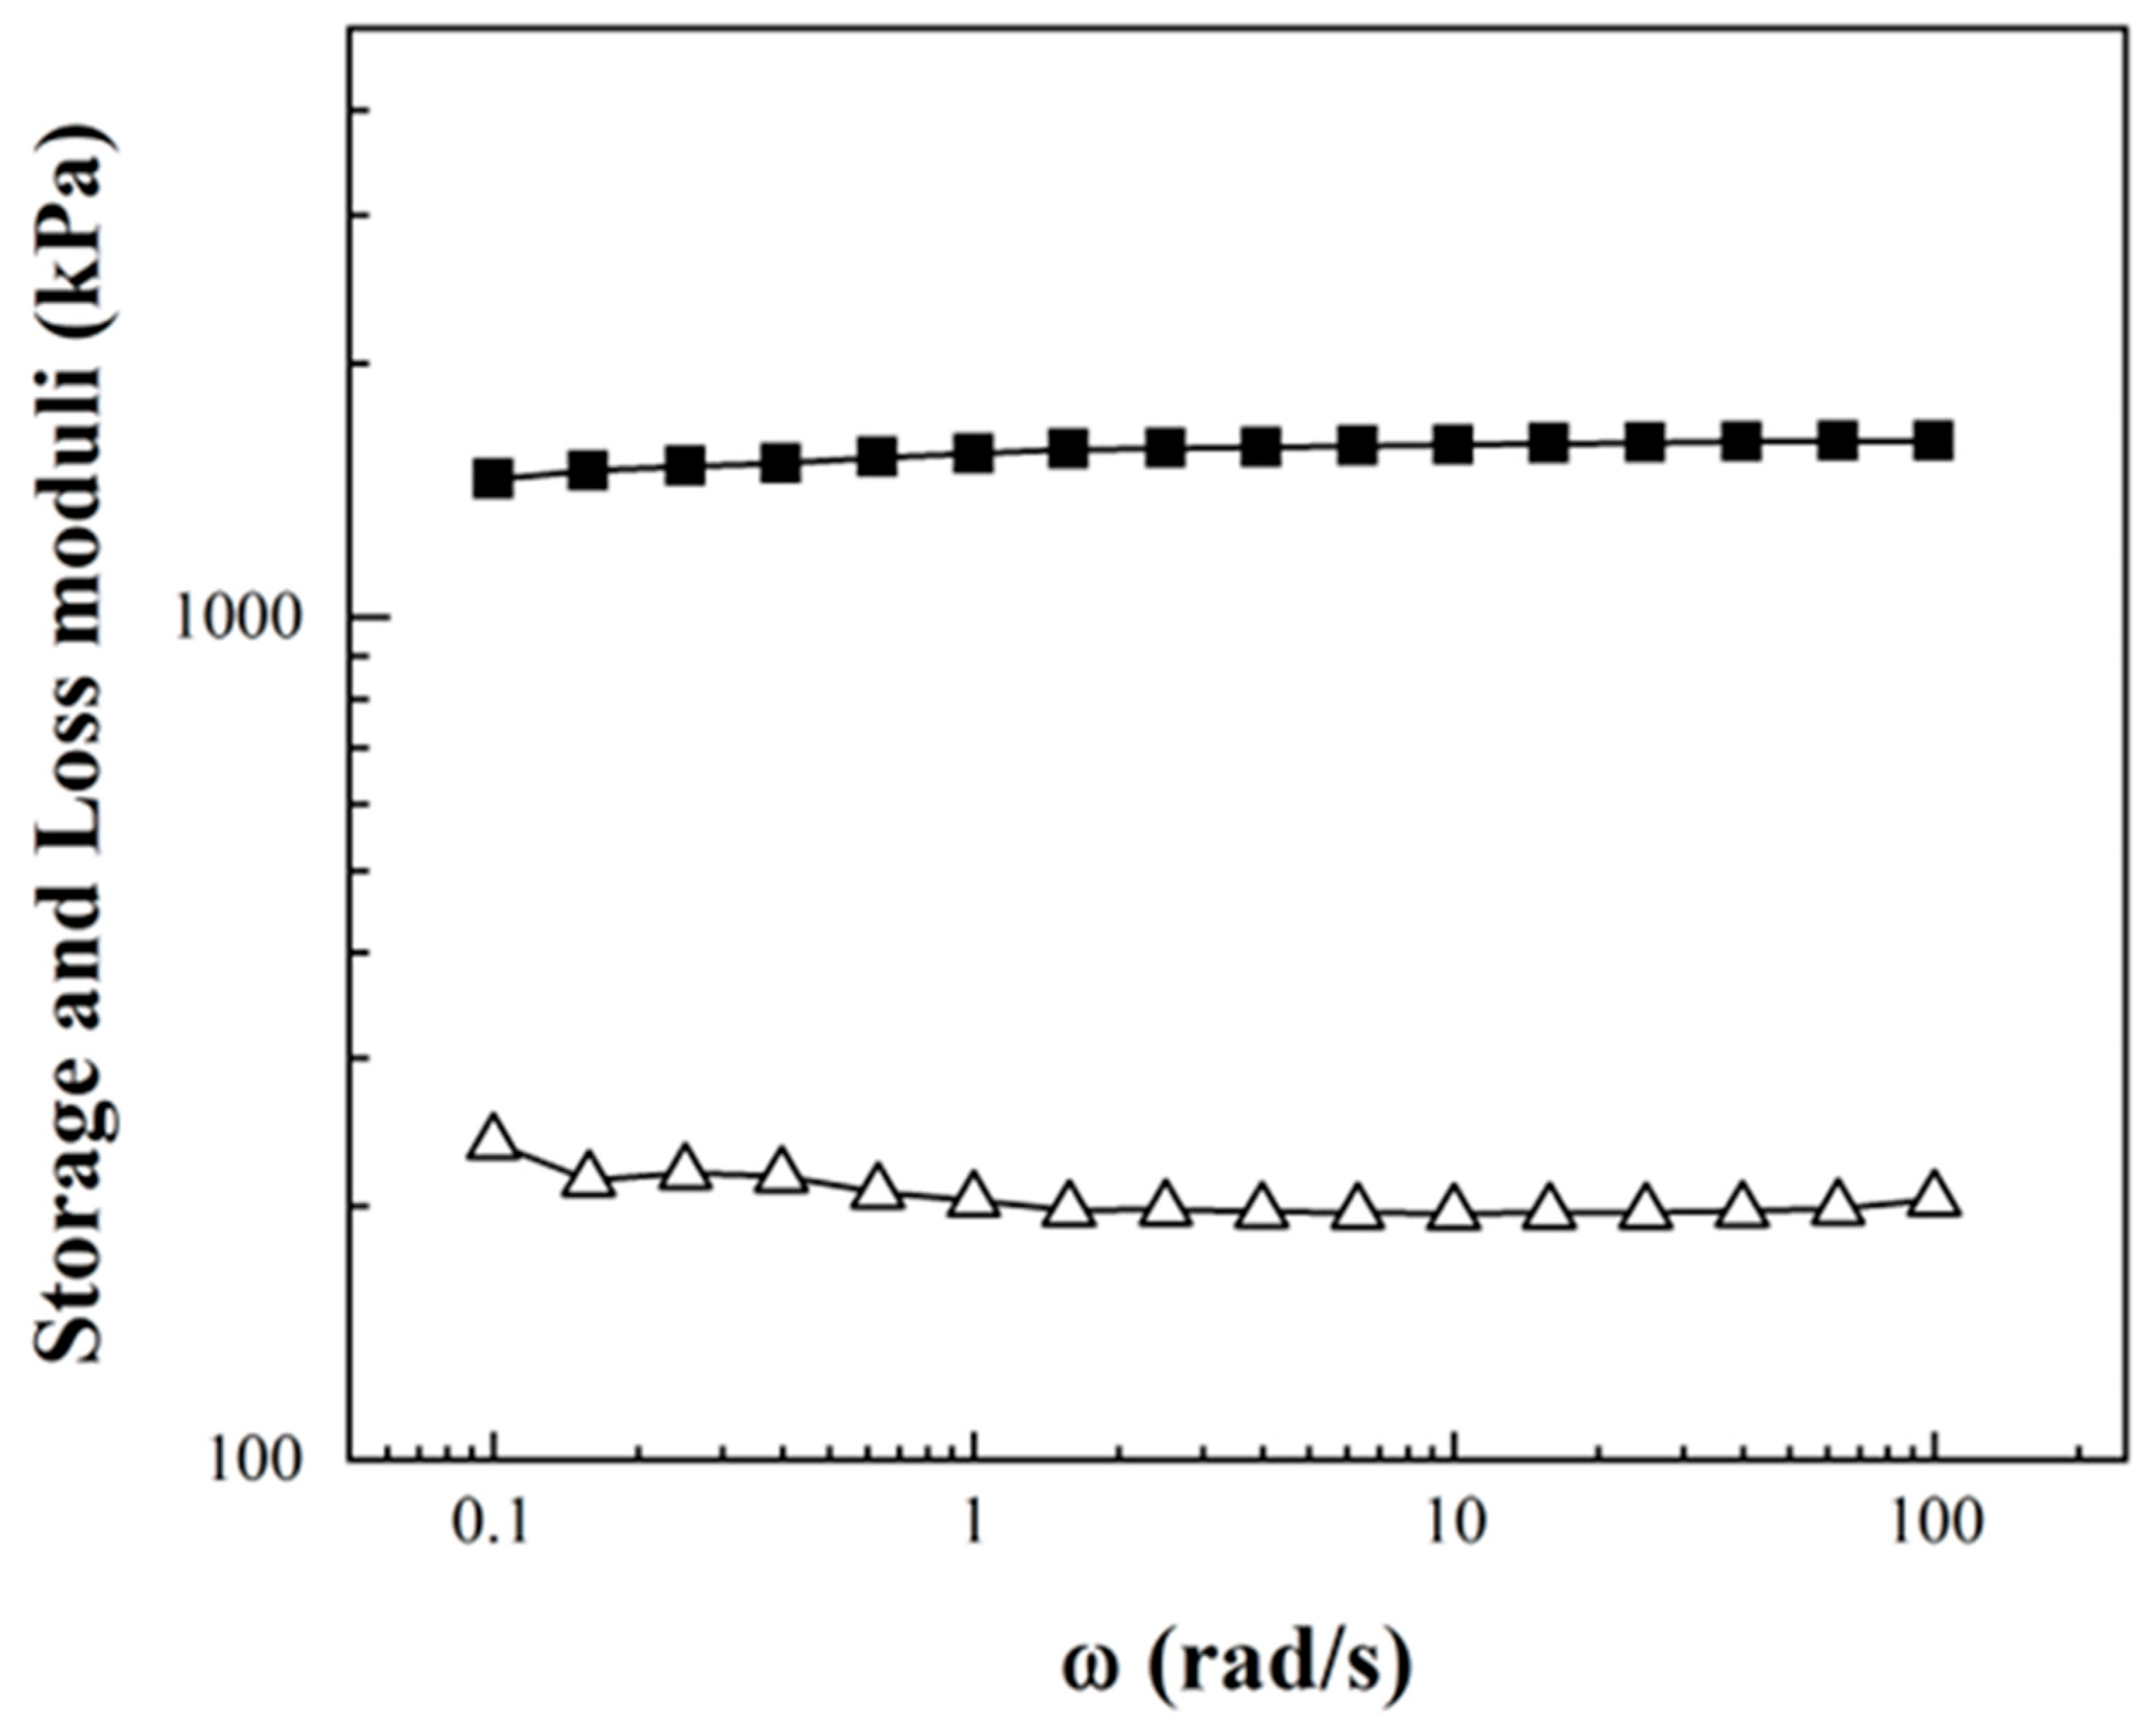
Figure 5.
Viscosity (η) of poly(styrene-co-acrylonitrile) P(S:AN) solutions: (a) 0:100, (b) 20:80, (c) 40:60 and (d) 50:50 wt.%:wt.% with different CNT–sponges content: (■) 0.1 wt.%, (•) 0.3 wt.% and (▲) 0.5 wt.%.
Figure 5.
Viscosity (η) of poly(styrene-co-acrylonitrile) P(S:AN) solutions: (a) 0:100, (b) 20:80, (c) 40:60 and (d) 50:50 wt.%:wt.% with different CNT–sponges content: (■) 0.1 wt.%, (•) 0.3 wt.% and (▲) 0.5 wt.%.
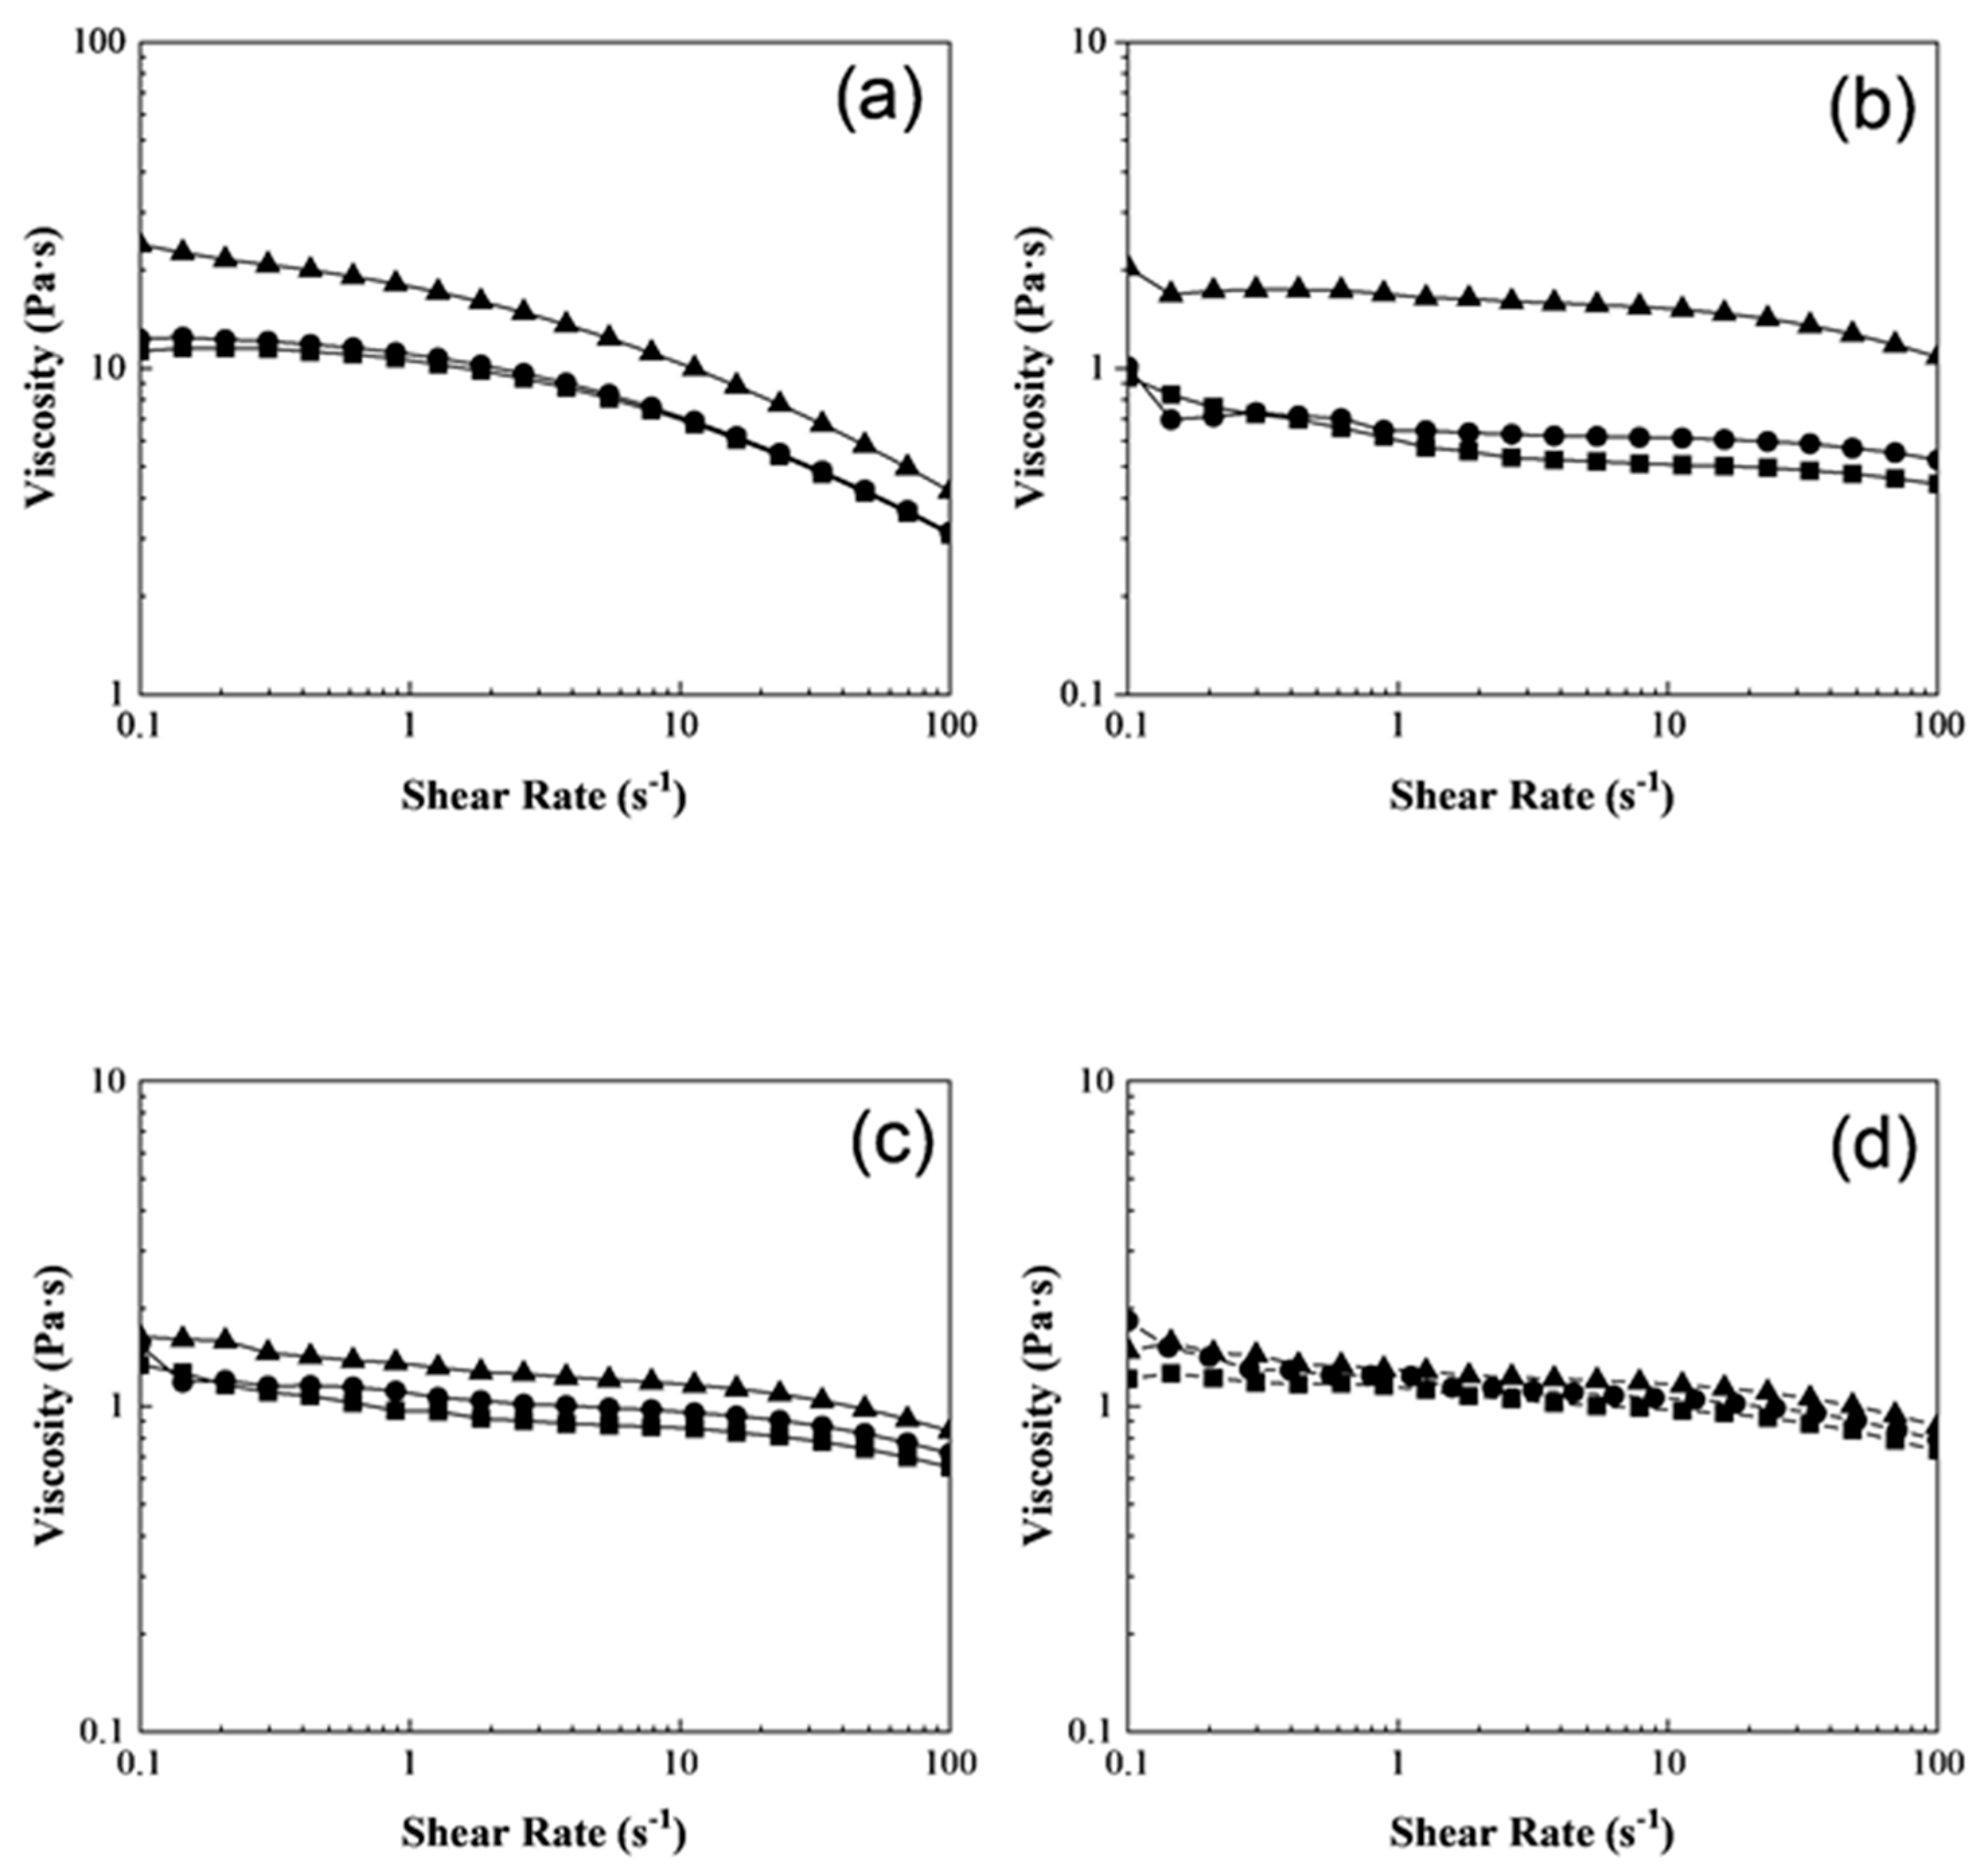
Figure 6.
Log-log plot of (G') as a function of (G'') of poly(styrene-co-acrylonitrile) P(S:AN) solutions: (a) 0:100, (b) 20:80, (c) 40:60 and (d) 50:50 wt.%:wt.% with 10 wt.% of solids and different CNT–sponges contents: (■) 0.1 wt.%, (•) 0.3 wt.% and (▲) 0.5 wt.%.
Figure 6.
Log-log plot of (G') as a function of (G'') of poly(styrene-co-acrylonitrile) P(S:AN) solutions: (a) 0:100, (b) 20:80, (c) 40:60 and (d) 50:50 wt.%:wt.% with 10 wt.% of solids and different CNT–sponges contents: (■) 0.1 wt.%, (•) 0.3 wt.% and (▲) 0.5 wt.%.
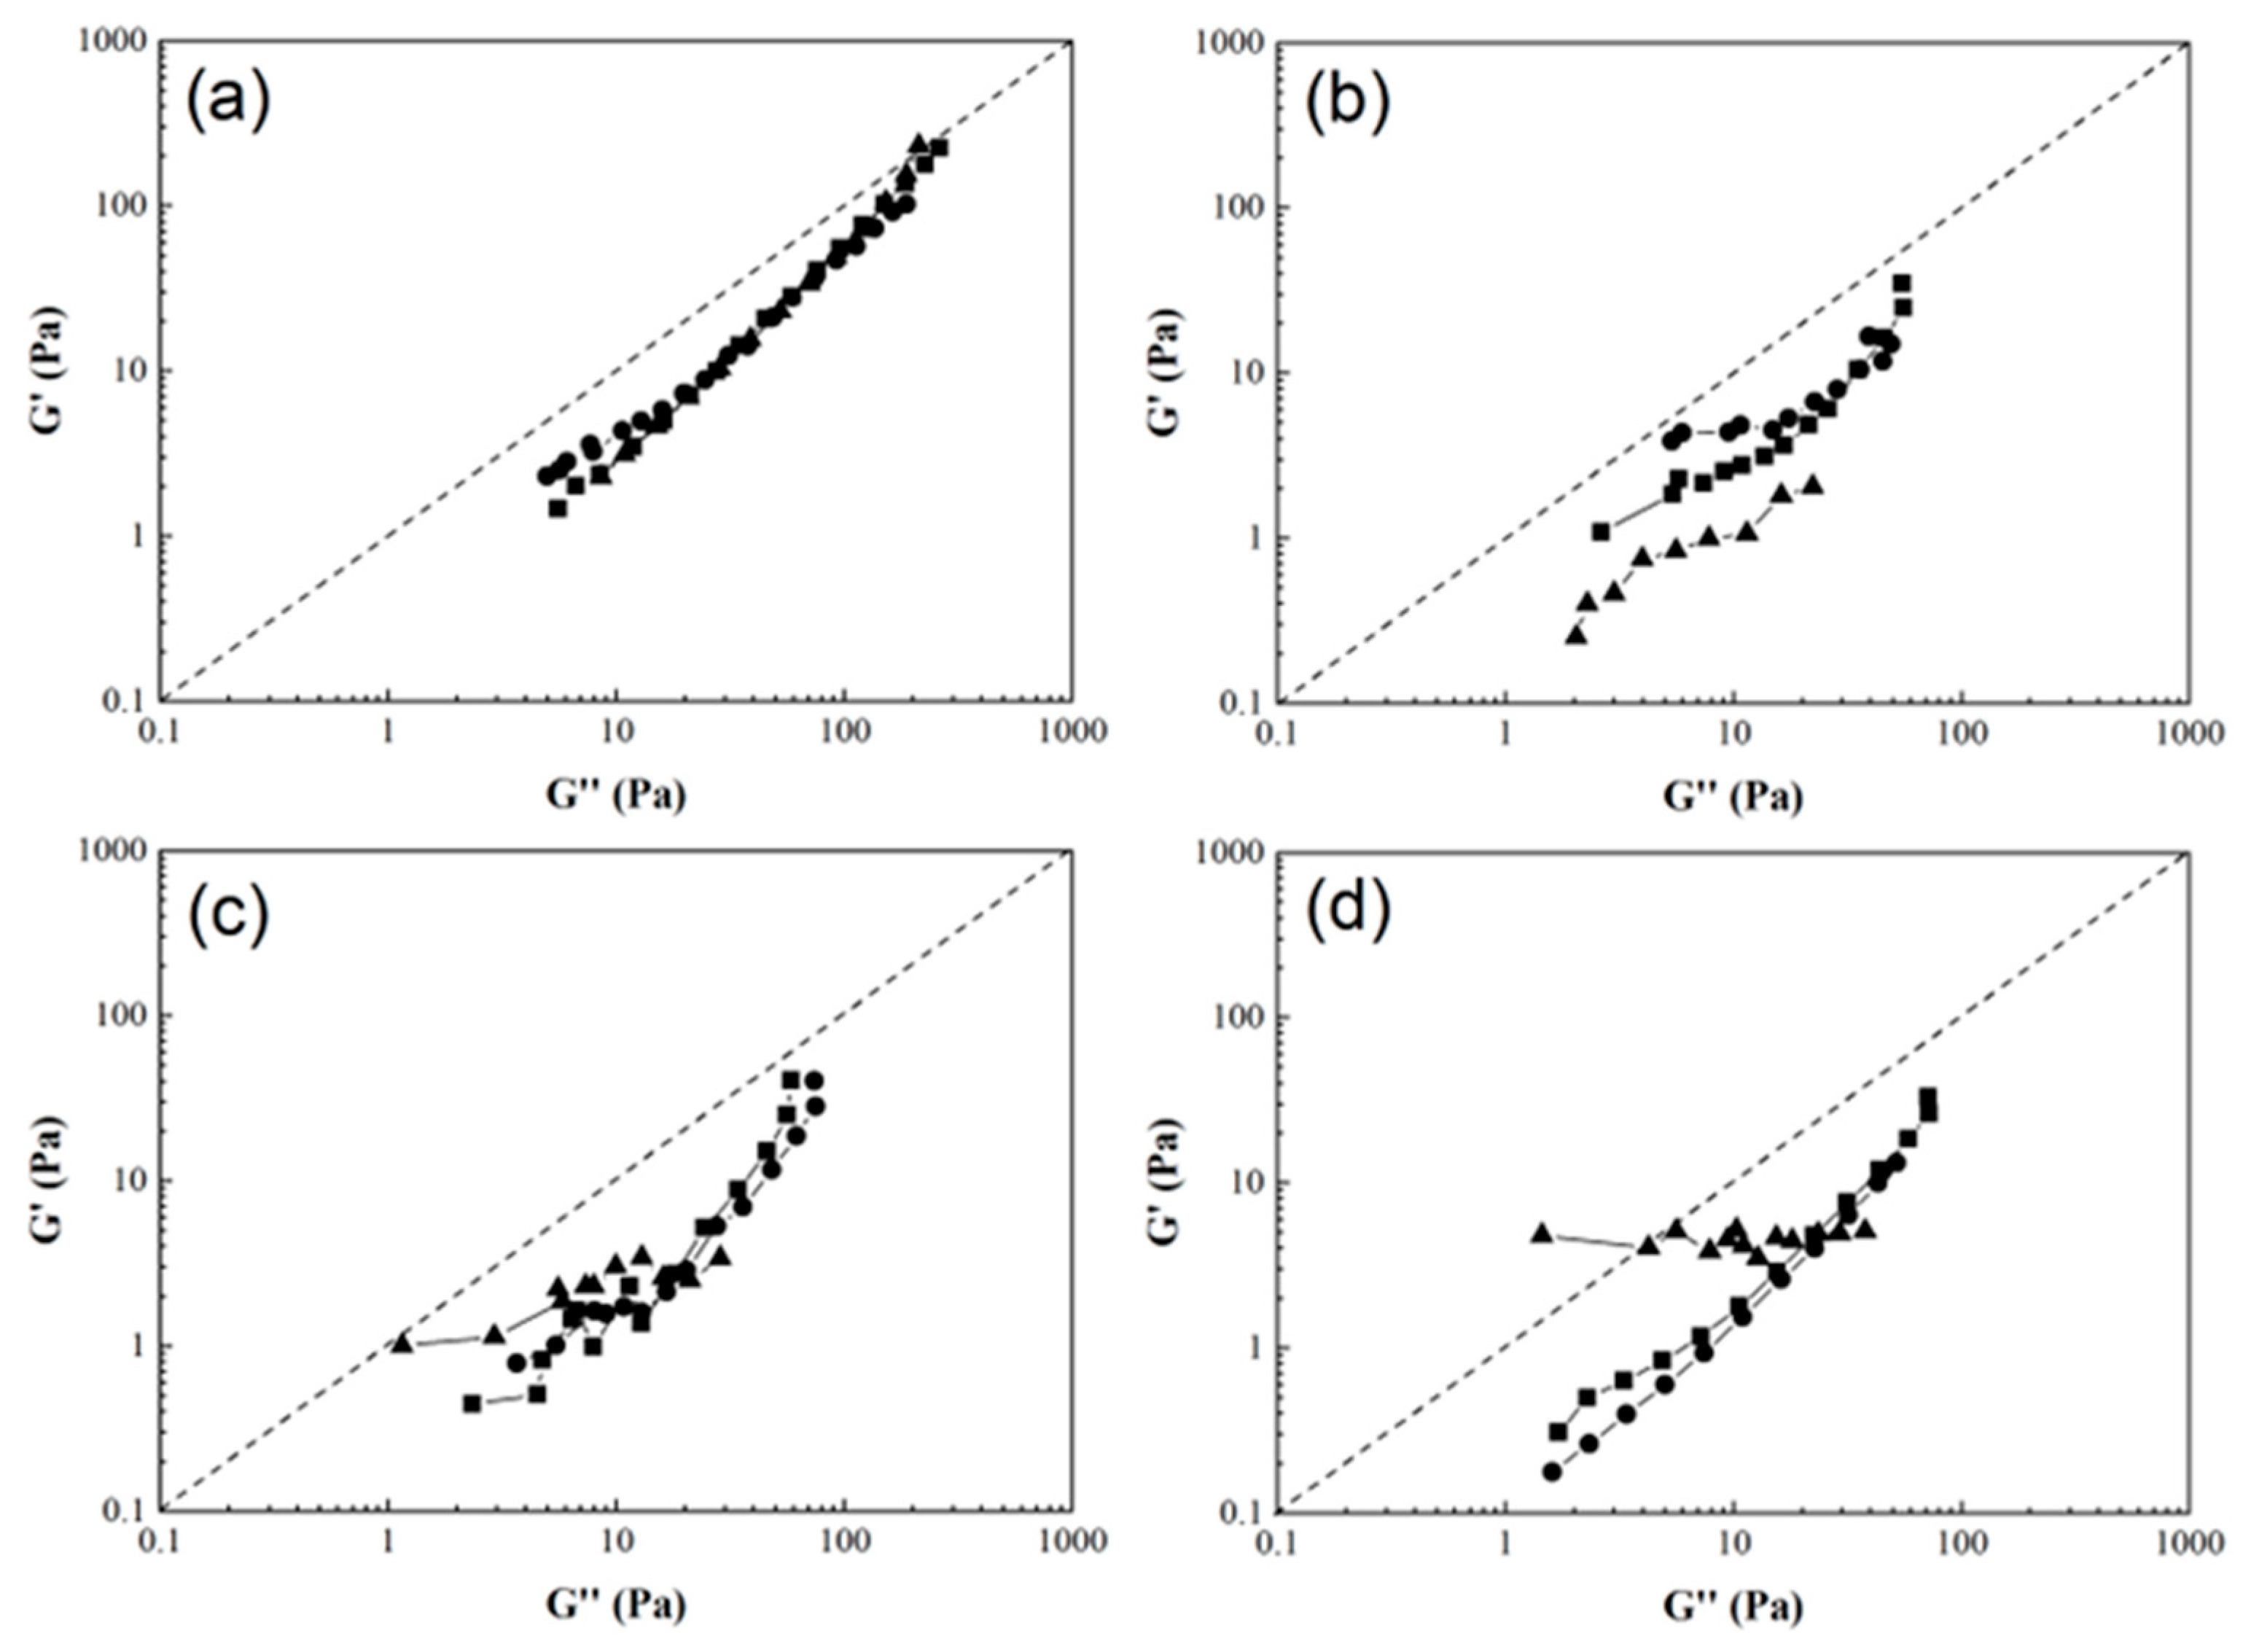
Figure 7.
Loss factor (tan δ) as a function of frequency (ω) for poly(styrene-co-acrylonitrile) P(S:AN) solutions: (a) 0:100, (b) 20:80, (c) 40:60 and (d) 50:50 wt.%:wt.% with 10 wt.% of solids and different CNT–sponges contents: (■) 0.1 wt.%, (•) 0.3 wt.% and (▲) 0.5 wt.%.
Figure 7.
Loss factor (tan δ) as a function of frequency (ω) for poly(styrene-co-acrylonitrile) P(S:AN) solutions: (a) 0:100, (b) 20:80, (c) 40:60 and (d) 50:50 wt.%:wt.% with 10 wt.% of solids and different CNT–sponges contents: (■) 0.1 wt.%, (•) 0.3 wt.% and (▲) 0.5 wt.%.
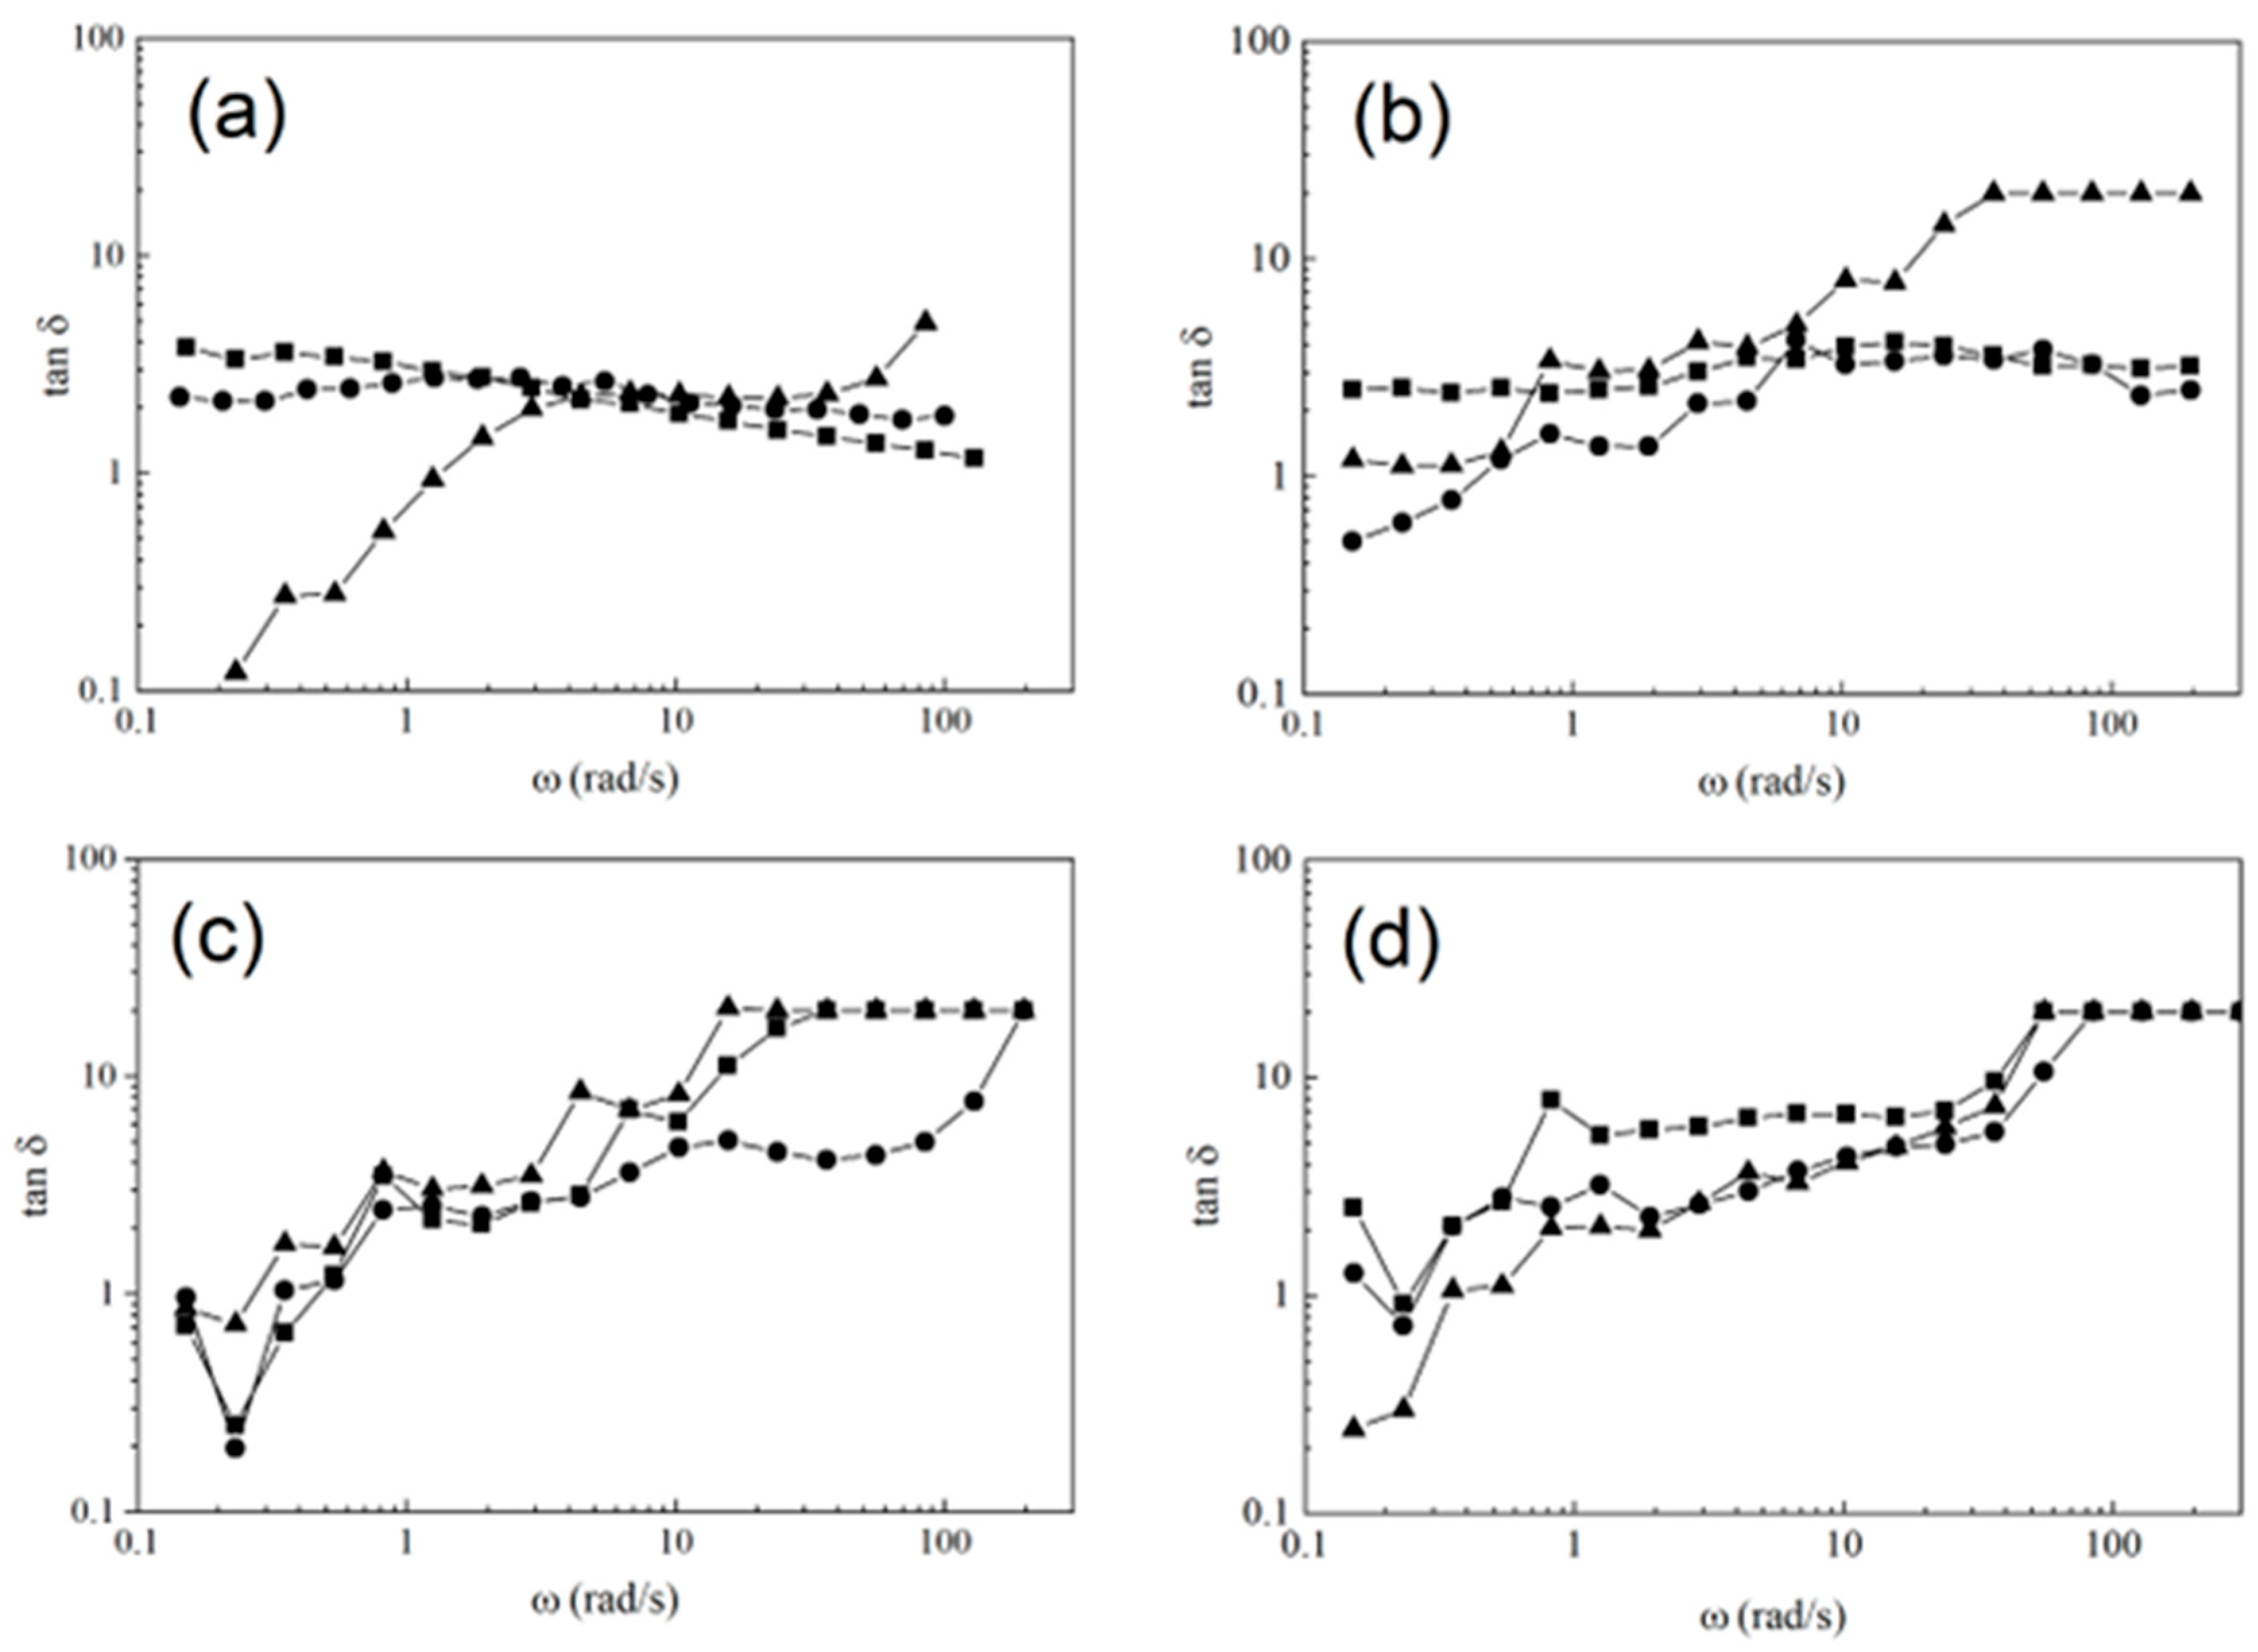
Figure 8.
SEM micrographs of fibers at different P(S:AN) and CNT–sponges concentrations: (a) SAN1.1, (b) SAN3.1, (c) SAN5.1, (d) SAN1.4, (e) SAN3.4 and (f) SAN5.4.
Figure 8.
SEM micrographs of fibers at different P(S:AN) and CNT–sponges concentrations: (a) SAN1.1, (b) SAN3.1, (c) SAN5.1, (d) SAN1.4, (e) SAN3.4 and (f) SAN5.4.
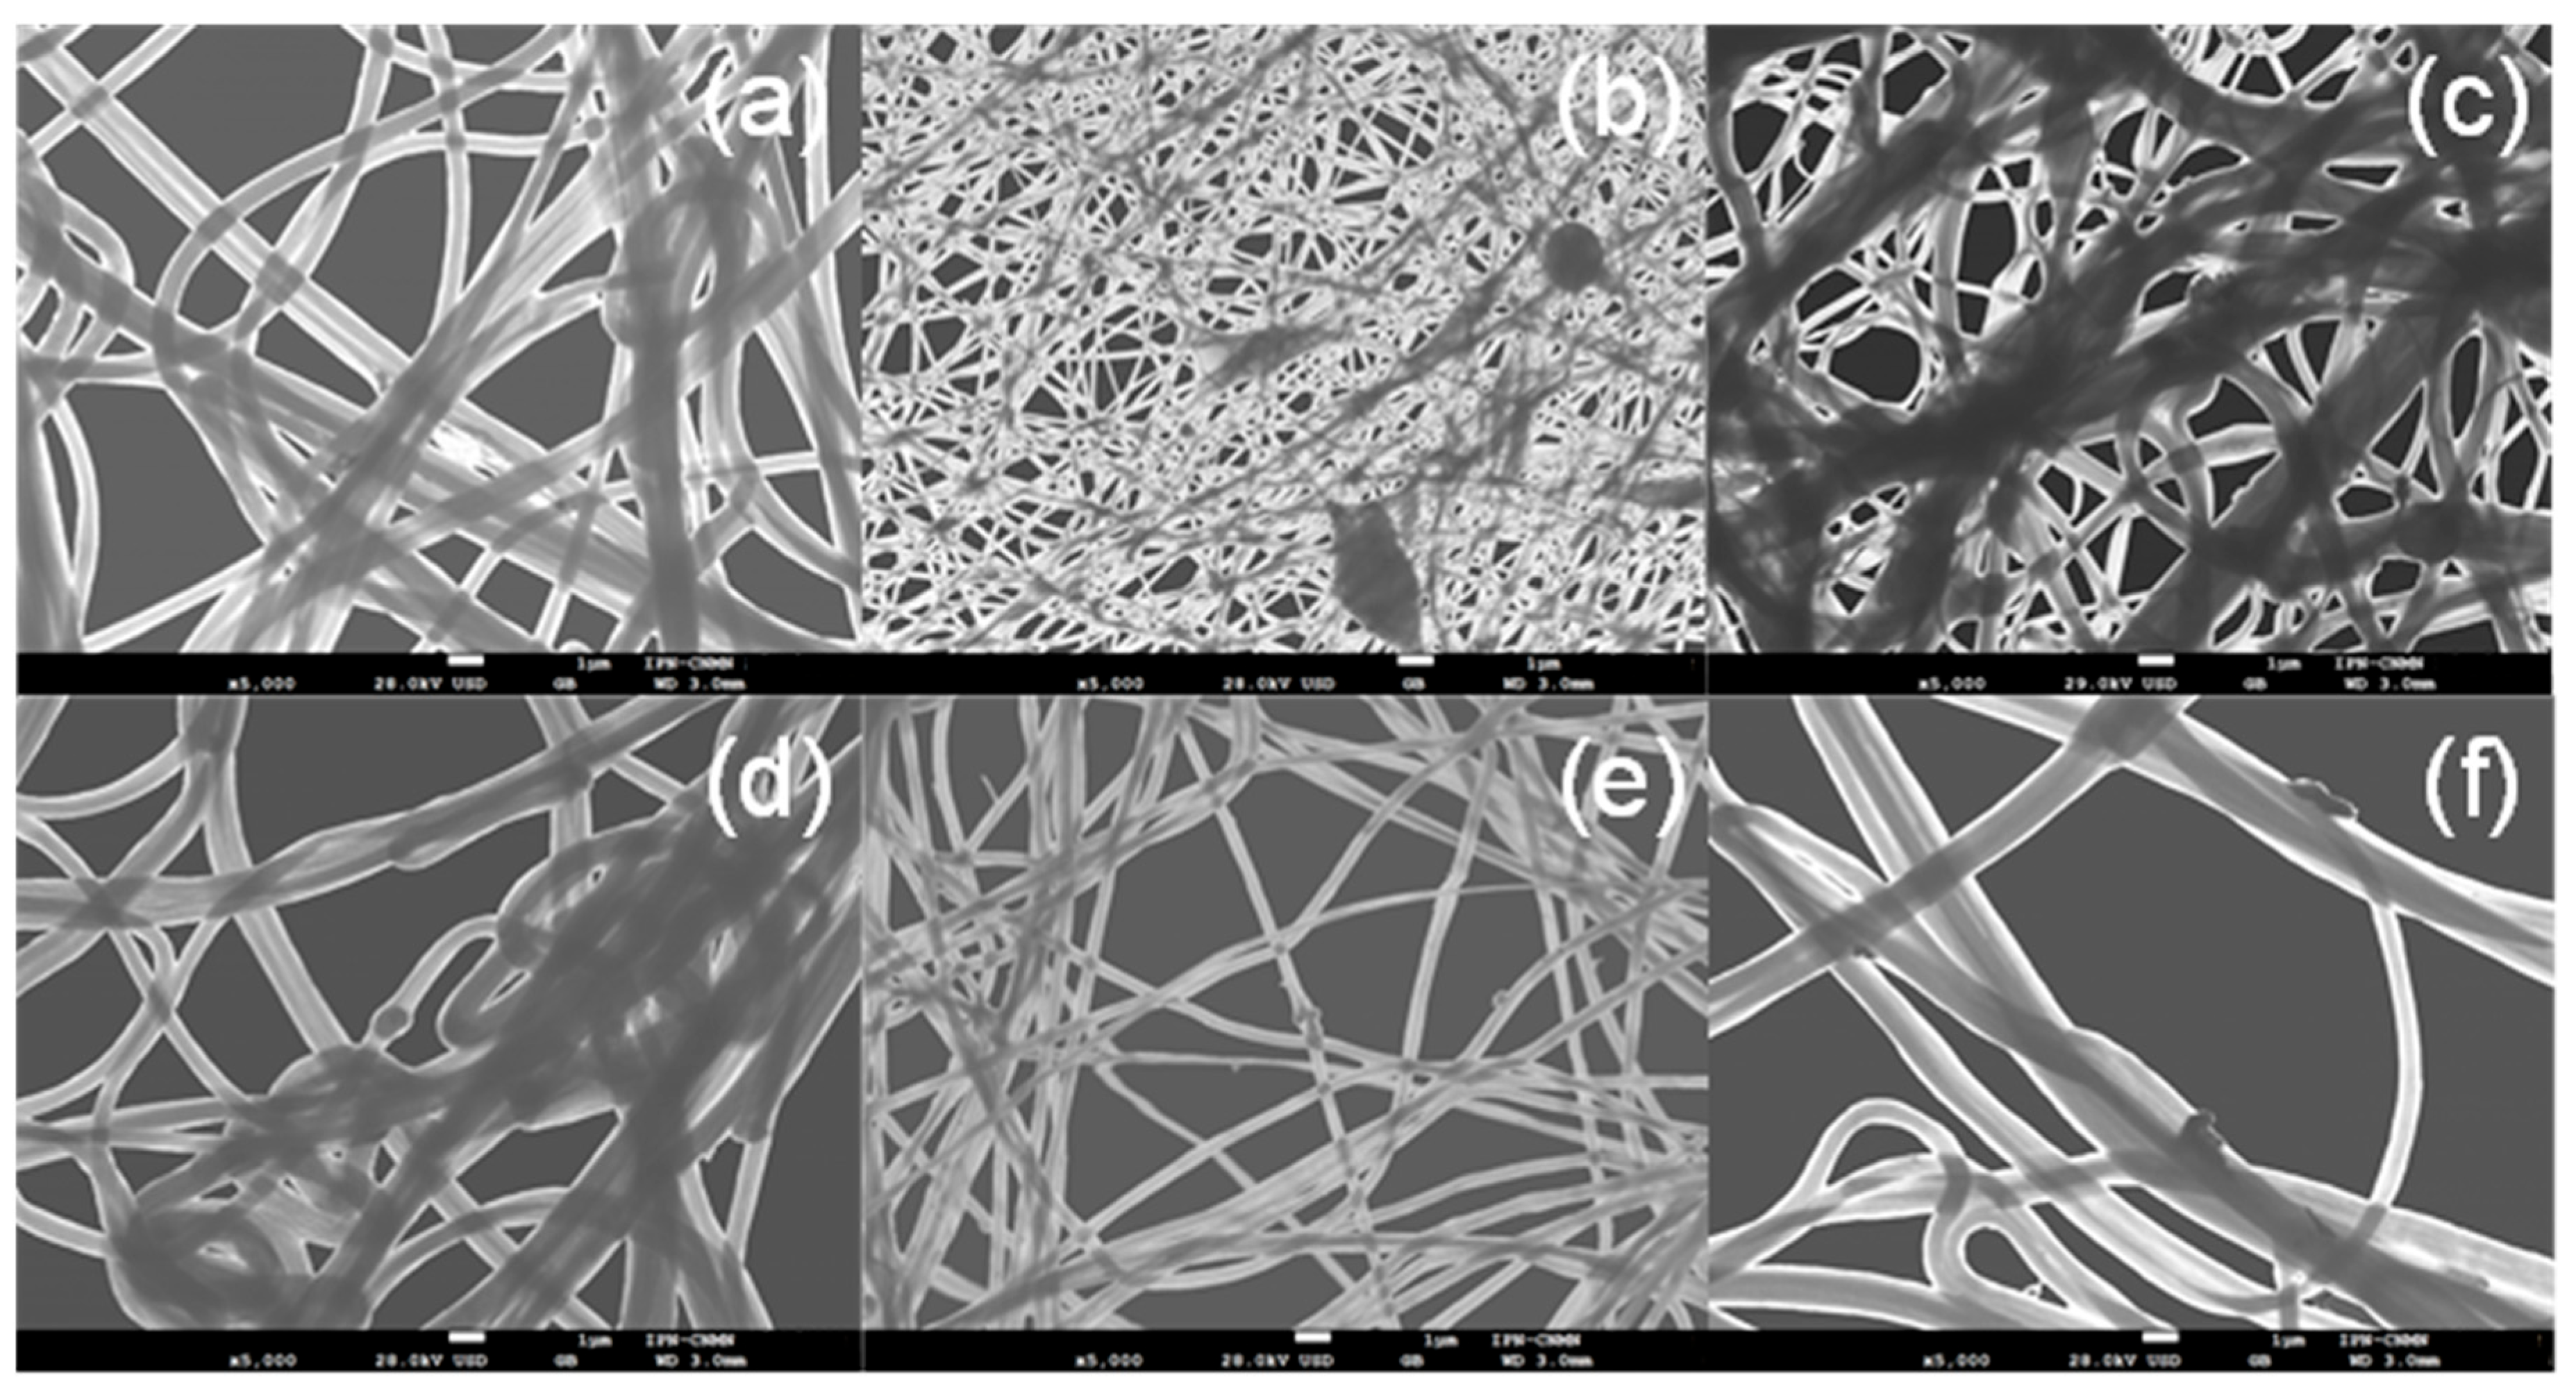

Table 1.
Contents of polymer and CNT–sponges in the polymeric composites solutions.
| CNT-sponges 0.1 wt.% |
CNT-sponges 0.3 wt.% |
CNT-sponges 0.5 wt.% |
|||
|---|---|---|---|---|---|
| Code | P(S:AN)1 | Code | P(S:AN)1 | Code | P(S:AN)1 |
| SAN1.1 | 0:100 | SAN3.1 | 0:100 | SAN5.1 | 0:100 |
| SAN1.2 | 20:80 | SAN3.2 | 20:80 | SAN5.2 | 20:80 |
| SAN1.3 | 40:60 | SAN3.3 | 40:60 | SAN5.3 | 40:60 |
| SAN1.4 | 50:50 | SAN3.4 | 50:50 | SAN5.4 | 50:50 |
1P(S:AN) wt.%:wt.%
Disclaimer/Publisher’s Note: The statements, opinions and data contained in all publications are solely those of the individual author(s) and contributor(s) and not of MDPI and/or the editor(s). MDPI and/or the editor(s) disclaim responsibility for any injury to people or property resulting from any ideas, methods, instructions or products referred to in the content. |
© 2025 by the authors. Licensee MDPI, Basel, Switzerland. This article is an open access article distributed under the terms and conditions of the Creative Commons Attribution (CC BY) license (http://creativecommons.org/licenses/by/4.0/).
Copyright: This open access article is published under a Creative Commons CC BY 4.0 license, which permit the free download, distribution, and reuse, provided that the author and preprint are cited in any reuse.


