Submitted:
07 June 2025
Posted:
09 June 2025
You are already at the latest version
Abstract
Bamboo and wood landscape bridges are increasingly becoming an important component of achieving sustainable green buildings. Currently, the aesthetic analysis process in landscape bridge design still faces key issues such as strong subjectivity and difficulty in quantification. To address the key aesthetic issues in bridge landscape design, this article takes bamboo and wood landscape bridges as the research object. Based on the analysis of the connotation concept of bamboo and wood landscape bridges, a quantitative approach to aesthetic characteristic analysis indicators is proposed, and further research is conducted on the correlation between the objective attributes and subjective evaluation of bamboo and wood landscape bridges. Firstly, a conceptual analysis is conducted on bamboo and wood landscape bridges, laying a theoretical foundation for the sub-sequent selection of quantitative indicators for the aesthetic characteristics of bamboo and wood landscape bridges and the integration of subjective and objective evaluation. Secondly, propose aesthetic evaluation indicators and quantitative analysis methods for bamboo and wood landscape bridges. Based on the essential characteristics of bamboo and wood landscape bridges, select five main evaluation indicators that reflect the aesthetic characteristics of bamboo and wood landscape bridges at the "landscape" level Using the SD method to conduct subjective evaluation of the aes-thetics of bamboo and wood landscape bridges, and evaluating the average aesthetic tendency of the test population towards bamboo and wood landscape bridges. Finally, conduct research on the correlation between objective attributes and subjective evaluations of the aesthetic characteristics of bamboo and wood landscape bridges. By combining the subjective and objective evaluation methods with quantitative indicator calculations, the relationship between the objective attributes and subjective cognition of the aesthetic characteristics of bamboo and wood landscape bridges is revealed. From the perspective of qualitative and quantitative integration, a bamboo and wood landscape bridge aesthetic evaluation system is constructed, which can provide reference for the design and evaluation of bamboo and wood landscape bridges.
Keywords:
landscape bridge
; Aesthetic analysis
; Bamboo and wood structure
; Conceptual analysis
; compu-tational aesthetics
1. Introduction
Today, as a national development strategy of Chinese path to modernization, the construction of beautiful China is committed to improving the people’s living environment and quality of life, and achieving green and low-carbon development. Strengthening the construction of high-quality green buildings is an important link to achieve carbon neutrality and create a beautiful China. Bamboo wood structure bridges will certainly become an important part of sustainable high-tech development buildings [1,2,3]. How to improve the landscape quality of bamboo and wood landscape bridges, strengthen the scientificity and rationality of their landscape design, is also a part of promoting the development of bridge aesthetics and meeting the needs of people for a better life [4,5,6,7].
At present, there are common problems in the aesthetic design process of bridges, mainly including: (1) the convergence of landscape design of bridges. There is a serious tendency towards homogenization in the landscape design of numerous bridges, which fails to fully showcase regional cultural characteristics. Except for a few landscape bridges with unique styles, most bridges are difficult to identify the essential differences between them [8]. (2) Visual landscape fragmentation. In the current design of some newly-built landscape bridges, the harmonious integration with the surrounding visual environment is often not properly handled, resulting in the fragmentation of the visual landscape, the destruction of the original regional characteristics, and the weakening of the public’s spatial recognition and emotional resonance of the environment. Although some newly built bridges have their own characteristics, from the overall visual effect, they present a chaotic and disorderly state, failing to shape a coordinated and unified visual image [9]. (3) As a multidisciplinary engineering practice, the core contradiction of bridge design lies in the dialectical relationship between structural mechanics requirements and aesthetic value pursuit. In contemporary engineering practice, structural engineers and architects often face collaborative design challenges due to differences in professional perspectives: the former may overly emphasize structural rationality, leading to architectural form being trapped in technical determinism; The latter may fall into the trap of formalism, placing visual expression above engineering logic and causing a disconnect between form and function [10]. Breaking through traditional professional barriers and establishing an integrated design method that combines structural logic and artistic thinking has become a key path to promote innovative development of bridges [11].
In recent years, the construction of landscape bridges has shown a trend of coordinated development of functionality, aesthetics, and ecology [12]. In terms of design, emphasis is placed on integrating regional cultural symbols and digital technology applications. In terms of eco-friendly technology, recycled materials, vegetation integration design, and rainwater management systems are adopted to reduce ecological interference. Intelligent monitoring and modular construction technology have improved engineering efficiency and sustainability, but some projects still face issues such as ecological impact, high maintenance costs, and cultural expression homogenization.
The aesthetic potential of bamboo and wood materials stems from their dual characteristics of natural properties and cultural symbolism [13,14]. On a physical level, the vertical texture, bamboo knot rhythm, and cross-sectional texture of bamboo and wood form unique visual symbols. For example, Colombian designer Simon Velez’s umbrella shaped bamboo bridge is constructed with overlapping coarse bamboo, blending modern style with Inca cultural symbols and becoming a landmark building. At the cultural level, bamboo symbolizes the philosophical conception of “empty arms as bones” in traditional Chinese culture. In modern design, this metaphor can be strengthened through parametric techniques, such as the Taoran Art Park Bamboo Bridge, which combines steel structure skeleton with bamboo skin weaving to achieve the aesthetic expression of “coexistence of rigidity and flexibility”. The principles of proportion coordination (golden ratio 0.618) and form order (symmetry and rhythm) in bridge aesthetics are particularly prominent in bamboo and wood structures.
Landscape bridge aesthetics is an independent discipline that integrates philosophical speculation, structural rationality, and artistic expression, forming a multidimensional research paradigm that balances structural logic, humanistic philosophy, and interdisciplinary innovation [15]. Bridge aesthetics has gradually established an interdisciplinary theoretical framework, which not only deconstructs the origin of aesthetics based on philosophical speculation, but also breaks through the boundary between engineering and art through the concept of “structural art”. Its development reflects the unremitting pursuit of the synergistic sublimation of technical rationality and humanistic value in bridge construction.
The aesthetic design criteria for landscape bridges are systematic principles and norms that guide landscape bridges to achieve the coordination and unity of artistic aesthetic value and environment while meeting functional and structural requirements [16]. The development of aesthetic design criteria for landscape bridges is essentially a deepening of people’s understanding of the relationship between “engineering and art”. Although aesthetic design and night lighting systems have become important considerations for large urban bridges in contemporary bridge engineering, there are still significant misconceptions in design practice [17].
The quantitative method for aesthetic evaluation of bridge landscapes is to construct a scientific indicator system and mathematical model, transforming subjective aesthetic feelings into measurable and comparable objective data, thereby achieving a systematic evaluation of the aesthetic value of bridge landscapes. The research on quantitative methods for aesthetic evaluation of bridge landscapes covers multiple dimensions such as modern technology and interdisciplinary exploration, presenting the characteristics of interdisciplinary and technological integration [18].
In summary, significant progress has been made in the theoretical construction, design criteria, and evaluation methods of landscape bridge research. Domestic and foreign scholars have explored the form, function, and ecological coordination mechanism of bridges from multiple dimensions of philosophy, aesthetics, and engineering technology, forming various formal rules and theoretical systems of structural art aesthetics. With the help of BIM technology, ecological materials, and quantitative evaluation models, intelligent design and scientific evaluation have been promoted. However, research still faces bottlenecks such as insufficient quantification of aesthetic characteristics of bamboo and wood materials, homogenization of regional cultural expression, disconnection between practice and theory (such as the phenomenon of “pseudo bridge type”), and fragmented evaluation standards. In the future, it is necessary to deepen the construction of a multidisciplinary collaborative design and periodic dynamic evaluation system, empower the integration of “function ecology humanity” values with digital technology, and promote the upgrading of landscape bridges from engineering construction to aesthetic creation.
This article takes bamboo and wood landscape bridges as the research object. Based on the establishment of the conceptual system of bamboo and wood landscape bridges using conceptual logical analysis method, the aesthetic characteristics of bamboo and wood landscape bridges are taken as the core. From the perspectives of objective attributes, subjective cognition, and the coupling correlation between subjectivity and objectivity, a qualitative and quantitative integrated approach is adopted to study the aesthetic characteristics of bamboo and wood landscape bridges. Firstly, starting from the inherent properties of bridges, the concept of bamboo wood structural landscape bridges is established by integrating landscape characteristics and the material carrier of bridge construction materials, namely bamboo and wood elements. Then, based on the objective attributes of bamboo wood landscape bridges, qualitative analysis methods are used to screen the main aesthetic indicators through logical reasoning, and corresponding quantitative calculation expressions are established. Next, the subjective cognitive patterns of bamboo and wood landscape bridges were studied through a survey questionnaire, and the reliability and validity of the survey results were analyzed. Then, taking representative bamboo and wood landscape bridges as a case study, the subjective and objective correlation of aesthetic characteristics of bamboo and wood landscape bridges is explored, revealing the laws of aesthetic characteristics of bamboo and wood landscape bridges, and proposing strategic reference suggestions for the design and evaluation process of bamboo and wood landscape bridges.
2. Conceptual Analysis
2.1. Bridge Functional Performance
Bridges, as buildings for cars, trains, pedestrians, and other vehicles to cross obstacles such as rivers, bays, lakes, valleys, or other routes, carry important transportation functions. The main function of a bridge is to ensure the continuity of traffic, allowing pedestrians, vehicles, and other modes of transportation to pass through obstacles smoothly. As a structure that crosses obstacles, the functionality of bridges is undoubtedly paramount, and on this basis, the psychological implications contained in bridges reflect people’s desire to establish a communication attribute between two things, expressing the beautiful wish to cross from one shore to the other.
Landscape plays a key role in the design of bamboo and wood landscape bridge systems. Following the functionality of bridge structures, landscape elements have become the key shaping force that endows bamboo and wood landscape bridges with unique charm and artistic value. Different from conventional transportation bridges, landscape bridges aim to integrate into the surrounding ecological system and become a guide for visual center and spatial experience. From a visual presentation perspective, landscape is the core shaper of form. It incorporates smooth curves and varied geometric forms into the exterior design of bridges based on the aesthetic principles of art and design, giving bamboo and wood landscape bridges a distinct and highly attractive visual identity. In terms of spatial layout, the landscape is ingeniously divided and organized to create a step by step and scenery by step effect. Therefore, landscape, as a form endower in the bamboo and wood landscape bridge system, is a key promoter of visual presentation, spatial experience, and environmental integration, endowing bridges with unique artistic vitality.
2.2. Landscape Comprehensive Performance
Bridges, spanning structures, primarily serve the purpose of passage and crossing over them, providing a brief stay. However, with the development of modern cities to this day, people, while passing through bridges, also want to stand on the bridge and enjoy the scenery in their leisure time, and those who observe from afar also want to see the scenery of the bridge. So, there must be an emotional resonance between this bridge and the person. From a scientific perspective, landscape bridges have the rationality of engineering structural stress; In terms of artistic attributes, landscape bridges possess visual sensory qualities of geometric forms; From a humanistic perspective, landscape bridges possess a cultural imagery of romantic sentiment. So, an outstanding landscape bridge should be the unity of science, art, and humanities, that is, the trinity of “force form meaning”.
The traditional classification of bridge stress is based on pure mechanical principles, aiming to clearly analyze the internal force transmission and bearing capacity of bridges when subjected to loads. However, the core value of landscape bridges lies not only in their mechanical performance, but also in their harmonious coexistence with the surrounding environment as landscape elements and their visual impact on people. Therefore, simple force classification cannot fully cover the uniqueness of landscape bridges in design and function, which requires a new perspective, namely the concept of combining force and shape, for classification.
There are significant differences between landscape bridge classification and traditional bridge classification, and traditional bridge force classification cannot be used to classify landscape bridges. Instead, landscape bridges should be classified based on their logical attributes from the perspective of structural form (mainly including beam form, arch form, cable-stayed form, and suspension form) based on the concept of force form combination.
2.3. Classification of Landscape Bridges
The classification of landscape bridges adopts the concept of combining force and shape, and is classified according to the “form force bridge”. The unity of the external shape and internal and external forces of landscape bridges is that form comes first, force comes back, and falls on the bridge. The classification concept of “Xingli Bridge” emphasizes the organic unity of the external shape and internal force of landscape bridges. Placing shape first highlights the importance of landscape bridges in visual presentation and environmental integration, while force is the foundation that supports the stable existence of bridges. The two are interrelated and ultimately focus on the overall structure of the bridge. This classification method aims to comprehensively understand and divide landscape bridges, surpassing the limitations of traditional classification based solely on force or a single external factor.

Table 1.
Landscape Bridge Classification.
| Force | Beam | Arch | Cable-stayed | Suspension | Non-crossing |
| Form | |||||
| Beam | Beam bridge | Beam-arch bridge | Beam cable-stayed bridge | Beam suspension bridge | Decorative beam bridge |
| Arch | Arch-beam bridge | Arch | Arch cable-stayed bridge | Arch suspension bridge | Decorative arch bridge |
| Cable-Stayed | Cable-stayed beam bridge | Cable-stayed arch bridge | Cable-stayed bridge |
Cable-stayed suspension bridge | Decorative cable-stayed bridge |
| suspension | Suspenison beam bridge | Suspension arch bridge | Suspension cable-stayed bridge | Suspension | Decorative suspension bridge |
| Non-crossing | Decorative beam bridge | Decorative arch bridge | Decorative cable-stayed bridge | Decorative suspension bridge | Decorative Landscape bridge |
The crossing structure is the main part of a bridge, whose main function is to cross obstacles and support traffic flow. To bear the main load, special structural forms such as suspension bridges, arch bridges, and beam bridges may be used to meet the requirements of crossing.
Non-spanning structures are not the main structure of bridges and do not bear the main load. Its structural forms may be more diverse and not limited to crossing specific obstacles. The design of its form is entirely for decoration, and this form of decoration that is completely separated from the load-bearing capacity of the bridge is a new trend in urban landscape bridges in recent years.
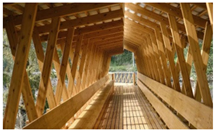
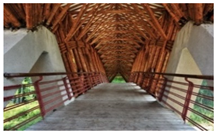
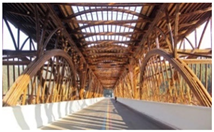
Most bamboo and wood landscape bridges are mainly composed of beam bridges and arch bridges. Arched force beams are a type of bridge structure that combines the characteristics of arch bridges and beam bridges. In the design and construction of such bridges, the superior load-bearing performance and aesthetic appeal of arches are considered, as well as the crossing capacity of beams, thus forming an efficient and stable bridge type. As shown in Figure 1 below.
3. Objective Attributes of Bamboo and Wood Landscape Bridges
3.1. Indicator Selecting
The aesthetic evaluation of bamboo and wood landscape bridges is based on the selection of pedestrian visual features from five aspects: natural ecology, coordination and unity, scale and proportion, color, and visual transparency. This is because the comprehensive effects of the bamboo and wood material characteristics, environmental adaptation requirements, and human visual perception laws of bamboo and wood landscape bridges are considered. These five aspects not only follow the basic principles of landscape design, but also make adaptive adjustments to the special characteristics of bamboo and wood materials, which can be seen in Table 2.
3.2. Indicator Calculation
Based on the analysis and screening of the influencing factors of aesthetic evaluation of bamboo and wood landscape bridges mentioned above, five qualitative indicators have been determined for research. Therefore, quantitative indicators for aesthetic evaluation of bamboo and wood landscape bridges are analyzed and quantified from five aspects: natural ecology, coordination and unity, scale and proportion, color, and visual transparency.
3.2.1. Visual Proportion of Bamboo and Wood Elements
The visual proportion of bamboo and wood elements refers to the proportion of bamboo, wood materials or their textures, colors, etc. in the visual aspect of bridges. It can be used as an auxiliary indicator to measure the natural ecology of landscape bridges. Due to the direct correlation of natural perception, the natural textures, colors of bamboo and wood materials have a natural visual coordination with natural landscapes such as forests, water bodies, and mountains. The proportion of high bamboo and wood visual elements (such as bamboo railings and wooden bridge decks) can intuitively convey the perception of “ecological friendliness” and enhance the harmony between bridges and the environment. Moreover, as a renewable material, the use of bamboo and wood implies a low-carbon and environmentally friendly concept. A high visual proportion may reflect the designer’s emphasis on ecological materials, indirectly reflecting the project’s pursuit of sustainability. The visual proportion of bamboo and wood elements is calculated by the ratio of the pixel count of bamboo and wood elements to the total area of the bridge body. The calculation formula is as follows:
In the formula: is pixel area of bamboo and wood material, is total area of bridge body area.
Using Python programming language to calculate the visual proportion of bamboo and wood elements in bridge images, the operation method is to read in the image and interact with the user. Left click to select multiple points to mark the bridge area, right-click to close these points and form a polygon to represent the bridge area. Then, the image is converted to HSV space for easier extraction of bamboo and wood areas based on color range. After color filtering, masks for bamboo and wood are generated, and combined with the masks for the bridge area, the proportion of bamboo and wood areas in the bridge area is calculated. Finally, the proportion of bamboo and wood in the bridge area is calculated and the results are displayed.
3.2.2. Visual Entropy
Visual entropy is the combination of the concept of information and the characteristics of the human visual system (HVS), used to quantify the level of information complexity and diversity in visual scenes. This theory originated from the concept of thermodynamic entropy, a physical quantity proposed by Rudolf Clausius to describe the disordered state of a system [19], and has now been extended to research in the field of image cognitive science. In landscape perception evaluation, the level of visual entropy directly reflects the richness of scene elements and the complexity of their spatial organization [20], where an increase in element types typically leads to a significant increase in visual information content. With the breakthrough of digital image processing technology, calculation methods based on real-life images have become the mainstream research approach. This method of evaluating landscapes using real-life photos has been widely recognized by the psychophysics school and has high reliability and validity [21]. This article calculates the total information in an image through visual analysis, and the calculation formula is derived from the Shannon diversity index. Generally, the more types of elements, the more complex the visual perception, and the higher the visual entropy. The calculation formula is as follows.
where, is the pixel count of the i-th element in each photo.
Selecting visual entropy to reflect the unity between bamboo and wood landscape bridges and the surrounding environment, visual entropy can explain the order of environmental information, and its correlation with subjective visual perception has been confirmed. When observers come into contact with landscape scenes, their visual system completes the overall recognition of complex elements in the pre attention stage. This cognitive feature is manifested as a filtering mechanism for detailed information such as color composition, morphological features, and environmental elements, retaining only the most recognizable contour features and key overall information, while ignoring a large number of visual details. This cognitive characteristic determines that the evaluation of landscape coordination and unity should focus on the overall order of the system rather than the local effects of micro elements. The principle of measuring visual entropy is that when the composition of landscape elements presents highly isomorphic and serialized features, the system exhibits a low entropy state; On the contrary, when the heterogeneity of elements increases and the unity decreases, it leads to an increase in entropy value, which provides an objective basis for the evaluation of landscape visual coordination and unity.
The quantitative analysis of image visual entropy can be implemented through MATLAB programming, and its calculation process mainly consists of four steps: first, import the digital image file and perform color space conversion to convert it into a single channel grayscale image; Next, analyze the distribution characteristics of pixel intensity and construct a normalized grayscale histogram; Then calculate the frequency of each gray level appearing in the entire image and use it as the corresponding probability value; Finally, a mathematical model was established based on Shannon entropy theory, and the entropy value representing the complexity of image information was obtained by probability weighted summation.
3.2.3. Proportionality
Proportionality is a measure of the aesthetic beauty of the proportion of landscape bridge form elements, and its essence lies in the harmony of the proportion relationship between components. Although aesthetic standards have dynamically evolved with the changing times and cultural differences, some classic proportion models have always maintained wide applicability. Empirical research has shown that specific numerical relationships such as 1:1, 1:1.414, 1:1.618, 1:1.732, and 1:2 exhibit stable aesthetic value in cross-cultural design. These benchmark ratios continue to provide theoretical support for modern bridge design through the synergistic effect of mathematical laws and visual effects. The proportionality formula is as follows [22]:
In the formula, is proportionality, and are the difference between the proportion of elements and contour lines and the classical proportion, respectively;and the width and height of element i, respectively; and are the width and height of the contour line, respectively; is the classic proportion.
The optimal proportion of landscape bridges is essentially a dialectical unity of “structural rationality” and “aesthetic sensibility”. In the specific design of bridges, when studying the interrelationships between the overall or local scale and size, it can also be used as a reference, but this must ensure the requirements of mechanics and meet the practical conditions of engineering. After all, bridges are not purely works of art, so structural safety and visual aesthetics need to be taken into account to avoid sacrificing practicality for the pursuit of form. In landscape bridge design, height to span ratio, rise to span ratio, and width to span ratio are key parameters that affect the aesthetic effect of bridges. These ratios not only determine the structural rationality of the bridge, but are also closely related to visual coordination and environmental integration.
The constituent elements of bamboo and wood landscape bridges can be divided into:
(1) Local elements: aspect ratio, aspect ratio, aspect ratio, etc. The height to span ratio of beam bridges is usually 1:15~1:25; The height to span ratio of the main arch of the arch bridge is 1:5~1:8; The width to span ratio is usually 1:3~1:5 [23].
(2) Overall contour: the ratio of contour line width to height. The recommended golden ratio is 1.618:1, 1.732:1, and 2:1 [24].
3.2.4. Color Beauty Value
The color geometry formulation of M-S theory quantitatively describes the hue, saturation, and brightness of colors [25], making it intuitively describe the harmony attribute of colors. It also cites the aesthetic degree formula in George David Birkhoff’s research on symbolic aesthetics [26]:
where, M is beauty value, O is order factor, C is complexity factor.
3.2.5. Sky Opening Width
The visual range of the human eye can be viewed as an irregular pyramid shaped space with the eyeball as the vertex, where a single dimension of visual information corresponds to a specific perspective on the retina. When the observation distance is consistent, the larger the size of the object, the larger the angle of view formed, and the corresponding visual perception effect is more significant [28]. In the study of visual permeability, actual obstructions often present three-dimensional geometric shapes, and the size of their projected area on the retina directly reflects the degree of obstruction of the line of sight. As the research object shifts from one-dimensional visual elements to two-dimensional projection graphics, the traditional perspective concept is no longer suitable for analysis needs, and its theoretical connotation needs to be expanded [29].
In the field of spatial geometry, solid angle is used to describe the spatial angle enclosed by a conical surface. It is defined as: taking the vertex of a cone as the center of the sphere, taking a unit sphere with a radius of 1, the area of the cone cut on the sphere is the value of the solid angle, measured in “solid radians” [30].
The formula for solid angle is:
where, is solid angle, A is the cross-sectional area of a spherical surface by a conical surface,R is spherical Radius.
The spatial openness can be analyzed using a geometric projection model. When ignoring the non-uniform distribution characteristics of human visual sensitivity, the spatial openness of the observation point can be characterized by the solid angle corresponding to the spherical area A formed by the projection of the sky on the visual sphere. According to the knowledge of spatial geometry, the spherical area A of space can be expressed as [31]:
So the solid angle generated by the spherical area is:
In the formula, D is the sky range.
Considering that the vertical field of view of the human eye is 130 ° and the horizontal field of view is 180 °, the solid angle that can be generated by this field of view while keeping the human head still is expressed as:
In the formula, is range of field of view.
So, when a person keeps their head still, the openness of the sky can be expressed as:
The ratio of the projected area of the sky and field of view on a sphere of the same radius.
4. Subjective Attributes of Bamboo and Wood Landscape Bridges
4.1. Survey Questionnaire
Under controllable conditions, the visual evaluations of 10 bamboo and wood landscape bridges at home and abroad were obtained from the subjects in five aspects and overall, namely natural ecology, coordination and unity, scale and proportion, color, and visual transparency. The adjectives used were “extremely poor - excellent”, “messy - unified”, “disordered - coordinated”, “messy - harmonious”, “obscured - transparent”, and the overall evaluation was “poor - good”, which can be seen Table 3.
The application of semantic difference method (SD method) often involves the selection of scale levels. Through literature review, it was found that existing studies generally use the seven level Likert scale as a measurement tool. Based on this, the evaluation system constructed in this study also adopts a seven level evaluation gradient, as shown in Figure 2. The specific scale values are set as: very (-3), very (-2), normal (0), relatively (1), very (2), and very (3), providing reference for more accurate expression.
4.2. Reliability and Validity
The core of questionnaire design is to address issues of reliability and validity. Reliability ensures stable and reproducible data, avoiding random errors; Validity ensures that the questions are accurately directed towards the research objectives, preventing bias and misleading information. The absence of both can lead to data distortion and invalid conclusions. In cross group or long-term research, reliability and validity are the foundation of data comparability and conclusion value, directly determining whether the research can be implemented in practice or promote theoretical breakthroughs.
(1) Reliability
Reliability, as an important indicator in psychometrics, is mainly used to evaluate the reliability of the measurement results of questionnaire tools. This indicator includes two key dimensions: internal consistency validity and time stability validity. The former reflects the degree of synergy between the measurement results of each item within the same scale, while the latter evaluates the persistence of the results obtained through repeated measurements at different time points. In terms of quantitative evaluation, the Cronbach’s Alpha correlation coefficient is usually used to represent this standardized parameter to characterize the reliability of the questionnaire. The calculation formula is Equation (14) , and its numerical range is positively correlated with the reliability level.
In the formula, is the number of questions, is The variance of the score for the i-th question.
(2) Validity
Validity is the core indicator for measuring whether a questionnaire can accurately reflect the target variable, including content validity, construct validity, criterion validity, and surface validity. Through scientific design and multidimensional testing, validity evaluation can ensure the explanatory power of questionnaire data and the credibility of research conclusions. Generally, validity coefficient is used as a measurement indicator and is the basic link for ensuring the quality of empirical research.
The Kaiser Meyer Olkin (KMO) measure and common factor variance are commonly used indicators. The KMO value is used to evaluate whether the data is suitable for factor analysis, and its calculation formula is shown in Equation (15).
In the formula, is the correlation coefficient between variables and , is the partial correlation coefficient between variables and .
4.3. Analysis of Questionnaire Validity
Based on the evaluation questionnaire data of the aesthetic characteristics of bamboo and wood landscape bridges, analyze the multidimensional cognition of the public towards their aesthetic characteristics. By analyzing the validity of the evaluation results, ensure the scientific validity of the research conclusions.
4.3.1. Reliability Analysis
After completing the questionnaire survey, in order to ensure the validity of the questionnaire data, it is necessary to verify and evaluate whether the scale has reproducible stability characteristics through reliability analysis. In statistics, such coherence or stability is mainly determined by calculating the correlation between various measured values, represented by the correlation coefficient Cronbach’s Alpha. Usually, this value is between 0.6-0.8, and in practical applications, it is required to be greater than 0.5, indicating that the questionnaire has good consistency [31].
The Cronbach’s Alpha coefficients of the survey questionnaires for Bridge A to Bridge J are shown in Table 4 below. According to the Cronbach’s Alpha values in Table 4, the vast majority are above 0.6, with an average of 0.640, indicating that the reliability of the questionnaire survey is generally good.
4.3.2. Validity Analysis
Analyze the validity of the survey questionnaire and evaluate the rationality of the questionnaire design. If the KMO value falls within the range of 0.7 to 0.8, it indicates that the data is suitable for extracting information, indirectly reflecting a high validity; If the KMO value is below 0.6, it indicates that the data is not suitable for extracting information, and the validity performance is average. Subsequently, it is necessary to examine the correspondence between the topic and the factors; If the corresponding relationship is consistent with psychological expectations, it indicates that the questionnaire validity is high; If there is insufficient validity, or if the commonality value of a certain analysis item is less than 0.4, relevant items should be considered for exclusion.
The KMO values and common factor variance values of this survey questionnaire are listed in the table below. To measure indicators, a KM0 greater than 0.5 and a common factor of variance greater than 0.4 are usually considered to indicate good validity of the survey questionnaire [32]. The KMO values and common factor variance values of this survey questionnaire are listed in Table 5.
The KMO values of all bridges are above 0.7 (range 0.712~0.768), indicating that the data is suitable for factor analysis and has good construct validity. The common factor variance of most indicators is greater than 0.4, indicating that each item has good explanatory power and validity for the common factor. From the above data, it can be seen that the survey questionnaire has good validity, and its statistical results can reflect the attributes of the measured target well.
4.4. Analysis of Survey Questionnaire Results
A total of 214 valid questionnaire data were collected for evaluation, and multidimensional evaluations were conducted on different bridge images. The research results show that all participants were able to accurately express their evaluations of each bridge image in various aspects, with good reliability and validity. The average values of their indicator evaluations are shown in the following sections.
4.4.1. Natural Ecology
The average subjective evaluation values of natural ecological indicators are shown in Table 6 and Figure 3.
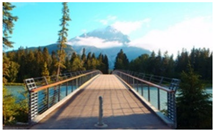
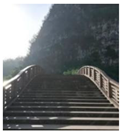
According to the evaluation results, it can be found that the natural ecological evaluation value of Bridge A image is relatively high, while Bridge E has the lowest evaluation value. In the presentation of Bridge A image, it can be seen that the bridge design uses a large amount of wooden materials, giving people a warm and close feeling to nature. The lawn below the bridge and the vegetation on both sides are abundant and have not been damaged due to the construction of the bridge. The concrete slope protection of the bridge bank in the picture of Bridge E may have a certain impact on the natural ecology. The roof of the bridge is not made of natural bamboo and wood materials, and these artificial structures may damage the original natural landscape.
4.4.2. Coordination and Unification
The average subjective evaluation values of coordination and unified indicators are shown in Table 7 and Figure 4.
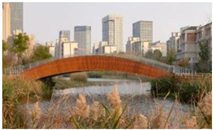
According to the evaluation results, it can be found that the coordination and unity evaluation value of Bridge F image is the highest, while the evaluation value of Bridge I is the lowest. In the presentation of the image, it can be found that the design style of Bridge F is consistent with the surrounding architectural style, adopting a combination of modern and traditional design concepts. The element design complements the warm toned lighting in the background, making the bridge and environment integrated. The red columns and decorative patterns on the eaves of Bridge I have traditional Chinese characteristics, but the modern high-rise buildings in the background create a certain contrast with the traditional style of the bridge, which may feel a bit abrupt.
4.4.3. Scale and Proportion
The average subjective evaluation values of scale and proportion indicators are shown in Table 8 and Figure 5.
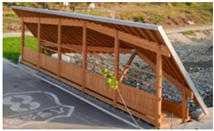
According to the evaluation results, it can be found that the scale and proportion evaluation value of Bridge D image is the highest, while the evaluation value of Bridge J is the lowest. In the image presentation, it can be found that the ratio of the length of Bridge D to the height of the bridge roof gives a sense of stability and balance, and appears more harmonious in proportion. In the picture of Bridge J, it can be observed that the bridge body is relatively long, and the height of the curved roof on the bridge top may appear somewhat unbalanced in proportion to the length of the bridge. The scale and proportion of the bridge may feel somewhat distant.
4.4.4. Color
According to the evaluation results, it can be found that the color evaluation value of Bridge A image is the highest, while Bridge I has the lowest evaluation value. In the presentation of the image, it can be found that Bridge A mainly uses a yellow wood tone, which appears bright but not abrupt against the blue sky and green trees. The yellow bridge appears even brighter in the sunlight, giving people a warm, bright, and peaceful feeling. Bridge I mainly adopts red and black tones, which form a strong contrast with modern buildings such as gray and white buildings around it, which may appear abrupt and incongruous. Although the red and black tones have a certain visual impact, red may give people an overly enthusiastic and tense feeling when used on a large scale.
4.4.5. Visual Transparency
The average subjective evaluation value of visual permeability index is shown in Table 10 and Figure 7.
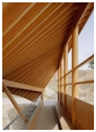
According to the evaluation results, it can be found that the visual permeability evaluation values of bridge G and bridge H images are the highest, while the evaluation values of bridge C, bridge D, and bridge E are low. In the presentation of the images, it can be found that bridge G and bridge H are both open bridge deck spaces, with no other space enclosing and separating them except for pedestrian guardrails on both sides of the bridge deck. There is no top cover above the bridge deck, and the view on the bridge deck is unobstructed. However, bridge C, bridge D, and bridge E are semi open bridge deck spaces with a top cover above the bridge deck, and the spaces on both sides of the bridge deck are partially enclosed, neither completely open nor completely closed. The internal space of the bridge deck and the external space have semi transparency, and the outside scenery is faintly visible, with low visual permeability.
4.4.6. Overall Landscape Aesthetics Evaluation
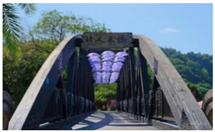
According to the evaluation results, it can be found that the landscape aesthetics of Bridge B and Bridge J are highly evaluated, with a certain artistic and modern design style that is simple and modern. The bridge deck of Bridge B is covered with woven textured materials, forming a harmonious contrast with the surrounding natural environment. The characteristic roof imitates the shape of a buffalo horn with creativity. The aesthetic evaluation of Bridge C is relatively low. Although the double helix roof design is unique and has a certain visual impact, it may give people a heavy and oppressive feeling due to its complex structure, dense spacing between helix roofs, and dark colors.
5. Bamboo and Wood Landscape Bridge Subject Guest Correlation
5.1. Analysis of Indicator Importance
Analyze the importance of various evaluation indicators for the overall aesthetic evaluation of bamboo and wood landscape bridges based on their multidimensional characteristics. Regression analysis is a statistical analysis method used to determine the quantitative relationship between the degree of interdependence between two or more variables. Using the overall landscape aesthetic evaluation (A) as the dependent variable, five dimensions including natural ecology (A1), coordination and unity (A2), scale and proportion (A3), color (A4), and visual transparency (A5) were used as independent variables for multivariate linear regression analysis using SPSS Statistics.
By analyzing the contribution of each indicator evaluation to the overall landscape aesthetic evaluation through standardized regression coefficients, the importance of different evaluation indicators can be revealed. Taking sample bridge A as an example, the weight analysis of the contribution of each sub item evaluation to the overall evaluation is shown in Table 12.
The linear regression expressions for the 10 bridge images are as follows:
Bridge A:A=0.085A1+0.124A2+0.233A3+0.155A4+0.203A5+1.022
Bridge B:A=0.094A1+0.122A2+0.155A3+0.088A4+0.135A5+2.029
Bridge C:A=0.201A1+0.103A2+0.085A3+0.150A4+0.226A5+0.855
Bridge D:A=0.269A1+0.205A2+0.078A3+0.175A4+0.053A5+0.928
Bridge E:A=0.108A1+0.062A2+0.137A3+0.292A4+0.192A5+0.963
Bridge F:A=0.146A1+0.097A2+0.143A3+0.185A4+0.160A5+1.256
Bridge G:A=0.167A1+0.161A2+0.084A3+0.177A4+0.191A5+1.000
Bridge H:A=0.091A1+0.125A2+0.197A3+0.237A4+0.146A5+0.937
Bridge I:A=0.085A1+0.186A2+0.109A3+0.127A4+0.125A5+1.760
Bridge J:A=0.152A1+0.030A2+0.246A3+0.142A4+0.218A5+1.184
The expression for taking the average of each sub coefficient is:
A=0.140A1+0.121A2+0.147A3+0.173A4+0.165A5+1.193
By comprehensively analyzing the weight and numerical differences of indicators, the following conclusions can be drawn:
(1) There is a significant linear correlation between each evaluation index and the overall landscape aesthetic average value;
(2) The importance of each sub indicator in the overall aesthetic evaluation varies depending on the landscape effect of the bridge images, ranging from 0.121 to 0.173 on average. The two indicators of color A4 and visual transparency A5 have a higher impact on the overall aesthetic evaluation of bridge landscapes than other indicators.
5.2. Correlation Between Subjective and Objective Attributes
There is a correlation between the information carrying capacity of environmental factors and an individual’s psychological perception level. To further analyze the quantitative relationship between visual stimuli and subjective evaluation perception in bridge landscape, we will start from the five evaluation index systems mentioned above and study the relationship between subjective and objective functions by expanding the sample size.
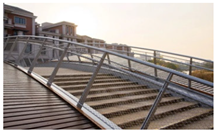
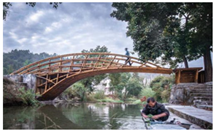
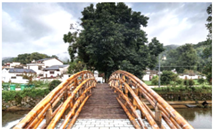
To significantly improve the stability of data, reduce accidental bias, and ensure the statistical significance of research conclusions, a sampling study was conducted on 15 representative bamboo and wood landscape bridges. The 15 bridge samples here include different structural forms, functional types, and regional cultural backgrounds, which can more comprehensively reflect the diversity of bamboo and wood landscape bridges, which can be seen in Table 13.
5.3. Correlation Results
In the process of data analysis, the selection of correlation coefficient needs to be determined according to the data type. Common indicators include Pearson linear correlation coefficient, Spearman rank correlation coefficient, and Kendall rank correlation coefficient. Based on the continuous variable characteristics of this study, SPSS software was used for bivariate correlation testing, and Pearson coefficient was selected as the main analysis method.
(1) Natural ecological analysis
The correlation analysis between the visual proportion of bamboo and wood elements and natural ecological evaluation is shown in Table 14.
According to the analysis of Table 14, the correlation coefficient between the visual proportion of bamboo and wood elements and natural ecological evaluation at the 0.01 level is 0.746, as determined by the bilateral Pearson correlation test, P=0.000, There is a significant positive correlation between the two, and the visual proportion of bamboo and wood elements can reflect and measure the natural ecological level of bamboo and wood landscape bridges. The larger the visual proportion of bamboo and wood elements, the higher the natural ecological level.
(2) Coordination and unification related analysis
The correlation analysis between visual entropy and coordination and unified evaluation values is shown in Table 15.
According to the analysis of Table 15, the correlation coefficient between visual entropy and coordination and unified evaluation values at the 0.01 level is -0.854, as determined by the bilateral Pearson correlation test, P=0.000, There is a significant negative correlation between the two, and the size of visual entropy can reflect and measure the coordination and unity of bamboo and wood landscape bridges. The larger the visual entropy value, the worse the coordination and unity between the bridge and the surrounding environment.
(3) Scale and proportion correlation analysis
The correlation analysis between proportionality, scale, and proportionality evaluation values is shown in Table 16.
According to the analysis of Table 16, the correlation coefficient between proportionality and scale and proportionality evaluation values is 0.869 at the 0.01 level, as determined by the bilateral Pearson correlation test, P=0.000, There is a significant positive correlation between the two, and the degree of proportionality can reflect and measure the scale and proportion of bamboo and wood landscape bridges. The larger the degree of proportionality, the more coordinated the scale of bamboo and wood landscape bridges.
(4) Color related analysis
The correlation analysis between color beauty value and color evaluation value is shown in Table 17.
According to the analysis of Table 17, the correlation coefficient between color beauty value and color evaluation value at the 0.01 level is 0.797 through bilateral Pearson correlation test, P=0.000.There is a significant positive correlation between the two, and the beauty value can reflect and measure whether the colors of bamboo and wood landscape bridges are harmonious. The higher the beauty value, the more harmonious the colors of bamboo and wood landscape bridges are.
(5) Visual Transparency Correlation Analysis
The correlation analysis between sky width and visual permeability evaluation values is shown in Table 18.
According to the analysis of Table 18, the correlation coefficient between sky width and visual permeability evaluation value at the 0.01 level was 0.876 as determined by the bilateral Pearson correlation test, P=0.000. There is a significant positive correlation between the two, and the size of the sky opening can reflect and measure the visual transparency of bamboo and wood landscape bridges. The larger the sky opening value, the wider the field of view of bamboo and wood landscape bridges.
5.4. Correlation Analysis
Based on the theoretical framework of psychophysics, the mathematical relationship model between external visual stimuli and subjective perception is mainly reflected in three functional forms: linear model, logarithmic model, and power function model. SPSS statistical analysis software is used to perform function model fitting tests on experimental data. Through linear regression analysis in the curve estimation method, the fitting of the three types of function models is as follows:
(1) The relationship between the visual proportion of bamboo and wood elements and natural ecological evaluation
On the basis of correlation analysis, further research was conducted on the functional relationship between the visual proportion of bamboo and wood elements and natural ecological evaluation. Table 19 shows the fitting results of linear, logarithmic, and power function models.
According to the data analysis of Figure 9 and Table 19, the linear relationship between the visual proportion of bamboo and wood elements and the natural ecological evaluation value is stronger than the power function relationship, and the strength of the logarithmic function relationship is closer, which can be expressed as:
y=0.008x+0.142
In the formula, y is subjective preference evaluation of the natural ecology of bamboo and wood landscape bridges by the test subjects, x is visual proportion of bamboo and wood elements.
This linear model reflects that for every 1% increase in the proportion of bamboo and wood visual elements, the natural ecological evaluation increases by approximately 0.008 points. This indicates that the visibility of bamboo and wood materials has a quantifiable promoting effect on enhancing the harmony between landscape bridges and the natural environment. However, the slope of the linear relationship is gentle, indicating that the visual proportion of bamboo and wood elements needs to reach a high proportion in order to significantly improve the natural ecological evaluation. It is recommended to prioritize increasing the visual proportion by exposing large areas of bamboo and wood materials and strengthening bamboo texture while balancing structural safety and functionality.
(2) The relationship between visual entropy, coordination, and unified evaluation
On the basis of correlation analysis, further research was conducted on the functional relationship between visual entropy and coordinated unified evaluation. Table 20 shows the fitting results of linear, logarithmic, and power function models.
According to the analysis of the data in Figure 10 and Table 20, the linear relationship between visual entropy and the evaluation values of coordination and unity is stronger than the power function relationship, and is closer to the strength of the logarithmic function relationship. It can be expressed as:
y=7.447-0.92x
In the formula, y is subjective preference evaluation of the subjects for the coordination and unity of bamboo and wood landscape bridges, x is visual entropy.
This linear model reflects a stable linear decreasing relationship between visual entropy x and coordination and unity evaluation y, indicating that the complexity and disorder of landscape elements significantly weaken participants’ perception of the unity between the bridge and the surrounding environment. Therefore, in the design of bamboo and wood landscape bridges, it is recommended to reduce the splicing of heterogeneous materials and prioritize the use of single or similar material combinations dominated by bamboo and wood; Control the contrast between hue and brightness, and weaken visual jumps through adjacent colors or gradient color schemes.
(3) The relationship between color beauty value and color evaluation
On the basis of correlation analysis, further research is conducted on the functional relationship between color beauty values and color evaluation. Table 21 shows the fitting results of linear, logarithmic, and power function models.
According to the analysis of the data in Figure 11 and Table 21, there is a power function relationship between the color beauty value and the color evaluation value, which can be expressed as:
In the formula, y is subjective preference evaluation of the color of bamboo and wood landscape bridges by the test subjects, x is color beauty value.
The model shows a super linear growth relationship between color beauty values and color evaluation values (power exponent b=1.156>1). As the beauty value increases, the speed of color evaluation improvement gradually accelerates, and the beauty value needs to reach a certain threshold to produce a significant improvement in harmony. It is recommended to systematically improve the aesthetic value in the design of bamboo and wood landscape bridges through color saturation control or contrast enhancement with environmental vegetation.
(4) The relationship between sky width and visual transparency evaluation
On the basis of correlation analysis, further research was conducted on the functional relationship between sky width and visual permeability evaluation. Table 22 shows the fitting results of the linear model.
According to the analysis of the data in Figure 12 and Table 22, it can be concluded that there is a linear function relationship between sky width and visual permeability evaluation value, which can be expressed as:
y=0.913x+0.389
In the formula, y is subjective preference evaluation of visual transparency of bamboo and wood landscape bridges by test subjects, x is the width of the sky.
This model reflects a significant positive correlation between sky width and visual transparency evaluation. For every 1 unit increase in sky width, the average visual transparency evaluation improves by nearly 1 point, indicating that the expansion of the sky field of view has a strong amplification effect on visual transparency perception. In the design of bamboo and wood landscape bridges, the influence of sky width should be fully considered, and the sky width should be appropriately increased to enhance the visual transparency and aesthetics of the bridge.
(5) The relationship between proportionality, scale, and proportionality evaluation
On the basis of correlation analysis, further research was conducted on the functional relationship between proportionality, scale, and proportionality evaluation. Table 23 shows the fitting results of linear, logarithmic, and power function models.
According to the analysis of the data in Figure 13 and Table 23, it can be seen that there is a power function relationship stronger than linear and logarithmic relationships between the proportionality and scale and the proportionality evaluation value, which can be expressed as:
This model reflects a super-linear accelerated growth relationship (power exponent b=2.115>1) between proportionality, scale, and proportional evaluation values. With the increase of proportion, the growth rate of bridge scale and proportion evaluation significantly accelerates. The proportional PM is in the range of 0.5-0.7, indicating a low level of evaluation, while in the high proportional range (0.8-1), the evaluation has significantly improved. When the proportional degree PM>0.8, the growth rate of scale and proportional evaluation will significantly accelerate.
Above all, except for the negative linear relationship between visual entropy and the evaluation of coordination and unity of bridges, the increase of the other four objective values (independent variables) has a positive promoting effect on the corresponding subjective evaluation (dependent variable), but the magnitude of the increase varies. And the rate of subjective perception improvement lags behind the changes in objective indicators, indicating that people’s aesthetic cognition has a delayed response characteristic. Regression analysis shows that there is no significant difference in the goodness of fit between linear relationships, power function relationships, and logarithmic function relationships, which may be due to the limited sample size making it difficult to fully reveal the morphological characteristics of the function curve between objective values and their corresponding subjective evaluations. However, the logarithmic relationship of Fechner’s law and the power function relationship of Stevens’ law are almost the same under certain experimental conditions and sample sizes, and can be replaced by each other.
6. Summary and Conclusions
This study reveals the intrinsic relationship between the objective landscape attributes and subjective evaluation preferences of bamboo and wood landscape bridges by constructing a qualitative and quantitative integrated evaluation system. From connotation analysis, indicator screening to data validation analysis, it has expanded the evaluation dimensions of bridge aesthetics and provided decision-making references for the landscape design of bamboo and wood landscape bridges.
(1) In the bamboo and wood landscape bridge system, the bridge is the core structural support, the landscape is the key to the design, and bamboo and wood are the characteristic material elements. Then, starting from the concept of combining force and form, the classification of bamboo and wood landscape bridges should be carried out, and the establishment of the landscape form of bridges should pursue the goal of “force form meaning” unity. The conceptual analysis of bamboo and wood landscape bridges provides a reasonable logical starting point for exploring aesthetic specificity from the perspectives of objective, subjective, and subjective objective correlations.
(2) Through extensive literature review and expert team discussions, five visual evaluation indicators suitable for bamboo and wood landscape bridges were selected from numerous landscape bridge evaluation indicators, namely natural ecology, coordination and unity, scale and proportion, color, and visual transparency. These indicators not only reflect the characteristics of bamboo and wood materials, but also cover key aspects of visual evaluation. On the basis of the logical reasoning rationality of the aesthetic characteristics indicators of bamboo and wood landscape bridges, a solid theoretical foundation is laid for the overall understanding of the aesthetic characteristics of bamboo and wood landscape bridges that integrates qualitative analysis and quantitative calculation.
(3) The aesthetic objective characteristics of bamboo and wood landscape bridges significantly affect public aesthetic preferences, and this influence can be described through quantitative models. Using multiple regression analysis method, the visual evaluation of bamboo and wood landscape bridges was taken as the dependent variable, and five sub evaluations including natural ecology, coordination and unity were taken as independent variables. SPSS statistics software was used for analysis. The results indicate a linear relationship between each evaluation indicator and the overall average, but the importance of each sub indicator to the overall evaluation varies depending on the graph, ranging from 0.121 to 0.173 on average. Among them, the two indicators of color and visual transparency have a relatively high impact on the overall aesthetic evaluation of bamboo and wood landscape bridges.
This article focuses on the aesthetic characteristics of bamboo and wood landscape bridges, with a main focus on a certain number of bamboo and wood landscape bridge cases and visual feature dimensions. There are still some issues that need further research: (1) improving the evaluation medium, it is recommended to use 3D virtual reality technology as an evaluation method in subsequent research, and obtain more realistic visual experience data by simulating pedestrian dynamic perspectives, which will significantly improve the reliability of evaluation results. (2) Introducing eye movement research, when evaluating the psychological dimensions of aesthetic perception of bamboo and wood landscape bridges, eye movement experimental paradigms can be introduced to expand measurement methods. However, correlation analysis between eye movement parameters and objective characteristics of landscape elements is necessary to ensure the practical value of research results. (3) The precision and element coverage of optimizing the indicator system will be further studied in terms of indicator representation validity and coverage breadth, in order to systematically enhance the scientific and universal nature of aesthetic evaluation research on bamboo and wood landscape bridges.
Author Contributions
Writing, Yuting Zhao; methodology and review, Fenghui Dong; editing, Fenghui Dong.
Funding
The Natural Science Foundation of Jiangsu Province (Grant No. BK20200793).
Data Availability Statement
The data used to support the findings of this study are available from the corresponding author upon request.
Acknowledgments
The authors wish to express their sincere gratitude to the Natural Science Foundation of Jiangsu Province (Grant No. BK20200793).
Conflicts of Interest
The authors declare no conflicts of interest.
References
- Sun Xaioluan, Qu Yiheng, et al. Design and Analysis of a Wooden Landscape Bridge Structure [J]. Highway,2020,65(2):79-84.
- Lin H M Z. Xuhong Bridge: A Long Span Wooden Arch Bridge with Glued Laminated Timber[J]. Structural Engineering International,2021,31(1):60-64. [CrossRef]
- Li Tianni. Exploration and Research on the Structural Possibility of Bamboo based Landscape Architecture [D]. North China University of Technology,2022.
- Ni Yuancheng. The Application and Evaluation of Aesthetics in Bridge Design [D]. Shenyang Jianzhu University,2015.
- Deng Wenzhong. Bridge Form and Aesthetics [J].Engineering,2018,4(2):221-242.
- Xu Liping. Research on Bridge Aesthetics Theory Based on the Overall Perspective of Bridges and Buildings [J]. Highway, 2021,66(3):78-84.
- Jiang Yu, Sunjun. On the Ecological Aesthetics of Ancient Chinese Covered Bridges [J]. Highway,2020,65(2):183-186.
- Zhuang Yonghao. Research on Landscape Design of Urban Bridges [J]. Municipal technology, 2025, 43(2):45-52.
- Li Bo. Research on the Aesthetics and Landscape of Highway Overpass Bridge Architecture [D]. Changsha University of Science and Technology,2003.
- Sun Lili. Research on Postmodern Landscape Design in Urban Communities [D]. Southeast University,2022.
- Hu Yuxuan. The Integration of Rationality and Sensibility: Logical Thinking and Imagery Thinking in Exhibition Art Design [J]. Literary Life - Literary Theory, 2018(6):30-31.
- Zhang Pengtao. Research on Series Planning Methods for Urban River Bridge Types [J]. Tongji University, 2006.
- Zhu Yuekun. The aesthetic form and application of seal carving art in packaging design [J]. China Package, 2023, 43(1):30-33.
- Liu Wen, Meng Xinmiao, Duanwei. Exploration of Integrating Aesthetic Education into Graduate Professional Course Teaching: Taking the Course of “Advanced Bamboo and Wood Structure” as an Example [J]. Forestry Education In China, 2023, 41(3):45-47.
- Wei Yang, Dong Fenghui, Ding Mingmin, Zheng Kaiqi, Liu Song. Bridge aesthetics [M]. China Communications Press, 2025.
- Li Yan. Research on Ecological Aesthetics Design Methods for Bridges in Mountainous Cities [D]. Chongqing University,2015.
- Xu Liping. Contemporary Bridge Aesthetics [M]. Tongji University Press, 2024.
- Qin Chunxiao. Research on Perception Theory and Method of Highway Landscape Evaluation [D]. South China University of Technology,2008.
- Zhu Jiaxing. Information and Entropy [J]. Journal of Beijing University of Aeronautics and Astronautics, 1995, 21(2): 84-90.
- Dou Yan, Kong Lingfu, Wang Liufeng. Visual Attention Calculation Model Based on Visual Entropy [J]. Acta Optica Sinica, 2009, 29(9): 2511-2515.
- Tang Xiaomin. Theoretical, methodological, and applied research on landscape visual environment evaluation [D]. Fudan University, 2007.
- Wang Decai, Ding Na, Li Yongjie, et al. Quantitative analysis of color characteristics of Huizhou street and alley buildings based on visual perception: a case study of Hongcun [J]. Industrial buildings,2025,1-11.
- Yan L, Li Q, Zhang Y, et al. Computer vision quantization research on the architectural color of Avenida de Almeida Ribeiro in Macau based on the human eye perspective[J]. Frontiers in Computational Neuroscience, 2022, 16: 951718. [CrossRef]
- Cheng Yuning, Tanming. Research on Landscape Color Environment Optimization Based on Quantitative Technology: Taking the Central Axis of Nanjing Zhongshan Mausoleum as an Example [J]. Journal of Western Human Settlements and Environment, 2016, 31(4):8.
- Zhang Linbo, Wang Wei, Wu Chunxu, et al. Theory and Practice of Quantitative Evaluation Method for Visual Landscape Impact Based on GIS [J]. Journal of Ecology, 2008, 28(6):8.
- Xu Xinji. Research on the sense of oppression in urban street landscape based on SD method: taking Fengqi Road in Hangzhou as an example [J]. Huazhong Architecture, 2015, 33(4):6.
- Zhao Ruoqian. Fairness evaluation of visual landscape quality in community life circle streets [D]. Zhejiang Agricultural and Forestry University,2024.
- Tan Ming. Quantitative Study on the Color Composition of Jingyuan [D]. Nanjing: Southeast University, 2018.
- Niu Xinyi, Xu Fang. Quantitative evaluation method for spatial openness of built environment based on visual influence [J]. Urban planning forum, 2011(1): 91-97.
- Lei Guilin, Bao Shiyuan, Zhang Biao. Stereoscopic angles and their applications in physics [J]. Journal of Gansu University of Education (Natural Science Edition), 1992(2): 51-56.
- Han Junwei. Research on Visual Evaluation of Pedestrian Street Landscape [D]. Chengdu: Southwest Jiaotong University, 2018.
- Zeng Wuyi, Huang Bingyi. Reliability and validity analysis of survey questionnaire [J]. Statistics and Information Forum, 2005, 20(6): 1-15.
Figure 1.
Arched force beam-arched beam bridge.
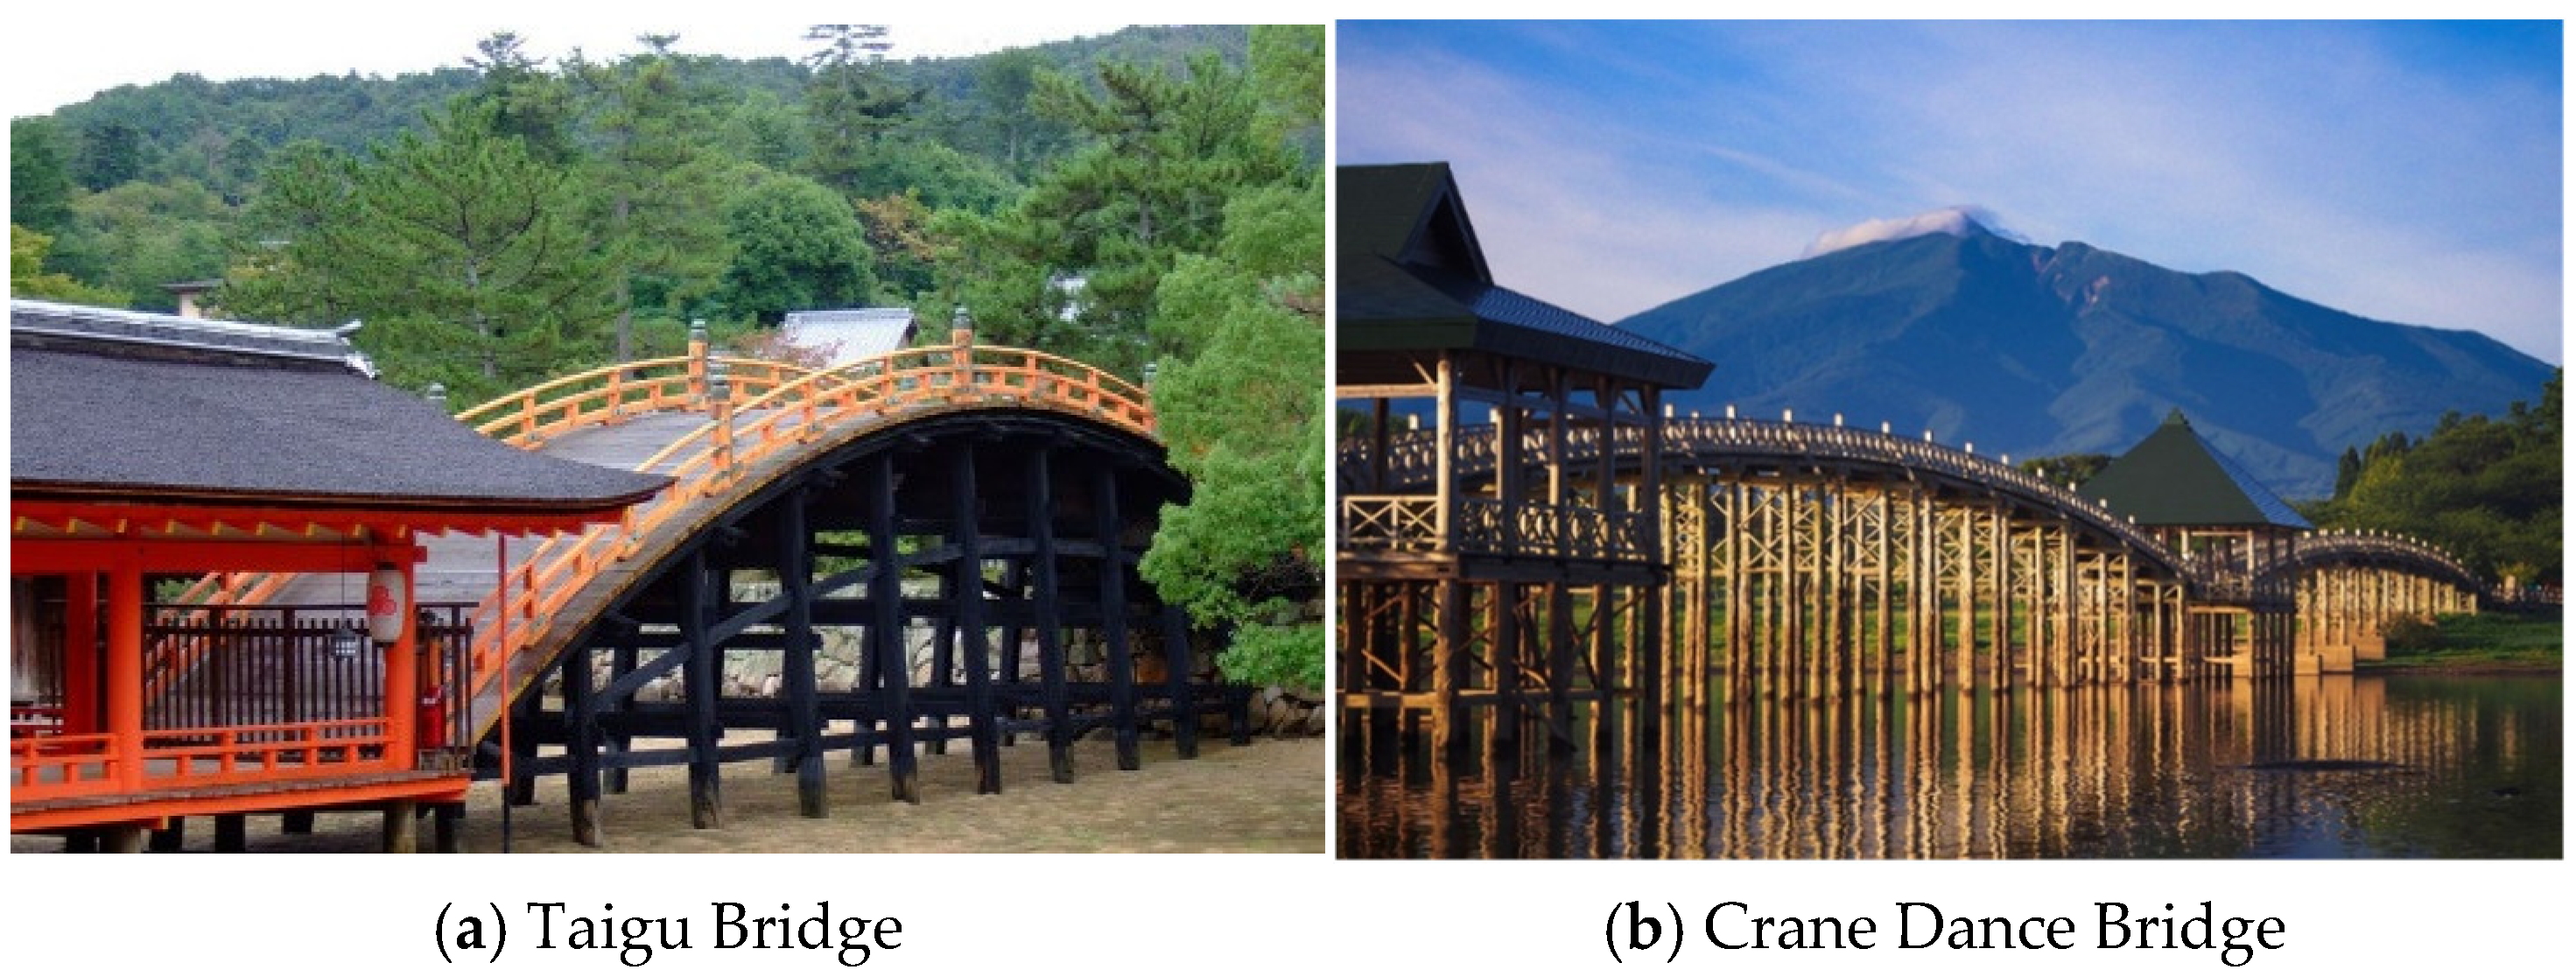
Figure 2.
Schematic of the semantic differentiation questionnaire scale.
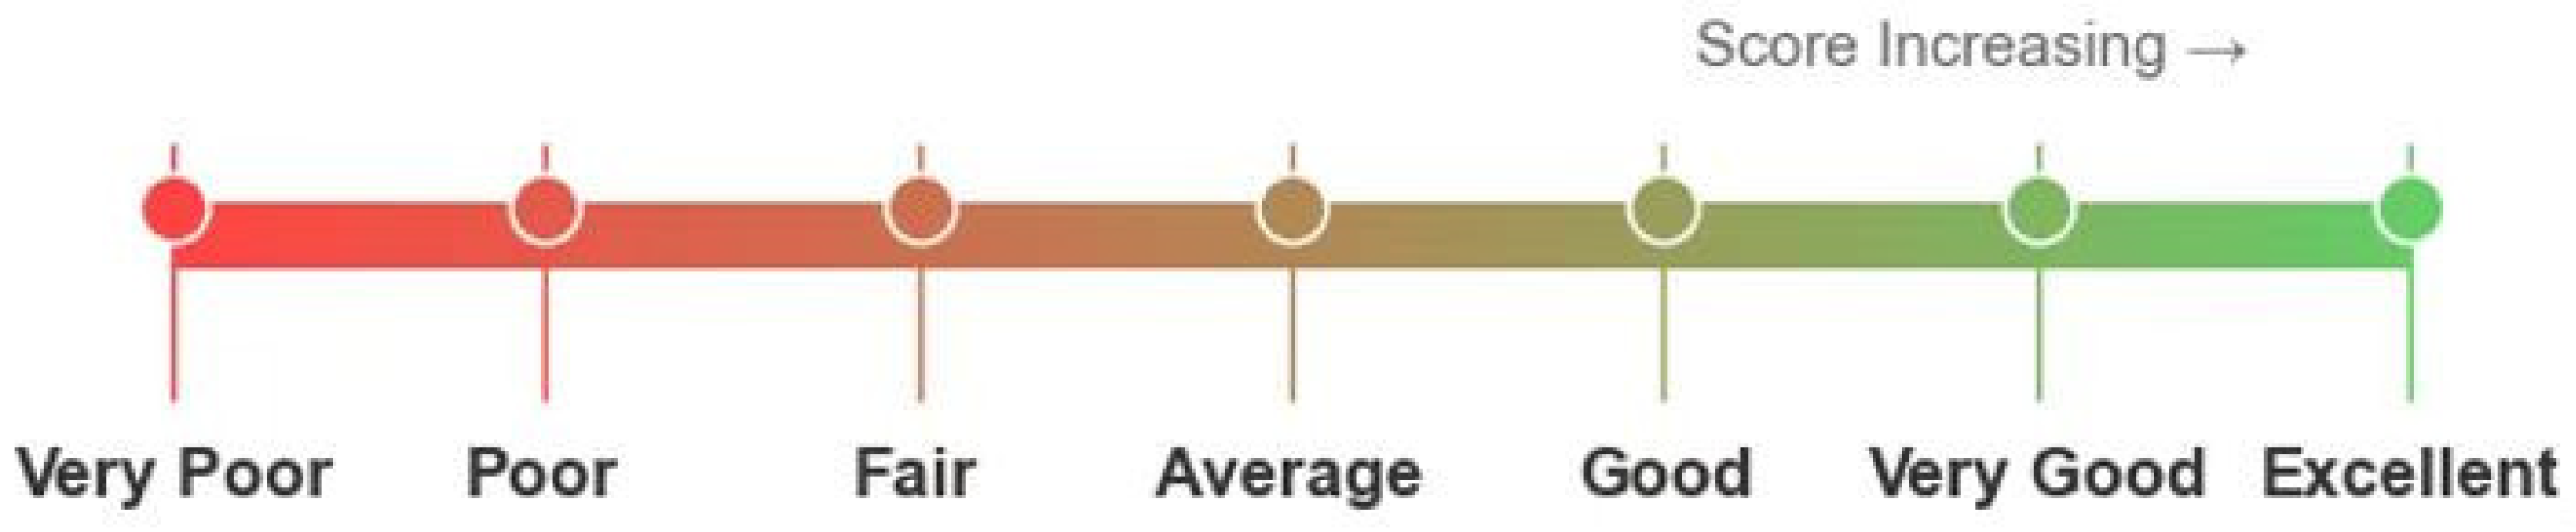
Figure 3.
Mean value of natural ecological evaluations.
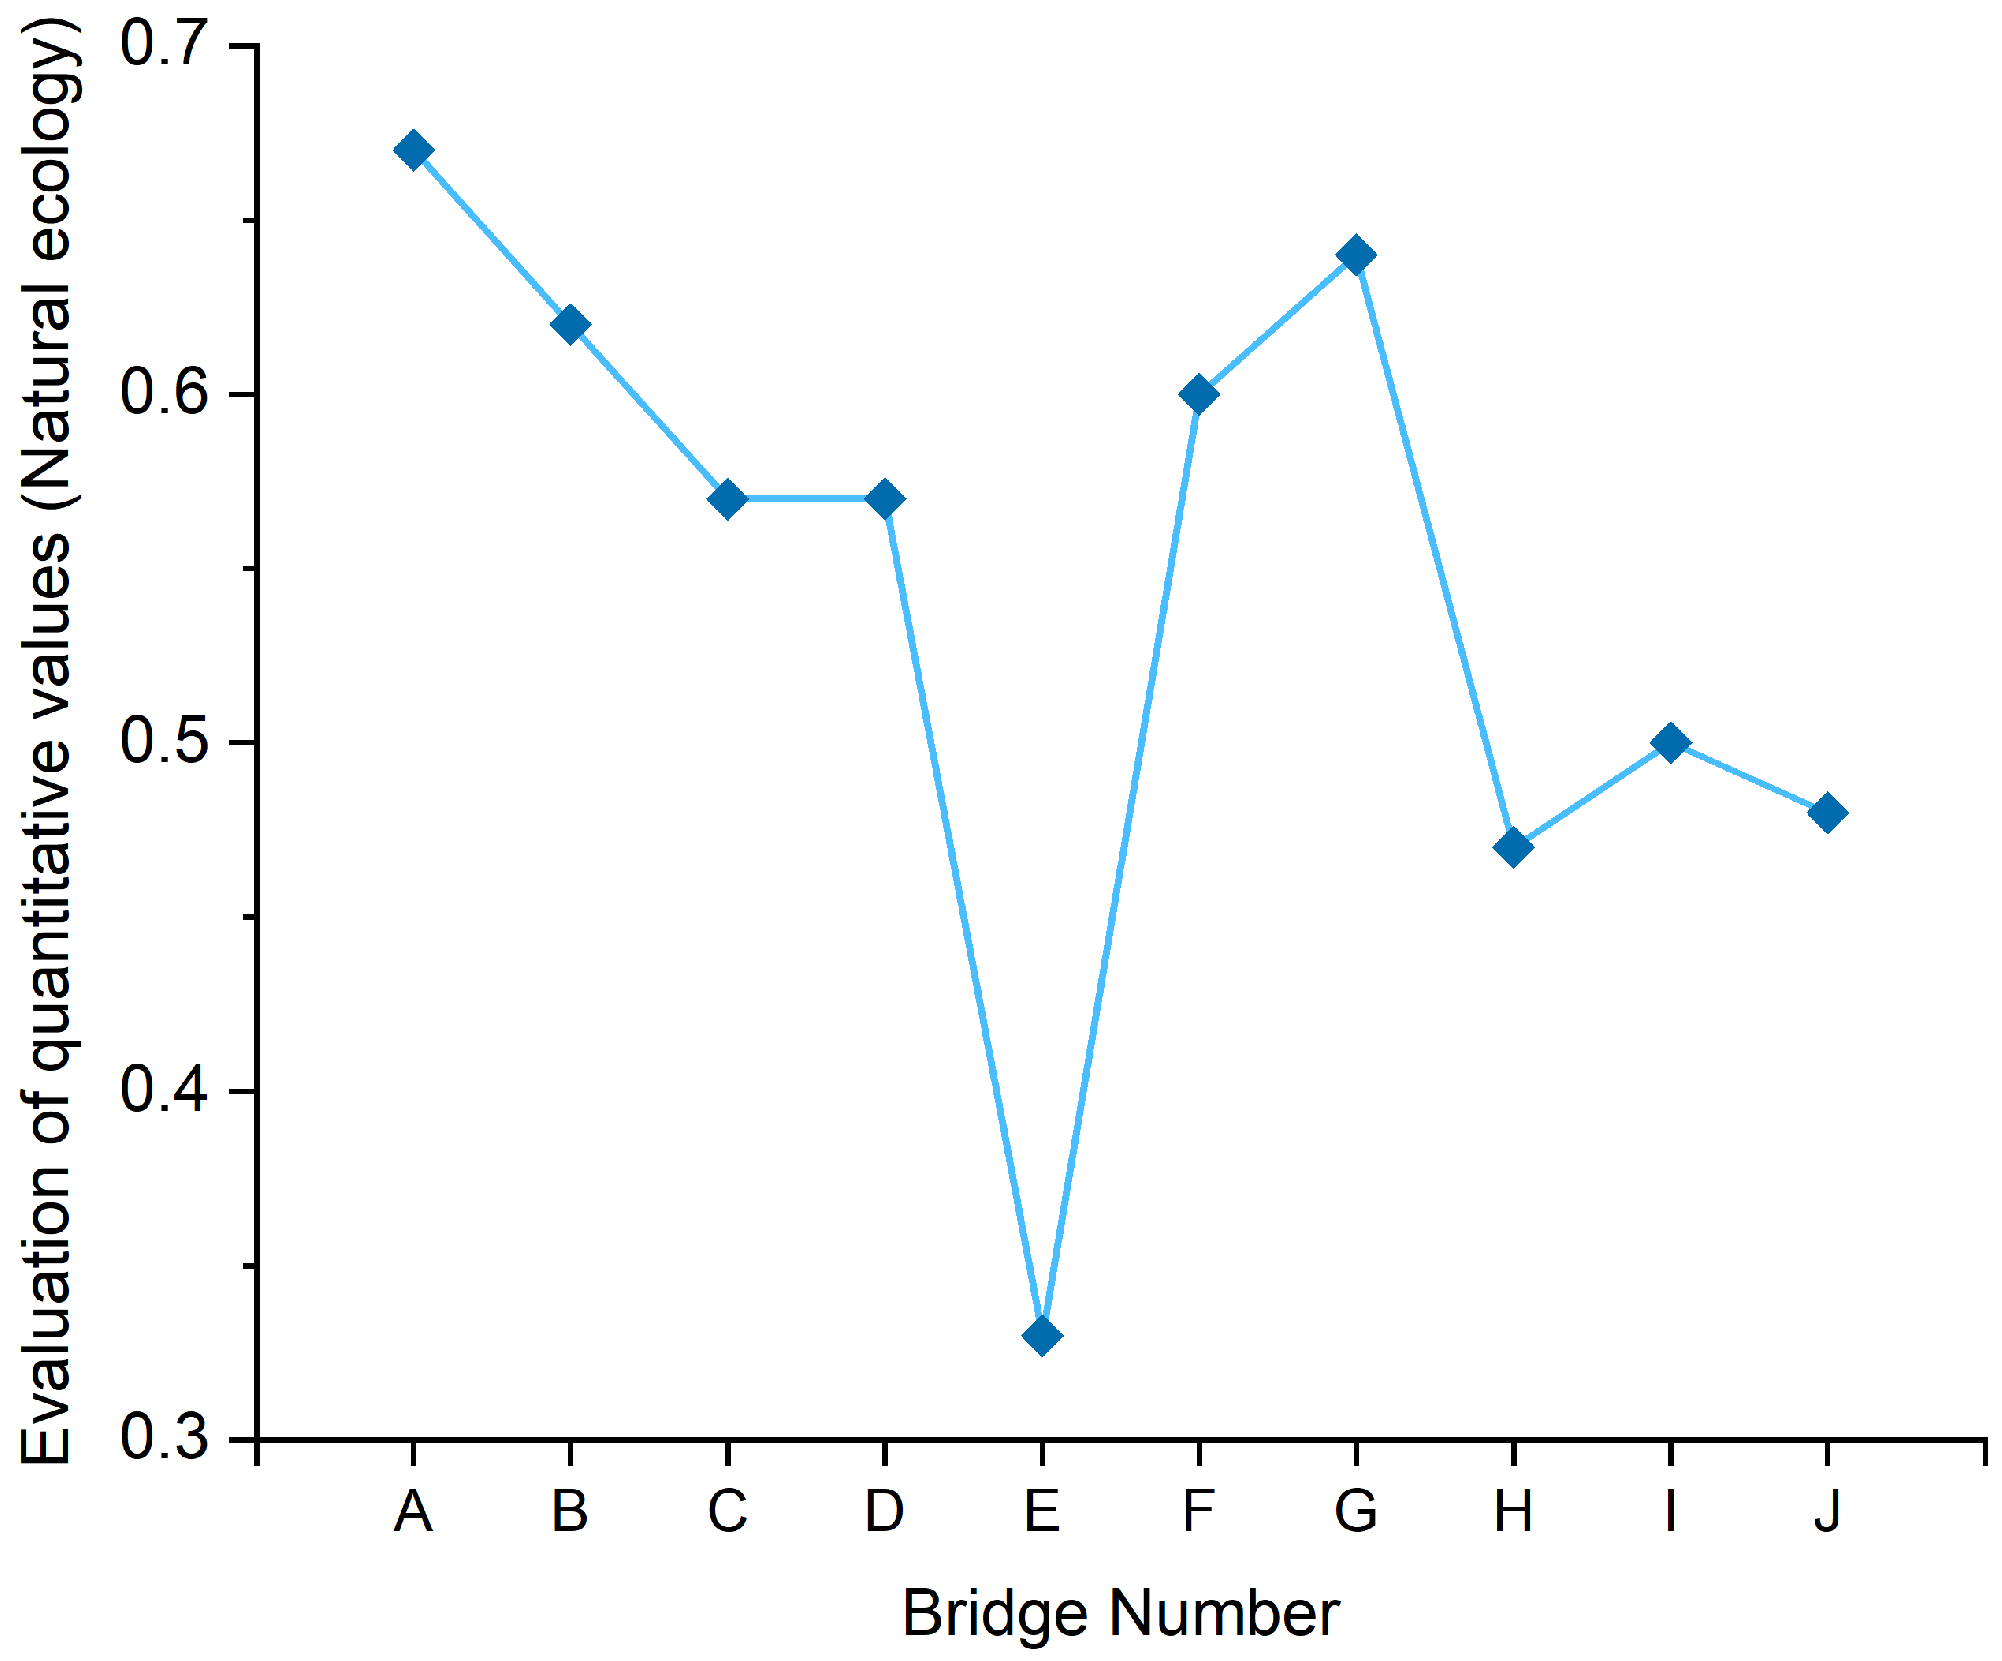
Figure 4.
Mean value of coordinated and harmonized evaluations.
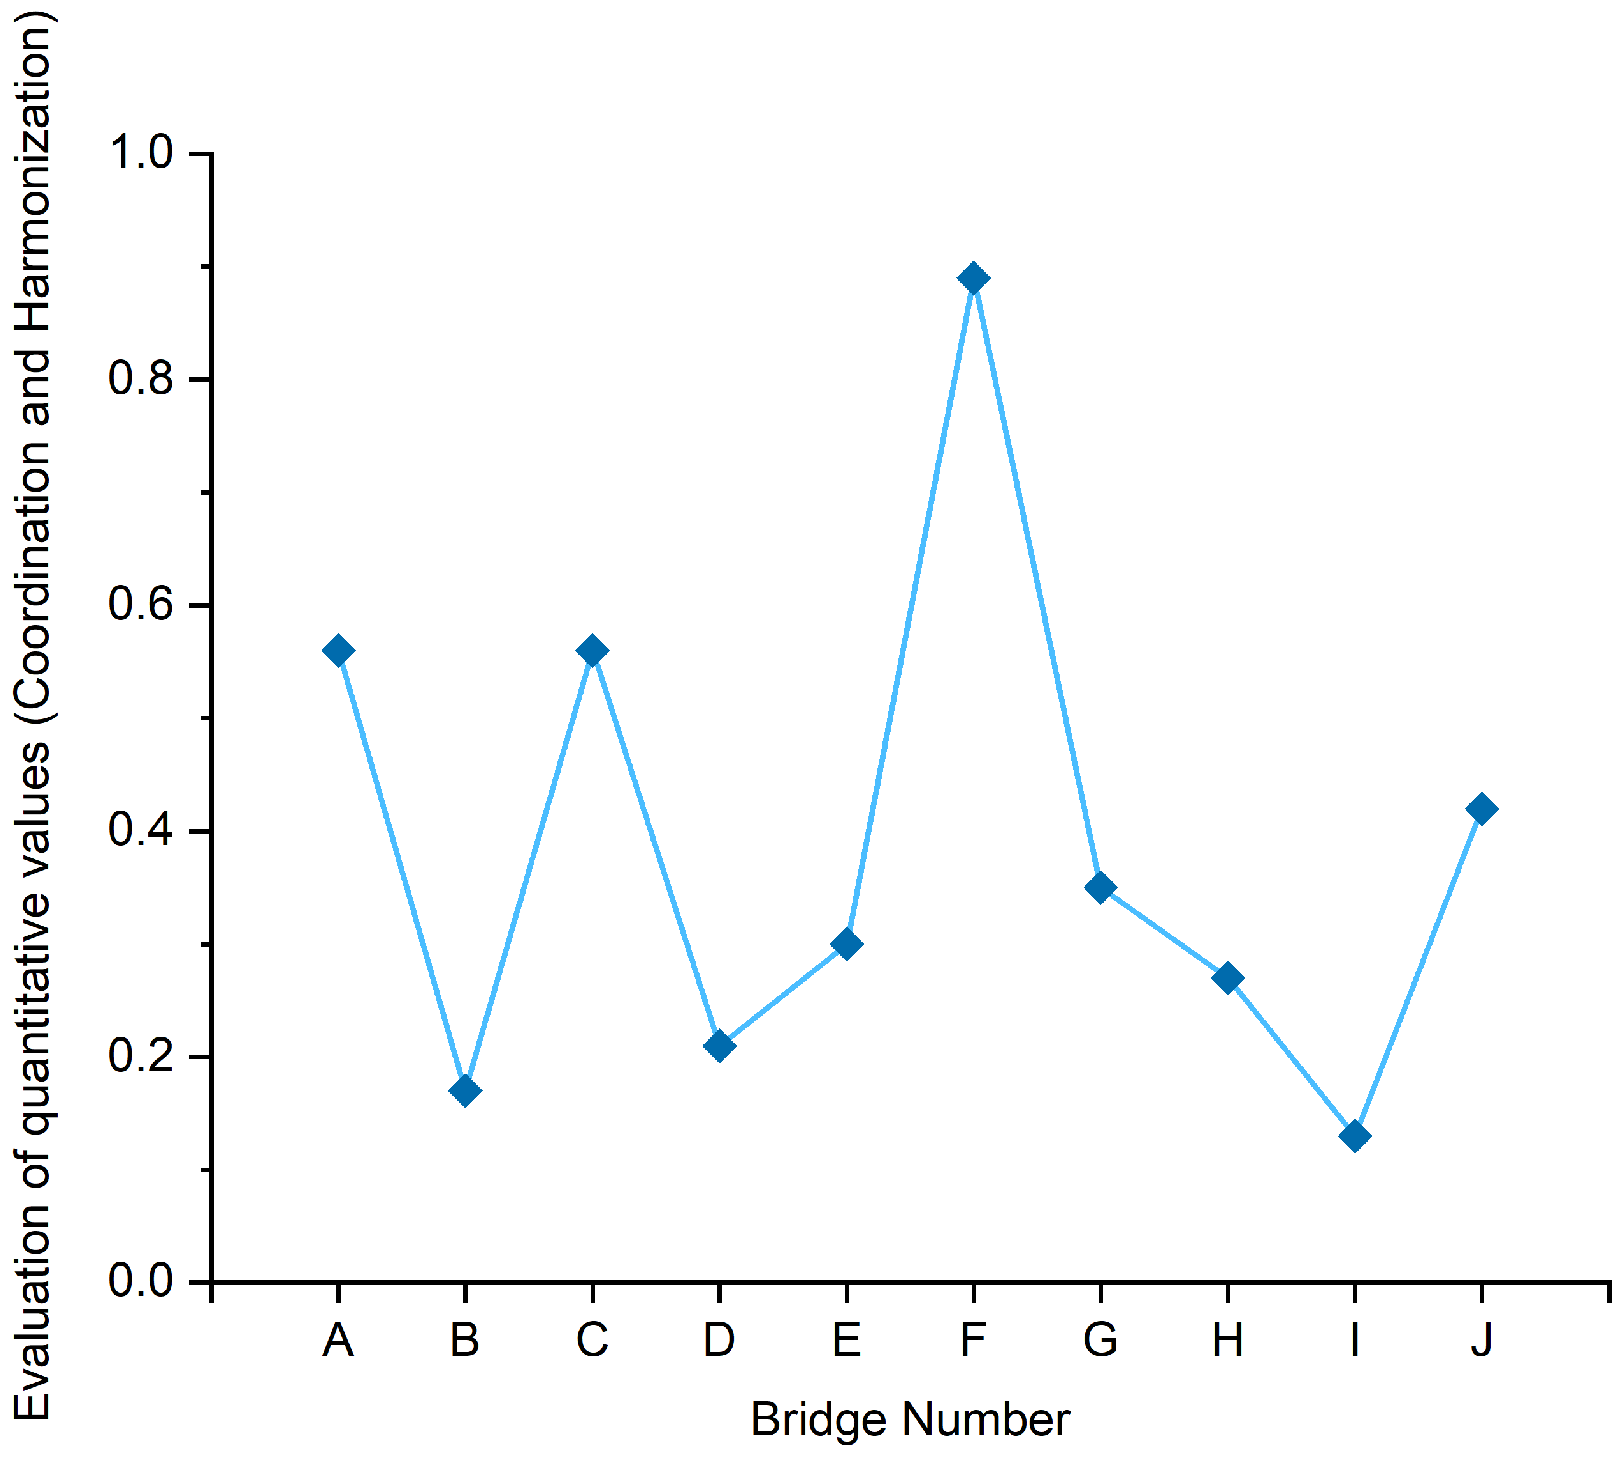
Figure 5.
Mean value of scale and proportion evaluations.
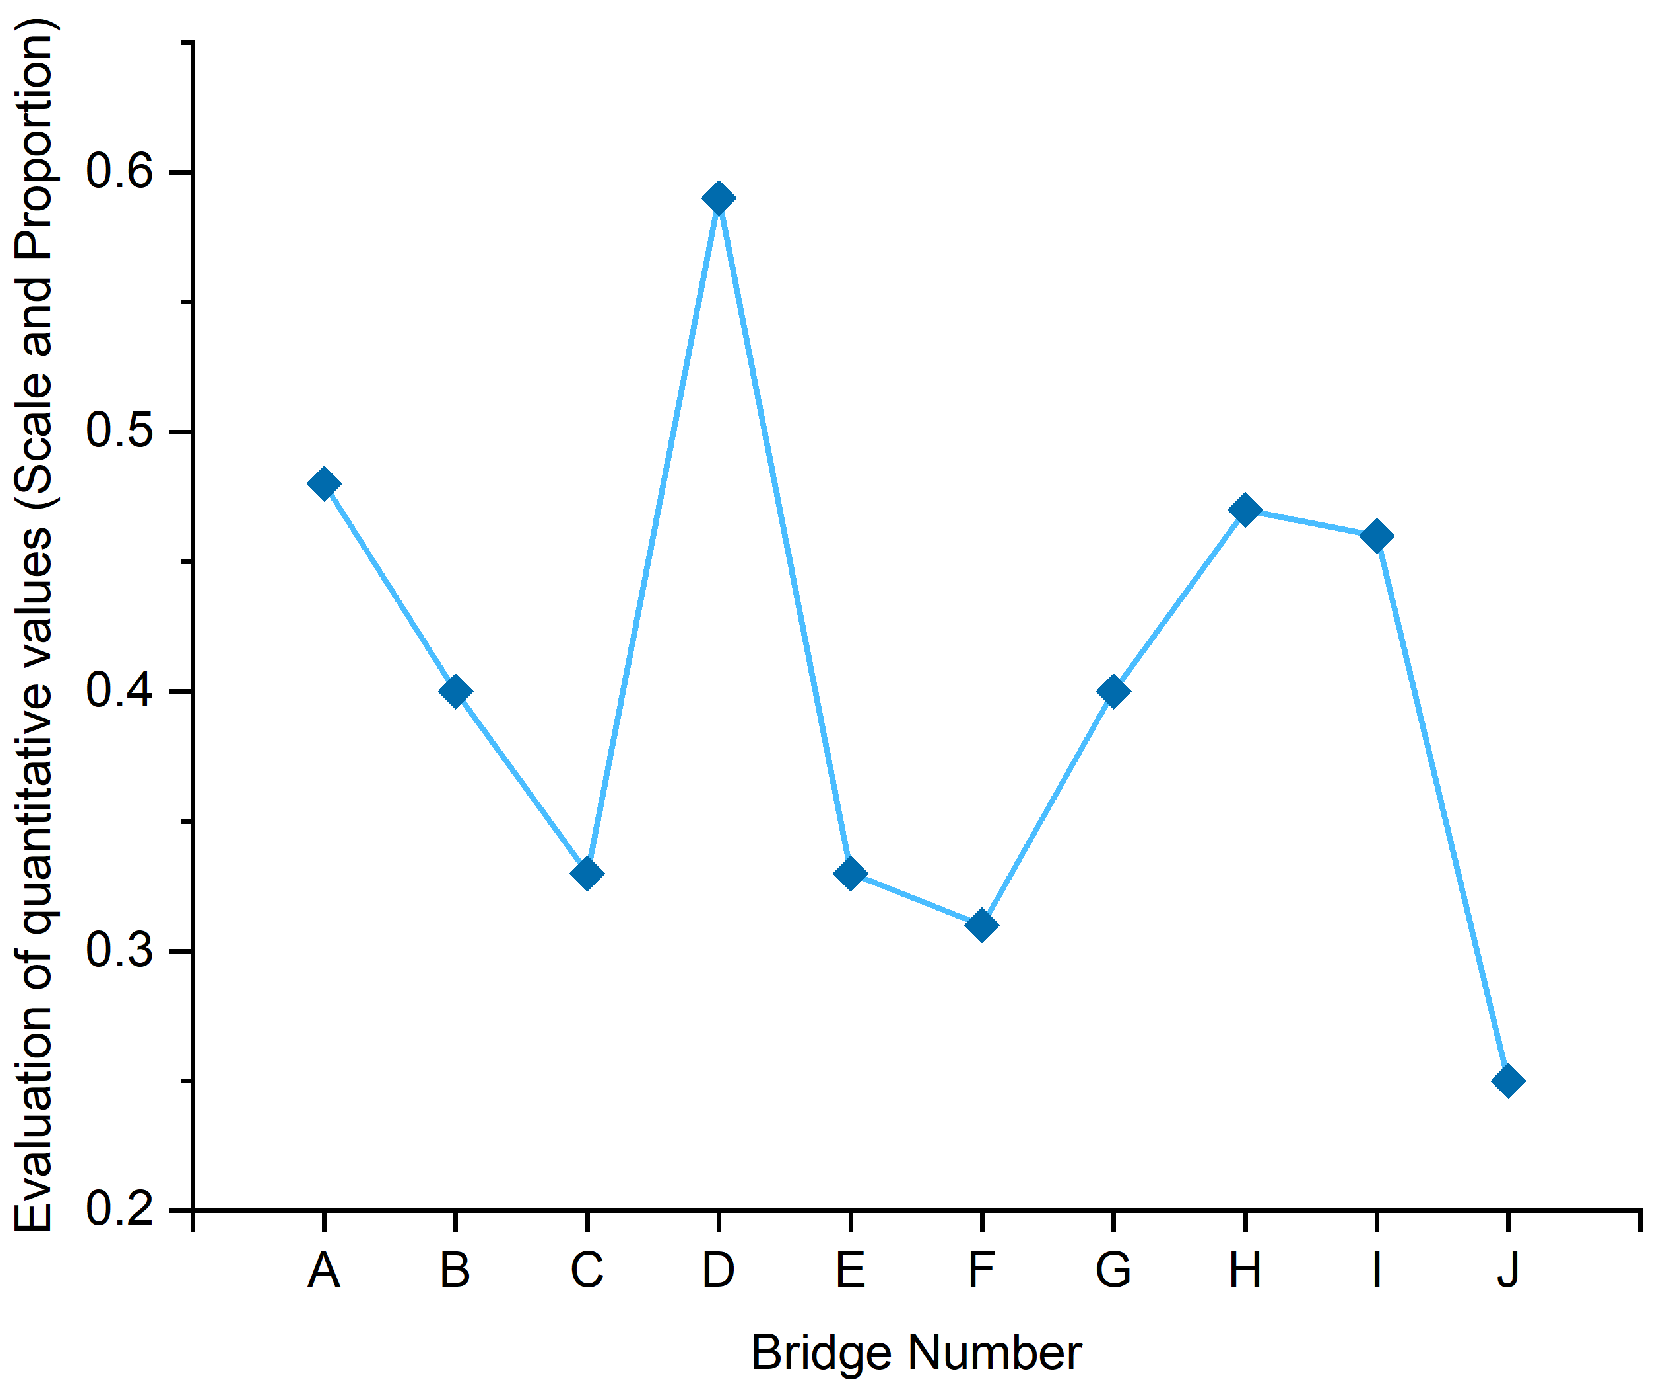
Figure 6.
Average color rating.
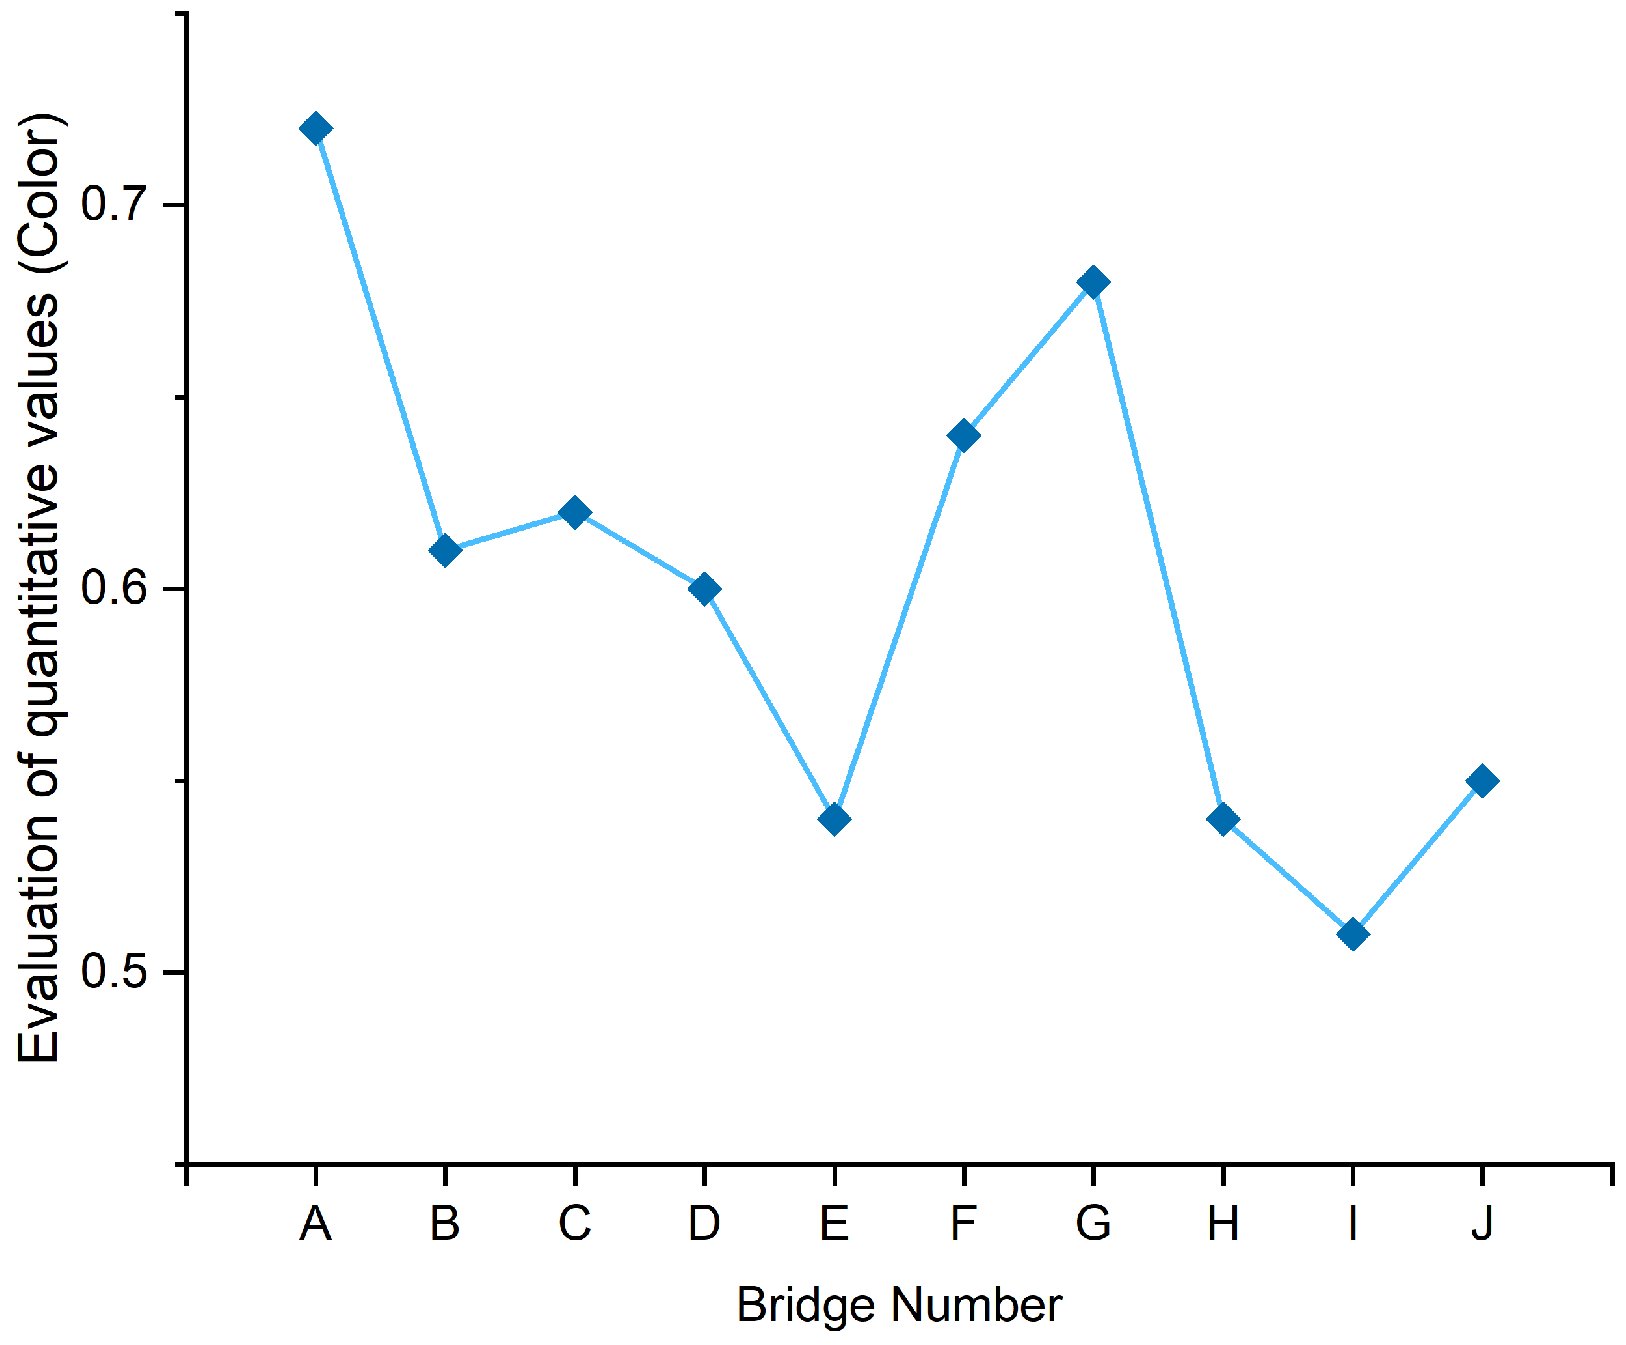
Figure 7.
Mean value of visual permeability evaluation.
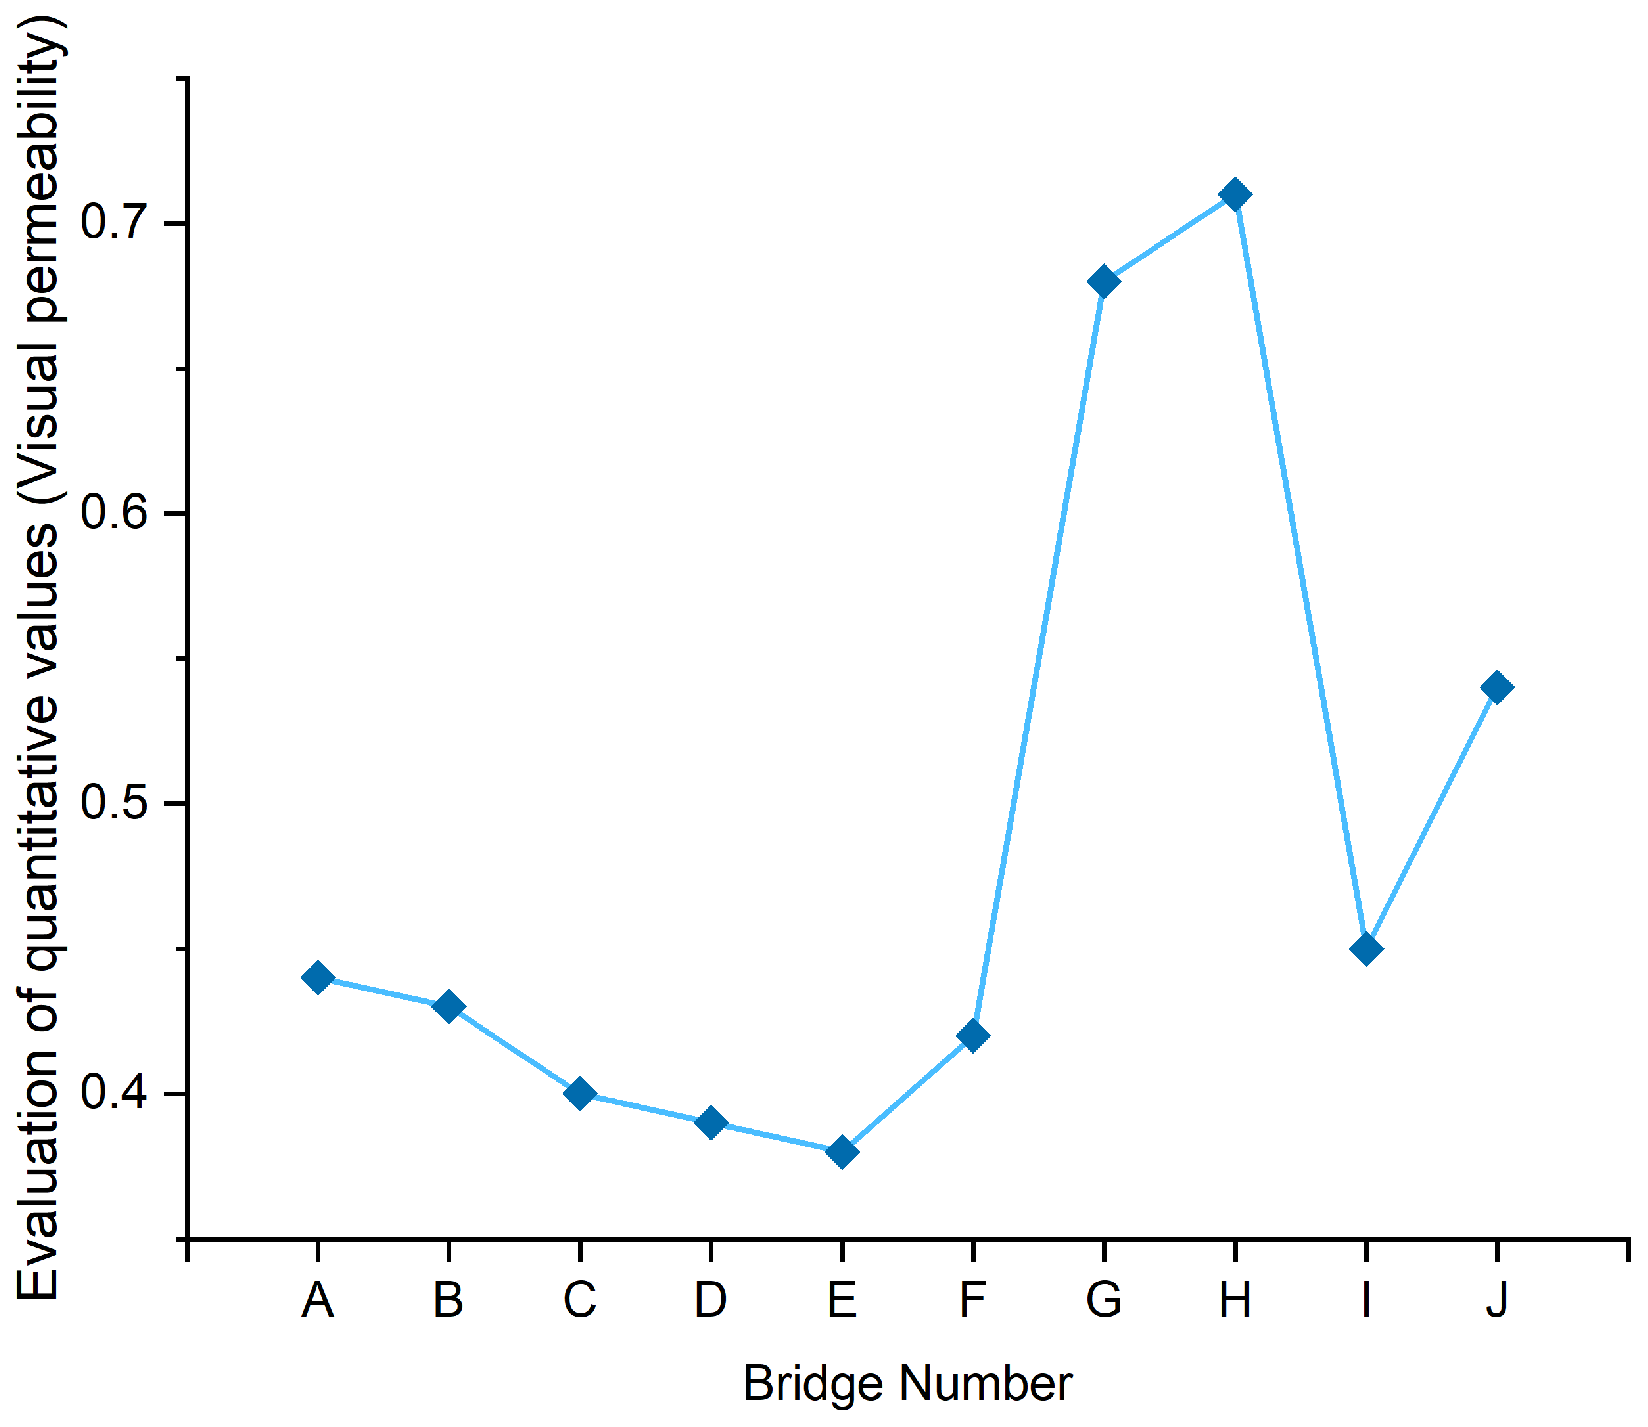
Figure 8.
Overall Landscape Aesthetics Evaluation Mean.
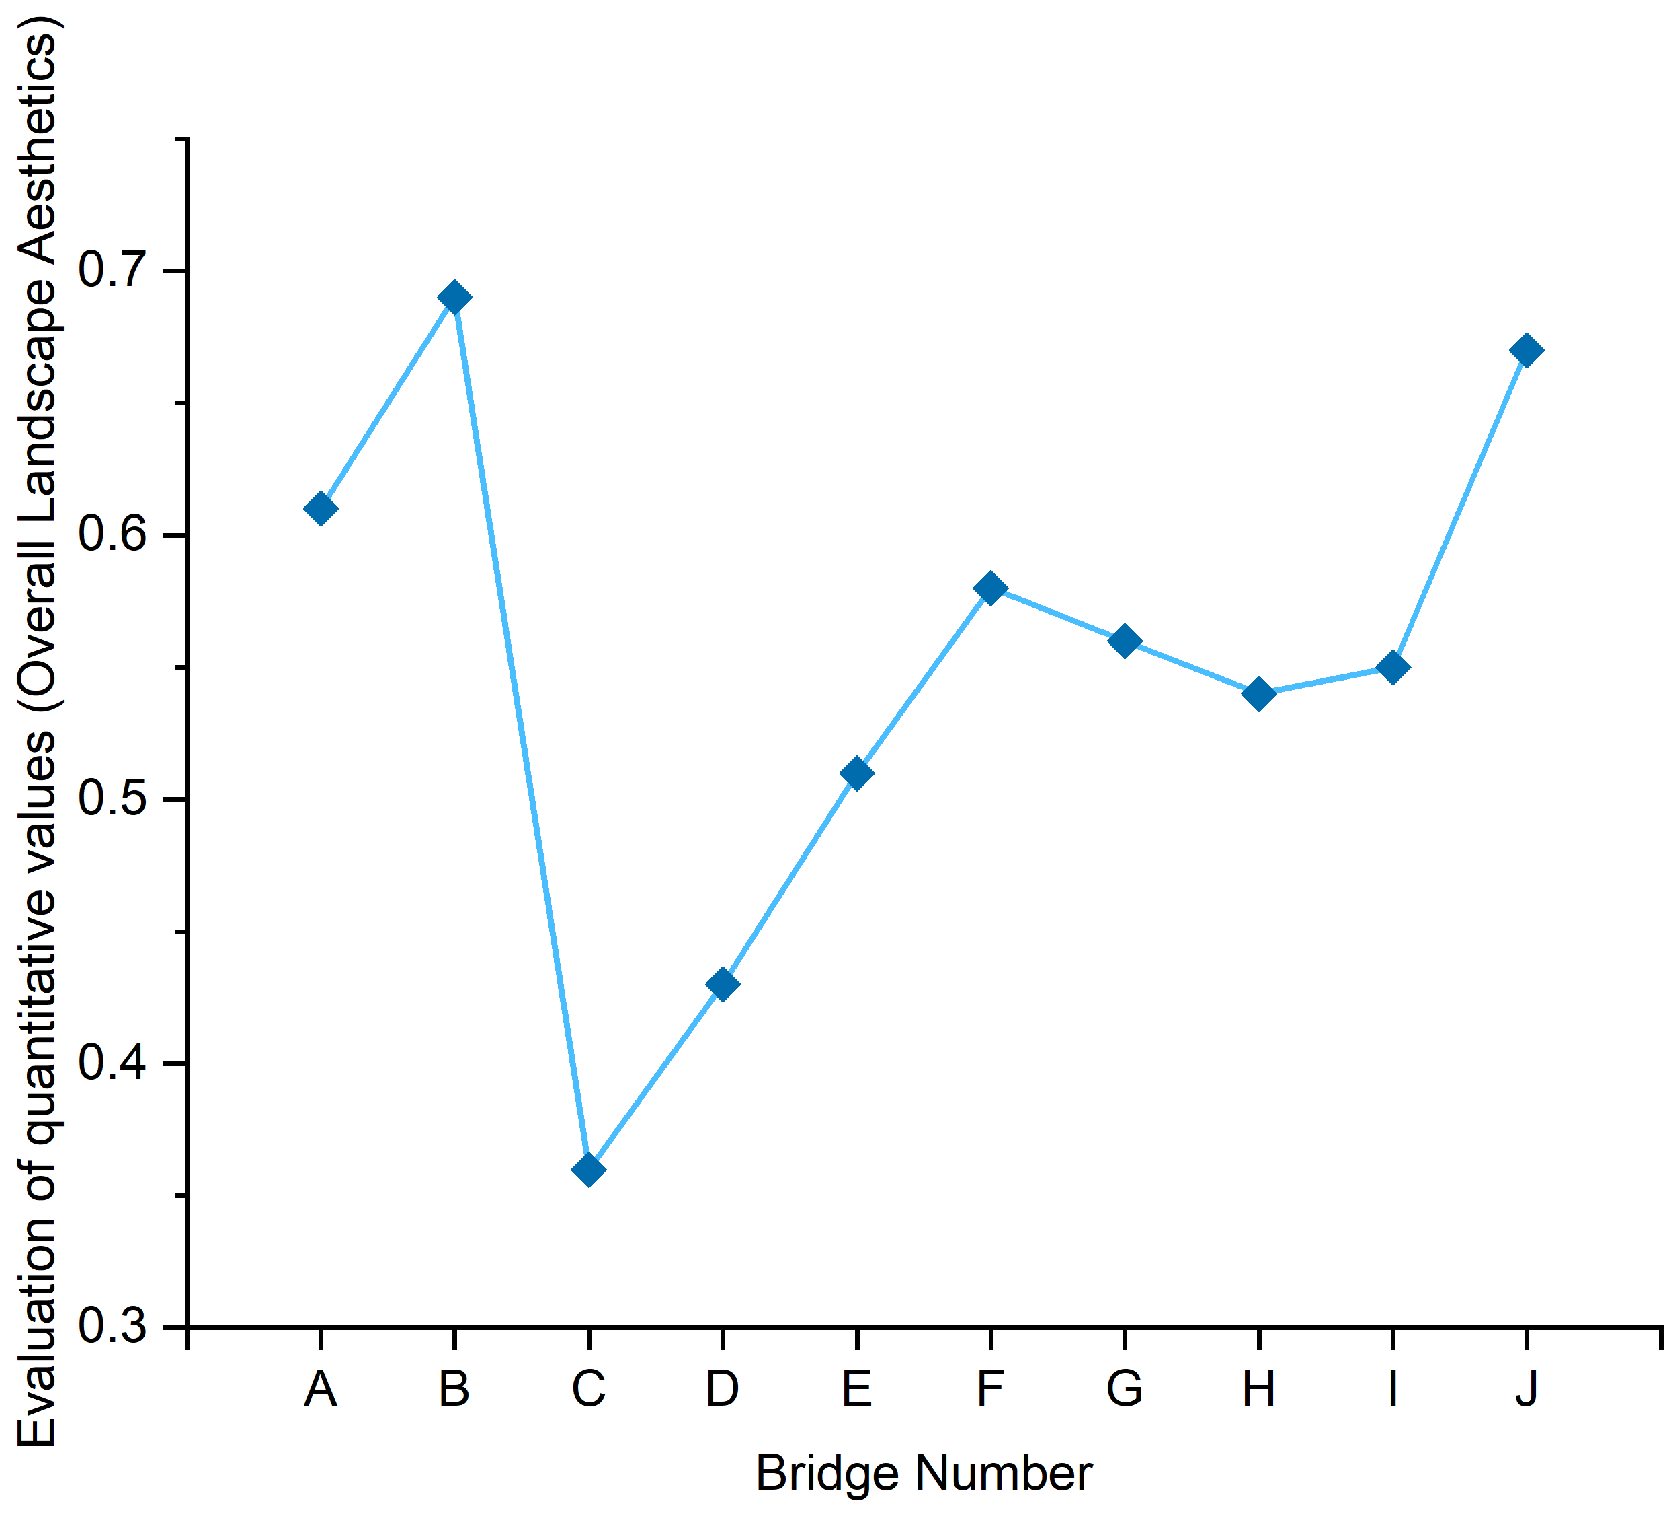
Figure 9.
The visual proportion of bamboo and wood elements—Evaluation of Natural ecology Fitting Curve.
Figure 9.
The visual proportion of bamboo and wood elements—Evaluation of Natural ecology Fitting Curve.
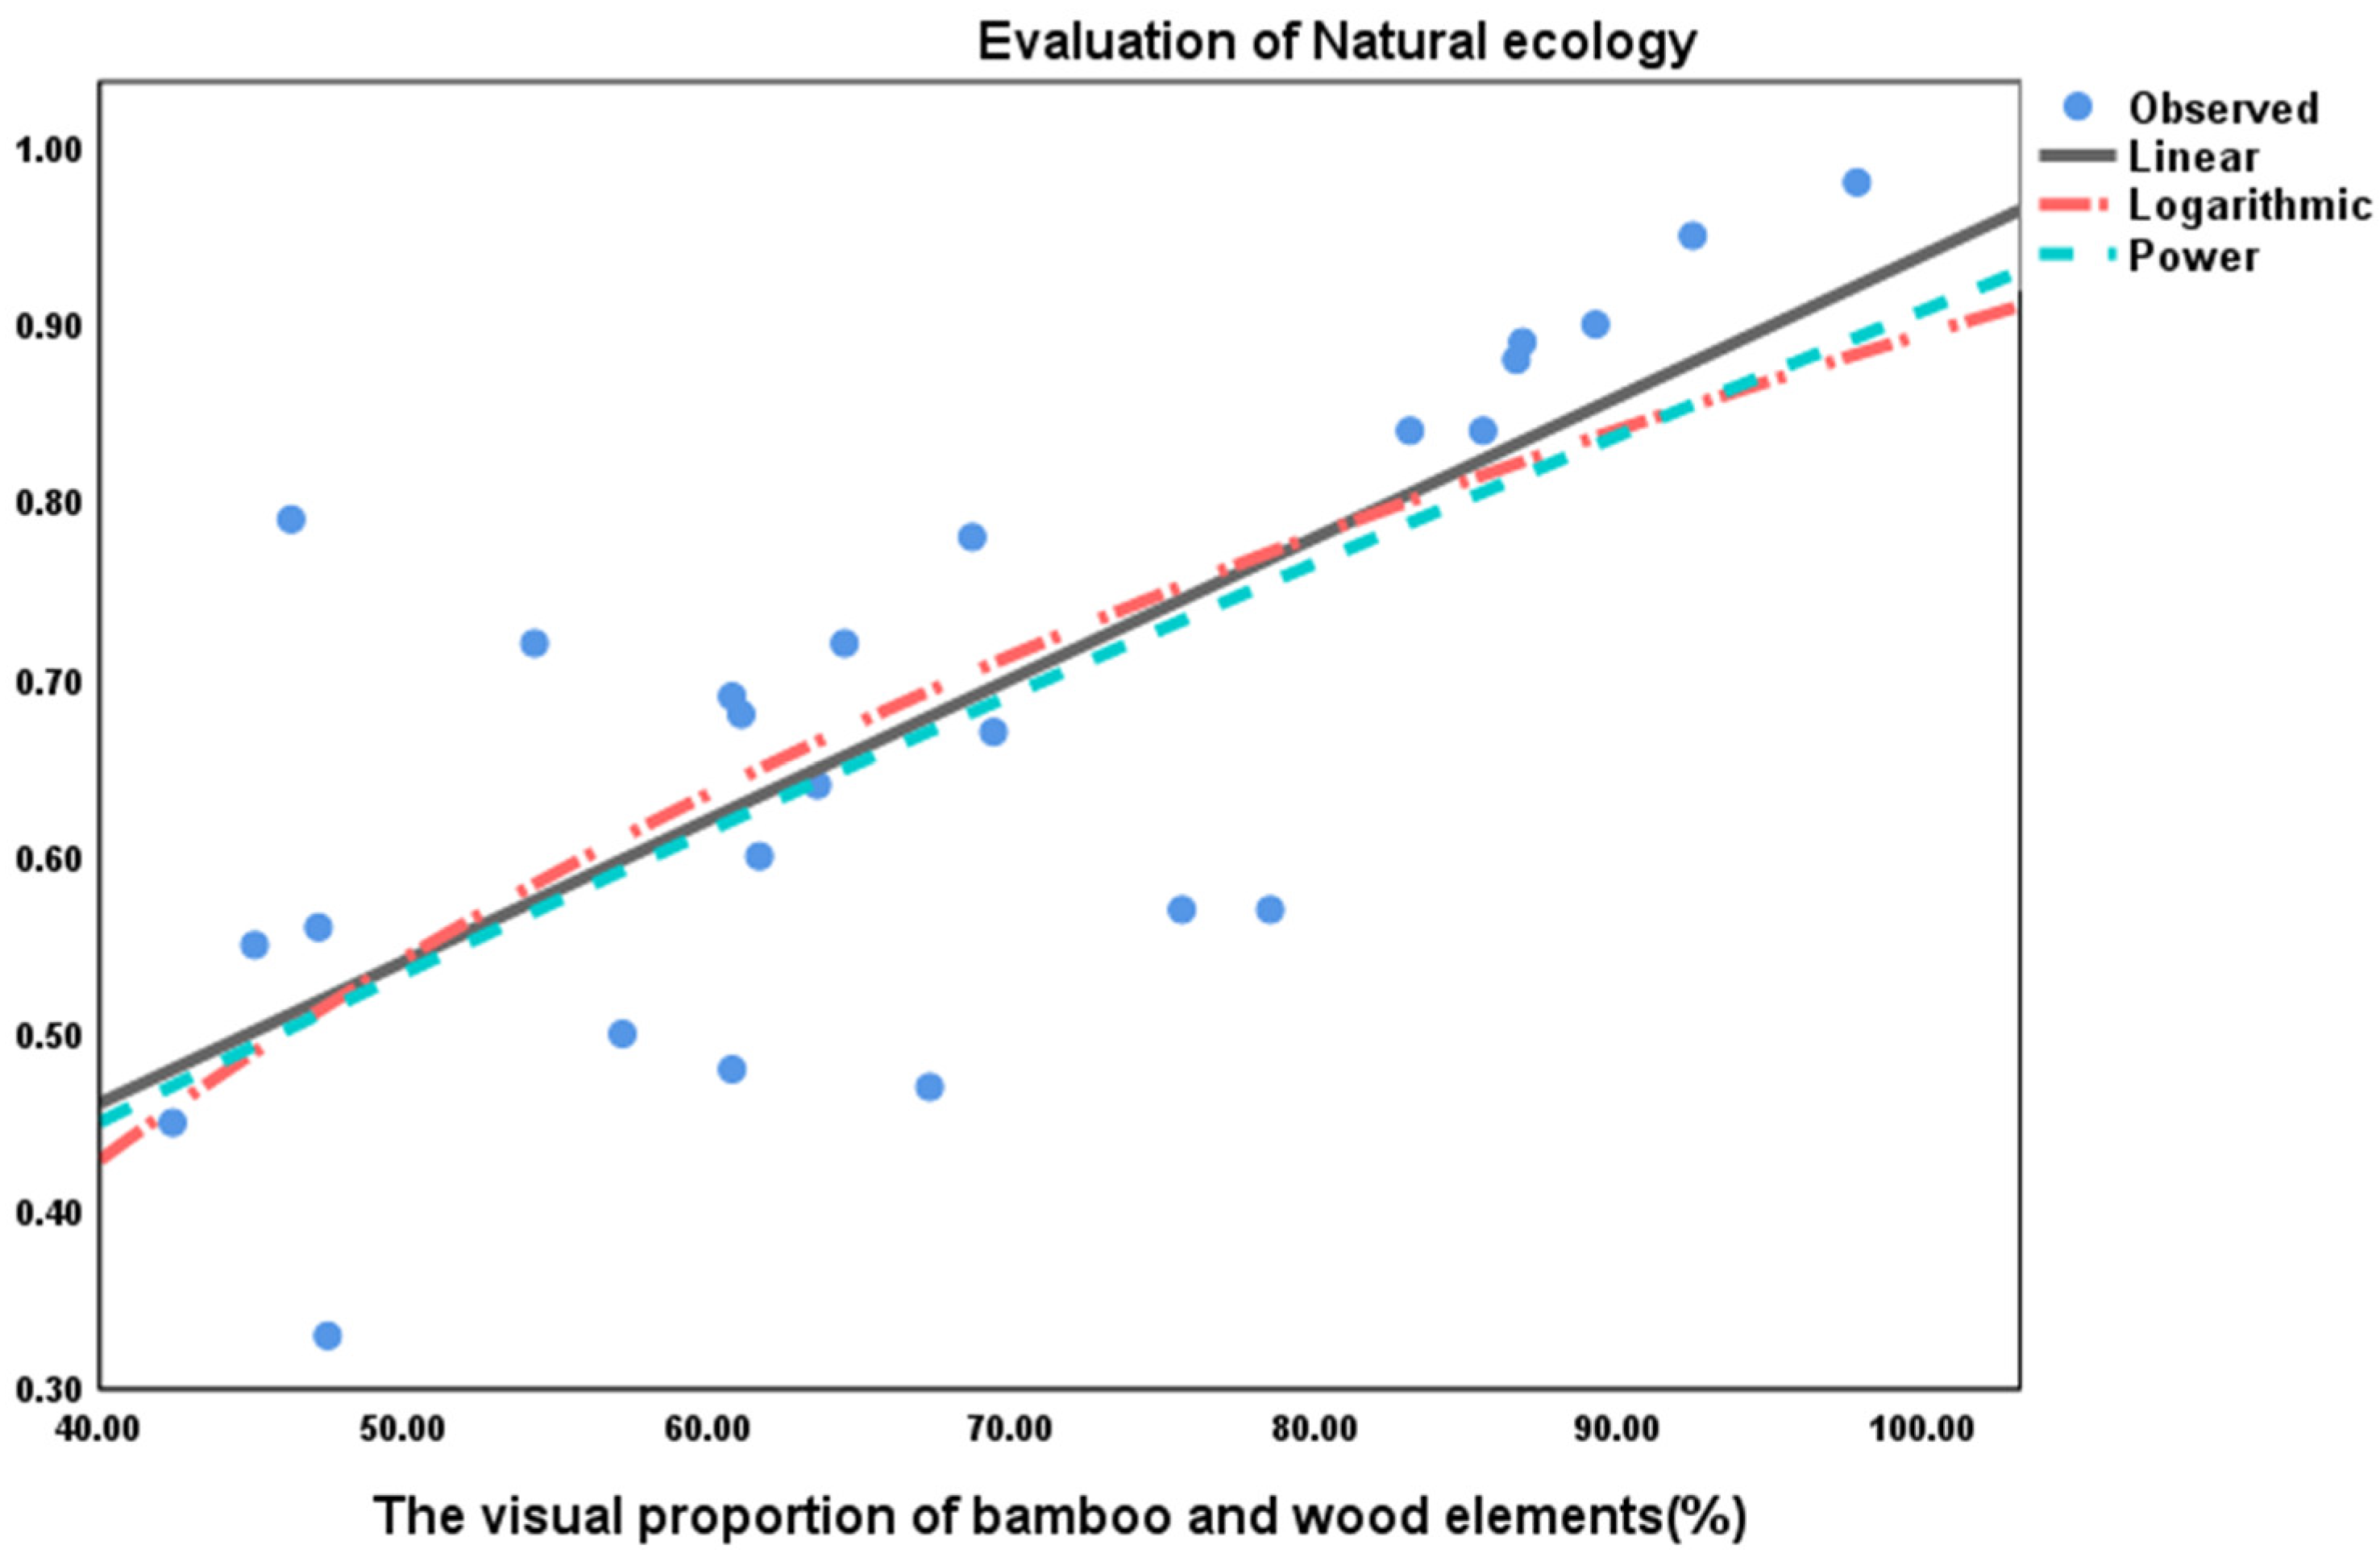
Figure 10.
Visual entropy- Evaluation of coordination and harmonization Fitting Curve.
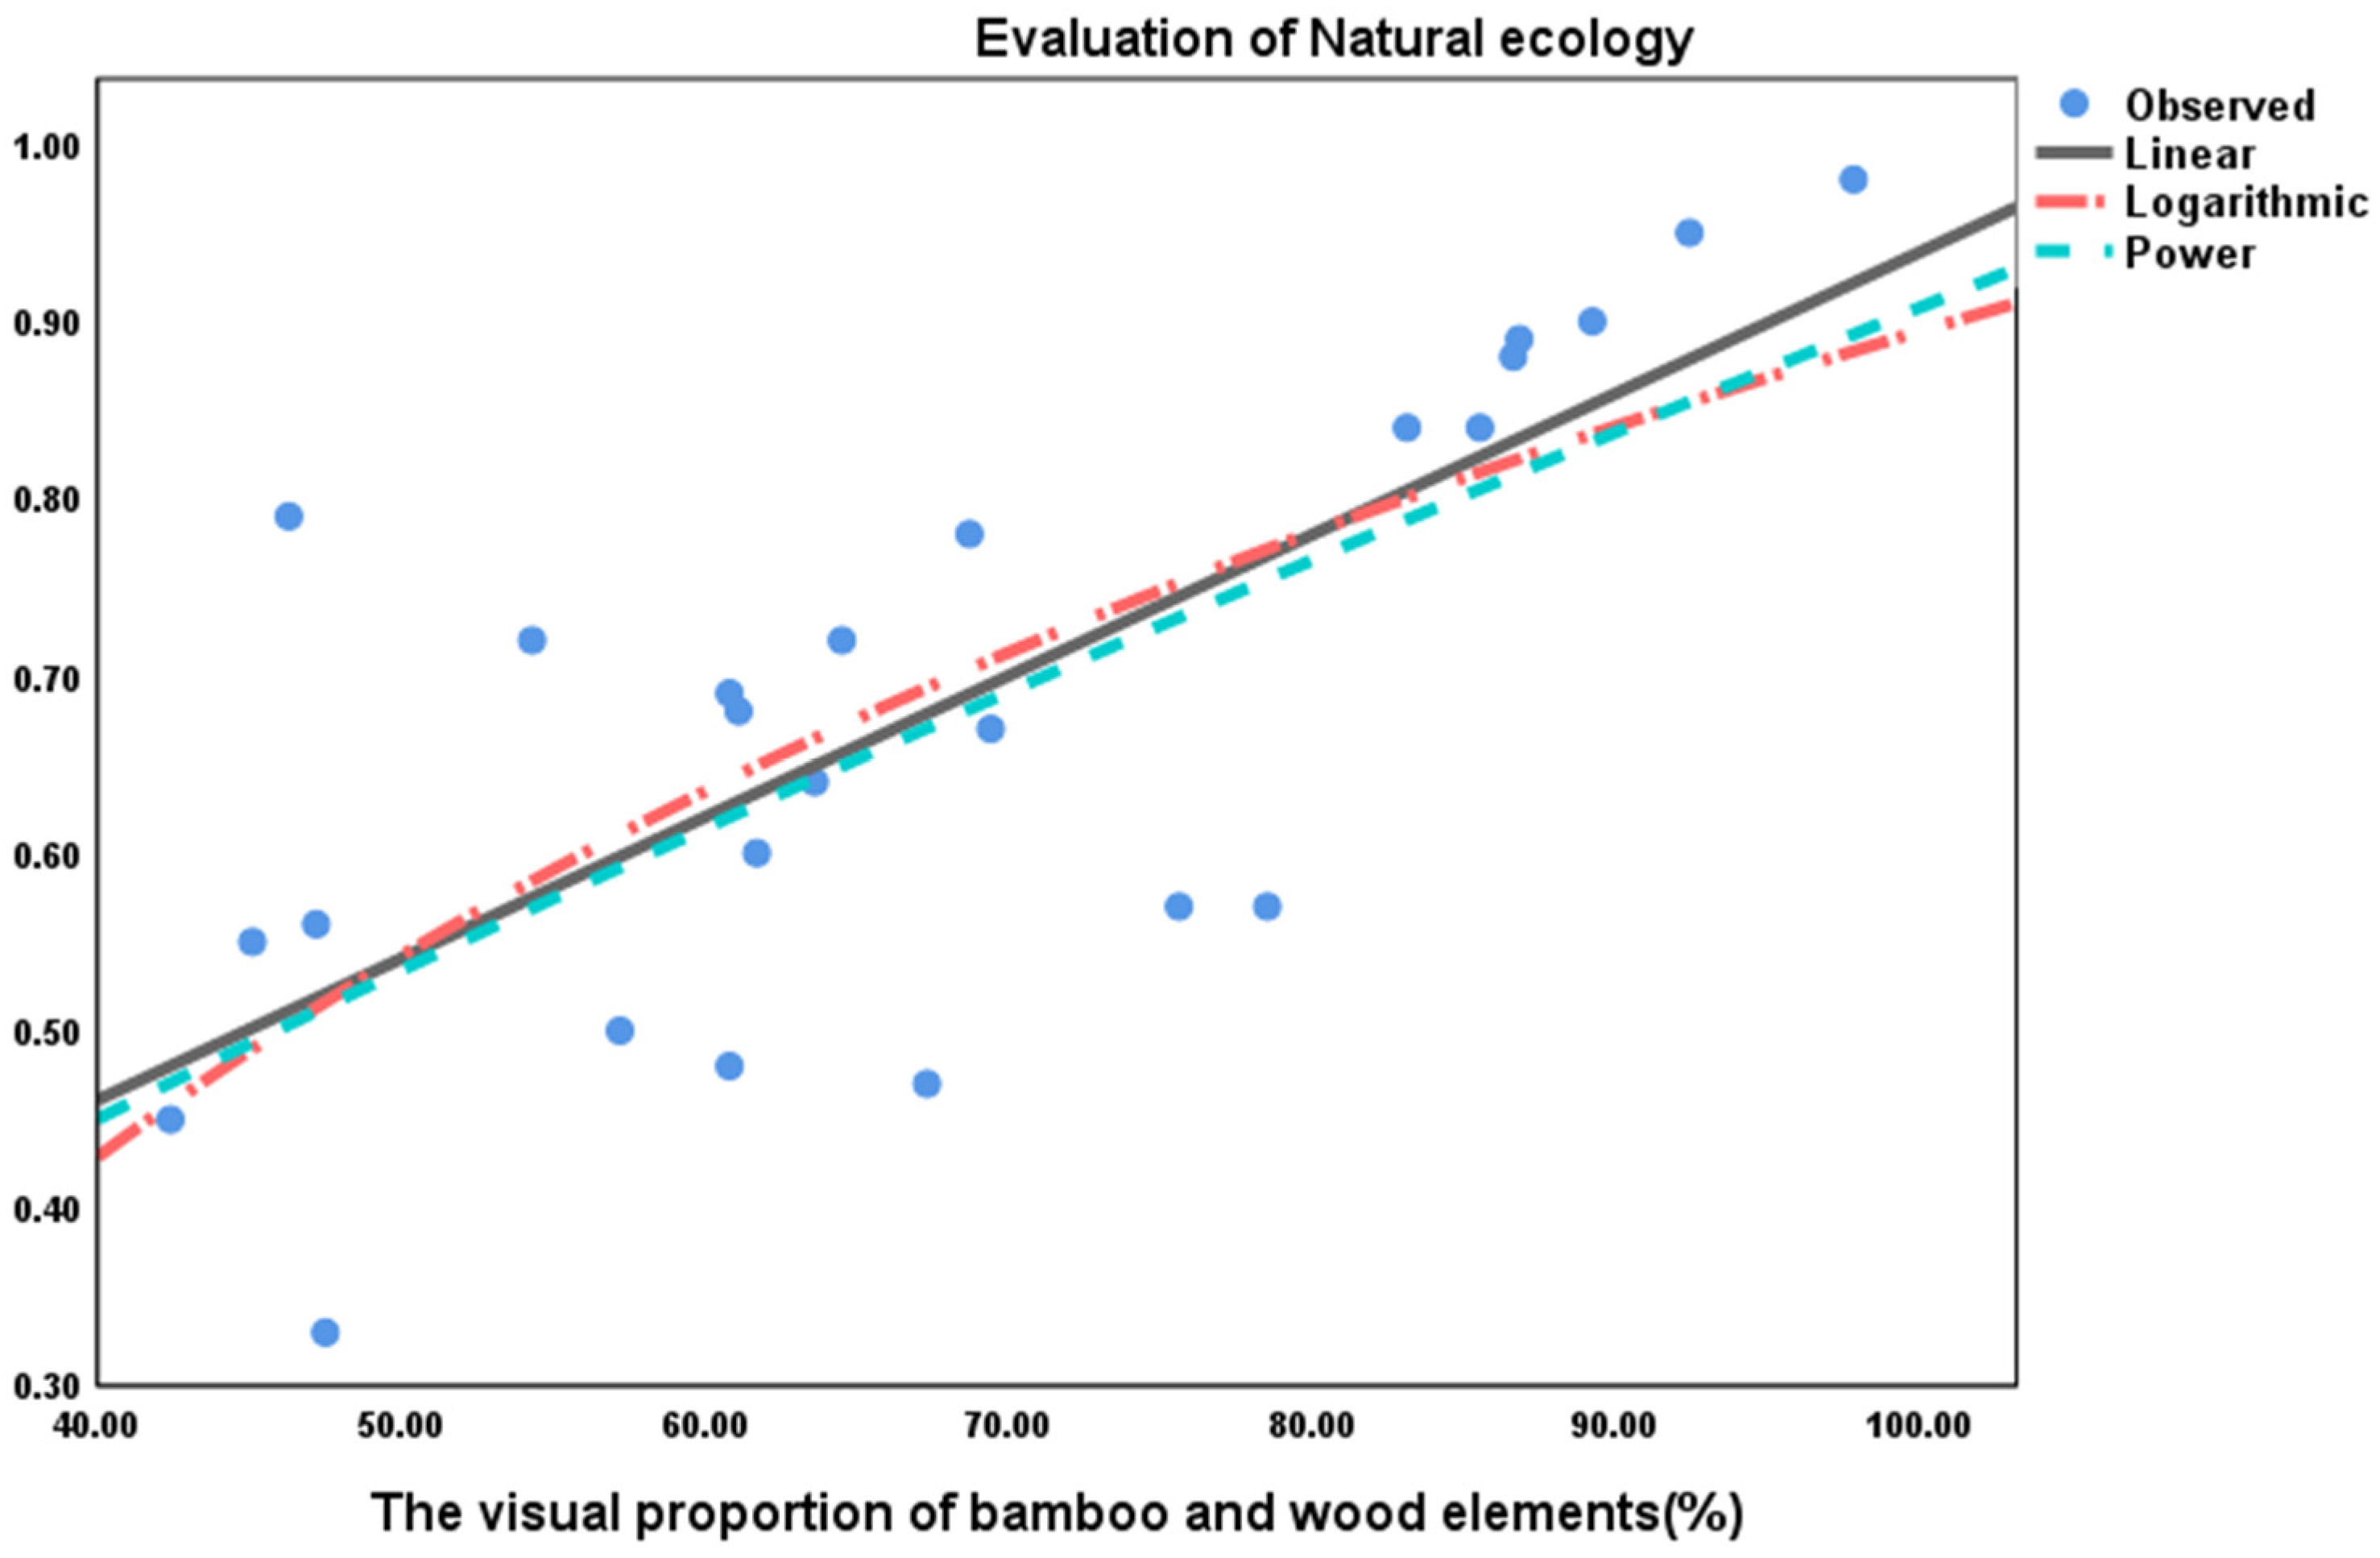
Figure 11.
Color Measurement - Evaluation of color Fitting Curve.
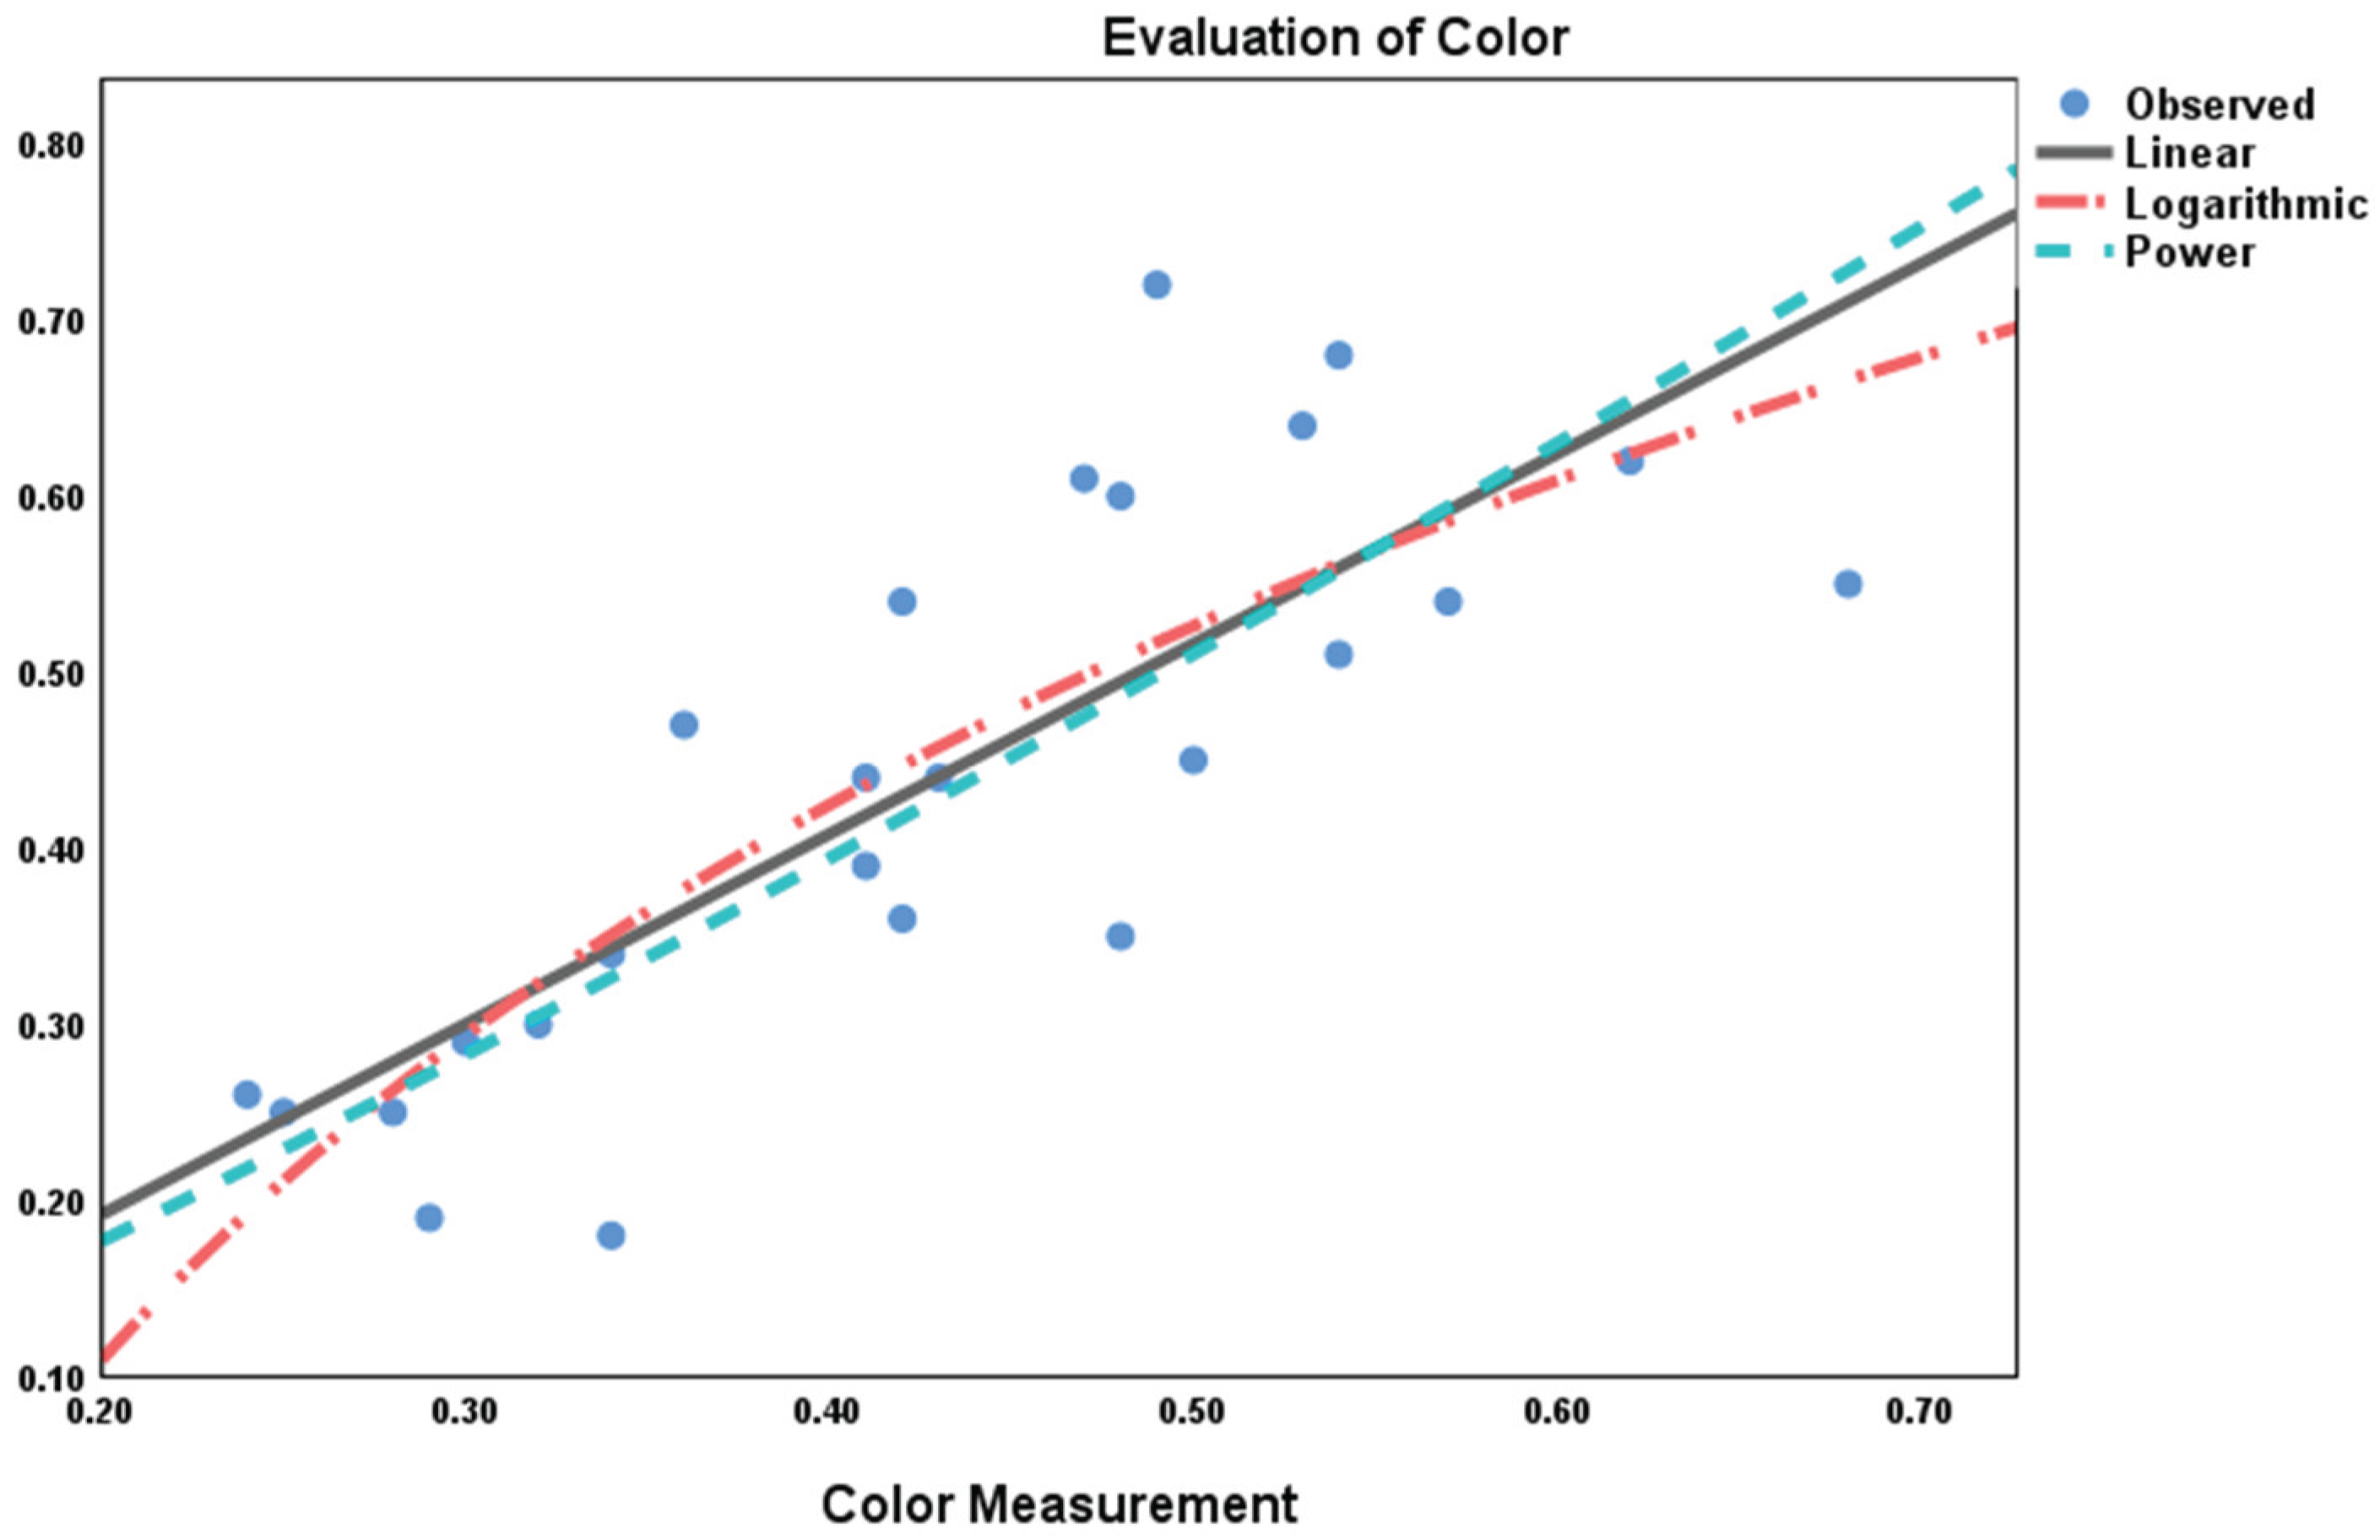
Figure 12.
Sky View Factor - Evaluation of Visual permeability Fitting Curve.
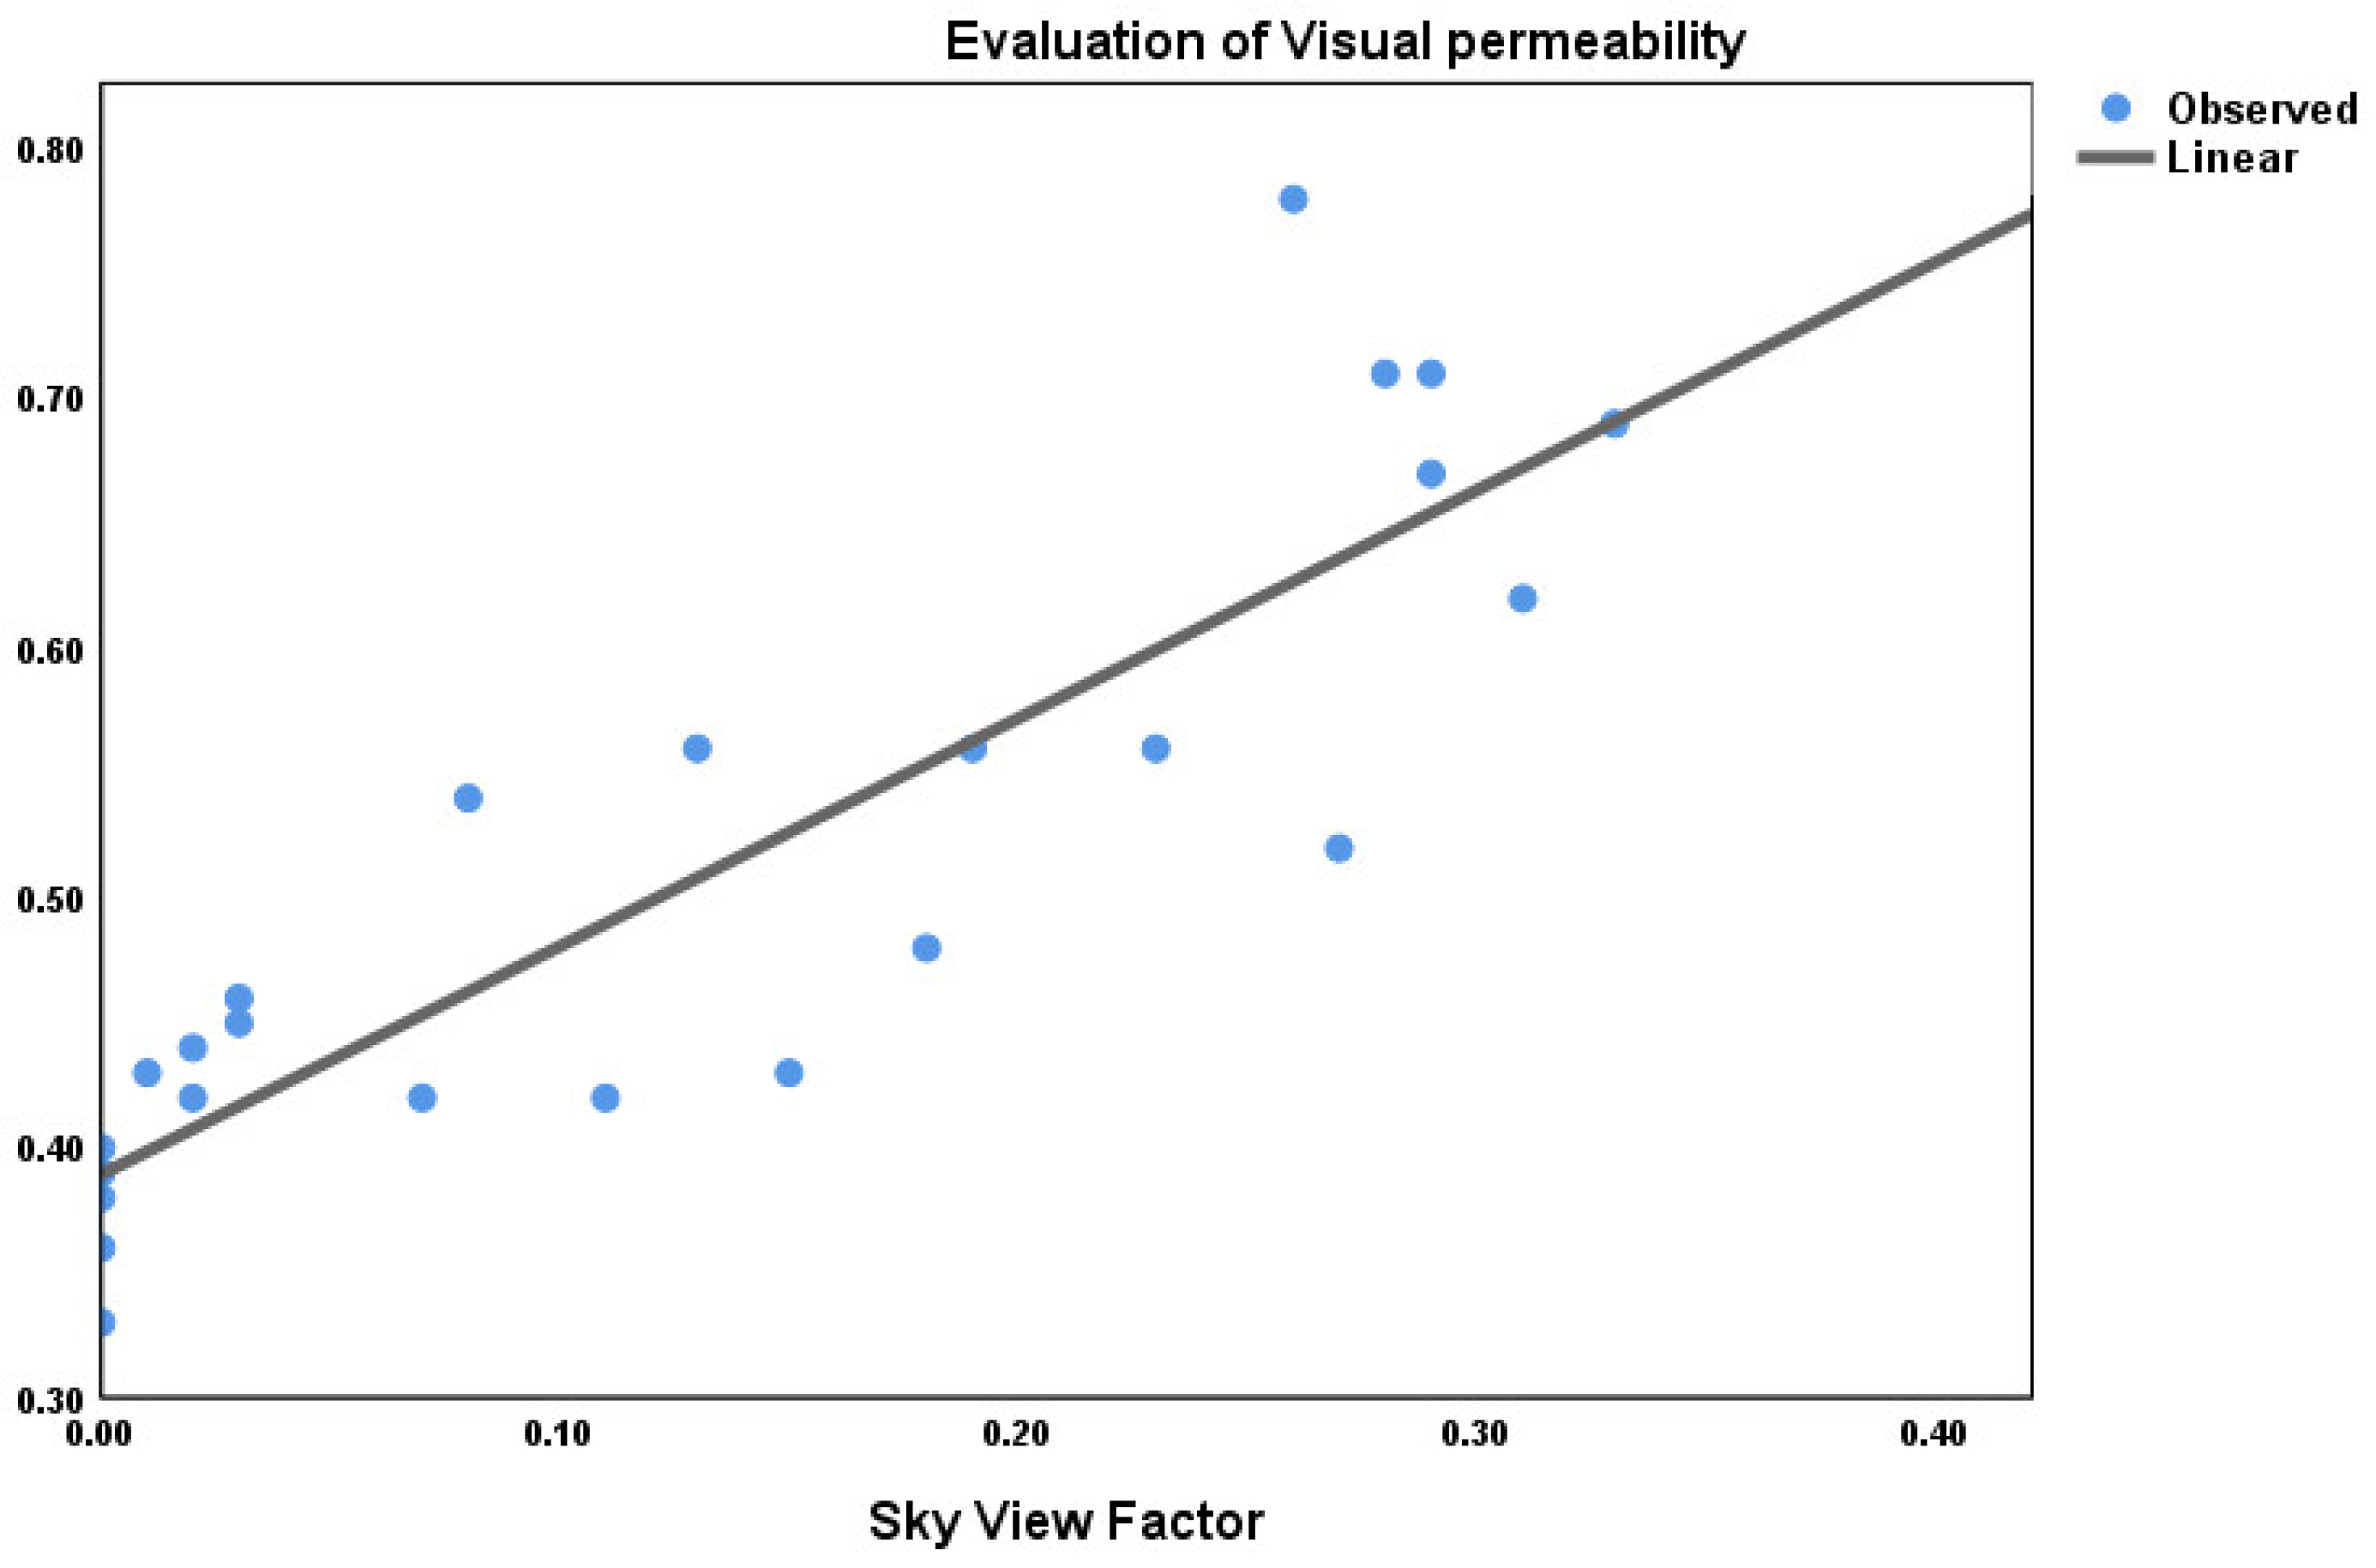
Figure 13.
Proportionality- Evaluation of scale and proportionality Fitting Curve.
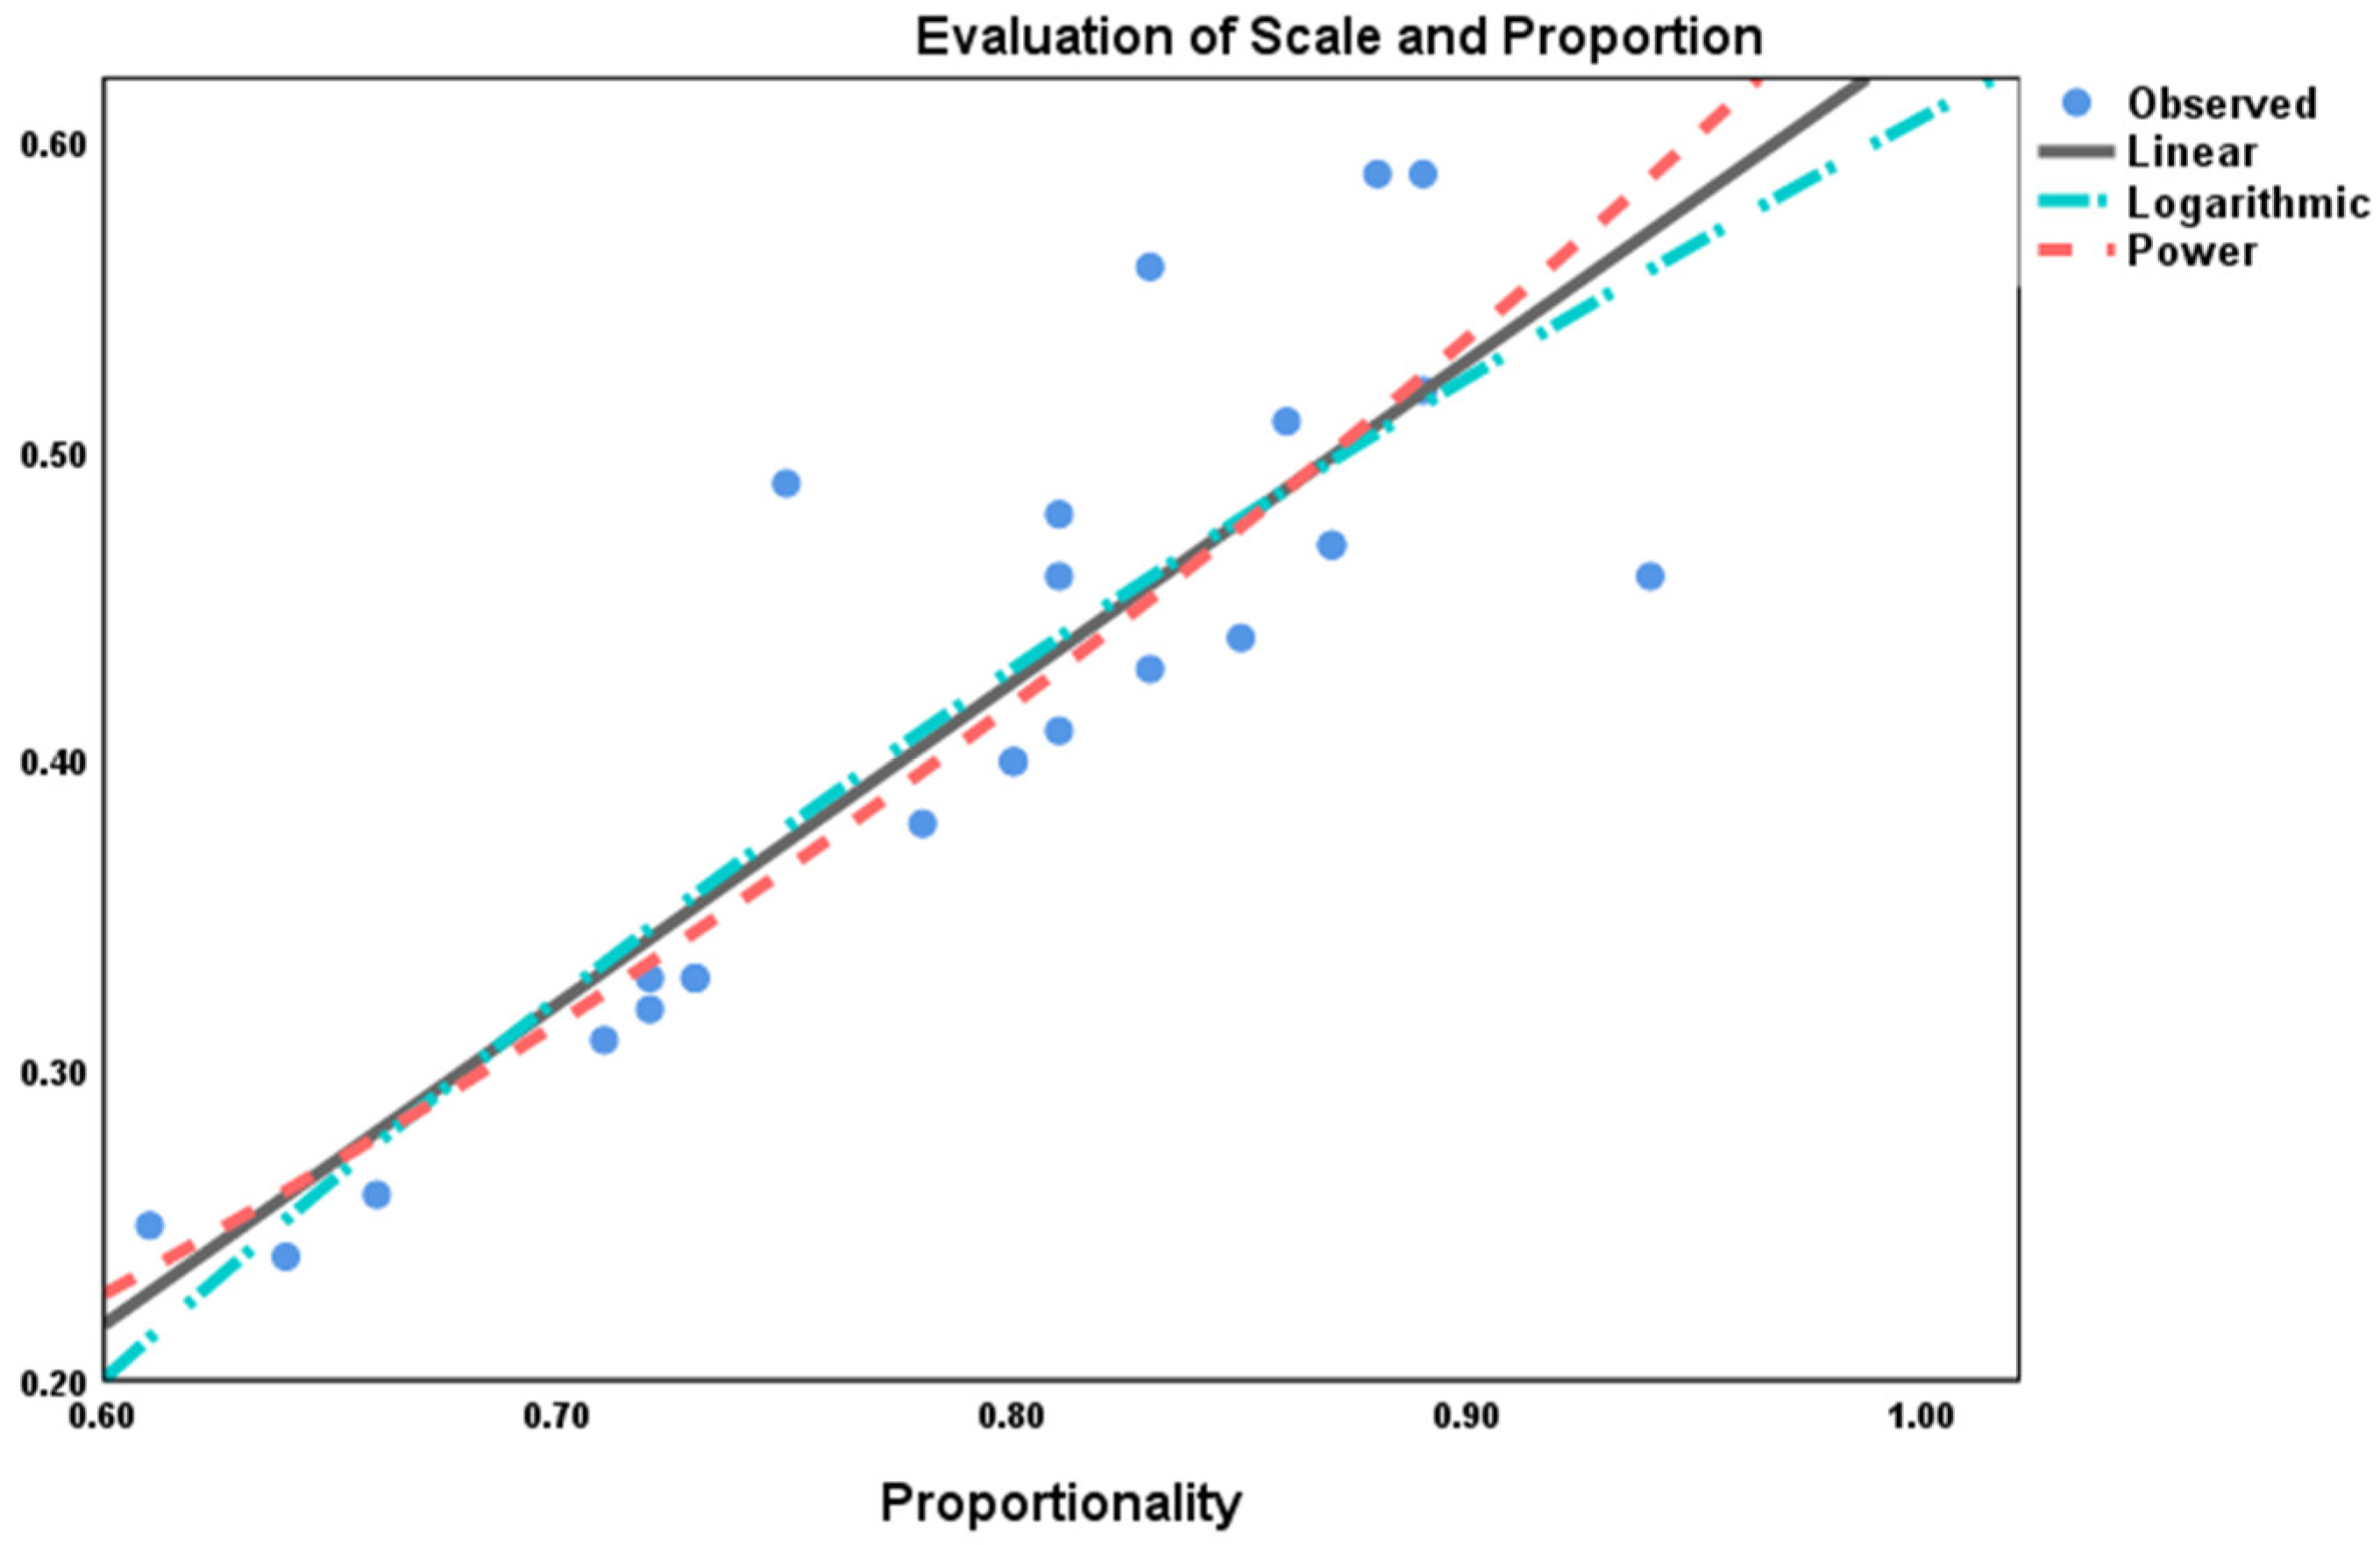
Table 2.
Evaluation index table of bamboo and wood landscape bridges.
| Order | Major factor |
| 1 | Natural ecology |
| 2 | Coordination and unity |
| 3 | Scale and proportion |
| 4 | Colour |
| 5 | Visual Transparency |
Table 3.
SD factor evaluation.
| SD evaluation factor | Adjectives are correct |
| Natural ecology | Extremely poor - excellent |
| Coordination and unity | Messy - Unified |
| Scale and proportion | Imbalance - Coordination |
| Color | Chaos - Harmony |
| Visual Transparency | Covering - Transparent |
Table 4.
Table of Cronbach’s Alpha Coefficients for Questionnaires by Bridge.
| Natural ecology | Coordination and unity | Scale and proportion | Colour | Visual Transparency | Overall Landscape Evaluation | |
| Bridge A | 0.662 | 0.701 | 0.620 | 0.698 | 0.630 | 0.615 |
| Bridge B | 0.606 | 0.628 | 0.593 | 0.607 | 0.572 | 0.601 |
| Bridge C | 0.565 | 0.578 | 0.539 | 0.519 | 0.542 | 0.503 |
| Bridge D | 0.594 | 0.610 | 0.593 | 0.609 | 0.611 | 0.567 |
| Bridge E | 0.654 | 0.639 | 0.575 | 0.603 | 0.604 | 0.569 |
| Bridge F | 0.585 | 0.598 | 0.553 | 0.607 | 0.573 | 0.547 |
| Bridge G | 0.614 | 0.629 | 0.646 | 0.639 | 0.609 | 0.590 |
| Bridge H | 0.551 | 0.615 | 0.566 | 0.581 | 0.593 | 0.521 |
| Bridge I | 0.595 | 0.620 | 0.606 | 0.607 | 0.605 | 0.600 |
| Bridge J | 0.600 | 0.600 | 0.595 | 0.578 | 0.596 | 0.543 |
Table 5.
Table of KM0 values and common factor variance values of evaluation conclusions.
| Bridge A | BridgeB | BridgeC | BridgeD | BridgeE | ||
| KMO value | 0.768 | 0.749 | 0.718 | 0.712 | 0.740 | |
| Common factor variance | Natural ecology | 0.690 | 0.594 | 0.496 | 0.617 | 0.429 |
| Coordination and unity | 0.440 | 0.507 | 0.440 | 0.555 | 0.486 | |
| Scale and proportion | 0.659 | 0.623 | 0.570 | 0.614 | 0.691 | |
| Colour | 0.521 | 0.589 | 0.631 | 0.559 | 0.634 | |
| Visual Transparency | 0.669 | 0.685 | 0.575 | 0.549 | 0.639 | |
| Overall Landscape Visual Evaluation | 0.716 | 0.598 | 0.692 | 0.688 | 0.719 | |
| Bridge F | BrdigeG | BridgeH | Bridge I | BridgeJ | ||
| Common factor variance | KMO value | 0.738 | 0.767 | 0.724 | 0.768 | 0.733 |
| Natural ecology | 0.491 | 0.645 | 0.646 | 0.611 | 0.544 | |
| Coordination and unity | 0.675 | 0.587 | 0.529 | 0.551 | 0.540 | |
| Scale and proportion | 0.658 | 0.515 | 0.616 | 0.639 | 0.574 | |
| Colour | 0.704 | 0.549 | 0.574 | 0.589 | 0.613 | |
| Visual Transparency | 0.541 | 0.658 | 0.514 | 0.599 | 0.567 | |
| Overall Landscape Visual Evaluation | 0.609 | 0.703 | 0.717 | 0.668 | 0.708 | |
| BridgeA | BridgeB | BridgeC | BridgeD | BridgeE | ||
| Common factor variance | KMO value | 0.768 | 0.749 | 0.718 | 0.712 | 0.740 |
| Natural ecology | 0.690 | 0.594 | 0.496 | 0.617 | 0.429 | |
| Coordination and unity | 0.440 | 0.507 | 0.440 | 0.555 | 0.486 | |
| Scale and proportion | 0.659 | 0.623 | 0.570 | 0.614 | 0.691 | |
| Colour | 0.521 | 0.589 | 0.631 | 0.559 | 0.634 | |
| Visual Transparency | 0.669 | 0.685 | 0.575 | 0.549 | 0.639 | |
| Overall Landscape Visual Evaluation | 0.716 | 0.598 | 0.692 | 0.688 | 0.719 | |
| 桥F | 桥G | 桥H | 桥I | 桥J | ||
| Common factor variance | KMO value | 0.738 | 0.767 | 0.724 | 0.768 | 0.733 |
| Natural ecology | 0.491 | 0.645 | 0.646 | 0.611 | 0.544 | |
| Coordination and unity | 0.675 | 0.587 | 0.529 | 0.551 | 0.540 | |
| Scale and proportion | 0.658 | 0.515 | 0.616 | 0.639 | 0.574 | |
| Colour | 0.704 | 0.549 | 0.574 | 0.589 | 0.613 | |
| Visual Transparency | 0.541 | 0.658 | 0.514 | 0.599 | 0.567 | |
| Overall Landscape Visual Evaluation | 0.609 | 0.703 | 0.717 | 0.668 | 0.708 |
Table 6.
Mean value of natural ecological evaluations.
| Bridge number | A | B | C | D | E | F | G | H | I | J |
| Evaluation value | 0.67 | 0.62 | 0.57 | 0.57 | 0.33 | 0.60 | 0.64 | 0.47 | 0.50 | 0.48 |
Table 7.
Mean value of coordinated and harmonized evaluations.
| Bridge number | A | B | C | D | E | F | G | H | I | J |
| Evaluation value | 0.56 | 0.17 | 0.56 | 0.21 | 0.3 | 0.89 | 0.35 | 0.27 | 0.13 | 0.42 |
Table 8.
Mean value of scale and proportion evaluations.
| Bridge number | A | B | C | D | E | F | G | H | I | J |
| Evaluation value | 0.48 | 0.40 | 0.33 | 0.59 | 0.33 | 0.31 | 0.40 | 0.47 | 0.46 | 0.25 |
Table 9.
Average color rating.
| Bridge number | A | B | C | D | E | F | G | H | I | J |
| Evaluation value | 0.72 | 0.61 | 0.62 | 0.60 | 0.54 | 0.64 | 0.68 | 0.54 | 0.51 | 0.55 |
Table 10.
Mean value of visual permeability evaluation.
| Bridge number | A | B | C | D | E | F | G | H | I | J |
| Evaluation value | 0.44 | 0.43 | 0.40 | 0.39 | 0.38 | 0.42 | 0.68 | 0.71 | 0.45 | 0.54 |
Table 11.
Overall Landscape Aesthetics Evaluation Mean.
| Bridge number | A | B | C | D | E | F | G | H | I | J |
| Evaluation value | 0.61 | 0.69 | 0.36 | 0.43 | 0.51 | 0.58 | 0.56 | 0.54 | 0.55 | 0.67 |
Table 12.
Bridge A multiple linear regression analysis coefficient.
| Non standardized coefficient | t | p | ||
| regression coefficient | Standard Error | |||
| constant | 1.022 | 0.446 | 2.290 | 0.023* |
| Natural ecology | 0.085 | 0.069 | 1.233 | 0.219 |
| Coordination and unity | 0.124 | 0.06 | 2.083 | 0.039* |
| Scale and proportion | 0.233 | 0.064 | 3.667 | 0.000** |
| Colour | 0.155 | 0.063 | 2.474 | 0.014* |
| Visual Transparency | 0.203 | 0.065 | 3.100 | 0.002** |
Note: **. at level 0.01 (dual tailed),Significant correlation,*. at level 0.05 (double tailed),Significant correlation.
Table 13.
Digital photo of the evaluated bamboo and wood landscape bridge.
| Bridge number |
Bridge number |
Realistic Bridge Scene |
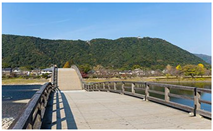
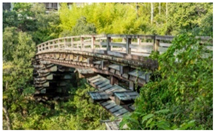
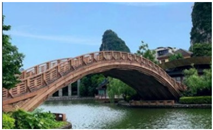
| 1 | Feihong Bridge |
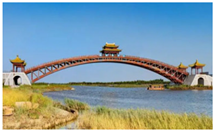 
|
| 2 | Canal corridor bridge |
|
| 3 | Crane Dance Bridge |
|
| 4 | Banfu Town River Bridge |
|
| 5 | single-plank bridge |
|
| 6 | Convenient Bridge |
|
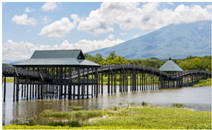
| 7 | Suspended shore flying bridge |
|
| 8 | Kintai Bridge |
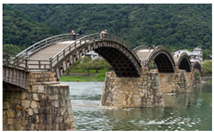 
|
| 9 | Yuan Bridge |
|
| 10 | Mulong Bridge |
|
| 11 | Lover’s Bridge |
|
| 12 | Resort Bamboo Bridge |
|
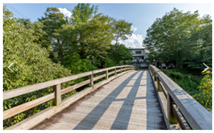
| 13 | Wooden pedestrian bridge |
|
| 14 | Park Bamboo Bridge |
|
| 15 | Yuejian Bridge |
|
Table 14.
Natural Ecology Correlation Analysis Scale.
| Natural ecology | Visual proportion of bamboo and wood elements | ||
| Natural ecology | Pearson correlation | 1 | 0.746** |
| Significance (dual tailed) | 0.000 | ||
| Number of cases | 25 | 25 | |
| Visual proportion of bamboo and wood elements | Pearson correlation | 0.746** | 1 |
| Significance (dual tailed) | 0.000 | ||
| Number of cases | 25 | 25 | |
Note, **. at the 0.01 level (double tailed), the correlation is significant.
Table 15.
Coordination and Harmonization Correlation Analysis Scale.
| Coordination and unity | Visual entropy | ||
| Coordination and unity | Pearson correlation | 1 | -0.854** |
| Significance (dual tailed) | 0.000 | ||
| Number of cases | 25 | 25 | |
| Visual entropy | Pearson correlation | -0.854** | 1 |
| Significance (dual tailed) | 0.000 | ||
| Number of cases | 25 | 25 | |
Note,**. at the 0.01 level (double tailed), the correlation is significant.
Table 16.
Scale and Proportion Correlation Analysis Scale.
| Scale and proportion | Proportionality | ||
| Scale and proportion | Pearson correlation | 1 | 0.869** |
| Significance (dual tailed) | 0.000 | ||
| Number of cases | 25 | 25 | |
| Proportionality | Pearson correlation | 0.869** | 1 |
| Significance (dual tailed) | 0.000 | ||
| Number of cases | 25 | 25 | |
Table 17.
Colour Correlation Analysis Scale.
| Colour | Color Beauty Value | ||
| Colour | Pearson correlation | 1 | 0.797** |
| Significance (dual tailed) | 0.000 | ||
| Number of cases | 25 | 25 | |
| Color Beauty Value | Pearson correlation | 0.797** | 1 |
| Significance (dual tailed) | 0.000 | ||
| Number of cases | 25 | 25 | |
Note, **. at the 0.01 level (double tailed), the correlation is significant.
Table 18.
Visual Permeability Correlation Analysis Scale.
| Visual Transparency | Sky width | ||
| Visual Transparency | Pearson correlation | 1 | 0.876** |
| Significance (dual tailed) | 0.000 | ||
| Number of cases | 25 | 25 | |
| Sky width | Pearson correlation | 0.876** | 1 |
| Significance (dual tailed) | 0.000 | ||
| Number of cases | 25 | 25 | |
Note,**. at the 0.01 level (double tailed), the correlation is significant.
Table 19.
Summary and parameter estimation table of the model for the visual proportion of bamboo and wood elements and evaluation of natural ecology.
Table 19.
Summary and parameter estimation table of the model for the visual proportion of bamboo and wood elements and evaluation of natural ecology.
| Equation | Model summary | Parameter estimation value | |||||
| R square | F | Freedom 1 | Freedom 2 | Significance | Constant | b1 | |
| Linear | 0.556 | 28.834 | 1 | 23 | 0.000 | 0.142 | 0.008 |
| logarithm | 0.516 | 24.477 | 1 | 23 | 0.000 | 1.446 | 0.508 |
| Power | 0.477 | 20.935 | 1 | 23 | 0.000 | 0.027 | 0.766 |
Table 20.
Summary and parameter estimation table of the model for the visual entropy and evaluation of coordination and harmonization.
Table 20.
Summary and parameter estimation table of the model for the visual entropy and evaluation of coordination and harmonization.
| equation | Model Summary | Parameter estimation value | |||||
| R square | F | Freedom 1 | Freedom 2 | Significance | constant | b1 | |
| linear | 0.730 | 62.089 | 1 | 23 | 0.000 | 7.447 | -0.920 |
| logarithm | 0.720 | 59.181 | 1 | 23 | 0.000 | 14.061 | -6.710 |
| cloth cover | 0.619 | 37.325 | 1 | 23 | 0.000 | 3.486E+11 | -13.577 |
Table 21.
Summary and parameter estimation table of the model for the colour measurement value.
| and evaluation of colour | |||||||
| equation | Model Summary | Parameter estimation value | |||||
| R square | F | Freedom 1 | Freedom 2 | Significance | constant | b1 | |
| linear | 0.635 | 39.988 | 1 | 23 | 0.000 | -0.024 | 1.080 |
| logarithm | 0.662 | 45.133 | 1 | 23 | 0.000 | 0.841 | 0.455 |
| cloth cover | 0.676 | 47.998 | 1 | 23 | 0.000 | 1.137 | 1.156 |
Table 22.
Summary and parameter estimation table of the model for the sky view factor and evaluation of visual permeability.
Table 22.
Summary and parameter estimation table of the model for the sky view factor and evaluation of visual permeability.
| Equation | Model summary | Parameter estimation value | |||||
| R square | F | Freedom 1 | Freedom 2 | significance | constant | b1 | |
| Linear | 0.768 | 76.026 | 1 | 23 | 0.000 | 0.389 | 0.913 |
Note, the independent variable (sky width) contains non positive values, with a minimum value of 0. Cannot calculate logarithmic and power models.
Table 23.
Summary and parameter estimation table of the model for the proportionality and evaluation of scale and proportion.
Table 23.
Summary and parameter estimation table of the model for the proportionality and evaluation of scale and proportion.
| Equation | Model summary | Parameter estimation value | |||||
| R square | F | Freedom 1 | Freedom 2 | Significance | Constant | b1 | |
| Linear | 0.755 | 70.710 | 1 | 23 | 0.000 | -0.406 | 1.040 |
| logarithm | 0.760 | 72.848 | 1 | 23 | 0.000 | 0.609 | 0.799 |
| Power | 0.818 | 103.471 | 1 | 23 | 0.000 | 0.671 | 2.115 |
Disclaimer/Publisher’s Note: The statements, opinions and data contained in all publications are solely those of the individual author(s) and contributor(s) and not of MDPI and/or the editor(s). MDPI and/or the editor(s) disclaim responsibility for any injury to people or property resulting from any ideas, methods, instructions or products referred to in the content. |
© 2025 by the authors. Licensee MDPI, Basel, Switzerland. This article is an open access article distributed under the terms and conditions of the Creative Commons Attribution (CC BY) license (http://creativecommons.org/licenses/by/4.0/).
Copyright: This open access article is published under a Creative Commons CC BY 4.0 license, which permit the free download, distribution, and reuse, provided that the author and preprint are cited in any reuse.


