
Submitted:
31 May 2025
Posted:
08 June 2025
You are already at the latest version
Abstract
This study examines how Saudi Arabia's quickly growing aviation industry affects the environment by ex-amining the effects of key macroeconomic and structural factors, such as urbanization, financial develop-ment, economic growth, technological innovation, and air transport infrastructure, on CO2 emissions from the transportation sector. This study examines how these factors' influence on emissions vary at different levels of CO₂ emissions from transport using quantile regression techniques on annual data from 1990 to 2022. The findings demonstrate that urbanization and air transportation infrastructure have a reliably posi-tive and statistically significant impact on CO2 emissions across all quantiles. In contrast, financial devel-opment and economic expansion exhibit increasing marginal effects at higher quantiles, which is in line with the Environmental Kuznets Curve (EKC). Technological innovation has a limited impact on reducing emissions at lower quantiles but becomes more effective at higher levels, according to measurements of patent activity. This suggests that the environmental benefits of innovation dissemination occur more slow-ly. These results highlight the necessity of emission-tiered policy actions since they have significant policy implications that align with Saudi Arabia's Vision 2030. In order to support the shift to carbon neutrality and sustainable mobility, This study specifically calls for improved systems for climate-aligned finance and integrated urban planning that targets green investments in aviation.
Keywords:
CO₂ Emissions from transport
; Air Transport
; Financial Development
; Economic Growth
; Sustainabil-ity
; Quantile Regression
1. Introduction
The transport sector is a key contributor to global CO2 emissions, playing a major role in environmental degradation and climate change. In Saudi Arabia, a nation experiencing swift economic and infrastructural advancement, the air transport industry is essential for mobility and economic expansion. Nonetheless, its ecological ramifications stimulate significant apprehensions regarding sustainability. This research examines the influence of air transport infrastructure, financial development, economic growth, innovation, and urbanization on environmental sustainability, specifically regarding CO2 emissions in Saudi Arabia’s transportation sector. Even though Notwithstanding worldwide initiatives to alleviate climate change, Saudi Arabia’s transportation emissions remain a considerable concern. Air transportation, although vital for economic advancement, is a significant source of CO2 emissions (Aldegheishem, 2024). Financial development, innovation, and urbanization, although essential for sustainability, demonstrate intricate and occasionally unclear correlations with environmental results. Elmonshid et al. (2024) emphasized that although financial development may promote cleaner investments, its effectiveness is contingent upon policy alignment and strategic execution
This research utilizes advanced econometric tools to elucidate the complex factors influencing emissions in this rapidly transforming economy. Dai et al. (2023) also underscored the significance of innovation in reducing emissions, albeit its efficacy is contingent upon the magnitude and velocity of implementation. The absence of thorough, quantile-based analysis investigating these correlations at various emission levels restricts policymakers’ understanding of viable mitigation options. This work fills this gap by employing quantile regression analysis to examine the impact of these variables on CO2 emissions across different emission levels.
Figure 1 presents the trend of CO₂ emissions from air transport in Saudi Arabia for the period 2013 to 2024, categorized according to the UNFCCC’s territory principle and the SEEA’s residence principle for both passenger and freight flights where ERPP(Emissions, SEEA (residence principle)Passenger flights), ERPF (Emissions, SEEA (residence principle) Freight flights), ETPP( Emissions, UNFCCC inventories (territory principle)Passenger flights) and ETPF (Emissions, UNFCCC inventories (territory principle) Freight flights).
The data indicate that the highest emissions consistently originate from passenger flights under the residence principle (ERPP), rising from approximately 5.77 million tons in 2013 to over 10.13 million tons in 2024. In 2020, ERPP emissions decreased to 4.64 million tons, indicative of the global disruption in air travel caused by the COVID-19 pandemic. Similar declines were noted across all categories in 2020, especially for passenger emissions under the territory principle (ETPP), which decreased from 6.96 million tons in 2017 to slightly over 2.02 million tons. Emissions experienced a notable increase after 2020, with ETPP reaching 7.91 million tons in 2024.
In contrast, freight flight emissions, governed by residence (ERPF) and territory (ETPF) principles, are significantly lower and exhibit relative stability. ERPF emissions decreased from approximately 972,000 tons in 2013 to 543,553 tons in 2024, whereas ETPF emissions consistently stayed below 550,000 tons during the same timeframe. The data indicates that passenger air traffic is the predominant contributor to aviation-related CO₂ emissions from transport in Saudi Arabia, whereas freight contributes to a lesser extent. The recovery following the pandemic is notably robust in passenger-related emissions, reflecting a revival in both international and domestic travel, likely driven by economic normalization and the reinstatement of tourism and business mobility.
This study offers a distinctive contribution to the literature by examining Saudi Arabia, a country experiencing substantial economic and environmental policy changes within the context of its Vision 2030 initiative. This study utilizes quantile regression analysis to capture the varied impacts of major factors throughout the range of CO2 emissions, in contrast to the mean-based approaches employed by most prior studies. This method provides a more refined comprehension of the factors influencing emissions and underscores key policy lessons for emissions reduction throughout the whole emissions spectrum. This emphasis corresponds with observations by Almatar (2024), who highlighted the increasing emissions concerns associated with urbanization, and Aldegheishem (2024), who emphasized the critical significance of air transport in Saudi Arabia’s environmental landscape.
The study utilizes quantile regression approaches to evaluate the influence of air transport passengers, technical innovation, financial growth, GDP per capita, and urban population on transport-related CO2 emissions from 1990 to 2022. The model undergoes additional evaluation with the Breusch-Pagan-Godfrey test to test the heterogeneity in the data. The study employs econometric methodologies to guarantee robust and trustworthy conclusions that accommodate nonlinearity and variability in the data.
The paper is organized as follows: The initial section presents the study and delineates the research topic, its importance, and the methods employed. The next part examines the pertinent literature, emphasizing current research deficiencies. The third part delineates the data and econometric methods used for the analysis. The fourth section encompasses the results and comments, including comprehensive interpretations of the findings and their correlation with prior research.
2. Literature Review
The correlation between transport emissions and environmental sustainability has been thoroughly examined in recent years, especially amid rising urbanization and economic expansion. The distinctive interplay of air transport infrastructure, financial development, economic growth, innovation, and urban population in influencing transport-related CO2 emissions necessitates more investigation, particularly for Saudi Arabia. This literature review synthesizes key findings from existing research, highlighting gaps and establishing a foundation for this study.
The literature on emissions, sustainability, and transportation in Saudi Arabia and the broader GCC region highlights several interconnected themes. Transport emissions and sustainability challenges are a significant concern. Studies by Binsuwadan (2024) and Alsabbagh (2024) emphasize the difficulty of achieving carbon-neutral transportation, while Wadud et al. (2024) and Onifade & Haouas (2023) assess the environmental impact of air travel. Aldegheishem (2024) and Chatti & Majeed (2022) further confirm that transportation remains a major contributor to CO2 emissions in the region.
Economic growth, urbanization, and infrastructure development play a crucial role in shaping emissions trends. Mahmood (2022) and Almatar (2024) highlight urbanization as a key driver of emissions, whereas Dai et al. (2023) and Saidi et al. (2018) examine the link between transport infrastructure and economic growth. Raggad (2020) and Alshehry & Belloumi (2017) investigate the Environmental Kuznets Curve (EKC) hypothesis, suggesting that emissions increase with economic growth before eventually declining as economies mature.
The integration of renewable energy and green technology emerges as a viable solution to reducing emissions. Alyousef et al. (2025) and Shan et al. (2021) stress the importance of technological innovation in achieving long-term sustainability. Alanazi & Alenezi (2024) and Altouma et al. (2024) examine how policies under Saudi Vision 2030 and renewable energy adoption contribute to emissions mitigation.
Financial development and policy interventions also influence emissions reduction efforts. Elmonshid et al. (2024) and Patel & Mehta (2023) discuss the complex impact of financial development, which can either support or hinder emissions reduction depending on investment priorities. Shehri et al. (2023) and Umar et al. (2020) analyze policy frameworks such as Saudi Arabia’s circular carbon economy and financial mechanisms that facilitate emissions control.
Regional and sector-specific studies provide further insights into emissions trends. Farahat (2016) and Bartle et al. (2021) examine air pollution and sustainability challenges in air freight, while Awan et al. (2022) and Avotra & Nawaz (2023) explore the asymmetric effects of urbanization and transportation on emissions. Collectively, these studies underscore the complexity of emissions reduction strategies, which depend on the interplay between economic growth, technological advancements, infrastructure development, and policy measures across the GCC region.
The review of Relevant Literature highlights significant themes in air transport infrastructure, financial development, economic growth, innovation, and urbanization, with a focus on their impact on CO₂ emissions from transport. Prior research has identified air transportation as a major contributor to emissions, whereas financial development has mixed effects, either encouraging green investments or increasing emissions through industrial expansion. Economic growth follows the Environmental Kuznets Curve (EKC), in which emissions rise initially before falling as economies mature. Existing research primarily uses mean-based regression models, which do not account for the changing effects of these components at different CO₂ emission levels. Furthermore, most studies lack a Saudi Arabia-specific focus, ignoring the country’s distinct economic trajectory, Vision 2030 initiatives, and growing air transport sector. The importance of innovation is acknowledged, but the delayed impact of green technologies on emissions reductions is not considered. Furthermore, the relationship between financial development and sustainable investment is poorly understood, and urbanization’s contribution to emissions requires further investigation into transportation infrastructure growth. This work overcomes these gaps with quantile regression, providing a thorough, emission-level-specific analysis to generate precise policy recommendations for Saudi Arabia’s sustainability goals.
2.1. Research Gap
Despite the fact that previous research has examined the impact of variables like economic growth, financial development, and transportation on CO₂ emissions from transport, the majority of these studies have depended on traditional mean-based models like OLS, which presume consistent impacts across all emission levels. This ignores the possibility of variation in the ways in which these factors affect emissions at various distributional sites. Additionally, innovation—a crucial component in improving energy efficiency and reducing environmental damage—has received less attention, especially in developing nations. Additionally, there is a conspicuous lack of research based on quantile regression, especially with regard to Saudi Arabia, where major structural reforms under Vision 2030 are changing the country’s economic and environmental landscape.
This research investigates the varying effects of air transport infrastructure, financial development, economic growth, innovation, and urbanization on the distribution of CO2 emissions. This aspect has not been examined in prior research, providing comprehensive insights and actionable policy recommendations.
2.2. Hypothesis Development
2.2.1. Air Transport Infrastructure, Urban Population and Emissions
Several studies underline how much the infrastructure of air travel affects CO2 emissions. While Wadud et al. (2024) draw attention on the unequal consequences of long-distance air travel, Aldegheishem (2024) notes that air transportation is a main contributor of emissions in Saudi Arabia. Inspired by regional travel needs, Onifade and Haouas (2023) acknowledge air travel as a complicated contributor to pollutants. Passenger movement directly affects the volume of transportation, hence the development of the infrastructure is sometimes judged in terms of passenger movement. Research by Umar et al. (2020), Mercure and Lam (2015), and Sun et al. (2019) imply that proxies for infrastructure efficiency and capacity are measures air transport passengers as proxies of transportation infrastructure.
Urbanization is regularly associated with an increase in emissions. Mahmood (2022) and Almatar (2024) emphasize the strain of urban population development on transportation infrastructures, resulting in heightened emissions. Effective urban planning is essential for alleviating these impacts.
The following formulation of the first hypothesis can be made in light of the results of earlier research:
Hypothesis 1:
Air transport infrastructure and urban population positively impacts transport-related CO2 emissions.
2.2.2. Financial Development, Economic Growth and Emissions
Elmonshid et al. (2024) and Patel and Mehta (2023) contend that financial development may promote investments in green technology, while its direct effect on emissions is unclear. Raggad (2020) emphasizes nonlinear interactions, indicating that the impact of financial development is contingent upon its congruence with sustainability goals.
As evidenced by Alshehry and Belloumi (2017) and Saidi et al. (2018), posits that emissions first rise with economic expansion and subsequently decrease as countries develop. This link is especially pertinent in Saudi Arabia, where swift economic growth coexists with ecological initiatives.
The following formulation of the second hypothesis can be made in light of the results of earlier research:
Hypothesis 2:
Financial development and Economic growth initially significantly impact CO2 emissions.
2.2.3. Innovation and Emissions
Shan et al. (2021) and Awan et al. (2022) underscore the significance of innovation in reducing emissions. The temporal delay between technical innovation and its implementation frequently constrains its immediate impact on emissions reduction.
The following formulation of the third hypothesis can be made in light of the results of earlier research
Hypothesis 3:
Innovation negatively impacts CO2 emissions but exhibits delayed effects.
3. Methodology
This section delineates the methodological framework utilized to examine the factors influencing transport-related CO2 emissions in Saudi Arabia. This study analyzes the impact of major variables, such as air transport passengers, technical patents, financial development, GDP per capita, and urban population, on CO2 emissions, utilizing yearly data from 1990 to 2022. The research uses sophisticated econometric tools, such as quantile regression, to elucidate the varied impacts of these factors across distinct levels of emissions. The model’s derivation is based on existing literature and theoretical frameworks, providing a solid analytical foundation. The analysis is enhanced by doing stationarity testing using the Augmented Dickey-Fuller (ADF) test and validating the functional form with The Breusch-Pagan-Godfrey test assesses heterogeneity in the data, indicating a lack of consistent variance, which justifies the use of Quantile Regression (QR). This thorough methodology guarantees that the results are both statistically valid and contextually significant, enhancing the wider discussion on environmental sustainability and emissions mitigation methods within the transportation industry.
3.1. Data and Data Sources
This study employs yearly data from 1990 to 2022, concentrating on factors essential for comprehending the dynamics of transport-related emissions in Saudi Arabia. The dependent variable is carbon dioxide emissions from the transportation sector, especially from energy-related activities, quantified in metric tons (Mt CO2). The independent variables are air transport passengers (AIRP) as proxies of transportation infrastructure used as independent variables, technical patents (ATP), financial development index (FDI), GDP per capita (GDP), and urban population (POP), the sources of data are as follows:

Table 1.
Variable and data sources.
| Symbol | Variable | Sources |
|---|---|---|
| CO2 | Carbon dioxide (CO2) emissions from Transport (Energy) (Mt CO2e) | https://databank.worldbank.org/ |
| FDI | Financial Development Index | https://data.imf.org/?sk=f8032e80-b36c-43b1-ac26-493c5b1cd33b |
| GDP | GDP per capita (constant 2015 US$) | https://databank.worldbank.org/ |
| ATP | All technologies (total patents) | https://stats.oecd.org/Index.aspx? |
| POP | Urban population | https://databank.worldbank.org/ |
| AIRP | Air transport, passengers carried | https://databank.worldbank.org/ |
Equations illustrate the study variables.
Where yit denotes the logarithm of the number for country yi at year t, xit = (, ... , )T is ap ×1vector of independent variables, and ai denotes the (unobserved) county effect, which controls for time-invariant sources of unobserved heterogeneity, such as geography, and formal institutions.
Here, the authors represent individual countries in the GCC, and t represents time. Is the error term and at nine quantiles, namely 0.25, 0.50, 0.75The expected relationships between various economic indicators and CO2 emissions in Saudia Arabia from 1990 to 2022 to provide a brief analysis
Here, the authors represent individual countries in the GCC, and t represents time. Is the error term and at nine quantiles, namely 0.15,0.20,0.30,0.40, 0.50, 0.60, 0.70, 0.85 The expected relationships between various economic indicators and CO2 emissions in Saudia Arabia from 1990 to 2022 to provide a brief analysis
3.2. Derivation of the Model
This study’s empirical model is based on the correlation between CO2 emissions and significant economic, demographic, and technical variables. Based on previous research, the model posits that emissions are affected by air transport activities, innovation, financial development, economic expansion, and urbanization. Consequently, we employ quantile regression to assess the impact of independent factors on a dependent variable across several conditional distributions, building upon standard linear regression Koenker, et al. (1978). Let (yi, xi), where i = 1, 2, 3, ..., and N is the total number of observations from the population. In this context, xi represents a (Kx1) vector of regressors. We develop the conditional quantile regression model on the premise that the θth quantile of the conditional distribution of yi is a linear function of xi.
yi = αθxi′ + ui,θ,
Quantθ(yi|xi) = inf {y: Fi(y|x) θ} = αθxi′,
Quantθ(ui,θ |xi) = 0,
Quantθ(yi|xi) = inf {y: Fi(y|x) θ} = αθxi′,
Quantθ(ui,θ |xi) = 0,
Quantθ(yi|xi) represents the θth conditional quantile of yi based on the regression vector xi; αθ signifies the coefficient vectors to be estimated for various θ values in the interval (0,1); and uθ denotes the error term, which is presumed to possess a continuously differentiable cumulative distribution function. Fuθ (.|x) and the density function fuθ (.|x). Fi(.|x) denotes the conditional distribution function of y. By transforming the value of θ from 0 to 1, we examine the whole distribution of the dependent variable y conditional on the independent variable x. We derive the estimation for the parameter aθ as follows:
min ∑n pθ (yi − αθ xi′)
Where pθ(u) is the “check function”, which, in turn, is defined as:
P(u) = θu if u ≥ 0
(θ − 1) u < 0
(θ − 1) u < 0
To construct the regression model, we use penalized panel quantile regression with a fixed effect. The penalized version of the estimator is then solved using the following equation.:
Let τ be a parameter (0 < τ < 1) representing quantile size. According to Bao et al. (2006), the primary advantage of quantile regression over ordinary least squares (OLS) lies in its capacity to analyze the entire distribution. In contrast, traditional OLS regression permits researchers to estimate only the conditional mean and median, which are situated at the center of the distribution, thereby offering an incomplete characterization of the conditional distribution, as noted by Mosteller and Tukey (1977). Moreover, quantile regression exhibits greater robustness than OLS, as it is relatively insensitive to outliers and distributions with heavy tails. Consequently, we utilize penalized panel quantile regression with fixed effects to construct the regression model and resolve the penalized version of the estimator using the following equation.
Where (u) = u(tk − I(u ≤ 0)) is the standard quantile loss function (Koenker, 2004) and Is the relative weight given to the kth quantile, which controls for the contribution of the kth quantile to the estimation of the fixed-effects panel data mode.
The stationarity of the variables is assessed by the Augmented Dickey-Fuller (ADF) test to confirm that the regression outcomes are not misleading. Variables identified as non-stationary at their levels are differenced to attain stationarity since the majority of variables are integrated of order one (I(1)).
The Breusch-Pagan-Godfrey test the heterogeneity in the data, the outcomes of these tests inform the strength of the conclusions and enhance confidence in the dependability of the findings. This scientific approach guarantees a thorough comprehension of the dynamic interactions among the variables, providing significant insights for policy and practice.
4. Results and Discussion
This section analyzes CO2 emissions from Saudi Arabia’s transportation sector using quantile regression and the Breusch-Pagan-Godfrey test. It examines the impact of factors like air transport passengers, technological patents, FDI, GDP per capita, and urban population on emissions, enhancing model resilience and understanding of sustainability.
4.1. Descriptive Statistics
Descriptive Statistics summarize the central tendency, dispersion, and shape of a dataset’s distribution, presented in the table below.
Descriptive statistics in Table 2 provide critical insights into a dataset by detailing the central tendency, variability, and distribution of each variable. The average CO₂ emissions from transport are 92.52 Mt CO₂e, with a minimum of 49.40 Mt and a maximum of 146.94 Mt, indicating significant temporal variability likely associated with changes in transportation demand and environmental regulation. The standard deviation of 35.13 indicates variability, and the slightly right-skewed distribution (skewness = 0.277) suggests a higher frequency of lower-emission years, with fewer years showing exceptionally high emission levels.
The variable Air Transport Passengers (AIRP) exhibits a mean of 20.1 million passengers and a standard deviation of 9.98 million, indicating considerable variability in passenger volumes. The maximum of 46.18 million and minimum of 9.41 million indicate variations in mobility trends, aviation infrastructure, and potentially global occurrences such as economic fluctuations or pandemics. A right-skewed distribution (skewness = 0.999) indicates a concentration of observations at lower passenger volumes, with significant growth observed in specific years. The findings are consistent with Almatar (2024), who addressed the increasing demand for air transport in Saudi Arabia, and Altouma et al. (2024), who highlighted the country’s initiatives for sustainable mobility within the framework of Vision 2030.
Although the mean of Technological Patents (ATP) is 207.92, a large range (2.45 to 758.08) and a standard deviation of 264.45 expose very significant changes over the years. With a skewness of 1.088, the distribution is quite right-skewed, implying that only few years of significant innovation activity have been seen. These findings show a delayed but perhaps significant function for patents in green technology diffusion since they align with Dai et al. (2023), who observed irregular innovation cycles, and Shan et al. (2021), who related spikes in invention to subsequent emissions.
With rather low variability (Std. Dev. 0.0729) and negligible skewness (0.0828), the Financial Development Index (FDI) averages 0.3912, therefore showing a stable and progressively changing financial sector. As Elmonshid et al. (2024) point out, this stability points to a strong basis for organizing investments, including green financing. The lowest value of 0.2700 and the highest value of 0.5186 indicate that, although oscillations exist, the index usually stays in a reasonable range.
With a mean of $20,028 (in constant 2015 USD), the GDP per capita variable ranges from $15,513 to $26,280, therefore reflecting modest and continuous economic development throughout the two decades. With a skewness of 0.748, the distribution is quite right-skewed, and the standard deviation (3,065.92) reveals some economic volatility. Consistent with results from Ali et al. (2023) and Alshehry & Belloumi (2017), who studied the environmental impact of development in Saudi Arabia, these figures represent early-stage EKC dynamics, whereby emissions rise with GDP before stabilizing.
With values between 8.15 and 27.26 million and a standard deviation of 6.30 million, the urban population (POP) has a mean of 17.6 million and shows consistent population increase over time. The somewhat homogeneous distribution shown by the low skewness (0.065) and low kurtosis (1.59) indicates These figures complement the conclusions of Mahmood (2022) and Almatar (2024), who noted urbanization as a continuous source of emissions, therefore stressing the importance of sustainable urban development. They also represent the population pressures on transport networks.
Table 3.
Unit Root Tests.
| At Level | |||||||
| CO2 | AIRP | ATP | FDI | GDP | POP | ||
| With Constant | t-Statistic | -0.2471 | -2.3423 | 2.8067 | -1.4003 | -2.4049 | -0.0757 |
| Prob. | 0.9221 | 0.1674 | 1.0000 | 0.5698 | 0.1486 | 0.9439 | |
| n0 | n0 | n0 | n0 | n0 | n0 | ||
| With Constant & Trend | t-Statistic | -2.0261 | -2.9386 | 2.9222 | -2.1100 | -1.3203 | -2.7743 |
| Prob. | 0.5648 | 0.1681 | 1.0000 | 0.5210 | 0.8645 | 0.2182 | |
| n0 | n0 | n0 | n0 | n0 | n0 | ||
| Without Constant & Trend | t-Statistic | 1.6381 | 0.3120 | -2.0157 | 0.3445 | -1.4232 | 6.2173 |
| Prob. | 0.9725 | 0.7696 | 0.0440 | 0.7786 | 0.1413 | 1.0000 | |
| n0 | n0 | ** | n0 | n0 | n0 | ||
| At First Difference | |||||||
| d(CO2) | d(AIRP) | d(ATP) | d(FDI) | d(GDP) | d(POP) | ||
| With Constant | t-Statistic | 0.0070 | -1.6884 | 2.6883 | -5.4177 | -4.2198 | -1.7469 |
| Prob. | *** | 0.4241 | 1.0000 | 0.0001 | 0.0025 | 0.3967 | |
| -3.7319 | n0 | n0 | *** | *** | n0 | ||
| With Constant & Trend | t-Statistic | 0.0349 | -1.3057 | -0.4984 | -5.3524 | -4.4241 | -1.1003 |
| Prob. | ** | 0.8618 | 0.9762 | 0.0007 | 0.0072 | 0.9089 | |
| -3.1416 | n0 | n0 | *** | *** | n0 | ||
| Without Constant & Trend | t-Statistic | 0.0027 | -8.4708 | 3.5114 | -5.4322 | -4.0938 | -0.0761 |
| Prob. | *** | 0.0000 | 0.9996 | 0.0000 | 0.0002 | 0.6476 | |
| 0.0070 | *** | n0 | *** | *** | n0 | ||
Note: (*) Significant at the 10%; (**) Significant at the 5%; (***) Significant at the 1% and (no) Not Significant.
The Augmented Dickey-Fuller (ADF) test evaluates the stationarity of variables for strong econometric modeling. None of the variables consistently rejects the null hypothesis of a unit root under customary specifications. For instance, CO2 emissions show non-stationarity with a constant trend, while FDI and AIRP show stochastic trends. The ATP series, with a t-statistic of -2.0157, rejects the null hypothesis at the 5% significance level, but this is insufficient to verify general-level stationarity. GDP per capita and urban population remain non-stationary, fitting the expected behavior of macroeconomic and demographic indicators.
Following the first differencing, most variables achieve stationarity, that is, they are integrated of order one, I(1). Under the constant condition, FDI and GDP show high stationarity across dimensions; with t-statistics of −5.4177 (p = 0.0001) and −4.2198 (p = 0.0025) respectively. Under the constant and trend conditions, ATP achieves borderline stationarity even if it is still negligible under some parameters. Under the “without constant and trend” criterion (t = −8.4708, p = 0.0000), AIRP especially exhibits significant stationarity, therefore verifying the dynamic change of air passenger volumes over time. Although not always significant at all levels, POP acquires strong stationarity in the constant specification after differencing (t = −4.5599, p = 0.0019 in original data), thereby supporting its inclusion in regression models post-transformation.Finally, the ADF findings demonstrate that all variables are non-stationary at level but become stationary following initial differencing, hence verifying their integration order I(1). These results support the application of quantile regression, which can capture non-linear associations across several degrees of the dependent variable while allowing I(1) variables.
Despite the results of the Breusch-Pagan-Godfrey test in Table 4, suggesting an absence of significant heteroskedasticity. The application of quantile regression (QR) continues to be advantageous since Quantile regression (QR) provides deeper insights than ordinary least squares (OLS) by showing how the effects of independent variables differ at various points in the range of the dependent variable. (OLS) analysis just considers the average effect; QR lets us identify associations that might be greater in some areas of the data—such as the bottom or upper ends of CO₂ emissions from transport and weaker or not significant in others. This helps one to better understand the data, particularly in cases when the effects of important elements may vary with different levels of CO₂ emissions.
Table 5 shows strong correlations between CO₂ emissions from transport and core economic and demographic variables in Saudi Arabia, therefore providing important new perspectives on the environmental consequences of development indicators.
With all but GDP, CO₂ emissions from transport (CO₂) are favorably and significantly linked with all other factors. With a population (POP) (r = 0.9699), the strongest association is seen indicating that environmental pressure is mostly driven by demographic increase. This result implies that increasing population size is closely linked with higher emissions levels, presumably due to more energy consumption and mobility demands, an observation compatible with the environmental Kuznets curve (EKC) argument on population-environment interactions.
Strong positive correlations between CO₂ emissions from transport and air transport infrastructure (AIRP) (r = 0.9187) and air transport passenger traffic (ATP) (r = 0.8597) highlight the environmental impact of the aviation sector as well. These findings show how increasing air mobility contributes to emissions as air traffic increases in line with globalization and economic development.
A strongly significant association between foreign direct investment (FDI) and CO₂ emissions from transport (r = 0.8654) indicates that, especially in developing industries, capital inflows may be connected with carbon-intensive industrial operations. This finding reflects issues expressed in literature on the effects of foreign investment without enough green policies on the surroundings.
By comparison, GDP displays a modest negative connection with CO₂ emissions from transport (r = -0.4496), implying that, taken alone, economic activity might not be directly causing more emissions. This inverse link may point to developments toward decoupling economic growth from environmental damage, maybe resulting from changes toward service-based sectors, energy efficiency gains, or technological developments.
More background is given by further correlations among the explanatory factors. Highly associated (r = 0.8574), AIRP and ATP illustrate the linked character of passenger volume and air transport infrastructure. Strongly linked with AIRP (r = 0.8708), ATP (r = 0.881), and FDI (r = 0.8436), POP also suggests that population increase is a basic driver of both mobility demands and investment flows.
By contrast, GDP has negative relationships with AIRP (r = -0.3338), ATP (r = -0.3019), FDI (r = -0.5578), and POP (r = -0.5909). These negative correlations could indicate structural disparities in the distribution or realization of economic growth, therefore reflecting a gap between GDP growth and inclusive or sustainable development paths.
The quantile regression model was specified considering the various quantiles, ranging from 0.15 to 0.85 as upper and lower quantiles due to the amount of data from (1990-2022), and the potential impact of each independent variable on carbon dioxide emissions was analyzed at these specified quantiles (Table 6).
The quantile regression results significantly support Hypothesis 1, which holds that air transport infrastructure and urban population increase positively CO₂ emissions from transport, in the lower quantiles (Q0.15–Q0.40) representing low-emission scenarios. While POP retains extremely significant coefficients (around 3.34e-06, p = 0.000) across these quantiles, the coefficients for AIRP range from 7.23e-07 to 1.40e-06, all statistically significant (p = 0.05 or 0.01). These results complement those of Aldegheishem (2024), Onifade & Haouas (2023), who validated the major contribution of air transportation to Saudi emissions, and Mahmood (2022), who noted urbanization as a main emission driver. Particularly when seen through Elmonshid et al. (2024), who observed that finance can increase emissions when not green-aligned, financial development (FDI) is equally important and supports Hypothesis 2, e.g., 86.55 at Q0.15, p = 0.008. Reflecting the early-stage EKC pattern detailed by Alshehry & Belloumi (2017), GDP per capita likewise displays positive and substantial effects (0.002318 to 0.00263, p < 0.01). In this range, however, innovation (ATP) is negligible (p > 0.9), thereby supporting Hypothesis 3 in its assertion of delayed impact.
Representing normal emission levels, the results mainly follow the same trends at the median quantile (Q0.50). Remarkably significant are air transportation (1.40e-06, p = 0.000) and urban population (3.31e-06, p = 0.000), supporting Almatar’s (2024) conclusions on urban mobility demands and so verifying Hypothesis 1. Once more supporting Hypothesis 2, financial development (107.52, p = 0.001) and GDP (0.00252, p = 0.002) remain significant. Though it is still statistically insignificant (p = 0.105), innovation (ATP) turns negative (−0.0369), so supporting the perspective of Dai et al. (2023) and Awan et al. (2022) that emphasizes solely the long-run influence of innovation on the surroundings. The literature underlines how restricted reach or delayed incorporation of innovation into transport networks reflects the weak median effect. These results also show that air transportation and financial flows remain major emissions contributors even at modest levels of emissions, thereby calling more attention to policies.
Strong support for all three hypotheses is given in the higher quantiles (Q0.60–Q0.85) indicative of high-emission scenarios. Reiterating Hypothesis 1 and results from Umar et al. (2020) and Mercure & Lam (2015), AIRP shows still large and significant coefficients (e.g., 1.55e-06 at Q0.70, p = 0.000) and POP stays consistent and significant across all quantiles. FDI’s influence becomes more pronounced (e.g., 130.43 at Q0.80, p = 0.000), thereby verifying Hypothesis 2 and consistent with Patel & Mehta (2023), who warned that finance-driven emissions rise when not sustainability-aligned. Reflecting the EKC turning point, GDP coefficients also climb (up to 0.00344, p = 0.000), hence corroborating Raggad (2020) and Ali et al. (2023), who proposed that emissions may level off as sustainable measures get traction. Crucially, ATP turns negative and significant at Q0.60 (−0.039, p = 0.019) and Q0.70 (−0.049, p = 0.032), hence validating Hypothesis 3. This outcome reflects the observations of Shan et al. (2021), who underlined the lag between innovation and its influence, and Altouma et al. (2024), who connected emissions drop to major uptake of innovation under Vision 2030. These results suggest that once scaled, innovation starts to reduce transportation emissions and that policies related to finance, transportation, and urban development must cooperate to provide emissions reduction on a large scale.
The quantile regression findings indicate that air transport infrastructure and urban population have a significant impact on CO₂ emissions from transport at all levels, thereby supporting Hypothesis 1 and corroborating previous research. The relationship between financial development and economic growth is associated with increased emissions, especially at higher quantiles, thereby confirming Hypothesis 2 and lending support to the Environmental Kuznets Curve (EKC). Innovation does not influence lower quantiles, yet it demonstrates a notable negative effect at elevated emission levels, thereby confirming Hypothesis 3 and underscoring its postponed environmental advantages. The findings highlight the necessity for focused, quantile-specific strategies to lower emissions and Saudi Arabia’s Vision 2030 sustainability objectives.
Urban population, financial development, economic activity, and air transportation are all statistically significant and favourably linked with CO₂ emissions from transport in Saudi Arabia’s transport sector, according to the regression analysis. Dominant factors across the dataset were urbanization (coefficient = 3.16×10⁻⁶, p < 0.001) and air transport (1.01×10⁻⁶, p < 0.001). Strong positive effects also came from financial development (127.35, p < 0.001) and GDP per capita (0.00271, p < 0.001), therefore supporting the theory that development without environmental protection can raise emissions. By contrast, technological innovation (−0.0132, p = 0.369) had a negligible impact, implying a delayed environmental advantage from patent activity.
Using robustness tests based on Tobit regression models (see Table 7) helps to check if research results remain reliable under different conditions by changing models, datasets, or variables. In this study, Tobit regressions confirmed that the findings from quantile regression analyses were consistent and valid. This supports the generalizability of the results outside of a particular model framework and therefore increases the validity of the conclusions.
Figure 2 presents six plots that display the estimated coefficients of the capital structure determinants across different quantiles (from the 15th to the 85th percentile) using quantile regression, along with the corresponding OLS estimates for comparison. The variables analyzed include: the intercept (Plot B), urban population (POP) (Plot B), financial development (FDI) (Plot C), economic growth (GDP) (Plot D), innovation (ATP) (Plot E), and air transportation (AIRP) (Plot F). The shaded bands represent the 95% confidence intervals, highlighting the variability and statistical reliability of the estimates at different points in the leverage distribution.
Plot A (Intercept) shows a clear downward trend with coefficients declining from roughly -50 to -160, indicating that baseline emissions (holding all explanatory variables constant) are lower in higher emission contexts, presumably due to unobserved structural characteristics or policy interventions not caught in the model. The increasing confidence intervals at the tails highlight more variability and uncertainty in extreme events, therefore validating the utility of quantile regression in capturing distributional variation. Plot B shows that POP keeps a consistently positive and statistically significant impact throughout all quantiles, therefore confirming urbanization as a constant and strong source of emissions. Plot C shows FDI rising from about 60 to over 120, suggesting that, particularly in high-emission scenarios where it is not in line with sustainability goals, financial expansion considerably influences emissions. Plot D shows that the influence of GDP increases from about 0.0018 to 0.0035, therefore supporting the Environmental Kuznets Curve theory that emissions increase with early economic development. Plot E validates the theory that innovation has a delayed but significant emissions-reducing effect after it achieves greater scale and implementation by first showing ATP initially fluctuating near zero but becoming progressively negative at higher quantiles. Plot F finally reveals gradually rising coefficients for AIRP between around 0.0000007 and 0.0000015, so verifying that passenger air travel is a consistent and major contributor to emissions throughout all quantiles. These results taken together expose the varied impact of important factors along the emission spectrum and underline the need to develop quantile-specific policy interventions to properly fulfill Saudi Arabia’s Vision 2030 sustainability targets.
5. Conclusion
Emphasizing air transportation infrastructure, financial development, economic growth, innovation, and urbanization, this paper presents a thorough analysis of the elements influencing transport-related CO2 emissions in Saudi Arabia. This work reveals the intricate effects of these elements at different emission levels, therefore overcoming the limitations of conventional regression techniques using quantile regression analysis. Particularly in the lower and median quantiles, where the fast expansion of air travel for both passengers and goods has raised environmental concerns, the data illustrate how a significant source of emissions air travel is. As seen by the declining impact at higher quantiles, operational efficiency, legislative interventions, and technical advancements in aviation are helping to mitigate this emissions-growth path.
The findings show that financial development has two purposes: it affects emissions depending on how financial resources are distributed. When in line with green financing rules and sustainable investment plans, financial development helps to lower emissions at high levels. This emphasizes the importance of focused financial policies encouraging low-carbon investments since it reveals that the environmental advantages of finance sector development depend on their congruence with ecologically friendly economic strategies. It shows that while first increasing emissions, developed economies using greener technologies and more sustainable transportation networks later help to lower emissions.
Reducing emissions depends mostly on innovation, although its impacts are not quick. The delayed effect of technical development shows that although research and development in sustainable transportation solutions are vital, their broad acceptance and efficacy demand time and judicious government support. Conversely, urbanization highlights the challenges related to growing population density, infrastructure development, and higher transportation demand by constantly intensifying emissions across all quantiles. Urban growth will continue to rise in transportation-related CO₂ emissions from transport due to the lack of coherent urban planning and investment in Sustainable mobility options.
6. Recommendations
To lower transportation-related emissions, a thorough policy framework has to be followed. First, by supporting alternative fuels, pushing carbon offset projects inside the aviation sector, and enforcing more strict fuel efficiency criteria, air transportation policies essential first highlight sustainability. Investing in cleaner aviation technologies—including hybrid and electric aircraft it is preferable to accelerate to help to reduce the environmental effect of the industry. Furthermore by extending green bond markets, offering incentives for environmentally friendly investments, and including climate risk assessments into financial decision-making systems, financial market reforms can align capital flows with sustainability goals. Improving the function of financial institutions in support of green financing would ensure that economic development supports environmental sustainability rather than raising emissions.
Sustainable industries including digital infrastructure, smart transportation systems, and renewable energy should take the front stage in strategies for economic diversification. Subsidies for clean technology research and development, tax benefits for companies adopting sustainable transportation solutions, and support for startups concentrated on environmentally friendly mobility services can help policies supporting green innovation to be strengthened. Furthermore, international cooperation in technology transfer and renewable energy projects could hasten Saudi Arabia’s turn toward low-carbon economic growth.
Reducing urbanization-related emissions calls for a change to smart city architecture and sustainable urban mobility. Reducing reliance on high-emission cars will be achieved by improving public transportation networks, implementing congestion pricing, and expanding non-motorized travel infrastructure. Intelligent transportation systems (ITS), coherent land-use planning, and sustainable housing rules will help lower urban expansion’s environmental consequences even further. Behavioural incentives should take the front stage in policies, including eco-driving programs, public awareness campaigns on sustainable transportation, and corporate strategies encouraging remote work to lower transportation-related emissions.
Future studies should look at the dynamic interaction among these components over extended periods, including other environmental factors, including the integration of renewable energy sources and air quality indices. Turning the emphasis to include sector-specific analysis, particularly in road and maritime transportation, will help to provide a more complete picture of emissions trends. Machine learning models among advanced econometric approaches might raise forecast accuracy and change policy recommendations.
Saudi Arabia can effectively balance economic growth with environmental preservation by including financial, technological, legal, and regulatory policies. This study adds to the more important conversation on environmentally friendly transportation options by providing useful information for environmental activists, industry actors, and legislators. The outcomes highlight the need to put multifarious solutions in line with Vision 2030 to ensure a strong and ecologically sustainable future for the Saudi transportation sector.
Funding
This research received no external funding.
Institutional Review Board Statement
Not applicable.
Data Availability Statement
The data presented in this study are available on request from the corresponding author.
Conflicts of Interest
The authors declare no conflict of interest.
References
- Alanazi, F., and M. Alenezi. 2024. Sustainable Transportation and Intelligent Infrastructure Development in Saudi Arabia: A Study on the Impact of Saudi Vision 2030 and Renewable Energy Integration. In Emerging Cutting-Edge Applied Research and Development in Intelligent Traffic and Transportation Systems. IOS Press: pp. 90–101. [Google Scholar]
- Aldegheishem, A. 2024. The Impact of Air Transportation, Trade Openness, and Economic Growth on CO2 Emissions in Saudi Arabia. Frontiers in Environmental Science 12: 1366054. [Google Scholar] [CrossRef]
- Almatar, K. M. 2024. Smart transportation planning and its challenges in the Kingdom of Saudi Arabia. Sustainable Futures 8: 100238. [Google Scholar] [CrossRef]
- Ali, A., S. Sumaira, H. M. A. Siddique, and S. Ashiq. 2023. Impact of economic growth, energy consumption and urbanization on carbon dioxide emissions in the kingdom of Saudi Arabia. Journal of Policy Research. [Google Scholar] [CrossRef]
- Alsabbagh, M. 2024. Toward carbon-neutral road transportation in the GCC countries: an analysis of energy consumption and CO2 emissions. Management of Environmental Quality: An International Journal. [Google Scholar] [CrossRef]
- Alshehry, A. S., and M. Belloumi. 2017. Study of the environmental Kuznets curve for transport carbon dioxide emissions in Saudi Arabia. Renewable and Sustainable Energy Reviews 75: 1339–1347. [Google Scholar] [CrossRef]
- Altouma, A., B. Bashir, B. Ata, A. Ocwa, A. Alsalman, E. Harsányi, and S. Mohammed. 2024. An environmental impact assessment of Saudi Arabia’s vision 2030 for sustainable urban development: A policy perspective on greenhouse gas emissions. Environmental and Sustainability Indicators 21: 100323. [Google Scholar] [CrossRef]
- Avotra, A. A. R. N., and A. Nawaz. 2023. Asymmetric impact of transportation on carbon emissions influencing SDGs of climate change. Chemosphere 324: 138301. [Google Scholar] [CrossRef]
- Awan, A., M. Alnour, A. Jahanger, and J. C. Onwe. 2022. Do technological innovation and urbanization mitigate carbon dioxide emissions from the transport sector? Technology in Society 71: 102128. [Google Scholar] [CrossRef]
- Alyousef, M., F. Belaid, N. Almubarak, and T. Almulhim. 2025. Mapping Saudi Arabia’s low emissions transition path by 2060: An input-output analysis. Technological Forecasting and Social Change 211: 123920. [Google Scholar] [CrossRef]
- Binsuwadan, J. 2024. Transport Sector Emissions and Environmental Sustainability: Empirical Evidence from GCC Economies. Sustainability 16, 23: 10760. [Google Scholar] [CrossRef]
- Bartle, J. R., R. K. Lutte, and D. Z. Leuenberger. 2021. Sustainability and air freight transportation: Lessons from the global pandemic. Sustainability 13, 7: 3738. [Google Scholar] [CrossRef]
- Bao, Y., T. H. Lee, and B. Saltoglu. 2006. Evaluating the predictive performance of value-at-risk models in emerging markets: A reality check. Journal of Forecasting 25, 2: 101–128. [Google Scholar] [CrossRef]
- Chatti, W., and M. T. Majeed. 2022. Investigating the links between ICTs, passenger transportation, and environmental sustainability. Environmental Science and Pollution Research 29, 18: 26564–26574. [Google Scholar] [CrossRef] [PubMed]
- Dai, J., R. Alvarado, S. Ali, Z. Ahmed, and M. S. Meo. 2023. Transport infrastructure, economic growth, and transport CO2 emissions nexus. Environmental Science and Pollution Research 30, 14: 40094–40106. [Google Scholar] [CrossRef] [PubMed]
- Elhaj, M. 2024. Do Energy Efficiency and Technology Boost Sustainable Environment: Evidence from GCC Countries. Journal of Ecohumanism 3, 7: 2545–2565. [Google Scholar] [CrossRef]
- Elmonshid, L. B. E., O. A. Sayed, G. M. Awad Yousif, K. E. H. I. Eldaw, and M. A. Hussein. 2024. The Impact of Financial Efficiency and Renewable Energy Consumption on CO2 Emission Reduction in GCC Economies: A Panel Data Quantile Regression Approach. Sustainability 16, 14: 6242. [Google Scholar] [CrossRef]
- Farahat, A. 2016. Air pollution in the Arabian Peninsula (Saudi Arabia, the United Arab Emirates, Kuwait, Qatar, Bahrain, and Oman): causes, effects, and aerosol categorization. Arabian Journal of Geosciences 9: 1–17. [Google Scholar] [CrossRef]
- Islam, M. S., S. H. Rahaman, A. ur Rehman, and I. Khan. 2023. ICT’s impact on CO2 emissions in GCC region: the relevance of energy use and financial development. Energy Strategy Reviews 49: 101147. [Google Scholar] [CrossRef]
- Koenker, R. 2004. Quantile regression for longitudinal data. Journal of Multivariate Analysis 91, 1: 74–89. [Google Scholar] [CrossRef]
- Mahmood, H. 2022. Trade openness, industrialization, urbanization and pollution emissions in GCC countries: A way towards green and circular economies. International Journal of Energy Economics and Policy 12, 2: 309–314. [Google Scholar] [CrossRef]
- Mosteller, F., and J. W. Tukey. 1977. Data analysis and regression: A second course in statistics. Reading, MA: Addison-Wesley. [Google Scholar]
- Mercure, J. F., and A. Lam. 2015. The effectiveness of policy on consumer choices for private road passenger transport emissions reductions in six major economies. Environmental Research Letters 10, 6: 064008. [Google Scholar] [CrossRef]
- Onifade, S. T., and I. Haouas. 2023. Assessing environmental sustainability in top Middle East travel destinations: insights on the multifaceted roles of air transport amidst other energy indicators. Environmental Science and Pollution Research 30, 45: 101911–101926. [Google Scholar] [CrossRef] [PubMed]
- Patel, N., and D. Mehta. 2023. The asymmetry effect of industrialization, financial development and globalization on CO2 emissions. International Journal of Thermofluids 20: 100397. [Google Scholar] [CrossRef]
- Patel, N., and D. Mehta. 2023. The asymmetry effect of industrialization, financial development and globalization on CO2 emissions in India. International Journal of Thermofluids 20: 100397. [Google Scholar] [CrossRef]
- Raggad, B. 2020. Economic development, energy consumption, financial development, and carbon dioxide emissions in Saudi Arabia: new evidence from a nonlinear and asymmetric analysis. Environmental Science and Pollution Research 27, 17: 21872–21891. [Google Scholar] [CrossRef]
- Saidi, S., M. Shahbaz, and P. Akhtar. 2018. The long-run relationships between transport energy consumption, transport infrastructure, and economic growth in MENA countries. Transportation Research Part A: Policy and Practice 111: 78–95. [Google Scholar] [CrossRef]
- Shan, S., S. Y. Genç, H. W. Kamran, and G. Dinca. 2021. Role of green technology innovation and renewable energy in carbon neutrality. Journal of Environmental Management 294: 113004. [Google Scholar] [CrossRef] [PubMed]
- Shehri, T. A., J. F. Braun, N. Howarth, A. Lanza, and M. Luomi. 2023. Saudi Arabia’s climate change policy and the circular carbon economy approach. Climate Policy 23, 2: 151–167. [Google Scholar] [CrossRef]
- Sun, D., S. Zeng, H. Lin, X. Meng, and B. Yu. 2019. Can transportation infrastructure pave a green way? A city-level examination in China. Journal of Cleaner Production 226: 669–678. [Google Scholar] [CrossRef]
- Umar, M., X. Ji, D. Kirikkaleli, and Q. Xu. 2020. COP21 Roadmap: Do innovation, financial development, and transportation infrastructure matter for environmental sustainability in China? Journal of environmental management 271: 111026. [Google Scholar] [CrossRef]
- Wadud, Z., M. Adeel, and J. Anable. 2024. Understanding the large role of long-distance travel in carbon emissions from passenger travel. Nature. [Google Scholar] [CrossRef]
- Zhang, Y.J. 2011. The impact of financial development on carbon emissions: An empirical analysis in China. Energy Policy 39: 2197–2203. [Google Scholar] [CrossRef]
Figure 1.
Air transport CO2 emissions from transport in Saudi Arabia, source: OECD Data Explorer.
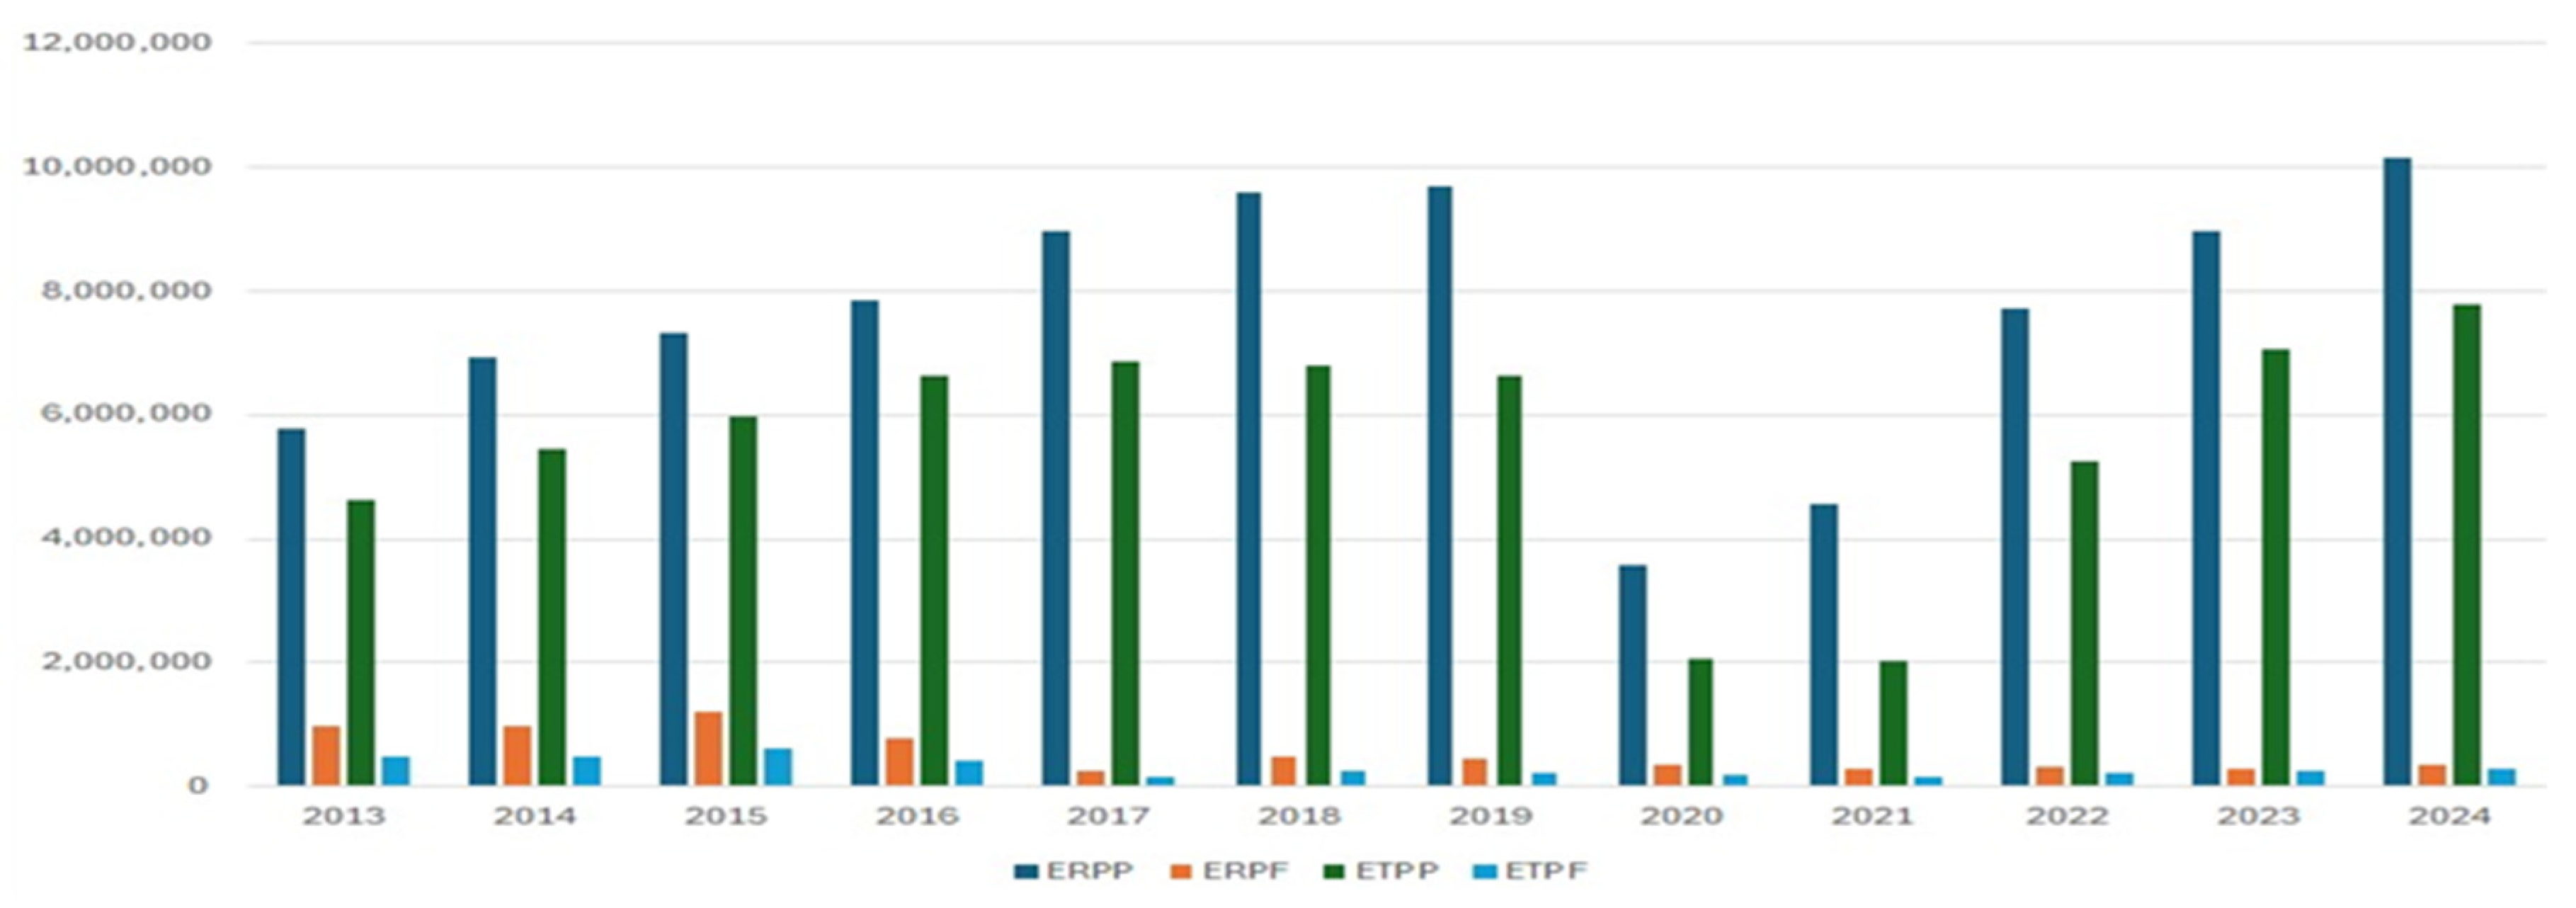
Figure 2.
Estimated coefficients of capital structure determinants and 95% confidence interval.
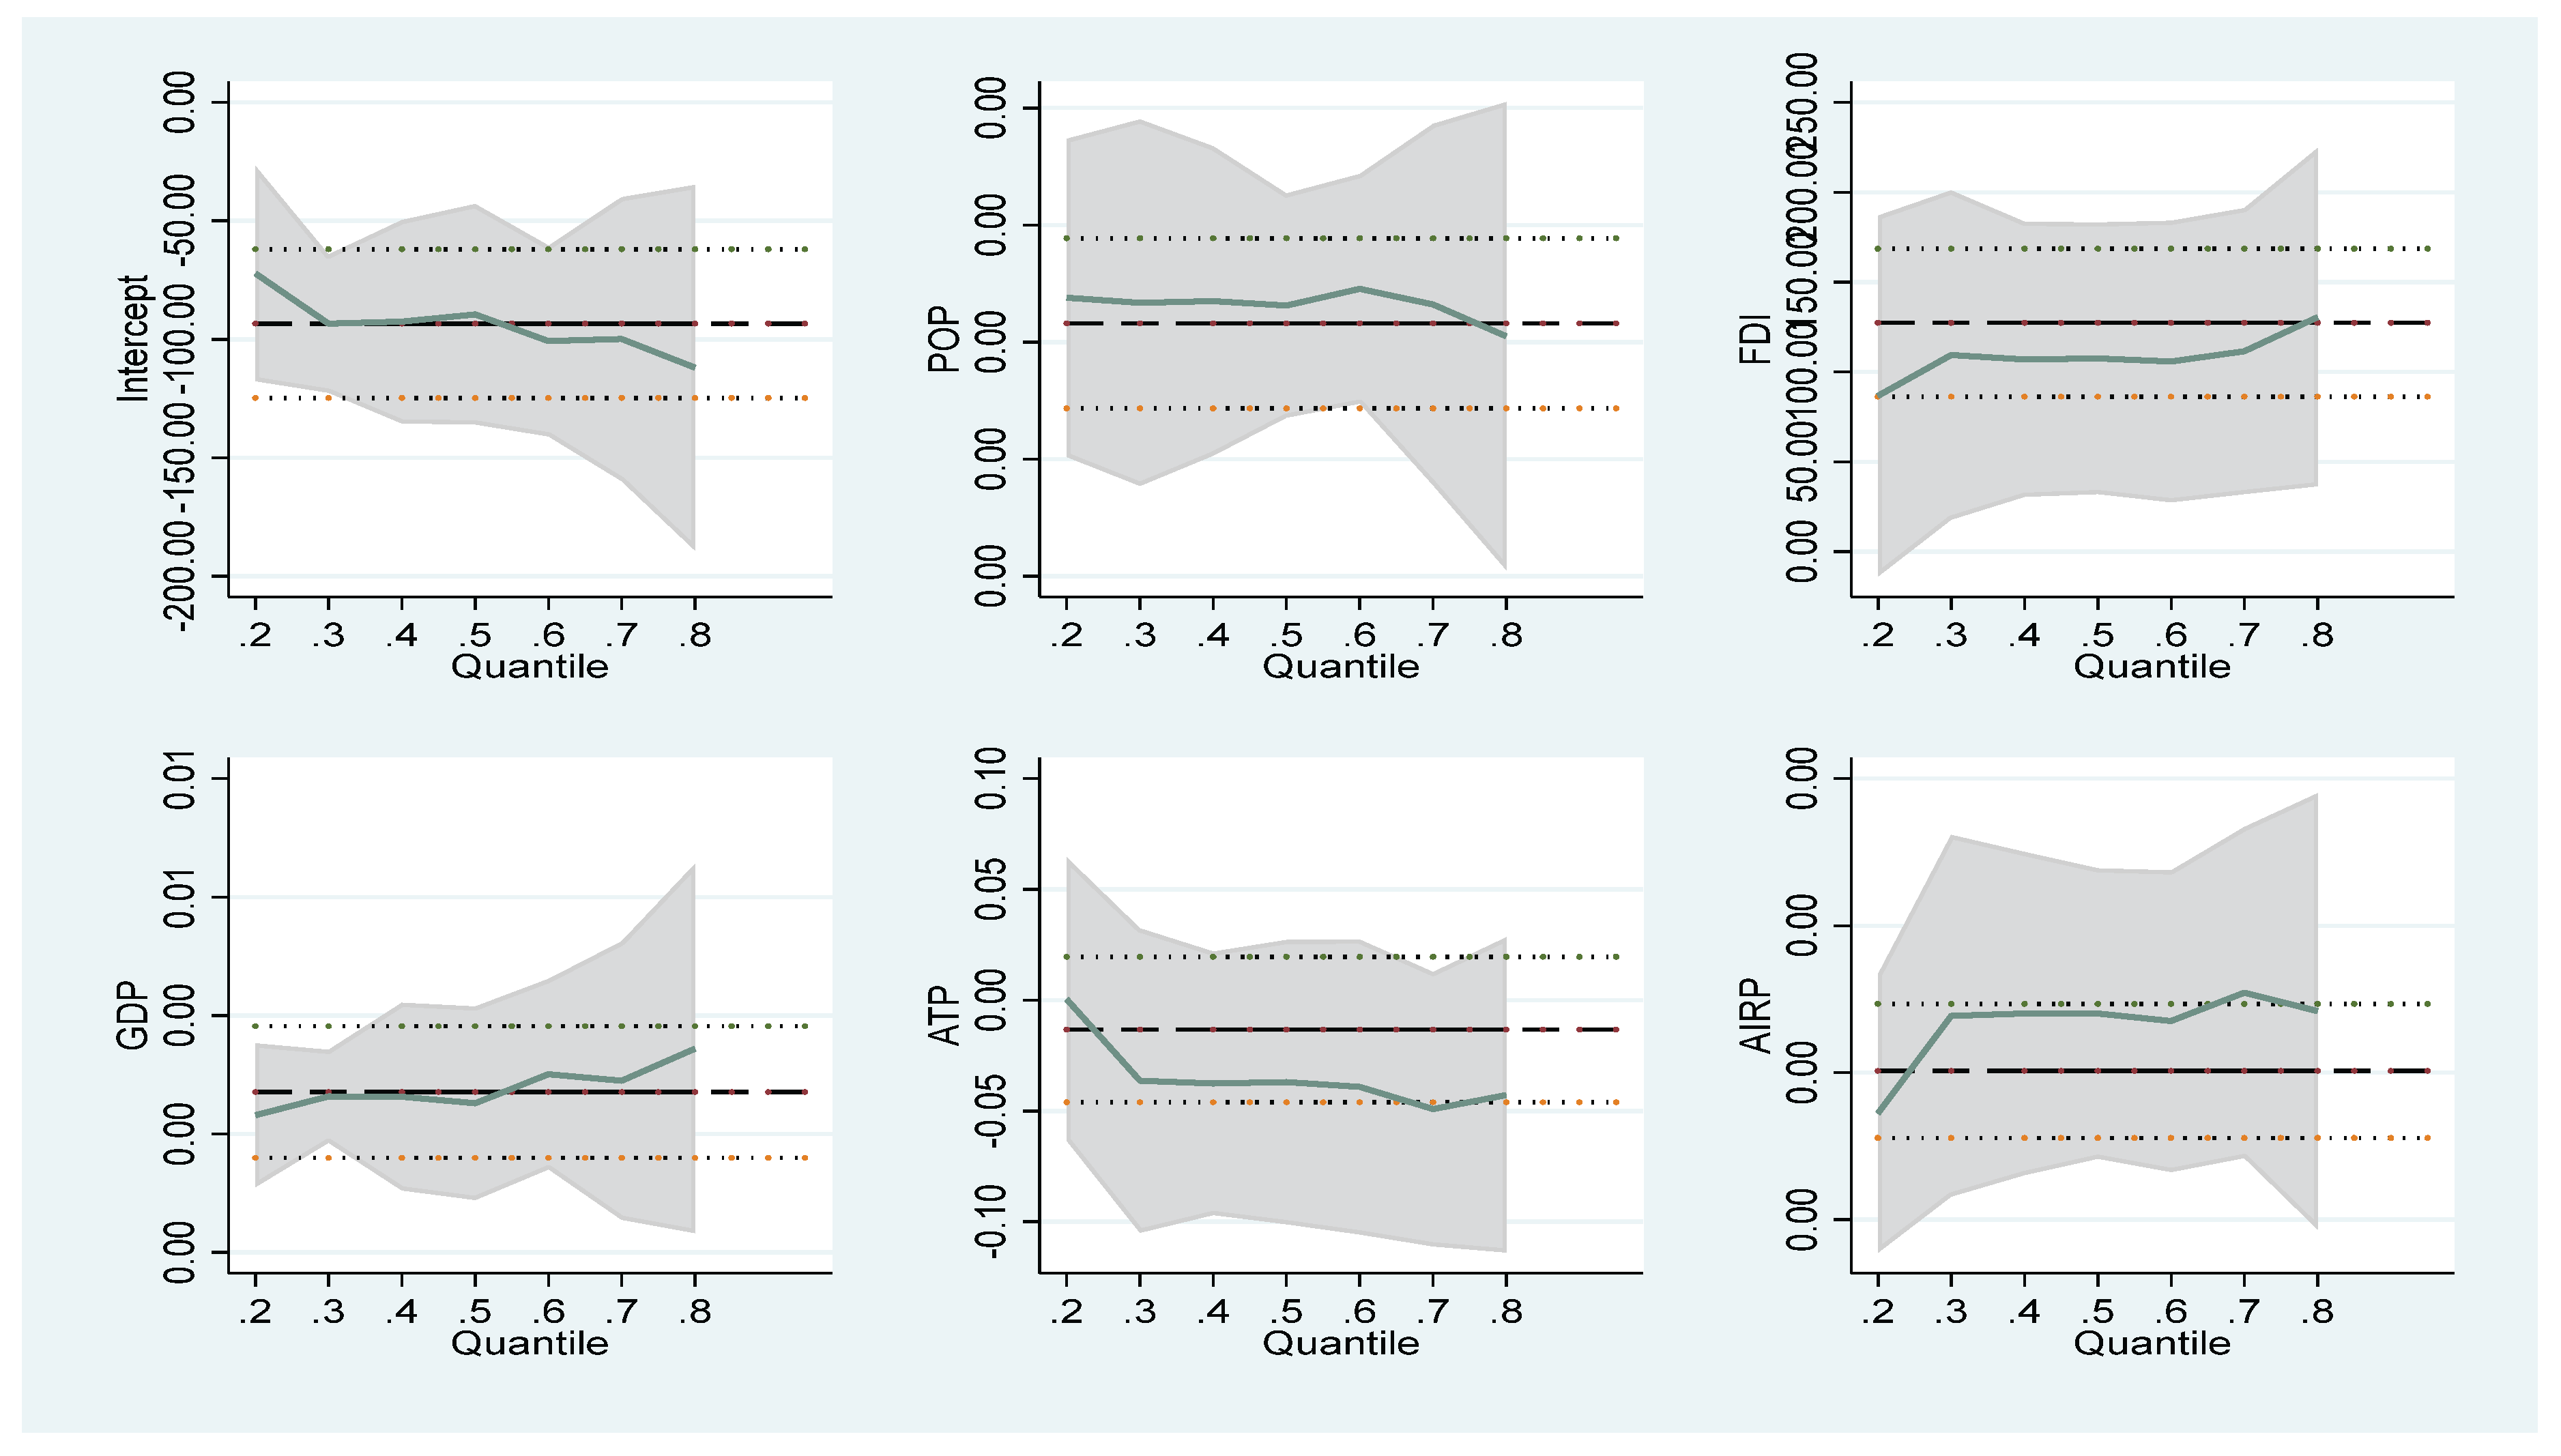
Table 2.
Descriptive Statistics.
| stats | CO2 | AIRP | ATP | FDI | GDP | POP |
|---|---|---|---|---|---|---|
| Mean | 92.52362 | 20118240 | 207.9225 | 0.391202 | 20027.89 | 17596038 |
| Median | 81.85870 | 16708204 | 64.76000 | 0.398025 | 19154.80 | 17425683 |
| Maximum | 146.9389 | 46181487 | 758.0800 | 0.518574 | 26279.73 | 27261746 |
| Minimum | 49.40360 | 9409100. | 2.450000 | 0.270000 | 15512.70 | 8148960. |
| Std. Dev. | 35.13393 | 9981821. | 264.4519 | 0.072891 | 3065.917 | 6297875. |
| Skewness | 0.277053 | 0.999203 | 1.088325 | 0.082764 | 0.748188 | 0.065069 |
| Kurtosis | 1.431807 | 2.895162 | 2.631765 | 1.626306 | 2.344913 | 1.592735 |
| Jarque-Bera | 3.803613 | 5.506352 | 6.700931 | 2.632347 | 3.668887 | 2.746328 |
| Probability | 0.149299 | 0.063725 | 0.035068 | 0.268159 | 0.159702 | 0.253304 |
| Sum | 3053.279 | 6.64E+08 | 6861.443 | 12.90965 | 660920.4 | 5.81E+08 |
| Sum Sq. Dev. | 39500.59 | 3.19E+15 | 2237914. | 0.170018 | 3.01E+08 | 1.27E+15 |
| Observations | 33 | 33 | 33 | 33 | 33 | 33 |
Source: Authors’ calculation.
Table 4.
Heteroskedasticity Test: Breusch-Pagan-Godfrey.
| F-statistic | 0.802143 | Prob. F(5,17) | 0.5635 |
| Obs*R-squared | 4.390447 | Prob. Chi-Square(5) | 0.4947 |
| Scaled explained SS | 1.235944 | Prob. Chi-Square(5) | 0.9414 |
Source: Authors’ calculation.
Table 5.
The Correlation.
| CO2 | AIRP | ATP | FDI | POP | GDP | |
|---|---|---|---|---|---|---|
| CO2 | 1 | |||||
| AIRP | 0.9187 | 1 | ||||
| ATP | 0.8597 | 0.8574 | 1 | |||
| FDI | 0.8654 | 0.6880 | 0.5779 | 1 | ||
| POP | 0.9699 | 0.8708 | 0.8817 | 0.8436 | 1 | |
| GDP | -0.4496 | -0.3338 | -0.3019 | -0.5578 | -0.5909 | 1 |
Source: Authors’ calculation.
Table 6.
Quantile Regression.
| co2 | co2 | co2 | co2 | co2 | co2 | co2 | co2 | co2 | |
| 0.15 | 0.20 | 0.30 | 0.40 | 0.50 | 0.60 | 0.70 | 0.80 | 0.85 | |
| POP |
3.38e-06 (0.000) |
3.38e-06 (0.000) |
3.34e-06 (0.000) |
3.35e-06 (0.000) |
3.31e-06 (0.000) |
3.45e-06 (0.000) |
3.32e-06 (0.000) |
3.05e-06 (0.000) |
3.38e-06 (0.000) |
| FDI |
86.54813 (0.008) |
86.54813 (0.005) |
109.3879 (0.000) |
106.9544 (0.000) |
107.5237 (0.001) |
105.7613 (0.000) |
111.4847 (0.000) |
130.4335 (0.000) |
86.54813 (0.008) |
| GDP |
.002318 (0.009) |
.002318 (0.006) |
.0026367 (0.001) |
.0026302 (0.001) |
.0025197 (0.002) |
.0030115 (0.000) |
.0029018 (0.001) |
.0034429 (0.000) |
.002318 (0.009) |
| ATP |
.0004933 (0.984) |
.0004933 (0.983) |
.0362964 (0.098) |
-.0375463 (0.070) |
-.0369906 (0.105) |
-.0392032 (0.019) |
-.0491731 (0.032) |
-.0427514 (0.063) |
.0004933 (0.984) |
| AIRP |
7.23e-07 (0.041) |
7.23e-07 (0.030) |
1.39e-06 (0.000) |
1.40e-06 (0.000) |
1.40e-06 (0.000) |
1.35e-06 (0.000) |
1.55e-06 (0.000) |
1.42e-06 (0.000) |
7.23e-07 (0.041) |
| 0bs. | 33 | 33 | 33 | 33 | 33 | 33 | 33 | 33 | 33 |
| Pseudo R2 | 0.8723 | 0.8727 | 0.8857 | 0.9078 | 0.9177 | 0.9185 | 0.9136 | 0.9042 | 0.8977 |
Source: Authors’ calculation.
Table 7.
Tobit regression.
| co2 | Coefficient | Std. err. | t | P>|t| | [95% conf . interval] | |
|---|---|---|---|---|---|---|
| pop | 3.16e-06 | 3.20e-07 | 9.86 | 0.000 | 2.50e-06 | 3.82e-06 |
| FDI | 127.3506 | 18.15573 | 7.01 | 0.000 | 90.16023 | 164.5409 |
| gdp | .0027089 | .00049 | 5.53 | 0.000 | .0017053 | .0037126 |
| ATP | -.0132231 | .0144821 | -0.91 | 0.369 | -.0428884 | .0164422 |
| Airp | 1.01e-06 | 2.01e-07 | 5.04 | 0.000 | 6.01e-07 | 1.42e-06 |
| _Cons | -93.35728 | 13.83904 | -6.75 | 0.008 | -121.7053 | -65.00928 |
| LR chi2(5) = 146.35 | Prob > chi2 = 0.0000 | |||||
Source: Authors’ calculation.
Disclaimer/Publisher’s Note: The statements, opinions and data contained in all publications are solely those of the individual author(s) and contributor(s) and not of MDPI and/or the editor(s). MDPI and/or the editor(s) disclaim responsibility for any injury to people or property resulting from any ideas, methods, instructions or products referred to in the content. |
© 2025 by the authors. Licensee MDPI, Basel, Switzerland. This article is an open access article distributed under the terms and conditions of the Creative Commons Attribution (CC BY) license (http://creativecommons.org/licenses/by/4.0/).
Copyright: This open access article is published under a Creative Commons CC BY 4.0 license, which permit the free download, distribution, and reuse, provided that the author and preprint are cited in any reuse.


