Submitted:
04 June 2025
Posted:
06 June 2025
You are already at the latest version
Abstract
Sheet piles have been widely used for water-crossing bridges to mitigate scouring issues and protect backfill soils. Recently, several studies suggested that sheet piles may be able to serve both as axial load-bearing elements and backfill retainers for short-span or low-traffic volume bridges. In this background, this study conducted modified static pile loading tests using a down-sized model test pile at a field test site to investigate the axial load-bearing capacity of the sheet pile. The field test data indicate that the side-frictional resistance would carry a major portion of the applied load (>70%), highlighting its importance in the sheet pile's axial load-bearing capacity. Upon that, this study compared results from the analytical methods, SPT-based methods, and CPT-based methods with the bearing capacity obtained from the field loading tests to assess the suitability of those predictions. For the side frictional resistance, the analytical and CPT-based methods may provide values that are in good agreement with field data, while SPT-based methods may yield quite divergent results. For the end-bearing resistance, most methods employed in this study underestimated the end-bearing capacity. Thus, it may be recommended to account for plugged areas to yield a more accurate prediction of the end-bearing capacity.
Keywords:
Sheet pile
; Short-span bridge
; Sheet pile abutment system
; Bearing capacity of a pile
; Static pile loading test
1. Introduction
Sheet piles have been widely used for the construction of water-crossing bridges, together with load-bearing piles (e.g., H-piles or pipe piles), to mitigate scouring issues and protect backfill soils (Figure 1). Those sheet piles are also particularly popular for the application of integral/semi-integral abutment bridges in some states of the USA. Recently, several studies suggested that those sheet piles may be able to serve both as axial load-bearing elements and backfill retainers for short-span or low-traffic volume bridges (e.g., Sylvain et al. 2017; Panchal et al. 2020). In support of this, it has also been reported that several bridges in Europe (Yandzio 1998) and the USA (Evans et al. 2012; Baker 2021) incorporated a steel sheet pile abutment system to resist both lateral loads from the backfill soil and axial load from the superstructure. Nonetheless, there is insufficient study data and experience in designing and analyzing the axial and lateral load resistance of such sheet piles. For example, the mobilization of skin frictional resistance in different passive and active zones is not fully understood yet. The effect of soil plugging may magnify the end-bearing capacity of a sheet pile, but its measure remains unclear. More importantly, various estimation methods may provide incongruous estimates of the sheet pile’s bearing capacity, potentially leading to under- or overestimation in the design.
Determining the capacities for side frictional resistance () and end-bearing resistance () is crucial in geotechnical engineering. These capacities can be assessed either by conducting field tests (e.g., the Cone Penetration Test (CPT)-based or the Standard Penetration Test (SPT)-based approaches), and/or by using analytical methods (e.g., the Meyerhof method). Using analytical methods requires input parameters, such as friction angle and cohesion of soils, as well as the cross-sectional area and the embedded depth of the pile (further details in Section 3). However, there are several uncertainties in those input parameters to estimate the bearing capacity of sheet piles. For example, an effective cross-sectional area for the end-bearing resistance is not certain. Bustamante and Gianeselli (1991) and Rybak and Zyrek (2013) suggested considering the soil-plugged area, while Yandzio (1998) and Underwood and Greenlee (2010) recommended using the cross-sectional area of the steel only. Even further, Baker (2021) proposed disregarding the entire end-bearing resistance. On the other hand, Pando et al. (2018) argued that the estimate of the side frictional resistance should also consider the change in the cross-sectional area with/without the soil plugging, and so the lesser values are to be adopted for both the side frictional and end-bearing resistances.
In this background, this study conducted modified static pile loading tests using a down-sized model test pile at a field test site to evaluate the axial load-bearing capacity of the sheet pile with a high level of confidence. Upon that, the bearing capacities estimated from the analytical, SPT-based, and CPT-based approaches were compared with the results from the field loading tests to assess the suitability of those predictions.
2. Bearing Capacity of a Sheet Pile
2.1. Concept and Challenges in the Estimate of the Bearing Capacity of a Sheet Pile
The ultimate bearing capacity () of a pile encompasses both side frictional resistance () and end-bearing resistance (). Determining the unit side frictional resistance (f) and end-bearing resistance (qp) for and typically involves two main approaches. The first approach directly correlates unit resistance for both side and end resistances from field data obtained through the CPT and SPT tests. The second approach is the traditional analytical method, which relies on parameters primarily derived from laboratory or field tests (see Section 3 below). By multiplying f and qp with the respective side and cross-sectional areas, the ultimate bearing capacity of a pile can be estimated (i.e., Qu = Qs + Qp).
A precise estimate of the end-bearing resistance of a sheet pile poses a challenge due to uncertainties arising from plugged/unplugged areas (Figure 2). Furthermore, a sheet pile is prone to rotational movement during excavation, which can lead to the remobilization of horizontal stress and subsequent alterations in the side frictional resistance. These factors introduce complexity into the precise assessment of the bearing capacity of a sheet pile. Additionally, different methods may yield varying end-bearing and side resistance values, potentially resulting in overly conservative or underestimated predictions.
2.2. Previous Study: Bearing Capacity of a Sheet Pile.
Several previous studies (e.g., Bustamante and Gianeselli 1991; Taenaka et al. 2006; Underwood and Greenlee 2010; Rybak and Zyrek 2013; Pando et al. 2018) attempted to examine the bearing capacity of a sheet pile via field static loading tests, as summarized in Table 1. Notably, many of these field tests reported a higher bearing capacity of sheet piles, compared to other load-bearing piles with the same embedded depth. For instance, Pando et al. (2018) observed that a sheet pile exhibited over 50% greater bearing capacity than an H-pile of equivalent length (5 m). Bustamante and Gianeselli (1991) and Rybak and Zyrek (2013) also observed that sheet piles exhibited greater bearing resistance than either box or composite piles in their tests. Furthermore, constructing sheet piles in a row within a specific area may help to optimize the utilization of all available lateral surfaces. Consequently, this arrangement may lead to augmented side resistance of the sheet pile system compared to other alternative pile designs.
3. Analytical & SPT/CPT-Based Prediction of the Bearing Capacity
The prediction of an individual sheet pile’s load-bearing capacity involves end-bearing and side frictional resistances. The end-bearing capacity (Qp) is defined as the product of the unit end-bearing resistance (qp) and the cross-sectional area, while the side frictional resistance (Qs) comes from the multiplication of unit side resistance (f) by the gross side area. As mentioned above, this study employed three main approaches to estimate the end-bearing and side frictional resistances: the analytical method, the SPT-based method, and the CPT-based method.
3.1. Analytical Method
In the analytical method based on the procedures proposed by Meyerhof (1976), the end-bearing resistance of a pile in sandy soil exhibits an increase with the embedment depth within the bearing stratum. This increase, however, reaches a plateau at a specific ratio of embedded length to pile diameter. The end-bearing resistance (Qp) is further dependent upon the effective vertical stress and the bearing capacity factor, the latter of which is influenced by the friction angle of soil as shown in Equation (1) (adapted from Das and Sivakugan 2018):
where is the effective vertical stress at the pile tip, is the bearing capacity factor, Ap is the cross-sectional area at the tip of a pile, is the atmospheric pressure (= 100 kN/m2), and is the effective friction angle of the bearing stratum. On the other hand, the end-bearing resistance in clay (φ=0) is estimated using Equation (2):
where is the undrained shear strength of the soil. Another method, known as the Effective Stress β-Method, can also be employed for mixed soil profiles (Hannigan et al. 2016). The end-bearing resistance is calculated as follows:
where the tip resistance coefficient (Nt) ranges from 3 to 30 for clay and from 30 to 150 for sandy soil (Fellenius 2014).
Determining the unit side frictional resistance presents a greater challenge, contingent upon several factors, most notably effective stress. It is influenced by various aspects, such as the pile installation, the specific type of piles employed, and the characteristics of the underlying soil strata. The quantification of side frictional resistance (Qs) involves a mathematical formulation that integrates the effective earth pressure coefficient (), effective vertical stress (), and the pile-soil friction angle , as shown in Equation (4) (Coyle and Castello 1981):
where is the perimeter of a pile, f is the unit side frictional resistance, and is the segment length of the pile. The sheet pile, generally considered to be a low displacement pile, is assigned a value ranging from to . In the Effective Stress β-Method, the side resistance is calculated as follows:
where the Bjerrum-Burland beta coefficient (β) ranges from 0.15 to 0.35 for clay and from 0.3 to 0.9 for sand (Fellenius 2014).
3.2. SPT-Based Method
The SPT-based method uses the blow counts measured from the field and some correlations to predict the bearing capacity of a pile. Meyerhof (1976) suggested the end-bearing resistance in sandy soil can be estimated as follows:
where N60 (SPT N values corrected for the 60% energy ratio) is the average number near the pile tip (about 10D below and 4D above the pile tip), L is the length, and D is the diameter of the pile.
Brown (2001) recommended the following equation for a mixed soil profile:
where App is the cross-sectional area of the soil plug and Fp is the plug mobilization factor, which is 0.42 for a pipe pile and 0.67 for an H-pile. There is no suggested value of Fp for a sheet pile, so we adopted 0.67 in this study.
Meyerhof (1976) suggested the side frictional resistance can be estimated for a low-displacement pile as follows:
And Brown (2001) suggested the following:
where Fvs is a factor for the pile driving method (1.0 for impact, or 0.68 for vibratory driving), Ab is the Brown’s regression analysis factor based on soil type (e.g., Ab = 25.0 kPa for clay to sand with vibratory hammer), and Bb is the Brown’s regression analysis factor based on soil type per blow count (0.0376 ksf/bpf (blows per foot), approximately 1.8 kPa/bpf).
3.3. CPT-Based Method
Initially recognized as the Dutch cone penetration test, the CPT has been serving as a reliable venue for outlining a continuous soil profile. It involves the insertion of a cone-shaped probe into the ground, allowing for the systematic exploration and characterization of subsurface soil conditions. The CPT-based method suggested by Nottingham and Schmertmann (1975) is as follows:
where qc1 is the average penetration resistance from 0.7b to 3.75b below the tip to the tip, qc2 is the average penetration resistance from 8b above the tip to the tip, and b is the width or diameter of the pile. The end-bearing resistance can also be estimated by Eslami and Fellenius (1997) as follows:
where the tip correction coefficient (Cp) is dependent on pile size, as larger piles require greater displacement to mobilize the pile tip resistance. In most cases, Cp is equal to 1. qEg is the geometric average of the cone tip resistance within the influence zone, corrected for pore pressure on the shoulder and adjusted to effective stress (1.36 in this study).
The side frictional resistance can be estimated following Nottingham and Schmertmann (1975) and Schmertmann (1978):
where Ks is the ratio of unit side resistance to unit cone sleeve friction, which depends on the ratio of the embedded pile depth to its diameter and varies depending on the type of cone penetrometer. Ks ranges from 0.8 to 2.4 for electrical penetrometers, while it ranges from 0.4 to 1.4 for mechanical penetrometers. Similarly, Eslami and Fellenius (1997) proposed:
where Cs is the side correlation coefficient. The representative value of Cs is 8% for clay and 0.4% for sand. U is the pore pressure measured at the cone tip, qc is the measured cone tip stress, and a is the ratio of the cone tip area unaffected by the pore water pressure to the total area.
4. Modified Static Pile Loading Test: Test Setup and Procedure
4.1. Design and Fabrication of the Model Test Pile
The model test pile was designed based on the dimensions of the PZ27 section. However, the width and height in the cross-section of the test pile were reduced by 50% (Figure 3) to account for the testing capacity of the study team. The test pile has a total length of 3 m (about 10 ft) and was made with A572 steel, the same material used for the standard PZ27 sheet pile.
Vibrating wire strain gauges (4150, GEOKON) were installed at three locations, as shown in Figure 3. Two layers of covers were applied to protect the strain gauges from potential damage. The first cover was made using a gauge protection kit provided by the manufacturer (GEOKON). The second layer of protection was prepared using metal pieces positioned across the sheet pile (details are in Kim et al. 2023).
4.2. Preparation of Test Site and Pile Installation
A pit of a cross-sectional area of 1.8 m by 1.8 m was excavated to 2.7 m depth. The bottom of the excavated test site is underlain by the in situ soil (clayey soil). The test pile was placed vertically in the middle of the excavated test site using a crane, and then the site was filled with backfill sand (Martin Marietta), instead of pile driving, to protect the strain gauges mounted on the model test pile. The backfill sand exhibits a poorly graded gradation (SP), based on the Unified Soil Classification System (USCS). After the placement, the pile was pushed downward by approximately 0.2 m to ensure good contact between the pile and underlying soil, and the fill sand was lightly compacted using a vibro compactor. Once the test site was prepared in this way, the research team conducted the CPT and SPT tests for the backfill and in situ soil to evaluate the properties of those soil layers (details in Section 4.4).
4.3. Loading Test Setup
The modified static pile loading test (refer to Figure 4) was designed to comply with the specifications outlined in ASTM D1143/D1143M (ASTM 2020a). The primary objective of this test was to determine the axial bearing capacity of the model test sheet pile with high confidence. The research team used the anchor method combined with concrete blocks to enable the necessary reaction force. This setup comprised two 3-meter anchors and two 3-ton concrete blocks, as shown in Figure 4. Given that the bearing capacity of the test sheet pile was estimated to range between 15.8 kN and 66.4 kN (based on the analytical, SPT-based, and CPT-based predictions), such a configuration was deemed sufficient. A bearing plate was employed on top of the sheet pile to render a flat surface for applying axial load. Then, a load cell (ATO, 20 tons capacity) was placed between the piston and the bearing plate to monitor the applied load during the test. Additionally, an LVDT (Linear Variable Differential Transformer) was installed on top of the bearing plate to record the vertical displacement at the pile head.
4.4. Geotechnical Investigation and Soil Parameters
The SPT and CPT tests were performed using the Geoprobe 7822 DT following the guidelines outlined in ASTM D1586/D1586M (ASTM 2022) and ASTM D5778-20 (ASTM 2020b), respectively. These tests were performed approximately 0.7 meters away from the model test pile. The N values exhibited a gradual increase from 1 to 5 within the excavated area (3 m). Beyond the 3 m depth, where the in situ soil underlays the test pit, the N value showed a sharp increase, for instance, to 9 at a depth of 3.5 m (Figure 5). The CPT test was conducted down to a depth of 4 m and repeated twice. The obtained CPT data included the tip resistance (qc), skin resistance (fs), and pore pressure (zero in this test). The SPT and CPT test results are compiled in Figure 5, which were also used to determine the properties of soil layers summarized in Table 2.
4.5. Test Procedure
All sensors, including strain gauges, load cells, and LVDT, were connected to the data logger (Keysight DAQ970A), power supply, and computer to begin the test. The vertical alignment of the LVDT and the horizontal alignment of the reaction beam were also checked before each loading test. Then, the axial force was applied using the hand pump (Newtry CP-180). The axial force was increased by 10% of the estimated ultimate bearing capacity (i.e., 5 kN) at each step during the test. The research team maintained each loading stage for a duration ranging between 4 to 15 minutes, in compliance with the guidelines specified in ASTM D1143/D1143M (ASTM 2020a), to ensure sufficient time for the stabilization of the test pile’s response under the applied loads. The loading stages were stopped when it was observed that the pile settled an additional 8 to 10 cm without any increase in the applied load. This static axial loading test was repeated three times to check the repeatability of the test, and thus, the reliability of the obtained data.
5. Static Axial Loading Test: Results and Analyses
5.1. Load-Displacement Curves and Ultimate Bearing Capacity
Three modified static pile loading tests were completed to examine the ultimate bearing capacity of the model test sheet pile (Figure 6). Davisson’s method (Davisson 1972) was used for these loading test data, and consequently, the ultimate bearing capacity was obtained between 35 kN and 37 kN from these tests. Test #1 exhibited a bit higher ultimate load, but the other tests #2 and #3 resulted in very similar numbers (Figure 6).
5.2. Load Transfer Along the Pile Length
The internal forces (F) at different depths of the pile were calculated as follows:
where ε is strain measured from strain gauges, and Es is Young’s modulus of the test pile. The displacement and strain of the test pile were constrained by the shear resistance at the pile-soil interface, which resulted in the decrease of the internal forces at deeper depths (Figure 7; example result from test #1). After the applied load was supported by the side frictional resistance along the pile length, only a remaining portion was transmitted to the pile end, which was shown to be approximately 9-10 kN from the three tests. Therefore, it implies that the side friction carried a majority of the applied load, accounting for 70% to 75% of the ultimate bearing capacity.
5.3. Comparison: Predictions from Analytical & SPT/CPT-Based Methods
The ultimate bearing capacity, side frictional resistance, and end-bearing resistance of the test sheet pile were derived by analyzing load-displacement curves and load transfer data from the modified static pile loading tests. These values were compared to those obtained from the analytical methods (Section 3.1), SPT-based methods (Section 3.2), and CPT-based methods (Section 3.3). Table 3 summarizes this comparison. The analytical methods provided side frictional resistance values that closely matched actual field test data. However, the end-bearing resistance was underestimated to some extent in both Meyerhof (1976) + Coyle & Castello (1981) and the Effective stress formulae. Consequently, the analytical methods resulted in an underestimated ultimate bearing capacity, compared to the field loading test results.
Next, SPT-based methods produced quite different prediction values. For example, predictions based on Brown (2001) delivered exaggerated side frictional resistance, even though its end-bearing resistance was reasonable. In contrast, predictions based on Meyerhof (1976) severely underestimated the side frictional resistance. All in all, the SPT-based methods were observed to produce inconsistent predictions for the side frictional resistance, while their end-bearing capacity was acceptable, compared with the pile loading test data.
Lastly, the CPT-based methods yielded predictions on end-bearing (Qp) and side frictional resistance (Qs) that were either slightly higher or lower than the loading test data. It is worth noting that the average value of those predictions from Nottingham and Schmertmann (1975) and Eslami and Fellenius (1997) would be very similar to those Qs and Qp values from the pile loading tests (see Table 3). The following Section 6 provides a further discussion on the predicted estimates by each method.
6. Discussion
6.1. Side Frictional Resistance
The static axial loading test results indicated that the side frictional resistance (Qs) bears a majority of the applied load, accounting for 70% to 75% of the ultimate bearing capacity (between 24.7 and 27.5 kN). The analytical methods provided a quite accurate prediction on Qs, ranging between 25.2 and 26.2 kN. These methods rely on effective stress, the Earth pressure coefficient, and the pile-soil interface. Since the model test pile was primarily in contact with sandy soil, assigning those parameters was straightforward, resulting in the Qs prediction that closely matched field data.
For the CPT-based methods, calculations based on Nottingham & Schmertmann (1975) estimated the side frictional resistance as about 30% less than the value from the field tests, while calculations based on Eslami and Fellenius (1997) estimated about 30% higher. Such a difference could be attributed to the different data sets used for the prediction. Nottingham & Schmertmann (1975) use the sleeve friction (fs) from the cone, whereas Eslami and Fellenius (1997) use the cone tip resistance (qc) for the calculation of Qs. Additionally, Ks (the ratio of unit side resistance to unit cone sleeve friction) is needed for Nottingham & Schmertmann (1975), which is influenced by the ratio of the embedded depth to the pile’s diameter or width. It was assumed Ks = 1 in this study. If Ks is changed to 1.4, the updated calculation on Qs would closely match the actual field test data. It should be noted that the Ks value pertains more to a symmetric pile, such as an H or pipe pile. A sheet pile, being asymmetric, presents a challenge in accurately determining its diameter or width. In this study, we assumed the sheet pile’s width to be equal to one of its dimensions (b = 0.152 m), which may need further investigation. On the other hand, the Qs prediction based on Eslami and Fellenius (1997) needs a side correlation coefficient, Cs (0.4% for sand). This coefficient varies with soil type and is challenging to estimate accurately. In this study, we used 0.4% as recommended, but adjusting it to 0.3% would yield the Qs values that better match field data. Thus, again, further study is needed on Cs.
Lastly, the SPT-based methods significantly deviated from the actual field data. That is, calculations based on Brown (2001) overestimated Qs by about 120%. The accuracy of this method is affected by several factors, including the pile driving method factor (Fvs), which is 0.68 in this study, and Brown’s regression analysis factors (Ab and Bb), which depend on soil types (25 and 1.8, respectively, in this study). Adjusting these parameters may lead to a meaningful improvement in the prediction. For instance, reducing Ab or Fvs by 50% would make the Qs prediction better aligned with the observed field data. Conversely, calculations based on Meyerhof (1976) underestimated Qs by almost 80%. In this method, we considered the sheet pile as a low-displacement pile, applying a correction factor of 0.01. The correction factor is 0.02 for a high-displacement pile, which could double the Qs prediction. Those uncertainties resulted in high discrepancies between the prediction and actual field data.
All in all, the differences between various approaches may be attributed to the methodologies used, the locations of geotechnical investigations, the equipment employed, and potential human errors. Introducing and adjusting correction factors, along with coefficients that account for sheet pile shape, effective stress, embedment depth, and soil type, could improve the alignment of side resistance estimates with actual field data.
With the side frictional resistance accounting for more than 70% of the total bearing capacity, sheet piles may offer a substantial contact area advantage over other pile types. That is, sheet piles form a continuous wall when installed in rows, whereas H-piles, pipe piles, or concrete piles are driven with space between each other. Therefore, the larger contact area of sheet piles may act to increase further the foundation’s ultimate bearing capacity. Further research on the side frictional resistance of sheet piles installed in a row is desirable to examine this point.
6.2. End-Bearing Resistance
The end-bearing resistance obtained from field tests was between 9.5 and 10.3 kN. The analytical methods exhibited certain discrepancies in their prediction. For example, calculations based on Meyerhof (1976) significantly underestimated the end-bearing resistance (Qp) of the sheet pile, yielding values 75% lower than actual field data. Calculations based on the β-method estimated closer Qp, only about 20% lower than the field data. Meyerhof (1976) uses the undrained shear strength of soil (cu), while the β-method uses the tip resistance coefficient (Nt = 30 in this study) and the effective vertical stress, which has a smaller margin of error.
For SPT-based methods, Brown (2001) yielded a better prediction, with a difference of less than 10% of the field data. It is worth noting that a partially plugged area was considered in the equation via the plug mobilization factor (Fp). In this study, we used Fp = 0.67, which is similar to the value used for H-piles. For CPT-based methods, calculations based on Nottingham and Schmertmann (1975) overestimated Qp by about 50%, whereas calculations based on Eslami and Fellenius (1997) underestimated it by about 30%. Both methods use cone tip resistance (qc) data but consider different distances above and below the pile tip to obtain the average qc. Overall, most methods (analytical, SPT-based, and CPT-based) employed in this study underestimated the end-bearing capacity. In this regard, it may be recommended to account for the plugged area (e.g., 20-40% increase in the tip area) to yield a more accurate prediction of Qp.
6.3. Recommendations and Follow-Up Study
Analytical, SPT-based, and CPT-based methods were tested to predict the bearing capacity of the model test sheet pile in this study in conjunction with the static axial loading test. We judge factors such as the correlation coefficient for soil type, the geometry of the sheet pile, the ratio of embedded length to diameter, and the tip cross-sectional area, which should be adjusted to accurately estimate the side frictional resistance (Qs) and end-bearing capacity (Qp) when using these approaches, particularly the analytical or SPT-based methods. While these methods are commonly applied to symmetric piles such as H-piles, pipe piles, and concrete piles, adjustments to critical factors are necessary to enhance the accuracy of results when applied to sheet piles.
In addition, it is recommended to apply several methods, and then obtain the average of all the estimates to reduce the margin of error in the prediction of Qs and Qp.
Based on the literature review and data analysis in this study, we conclude that sheet piles may have a good capacity for handling axial loads for a short-span bridge. Considering sheet piles may already be subjected to lateral loads from backfill soils (which was not taken into account in this study), an additional axial load from the superstructure could amplify horizontal deflection (e.g., P-Delta effect), shear stress, and bending moment acting on the sheet piles. Thus, this aspect needs further in-depth investigation via either numerical simulation studies or meso-/full-scale field loading tests.
7. Conclusions
In this study, we examined the ultimate bearing capacity of a sheet pile using modified static axial loading tests and used the test data to assess predictions made by analytical methods, SPT-based methods, and CPT-based methods. Salient observations can be summarized as follows:
- The field test data indicate that the side frictional resistance would carry a major portion of the applied load (> 70%), highlighting its importance in the sheet pile’s axial load-bearing capacity. The relatively larger contact area of the sheet pile, compared to other load-bearing piles, may significantly increase its side resistance. Further research on the behavior of axially loaded sheet piles installed in a row is desirable to understand their group effect.
- Prediction of the side frictional resistance of a sheet pile varies across different approaches. The analytical and CPT-based methods may provide values that are in good agreement with field data, while SPT-based methods may yield divergent results. Introducing and adjusting correction factors, such as sheet pile shape, effective stress, embedment depth, and soil type, may help to reduce such a discrepancy in the prediction of side frictional resistance.
- The end-bearing resistance may account for about one-fourth of the ultimate bearing capacity. Overall, most methods (analytical, SPT-based, and CPT-based) employed in this study underestimated the end-bearing capacity. In this regard, it may be recommended to account for the plugged area to yield a more accurate prediction of the end-bearing capacity.
- Overall, it is recommended to apply several methods and then obtain the average of all the estimates to reduce the margin of error in the prediction of the ultimate bearing capacity of a sheet pile.
- This study does not account for the rotation of a sheet pile, which can lead to the remobilization of shear forces acting on the sides. This aspect needs further in-depth investigation via either numerical simulation studies or meso-/full-scale field loading tests.
Author Contributions
Conceptualization, H.P.V. and S.K.; methodology, H.P.V., S.K., and J.E.; software, H.P.V. and S.K.; validation, H.P.V., S.K., J.E., and C.S.; formal analysis, H.P.V., S.K., R.Z., J.E., and C.S.; investigation, H.P.V and R.Z.; resources, S.K., J.E., and C.S.; data curation, H.P.V., S.K., and J.E; writing—original draft preparation, H.P.V. and S.K.; writing—review and editing H.P.V, S.K., R.Z., J.E., and C.S.; visualization, H.P.V, S.K., and J.E.; supervision, S.K., J.E., and C.S.; project administration, S.K.; funding acquisition, S.K., J.E., and C.S. All authors have read and agreed to the published version of the manuscript.
Funding
This research received a research grant from the Nebraska Department of Transportation, USA.
Data Availability Statement
The data presented in this study are available on request from the corresponding author.
Acknowledgment
Research reported in this publication was supported by the Nebraska Department of Transportation, FY22(010).
Conflicts of Interest
The authors declare no conflicts of interest.
References
- ASTM. (2020a). ASTM D1143/D1143M-20 - Standard Test Methods for Deep Foundation Elements Under Static Axial Compressive Load.
- ASTM. (2020b). ASTM D5778-20 - Standard Test Method for Electronic Friction Cone and Piezocone Penetration Testing of Soils.
- ASTM. (2022). ASTM D1586/D1586M-18e1 - Standard Test Method for Standard Penetration Test (SPT) and Split-Barrel Sampling of Soils.
- Baker, M. (2021). Steel Sheet Pile Bridge Abutment Technical Design Manual, Prepared for Nucor Skyline, Inc.
- Bowles, J.E. (1997). Foundation analysis and design. 5th edition. England: McGraw-Hill.
- Brown, R.P. (2001). Predicting the ultimate axial resistance of single driven piles.
- Bustamante, M. , & Gianeselli, L. In (1991). Predicting the bearing capacity of sheet piles under vertical load. In Proceedings of the 4th International Conference on Piling and Deep Foundations, Stresa Italy (pp. 1-8).
- Coyle, H.M. , & Castello, R.R. New design correlations for piles in sand. Journal of the Geotechnical Engineering Division 1981, 107, 965–986. [Google Scholar]
- Das, B.M. , & Sivakugan, N. (2018). Principles of foundation engineering.
- Davisson, M.T. (1972). High-capacity piles. Proc. Innovations in Found. Const.
- Eslami, A. , & Fellenius, B.H. Pile capacity by direct CPT and CPTu methods applied to 102 case histories. Canadian Geotechnical Journal 1997, 34, 886–904. [Google Scholar]
- Evans, R. , White, D., & Klaiber, F. (2012). Modified sheet pile abutments for low-volume road bridges.
- Fellenius, B.H. (2014). Basics of Foundation Design. Electronic Edition. http://www.Fellenius.net, 410 p.
- Hannigan, P.J. , Rausche, F., Likins, G.E., Robinson, B.R., & Becker, M.L. (2016). Geotechnical engineering circular No. 12–Volume I: design and construction of driven pile foundations (Publication No. FHWA-NHI-16–009). Washington, DC: Federal Highway Administration (FHWA).
- Kim, S. , Eun, J., Song, C. R., Sim, C., Phi, H. V., Abualshar, B., & Ziaei, R. (2023). Feasibility Study: Application of Steel Sheet Piles for the Abutment of Water-Crossing Bridges in Nebraska.
- Meyerhof, G.G. Bearing capacity and settlement of pile foundations. Journal of the Geotechnical Engineering Division 1976, 102, 197–228. [Google Scholar] [CrossRef]
- Nebraska Department of Roads Bridge Division. (2016). Bridge Office Policies and Procedures.
- Nottingham, L. , & Schmertmann, J. An investigation of pile capacity design procedures. Final Report D 1975, 629, l59. [Google Scholar]
- Panchal, J.P. , McNamara, A.M., & Goodey, R.J. Sheet pile groups as an alternative foundation solution to cast-in-situ concrete piles. International Journal of Physical Modelling in Geotechnics 2020, 20, 83–96. [Google Scholar]
- Pando, M.A. , Whelan, C.D., Ogunro, V.O., M.J., Rice, Sylvain, M.B., and Park, Y. (2018). Determination of Vertical Resistance for Sheet Pile Abutments (FHWA/NC/2014-008). North Carolina Department of Transportation.
- Rybak, J. , & Żyrek, T. (2013). Experimental validation of sheet pile and combined pile axial capacity computation. In 11th Slovak Geotechnical Conference, Water effects on Geotechnical Constructions (pp. 3-4).
- Schmertmann, J.H. (1978). Guidelines for cone penetration test: performance and design.
- Sylvain, M.B. , Pando, M.A., Whelan, M.J., Rice, C.D., Ogunro, V.O., Park, Y., & Koch, T. (2017). Case history of a full-scale axial load test of sheet piles. In Geotechnical Frontiers 2017 (pp. 355-365).
- Taenaka, S. , Otani, J., Tatsuta, M., & Nishiumi, K. (2006). Vertical bearing capacity of steel sheet piles. In Proc., 6th International Conference on Physical Modelling in Geotechnics-Physical Modelling in Geotechnics-6th ICPMG’06 (pp. 1-6).
- Underwood, C.A. , & Greenlee, R.M. (2010). Steel sheet pile used as permanent foundation and retention systems-design and construction. In Earth Retention Conference 3 (pp. 129-136).
- Yandzio, E. (1998). Design guide for steel sheet pile bridge abutments. SCI Publication.
Figure 1.
An example of a water-crossing bridge that contains both bearing piles and sheet piles for scour protection, and (b) a detailed view of the abutment pile cap (from Nebraska Department of Roads, 2016).
Figure 1.
An example of a water-crossing bridge that contains both bearing piles and sheet piles for scour protection, and (b) a detailed view of the abutment pile cap (from Nebraska Department of Roads, 2016).
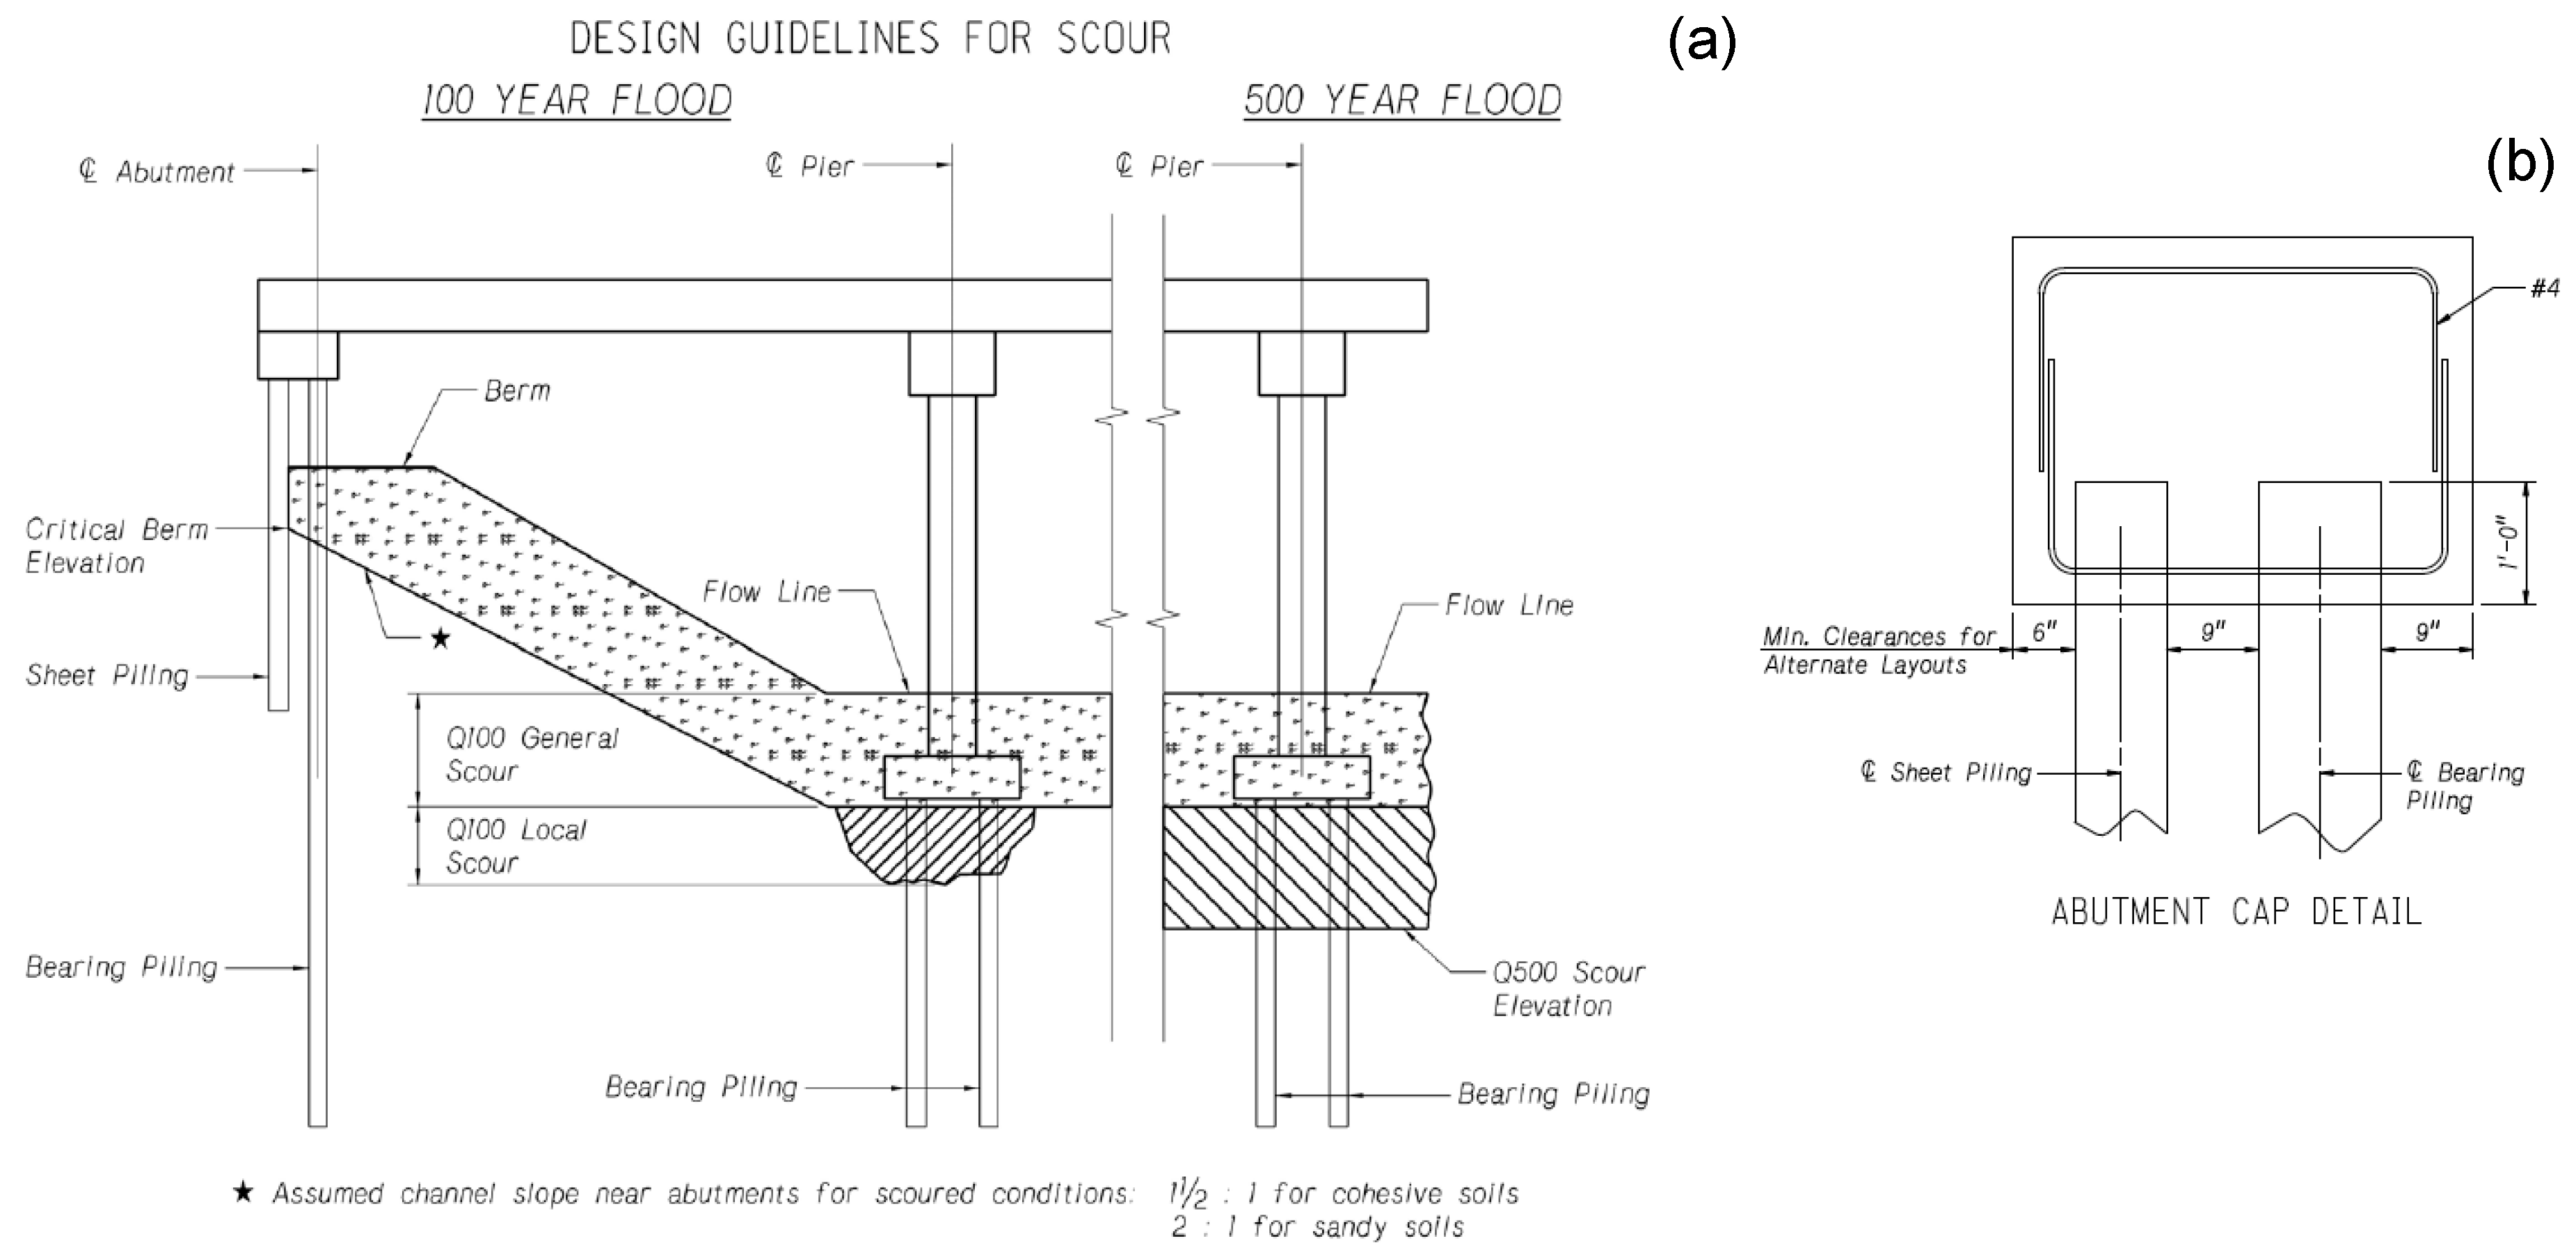
Figure 2.
Concept: a sheet pile as an axial-load bearing element and its side frictional and end-bearing resistance components.
Figure 2.
Concept: a sheet pile as an axial-load bearing element and its side frictional and end-bearing resistance components.
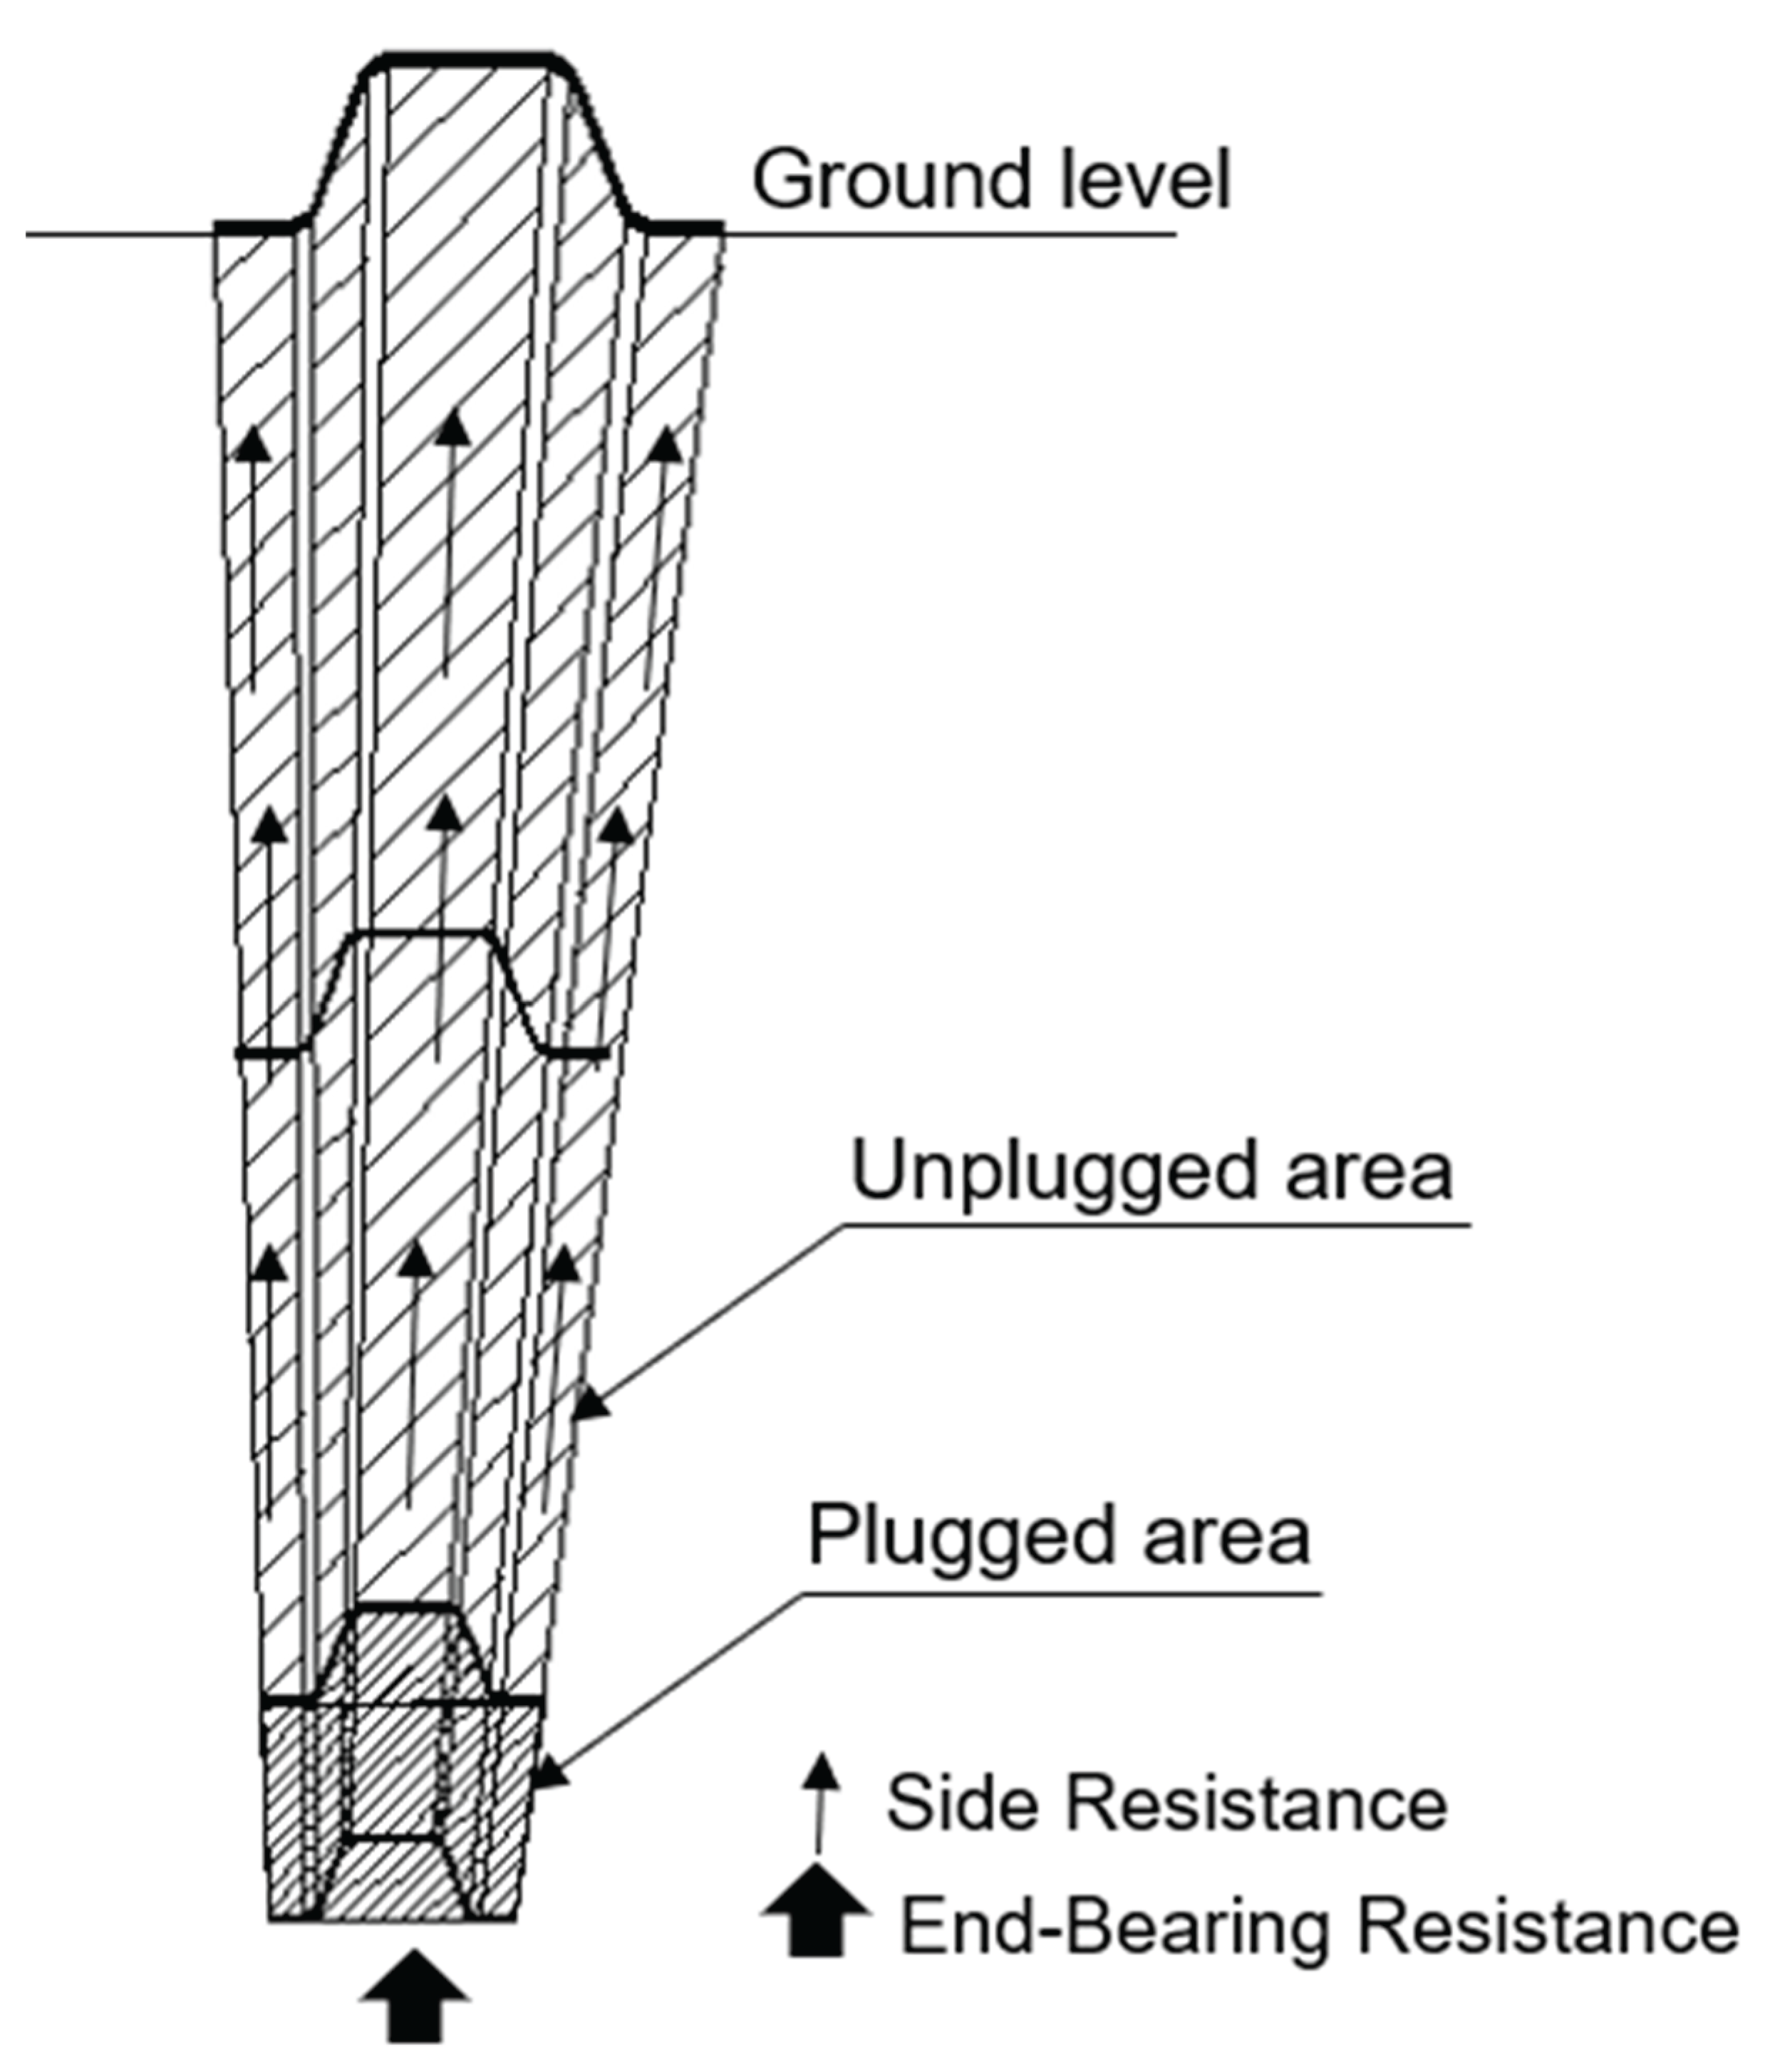
Figure 3.
The design and fabrication of the model test pile, along with the arrangement of strain gauges. Section: PZ27, width (W) = 0.457 m, depth (D) = 0.153 m, thickness (tf)= 0.0095 m, angle (a) = 111o, cross-sectional area = 0.005 m2, perimeter = 1.28 m, Young’s modulus = 200 GPa. .
Figure 3.
The design and fabrication of the model test pile, along with the arrangement of strain gauges. Section: PZ27, width (W) = 0.457 m, depth (D) = 0.153 m, thickness (tf)= 0.0095 m, angle (a) = 111o, cross-sectional area = 0.005 m2, perimeter = 1.28 m, Young’s modulus = 200 GPa. .
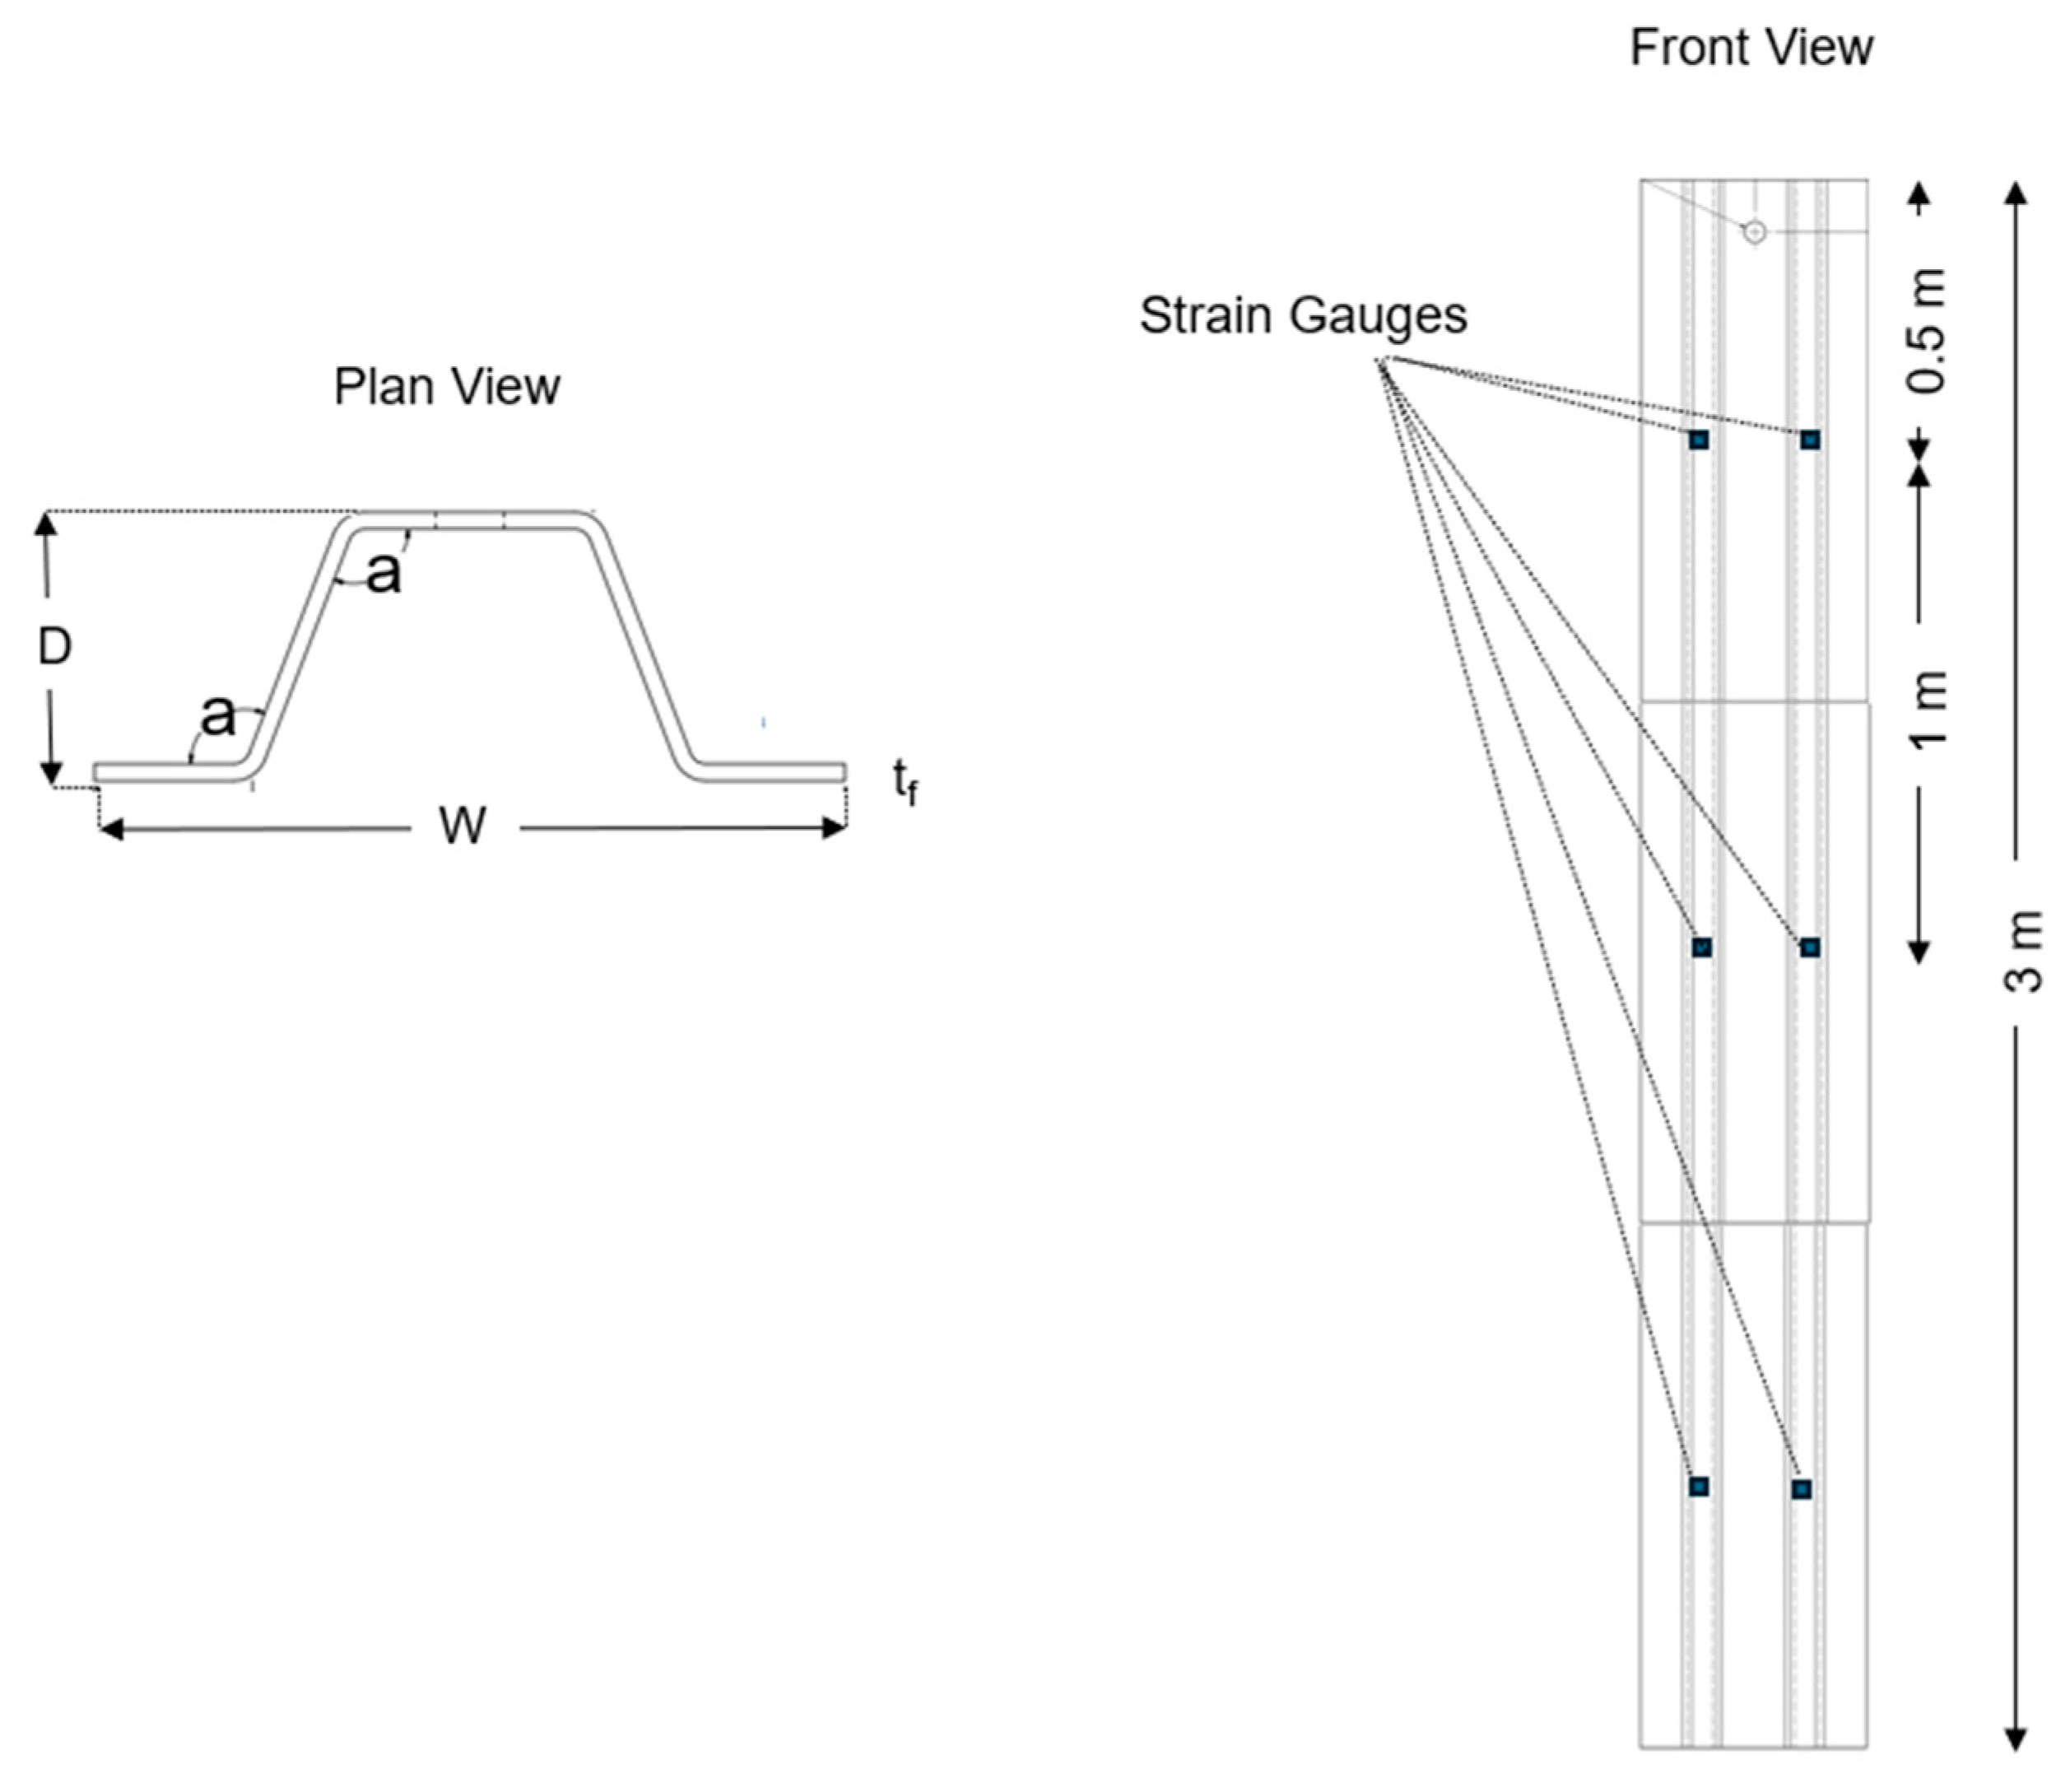
Figure 4.
A schematic diagram of the test setup to conduct static pile loading tests using the model test sheet pile.
Figure 4.
A schematic diagram of the test setup to conduct static pile loading tests using the model test sheet pile.
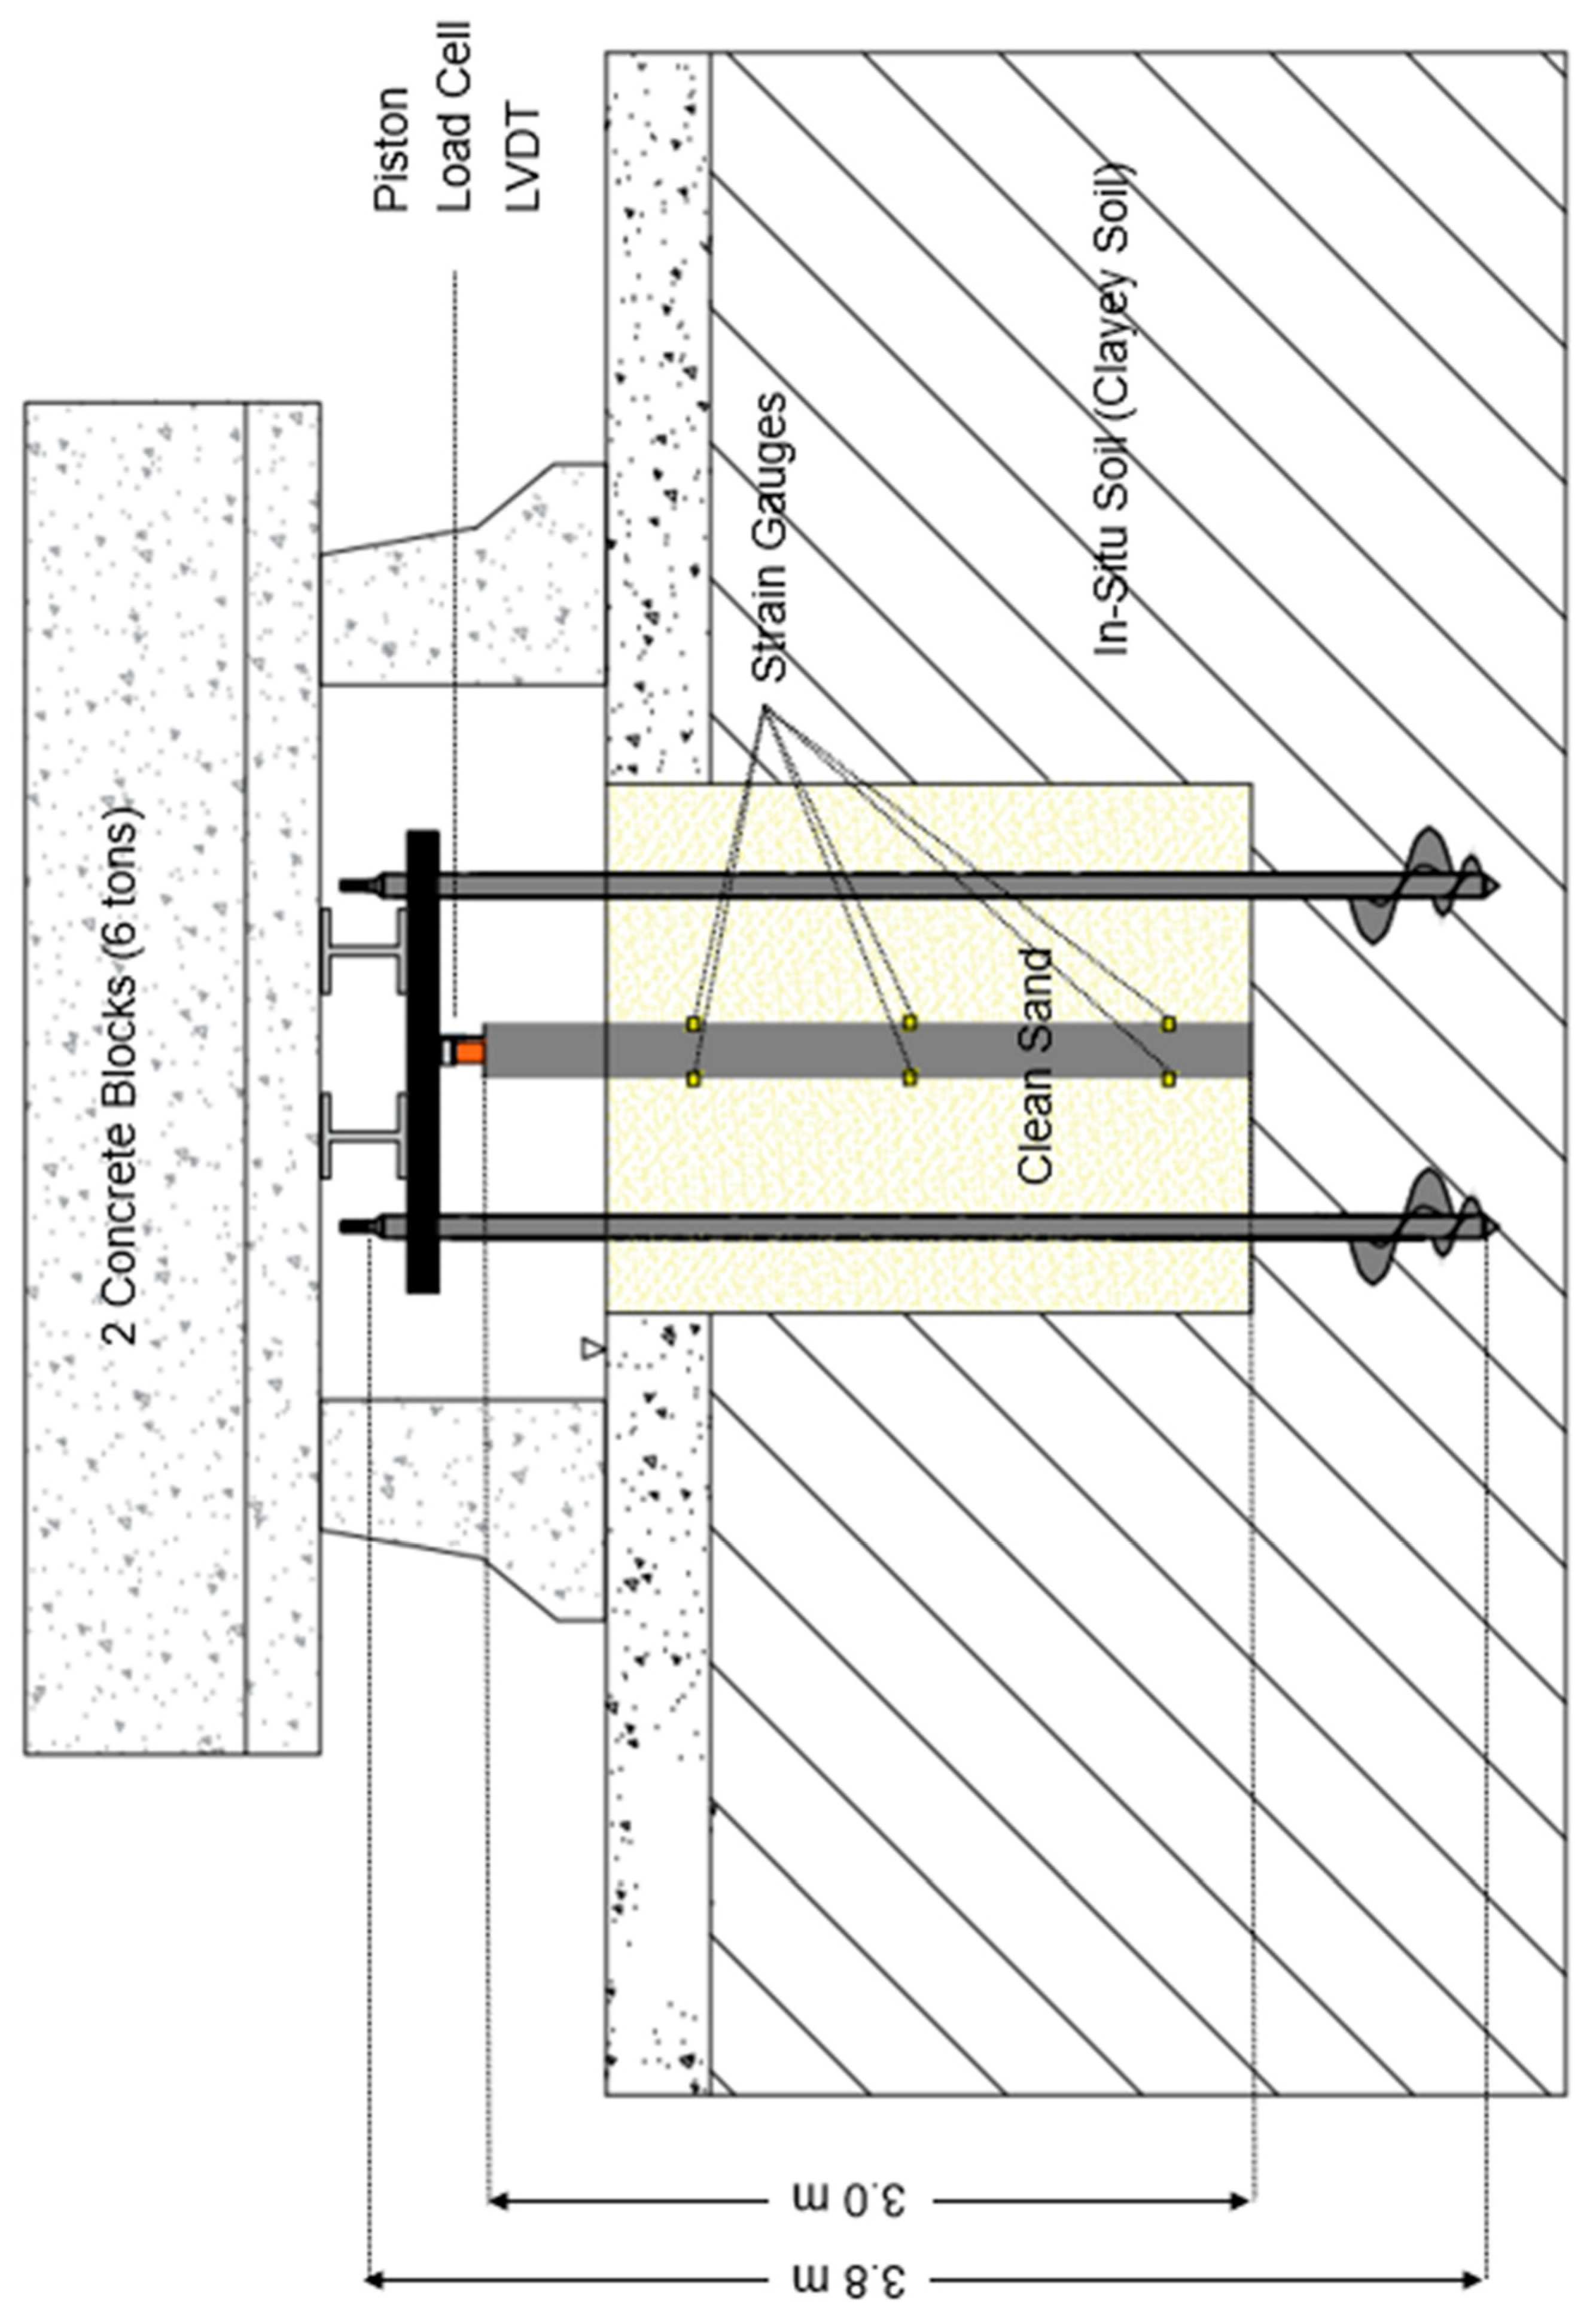
Figure 5.
Site characterization of the backfill and in-situ soils: (a) N values obtained from the SPT test; (b) the tip resistance qc, and (c) skin resistance fs obtained from CPT tests.
Figure 5.
Site characterization of the backfill and in-situ soils: (a) N values obtained from the SPT test; (b) the tip resistance qc, and (c) skin resistance fs obtained from CPT tests.
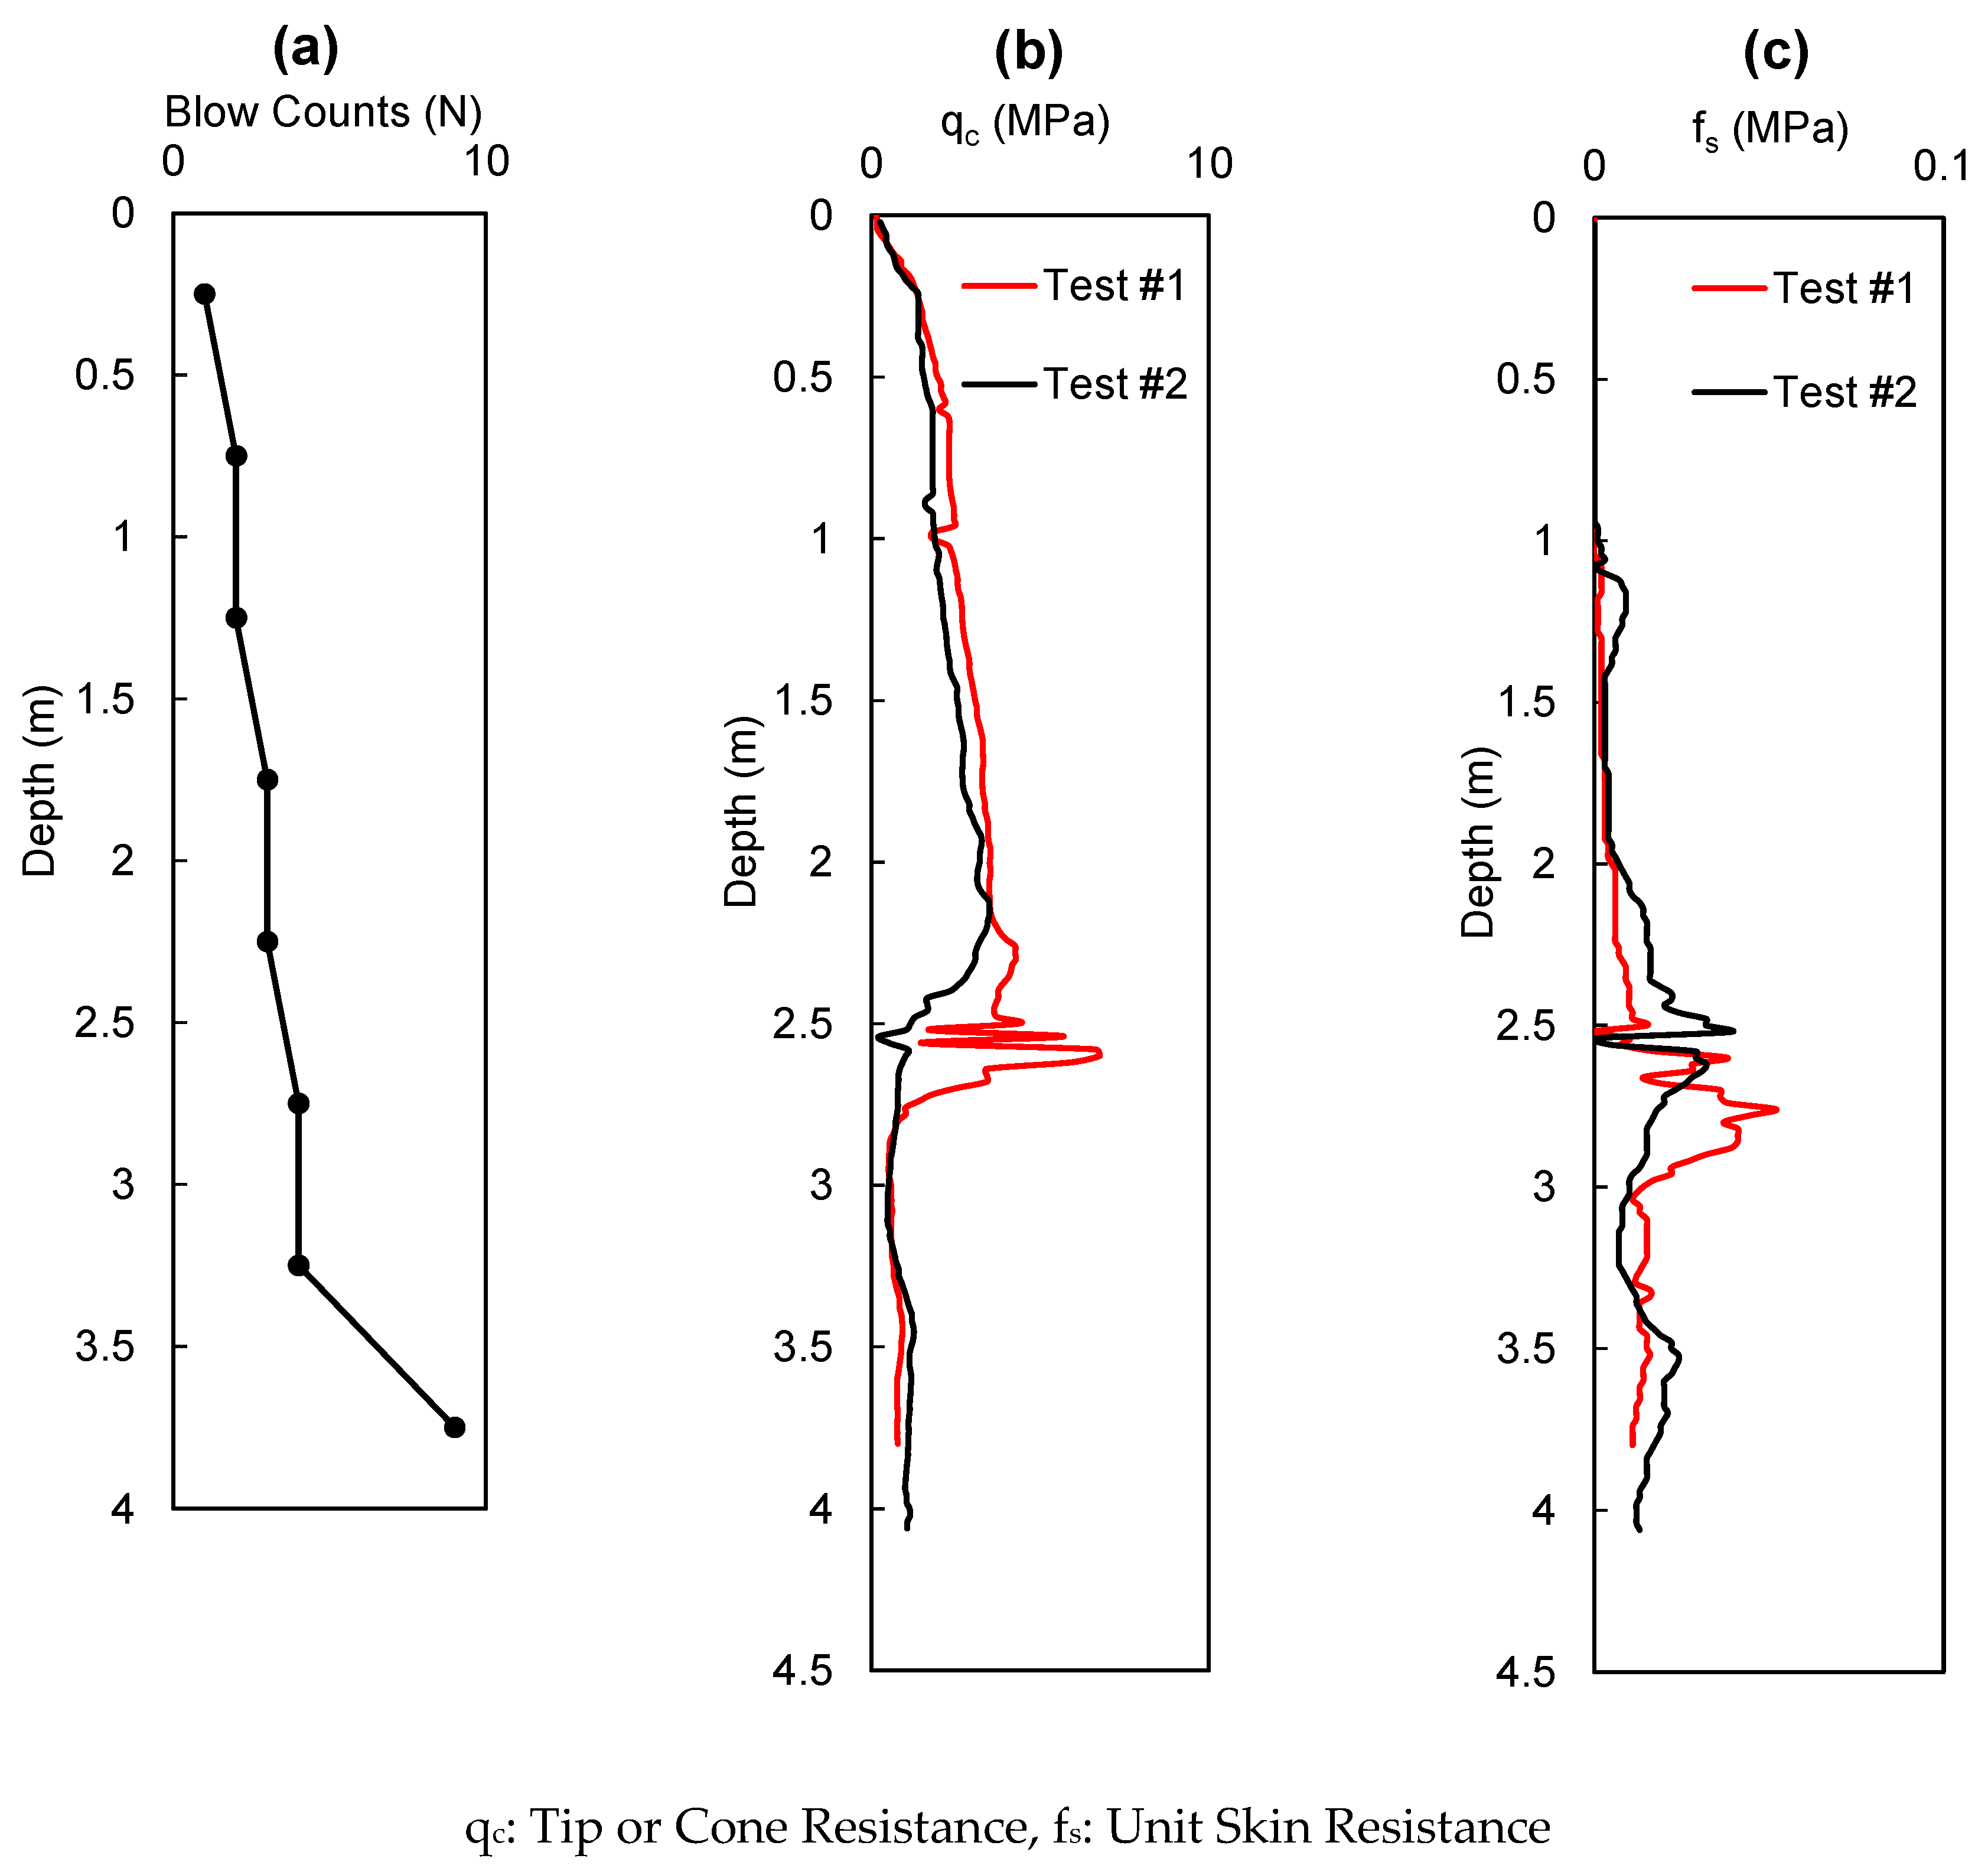
Figure 6.
Modified static pile loading test results: Applied axial load vs. displacement curves obtained from three separately conducted tests (#1-#3).
Figure 6.
Modified static pile loading test results: Applied axial load vs. displacement curves obtained from three separately conducted tests (#1-#3).
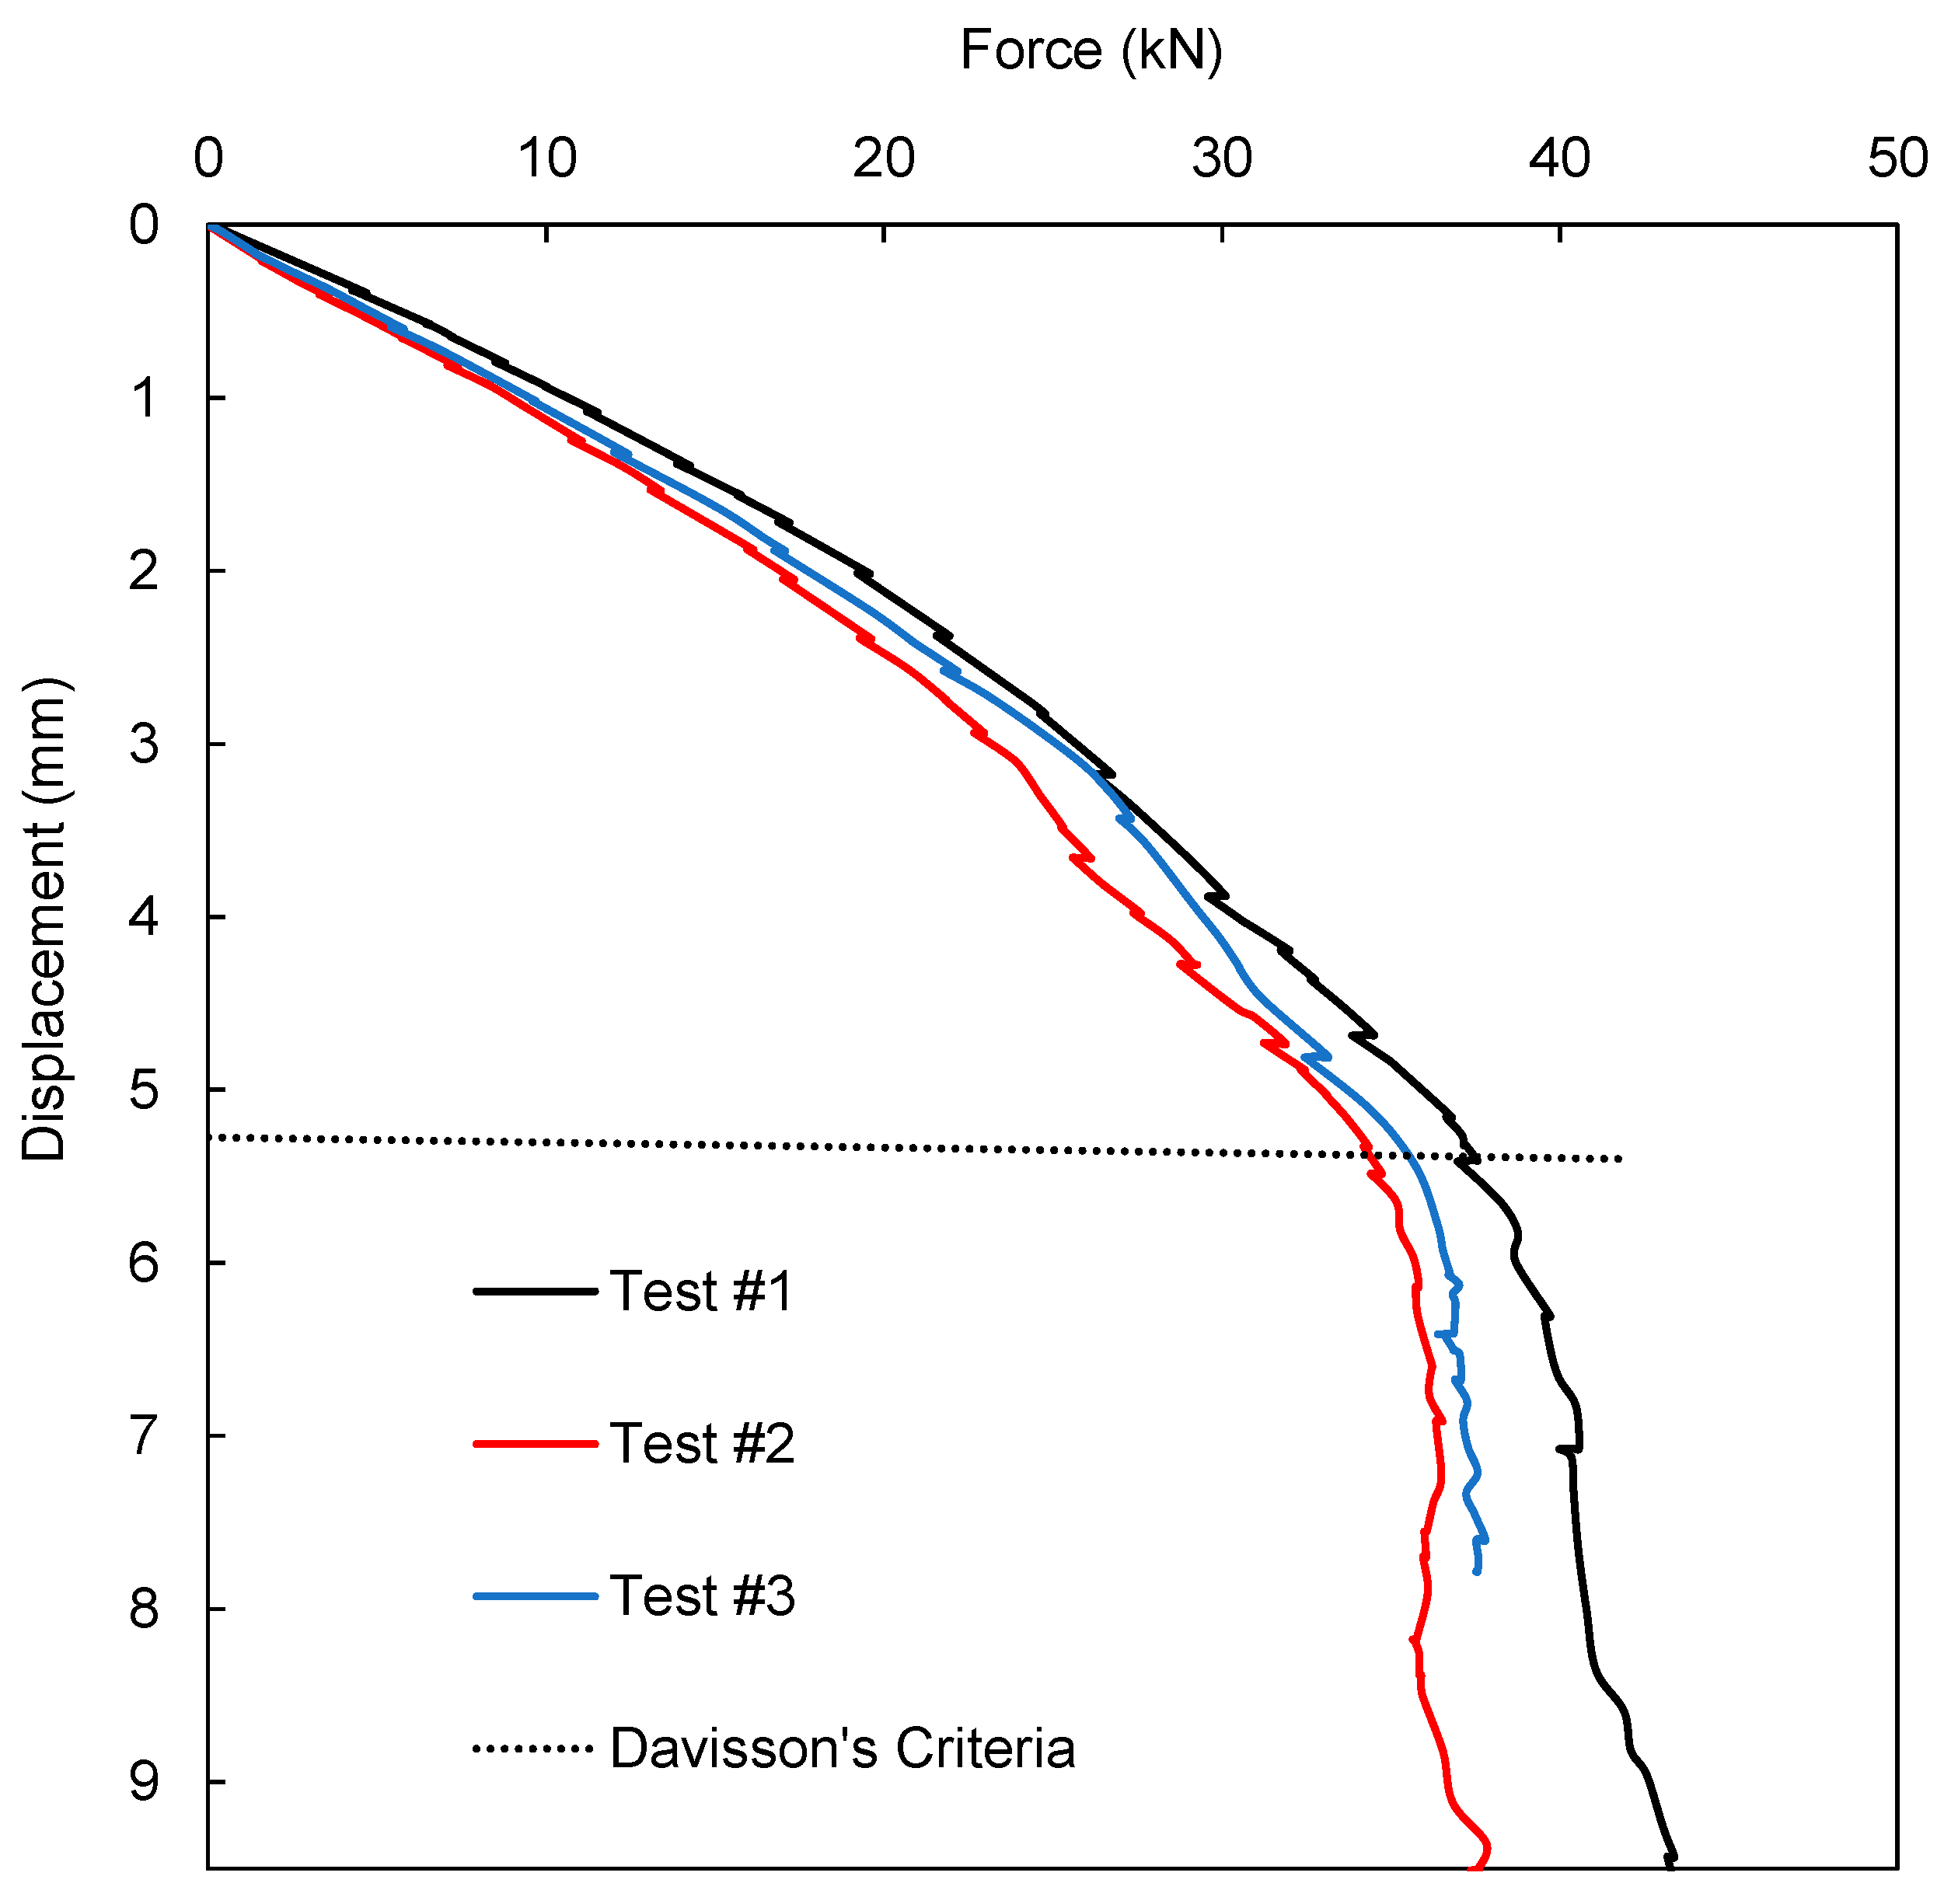
Figure 7.
Load transfer along the pile length. Data is obtained from strain gauges attached to the test sheet pile (axial loading test #1).
Figure 7.
Load transfer along the pile length. Data is obtained from strain gauges attached to the test sheet pile (axial loading test #1).
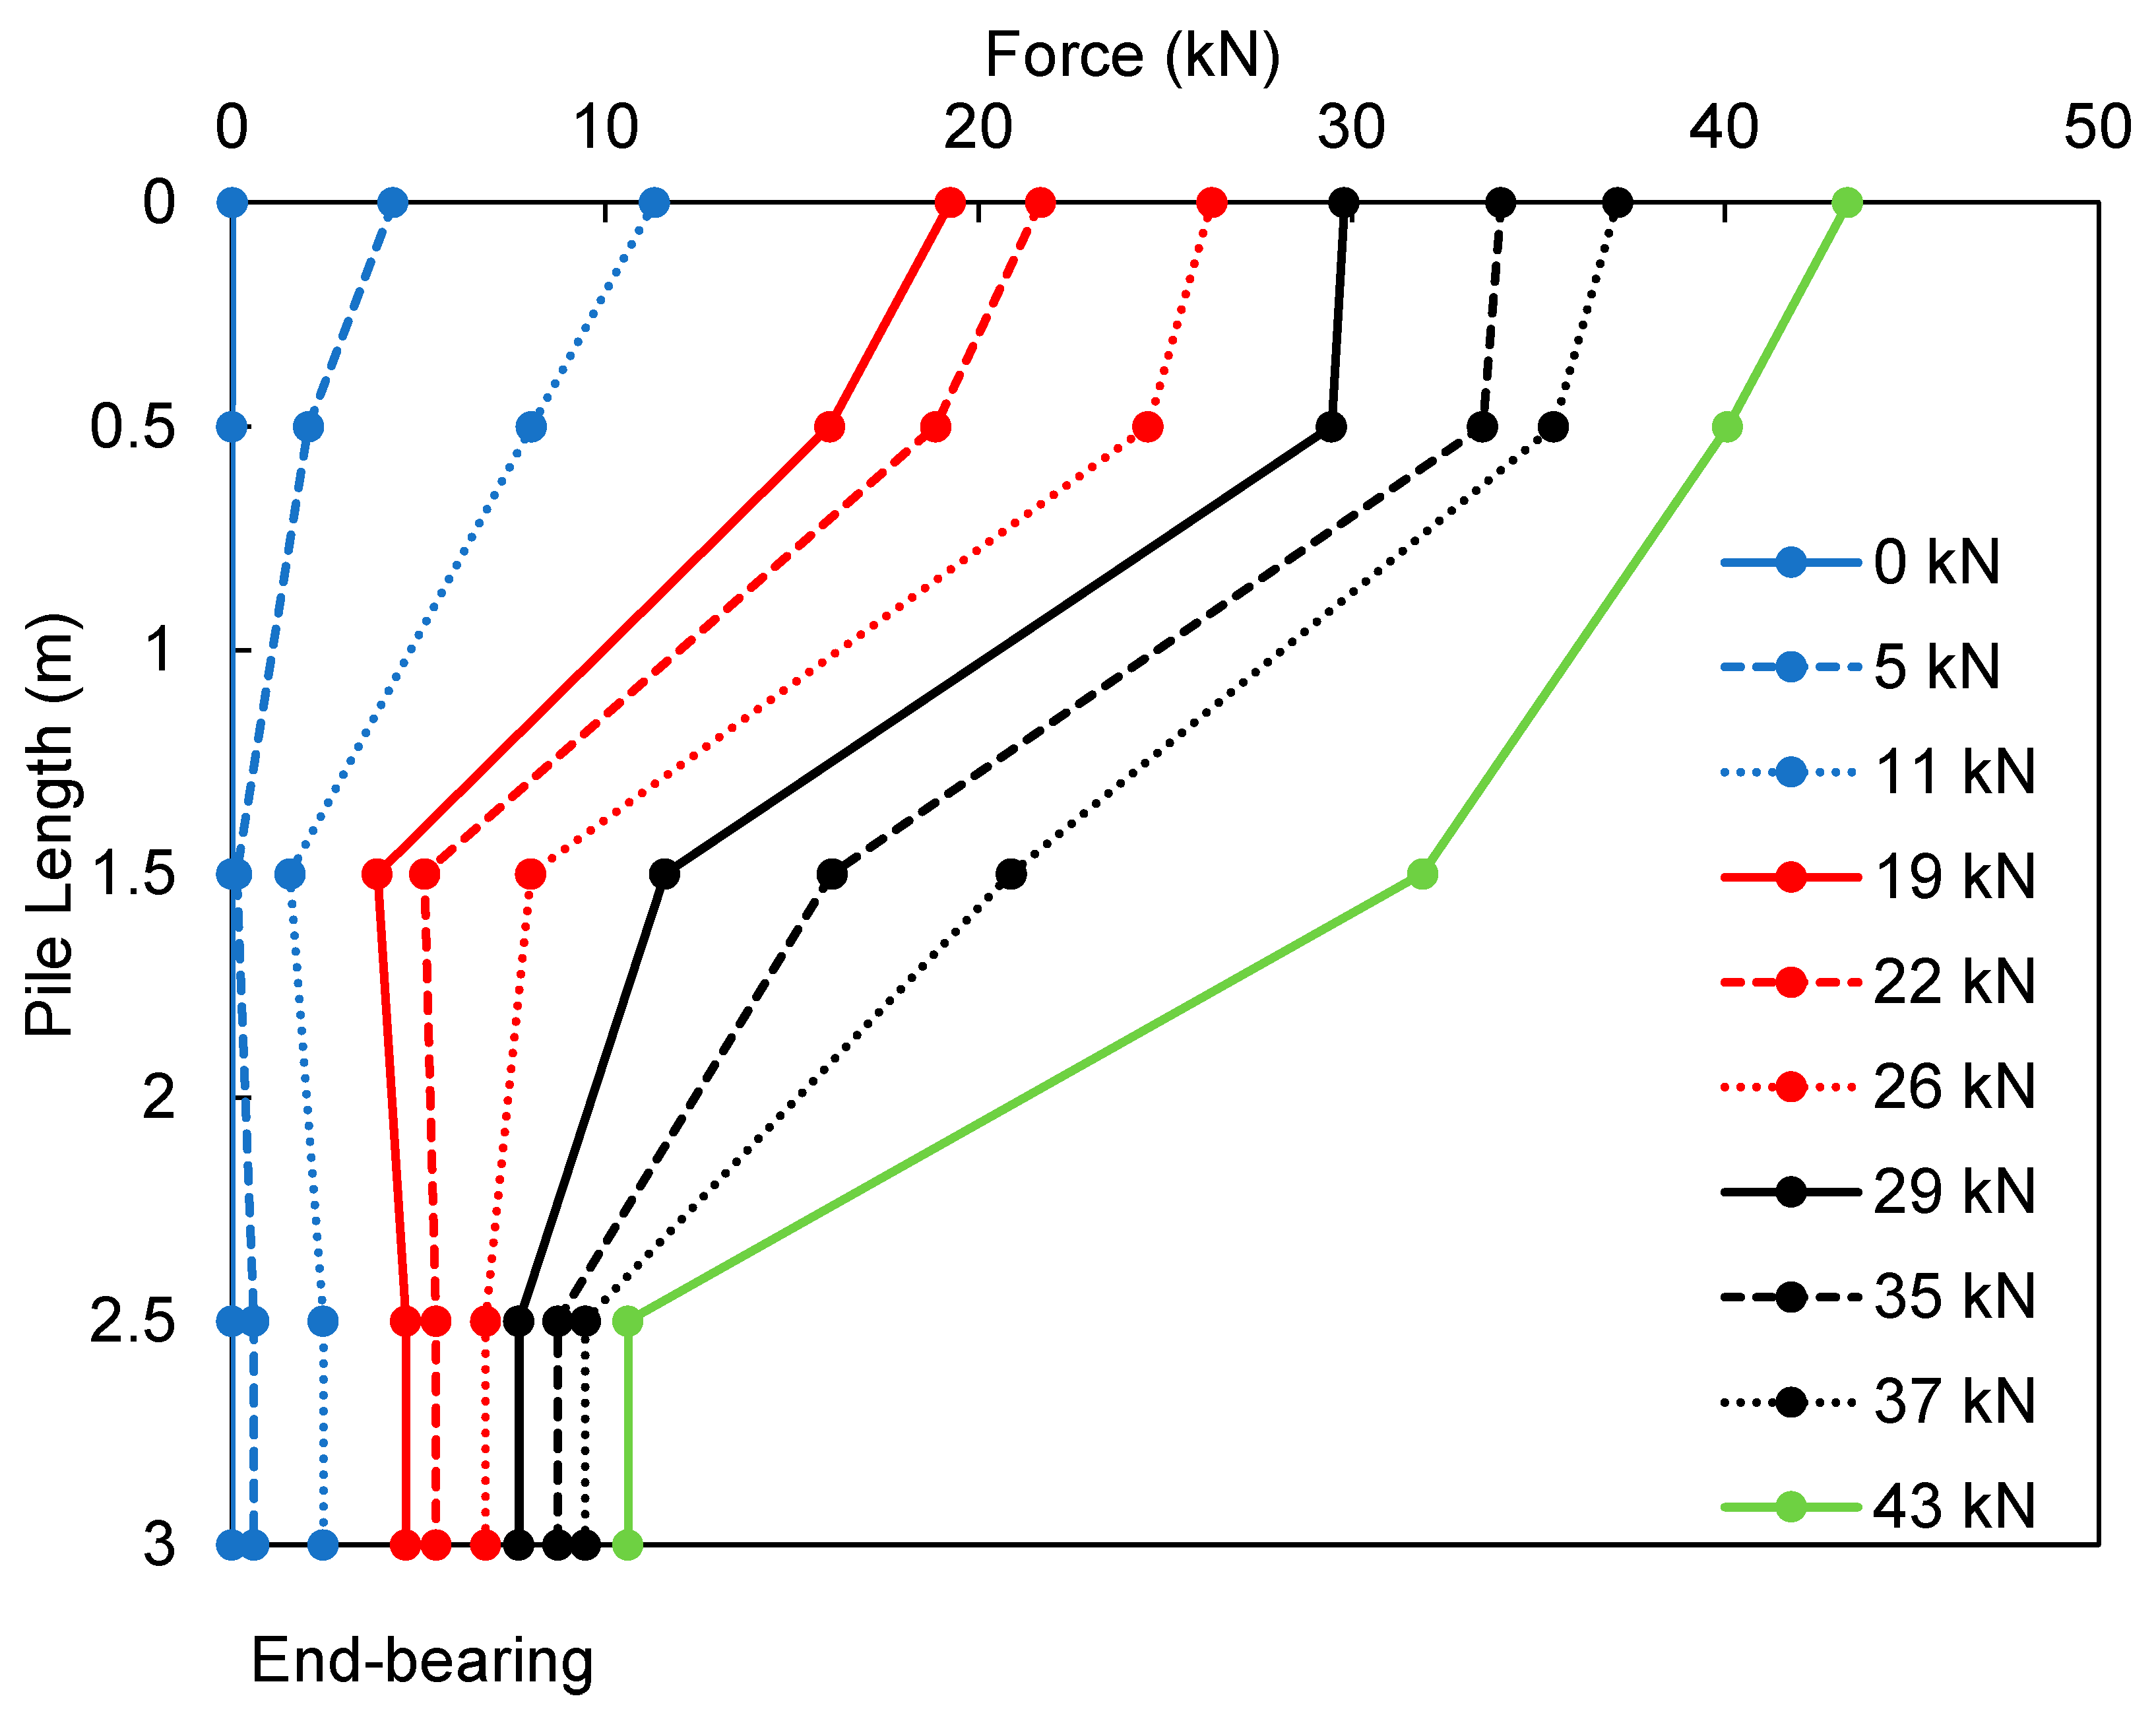

Table 1.
Previous studies on the bearing capacity of a sheet pile and its comparison with other pile types.
Table 1.
Previous studies on the bearing capacity of a sheet pile and its comparison with other pile types.
| Ref | Test Method | Soil Characterization | Soil Type | Test Scale | Pile Type |
Pile Length (m) | Number of Sections |
Ultimate Load (kN) |
Comparison Pile |
Comparison Pile Length (m) | Comparison Pile - Ultimate Load (kN) |
|---|---|---|---|---|---|---|---|---|---|---|---|
| 1) | PDA | SPT | Sand | Full scale | AZ | 11.2 | 2 sections | 961 | N/A | N/A | N/A |
| 2) | Pile loading test and PDA | SPT, CPT, DMT, laboratory tests | Sand | Down scale | PZ27 | 2.2 | 4 sections | 1,219 | N/A | N/A | N/A |
| Fullscale | 5 | 2 sections | 153 | H-pile | 5 | 100 | |||||
| 3) | Static pile loading test | SPT, CPT, PM, PAF, CPD, laboratory tests | Clay | Full scale | LP2S | 7.4 | 2 sections | 2,400 | Closed box pile | 12.2 | 2,250 |
| Sand | 2S | 12 | 3,000 | 1,300 | |||||||
| 4) | Pile loading test and PDA | SPT | Sand, silt, gravel | Full scale | N/A | 11.2 | 2 sections | 3,500 | Open box pile | 11.2 | 2,100 |
| 5) | Static pile loading test | CPT | Sand | Full scale | AZ37 | 15 | 2 sections | 2,500 | Composite 4×GU16-400 | 13 | 2,654 |
| |||||||||||
Table 2.
Soil properties to estimate the bearing capacity of the model test pile.
| Soil | Unit weight, γ (kN/m3) |
(°) | Cohesion, C (kN/m2) |
Friction angle at the soil-pile interface, (°) |
Coefficient of lateral earth pressure, K0 |
|---|---|---|---|---|---|
| Sand (backfill) |
18 | 30 | 0 | 24 | 0.5 |
| Clay (in situ) |
17 | 0 | 50 | 0 | N/A |
Table 3.
The bearing capacity of the model test pile: Comparison of the static pile loading test results with those from analytical, SPT-based, and CPT-based methods and numerical model. Note: the pile length is L = 2.7 m for all of those approaches.
Table 3.
The bearing capacity of the model test pile: Comparison of the static pile loading test results with those from analytical, SPT-based, and CPT-based methods and numerical model. Note: the pile length is L = 2.7 m for all of those approaches.
| Method | Side frictional resistance Qs (kN) | End-bearing resistance Qp (kN) |
Ultimate bearing capacity Qu (kN) |
|
|---|---|---|---|---|
| Analytical method | Meyerhof (1976) + Coyle & Castello (1981) |
26.2 | 2.4 | 28.6 |
| Effective Stress (β-method) | 25.2 | 7.8 | 33.0 | |
| SPT-based method | Brown (2001) | 57.5 | 8.9 | 66.4 |
| Meyerhof (1976) | 6.9 | 6.4 | 13.3 | |
| CPT-based method | Nottingham and Schmertmann (1975) | 18.0 | 14.6 | 32.6 |
| Eslami and Fellenius (1997) | 33.3 | 7.3 | 40.6 | |
| Pile loading test | #1 | 27.5 | 9.5 | 37.0 |
| #2 | 24.7 | 10.3 | 35.0 | |
| #3 | N/A | N/A | 35.2 | |
Disclaimer/Publisher’s Note: The statements, opinions and data contained in all publications are solely those of the individual author(s) and contributor(s) and not of MDPI and/or the editor(s). MDPI and/or the editor(s) disclaim responsibility for any injury to people or property resulting from any ideas, methods, instructions or products referred to in the content. |
© 2025 by the authors. Licensee MDPI, Basel, Switzerland. This article is an open access article distributed under the terms and conditions of the Creative Commons Attribution (CC BY) license (http://creativecommons.org/licenses/by/4.0/).
Copyright: This open access article is published under a Creative Commons CC BY 4.0 license, which permit the free download, distribution, and reuse, provided that the author and preprint are cited in any reuse.


