
Submitted:
05 June 2025
Posted:
05 June 2025
You are already at the latest version
Abstract
The colorant Congo Red is a synthetic azo dye, whose metabolites, depending on the doses, can be harmful for the environment and human health. Congo red can pollute the water mainly by the release of wastewater from different industries. Different metho-dologies have been proposed for its quantification, many of them including the use of spectrophotometry and HPLC, but some processes can be tedious and require various steps of sample preparation. In this work, a biosensor with immobilized enzymes lac-cases and Surface Plasmon Resonance (SPR) was used, achieving a LOD of 0.008 mg L-1, a LOQ of 0.028 mg L-1, a R2 value of 0.9926 and a working range from 0-3.5 mg L-1. Furt-hermore, the method was teste don spiked samples of tap water, with a % of recovery of 104.48%±10.41. The LOD was lower than other reported techniques for the detection of Congo Red, suitable for its use in real samples of tap water, and with a simple prepara-tion process.
Keywords:
Congo Red
; Surface Plasmon Resonance
; Biosensor
; water pollution
; laccase
1. Introduction
Congo Red - 3,3′-(biphenyl-4,4′-diyldidiazene-2,1-diyl) bis (4-aminonaphthalene-1-sulfonate)- is a synthetic azo dye [1] that, depending on the pH value, can have different colors: is blue-violet at pH 3, and red at pH 5 [2]. Also, it is one of the most common dye pollutants in water [3]. Depending on the doses, its metabolite benzidine causes harmful effects for humans and the environment: in humans, has carcinogenic, mutagenic, and cytotoxic effects, causes allergic reactions and damage to skin, eyes, reproductive and respiratory systems [4]. The chemical structure is shown in Figure 1. In animals, it is mutagenic, causes platelet aggregation, thrombocytopenia, and microembolism, enzyme inhibition, and hastens coagulation in cat´s blood. Also, its mutagenic effects can affect microorganisms like bacteria, algae, and protozoa [4]. Congo Red and other organic dyes are released to the environment through printing and dyeing wastewater, from textile, paper, leather, cosmetics, printing, and plastic industries, and its stable structure hinders degradation and provides high toxicity [5]. Studies have been found that concentrations of 3.11 mg L−1 can inhibit the growth of 50% of the tested individuals (IC50) of the microalga Pseudokirchneriella subcapitata, a concentration of 322.9 mg L−1 can be lethal for 50% tested organisms (LC50) of the cladocerans Daphnia magna, and for the cladocerans Ceriodaphnia rigaudi, the LC50 is 62.92 mg L−1. This reveals the impact that the pollution of the environment with this colorant can have on different trophic levels [6].
Different strategies have been used for the detection and quantification of Congo Red. For instance, Rafique et al. quantified this colorant in samples of effluent water, through UV-vis spectrometry and analyzed samples with concentrations in a range from 0.01% to 0.05% [8]. In another work, Qin et al. used Fe3O4@ionic liquid-β-cyclodextrin polymer magnetic solid phase extraction coupled with HPLC with a C18 column and UV-vis detector, for the determination of Congo Red in water samples, achieving a linear range from 0.005–100.00 µg mL−1, and a LOD of 1.8 g L−1 [9]. In another study, Liu et al. used a molecularly imprinted polymer coupled to HPLC for the detection of Congo Red food samples, with a previous solid-phase extraction, achieving a LOD of 0.07 μg kg−1 and a LOQ of 0.23 μg kg−1[10]. Also, other techniques have been proposed. For instance, Sahraei et al. used a spectrophotometric methodology with a nanosilver catalyzed oxidation by potassium iodate in a hydrochloric acid medium in water samples, with a linear range of 0.8–240 mg L−1, and a LOD of 0.6 mg L−1 [11]. On the other hand, Ganash et al. determined this colorant in samples of jelly, candy, wastewater, and tap water, using an Electrochemical Sensor Based on Gold Nanoparticle-Modified Carbon-Paste Electrode, with a LOD of 0.07 μM in the concentration range of 1–30 μM, and a LOD of 0.7 μM in the concentration range of 50–200 μM [12]. In another work, Liu et al. developed a label-free fluorescent sensor based on yellow-green emissive carbon quantum dots for the detection of Congo Red in water samples, with linear ranges of 0.5–50 and 50–170 μg mL−1, and LOD of 0.04 and 0.03 μg mL−1, respectively [13]. In other studies, Zulfajri et al. used a rambutan seed waste-derived nitrogen-doped carbon dots with L-aspartic acid for the detection of the colorant in water, and achieved a LOD 0.035 μM [14]. In another work, de Paula et al. studied the interaction of bovine serum albumin with Congo red dye and Surface Plasmon Resonance (SPR), and analyzed samples in a concentration range of 10–34 μM [15]. The present work proposes a SPR biosensor with the enzyme laccase immobilized on a thin gold film to detect Congo Red. SPR techniques have been demonstrated to achieve low LODs [16], and, combined with the use of enzymes like laccases, can have real-time measurements, with good recovery percentages and can be reused many times [17,18,19]. Laccase are multicopper enzymes that catalyze direct reduction of molecular oxygen to water, through a one electron oxidation of aromatic substrates without formation of hydrogen peroxide intermediate, by one-electron abstraction and are widely expressed in higher plants, fungi and bacteria [20]. In this work, a plasmonic sensor was used, based on the phenomenon of plasmon resonance. This phenomenon occurs when a photon of incident light hits a metal surface, usually a gold surface. At a certain angle of incidence, a portion of the light energy couples through the metal coating with the electrons in the metal surface layer, which then move due to excitation. These electron movements are called plasmons, and they propagate parallel to the metal surface. This plasmon oscillation in generates an electric field between the metal surface and the sample solution [21,22].
2. Methodology
2.1. Reagents and Materials
The chemical reagents, including the Red Congo Colorant, the laccase enzymes from Rhus vernicifera, the reagents for immobilization 16-mercaptohexadecanoic acid (MHDA), 11-mercaptoundecanol (MUD), 1-ethyl-3-(3-dimethylamino-propyl) carbodiimide hydrochloride (EDC) ethanolamine hydrochloride, and N-hydroxysuccinimide (NHS), were purchased from Sigma-Aldrich (St. Louis, MO, USA) and had analytical standard grade. The statistical analysis was performed with MinitabTM (OriginLab Corporation, Northampton, MA, USA). A sample of tap water was obtained using the methodology described at the regulation NOM-127-SSA1-2021 [23]. The sampling site was in the city of Leon, in Guanajuato, Mexico, with the following location: 21.157439046327397, -101.70295000187116.
2.2. Physical and Chemical Characterization of the Tap Water Sample
A physical and chemical characterization of the tap water sample was carried out, using Test Strips (UmlecoaTM, China). Following the directions of the supplier. The measured parameters were: total hardness, free chlorine, total chlorine, monopersulfate, cyanuric acid, ammonia chloride, bromine, total alkalinity, carbonate, fluoride, iron, copper, lead, nitrates, and nitrites. On the other hand, the pH was measured using a pH meter (model HI8314-1, Hanna Instruments, RI, USA).
2.3. Coating of the Glass Chips and SPR Setup
For the experiments, the gold chips used in the SPR system consisted of thin films of Cr/Au deposited on glass substrates of 1 × 1 cm by thermal evaporation of a 3 nm chromium layer, followed by a 50 nm gold film, deposited at a rate of 5 Å/s and 8 × 10⁻⁶ mbar, using a quartz crystal microbalance thickness monitor (XTC/2 Depositions Controllers Leybold Inficon quartz monitor, San Jose, CA, USA) [18]. The SPR setup used in this study was based on a Kretschmann configuration and consisted of two stacked rotation plates synchronized to move in a θ-2θ system using a stepper motor. Then, samples were injected into a Teflon cell using a syringe pump (Legato 100, KDScientific, Boston, MA, USA) and were faced against a thin gold chip previously coupled optically to a hemicylindrical BK7 glass prism, using an oil-matching index (n = 1.51) [18,19]. The detection was performed detecting the reflection changes of the p-polarized He-Ne laser light (N-LHP, Newport Corp., Irvine, CA, USA) at a wavelength of 633 nm to excite the surface plasmons, passing through the prism, using a photodetector (Hamamatsu, model S1226-8Bk, Bridgewater, NJ, USA) [18,19].
2.4. Immobilization of Laccases on The thin Cr-Au Film
The enzymes laccases from Rhus vernicifera were used as a bioreceptor. Therefore, the laccases were immobilized on a chip with a thin Cr-Au film (3 nm of Cr and 50 nm of gold) through covalent bonds. The process of immobilization was carried out as described in a previous work [18]: first, the thin gold film was functionalized, by adding with a micropipette 200 µL solution of the alkanethioles MHDA:MUD in ethanol, in a concentration of 250 µM, and left for 12h, at room temperature. After that, the chips were rinsed with absolute ethanol and air dried. Then, the free carboxyl groups generated by the alkanethiols, were activated with 350 µL of a 1:1 mix of EDC/NHS cross-linkers (0.2 M/0.05 M) in MES buffer (100 mM, 500 mM NaCl, pH 5) and rinsed with destilled water. After that, 200 U mg−1 of the enzyme was added to the chip’s surface, to allow the formation of amide bonds between the amino acids of the enzymes and the terminal carboxyl group of the alkanethiols. Finally, an ethanolamine solution (1 M, pH 8.5) was added to bind the remaining available carboxyl groups after the enzymes were immobilized, to prevent nonspecific binding in further analyses. A Fourier Transform Infrared (FTIR) spectroscopy analysis of the chips in the step of functionalization with the alkanethiols MHDA/MUD, the activation phase with EDC/NHS, and after the laccases immobilization.
2.5. Calibration Curve and Analysis of Samples
All the analyses were carried out with an injection rate of 0.2 mL min-1. For the calibration curve, stock solutions with Congo Red and distilled water were prepared, with concentrations of 0,1, 2,3, and 3.5 mg L-1. Previous to the analysis, a scan from 30 to 90° was carried out with air and water, and a fixed angle of 71.5° was selected [24]. The working angle was established at the highest slope of the linear region of the plasmon curve; the measurements were monitored as a function of time. Before the analysis of each sample, distilled water was injected to obtain the baseline, then the sample was injected until the signal was stable, and finally, NaOH 40mM was injected to regenerate the biosensor, followed by water. For the validation of the method, a sample of tap water spiked with Congo Red 2 mgL-1 was analyzed by duplicate (n=2).
2.6. Analytical Parameters
Once the calibration curve and spiked sample were analyzed, the analytical parameters were calculated. The LOD was defined as three times the standard deviation of the blank (n=2), and the LOQ was defined as ten times the standard deviation off the blank (n=2). Also, the equation of the line and the correlation coefficient R2 were calculated. The percentage of recovery of the spiked sample was calculated with the following equation:
Equation 1:
3. Results and Discusión
3.1. Physical and Chemical Characterization of the Tap Water Sample
As mentioned before, the tap water sample was characterized physically and chemically (see Table 1). As can be seen in Table 1, no heavy metals like iron, copper, and lead were detected. Also, no nitrites, bromine, MPS, fluoride, cyanuric acid, and ammonia chloride were detected either. On the other hand, the concentration of nitrates was lower than the maximum permissible limits (50 mg L-1) established by the World Health Organization (WHO), also, the pH values are suitable for drinking water, according to the WHO permissible limits (6.5-8.5) [25]. In regards of chloride, the WHO has not a health-based guideline value for drinking water, but for chlorine proposes a limit of 5 mg L-1. On the other hand, the acceptability of the degree of hardness can vary from one community to another. The taste threshold for the calcium ion is in the range of 100–300 mg L-1, the taste threshold for magnesium is probably lower, and consumers tolerate water hardness over 500 mg L-1, and a hardness above 200 mg L-1 may cause scale deposition in the treatment works, pipework, distribution system, and tanks within buildings [25]. The hardness is related to the carbonates, and it is usually expressed as milligrams of calcium carbonate per litre [25]. According to this, the carbonate concentration of the tap water sample (240 mg L-1) can cause scale deposition.
3.2. Immobilization of Laccases on the Thin Cr-Au Film
The laccases were immobilized by covalent binding on a thin gold film and after that, a scan from 30-80° was carried out with a sample of distilled water (see Figure 2). On the other hand, a replicate of the immobilization was carried out, to have samples from the functionalization step with alkanethiols (MHDA/MUD), the activation step with EDC/NHS, and after laccase immobilization, and were analyzed by FTIR (see Figure 3). Two small signals appeared since the functionalization step, corresponding to CH2 stretching of the alkanethiols MHDA/MUD in the range of 2860–2927 cm−1, as well as C=O stretching and COO- stretching signals between 1500–1700 cm−1 [26,27]. The presence of these peaks throughout the entire process of immobilization, indicates that the alkanethiols were bonded to the Cr–Au surface. Also, in the FTIR spectra, stretching signals could be observed close to 1460 cm-1, which confirmed the presence of CH2 bonds from alkanethiols, as well as signals close to 2850-3000 cm-1 [28]. Moreover, close to 1820 cm−1 can be seen changes in the percentage of transmittance was observed with the addition of EDC/NHS, corresponding to the symmetric stretch of C=O [29].
3.3. Calibration Curve and Analysis of the Samples
A calibration curve with concentrations of 0, 1, 2, 3, and 3.5 mg L-1 was carried out (see Figure 4). After that, a sample of tap water spiked with 2 mg L-1 of Congo Red was analyzed in duplicate (see Figure 4). As can be seen, as the dye concentration increased, so did the reflectance. When the Congo Red solutions were injected, the signal gradually increased until it stabilized. Once stable, the regenerating solution was injected and washed with distilled water, before the biosensor was reused. Ultimately, the biosensor underwent 10 cycles of use. After the calibration was carried out, the spiked sample with Congo Red at a concentration of 2 mg L-1 was analyzed in duplicate (see Figure 4).
3.4. Analytical Parameters
The graphic of the calibration curve and relevant analytical parameters are shown in Figure 5 and Table 2, respectively. The calibration had a good linear fitting (R2=0.9926), the equation of the line was obtained and used to calculate the concentrations of the spiked samples. The method had a good % of recovery (104.48%±10.41), apparently, the hardness of the water had neither important influence nor matrix effects. Also, the method had a LOD of 0.008 mg L-1 and a LOQ of 0.028 mg L-1 were obtained. The achieved analytical LOD and LOQ were lower than the results from other authors previously mentioned: Sahraei et al. used a spectrophotometric method with an oxidation reaction, and nansilver [11]. In another study, Rafique et al. also used spectrophotometry, with UV-vis detection, and analyzing solutions with concentrations from [8]. On the other hand, our LOD was also lower than Qin et al., that used HPLC with a UV-vis detector [9], and the method from Liu et al., which used a molecularly imprinted polymer and HPLC, with a previous solid-phase extraction step [10]. In another study, Liu et al. used a fluorescence sensor with quantum dots, with LODs higher than ours. Other techniques have also been proposed for the quantification of Congo Red, like the use of waste derived nitrogen carbon dots [14], and, even, the use of SPR techniques, like the work of de Paula et al., which used the interaction of bovine serum albumin with Congo Red [15], with LODs higher than the achieved in this study. Moreover, the achieved LOD if this study makes the method suitable for the analysis of concentrations that cause damage on indicator organisms like microalgae, cladocerans and fish [6]. However, future testing with samples enriched with similar molecules would be advisable to better verify the method's specificity. This demonstrates the potential of the enzymatic biosensor developed in this work, with no need of markers, or tedious sample pre-processing steps. However, future testing with samples enriched with similar molecules would be advisable to better verify the method's specificity.
4. Conclusions
The metabolites from the colorant Congo Red can cause damage to the environment and human health when reaches the water sources. Thus, different methodologies have been proposed for its detection and quantification, many of them including the use of spectrophotometry, HPLC, and UV-vis detectors, and the sample treatment can be complicated. In this work, an enzymatic SPR biosensor was developed, and a LOD lower than the reported in the other techniques was achieved. Moreover, the LOD was significantly lower than the LC50 and IC50 values reported for this colorant, making the biosensor suitable for analyzing real samples.
Author Contributions
Conceptualization, G.E.Q.-V. and D.L.-M.; methodology, G.E.Q.-V., D.L.-M.; software, G.E.Q.-V., O.R.-Q.; validation, G.E.Q.-V.; formal analysis, G.E.Q.-V., D.L.-M.; investigation, G.E.Q.-V, M.M.R.-D.; resources, G.E.Q.-V. and D.L.-M; data curation, G.E.Q.-V., O.R.-Q.; writing—original draft preparation, G.E.Q.-V., D.L.-M.; writing—review and editing, G.E.Q.-V., D.L.-M., O.R.-Q., A.S.-A., M.M.R.-D., J.F.V.-C.; supervision, D.L.-M-; project administration, D.L.-M.; funding acquisition, D.L.-M, G.E.Q-V. All authors have read and agreed to the published version of the manuscript.
Funding
This project was funded by Secretaría de Ciencia, Humanidades, Tecnología e Innovación (SECIHTI), CVU: 740156, and CVU 101368.
Data Availability Statement
The data generated and analyzed during the current study are available from the corresponding author.
Acknowledgments
The authors want to thank the Secretaría de Ciencia, Humanidades, Tecnología e Innovación (SECIHTI) for the scholarships provided through the “Estancias Postdoctorales por México”, CVU number: 740156 and CVU number: 101368. Also, the authors want to thank María Christian Albor Cortes, from the Materials Characterization Laboratory of the Centro de Investigaciones en Óptica AC.
Conflicts of Interest
The authors declare no conflicts of interest.
References
- Quintanilla-Villanueva GE, Sicardi-Segade A, Luna-Moreno D, Núñez-Salas RE, Villarreal-Chiu JF, Rodríguez-Delgado MM. Recent Advances in Congo Red Degradation by TiO2-Based Photocatalysts Under Visible Light. Catalysts 2025;15:84.
- Oyekanmi AA, Ahmad A, Mohd Setapar SH, Alshammari MB, Jawaid M, Hanafiah MM, et al. Sustainable durio zibethinus-derived biosorbents for Congo red removal from aqueous solution: statistical optimization, isotherms and mechanism studies. Sustainability 2021;13:13264.
- Roy A, Ananda Murthy HC, Ahmed HM, Islam MN, Prasad R. Phytogenic Synthesis of Metal/Metal Oxide Nanoparticles for Degradation of Dyes. J Renew Mater 2022;10:1911–30. [CrossRef]
- Siddiqui SI, Allehyani ES, Al-Harbi SA, Hasan Z, Abomuti MA, Rajor HK, et al. Investigation of Congo red toxicity towards different living organisms: a review. Processes 2023;11:807.
- Yang Y, Liu K, Sun F, Liu Y, Chen J. Enhanced performance of photocatalytic treatment of Congo red wastewater by CNTs-Ag-modified TiO 2 under visible light. Environmental Science and Pollution Research 2022:1–10.
- Hernández-Zamora M, Martínez-Jerónimo F. Congo red dye diversely affects organisms of different trophic levels: a comparative study with microalgae, cladocerans, and zebrafish embryos. Environmental Science and Pollution Research 2019;26:11743–55.
- Oyekanmi AA, Ahmad A, Mohd Setapar SH, Alshammari MB, Jawaid M, Hanafiah MM, et al. Sustainable durio zibethinus-derived biosorbents for Congo red removal from aqueous solution: statistical optimization, isotherms and mechanism studies. Sustainability 2021;13:13264.
- Rafique MA, Kiran S, Javed S, Ahmad I, Yousaf S, Iqbal N, et al. Green synthesis of nickel oxide nanoparticles using Allium cepa peels for degradation of Congo red direct dye: An environmental remedial approach. Water Science and Technology 2021;84:2793–804. [CrossRef]
- Qin X, Bakheet AAA, Zhu X. Fe 3 O 4@ ionic liquid-β-cyclodextrin polymer magnetic solid phase extraction coupled with HPLC for the separation/analysis of congo red. Journal of the Iranian Chemical Society 2017;14:2017–22.
- Liu F, Zhang S, Wang G, Zhao J, Guo Z. A novel bifunctional molecularly imprinted polymer for determination of Congo red in food. RSC Adv 2015;5:22811–7.
- Sahraei R, Farmany A, Mortazavi SS, Noorizadeh H. Spectrophotometry determination of Congo red in river water samples using nanosilver. Toxicol Environ Chem 2012;94:1886–92.
- Ganash A, Alshammari S, Ganash E. Development of a novel electrochemical sensor based on gold nanoparticle-modified carbon-paste electrode for the detection of congo red dye. Molecules 2022;28:19.
- Liu L, Mi Z, Wang J, Liu Z, Feng F. A label-free fluorescent sensor based on yellow-green emissive carbon quantum dots for ultrasensitive detection of congo red and cellular imaging. Microchemical Journal 2021;168:106420.
- Zulfajri M, Sudewi S, Damayanti R, Huang GG. Rambutan seed waste-derived nitrogen-doped carbon dots with l-aspartic acid for the sensing of Congo red dye. RSC Adv 2023;13:6422–32.
- de Paula HMC, Coelho YL, Agudelo AJP, de Paula Rezende J, Ferreira GMD, Ferreira GMD, et al. Kinetics and thermodynamics of bovine serum albumin interactions with Congo red dye. Colloids Surf B Biointerfaces 2017;159:737–42.
- Sadrolhosseini AR, Ghasemi E, Pirkarimi A, Hamidi SM, Ghahrizjani RT. Highly sensitive surface plasmon resonance sensor for detection of Methylene Blue and Methylene Orange dyes using NiCo-Layered Double Hydroxide. Opt Commun 2023;529:129057.
- Quintanilla-Villanueva GE, Luna-Moreno D, Blanco-Gámez EA, Rodríguez-Delgado JM, Villarreal-Chiu JF, Rodríguez-Delgado MM. A novel enzyme-based SPR strategy for detection of the antimicrobial agent chlorophene. Biosensors (Basel) 2021;11:43.
- Quintanilla-Villanueva GE, Rodríguez-Quiroz O, Sánchez-Álvarez A, Rodríguez-Delgado JM, Villarreal-Chiu JF, Luna-Moreno D, et al. An Innovative Enzymatic Surface Plasmon Resonance-Based Biosensor Designed for Precise Detection of Glycine Amino Acid. Biosensors (Basel) 2025;15:81.
- Sánchez-Álvarez A, Quintanilla-Villanueva GE, Rodríguez-Quiroz O, Rodríguez-Delgado MM, Villarreal-Chiu JF, Sicardi-Segade A, et al. Use of Laccase Enzymes as Bio-Receptors for the Organic Dye Methylene Blue in a Surface Plasmon Resonance Biosensor. Sensors 2024;24:8008.
- Kyomuhimbo HD, Brink HG. Applications and immobilization strategies of the copper-centred laccase enzyme; a review. Heliyon 2023;9.
- Homola J, Yee SS, Gauglitz G. Surface plasmon resonance sensors. Sens Actuators B Chem 1999;54:3–15.
- Nguyen HH, Park J, Kang S, Kim M. Surface plasmon resonance: a versatile technique for biosensor applications. Sensors 2015;15:10481–510.
- SSA. NOM-127-SSA1-2021: Agua para uso y consumo humano. Límites permisibles de la calidad del agua. 2021. https://www.dof.gob.mx/nota_detalle_popup.php?codigo=5650705 (accessed May 20, 2025).
- Sánchez-Álvarez A, Luna-Moreno D, Silva-Hernández O, Rodríguez-Delgado MM. Application of SPR Method as an Approach to Gas Phase Sensing of Volatile Compound Profile in Mezcal Spirits Conferred by Agave Species. Chemosensors 2023;11. [CrossRef]
- WHO. Guidelines for drinking-water quality. World Health Organization; 2011.
- Lacour V, Moumanis K, Hassen WM, Elie-Caille C, Leblois T, Dubowski JJ. Formation kinetics of mixed self-assembled monolayers of alkanethiols on GaAs (100). Langmuir 2017;35:4415–27.
- NIH. 16-Mercaptohexadecanoic acid. Compound Summary 2025. https://pubchem.ncbi.nlm.nih.gov/compound/16-Mercaptohexadecanoic-acid#section=13C-NMR-Spectra (accessed May 26, 2025).
- S. Martínez. Interpretación de espectros. Analítica Experimental, vol. I, UNAM; 2023.
- Tsai TC, Liu CW, Wu YC, Ondevilla NAP, Osawa M, Chang HC. In situ study of EDC/NHS immobilization on gold surface based on attenuated total reflection surface-enhanced infrared absorption spectroscopy (ATR-SEIRAS). Colloids Surf B Biointerfaces 2019;175:300–5.
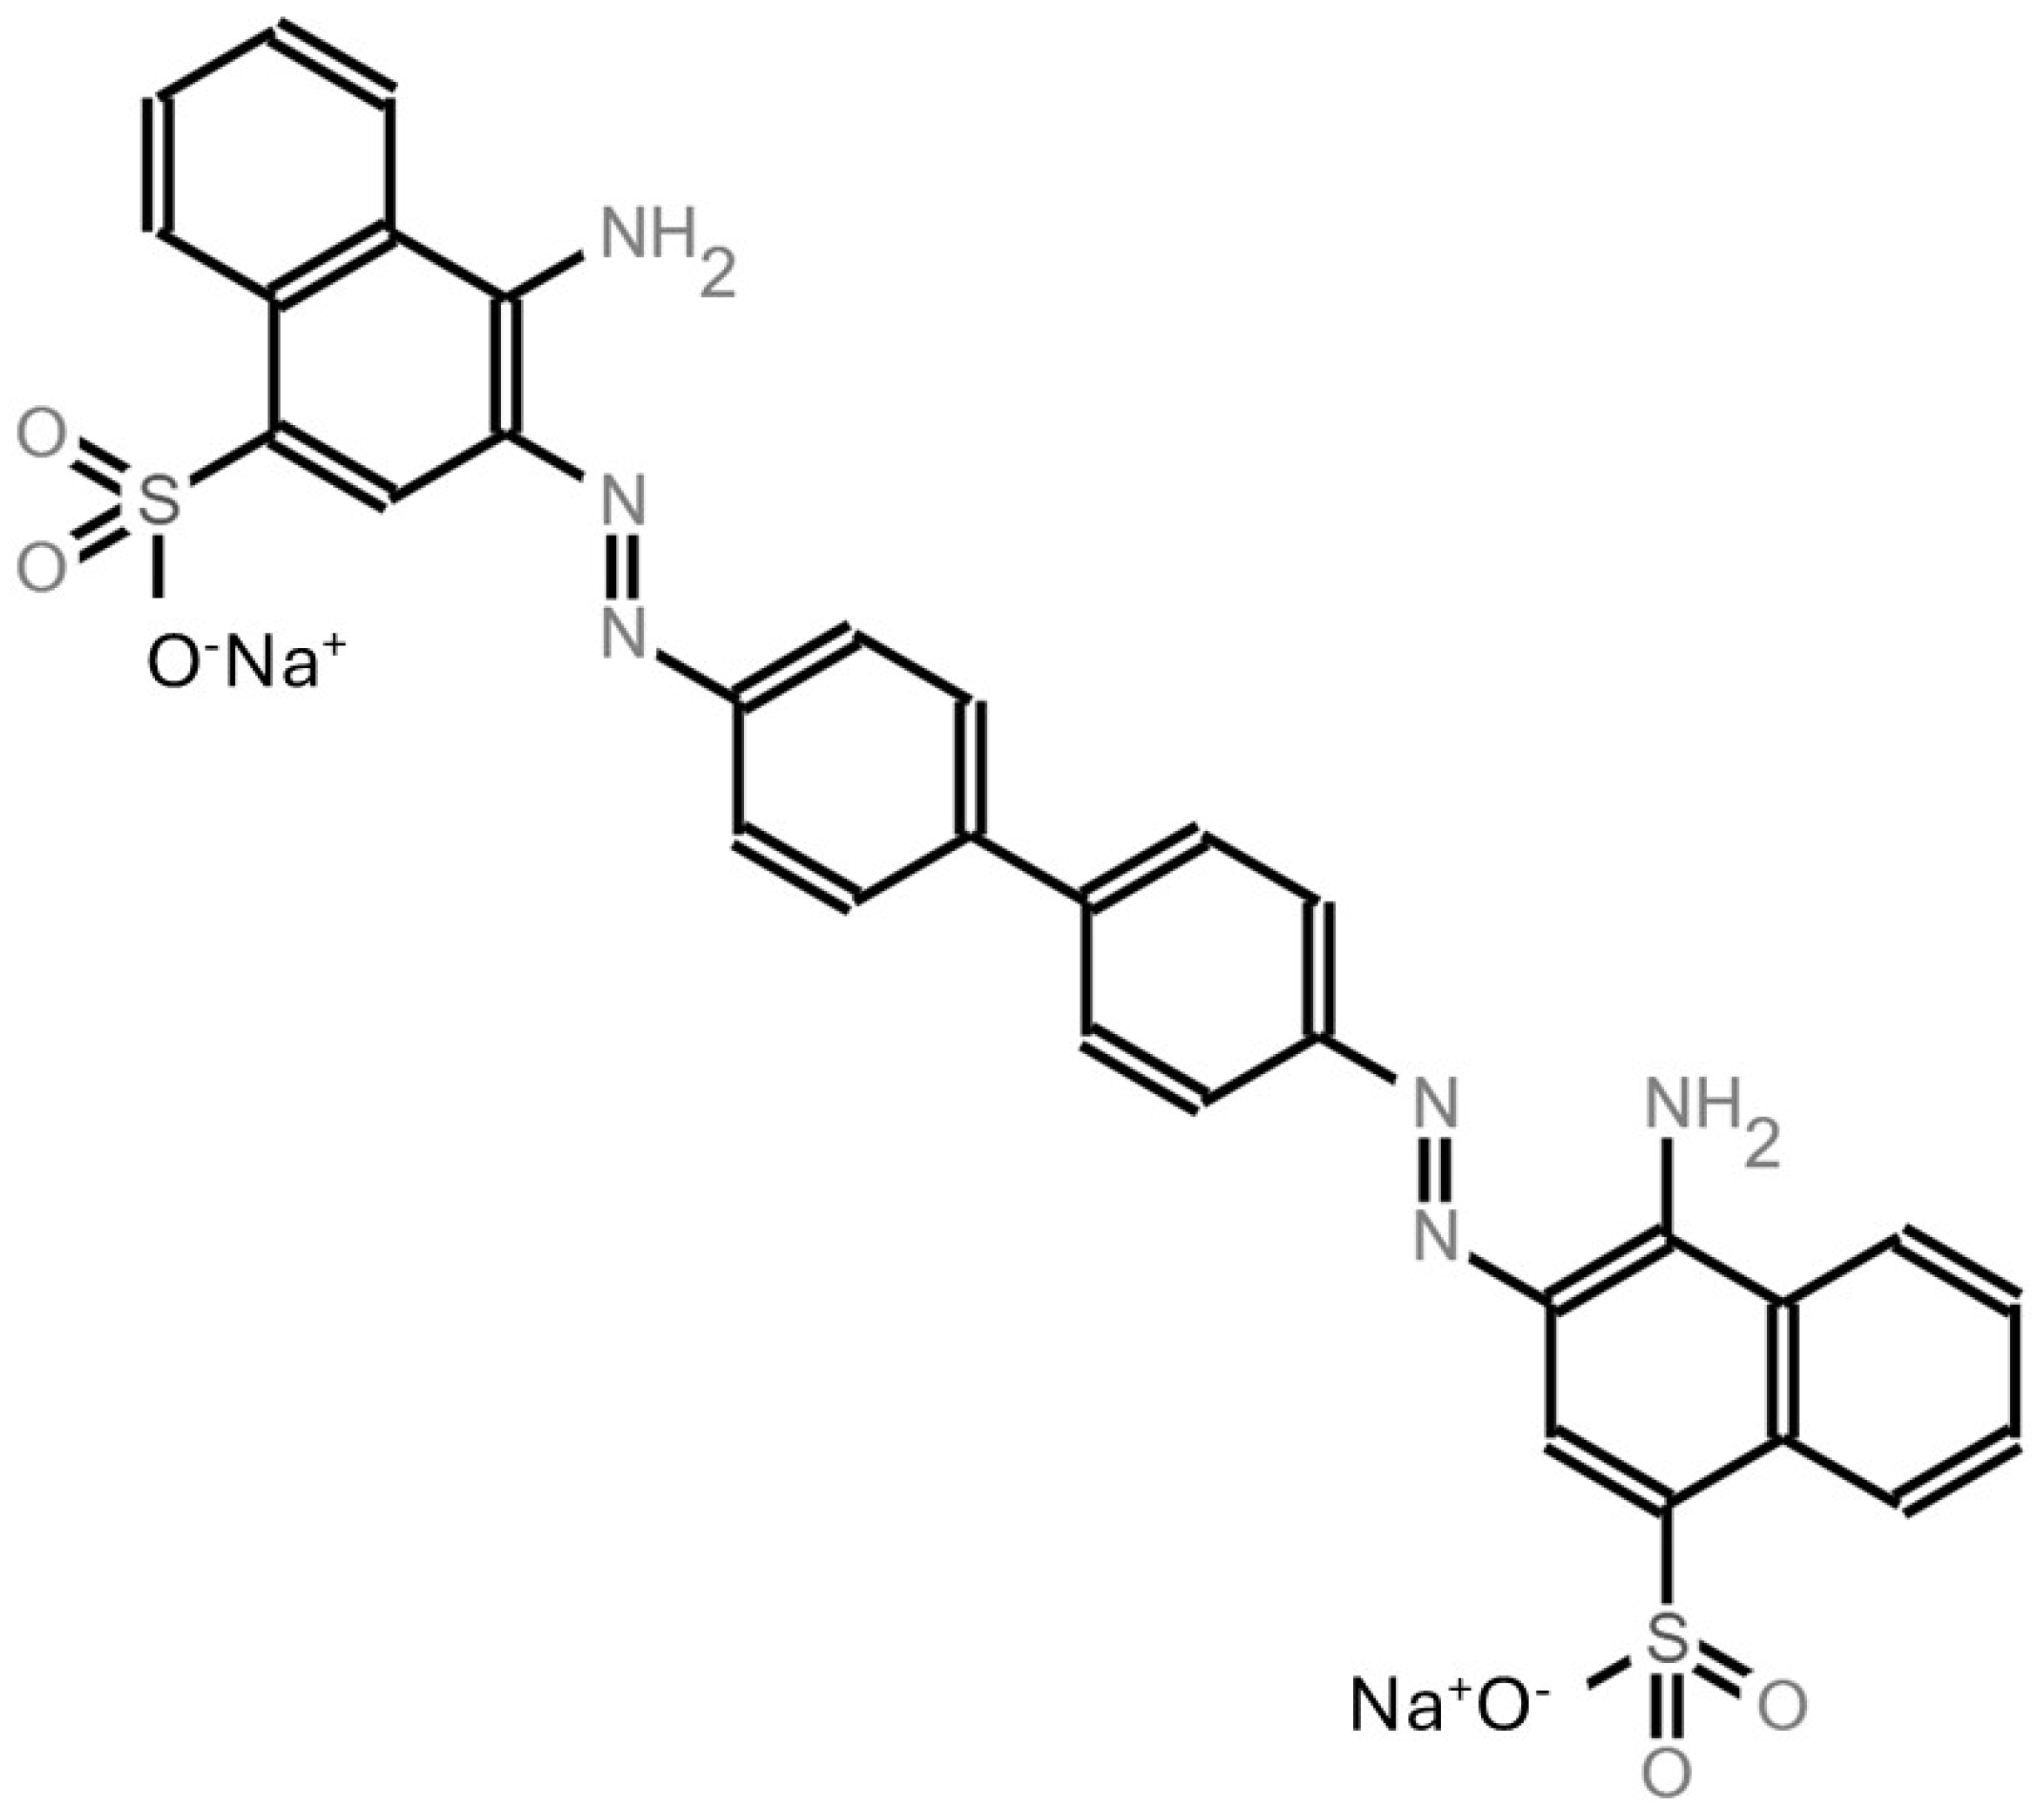
Figure 2.
A) Immobilization process of laccases. B) Scan with air after the immobilization. C) Scan with distilled water.
Figure 2.
A) Immobilization process of laccases. B) Scan with air after the immobilization. C) Scan with distilled water.
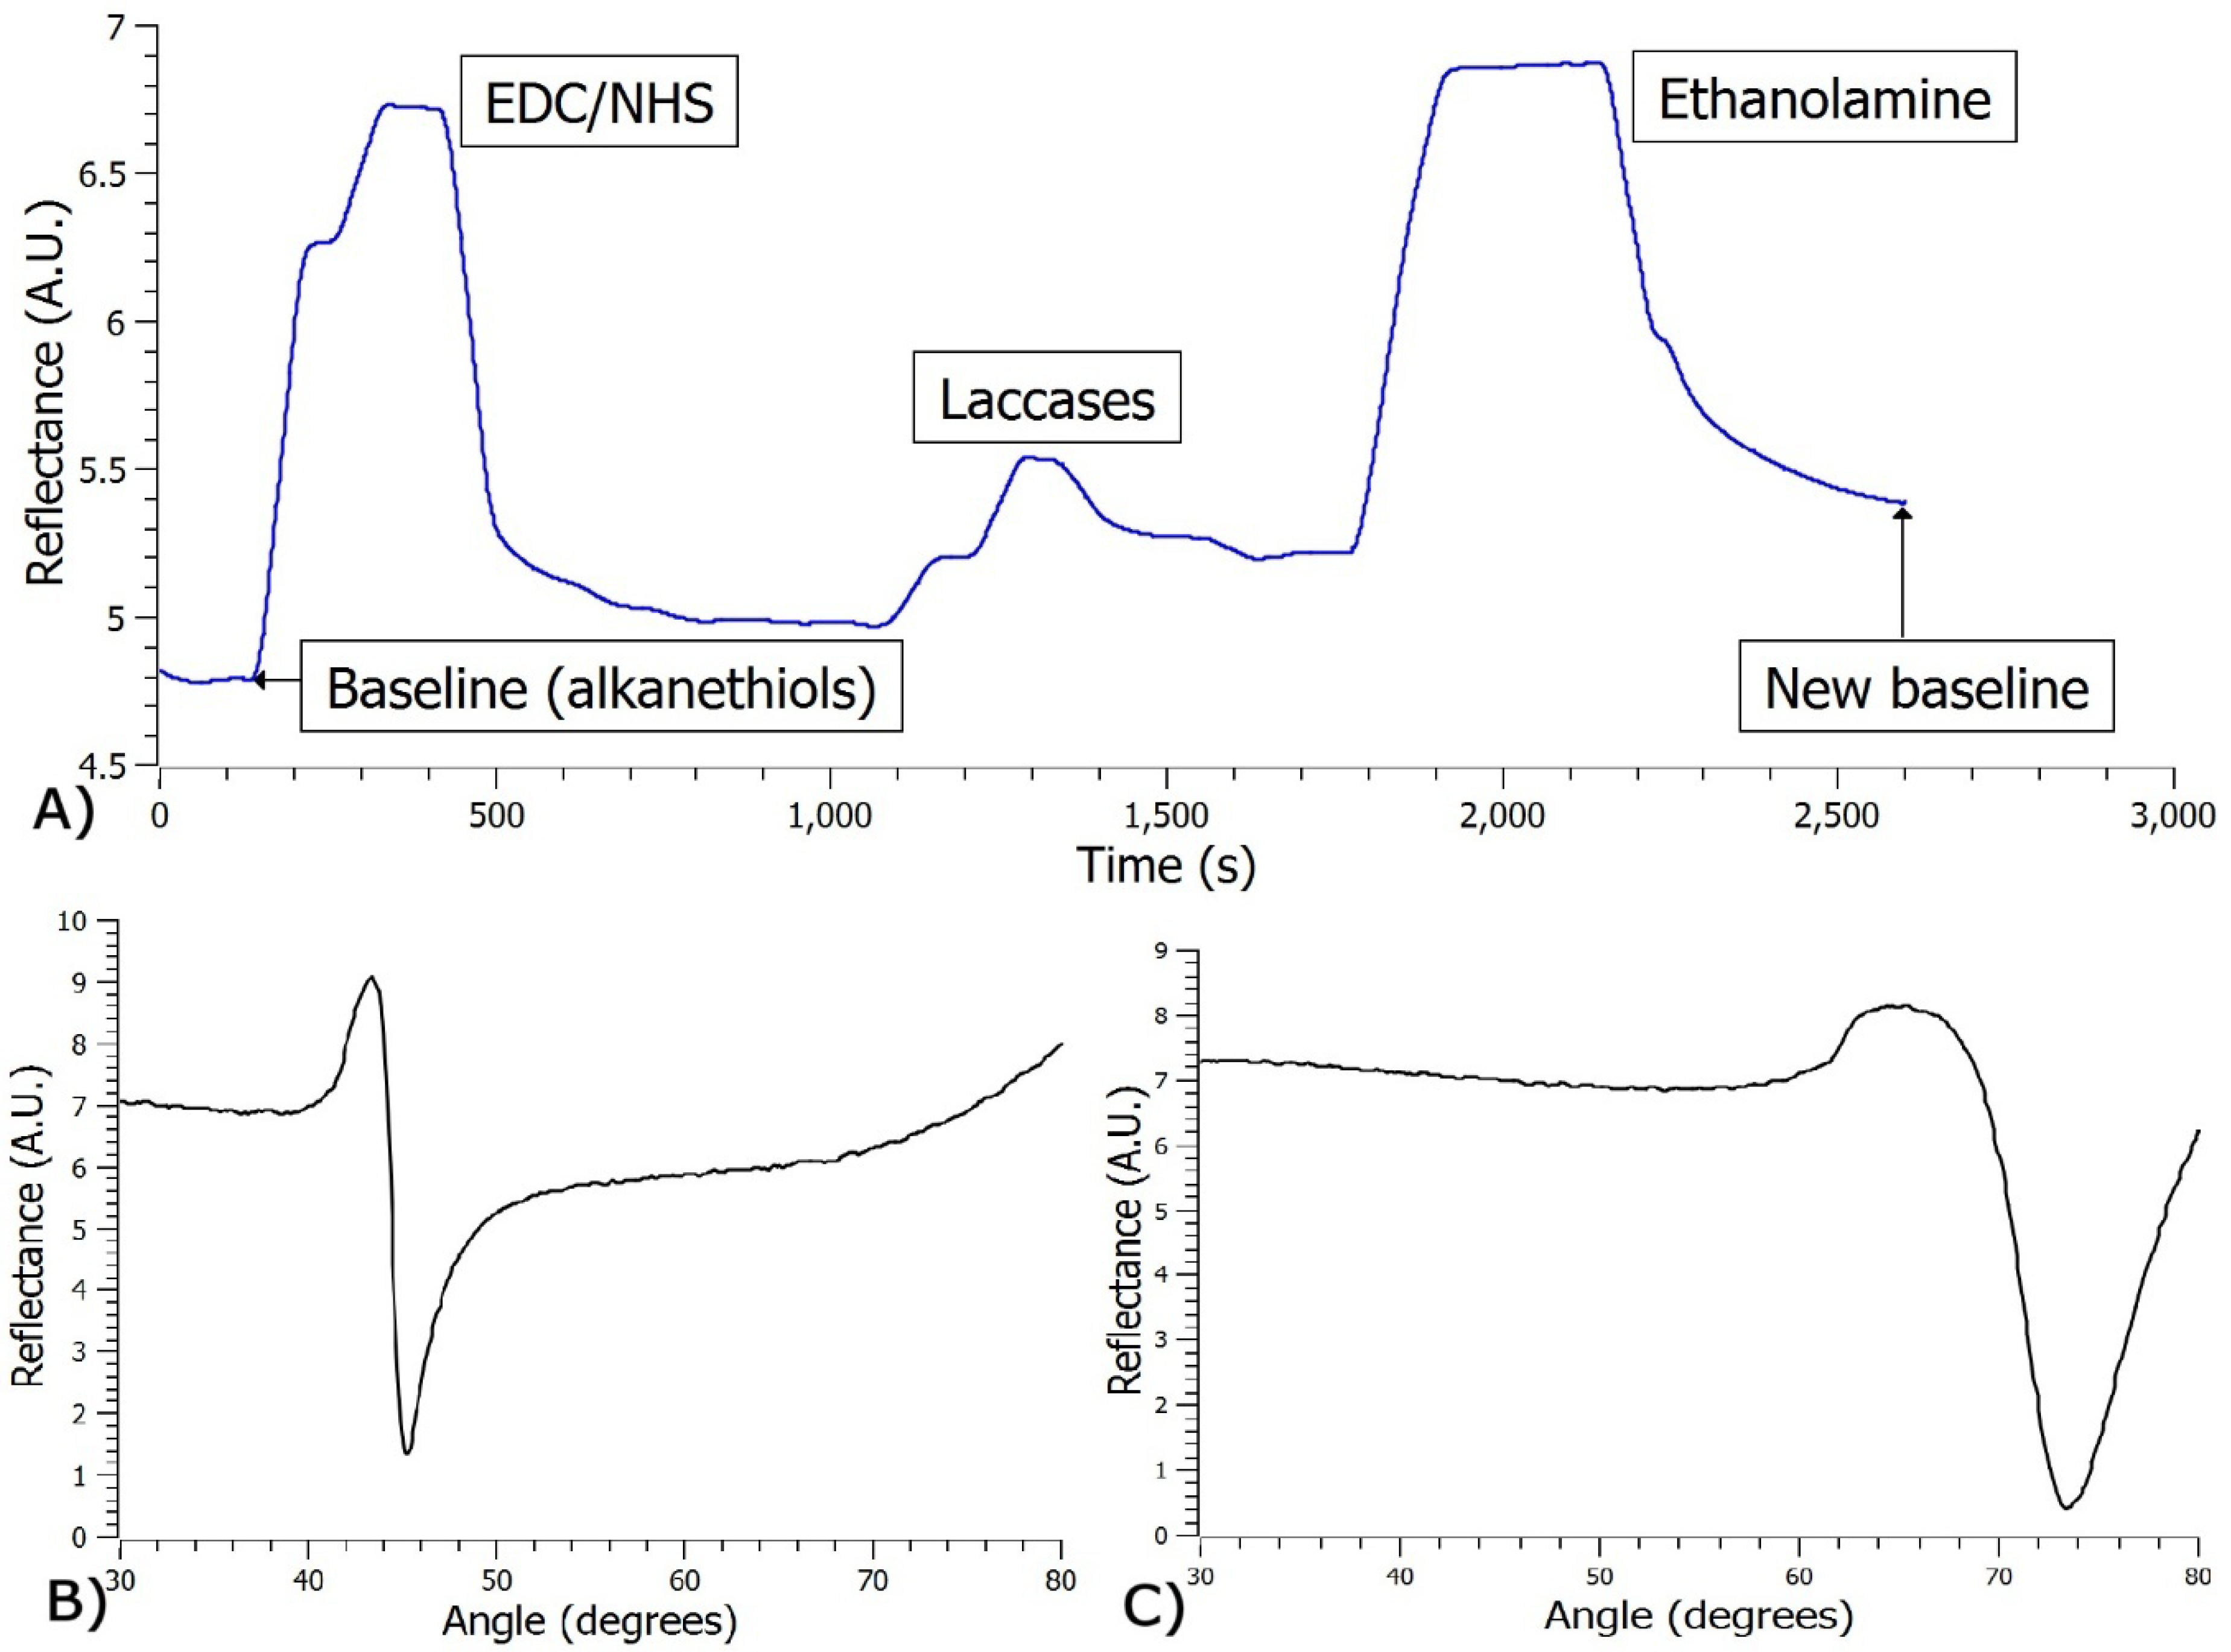
Figure 3.
FTIR analysis of the immobilization process.
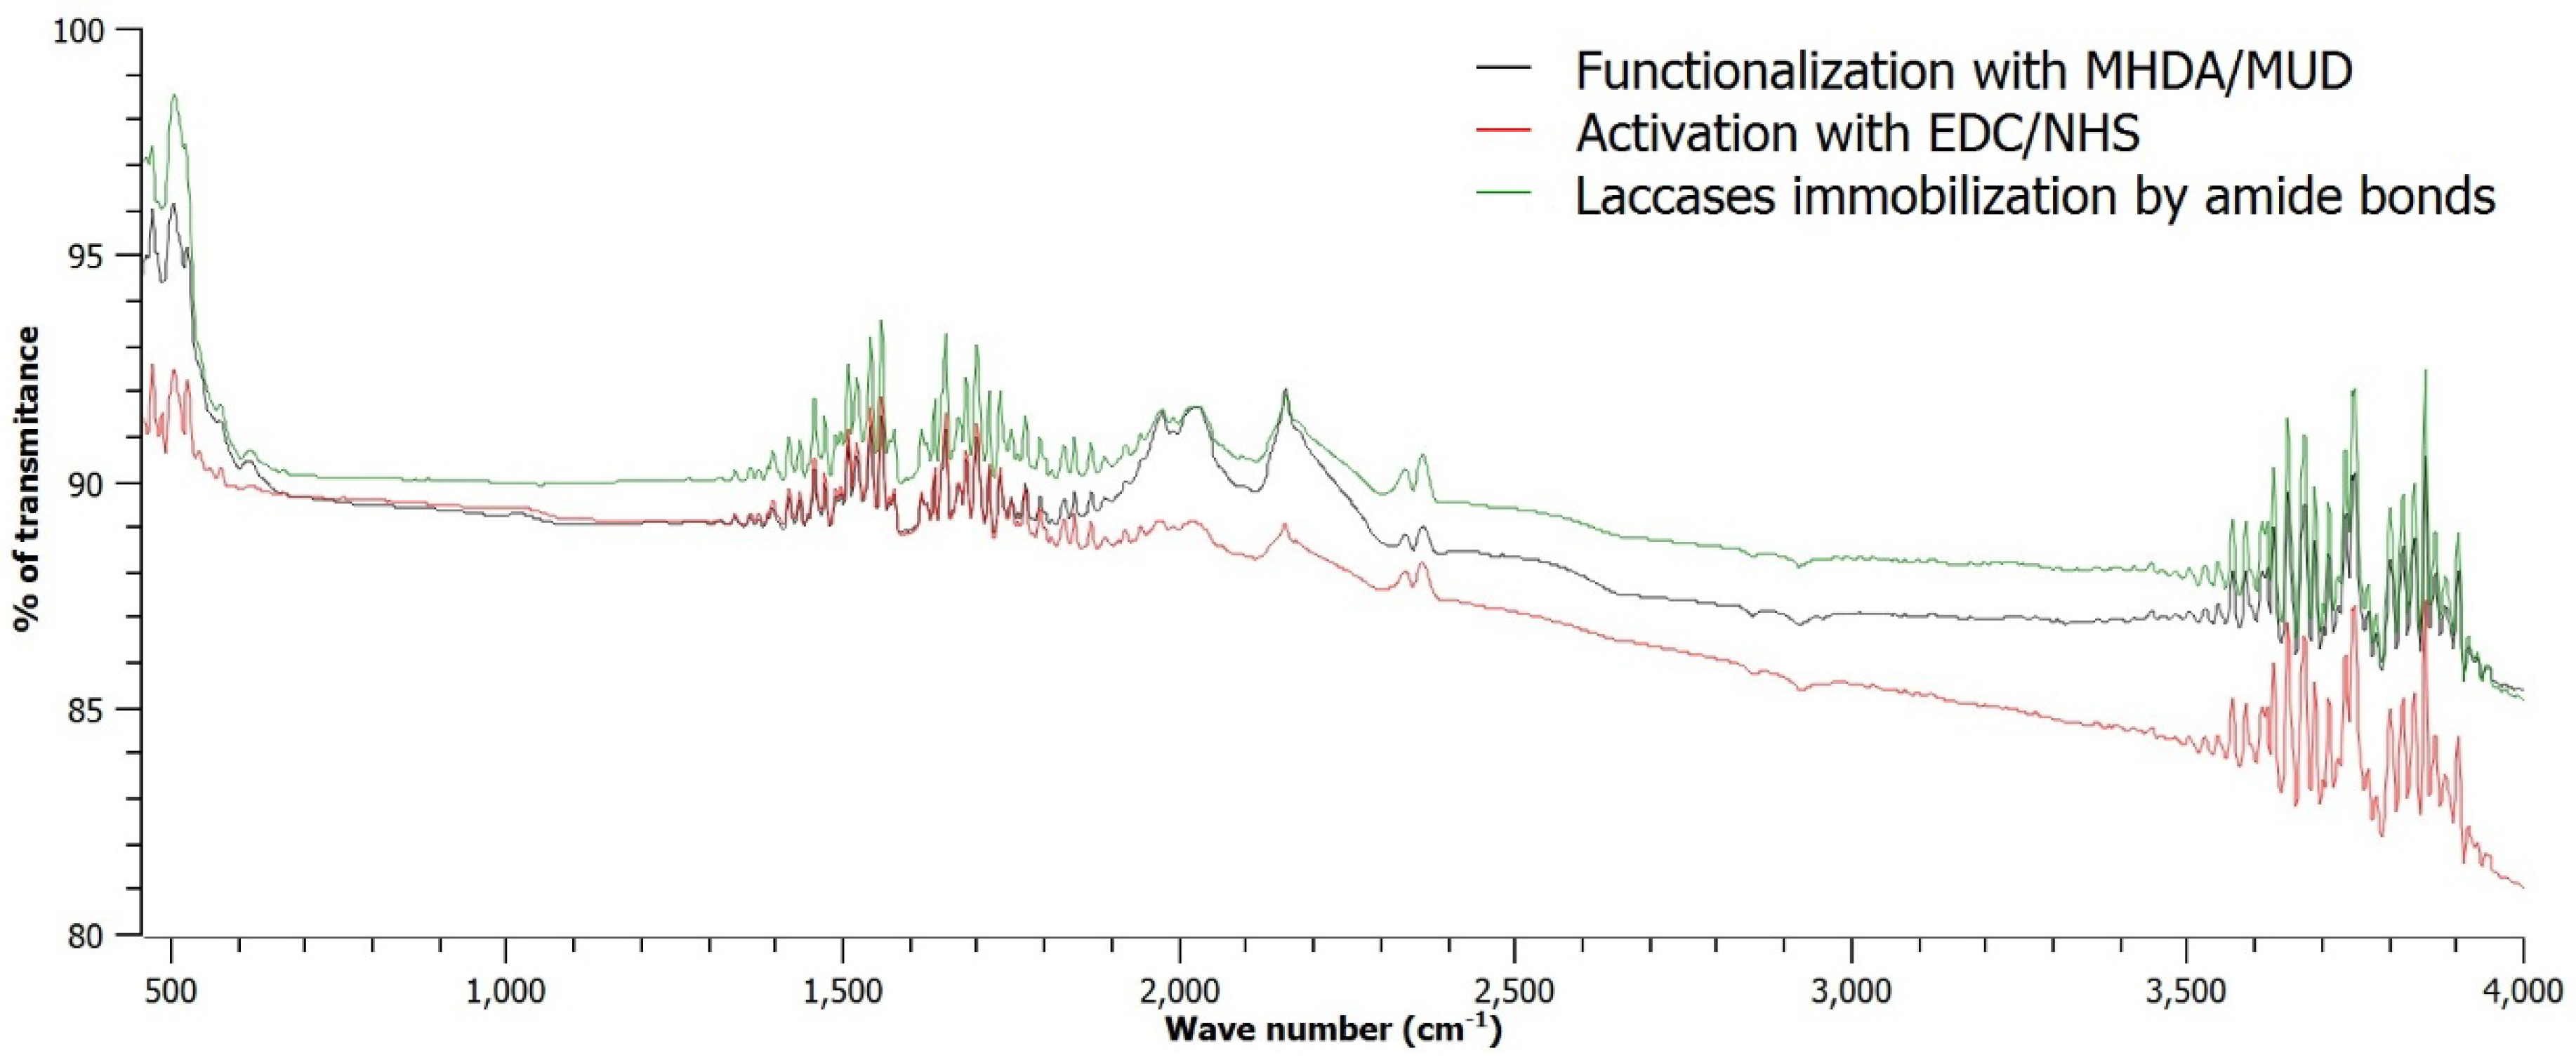
Figure 4.
A) Calibration curve by SPR. B) Spiked samples of tap water.
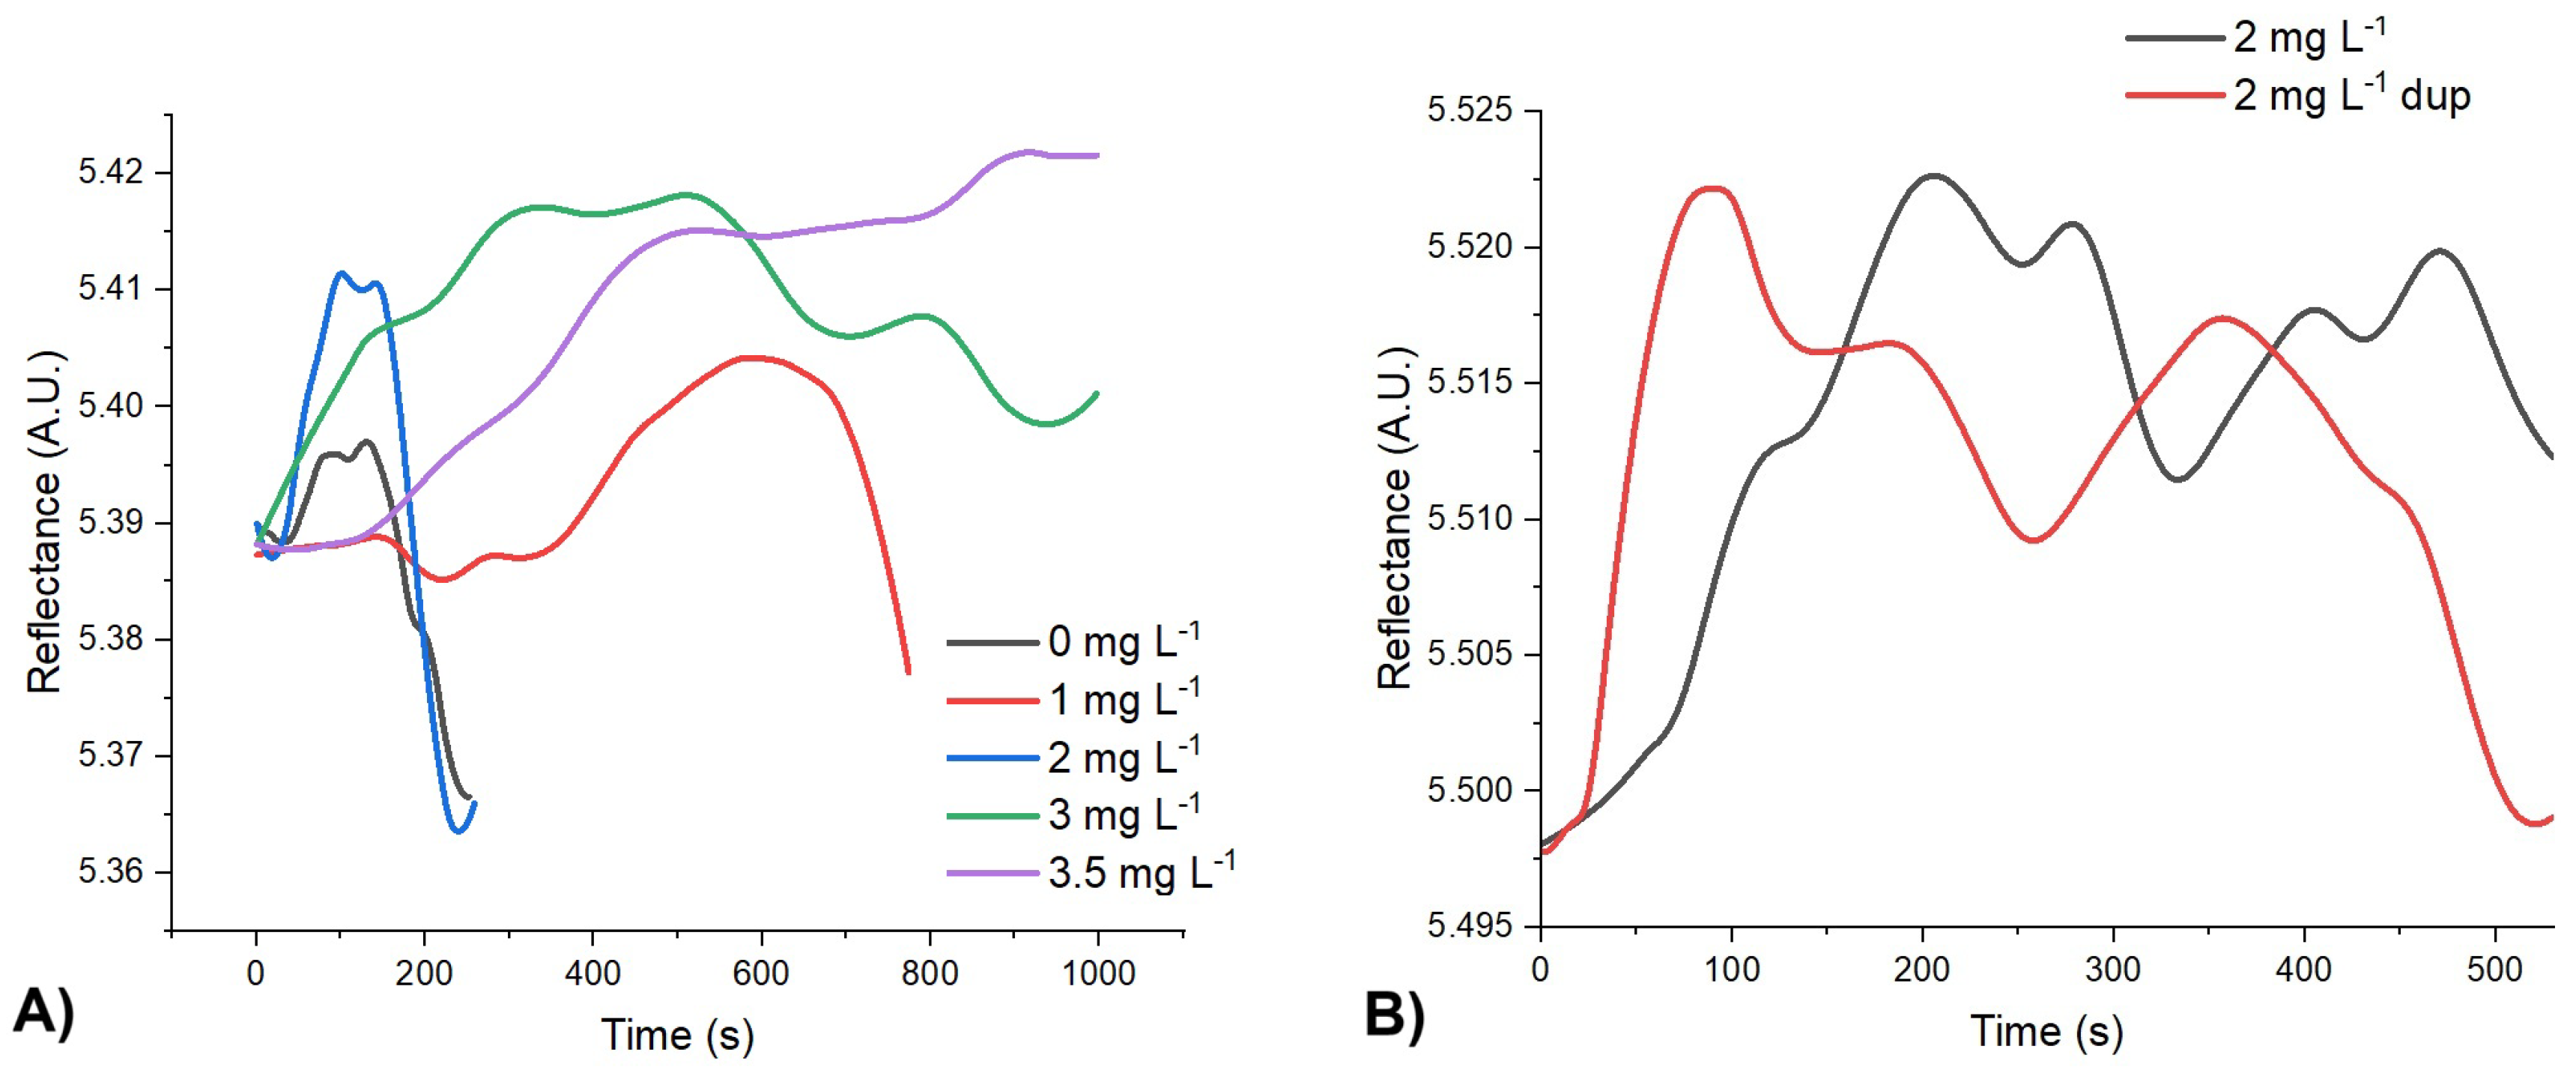
Figure 5.
Graphic of the calibration curve of Congo Red.
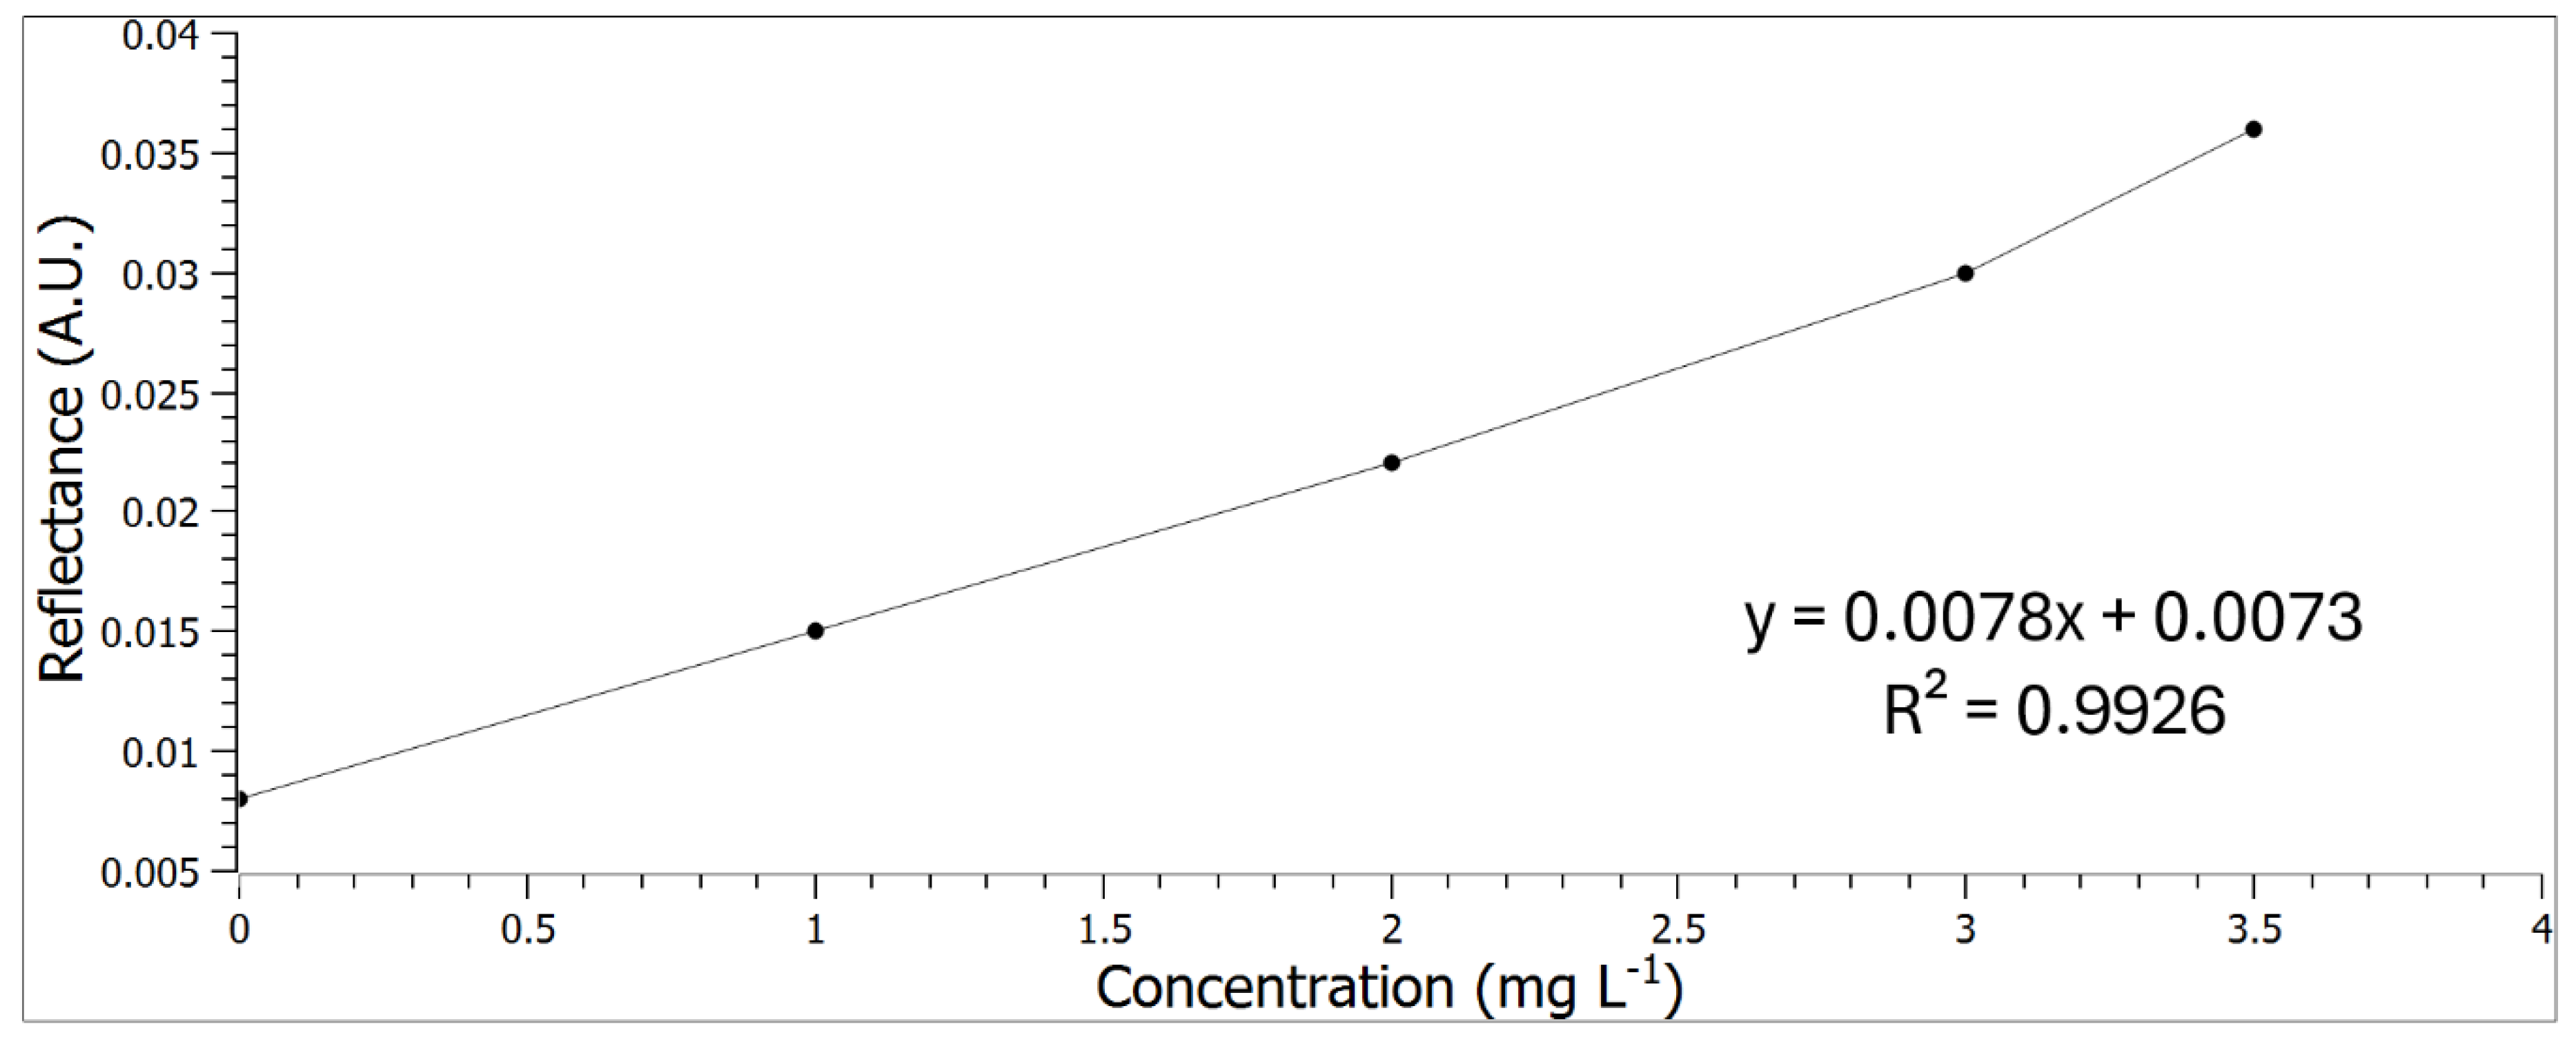

Table 1.
Physical and chemical characterization of the tap water samples.
| Parameter | Result | Parameter | Result |
|---|---|---|---|
| Total hardness | 25 mg L-1 | Total chloride | 0 mg L-1 |
| Free chloride | 0 mg L-1 | Fluoride | 0 mg L-1 |
| Iron | 0 mg L-1 | Cyanuric acid | 0 mg L-1 |
| Copper | 0 mg L-1 | Ammonia chloride | 0 mg L-1 |
| Lead | 0 mg L-1 | Bromine | 0 mg L-1 |
| Nitrate | 25 mg L-1 | Total alkalinity | 40 mg L-1 |
| Nitrite | 0 mg L-1 | Carbonate | 240 mg L-1 |
| MPS | 0 mg L-1 | pH | 7.6 |
Table 2.
Relevant analytical parameters of the method.
| Analytical parameter | Value |
|---|---|
| Equation of the line | y = 0.0078x + 0.0073 |
| R2 | 0.9926 |
| LOD | 0.008 mg L-1 |
| LOQ | 0.028 mg L-1 |
| % of recovery | 104.48%±10.41 |
| Working range | 0-3.5 mg L-1 |
Disclaimer/Publisher’s Note: The statements, opinions and data contained in all publications are solely those of the individual author(s) and contributor(s) and not of MDPI and/or the editor(s). MDPI and/or the editor(s) disclaim responsibility for any injury to people or property resulting from any ideas, methods, instructions or products referred to in the content. |
© 2025 by the authors. Licensee MDPI, Basel, Switzerland. This article is an open access article distributed under the terms and conditions of the Creative Commons Attribution (CC BY) license (http://creativecommons.org/licenses/by/4.0/).
Copyright: This open access article is published under a Creative Commons CC BY 4.0 license, which permit the free download, distribution, and reuse, provided that the author and preprint are cited in any reuse.


