
Submitted:
04 June 2025
Posted:
05 June 2025
You are already at the latest version
Abstract
Debit and credit card payments have become the most preferred method of transaction for consumers, replacing paper checks and cash. However, this shift has also led to an increase in concerns regarding identity theft and payment security. To address these challenges, it is crucial to develop an effective, secure, and reliable payment system. This master’s thesis presents a comprehensive study on payment card fraud detection using deep learning techniques. The introduction highlights the significance of a strong financial system supported by a quick and secure payment system. It emphasizes the need for advanced methods to detect fraudulent activities in card transactions. The proposed methodology focuses on the conversion of a comma-separated values (CSV) dataset into quick response (QR) code images, enabling the application of deep neural networks and transfer learning. The feature extraction process involves the use of a convolutional neural network, specifically a residual network architecture The results obtained through the over-sampling dataset balancing method revealed promising performance of precision, accuracy, recall and F1 score for the traditional models such as KNN, Decision tree, Random forest, Adaboost, Bagging and Gaussian Naive Bayes. Furthermore, the proposed deep neural network model achieved a good precision, indicating its effectiveness in detecting card fraud. The model also achieved high accuracy, recall, and F1 score, showcasing its superior performance compared to traditional machine learning models. In summary, this research contributes to the field of payment card fraud detection by leveraging deep learning techniques. The proposed methodology offers a sophisticated approach to detect fraudulent activities in card payment systems, addressing the growing concerns of identity theft and payment security. By deploying the trained model in an Android application, real-time fraud detection becomes possible, further enhancing the security of card transactions. The findings of this study provide insights and avenues for future advancements in the field of payment card fraud detection.
Keywords:
payment card
; credit card
; fraud detection
; QR code
; deep learning
1. Introduction
1.1. Context and Motivation
Consumers find debit and credit card payments to be more practical than paper checks, and merchants often accept them. Cards have successfully replaced cash as the major means of transaction, thereby making the concerns about identity theft and the security of payments grow rapidly [1]. The key element in developing a strong financial system, which will support economic activity, is an effective, quick, secure, and reliable payment system [2]. Three decades ago, the majority of customers usually visited their bank in person to get banking services like making deposits or checking balances. However, there has been a significant technological advancement in the last thirty years in how financial services are provided to customers. Many people today avoid physically visiting their bank or a bank teller for months or even years at a time as seen in [3]. The payment system utilized as the means of performing transactions in economic activity will occasionally develop along with the growth of technology and information. In order to make it easier for the community to conduct economic transactions, banks also produce non-cash money such as debit cards, credit cards and electronic money as mentioned in [4]. The modern financial system is characterized by a rapid pace of developments, both in terms of quantity and value [5]. Regardless of where company and franchise stores are located, many wholesalers and retailers worldwide now have access to customers in the large electronic sector through the development of the Internet and e-commerce [6]. The introduction of credit cards, debit cards, and automated teller machines are the most significant technological advancements that have contributed to this change [3]. These days, using credit and debit cards is commonplace, even in developing countries. People utilize it for online transactions, bill payments, and shopping. However, as the number of credit card users increased, so too have the incidences of card deception [7]. An annual loss of billions of dollars results from credit card fraud [8]. From the 10th online CyberSource’s annual fraud report, while the actual amount lost has increased as a result of an increase in online sales, the percentage loss of revenues has remained constant at 1.4% of online payments for the years 2006 to 2008 [9]. Card fraud also has wider repercussions because it supports international drug trafficking, organized crime, and terrorism [10].
The moral complexity of fraudulent activities as well as the ethics of banking have garnered a lot of attention recently. Fraud, which is defined as gaining products, services, or money through unethical ways, is an issue that is getting worse [11] around the world today. Fraud involves situations when criminal intentions are involved, which are typically obscure. Fraud detection also involves keeping an eye on how users and customers spend their money in order to identify, spot, or prevent unfavorable behavior [12]. Fraud can happen with any sort of card instrument; credit cards are only one of the most well-known targets for it. Additionally, as technology has evolved and altered over the past few decades, fraud has taken on a very different appearance. Though, before the evolution of online transactions and e-banking payments fraud has been in existence but the current state of information technology has led to a drastic increase in fraud-related transactions. However, urgent actions need to be taken to curb the ever-increasing damages caused by this detrimental action towards businesses, companies and individuals. Taking action to avoid fraud and dealing with it effectively when it does occur is a crucial duty for businesses and financial institutions, including banks [13]. In the past, so much research was performed in this field ranging from traditional to modern means. The traditional methods were able to detect fraud in banking transactions to some extent, however, they are not sustainable enough to be used since financial assets are the subject of discussion. Hence, the introduction of a more sophisticated means of detecting fraud in financial transactions is required. This led to thorough research on how to use computers to identify and curtail fraud in payment systems. Thus, the introduction of machine learning algorithms.
Machine learning aims to enable computers to learn without explicit programming [14]. For classification, identification, and segmentation tasks, Deep Learning, a subset of machine learning can be used to extract features, shapes, or hidden patterns from a dataset (including images). Deep Learning is better at addressing problems that we naturally, intuitively solve—issues like recognizing photos, spoken phrases, or text—that are simple for people to do but difficult to formalize [15]. Looking at the significant advancements made in computer vision algorithms over the last twenty to thirty years, some jobs involving complicated and high- level semantics are still difficult for machines to successfully complete. Machine learning is widely used to build statistical models from training data that has been manually annotated by humans in order to address such issues. Building machine learning algorithms that can handle sophisticated computer vision problems, as a result, has recently emerged as one of the largest difficulties in the field [16]. One of the most effective testbeds for artificial intelligence systems is spotting fraud in card transactions. Class imbalance, Concept drift and verification latency are a few of the pertinent issues that this problem raises [17]. However, we would be making use of deep learning (Artificial Neural Network) techniques to detect fraudulent activities in card payment systems, and also deploy it on an Android operating system.
1.2. Key Contribution
A large amount of research on card payment systems is done by using a modern technique, majorly a shallow machine learning method. In this shallow machine learning technique where humans explicitly perform the feature engineering operation which is based on instinct and also prone to errors. In [18] it was clearly stated no algorithm can replace the information gain provided by properly engineered features. However, deep learning does not require a feature engineering process because the important features are automatically detected by artificial neural networks. Hence, In this work, the generally available dataset for credit card detection, comma-separated values (CSV) would be transformed to a quick response code format which will enable us to apply deep neural network training on the dataset in other to improve the performance of the existing models in the field of card payment detection and consequently deploy our model on an android application.
Considering the unavailability of balanced datasets in the detection of various kinds of fraudulent activity in the card payment system, the class of interest is significantly underrepresented compared to the other class. Due to this, binary classifiers are substantially less effective and the results are unintentionally biased in favor of the dominant class when what we are interested in is the minority class. However, the class distribution with a considerably low number of samples would be over-sampled using an appropriate technique.
Also, the over-sampling technique would be performed on the CSV datasets just before transforming them into images and also a different technique known as image augmentation of the transformed images would be done as well. This is done to determine the most effective method between the two techniques for class balancing.
1.3. Structure of This Paper
The five chapters that make up this study report. The context and motivation of this study are provided in Chapter 1. It provides an overview of the issue under study and highlights its significance and applicability. This chapter also provides the scope, significance, explanation of the problem, and aim and objectives of the study. The technical and academic literature of earlier research endeavors is critically examined, and the current research activity is assessed in relation to the earlier works, as discussed in Chapter 2. The approach or methodology is the main topic of Chapter 3, while the analysis and result discussion are the main topics of Chapter 4. In chapter five, the conclusion and suggestions for additional work are explained.
2. Literature Review
This chapter provides a brief overview of the relevant Work in order to frame our own work. Section 2.1 presents and outlines card fraud detection, and Section 2.2 discusses older and recent techniques for detecting card fraud. Along with outlining our contributions to each subject, we also talk about the shortcomings of present methodologies.
2.1. Card Payment System
New financial needs that have arisen as a result of e-commerce are frequently incompatible with the effectiveness of conventional payment systems. As a result, almost everyone is interested in investigating the different kinds of electronic payment systems as well as the problems related to them and the use of digital currency. Electronic payment systems can be broadly divided into four groups: Smart Cards-based Electronic Payment Systems, Online Credit Card Payment Systems, Online Electronic Cash Systems, and Electronic Check Systems [19]. The payment card market includes millions of individuals who find it valuable to use a payment card, thousands of banks participating in various networks, and over a million retailers who value the ability to take those cards. The first successful general-purpose payment cards were created in the late 1950s, and after the late 1960s, their use rapidly increased [20,21]. Payment cards have two key characteristics that set them apart. They first display network externalities, where more merchants accepting payment cards increase their value to consumers. Second, millions of cardholders and millions of businesses that take cards are served by thousands of banks and other businesses, at least in the United States. Economic theory argues that some type of coordination is advantageous, maybe vital, in a setting with network externalities and thus many participants. In the US, a payment card network is typically formed to do this [22].
2.1.1. Credit Card
Credit cards have increasingly become a popular method for making and financing purchases, with the average credit card debt for households with balances reported to be over $9,0001. In addition, policymakers are concerned because household discretionary income has increased more quickly than credit card debt. Increasing credit card debt to fund consumption is typically viewed as a positive economic stimulus [23]. Comparing credit card accounts to other retail loans, like mortgages, lenders and investors have more alternatives to actively monitor and control credit card accounts because they are revolving credit lines. As a result, managing credit card portfolios offers financial institutions the opportunity for enormous revenue. Better risk management could result in annual savings for financial institutions of hundreds of millions of dollars [24].
2.1.2. Debit Card
Debit cards are plastic cards with a magnetic encoding that can be read by machines and resemble credit cards or cards used to access ATMs (ATMs). In fact, it is typical for ATM cards to perform the same functions as debit cards, allowing users to access ATMs as well as make purchases in stores. Online debit cards, offline debit cards, and prepaid debit cards are the three different transaction methods that fall under the umbrella term "debit card". The three different debit card kinds operate very differently and are not all available to users [25]. But, the majority of debit cards are online cards, which means that when a customer uses the card to make a transaction, money is immediately taken out of the customer’s deposit account.
2.2. Financial Fraud SYSTEM
Financial fraud is a complicated phenomenon that can take many various forms. This form depends on the attributed financial tools, the participants involved and the market segment in which it occurs. Financial fraud is made more likely by a number of factors such as the emergence of perverse incentive structures and fundamental conflicts of interest in the financial industry; the technological, legal, and financial innovation that give rise to financial market transactions with high complexity; the influx of gullible, uneducated participants in the financial market; and a rise in the use of legal secrecy, including the creation of more off- balance-sheet structures and shell firms in countries with tight confidentiality laws governing banking and legal services [25]
There are three (3) types of fraud as listed in [11] which are: bankruptcy, application and theft/counterfeit.
2.2.1. Bankruptcy Fraud
Credit cards are used by buyers in bankruptcy fraud even if they are aware they won’t be able to pay for their purchases. They’ll receive a payment request from the bank. However, the clients will be acknowledged as having declared bankruptcy and being unable to repay their bills. The losses must be paid for by the bank. This kind of fraud loss is typically not because it is regarded as a charge-off loss, it is taken into account for determining the fraud loss provision [11]. The only method to stop this type of fraud is to conduct a background check with credit bureaus to learn more about the consumers’ financial histories.
2.2.2. Application Fraud
In the financial sector, application fraud is a type of fraud that involves getting different financial products by deception, malevolent behavior, and the use of fake or artificial IDs. Identity fraud incidents are at record highs globally, and this trend is not anticipated to change very soon. Large-scale data breaches, the development of online shopping and related activities, the skill of fraudsters, and a general lack of public understanding about how to protect their identities are just a few of the causes contributing to this rise [26].
2.2.3. Theft/Counterfeit Fraud
Using a card that is not yours is considered theft fraud. The offender will use the victim’s card as frequently as they can before it is blocked. The bank will act to stop the use of the card more quickly. The sooner the owner responds and contacts the bank. Similarly, remote credit card use results in counterfeit fraud; all that is required are the credit card numbers.
2.3. Machine Learning
AI, usually referred to as artificial intelligence, is the emulation of human intelligence functions by machines, particularly computer systems [27]. AI makes an effort to imitate the cognitive and perceptual processes of the human brain. A branch of artificial intelligence called machine learning (ML) enables computers to learn from a set of facts and subsequently make insightful predictions. Machine learning can be defined into two major categories which are supervised and unsupervised learning [28].
In supervised learning, a computer system or machine is trained using data that has already been labelled to predict an intended result in order to solve classification and regression issues [28] i.e. both the inputs and the desired outputs are shown to the system. Learning a general rule that maps inputs to outputs was the purpose of supervised learning [29]. Unsupervised learning involves giving a machine input data that is not explicitly labelled, allowing the system to identify structures and patterns among the collection of objects without human intervention [28]. Decision Trees, naive Bayes algorithms, random forests, support vector machines (SVM), and K-Nearest Neighbor are examples of traditional machine learning (ML) techniques.
A branch of computing algorithms called machine learning aims to replicate human intelligence by learning from the environment. In the brand-new era of "big data", they are regarded as the workhorse. Various fields, including pattern recognition, computer vision, spacecraft engineering, finance, entertainment, and computational biology, as well as biological and medical applications, have effectively used machine learning techniques [30]. The following provides a detailed overview of the ML techniques used for identifying financial fraud:
2.3.1. Fuzzy-Logic
An efficient conceptual framework for dealing with the problem of describing the data in an uncertain and ambiguous environment is fuzzy logic (FL). It is a form of logic that demonstrates how thinking processes are estimated rather than accurate. The Fuzzy combinations provide useful ideas for managing complex modelling in a novel and improved manner [31].
2.3.2. K-Nearest Neighbors
The K-nearest neighbors (KNN) algorithm is a practical, uncomplicated supervised ML approach that is effective in tackling both classification and regression operations. By considering a limited number of the closest samples, the KNN model typically determines the class label. The KNN model is a kind of non- parametric model used for both classification and regression tasks, and it can find comparable neighborhoods in a dataset that are closest to a given sample point and construct a new sample point depending on the distance between two samples of data [32].
2.3.3. Hidden Markov Model
A formal framework for creating probabilistic models of problems involving the ”labelling” of linear sequences is provided by hidden Markov models (HMMs). They offer a conceptual toolkit for creating intricate models just by creating an understandable image. Dual-embedded random methods, such as the HMM, are frequently employed to outperform the conventional Markov model in handling more complicated random processes.
2.3.4. Support Vector Machine
SVM is a supervised ML technique that searches for the maximum hyperplane margin from datasets which is divided into two different categories. Based on a labelled training set for each class, SVM is capable of identifying fresh data points [33].
2.4. Deep Learning
Deep Learning (DL) is a subset of machine learning. DL uses multiple-layer artificial neural networks, which enable it to learn from enormous amounts of data, to effectively replicate how the human brain functions. The sort of data it uses and the way it learns it set DL apart from typical machine learning. Some pre-processing that is typically carried out in ML is eliminated by DL. Without the need for human specialists, DL can ingest, process, and automatically extract characteristics from unstructured input like photos and text [34]. DL can decide which characteristics are most crucial to distinguish for classification or prediction.
Deep learning enables multiple processing layers of computer models to learn representations of data at several levels of abstraction. In many other fields, including drug discovery and genomics, these techniques have significantly advanced the state-of-the-art in speech recognition, visual object recognition, object detection, and other areas [35]. The deep neural network’s significance lies in the fact that it paved the way for the intricate non-linear model and methodical technique for hierarchical knowledge processing [36].
2.4.1. Neural Network
Deep learning techniques are based on neural networks, often referred to as artificial neural networks (ANN) [37], which are a subset of machine learning. They took their name, organizational structure, and paradigms from the way the human brain imitates the communication between organic neurons. The neural network approach’s initial objective was to develop a computing system that could handle issues similar to a human brain. However, as time went on, research veered away from a purely biological approach and toward employing neural networks to fit particular tasks. Since then, neural networks have supported a wide range of specialized activities, such as image analysis, speech pattern recognition, language translation, email spam filtering, video game play, and medical diagnosis [38]. Node layers, which include an input layer, one or more hidden layers, and an output layer, make up Artificial Neural Networks (ANNs). Each node, or artificial neuron, is connected to others and has a weight and threshold that go along with it. Any node whose output exceeds the defined threshold value is activated and starts delivering data to the network layer. Otherwise, no data is transmitted to the network’s next tier [37]. A neural network is trained by giving it a set of input data known as a training set, much as how humans learn through examples [39].
An individual node in an artificial neural network may be linked to a large number of nodes in the layer below it from which it receives input and a number of nodes in the layer above it from which it transmits data. A numerical value known as weights is typically applied to each incoming connection. These weights are used to assess each variable’s significance, with larger weights having a greater impact on the result than smaller ones [37]. When the network is active, the nodes receive data with features that are each represented by a different number and multiply that data by the weights that go along with those features. Then, it adds the outcomes (in each connection) to produce a single value [27].
We can use the following formula to describe this activity:
n stands for the number of input nodes, w for weights, x for features, and b, also known as bias or threshold, is used.
An activation function is a mathematical operation that receives the value obtained from the summation. When a value exceeds a threshold value, the node "fires", sending the value to the next layer of the neural network. If the value is below the threshold value, the node does not communicate any data to the next layer. This indicates that the input of one node serves as the output of the following node. The sigmoid function and the Rectified Linear Activation (ReLu) are two of the most popular activation functions that can be employed in neural networks. The Sigmoid Function is shown below:
where e, also known as Euler’s number, is a mathematical constant and output of the sum on each node. ReLu is a simple function that is given as:
which basically implies that if the input value—a negative number—is less than 0, it returns 0; otherwise, it returns 1.
Up until it reaches the final output layer, the values of the levels it passes through and the succeeding layers are then summed together. Weights and thresholds are continuously changed during training until outputs produced by training data with the same labels are consistently identical [37]. In order to make this modification, the neural network tree is traversed once more, but this time from the back, i.e., the outputs. Backpropagation is used to make further weight adjustments, after which the neural network tree is traversed once more and the output is computed once more. To get a result that is as near to the output of the training data fed into the neural network tree, this is done as often as possible.
An evaluation method known as a cost or loss function is used to gauge the accuracy as the neural network is trained [41]. This determines how closely the neural network’s output values and the training’s actual results line up. To best represent the proximity, this value should be as low as it can be. The mean square error (MSE), which is provided by:
Where the projected result or value from the neural network and y the actual value, and m is the number of samples. The figure below displays the loss as a function of weight. Artificial neural networks can be divided into various types, each of which serves a different function. The Multilayer Perceptron, Convolutional Neural Networks, and Recurrent Neural Networks are popular examples of artificial neural networks
Convolutional Neural Network
Convolutional Neural Network (CNN) is a well-known deep learning architecture that was influenced by how living things naturally perceive their environment [43]. They are meant to automatically and adaptively learn spatial feature hierarchies by backpropagation using a variety of building blocks, such as pooling, convolution, and fully connected layers [44]. Convolution Neural Networks are a type of neural network that is effective for handling media data. With regard to image, speech, or audio data inputs, they brag about exceptional performance.
Reducing the parameters in a conventional ANN is the most advantageous feature of CNNs [45]. CNNs feature one or more convolutional layers and use a variant of multilayer perceptions. These layers may be combined or entirely integrated [46]. Convolutional networks have multiple layers, the first of which is the convolutional layer, which may be followed by additional convolutional layers or pooling layers. The ultimate layer is one that is completely connected [47]. The complexity of the CNN layer rises with each additional layer, allowing it to recognize more details in the inputted data, such as more pixels in an image. The CNN recognizes larger features or shapes as the visual data passes through each layer, eventually identifying the required shapes and dimensions [47].
The Convolutional layer is the fundamental component of a CNN and is where the majority of computations take place [49]. A feature map, a filter, and input data are needed for this. Convolution is a method for examining each pixel in an image’s receptive field to determine whether a feature is there. Input is scanned by the filters according to its dimensions [50]. Filter size F and stride S are some of its parameters. A feature map or activation map is the name of the final output or Output O. The Pooling layer performs a dimensional reduction, which lowers the number of input parameters. With the exception of the filter not having any weight, the pooling layer applies a filter to the entire input. Instead, the kernel fills the output array with values from the receptive field using an aggregation function [49]. The Max Pooling and Average Pooling are the two primary types of pooling [51]. While the Average Pooling determines the average value within the receptive field and sends those pixels to the output array, the Max Pooling chooses the pixel with the maximum value to transmit there. The Fully-Connected Layer connects neurons in a manner akin to that of a conventional neural network [45]. Each node has a connection to a node in the layer below. Based on the features that were retrieved from the preceding layers and their various filters, this layer conducts the classification operation. Fully-Connected layers typically utilize a SoftMax activation function [52] to classify inputs appropriately, producing a probability ranging from 0 to 1 [49]. Convolutional and pooling layers frequently use ReLu functions.
2.5. Related Work
In [53] it was pointed out that Real-world data mining jobs are faced with three major problems which are very large datasets with skewed class distributions and non-uniform cost per error. To solve these three problems, a multi-classifier meta-learning strategy was developed. Using a case study of the identification of credit card fraud, the empirical findings show that the method can dramatically lower loss brought on by fraudulent transactions. In conclusion, the study shows that the distribution of training classes has an impact on how well learnt classifiers function and that the natural distribution may differ from the ideal training distribution for performance maximization. Furthermore, the amount of damage brought on by fraudulent transactions can be greatly decreased by employing the multi-classifier meta-learning approach with four-balanced distribution of the training data subsets.
In [54], a theory for a Hidden Markov Model (HMM) to identify fraud in credit card transaction processing was proposed. An HMM was initially trained using a cardholder’s typical behavior. An incoming credit card transaction is deemed fraudulent if the trained HMM does not accept it with a high enough probability. Using an improvement to it, they simultaneously work to prevent the rejection of real transactions (Hybrid model). In conclusion, various fraud detection techniques were compared and why HMM is more effective than competing techniques was also demonstrated.
In [55], the capability of neural networks was applied in the area of credit card fraud detection. First, the backpropagation techniques (BPNs) were used for training, and then genetic algorithms were applied to select the parameters (network type, weight, number of nodes, number of layers etc.) that are crucial for performing neural networks as accurately as possible. Using the Genetic Algorithm and Neural Network (GANN), an attempt to successfully identify credit card fraud was made.
In [56], a hybrid model was proposed to determine credit card transaction fraud. The anomaly degree is provided by the fuzzy expert system, which explains how the new transaction differs from the past pattern of merchant transactions. The Fogg behavioral analysis method is used to determine the fraud tendency weight. As a result, this model is known as FUZZGY. The fuzzy expert system employs fuzzy rules that efficiently make use of previous business operations. Therefore, the motive and ability to commit fraud elements of the Fogg behavioral model are employed to describe the conduct of the merchant. This model calculates a weight for each merchant’s likelihood of fraud. The FUZZGY model calculates the suspiciousness level of incoming transactions in the end. The FUZZGY was successfully tested in a case study involving lottery fraud.
In [57], a genetic algorithm was used to identify fraudulent transactions here. It was presented that, in designing a neural network to solve the problem in the field of machine learning, genetic algorithms can be used to decide the network architecture, number of hidden layers, and number of nodes that would be used. The major objective of genetic algorithms, which are evolutionary in nature, is to find better solutions for stopping credit card theft technically. With the help of this algorithm, it was claimed that the safest payment system possible, is one that can determine whether a transaction is legitimate or not.
In [58], in this study, it presented a novel method for identifying credit card fraud that involves three stages of fraud detection. The first user authentication and card information verification is done in the first phase. The transaction moves on to the next stage, where the fuzzy cmeans clustering method is used to determine the typical credit card customer usage patterns based on historical behavior. According to how much the regular patterns have deviated, a suspicion score is determined, and it is then classed as valid, suspicious, or fraudulent. Once a transaction is flagged as suspicious, a neural network-based learning mechanism is used to ascertain if the activity in question was indeed fraud or only a rare error made by a genuine user. Extensive stochastic model testing demonstrates that the successful detection of fraudulent activity while decreasing the occurrence of false alarms is made possible by combining the clustering technique with learning.
In [59], the authors provided some answers by concentrating on important issues, such as how to deal with unbalanced and evolving data streams, how to assess performances in a way that is relevant for detection, how to use feedback provided by investigators on the fraud alerts generated, and why and how under-sampling is helpful in the presence of class imbalance. A race algorithm to quickly choose the optimal sampling method when there are several possible answers, when concept drift is present, combining two classifiers—one trained on feedback and the other on delayed samples—often results in the most accurate alerts. However, a model for a fraud detection system that can function in real-world settings and include feedback from investigators to produce precise alarms was developed and evaluated.
In [60], the research foundation of this study is based on the difference between fraudulent and legitimate transaction patterns. Here, a classification algorithm (CHAID and k-NN) was applied to identify and distinguish the abnormal pattern. The key factors driving the use of CHAID and k-NN classification methods include non-stationary distribution of the data, continuous streams of transactions, unbalanced class distributions and decreased dataset availability for study. The accuracy of the k-NN model (for k=3) is 0.7 and F = 0.6 and the accuracy of the CHAID model is 0.8 and F = 0.7, according to empirical results utilizing actual debit card transactions using ATM services. These outcomes are comparable to earlier research that employed Hidden Markov Models.
In [61], the issue of fraud detection for internet businesses was addressed. The research objective was to create, refine, and deploy a risk score system using data mining techniques at an online retailer. However, a couple of machine learning models were used to carry out this research while good results were obtained using regression, SVMs, and random forests. The best performance was achieved by Random Forests. In addition to its strong performance, this algorithm appears to be ideal for use in fraud detection due to its simple implementation and time complexity even with huge datasets. It was concluded that the performance of employing a balanced set of observations (under-sampling valid records) was comparable to using the much larger unbalanced complete set of records.
In [62], The study suggests a feature set that captures the user’s social interaction habits, such as the number of friends, followers, and reviews the person has supplied that have been useful in spotting fraud. Instead of detecting fraud, the issue at hand is one of the traits that contribute to it. The proposed feature set is evaluated using a neural network technique, and it is compared to the most advanced feature sets for identifying fraud. To assess whether a user is engaging in fraud, the feature set takes into account the person’s social interactions on the Yelp site. With a value of 0.95, the F1 score produced by neural networks is on par with all other widely used techniques for fraud detection.
In [63], the numerous types of fraud that banks are subjected to and the data mining technologies that enable their early detection from bank data were examined. To create models of typical and anomalous consumer behavior, supervised learning techniques called Support Vector Machines with Spark (SVM- S) was built. This model was utilized to assess the legitimacy of new transactions. The outcome of using databases of credit card transactions demonstrates the effectiveness of these methods in preventing banking fraud in big data. The study’s experimental findings demonstrate that SVM-S have superior prediction ability to Back Propagation Networks (BPN).
In [64], it was argued that Prior methods of automating fraud detection rely on learnt models or a priori criteria specific to the consumer which typically do not take into account fraud sequences or shifting behavior, which can result in false alerts. However, this study illustrates the dynamic creation and updating of a transaction model as well as the automatic fraud detection for prepaid cards. The method automatically builds, compares, and updates merchant terminals using hidden Markov models (HMM). For fraud detection trials, the efficiency and effectiveness of the methodology using real transactional data were demonstrated. The approach has a strong F-score in the fraud test cases, which were created from real fraud situations. Since a contemporary transaction processing system processes card transactions, their approach can identify fraud for retailers in real-time.
In [65], the study introduces 14 distinct strategies for combining data mining techniques to successfully achieve high fraud coverage with a high or low false rate. We also discuss the benefits and drawbacks of each technique, as well as the data sets that were used in the researchers’ studies. Neural Network, Decision Tree, Genetic Algorithm, Case Based Reasoning, Bayesian Network, Support Vector Machine, K-nearest neighbor and Artificial Immune System, Hidden Markov Model, fuzzy neural network and fuzzy Darwinian system, Inductive Logic Programming, Clustering Techniques, Logistic Regression, and Outlier Detection are some of the techniques mentioned above.
In [66], highlighted the effect of oversampling the minority class from the fraud detection dataset and how it has been used as a solution to this issue, although it still has significant flaws. However, this led to the proposition of a general, adaptable, and potent generative deep learning model called Generative Adversarial Networks. To increase the efficacy of a classifier, GAN was used to produce imitation minority class samples, which were then combined with training data into an augmented training set. Their Studies reveal that a classifier trained on the augmented set outperforms a classifier trained on the original data, particularly when it comes to sensitivity, leading to a reliable fraud detection system.
In [67], a method was outlined, using a neural network model to find illegal transactions. Nevertheless, due to confidentiality concerns, public data are hardly ever accessible. Resampling approaches were employed to address the unbalanced datasets. Using Matlab’s Neural network toolbox, a pattern recognition network that was trained using a scaled conjugate gradient backpropagation technique was created. With the help of Matlab’s Neural Network Toolbox, pattern recognition networks were created with input neurons, hidden layer and an output layer of 29, 13 and 2 neurons respectively. However, the obtained precision, accuracy, F1 score, Matthews correlation coefficient, and recall are 91.6%, 94.2%, 94.4%, 88.62%, 97.3% respectively.
In [68], treatment of payment as interleaved sequence and adoption of expensive features by using a recurrent neural network as used in the previous works were avoided. However, an effective ML pipeline from preprocessing to deployment together with a comprehensive RNN framework to identify fraud in real-time was presented in this study. How these multi-sequence, feature-free RNNs beat cutting-edge models, reducing computing costs and saving millions of dollars in fraud detection were also demonstrated. The experiments was conducted using datasets that were collected from two significant European financial institutions that handled card-present and card-not-present transactions. Due to privacy restrictions, the dataset used in this study wasn’t published. Each dataset received 10 training models. It was discovered that two stacked GRUs with the first and the second having 128 and 64 recurrent states each produced the best results for dataset A. Due to engineering considerations, one GRU with a recurrent state size of 64 units in dataset B was not utilized because the number of GRUs and state size was essentially immaterial as they claimed.
In [69], a method is proposed in order to improve classification accuracy and hasten detection convergence, this research suggests a semantically fused two-level artificial bee colony algorithm (ABC) and k-means model to detect credit card fraud from highly unbalanced datasets. In order to deal with the k- means classifier’s inability to identify the true cluster, ABC undertakes a kind of neighborhood search in addition to the global search as a second classification level. If the same data are inputted in a different sequence, it may return a different cluster. The suggested solution applies a built-in rule engine to filter the dataset’s features in order to determine if a transaction is legitimate or fraudulent based on a variety of consumer behavior (profile) parameters such as location, frequency of use, and book balance. According to the findings of the experiments, the suggested model can improve the classification accuracy against the risk provided by suspicious transactions and provides greater accuracy than conventional approaches.
In [70], an unbalanced dataset was utilized to test the applicability of various supervised machine learning models for predicting the likelihood of fraudulent transactions occurring. Sensitivity, time, and precision were used as the evaluation metrics. Since accuracy does not provide a clear conclusion and is not sensitive to unbalanced data, it was not employed in their study. However, Logistic Regression, Naive Bayes, kNN, Decision Tree, and Random Forest model were used to carry out their experiment.
In conclusion, Decision Tree was the preferred model on the basis of the time it took for testing.
In [71], actual transactions and publicly accessible records were used for the training of 13 machine learning and statistical models for credit card fraud detection. To determine if the combined characteristics generated by a genetic algorithm can provide a stronger discriminative capacity in fraud detection than the original features, a statistical hypothesis test is done. The results demonstrate that aggregated features can be successfully used to model real- world payment card fraud detection issues. However, the study can be improved by gathering additional real-world information from many regions around the world as their study only focused on Malaysia.
In [72], the major contribution is the creation of a fraud detection system which is based on homogeneity-oriented behavior analysis (HOBA) that makes use of a sophisticated feature engineering and deep learning architecture method. A comparison analysis based on a real-world dataset from one of the biggest commercial banks in China to evaluate the efficacy of the suggested framework was undertaken. The experimental results show that the suggested methodology is a practical and successful mechanism for detecting credit card fraud. It was claimed that the suggested method, with a tolerable false positive rate, can detect considerably more fraudulent transactions than the benchmark methods.
In [73], five distinct learning models— autoencoder, logistic regression, k-nearest neighbors, decision tree, and random forest —are proposed and contrasted. The outcomes demonstrate that the two best algorithms are random forest and logistic regression. Feature reduction utilizing principal component analysis and under-sampling— NearMiss could also improve the performance of the suggested models. Precision and AUROC were employed as the deciding criteria to arrive at a specific conclusion in this study. The research findings demonstrate the value of using feature selection and sample techniques.
In [74], a unique method for detecting credit card fraud via sequence labelling, which is based on probabilistic graphical models and deep neural networks (PGM) was introduced. The model was then compared to the baseline model using two real-world datasets. Also, how hidden sequential relationships between transactions as well as between anticipated labels could enhance the outcomes. In addition, a novel undersampling technique that aids in preserving the data’s sequential patterns during the random undersampling procedure was also introduced. However, the tests show that their algorithm outperforms cutting-edge oversampling and undersampling techniques in a promising manner.
In [75], a predictive lending model that pinpoints problematic individuals that are a lot more likely to repay the loan was built. As part of the study, supervised learning models namely, random forests, k-nearest neighbors (KNN), and decision trees. The categorization report states that the models with the highest f-score, accuracy score, recall and precision are the best models overall. But in this study, our main goal was to lower the classification models’ false- positive parameter. However, the paper highlighted that in order to improve business performance through the implementation of fraud detection techniques, forensic accounting should be required in deposit money institutions also users social media histories and tweets should be put into consideration as well.
2.6. Conclusion
In this chapter, we highlighted the various card payment systems which include the use of credit cards and debit cards to make online transactions most especially in electronic commerce. Furthermore, we explained the financial fraud system in detail including the types of fraud, which include bankruptcy, application, and theft fraud. Moving forward, we discussed machine learning which most of the current work in card fraud detection systems rely on while also explaining the various machine learning models ranging from fuzzy logic, K-nearest Neighbor, Hidden Markov Model and Support Vector Machine. Then, we talked about deep learning a subset of machine learning and we explained little about convolutional neural networks. Lastly, we researched in detail the previous work done in the field of card payment fraud detection from the years 1998 to 2022. So many methods ranging from shallow machine learning methods to deep learning methods have been applied to this field with each paper solving the problem in her own technique. A number of problems have been encountered in this field of work which are not limited to class imbalance, model use, and evaluation metrics.
3. Material and Methodology
Payment card fraud detection is a stretching task due to the complexity of human behavior and reaction to unforeseen circumstances which tends to affect normal human spending. Recently, the vast development and improvement in technologies across numerous areas which are not limited to, the medical field, agriculture, autonomous industries, telecommunication and banking industries have contributed to a handful of research by asking the right questions. We presented a new approach to aid payment card fraud detection in this chapter. As opposed to the current research methodology in this field which is mainly the use of features from comma-separated values (CSV) and using shallow machine learning models like logistic regression, support vector machine, decision tree, k-nearest neighbors and many more. No research has been done on using deep learning coupled with transfer learning to detect payment card fraud. However, we propose the application of a deep neural network using transfer learning to detect card fraud and also deploying the model in real-time by employing a mobile application.
3.1. Introduction
Due to the complexity of human behavior and our tendency to respond negatively to unplanned events, detecting payment card fraud can be challenging. Lately, cybercrime has increased tremendously, cutting across all the areas that incorporate the use of internet access to run their daily activities. Needless to say, the banking sector has recorded a huge number of fraud cases in the past years.
Thus, the need for a sophisticated means to detect discrepancies in customer behavior by comparing the particular transaction to the past transaction records. A handful of researchers have worked in this area and a good number of papers have been published to demonstrate the effectiveness of their work. Most of these papers dwell more on the use of shallow machine learning models which is quite understandable because of the available dataset. The generally obtainable dataset in payment card fraud detection is usually in comma-separated values (CSV) which mostly support the use of these models that include; Support vector machine, Logistic regression, Naive Bayes, Random Forest, Decision tree, K-nearest neighbors and Multi-layer perceptron. However, in this study, we proposed the conversion of this CSV dataset into quick response code (QR) images. This will enable us to apply deep neural networks and transfer learning to the implementation and development of a sophisticated model capable of detecting flaws in card transactions. More so, for real-time detection, the above model would be deployed by integrating the developed model into an Android application.
3.2. Proposed Framework
The proposed approach for payment card fraud detection relies on four stages which are; the conversion of the CSV datatype into QR images followed by the extraction of the important features by the convolutional layers, the third stage involves learning and the last stage is the deployment of the model.
3.2.1. Data Conversion
Data Description
The datasets employed in this study were obtained from the Kaggle data repository, https://www.kaggle.com/datasets/kartik2112/fraud-detection?select=fraudTest.csv. This dataset of simulated credit card transactions includes both valid and fraudulent purchases made between January 1 and December 31, 2019. It includes transactions made with a pool of 800 businesses using the credit cards of 1000 customers.
With the help of Brandon Harris’ Sparkov Data Creation Github program, this dataset was produced. From January 1 and December 31, 2020, this simulation was run. In order to create a consistent format, the files were concatenated. The data folder consists of two separate Microsoft Excel files which are the test and train sets. However, the test samples contain 555718 transactions while the training samples contain 1048574 transactions and both contain 22 features. See A for table description of the features.
Data Pre-Processing
Preparing raw data to be acceptable for a machine learning model is known as data preparation. In order to build a machine learning model, it is the first and most important stage. It is not always the case that we come across clean and prepared data when developing a machine learning project. Also, any time you work with data, you must clean it up and format it. Thus, we use a data preprocessing activity for this. As stated earlier; it was ensured that no null values were present in the dataset. Plus, the features which do not correlate with card fraud were dropped while the remaining features were converted to a QR image using a Python library known as qrcode. The pixel value 32 x 32 was maintained after the conversion.
Data Splitting
The importance of splitting datasets in machine learning cannot be over- emphasized. Our dataset was split into three different categories which are the training set, validation set and test set and in the ratio of 6:2:2 respectively. The training dataset was used in training the model while the validation set validates the model and for the purpose of evaluation we make use of the test set.
3.2.2. Feature Extraction
Model Implementation
Here, we transform our abstract risk model and our model specification into computer code. Depending on the intended IT Infrastructure, implementation may be done in a number of computer languages. Thus a Python programming language was adopted. In this study, Residual Network architecture was used for the development of our classification model.
Residual Network
The name Residual Network is ResNet. In 2015, Kaiming He, Xiangyu Zhang, Shaoqing Ren, and Jian Sun published a paper, https://arxiv.org/abs/1512.03385 on computer vision titled "Deep Residual Learning for Image Recognition", which is where they initially unveiled this novel neural network.
The term "feature extraction" refers to techniques for choosing and/or combining variables into features, which significantly reduces the amount of data that needs to be processed while properly and fully characterizing the initial data set. A convolutional network was utilized in this work to extract features from our deep learning models since this is a computer vision task. The choice of an appropriate network for feature extraction or the other components of a DL model is not made at random. So, it depends on the objective job and the computational complexity of the model’s implementation.
3.2.3. Model Learning
Optimizer
Learning the parameters to satisfy the objective function is a part of training deep learning models. Usually, the goal is to reduce the loss experienced throughout the learning process. In a supervised learning setting, data samples and their associated results are provided to the model. As a model generates an output, it first compares it to the desired output, then uses the difference to try to get the created output as near to the desired output as possible. Algorithms for optimization are used to achieve this. However, in this work, Adam optimizer was used to reduce the loss incurred during the training process. Its name is a contraction of "adaptive moments". It incorporates both momentum and rmsprop. A bias adjustment technique is also included in the update operation, which only takes the gradient’s smooth version into account. Adam has several benefits, including the fact that the magnitudes of parameter updates are independent of the gradient’s rescaling, that its stepsizes are roughly constrained by the stepsize hyperparameter, that it doesn’t need a stationary objective, that it works with sparse gradients, and that it naturally engages in step size annealing
Pre-Trained Weight
A pre-trained Resnet Model trained on imagenet dataset was used in this study to reduce the time complexity of our training process. Transfer learning is the process of applying what is learned from solving one machine learning problem to another. Using pre-trained models to transfer knowledge from one job to another is the main element of transfer learning.
Loss Function
The loss function is a mathematical formula used to determine how far the algorithm’s current output is from its desired result. It is a method to assess how well the algorithm models the data. In this study, binary cross-entropy loss was applied to measure how far our output is from the expected output.
Learning Rate
A hyperparameter called learning rate determines how much the model will be altered each time the model weights are changed in response to the predicted output differences. Selecting the learning rate is difficult since a value that is too little could lead to a drawn-out training process that might become stuck, and also value that is too high could lead to an unstable training process. Thus, after numerous tuning of our model, a learning rate of value 0.0001 was applied initially at the start of the training. However, a Reduce learning rate on plateau was applied to adjust the learning rate while there is no improvement on the model, depending on the metric to be monitored by the said argument (ReduceLROnPlateau).
Early Stopping
An early stopping parameter was compiled with the model. Early stopping is a technique that enables us to provide an arbitrarily large number of training epochs and terminate training whenever the model performance on a holdout validation dataset stops improving.
Batch Size
Batch size refers to the number of samples from the dataset to be fed into the model at a time during one epoch (cycle) of training. The batch size affects the model generalization. According to the authors of the paper, On Large-Batch Training for Deep Learning: Generalization Gap and Sharp Minima, large-batch strategies frequently cause models to get stuck in local minima. However, after numerous tuning a batch-size of 128 was employed in training our classification model.
Epoch
The entire number of iterations that all the training data are used in one cycle to train the machine learning model is referred to as an epoch. The number of epochs must be carefully chosen after tuning the model. This could cause model over-fitting or under-fitting when not carefully selected. In this study, 50 epoch was used for the model training process.
Evaluation Metrics
After we’ve used machine learning algorithms, we’ll need some tools to see how well they performed. These tools are referred to as performance evaluation metrics. The performance metrics were obtained after training and validating the datasets with a suitable learning rate and number of epochs which enable us to minimize the model error. In this work, we would consider the use of accuracy, recall, precision, and confusion matrix to measure the performance of our model.
Accuracy: The accuracy metric, in general, is defined as the proportion of correct predictions to the total number of occurrences examined
Precision: Precision is a metric for determining how many positive patterns in a positive class are accurately predicted out of the total predicted patterns.
Recall: The percentage of correctly classified positive patterns is measured by recall
F1 Score: The harmonic mean of recall and precision values is represented by this metric.
Hardware Resources and Specification
The Graphics Processing Units (GPU) package is recommended for our study because we deal with thousands of images which require a huge number of computations ranging from feature extraction to the reduction of loss to the barest minimum by ensuring the convergence of the weight’s values of our model. Making use of the GPU enabled our model to train or converge faster compared to the use of a Central Processing Unit (CPU) which could take forever. Our research was carried out on a Zbook 15 Workstation running on Windows operating system software with the following specifications:
HP Zbook Workstation: Intel® Core™ i7-6820HQ CPU @ 2.70GHz 2.71GHz
GPU: High-performance Nvidia Processor 8GB dedicated
RAM Memory: 16GB
Storage: 128GB SSD and 750 HDD
The model was deployed in mobile Android software using the Android application. The android system is made to predict the class in which the details uploaded represent. That is, if the particular transaction is perceived to be fraud or not.
3.2.4. Summary
In this chapter, we discussed the method and materials used to achieve our research objectives. We started from the stages involved in the study which are; dataset conversion, where we pre-process our CSV dataset by dropping the features that have no correlation with our aim and objectives. Then we proceed to conversion of our CSV data into QR code images so that we can comfortably apply deep neural network and transfer learning in order to achieve our research objectives. More so, we move forward to the next phase of applying a convolutional neural network for feature extraction. Then we proceed to model learning by setting our hyper-parameters right and efficiently applying the notable evaluation metrics to evaluate the performance of our trained model. The last phase of the methodology which is model deployment into an Android application for real-time detection and support was also done.
4. Analysis, Implementation and Results
4.1. Introduction
This chapter covers the whole implementation of our work, and we also look at the results of our implementation. Compare the findings to those of comparable studies that are reported in the literature review.
4.2. Implementation
This section includes a thorough explanation of how our work was implemented, from dataset gathering and preprocessing until the point of deployment.
4.2.1. Library Importation
All of the model’s prerequisite libraries are initially imported at the start of the modelling process. The majority of the libraries are from PyTorch for setting up models and hyperparameters. Scikit-Image, OS, and cv2 for importing and splitting data, as well as for visualizing our quick response code dataset in card fraud detection.
As preprocessing, the dataset which is in comma separated value (CSV) file was separated based on the classification (Real/Fake). However, each sample of the dataset was converted to a quick response code based on their class.
Now, the train data and the test data were loaded using the Pandas library. 1296675 instances of train data were loaded while 555719 of test instances were loaded.
To finalize, different analysis was performed on the datasets, ranging from uni-variate and bi-variate.
4.2.2. Data Analysis
Amount and Fraud
The analysis of amount and fraud shows the relationship between the two entities. It can be deduced from the datasets that most of the transactions above $400 fall in fraud events.
Gender and Fraud
This analysis shows the relationship between gender accounts susceptible to fraud events. However, it could be deduced that fraud is independent of gender. There is not much difference between the fraud cases experienced by both men and women. Below is the attachment of the graph of the percentage of fraud/no fraud and gender.
Age and Fraud
This analysis shows the age distribution and fraud events. However, it could be seen from the graph that fraud was peak around the age group of 30 to 55. Below is the attachment of the graph of age distribution and fraudulent events.
4.2.3. Data Balancing
The number of instances of fraud transactions to legitimate transactions is 11.3% to 88.7%. However, this requires some sort of data balancing to avoid bias on the minority group. Therefore, we applied SMOTE (Synthetic Minority Over-sampling Technique) data balancing technique to tackle this problem. Below is the code snippet for the operation.
4.2.4. Data Conversion
As stated earlier our dataset is in CSV format which is needed to be converted into an image in order to be able to apply a deep neural network for the implementation of the case study. Thus, we convert each instance (row) of the datasets to a Quick Response Code (QR). However, because of the limited availability of resources, we convert the subset of the dataset and apply it for our model training, validation and testing.
4.2.5. Model Implementation
In this architecture, the idea of "Residual Blocks" was developed in order to address the issue of the exploding gradient. The method employed is called skip network connections. By omitting some layers in between, the skip connection joins layer activations to subsequent layers. Consequently, a block is created. These discarded building blocks are stacked to create resnets. This network’s methodology involves letting the network fit the residual mapping rather than having layers learn the underlying mapping. The benefit of including this kind of skip link is that regularization will skip any layer that degrades architecture performance. In doing so, an extremely deep neural network can be trained without encountering issues with vanishing or exploding gradients.
4.2.6. Training Parameters
This step involves setting up the parameters required to train the model. Setting the right training parameter is essential to guarantee that the model produces the best results after training. A stochastic gradient descent approach is the optimizer chosen for this model. It gradually improves the weights in the model to lower the loss attained after each epoch. The binary cross-entropy loss function, which is generally used to determine how much a single sample prediction deviates from its true labels for binary data, has been selected to work in tandem with the optimizer.
4.3. Results
4.3.1. Model Conversion
Here we integrate the developed model into an Android mobile application. After successfully training our model, then we save the model. Since both the Android Studio and TensorFlow are being developed and managed by Google with an active community, thus making our deployment easily achievable.
Our Android mobile application was built in Android Studio 8.0.1. Android Studio is a Google’s official integrated development tool or environment. It is based on the IntelliJ IDEA software from JetBrains and the language used is JAVA and XML.
This section shows the plot obtained from the training of our model, and various results in the implementation process were shown and discussed.
4.3.2. The Plot of Training and Testing Loss, Training and Testing Accuracy
The figure 4.14 shows our training loss, testing loss, training accuracy and test accuracy by number of epochs
4.3.3. Model Comparison
Ce chapter is composed by two applications. The application of Over-sampling data balancing technique (SMOTE) and the application of Under-sampling data balancing technique (Random Under sampling)
Application of Over-Sampling Data Balancing Technique (SMOTE)
In this part, we calculate the confusion matrix that allows showing the performance of our model on the test datasets (figure 4.16).
The performance evaluation metric in the figure 4.17, and the classification report shown in table 4.17 summarizes the accuracy, precision, recall, support, and f1-score of the trained optimized model. This table below summarizes the classification of the used methods compared to our model.
An efficient way to assess the effectiveness of diagnostic tests is to plot test sensitivity as the y coordinate against its 1- specificity or false positive rate (FPR) as the x coordinate figure 4.18. This is known as the receiver operating characteristic curve (ROC).
Application of Random Under-Sampling Data Balancing Technique
This figure represents the confusion matrix that shows the performance of our model on our datasets.
The performance evaluation metric, the classification report is shown in the figure 4.20 and in the table 4.20 we summarize the accuracy, precision, recall, support, and f1-score of the trained optimized model.
The table below summarizes the classification of the used methods compared to our model.
An efficient way to assess the effectiveness of diagnostic tests is to plot test sensitivity as the y coordinate against its 1- specificity or false positive rate (FPR) as the x coordinate figure 4.21. This is known as the receiver operating characteristic curve (ROC).
4.3.4. Discussion
From the plots of losses, accuracy, confusion matrix, and classification report it could be seen that two different applications of experiments were carried out in terms of datasets balancing technique. The SMOTE and Random under-sampling technique were applied to the dataset and the outcome of the experiments are depicted above. Our methodology entails the conversion of each sample in our CSV dataset into quick response code images. These datasets were then used to train our proposed residual network while the outcome of the experiments was documented above. It could be seen that our proposed model performs best while using the Random under sampling dataset balancing technique.
4.3.5. Summary
In this paper, we discussed about the model implementation and the results obtained from our experiments. We explained in detail in the opening of the chapter about the libraries used to achieve our results. Also, we explained the data pre-processing, data loading and the analysis of our datasets using both univariate and bi-variate methods of data analysis. Moving forward, we talked about the methods of data balancing used to achieve the aims and objectives of our study. One of the most important phases of this study is the data conversion of CSV data format to QR code which was also explained together with its code snippet. Then we proceed to model implementation and training parameters. The last phase of the development was model deployment via mobile Android application which was also discussed and explained. Also, in this chapter, we compare the results of our proposed methodology with the existing methods and made some fascinating conclusions about our study.
5. Conclusion and Recommendation
5.1. Conclusion
Debit and credit card payments are more convenient for customers than paper checks, and businesses frequently accept them. Cards have successfully displaced cash as the primary method of payment, which has caused identity theft and payment security problems to increase significantly. An efficient, rapid, secure, and dependable payment system is essential for creating a robust financial system that will support economic activity. Hence, the proposition of a suitable method using a subset of machine learning known as a deep neural network. In this study, we proposed the conversion of each sample in a CSV file format into a quick response code image which is then used to train a deep neural network in other to solve the accuracy, f1 score, precision and recall lapses introduced in the previous research work. Numerous research has been undertaken in the field of card fraud detection systems using traditional machine-learning models like logistic regression, decision trees, random forests and many more. We compare the outcome of our experiments by using the same datasets to train traditional machine learning and our proposed deep neural network. Our evaluation of the five different traditional machine learnings which are K nearest neighbors, random forest, decision tree, bagging, Adaboost, and Gaussian Naive Bayes was based on accuracy, recall, f1 score and precision. For the over-sampling dataset balancing method, we obtain a precision of 0.99%, accuracy 0.99%, recall 1.00% and f1 score of 0.99% for KNN, a precision of 0.98%, accuracy 0.98%, recall 0.99% and f1 score of 0.99% for decision tree, a precision of 0.99%, accuracy 0.99%, recall 1.00% and f1 score of 0.99% for random forest, a precision of 0.95%, accuracy 0.92%, recall 0.88% and f1 score of 0.92% for adaboost, a precision of 0.99%, accuracy 0.99%, recall 0.99% and f1 score of 0.99% for bagging, a precision of 0.96%, accuracy 0.85%, recall 0.74% and f1 score of 0.83% for Gaussian naive bayes and our proposed model achieved a precision of 0.96%, accuracy 0.94%, recall 0.92% and f1 score of 0.94%. It could be seen here that the KNN and random forest perform best here. Also, for the under-sampling datasets balancing method, we obtain a precision of 0.85%, accuracy 0.85%, recall 0.85% and f1 score of 0.85% for KNN, a precision of 0.86%, accuracy 0.86%, recall 0.86% and f1 score of 0.86% for decision tree, a precision of 0.91%, accuracy 0.91%, recall 0.91% and f1 score of 0.91% for random forest, a precision of 0.95%, accuracy 0.92%, recall 0.88% and f1 score of 0.92% for adaboost, a precision of 0.90%, accuracy 0.90%, recall 0.90% and f1 score of 0.90% for bagging, a precision of 0.86%, accuracy 0.83%, recall 0.83% and f1 score of 0.83% for Gaussian naive bayes while our proposed model achieved a precision of 0.95%, accuracy 0.94%, recall 0.94% and f1 score of 0.94%. It could be seen here that our proposed model achieved the best result.
5.2. Recommendation
It is suggested that more deep neural network model architecture should be used with these datasets to see the possibilities of improving the existing fraud detection models. Adaptive learning could be applied while training the deep neural network and the use of other dataset repositories can be explored to train our proposed model.
Appendix A. Feature Table

Table A1.
Features of CSV dataset.
| S/no Features |
| 1. Transaction date and time |
| 2. ccnum |
| 3. Merchant |
| 4. Category |
| 5. Amount |
| 6. First name |
| 7. Last name |
| 8. Gender |
| 9. Street |
| 10. City |
| 11. State |
| 12. Zip |
| 13. Latitude |
| 14. Longitude |
| 15. City PoP |
| 16. Date of Birth |
| 17. Job |
| 18. Transaction number |
| 19. Unix Time |
| 20. Merchant latitude |
| 21. Merchant longitude |
| 22. Class |
References
- R. J. Sullivan, “The changing nature of us card payment fraud: Issues for industry and public policy.” in WEIS, 2010.
- V. I. Dewi, “Perkembangan sistem pembayaran di indonesia,” Bina Ekonomi, vol. 10, no. 2, 2006.
- B. Scholnick, N. Massoud, A. Saunders, S. Carbo-Valverde, and F. Rodriguez-Fernandez, “The economics of credit cards, debit cards and atms: A survey and some new evidence,” Journal of Banking & Finance, vol. 32, no. 8, pp. 1468–1483, 2008.
- N. Saraswati and I. Mukhlis, “The influence of debit card, credit card, and e-money transactions toward currency demand in indonesia,” Quantitative Economics Research, vol. 1, no. 2, pp. 87–94, 2018.
- J. B-lach, “Financial innovations and their role in the modern financial system-identification and systematization of the problem,” e-Finanse: Financial Internet Quarterly, vol. 7, no. 3, pp. 13–26, 2011.
- L. P. L. Cavaliere, N. Subhash, P. V. D. Rao, P. Mittal, K. Koti, M. K. Chakravarthi, R. Duraipandian, S. S. Rajest, and R. Regin, “The impact of internet fraud on financial performance of banks,” Turkish Online Journal of Qualitative Inquiry, vol. 12, no. 6, pp. 8126–8158, 2021.
- K. Vengatesan, A. Kumar, S. Yuvraj, V. Kumar, and S. Sabnis, “Credit card fraud detection using data analytic techniques,” Advances in Mathematics: Scientific Journal, vol. 9, no. 3, pp. 1185–1196, 2020.
- S. Bhattacharyya, S. Jha, K. Tharakunnel, and J. C. Westland, “Data mining for credit card fraud: A comparative study,” Decision support systems, vol. 50, no. 3, pp. 602–613, 2011.
- CyberSource, “Cybersource. online fraud report: online payment, fraud trends, merchant practices, and bench marks, ”accessed: 2023-08-01. [Online]. Available: http://cybersource.
- C. Everett, “Credit card fraud funds terrorism,” Computer Fraud & Security, vol. 2003, no. 5, p. 1, 2003.
- L. Delamaire, H. Abdou, and J. Pointon, “Credit card fraud and detection techniques: a review,” Banks and Bank systems, vol. 4, no. 2, pp. 57–68, 2009.
- K. Chaudhary, J. Yadav, and B. Mallick, “A review of fraud detection techniques: Credit card,” International Journal of Computer Applications, vol. 45, no. 1, pp. 39–44, 2012.
- R. Anderson, The credit scoring toolkit: theory and practice for retail credit risk management and decision automation. Oxford University Press, 2007.
- B. Mahesh, “Machine learning algorithms-a review,” International Journal of Science and Research (IJSR).[Internet], vol. 9, pp. 381–386, 2020.
- G., Y. B., and A. Courville, “Deep learning,” 2016. [Online]. Available: http://www.deeplearningbook.
- D. Luvizon, “Machine learning for human action recognition and pose estimation based on 3d information,” Ph.D. dissertation, Cergy Paris Universit´e, 2019.
- Dal Pozzolo, G. Boracchi, O. Caelen, C. Alippi, and G. Bontempi, “Credit card fraud detection: a realistic modeling and a novel learning strategy,” IEEE transactions on neural networks and learning systems, vol. 29, no. 8, pp. 3784–3797, 2017.
- T. Verdonck, B. Baesens, M. O´skarsd´ottir et al., “Special issue on feature engineering editorial,” Machine Learning, pp. 1–12, 2021.
- S. Sumanjeet, “Emergence of payment systems in the age of electronic commerce: The state of art,” Global Journal of International Business Research, vol. 2, no. 2, 2009.
- D. S. Evans and R. Schmalensee, Paying with plastic: the digital revolution in buying and borrowing. Mit Press, 2004.
- R. Hunt, “The development and regulation of consumer credit reporting in america federal reserve bank of philadelphia,” 2002.
- R. M. Hunt, “An introduction to the economics of payment card networks,”.
- Review of Network Economics, vol. 2, no. 2, 2003.
- T. Ekici and L. Dunn, “Credit card debt and consumption: evidence from household-level data,” Applied Economics, vol. 42, no. 4, pp. 455–462, 2010.
- B. C. S. D. A. W. L. A. S. Florentin Butaru, Qingqing Chen, “Risk and risk management in the credit card industry,” Journal of Banking Finance, vol. 72, pp. 218–239, 2016.
- J. P. Caskey, G. H. Sellon et al., “Is the debit card revolution finally here?” Economic Review-Federal Reserve Bank of Kansas City, vol. 79, pp. 79–79, 1994.
- J. W. Prathaban Mookiah, Ian Holmes and T. O. Connell, “A real-time solution for application fraud prevention,” 2019.
- Y. Tong, W. Lu, Y. Yu, and Y. Shen, “Application of machine learning in ophthalmic imaging modalities,” Eye and Vision, vol. 7, no. 1, pp. 1–15, 2020.
- E. Burns, “What is artificial intelligent ai,” accessed: 2023-2002. [Online]. Available: https://www.techtarget.
- S. Mishra, “towards data science, ”accessed: 2023-20-02. [Online]. Available: https://towardsdatascience.
- M. M. El Naqa, I., “Machine learning in radiation oncology,” vol. 9, pp. 3–11, 2015.
- L. A. Zadeh, “Fuzzy logic,” Computer, vol. 21, no. 4, pp. 83–93, 1988.
- J. Laaksonen and E. Oja, “Classification with learning k-nearest neighbors,” in Proceedings of international conference on neural networks (ICNN’96), vol. 3. IEEE, 1996, pp. 1480–1483.
- W. S. Noble, “What is a support vector machine?” Nature biotechnology, vol. 24, no. 12, pp. 1565–1567, 2006.
- IBM, “What is deep learning,” accessed: 2023-20-02. [Online]. Available: https://www.ibm.
- Y. LeCun, Y. Bengio, and G. Hinton, “Deep learning,” nature, vol. 521, no. 7553, pp. 436–444, 2015.
- P. Kim, “Convolutional neural network,” in MATLAB deep learning. Springer, 2017, pp. 121–147.
- IBM, “Neural network,” accessed: 2023-20-02. [Online]. Available: https://www.sas.com/en us/insights/analytics/neural-networks.
- SAS, “Neural networks: What they are and why they atter,,” accessed: 2023-20-02. [Online]. Available: https://www.sas.com/en us/insights/ analytics/neural-networks.
- S.-C. Wang, Interdisciplinary computing in Java programming. Springer Science & Business Media, 2003, vol. 743.
- Neutelings, “Neural networks.” accessed: 2023-20-02. [Online]. Available: https://tikz.
- V. Puncreobutr, “Education 4.0: New challenge of learning,” Journal of Humanities and Social Sciences, vol. 2, 2016.
- D. Rengasamy, M. Jafari, B. Rothwell, X. Chen, and G. P. Figueredo, “Deep learning with dynamically weighted loss function for sensor-based prognostics and health management,” Sensors, vol. 20, no. 3, p. 723, Jan 2020. [Online]. [CrossRef]
- J. Gu, Z. Wang, J. Kuen, L. Ma, A. Shahroudy, B. Shuai, T. Liu, X. Wang, G. Wang, J. Cai et al., “Recent advances in convolutional neural networks,” Pattern recognition, vol. 77, pp. 354–377, 2018.
- R. Yamashita, M. Nishio, R. K. G. Do, and K. Togashi, “Convolutional neural networks: an overview and application in radiology,” Insights into imaging, vol. 9, no. 4, pp. 611–629, 2018.
- S. Albawi, O. Bayat, S. Al-Azawi, and O. N. Ucan, “Social touch gesture recognition using convolutional neural network,” Computational Intelligence and Neuroscience, vol. 2018, 2017.
- Mehta, “A comprehensive guide to types of neural networks,” accessed: 2023-20-02. [Online]. Available: https://www.digitalvidya.com/ blog/types-of-neuralnetworks.
- IBM, “Convolutional neural networks.” accessed: 2023-20-02. [Online]. Available: https://www.ibm.
- C.-C. Lo, C.-H. Lee, and W.-C. Huang, “Prognosis of bearing and gear wears using convolutional neural network with hybrid loss function,” Sensors, vol. 20, no. 12, p. 3539, Jun 2020. [Online]. [CrossRef]
- IBM, “Convolutional neural network, ”accessed: 2023-20-02. [Online]. Available: https://www.ibm.com/cloud/learn/ convolutional-neuralnetworks.
- A. A. and S. Amidi, “Covolutional neural nets,” accessed: 2023-20-02. [Online]. Available: https://stanford.edu/∼shervine/teaching/cs-230/cheatsheetconvolutional-neural-networks.
- S.Saha, “A comprehensive guide to convolutional neural networks — the eli5 way,’ towards data science,” accessed: 2023-20-02. [Online]. Available: https://towardsdatascience.com/a-comprehensive-guide-to-convolutional-neural-networks-the-eli5-way-3bd2b1164a53.
- J. Brownlee, “How to choose an activation function for deep learning,” accessed: 2023-20-02. [Online]. Available: https://machinelearningmastery. com/choose-an-activation-function-for-deeplearning/.
- K. Philip and S. Chan, “Toward scalable learning with non-uniform class and cost distributions: A case study in credit card fraud detection,” in Proceeding of the Fourth International Conference on Knowledge Discovery and Data Mining, 1998, pp. 164–168.
- D. Iyer, A. Mohanpurkar, S. Janardhan, D. Rathod, and A. Sardeshmukh, “Credit card fraud detection using hidden markov model,” in 2011 World Congress on Information and Communication Technologies. IEEE, 2011, pp. 1062–1066.
- R. Patidar, L. Sharma et al., “Credit card fraud detection using neural network,” International Journal of soft computing and Engineering (IJSCE), vol. 1, no. 32-38, 2011.
- M. R. HaratiNik, M. Akrami, S. Khadivi, and M. Shajari, “Fuzzgy: A hybrid model for credit card fraud detection,” in 6th international symposium on telecommunications (IST). IEEE, 2012, pp. 1088–1093.
- R. D. Patel and D. K. Singh, “Credit card fraud detection & prevention of fraud using genetic algorithm,” International Journal of Soft Computing and Engineering, vol. 2, no. 6, pp. 292–294, 2013.
- T. K. Behera and S. Panigrahi, “Credit card fraud detection: a hybrid approach using fuzzy clustering & neural network,” in 2015 second international conference on advances in computing and communication engineering. IEEE, 2015, pp. 494–499.
- Dal Pozzolo, “Adaptive machine learning for credit card fraud detection,” 2015.
- Y. Heryadi, L. A. Wulandhari, B. S. Abbas et al., “Recognizing debit card fraud transaction using chaid and k-nearest neighbor: Indonesian bank case,” in 2016 11th International Conference on Knowledge, Information and Creativity Support Systems (KICSS). IEEE, 2016, pp. 1–5.
- N. Carneiro, G. Figueira, and M. Costa, “A data mining based system for credit-card fraud detection in e-tail,” Decision Support Systems, vol. 95, pp. 91–101, 2017.
- K. Goswami, Y. Park, and C. Song, “Impact of reviewer social interaction on online consumer review fraud detection,” Journal of Big Data, vol. 4, no. 1, pp. 1–19, 2017.
- N. K. Gyamfi and J.-D. Abdulai, “Bank fraud detection using support vector machine,” in 2018 IEEE 9th Annual Information Technology, Electronics and Mobile Communication Conference (IEMCON). IEEE, 2018, pp. 37–41.
- W. N. Robinson and A. Aria, “Sequential fraud detection for prepaid cards using hidden markov model divergence,” Expert Systems with Applications, vol. 91, pp. 235–251, 2018.
- E.-H. A. Abdou, H. E. Mohammed, W. Khalifa, M. I. Roushdy, and A.-B. M. Salem, “Machine learning techniques for credit card fraud detection,”Future Computing and Informatics Journal, vol. 4, no. 2, p. 5, 2019.
- U. Fiore, A. De Santis, F. Perla, P. Zanetti, and F. Palmieri, “Using generative adversarial networks for improving classification effectiveness in credit card fraud detection,” Information Sciences, vol. 479, pp. 448–455, 2019.
- S. Georgieva, M. Markova, and V. Pavlov, “Using neural network for credit card fraud detection,” in AIP Conference Proceedings, vol. 2159, no. 1. AIP Publishing LLC, 2019, p. 030013.
- B. Branco, P. Abreu, A. S. Gomes, M. S. Almeida, J. T. Ascens˜ao, and P. Bizarro, “Interleaved sequence rnns for fraud detection,” in Proceedings of the 26th ACM SIGKDD international conference on knowledge discovery & data mining, 2020, pp. 3101–3109.
- S. M. Darwish, “An intelligent credit card fraud detection approach based on semantic fusion of two classifiers,” Soft Computing, vol. 24, no. 2, pp. 1243–1253, 2020.
- S. Khatri, A. Arora, and A. P. Agrawal, “Supervised machine learning algorithms for credit card fraud detection: a comparison,” in 2020 10th International Conference on Cloud Computing, Data Science & Engineering (Confluence). IEEE, 2020, pp. 680–683.
- M. Seera, C. P. Lim, A. Kumar, L. Dhamotharan, and K. H. Tan, “An intelligent payment card fraud detection system,” Annals of operations research, pp. 1–23, 2021.
- X. Zhang, Y. Han, W. Xu, and Q. Wang, “Hoba: A novel feature engineering methodology for credit card fraud detection with a deep learning architecture,” Information Sciences, vol. 557, pp. 302–316, 2021.
- V. Chang, A. Di Stefano, Z. Sun, G. Fortino et al., “Digital payment fraud detection methods in digital ages and industry 4.0,” Computers and Electrical Engineering, vol. 100, p. 107734, 2022.
- J. Forough and S. Momtazi, “Sequential credit card fraud detection: A joint deep neural network and probabilistic graphical model approach,” Expert Systems, vol. 39, no. 1, p. e12795, 2022.
- S. Kumar, R. Ahmed, S. Bharany, M. Shuaib, T. Ahmad, E. Tag Eldin, A. U. Rehman, and M. Shafiq, “Exploitation of machine learning algorithms for detecting financial crimes based on customers’ behavior,” Sustainability, vol. 14, no. 21, p. 13875, 2022.
- K. He, X. Zhang, S. Ren, and J. Sun, “Deep residual learning for image recognition,” 2015. [Online]. Available: https://arxiv.org/abs/1512.03385.
Figure 2.
1: card system flow of payment [22].
Figure 2.
1: card system flow of payment [22].
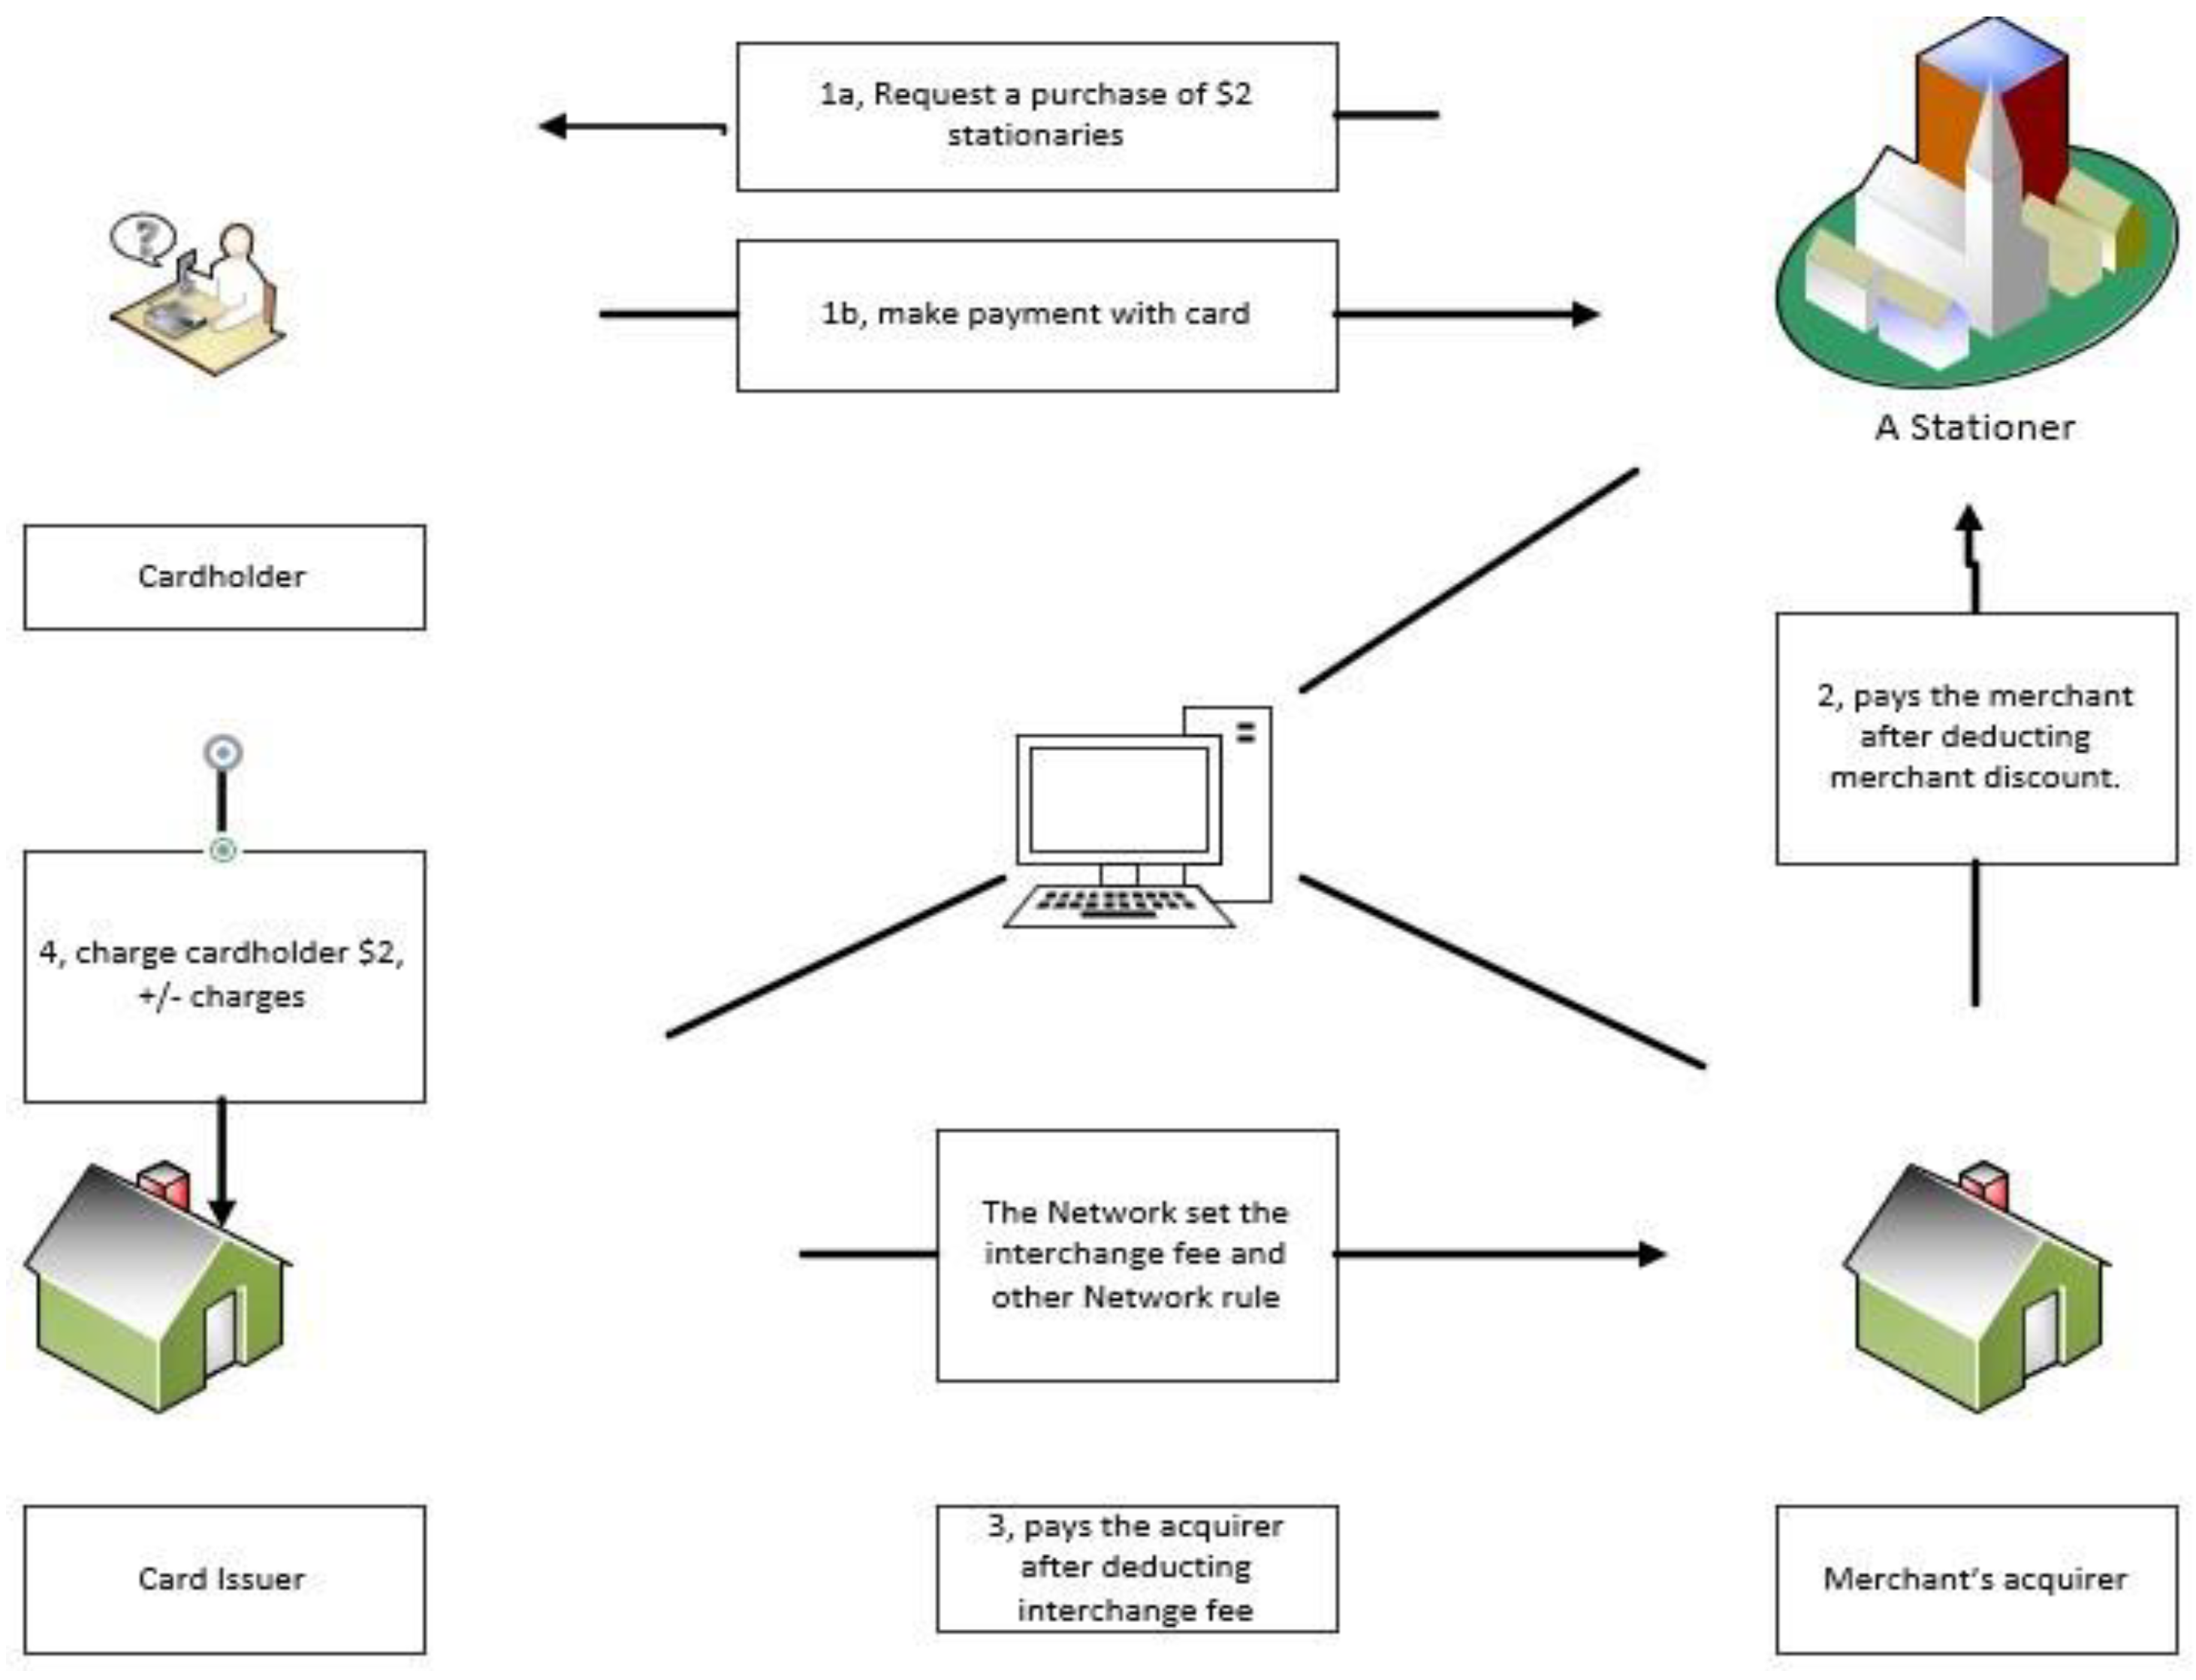
Figure 2.
2: An Artificial Neural Network Representation [40].
Figure 2.
2: An Artificial Neural Network Representation [40].
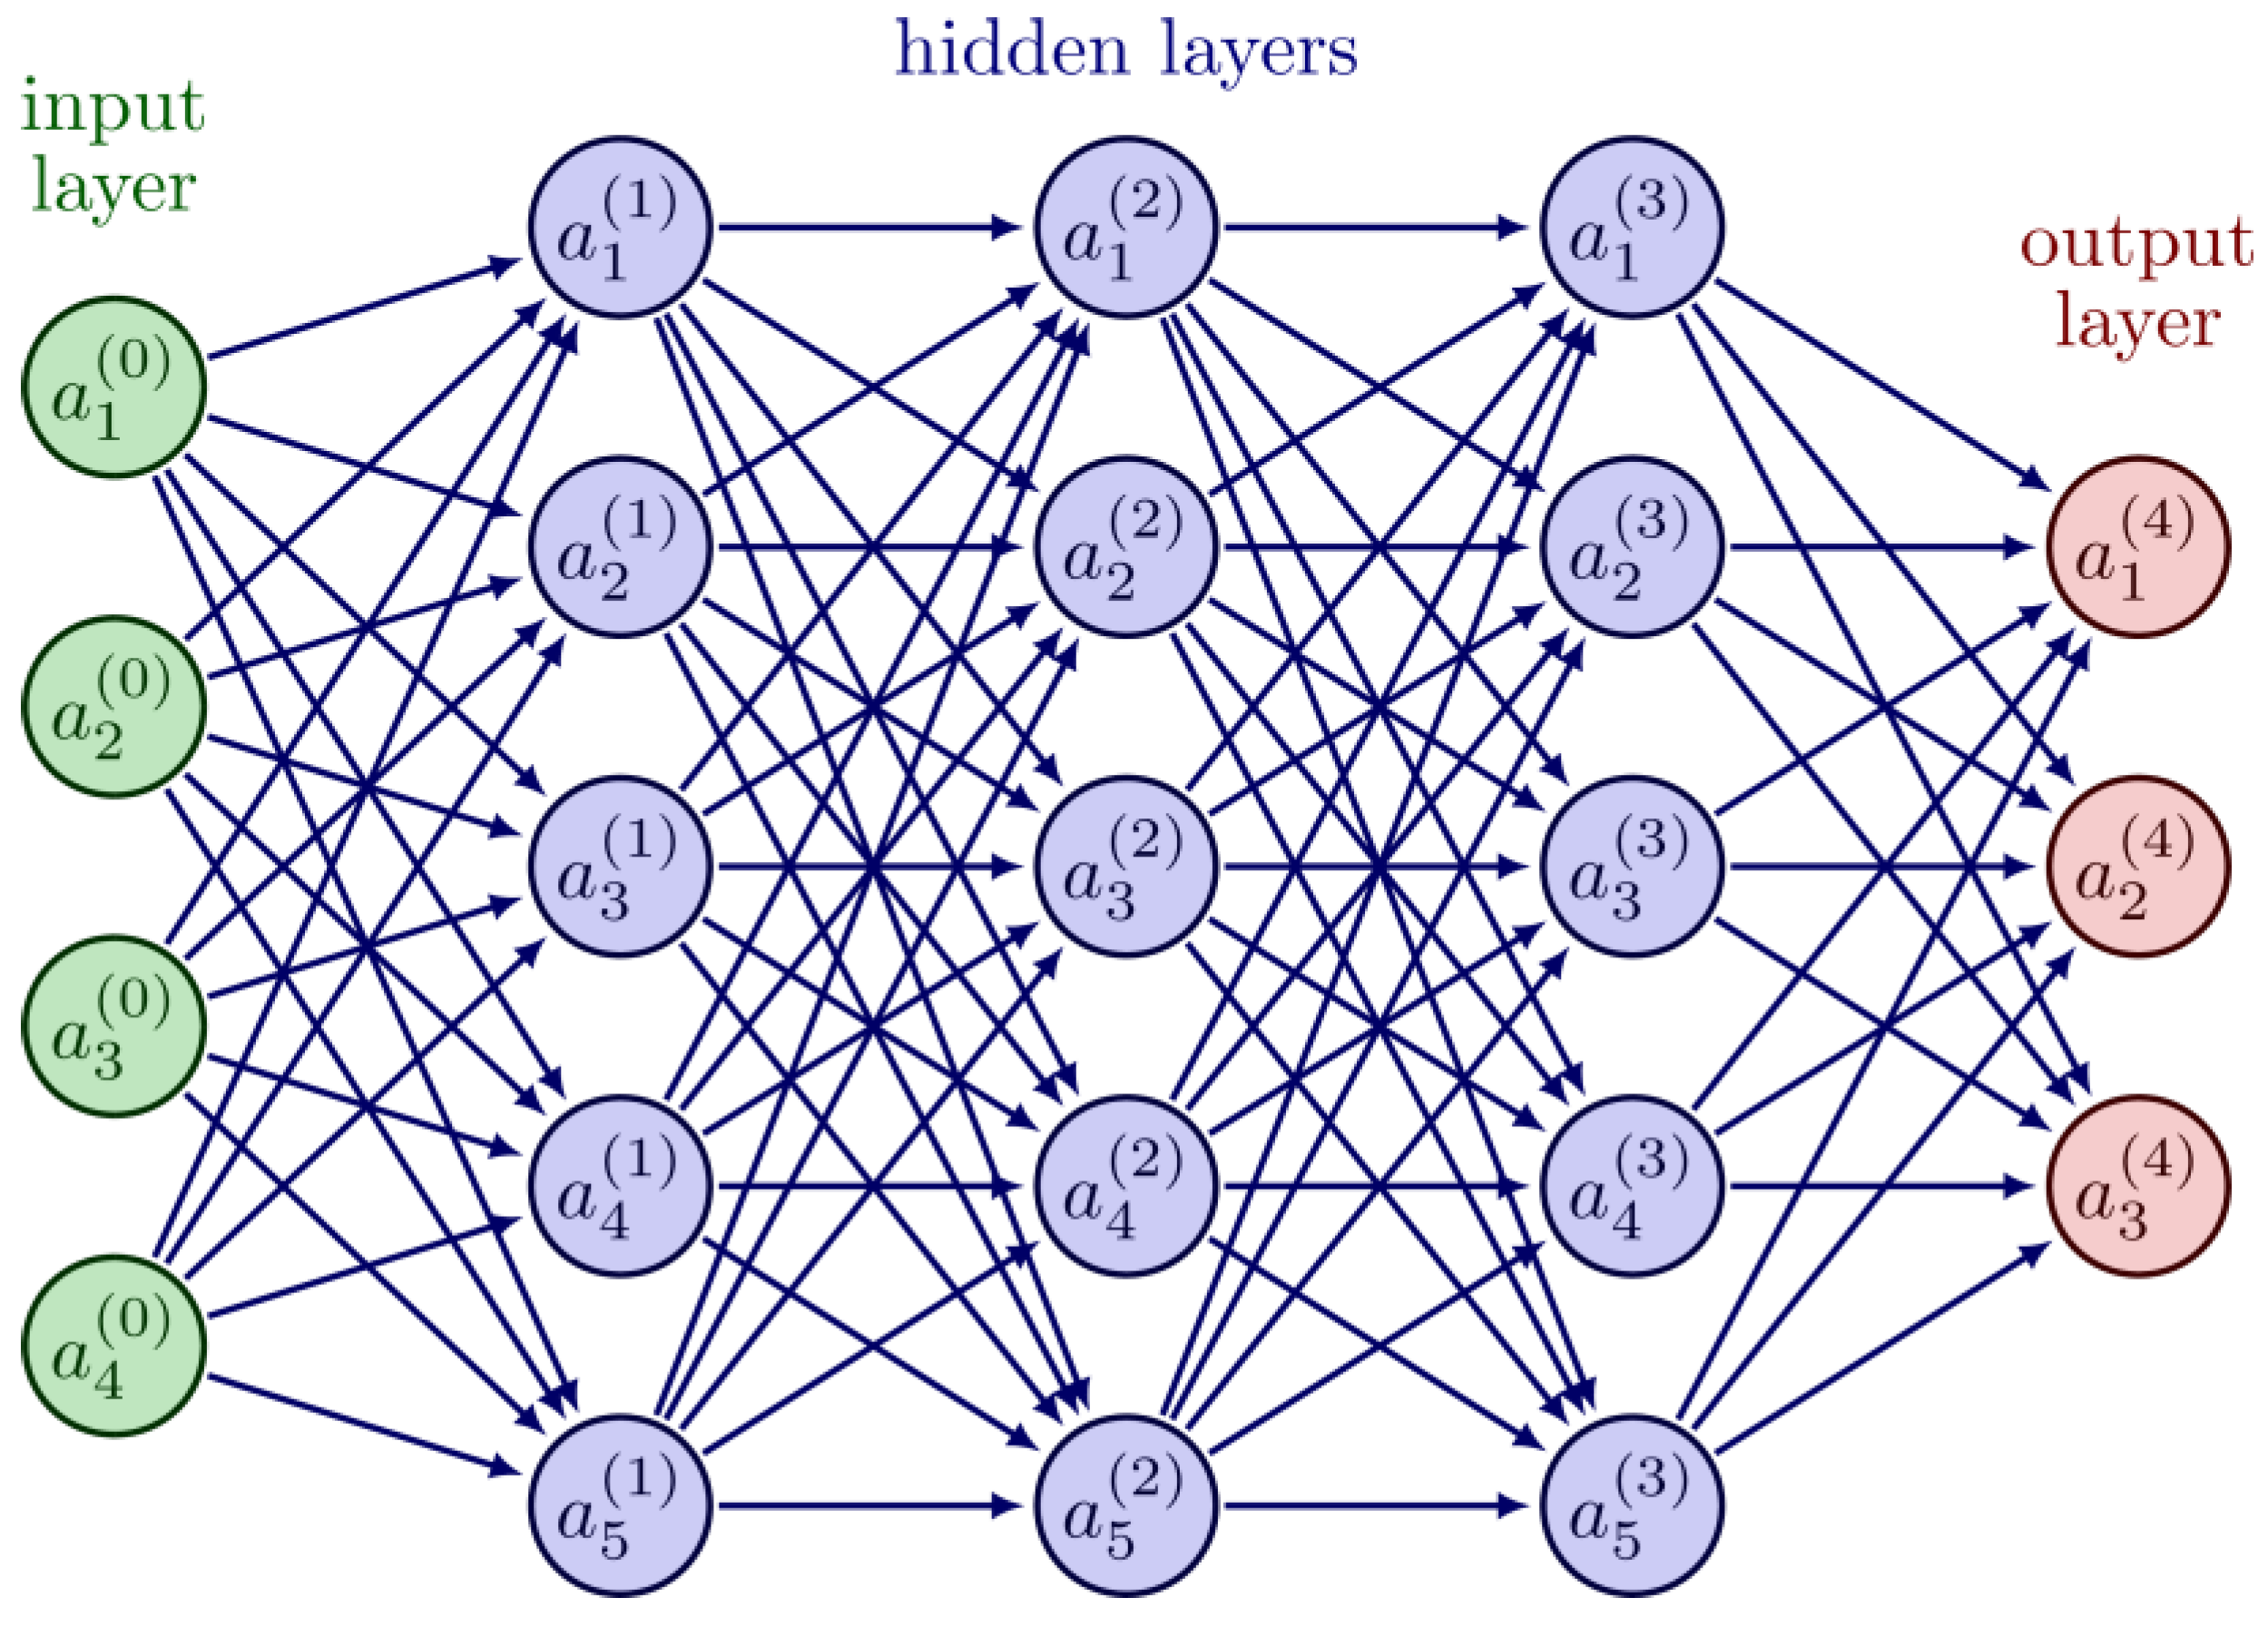
Figure 2.
3: loss against weight graphical representation [42].
Figure 2.
3: loss against weight graphical representation [42].
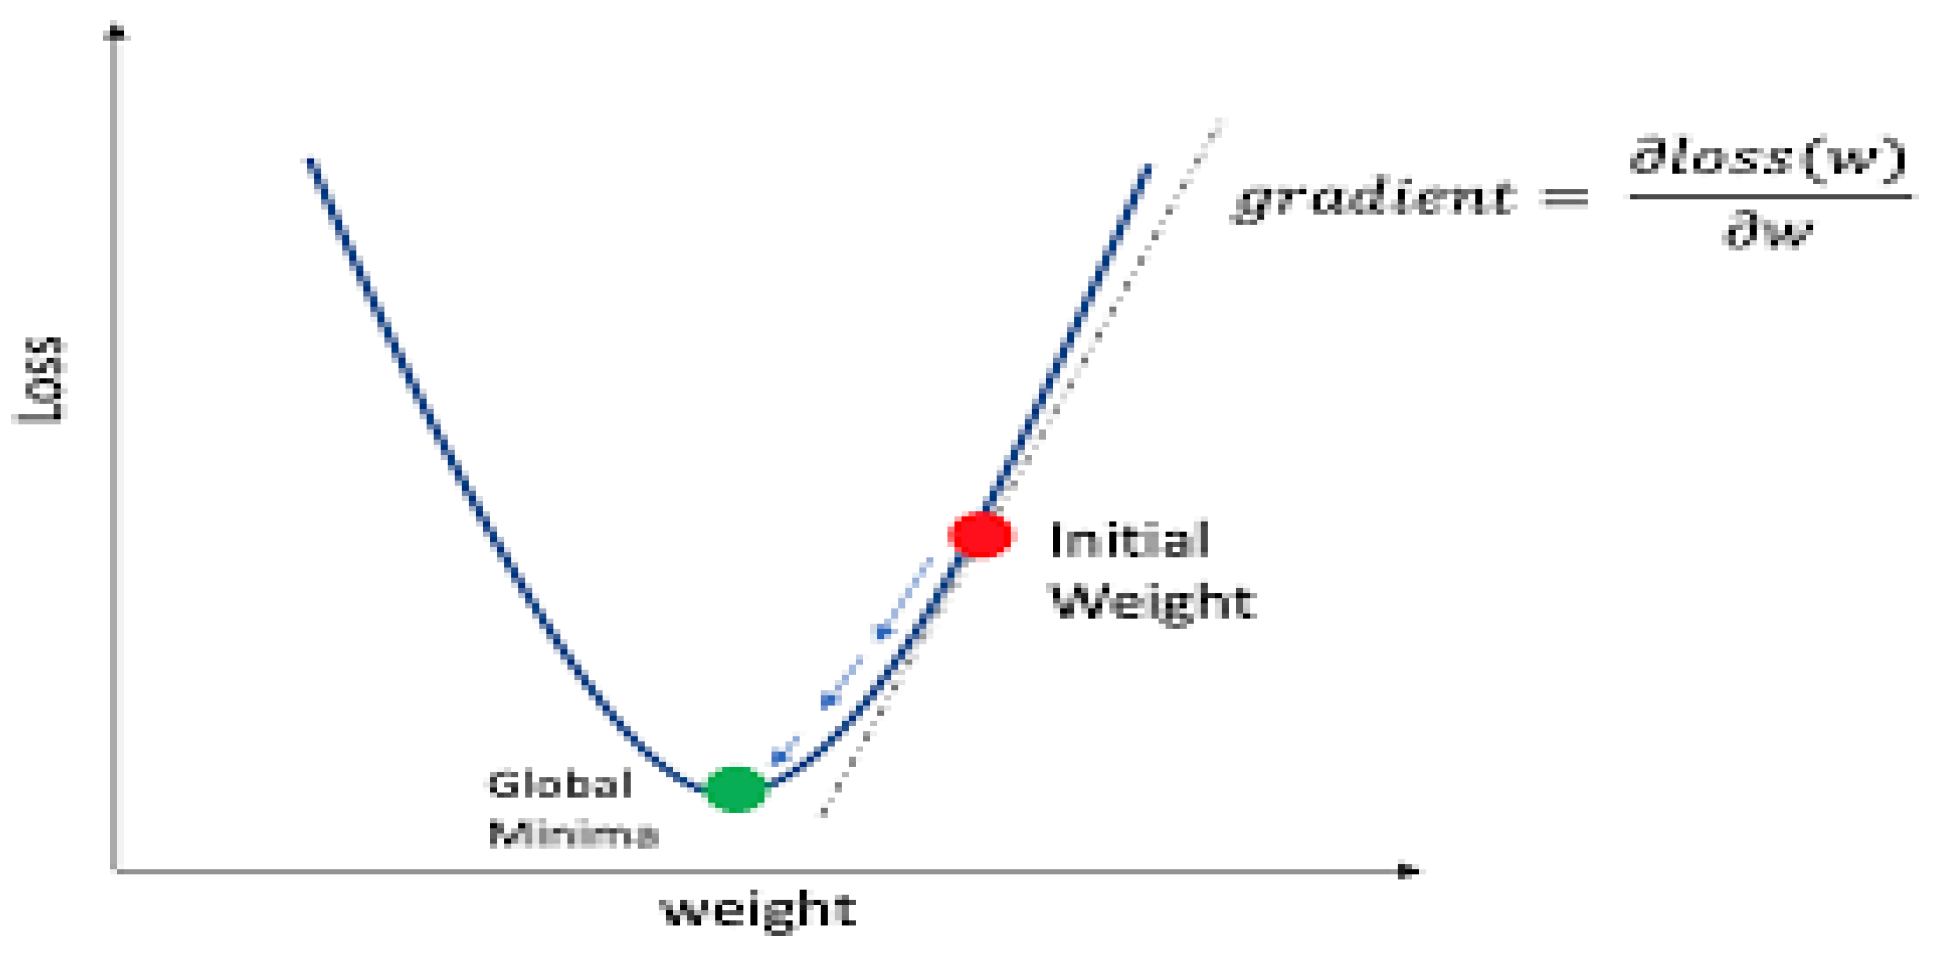
Figure 2.
4: Convolutional neural network illustration [48].
Figure 2.
4: Convolutional neural network illustration [48].
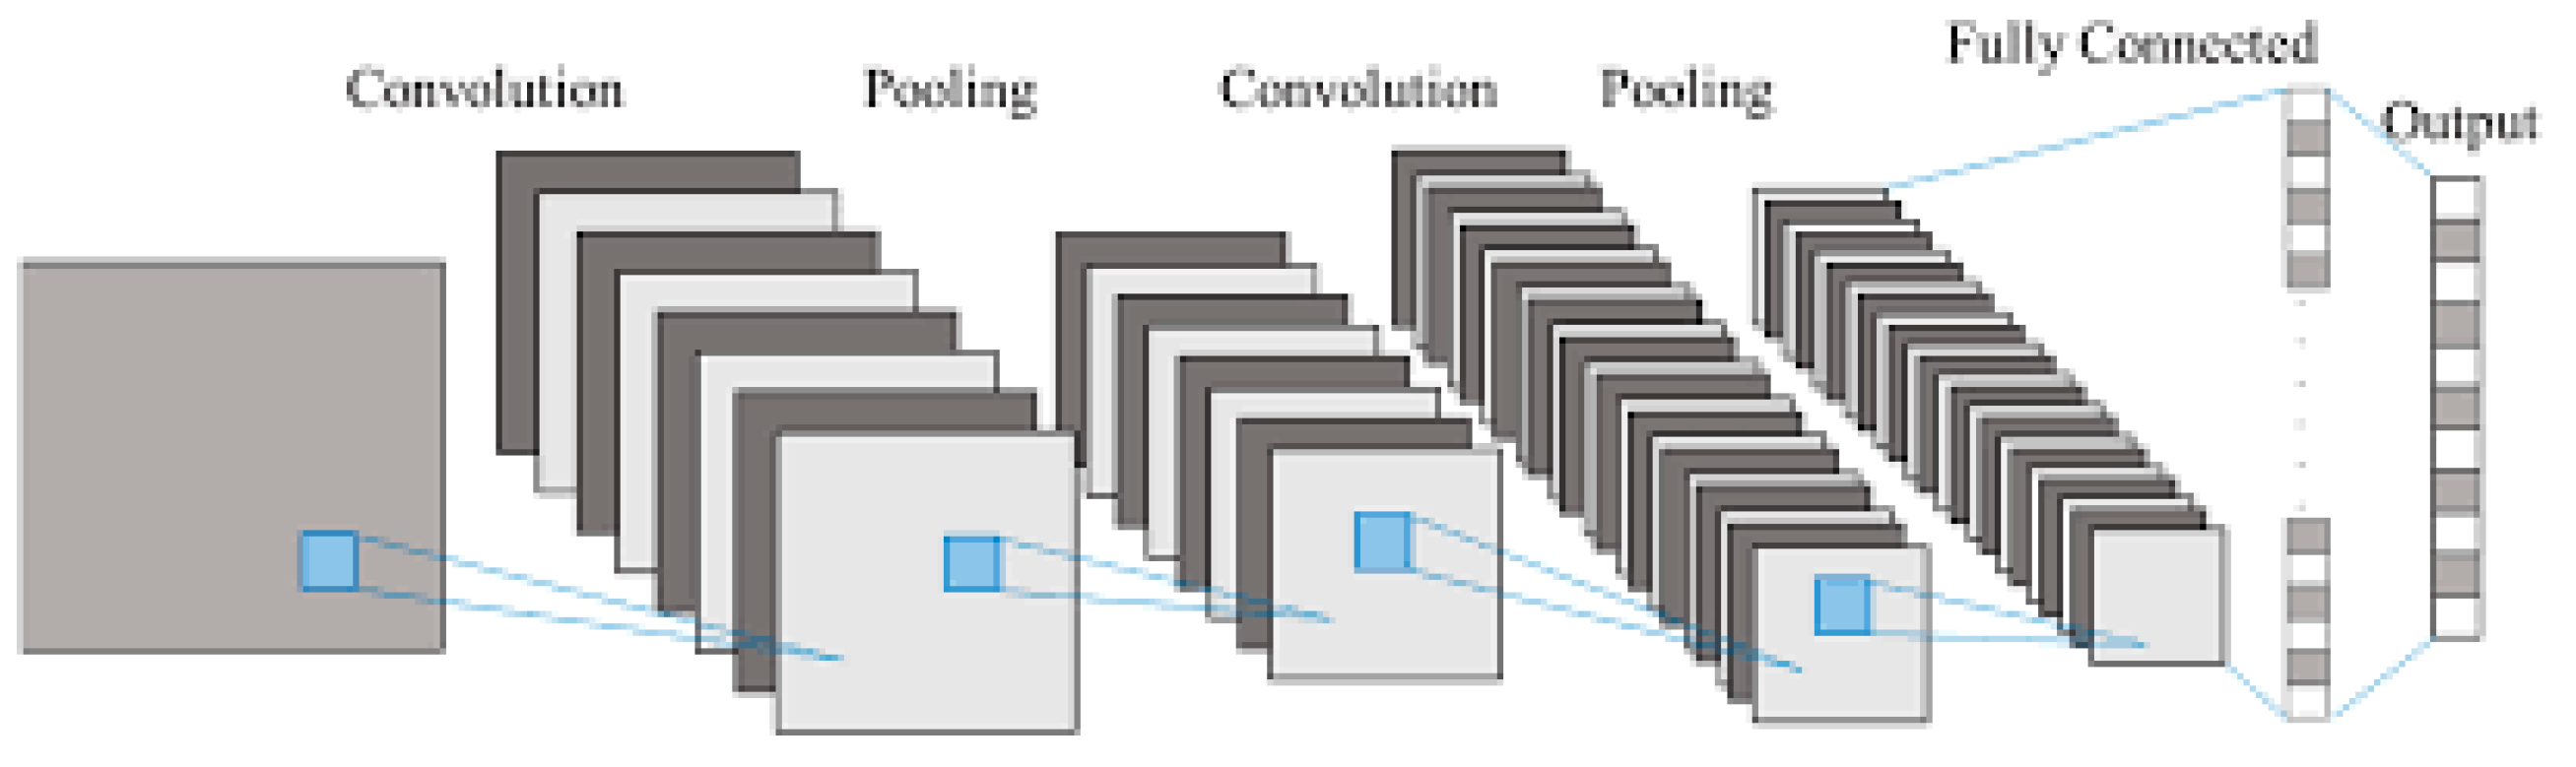
Figure 2.
5: four 50:50 data subsets created from a 20:80 data collection [53].
Figure 2.
5: four 50:50 data subsets created from a 20:80 data collection [53].
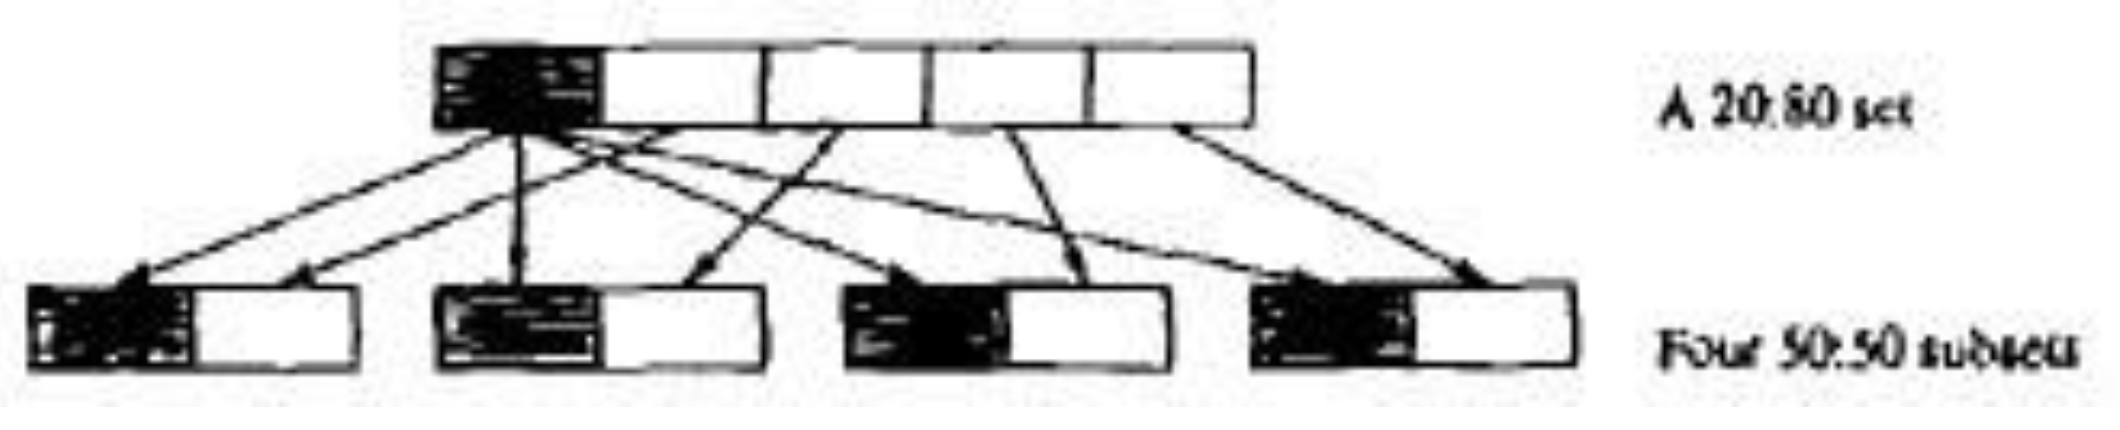
Figure 2.
6: a collection of input attributes that define each network transaction [55].
Figure 2.
6: a collection of input attributes that define each network transaction [55].
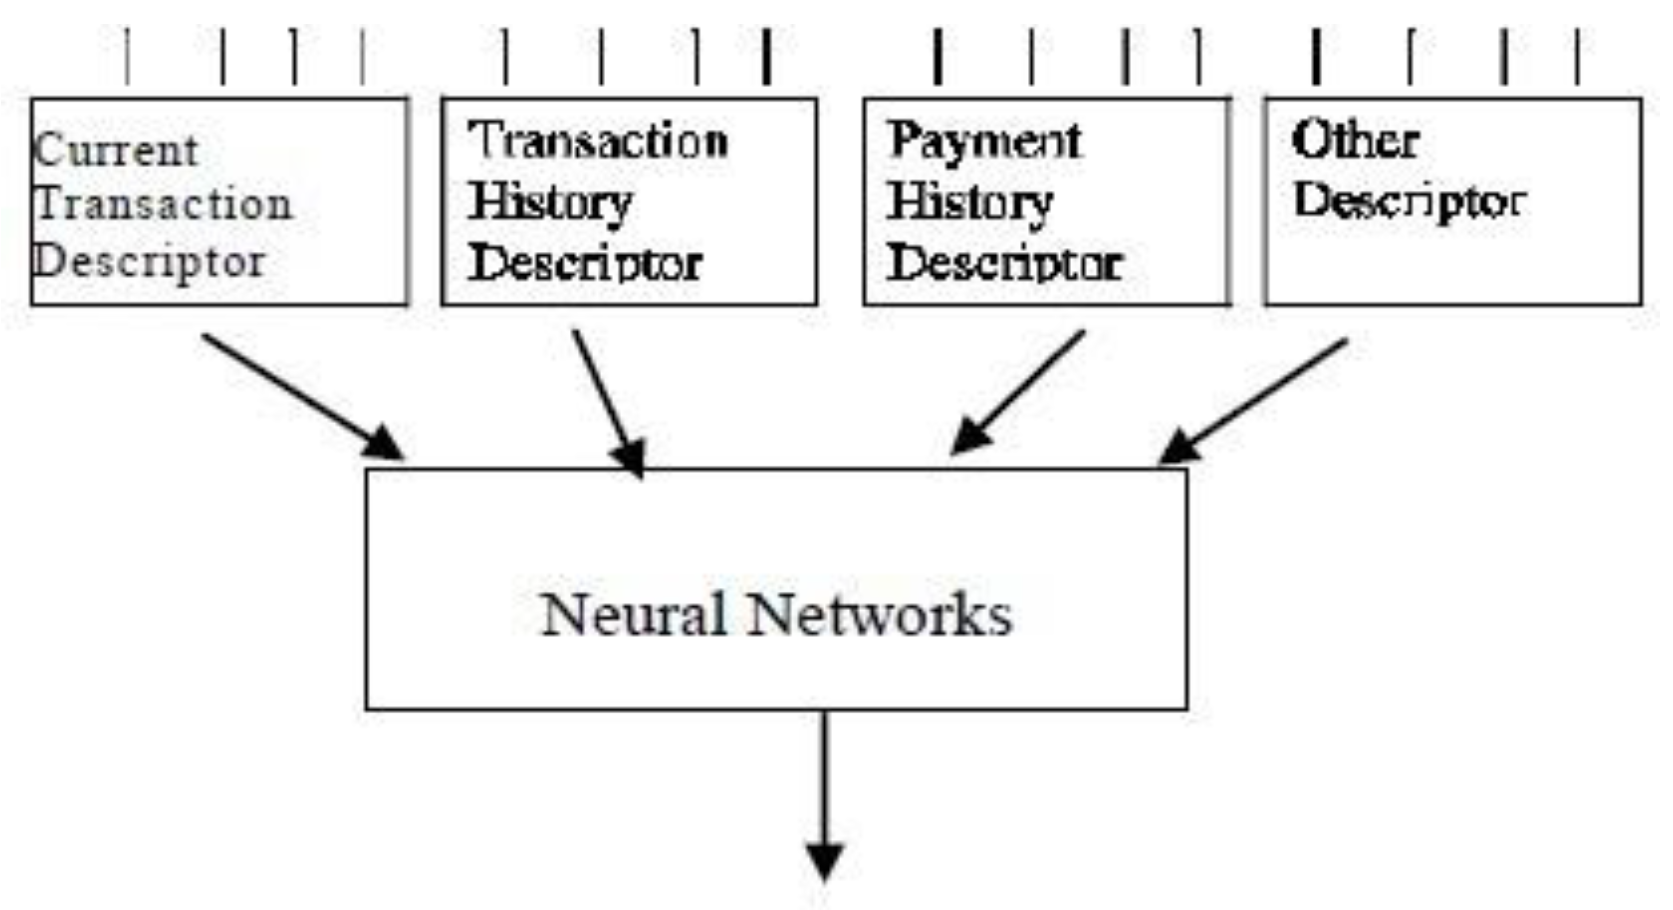
Figure 2.
7: Basic Components of GA and GANN Systems [55].
Figure 2.
7: Basic Components of GA and GANN Systems [55].
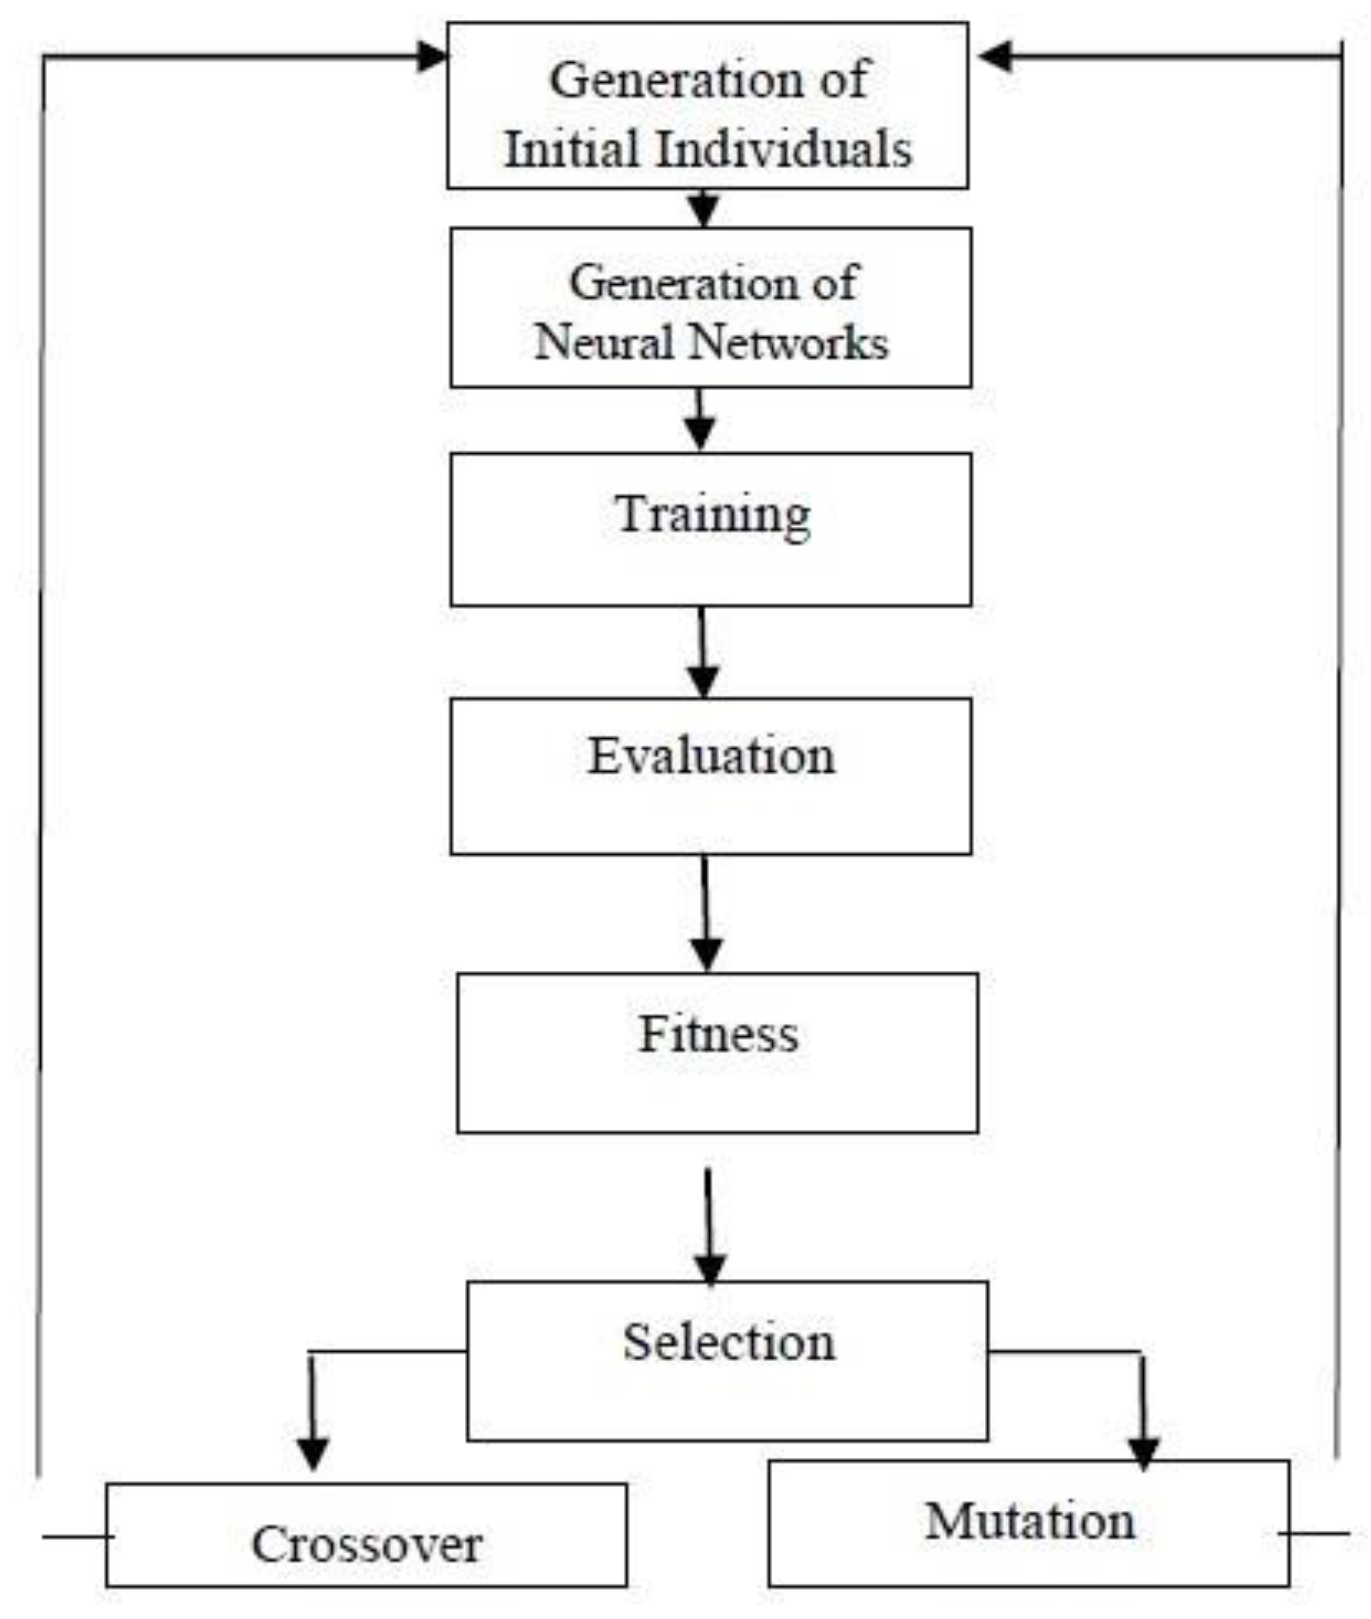
Figure 2.
9: The sequence of events in the potential Credit Card Fraud Detection System [58].
Figure 2.
9: The sequence of events in the potential Credit Card Fraud Detection System [58].
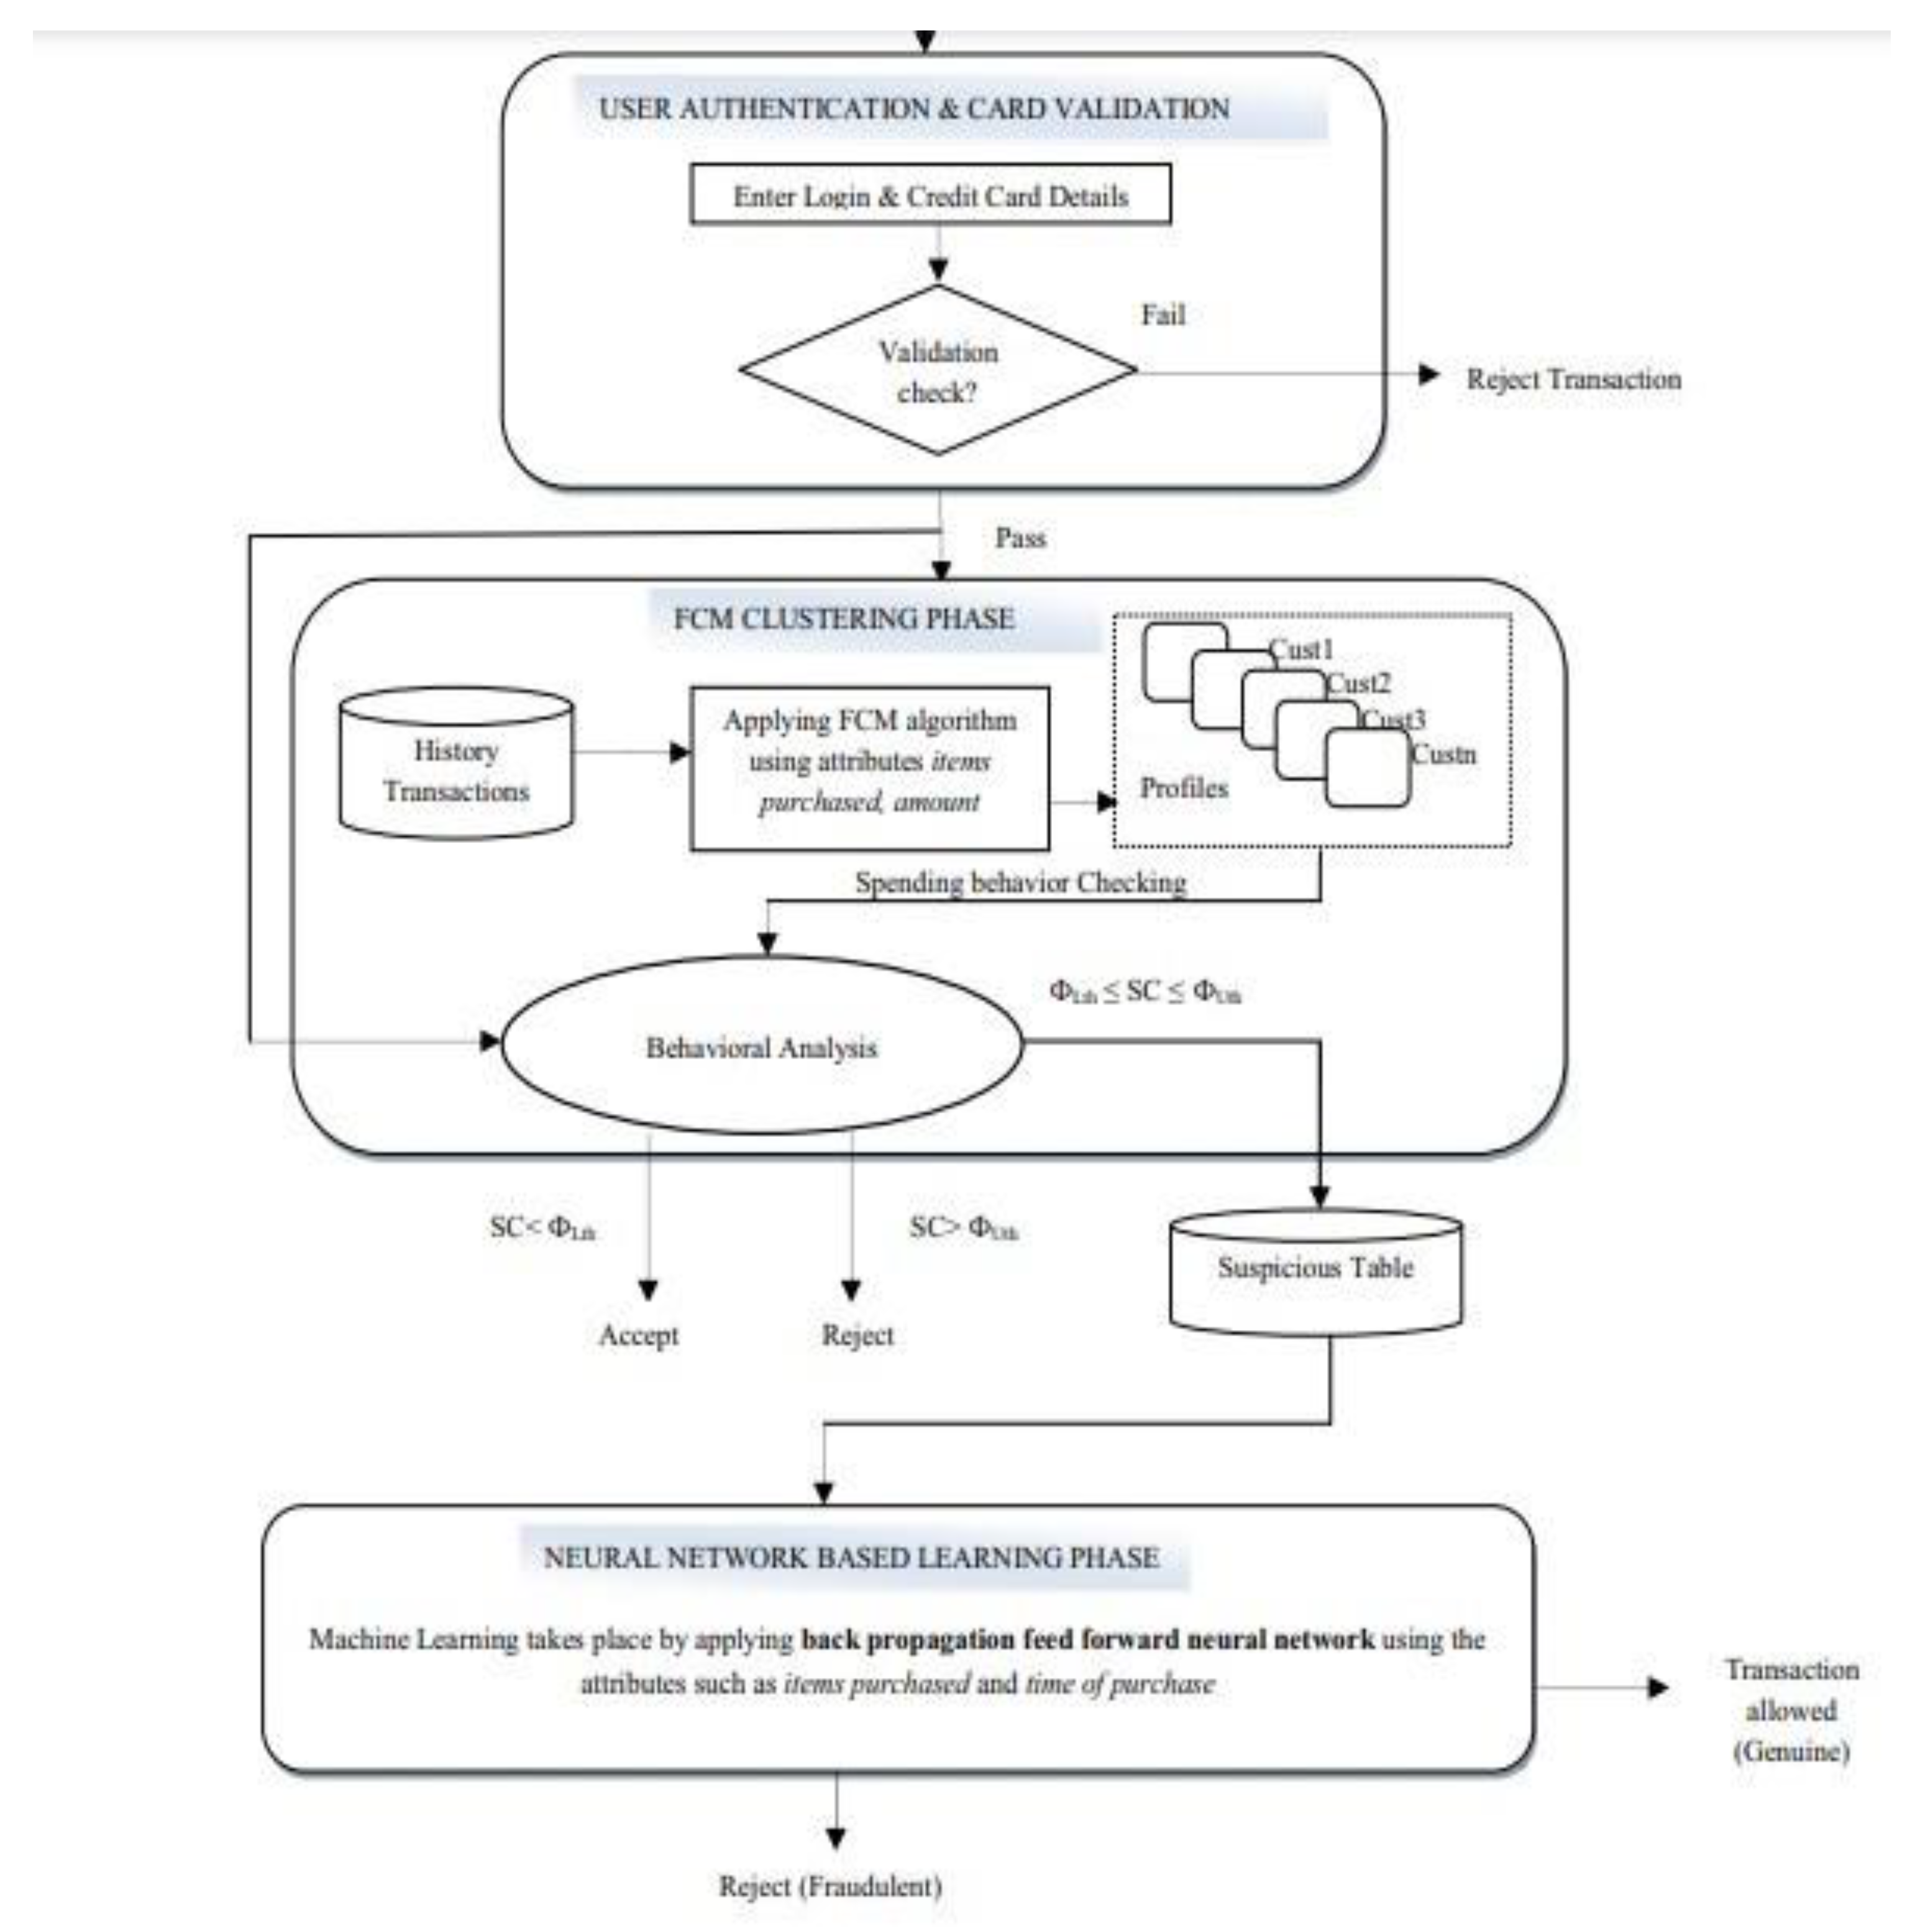
Figure 2.
10: Proposed procedure for the organization fraud detection [61].
Figure 2.
10: Proposed procedure for the organization fraud detection [61].
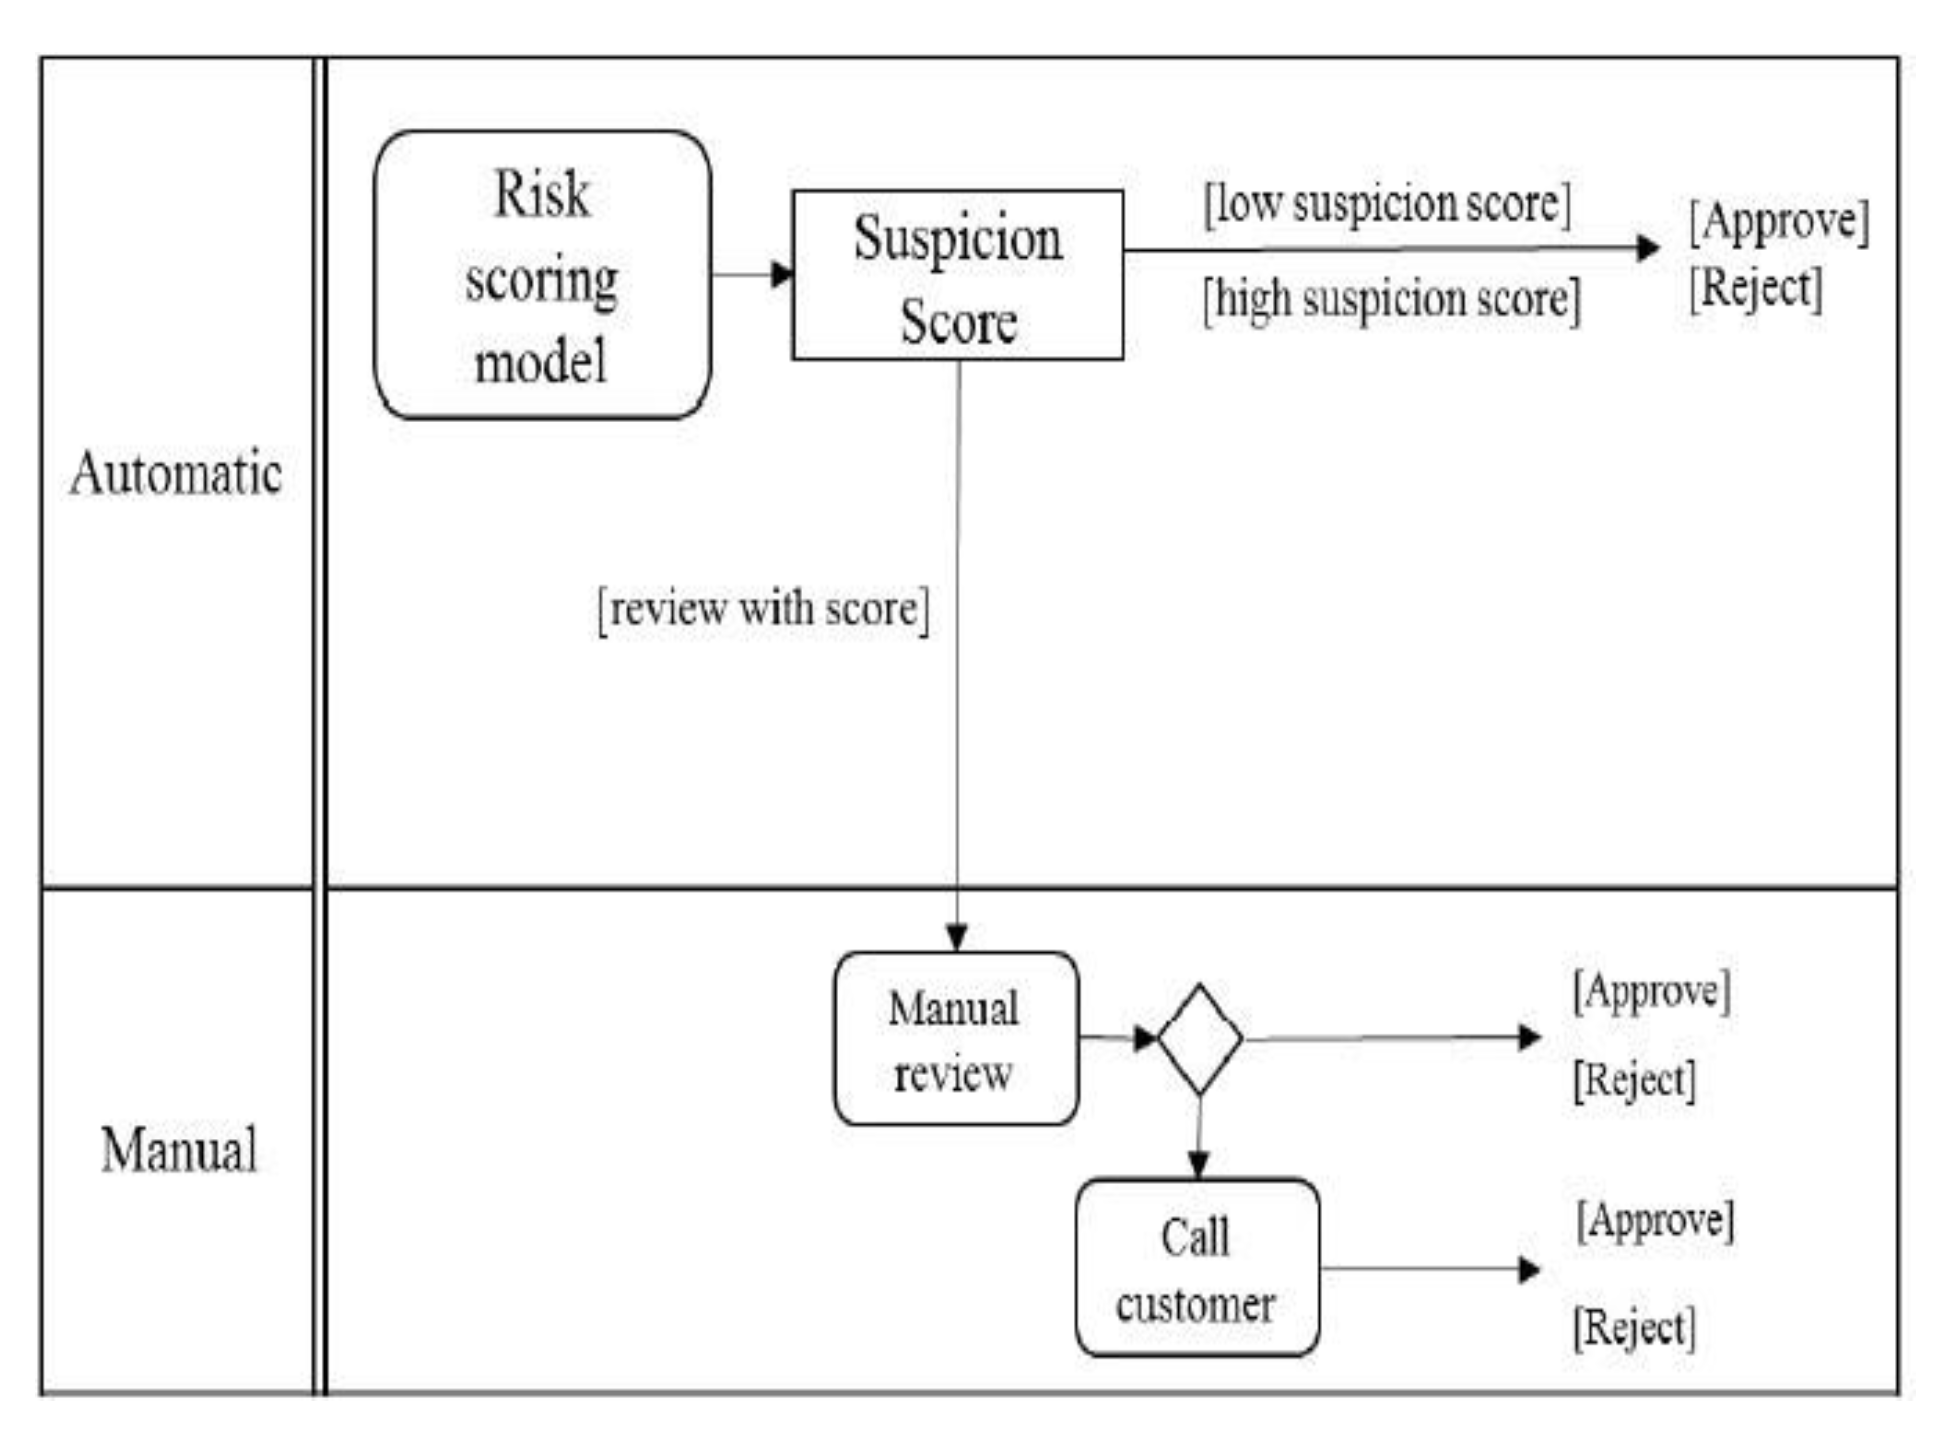
Figure 2.
11: Fraud detection with Big Data using SVM-S architecture [63].
Figure 2.
11: Fraud detection with Big Data using SVM-S architecture [63].
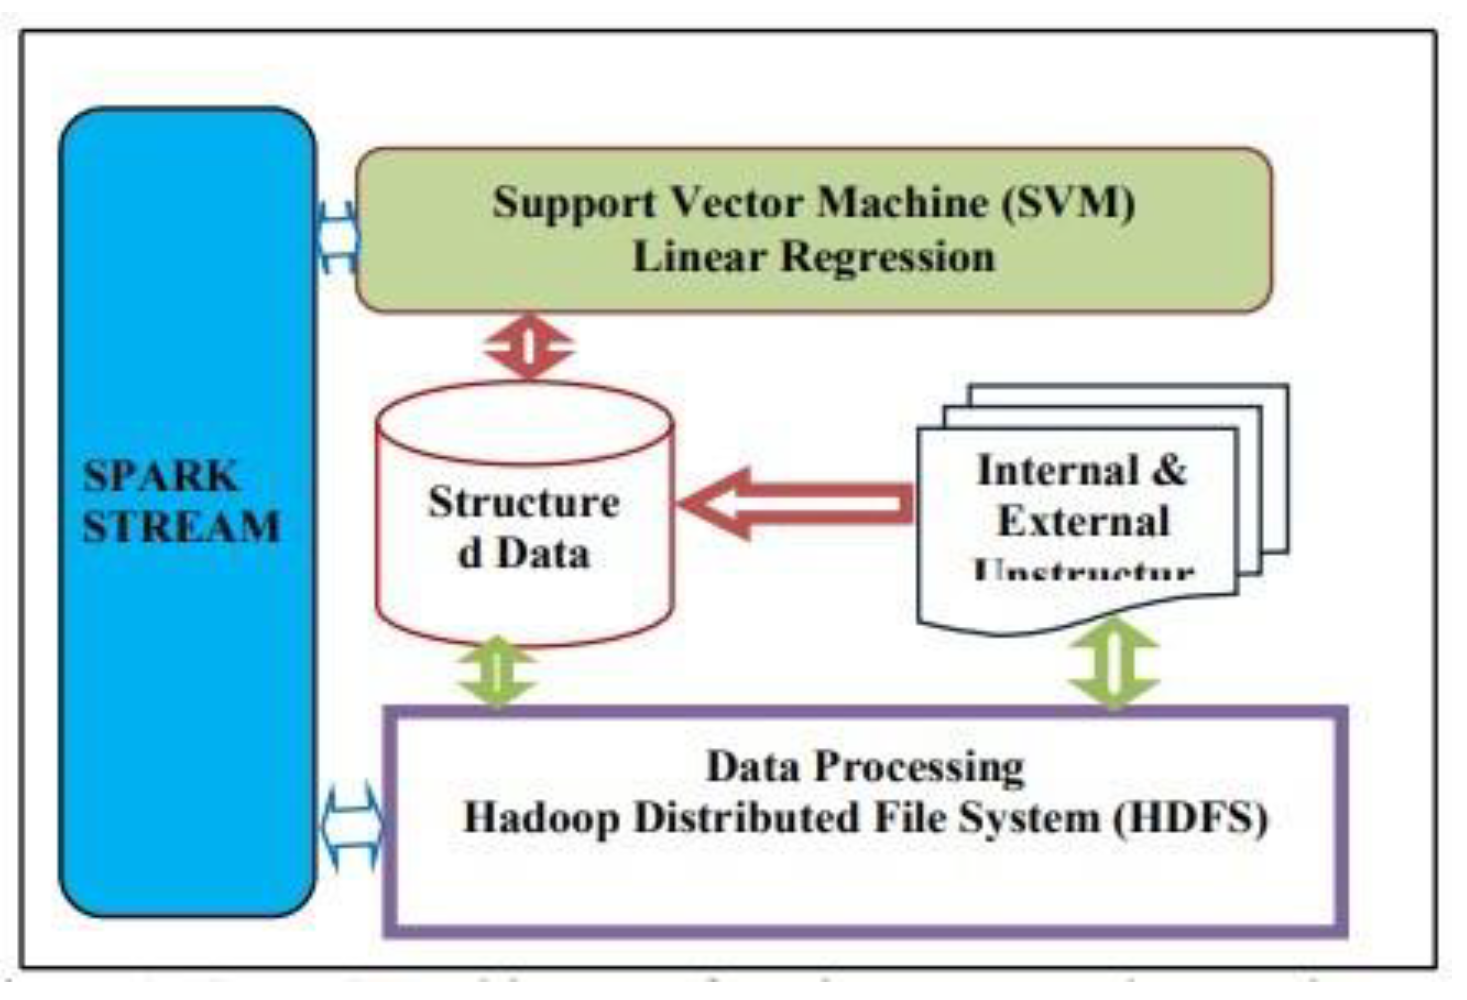
Figure 2.
12: A diagram showing the whole model architecture [68].
Figure 2.
12: A diagram showing the whole model architecture [68].
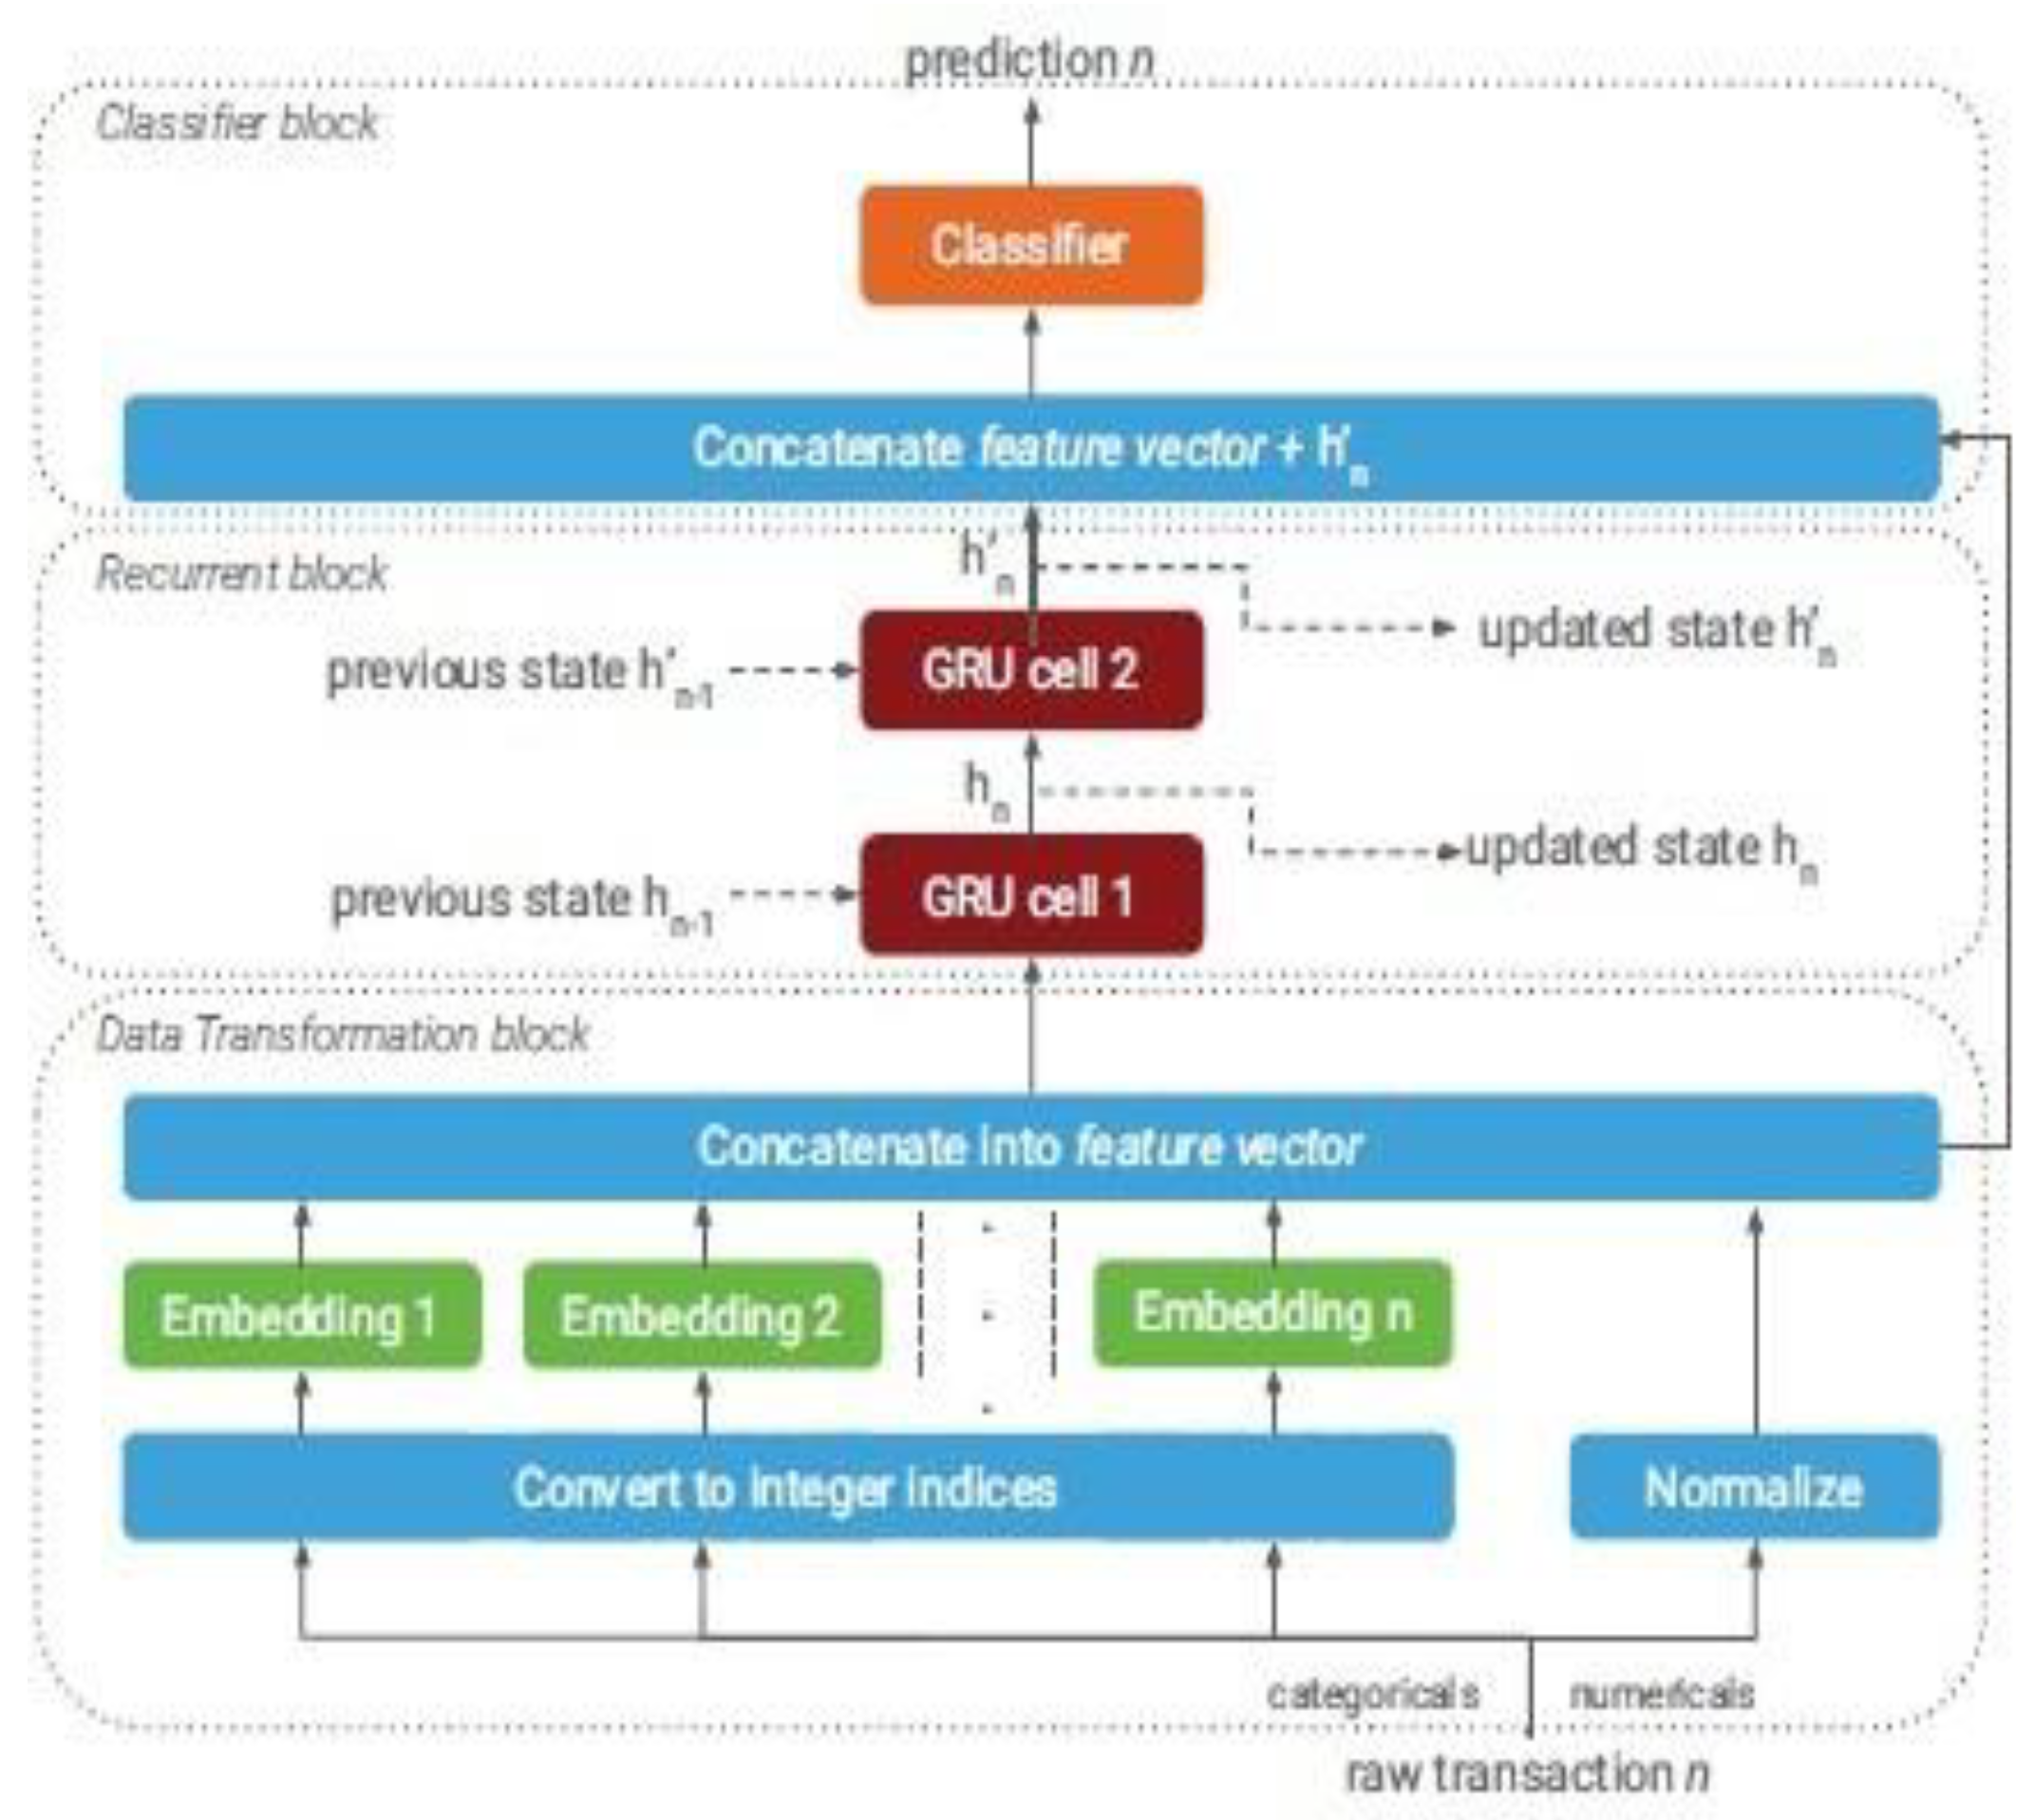
Figure 3.
1: Overview of the proposed framework for payment card fraud detection.
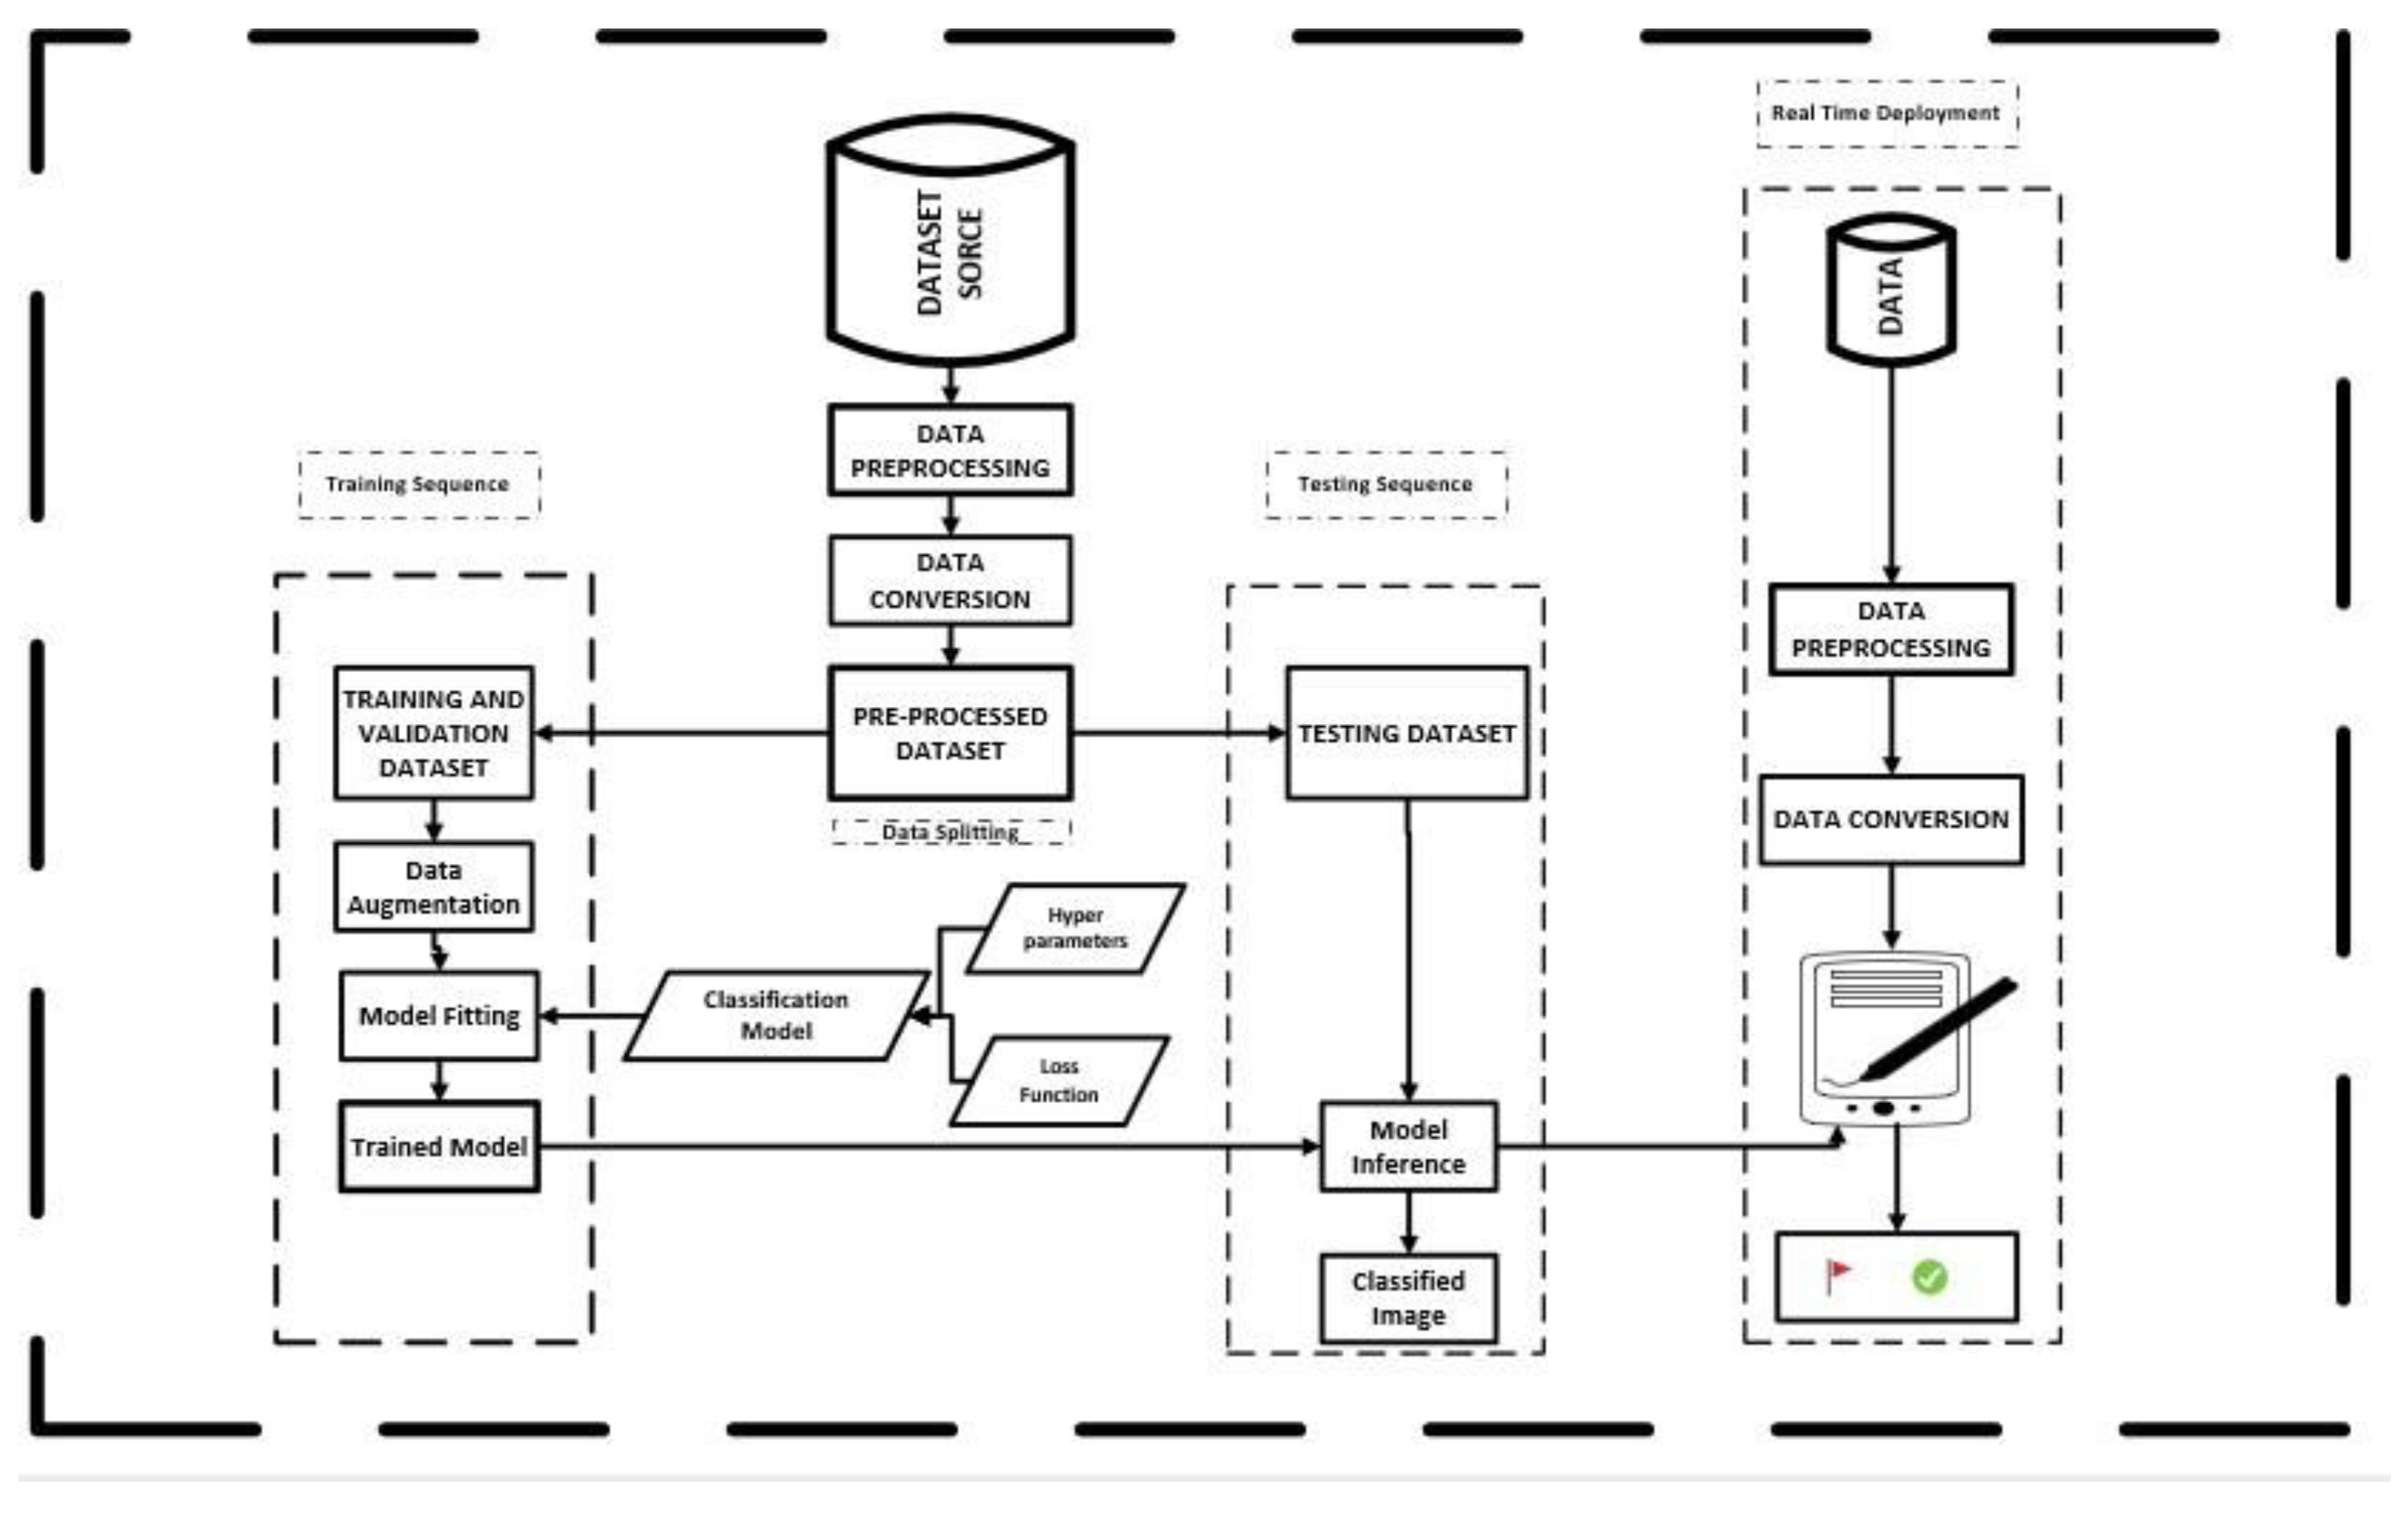
Figure 3.
2: Conversion of CSV datasets to Quick Response Code.
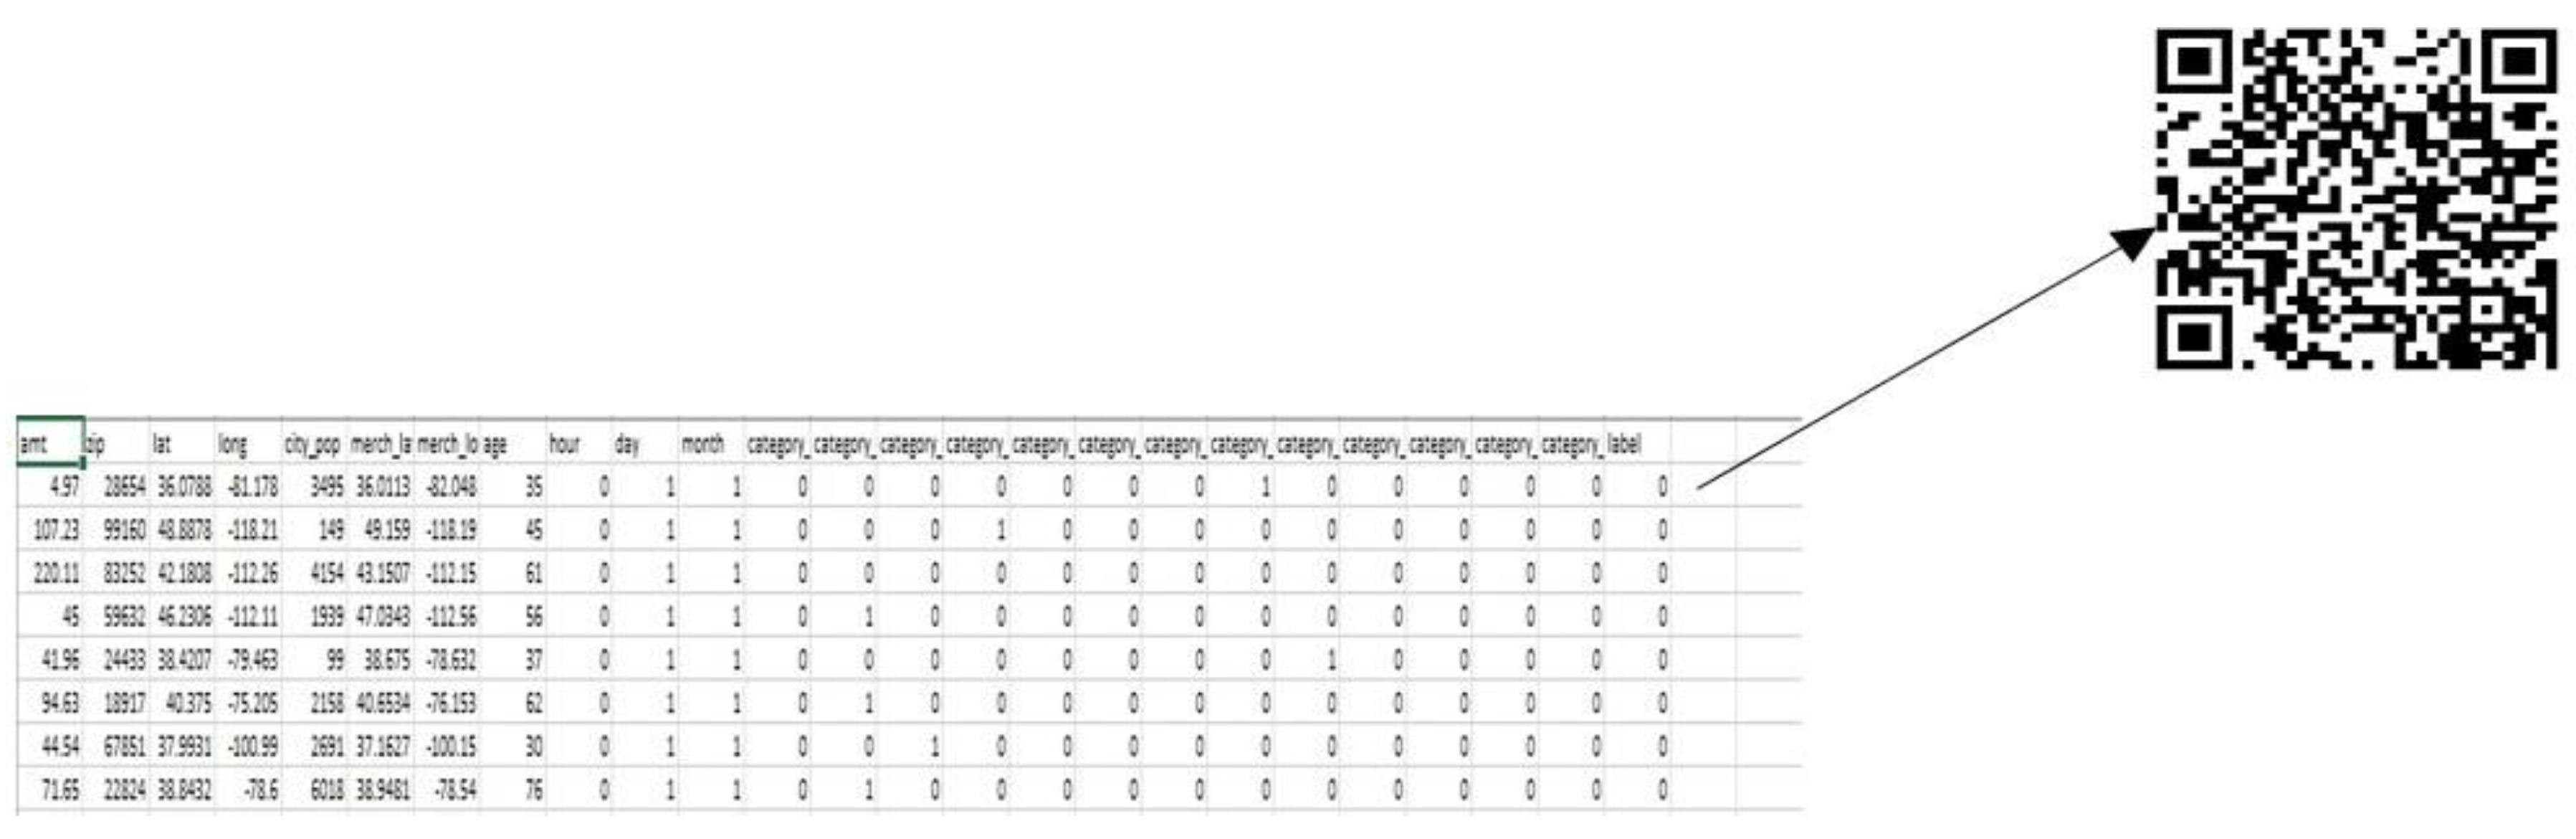
Figure 3.
3: Residual network architecture [76].
Figure 3.
3: Residual network architecture [76].
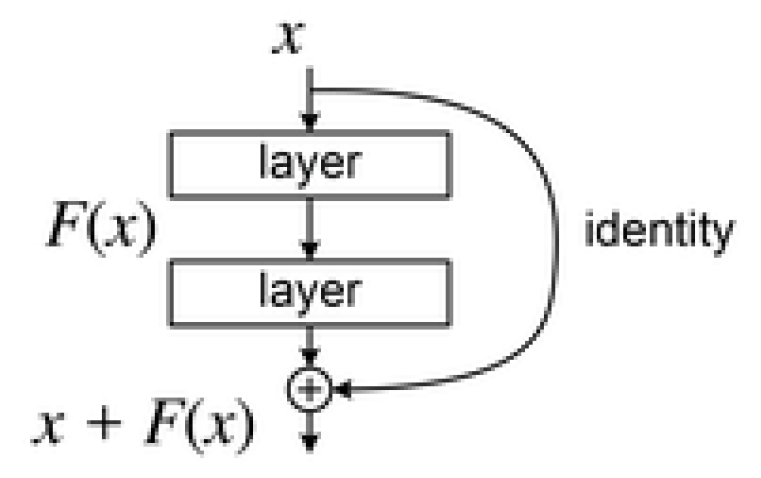
Figure 4.
3: Relationship between amount and fraud.
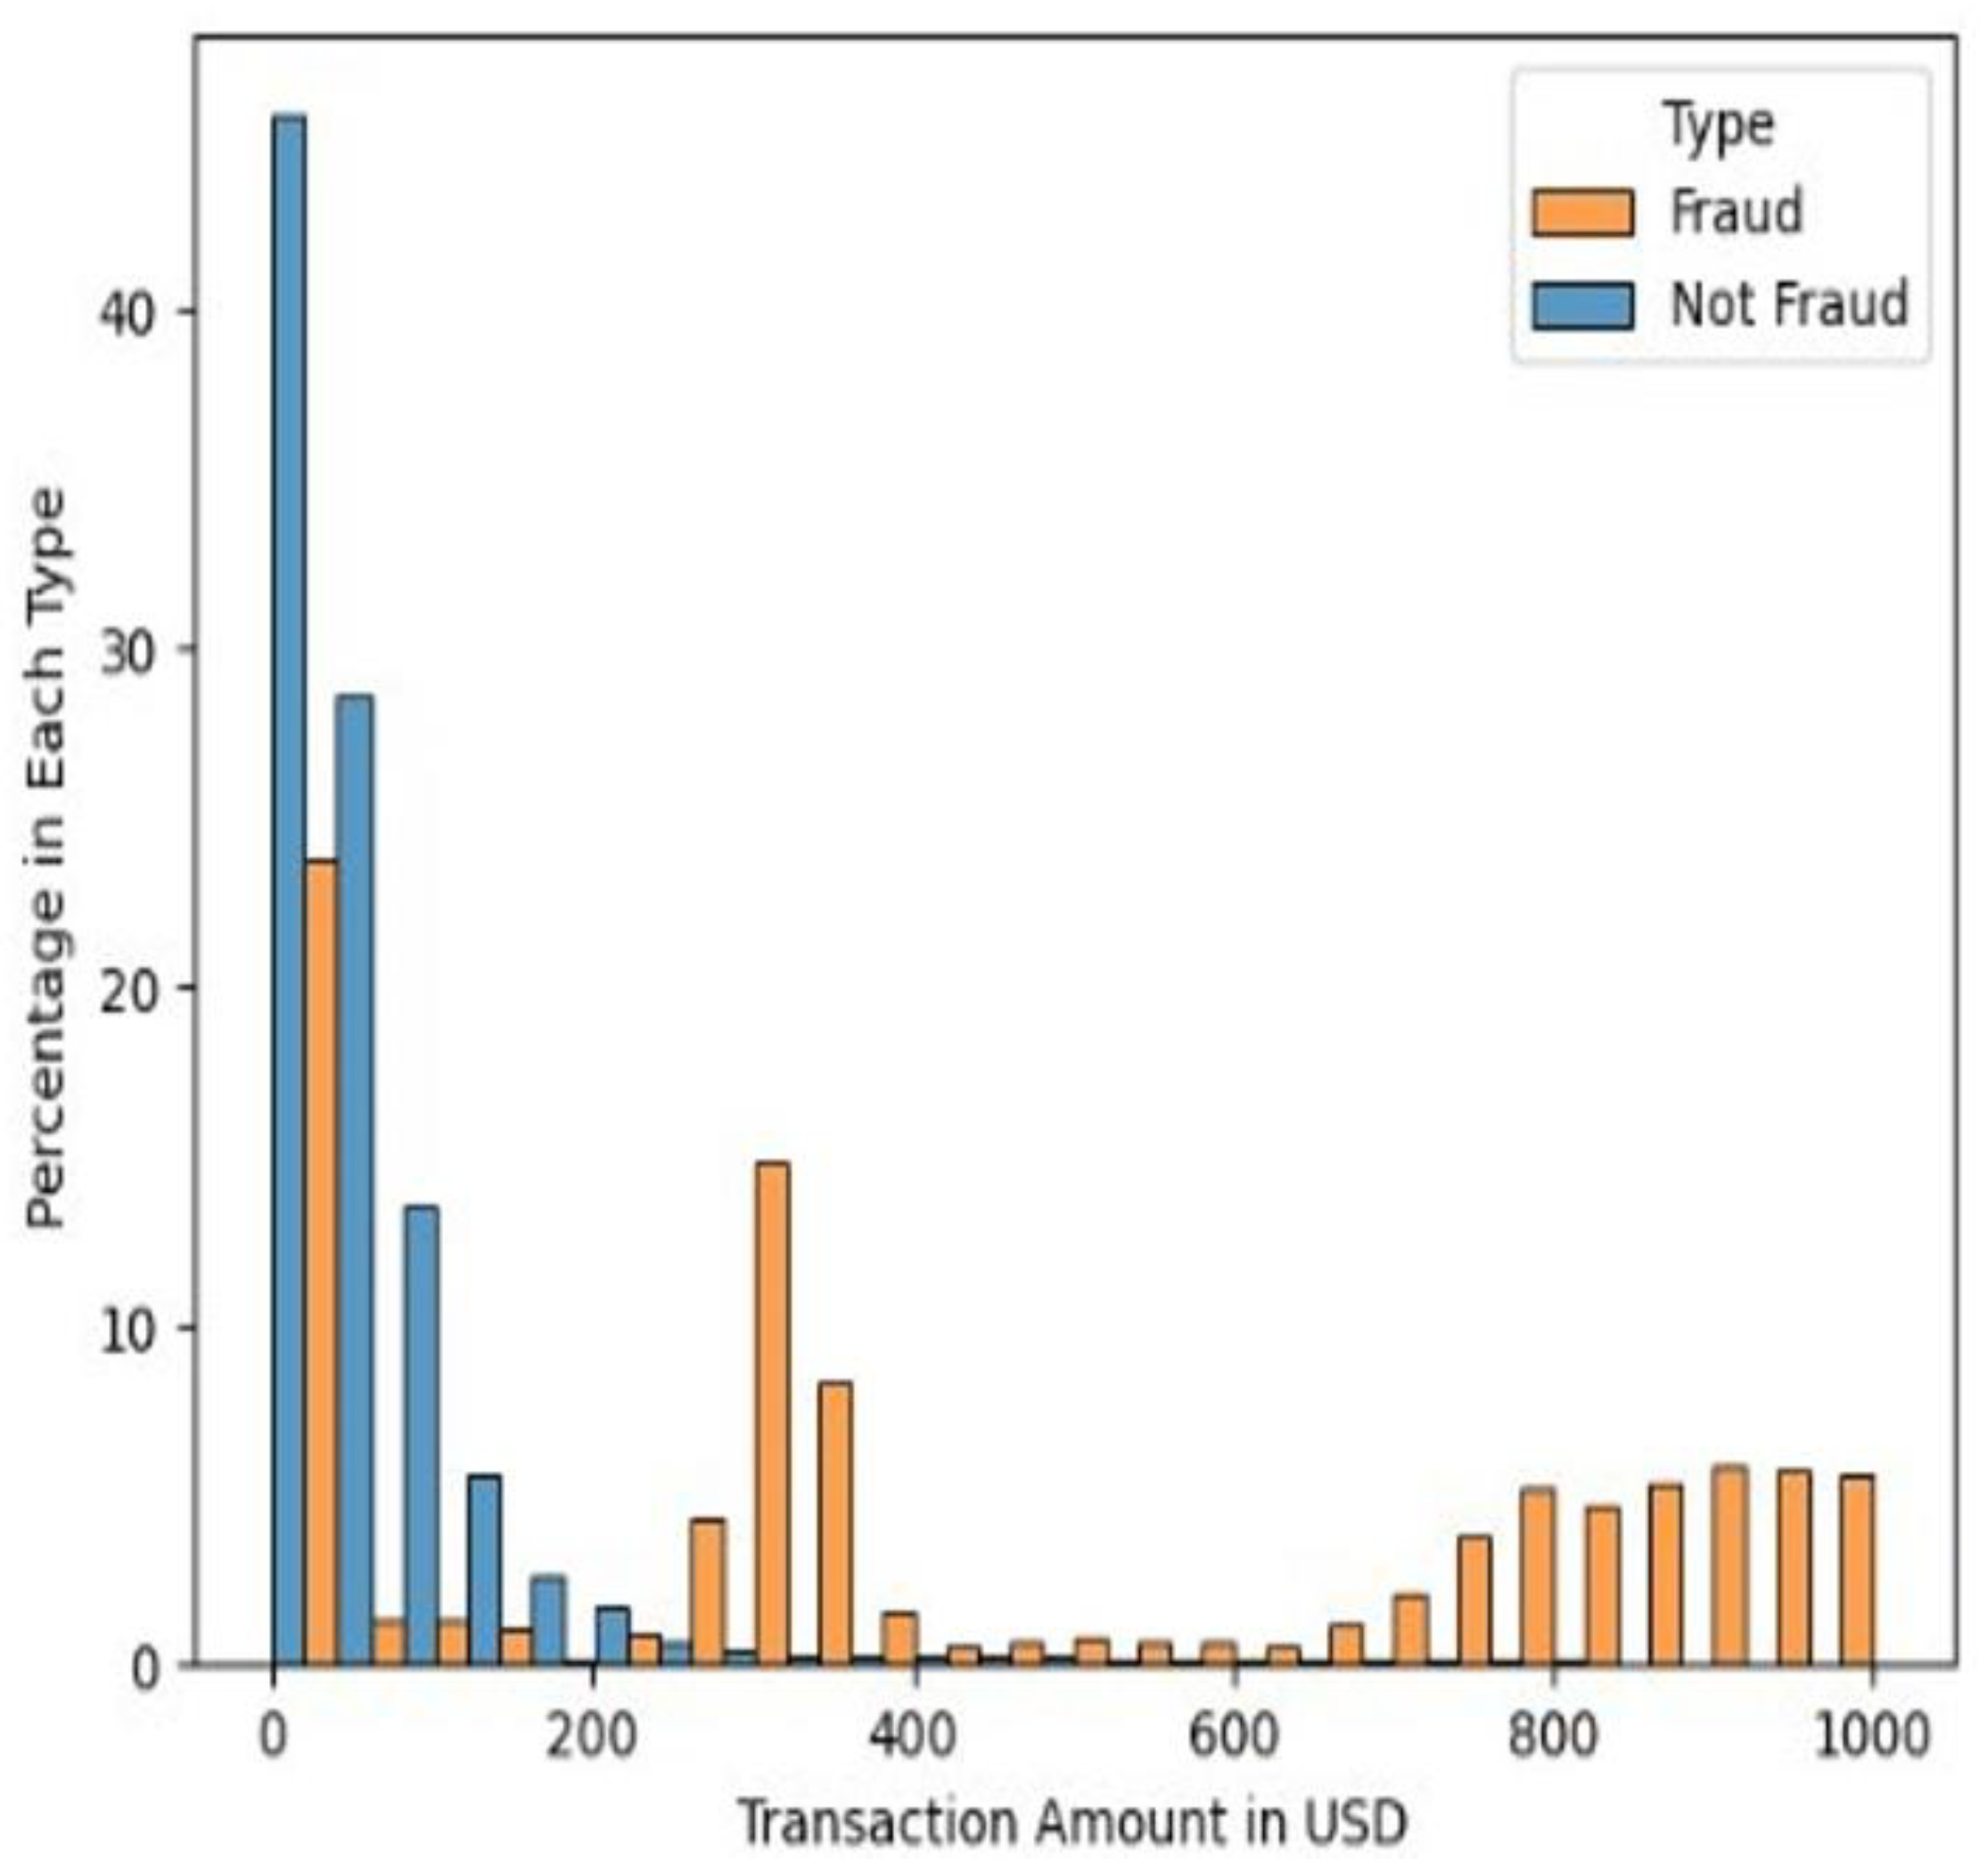
Figure 4.
4: Relationship between gender and fraud.
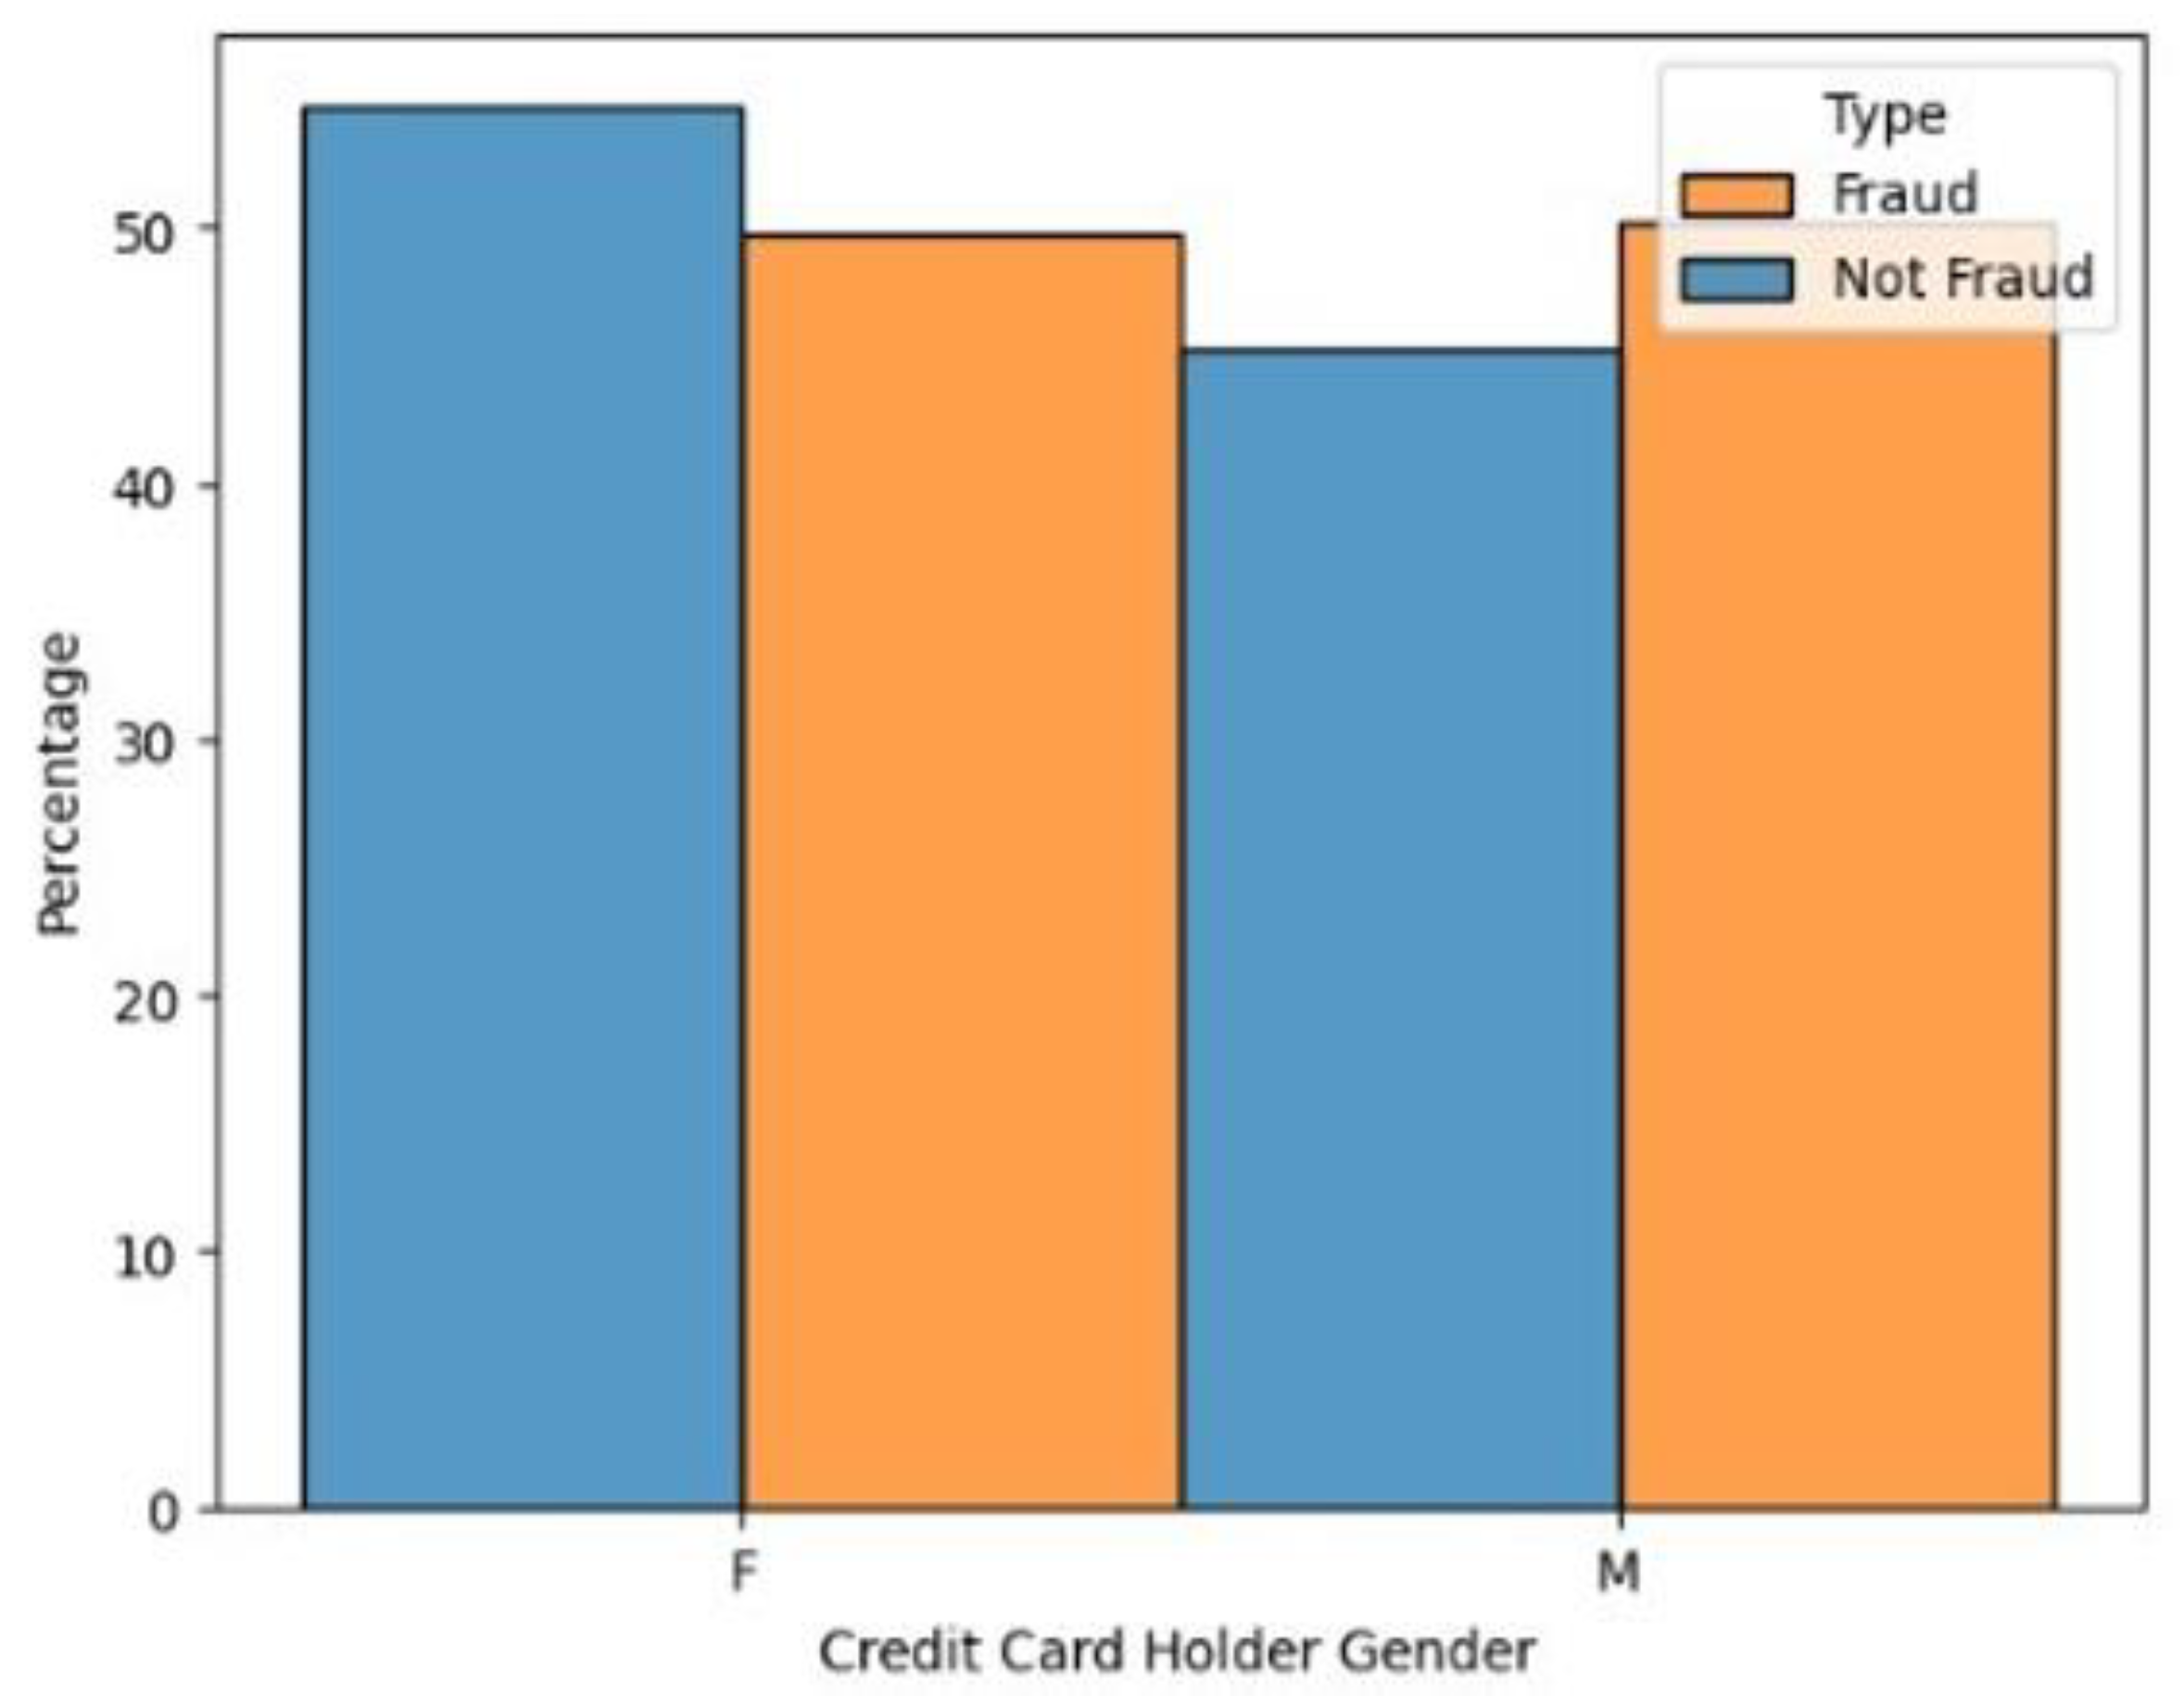
Figure 4.
5: Relationship between ages of cardholder and fraudulence events.
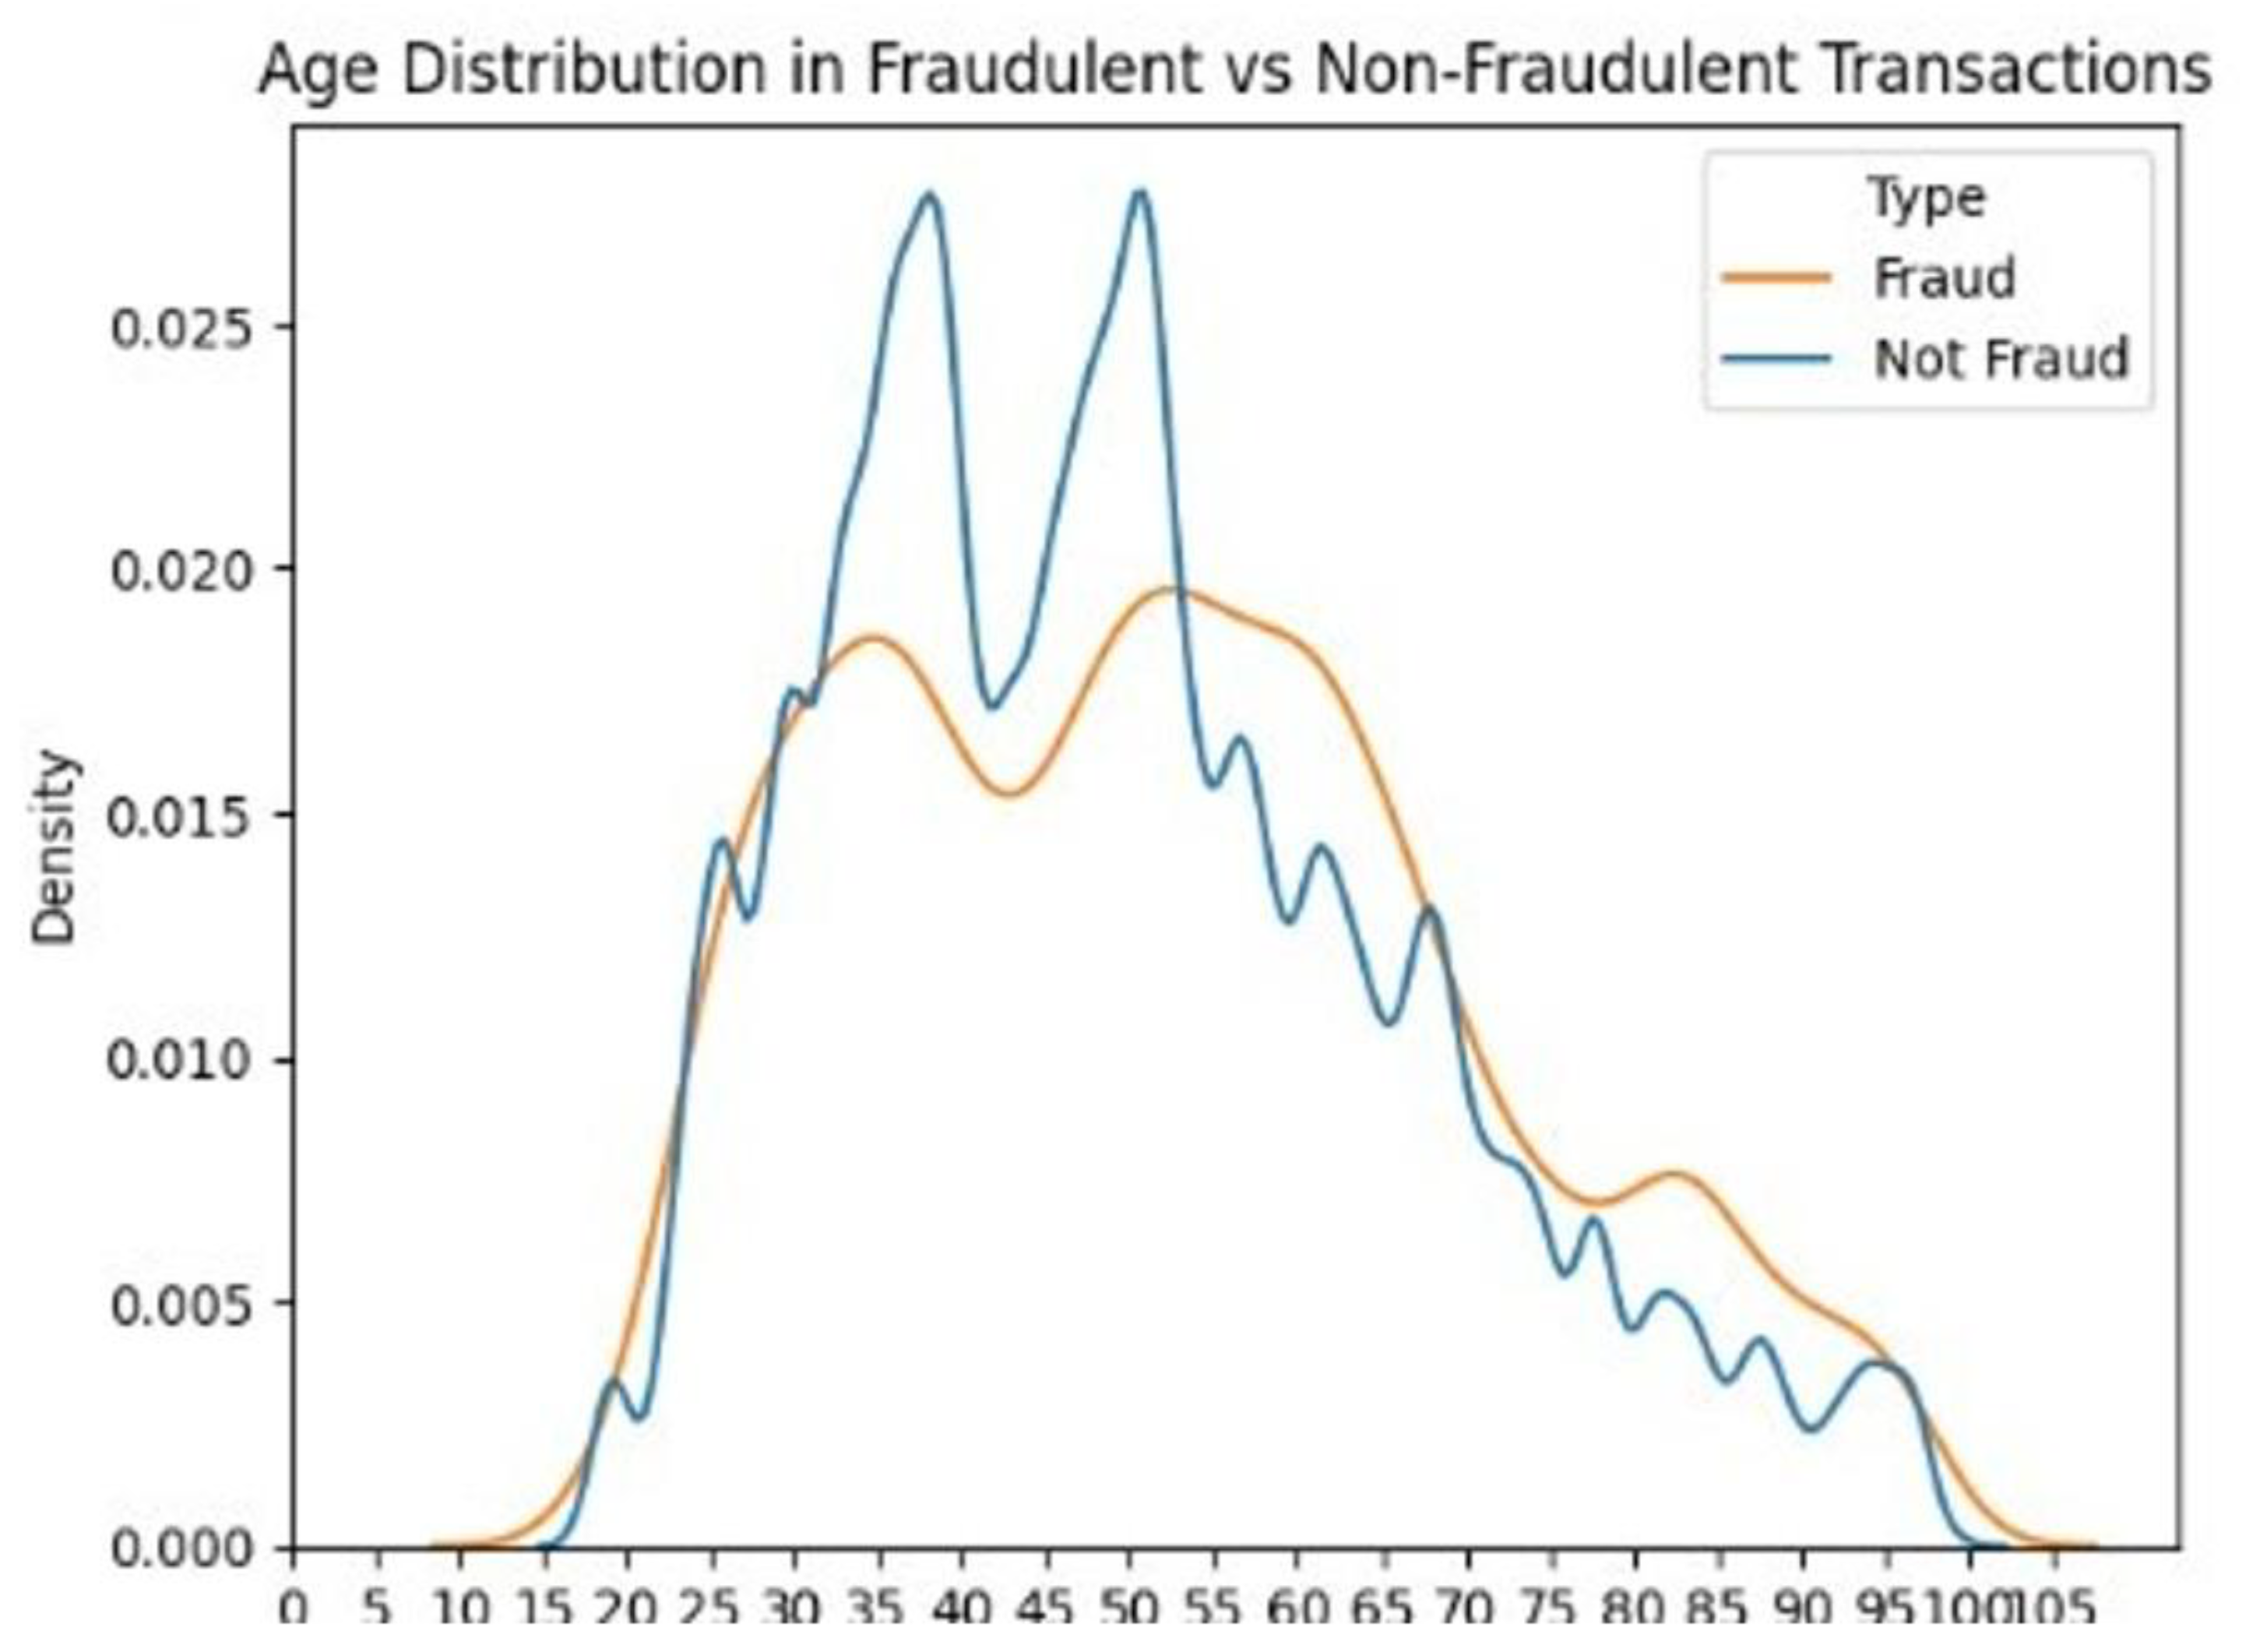
Figure 4.
6: Data Balancing operation.
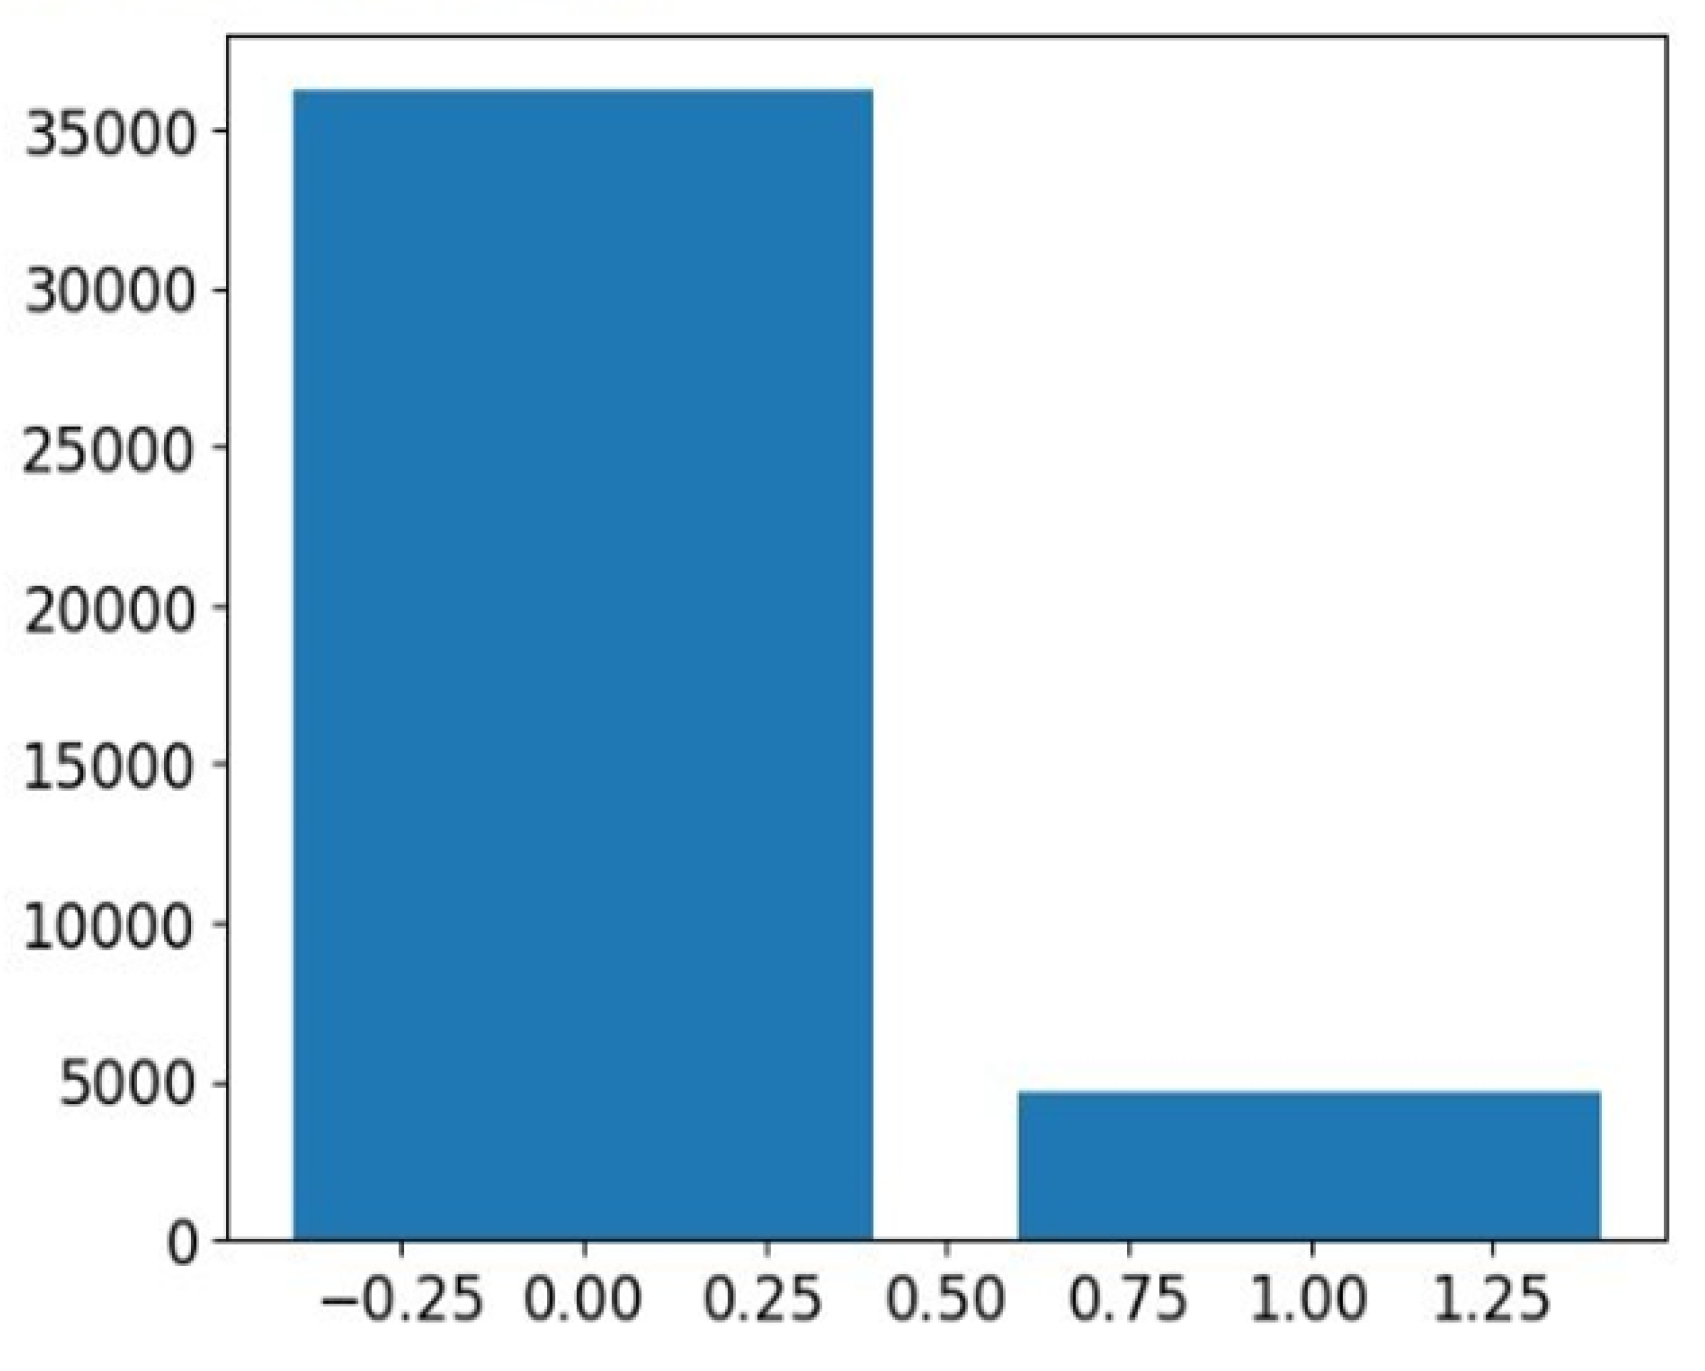
Figure 4.
14: Accuracy and loss plot for Over-sampling.
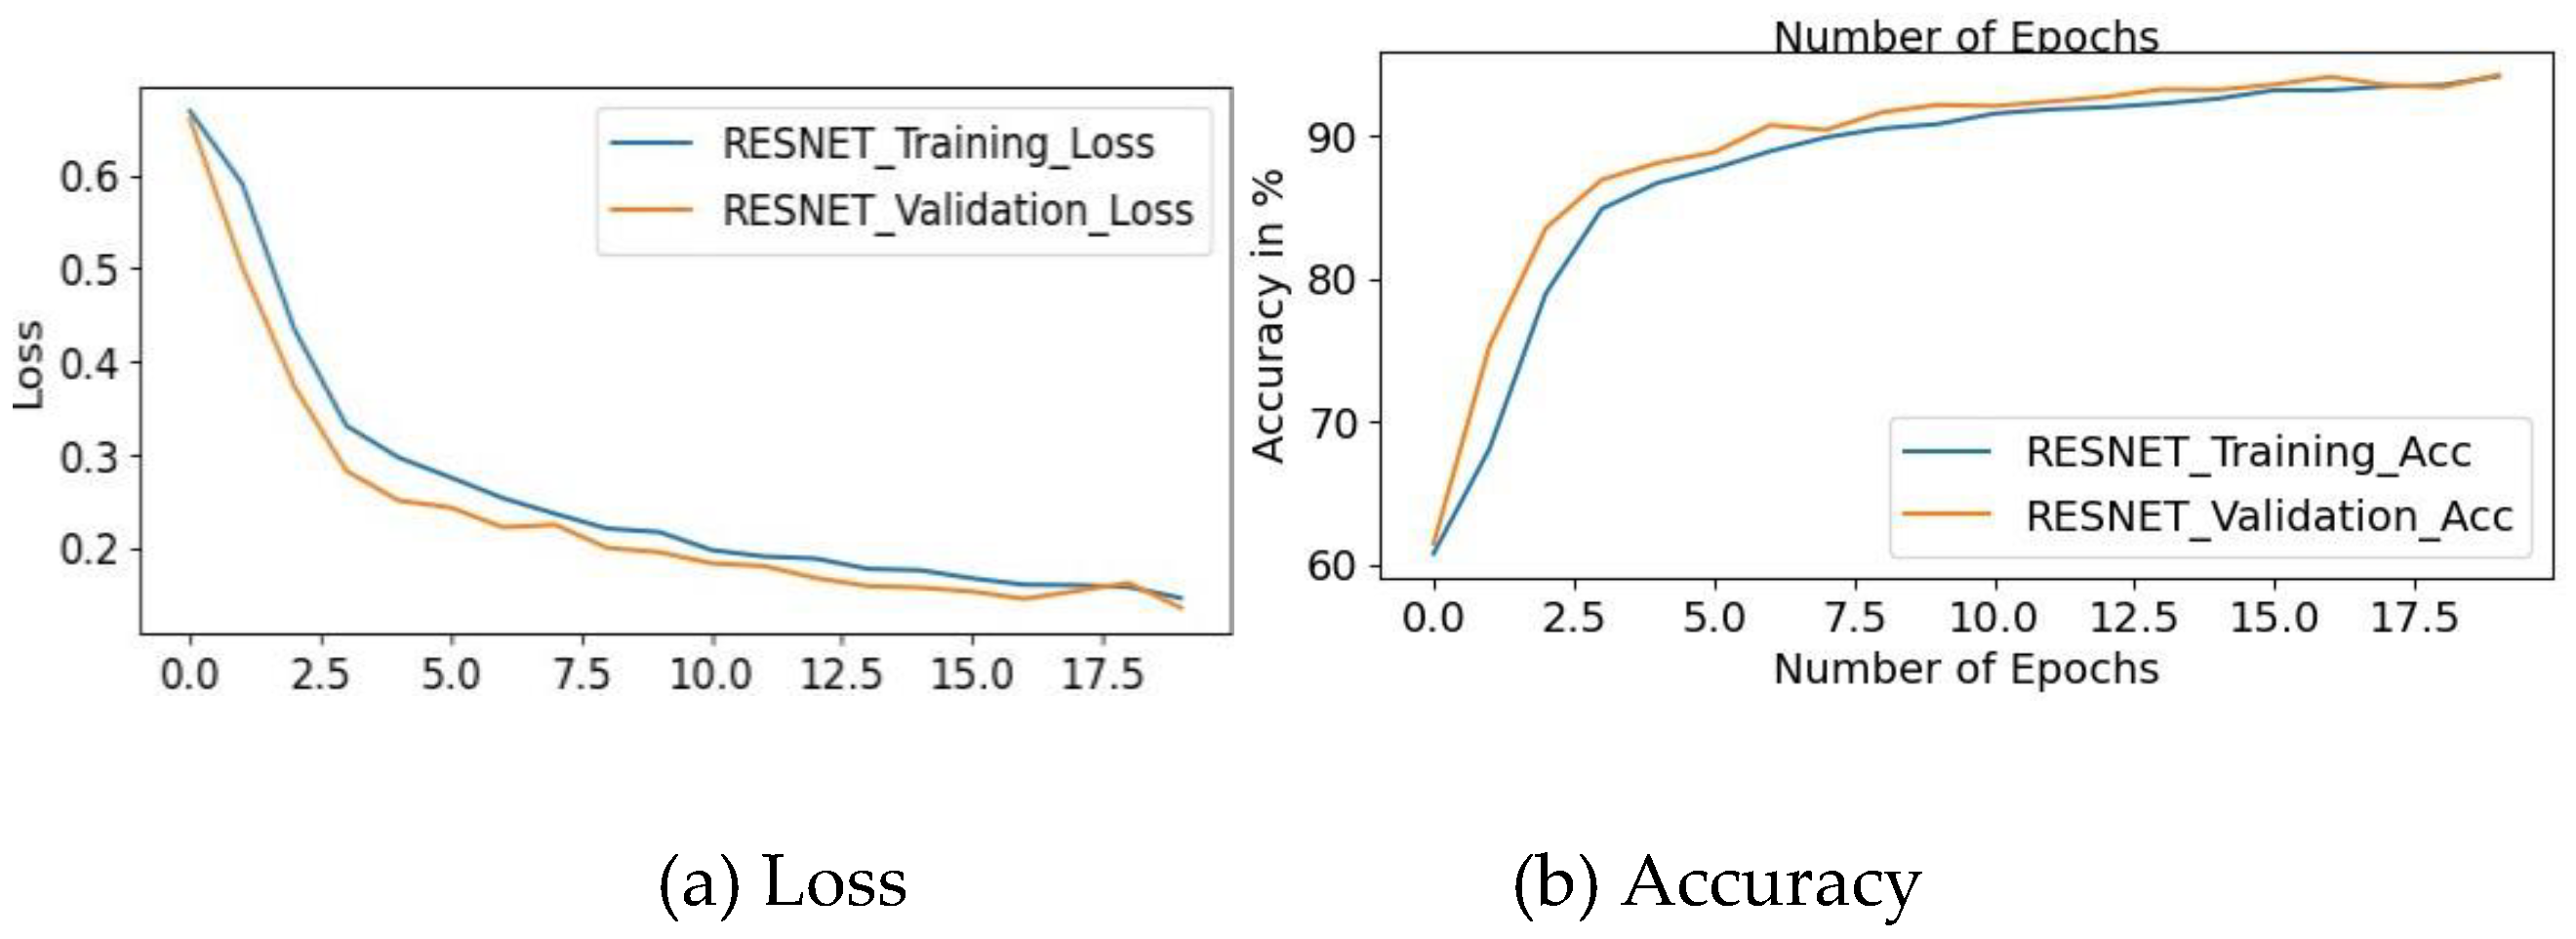
Figure 4.
15: Accuracy and loss plot for Under-sampling.
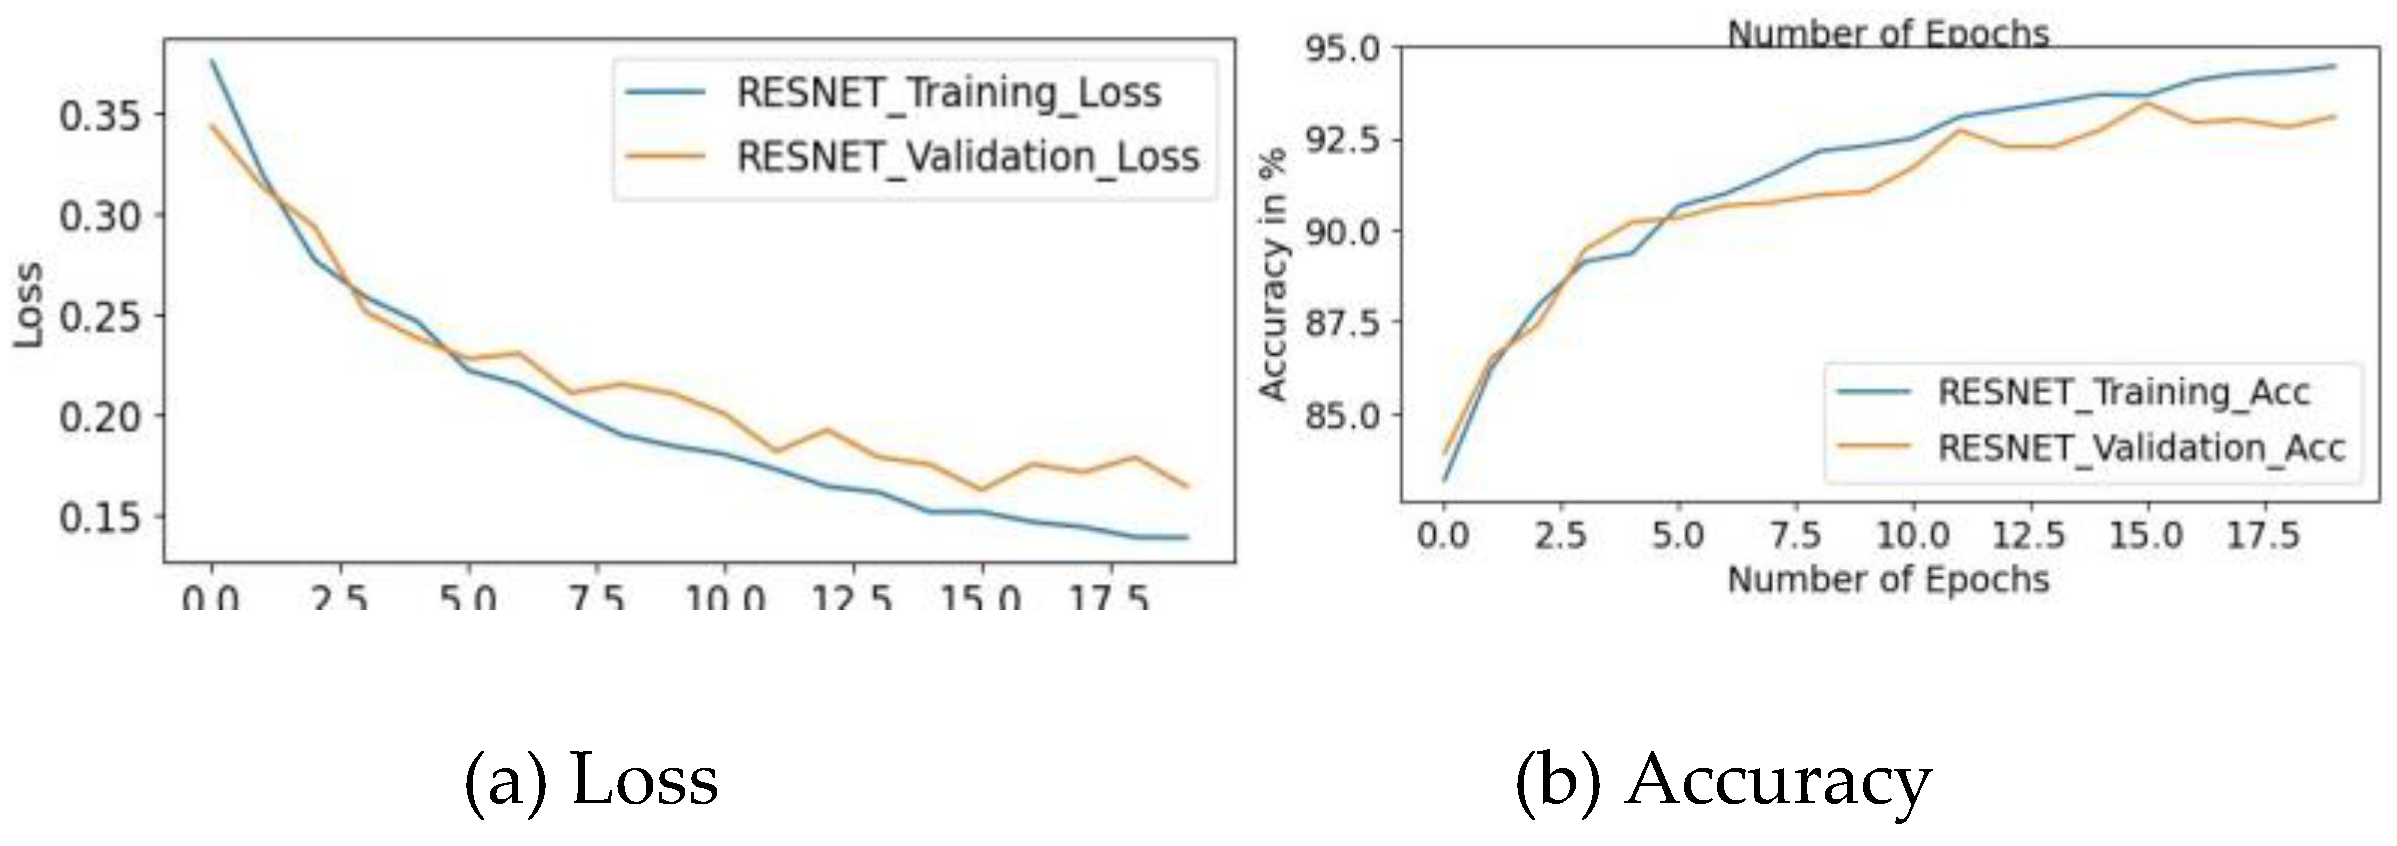
Figure 4.
16: Confusion Matrix for Over-sampling data balancing technique SMOTE.
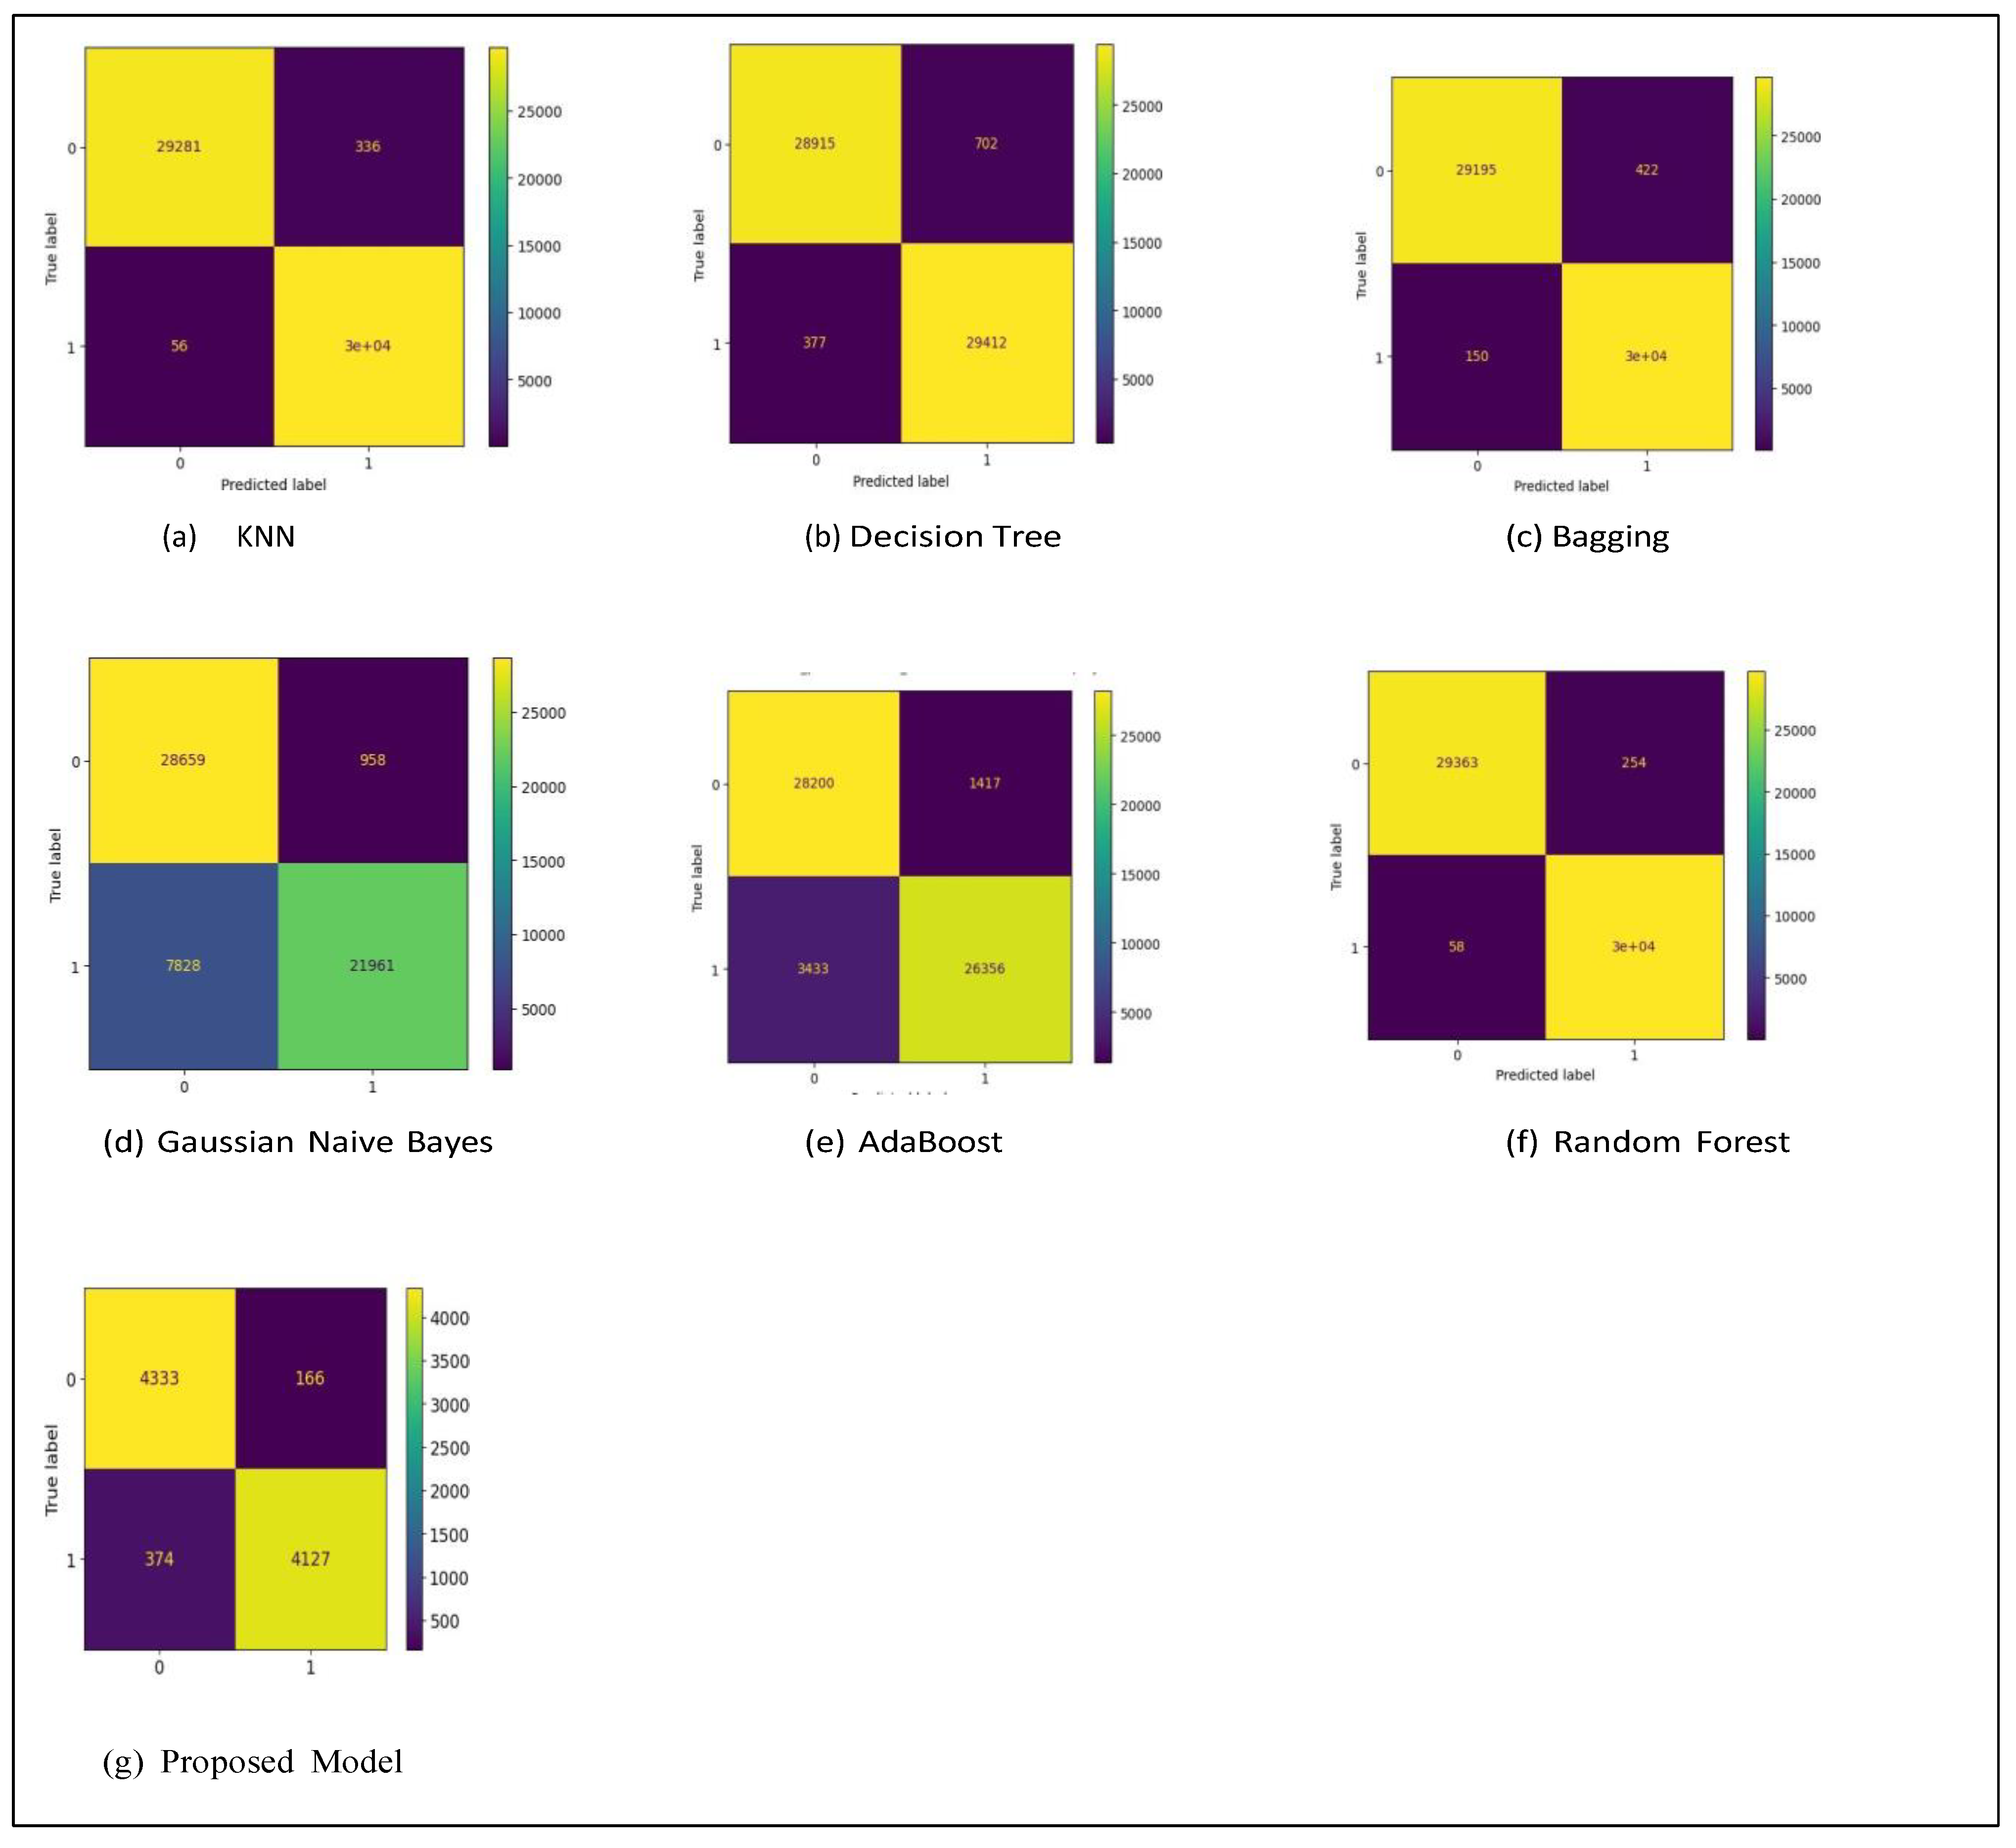
Figure 4.
17: Classification Reports for Over-sampling data balancing technique SMOTE.
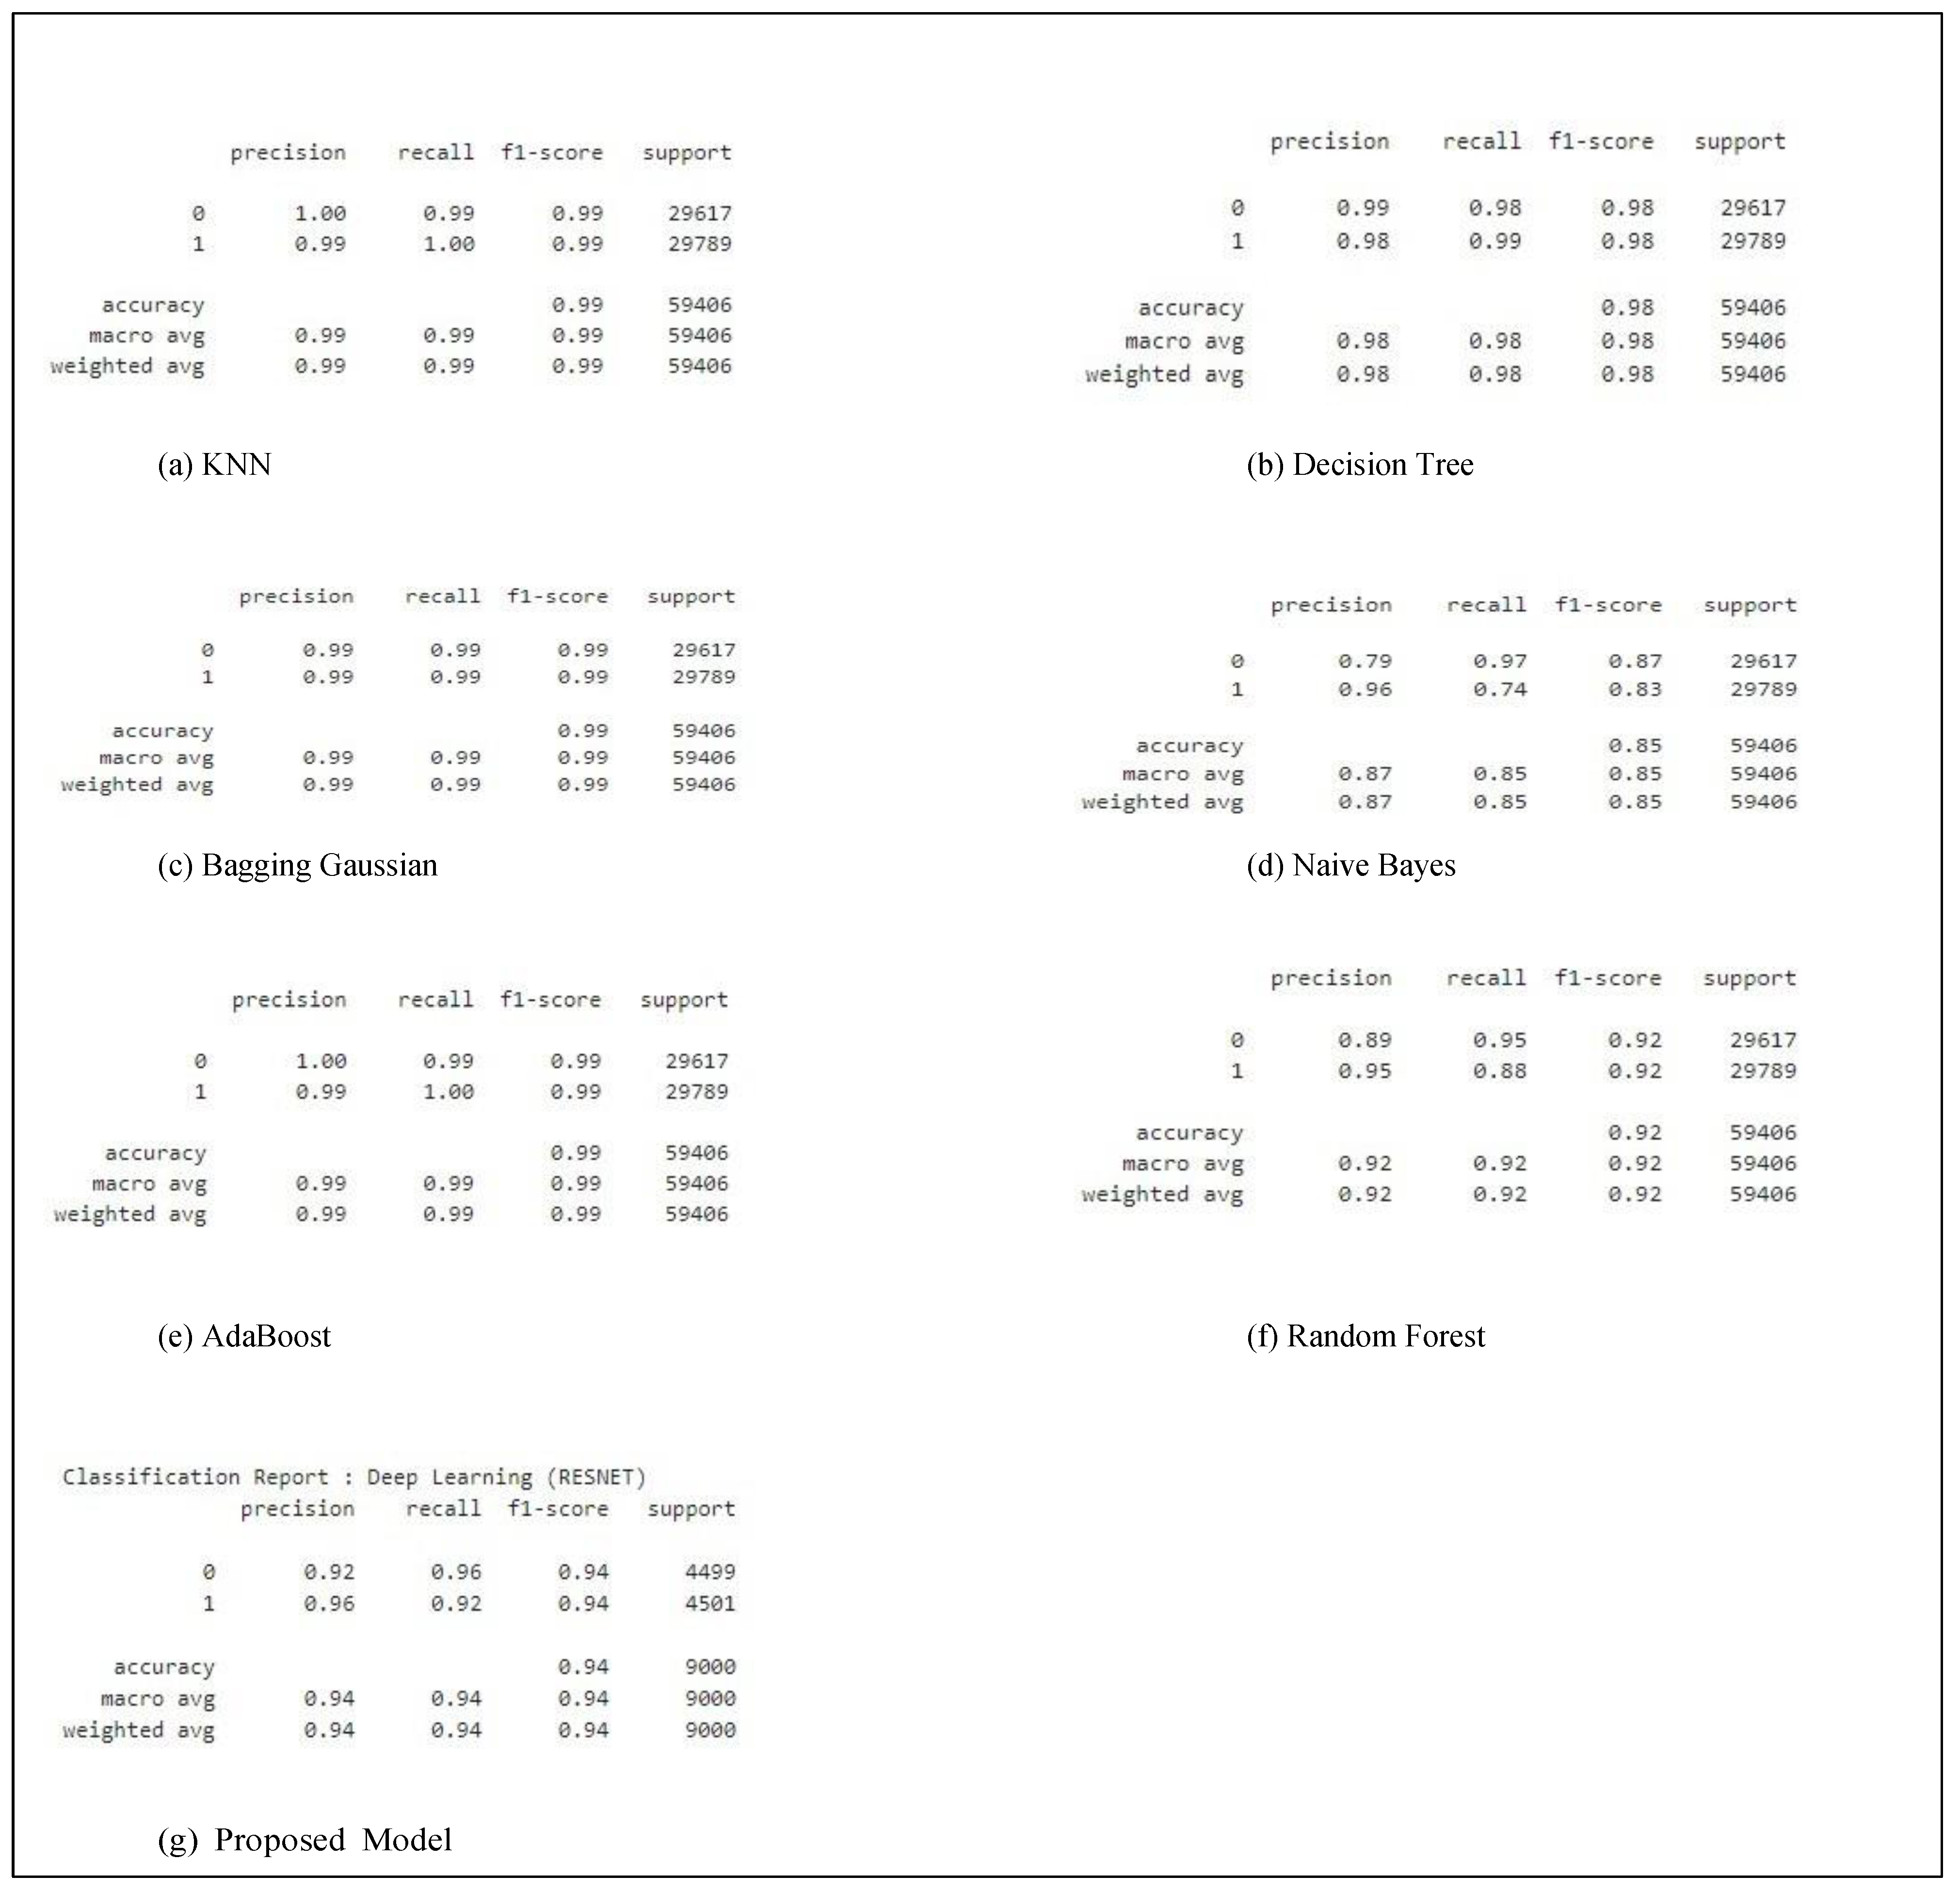
Figure 4.
18: Receiver Operating Curve for Over-sampling data balancing technique SMOTE.
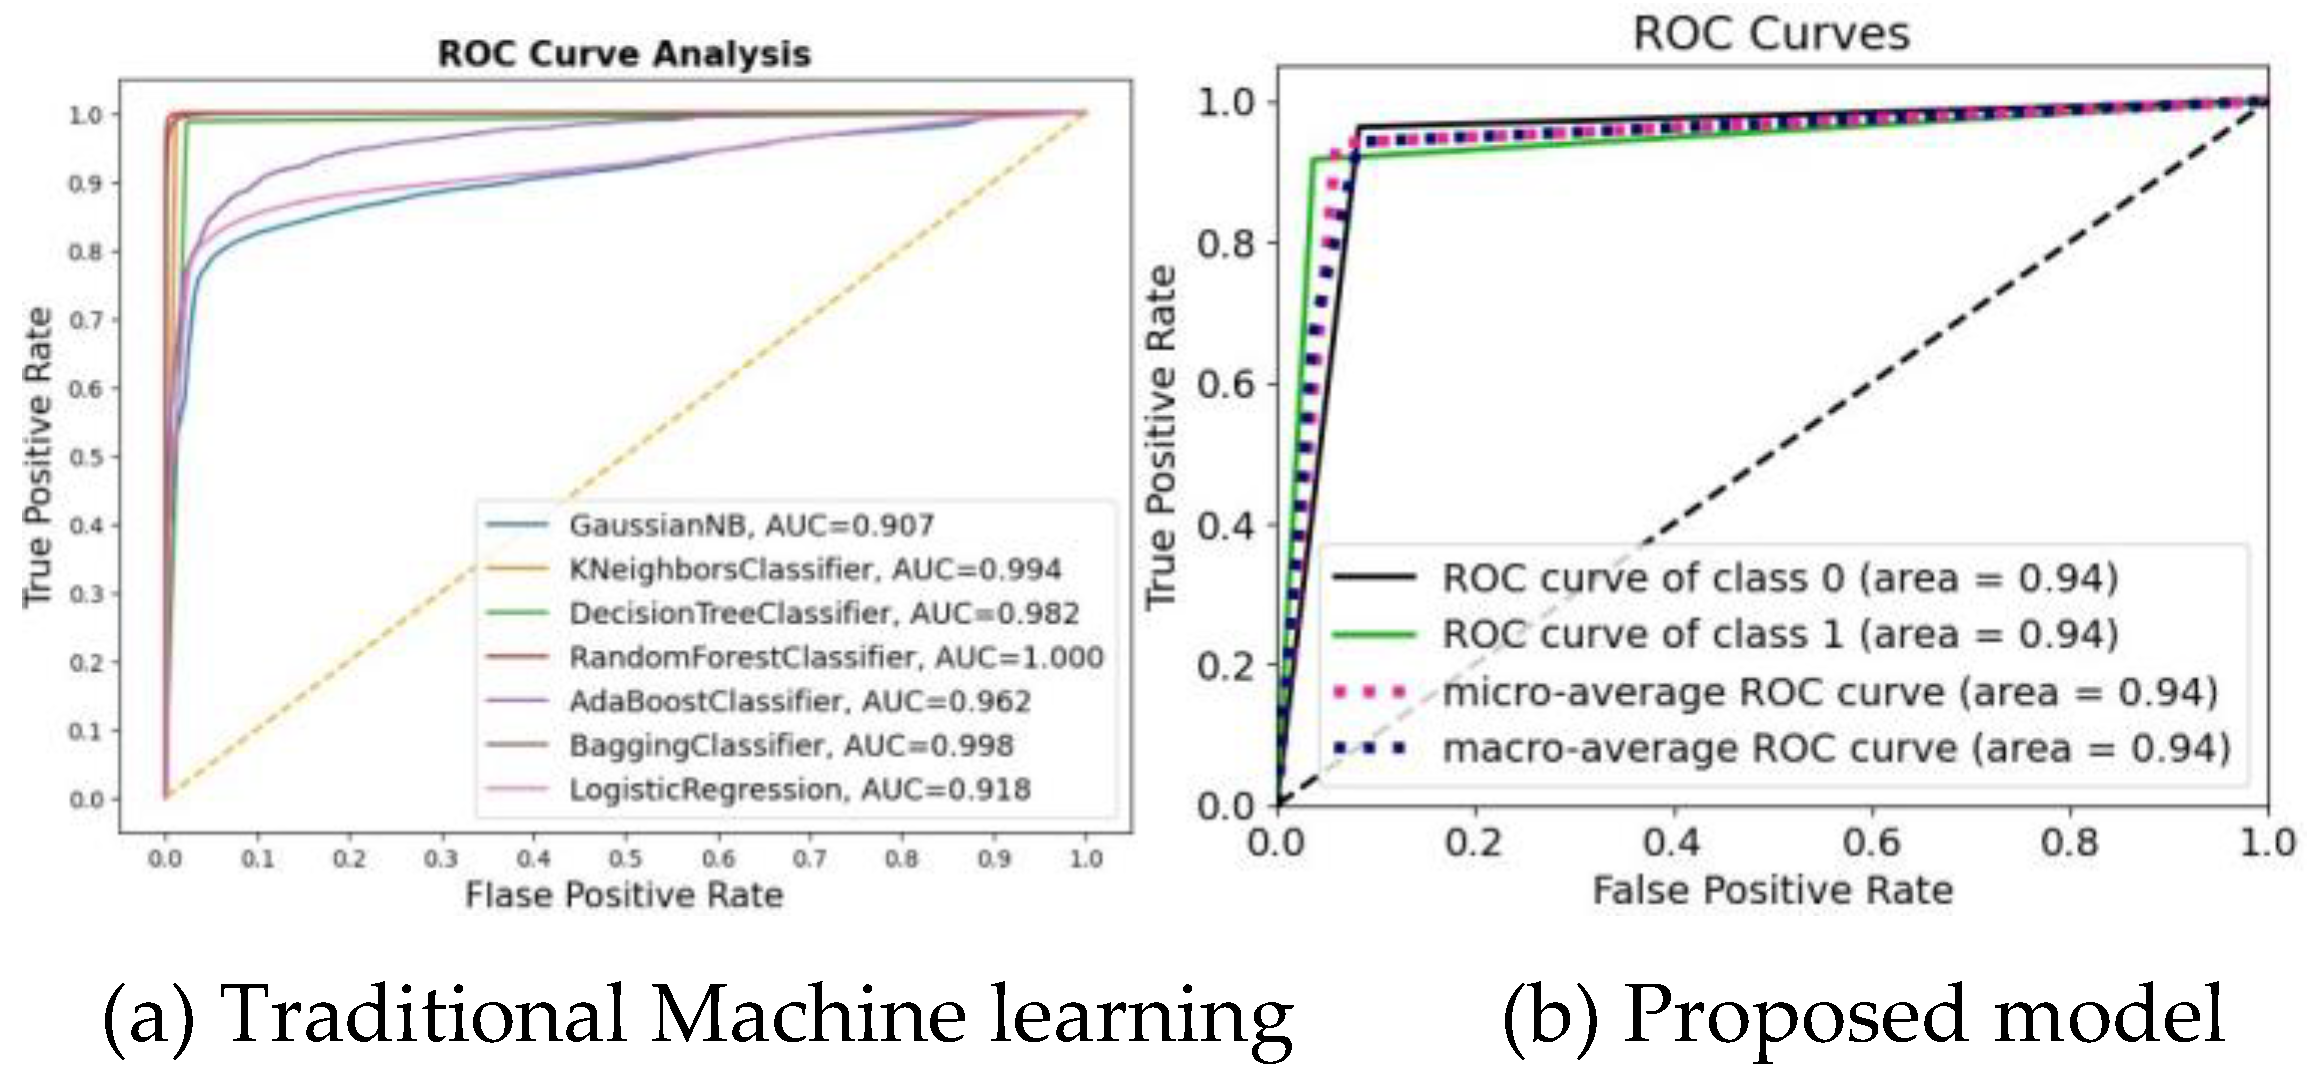
Figure 4.
19: Confusion Matrix for Under-sampling data balancing technique (Random Under sampling).
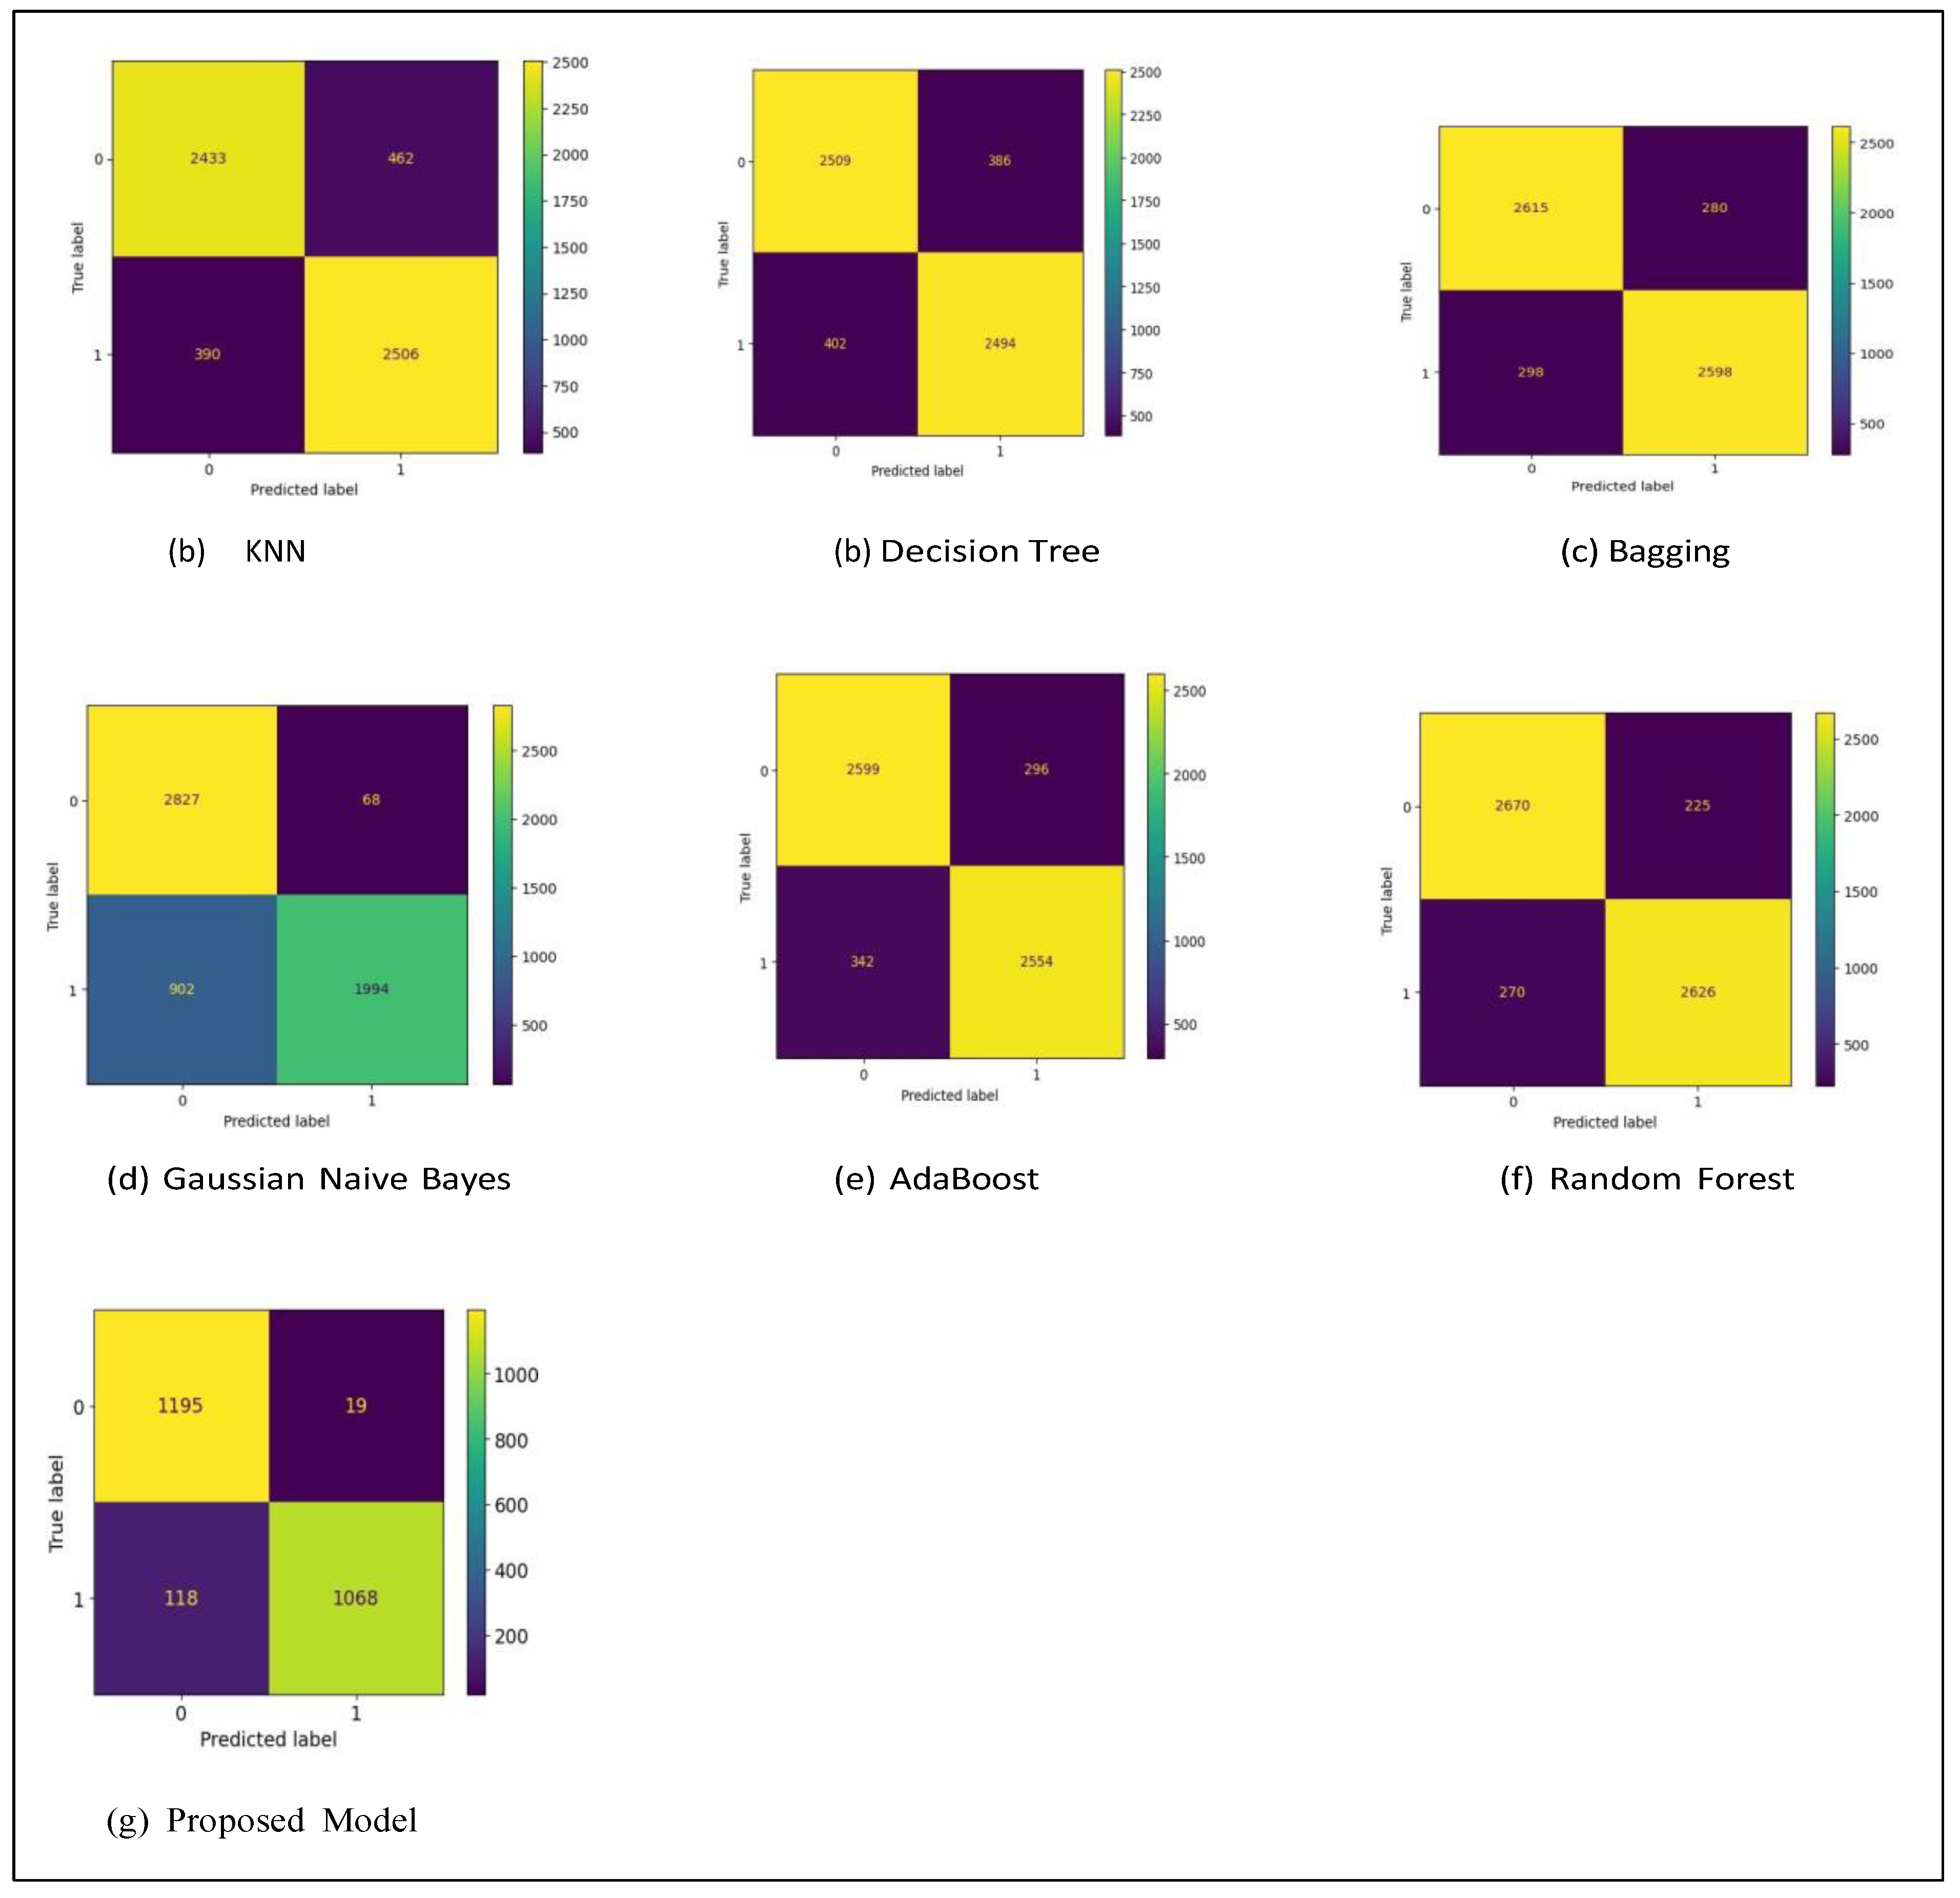
Figure 4.
20: Classification Reports for Under-sampling data balancing technique (Random Under sampling).
Figure 4.
20: Classification Reports for Under-sampling data balancing technique (Random Under sampling).
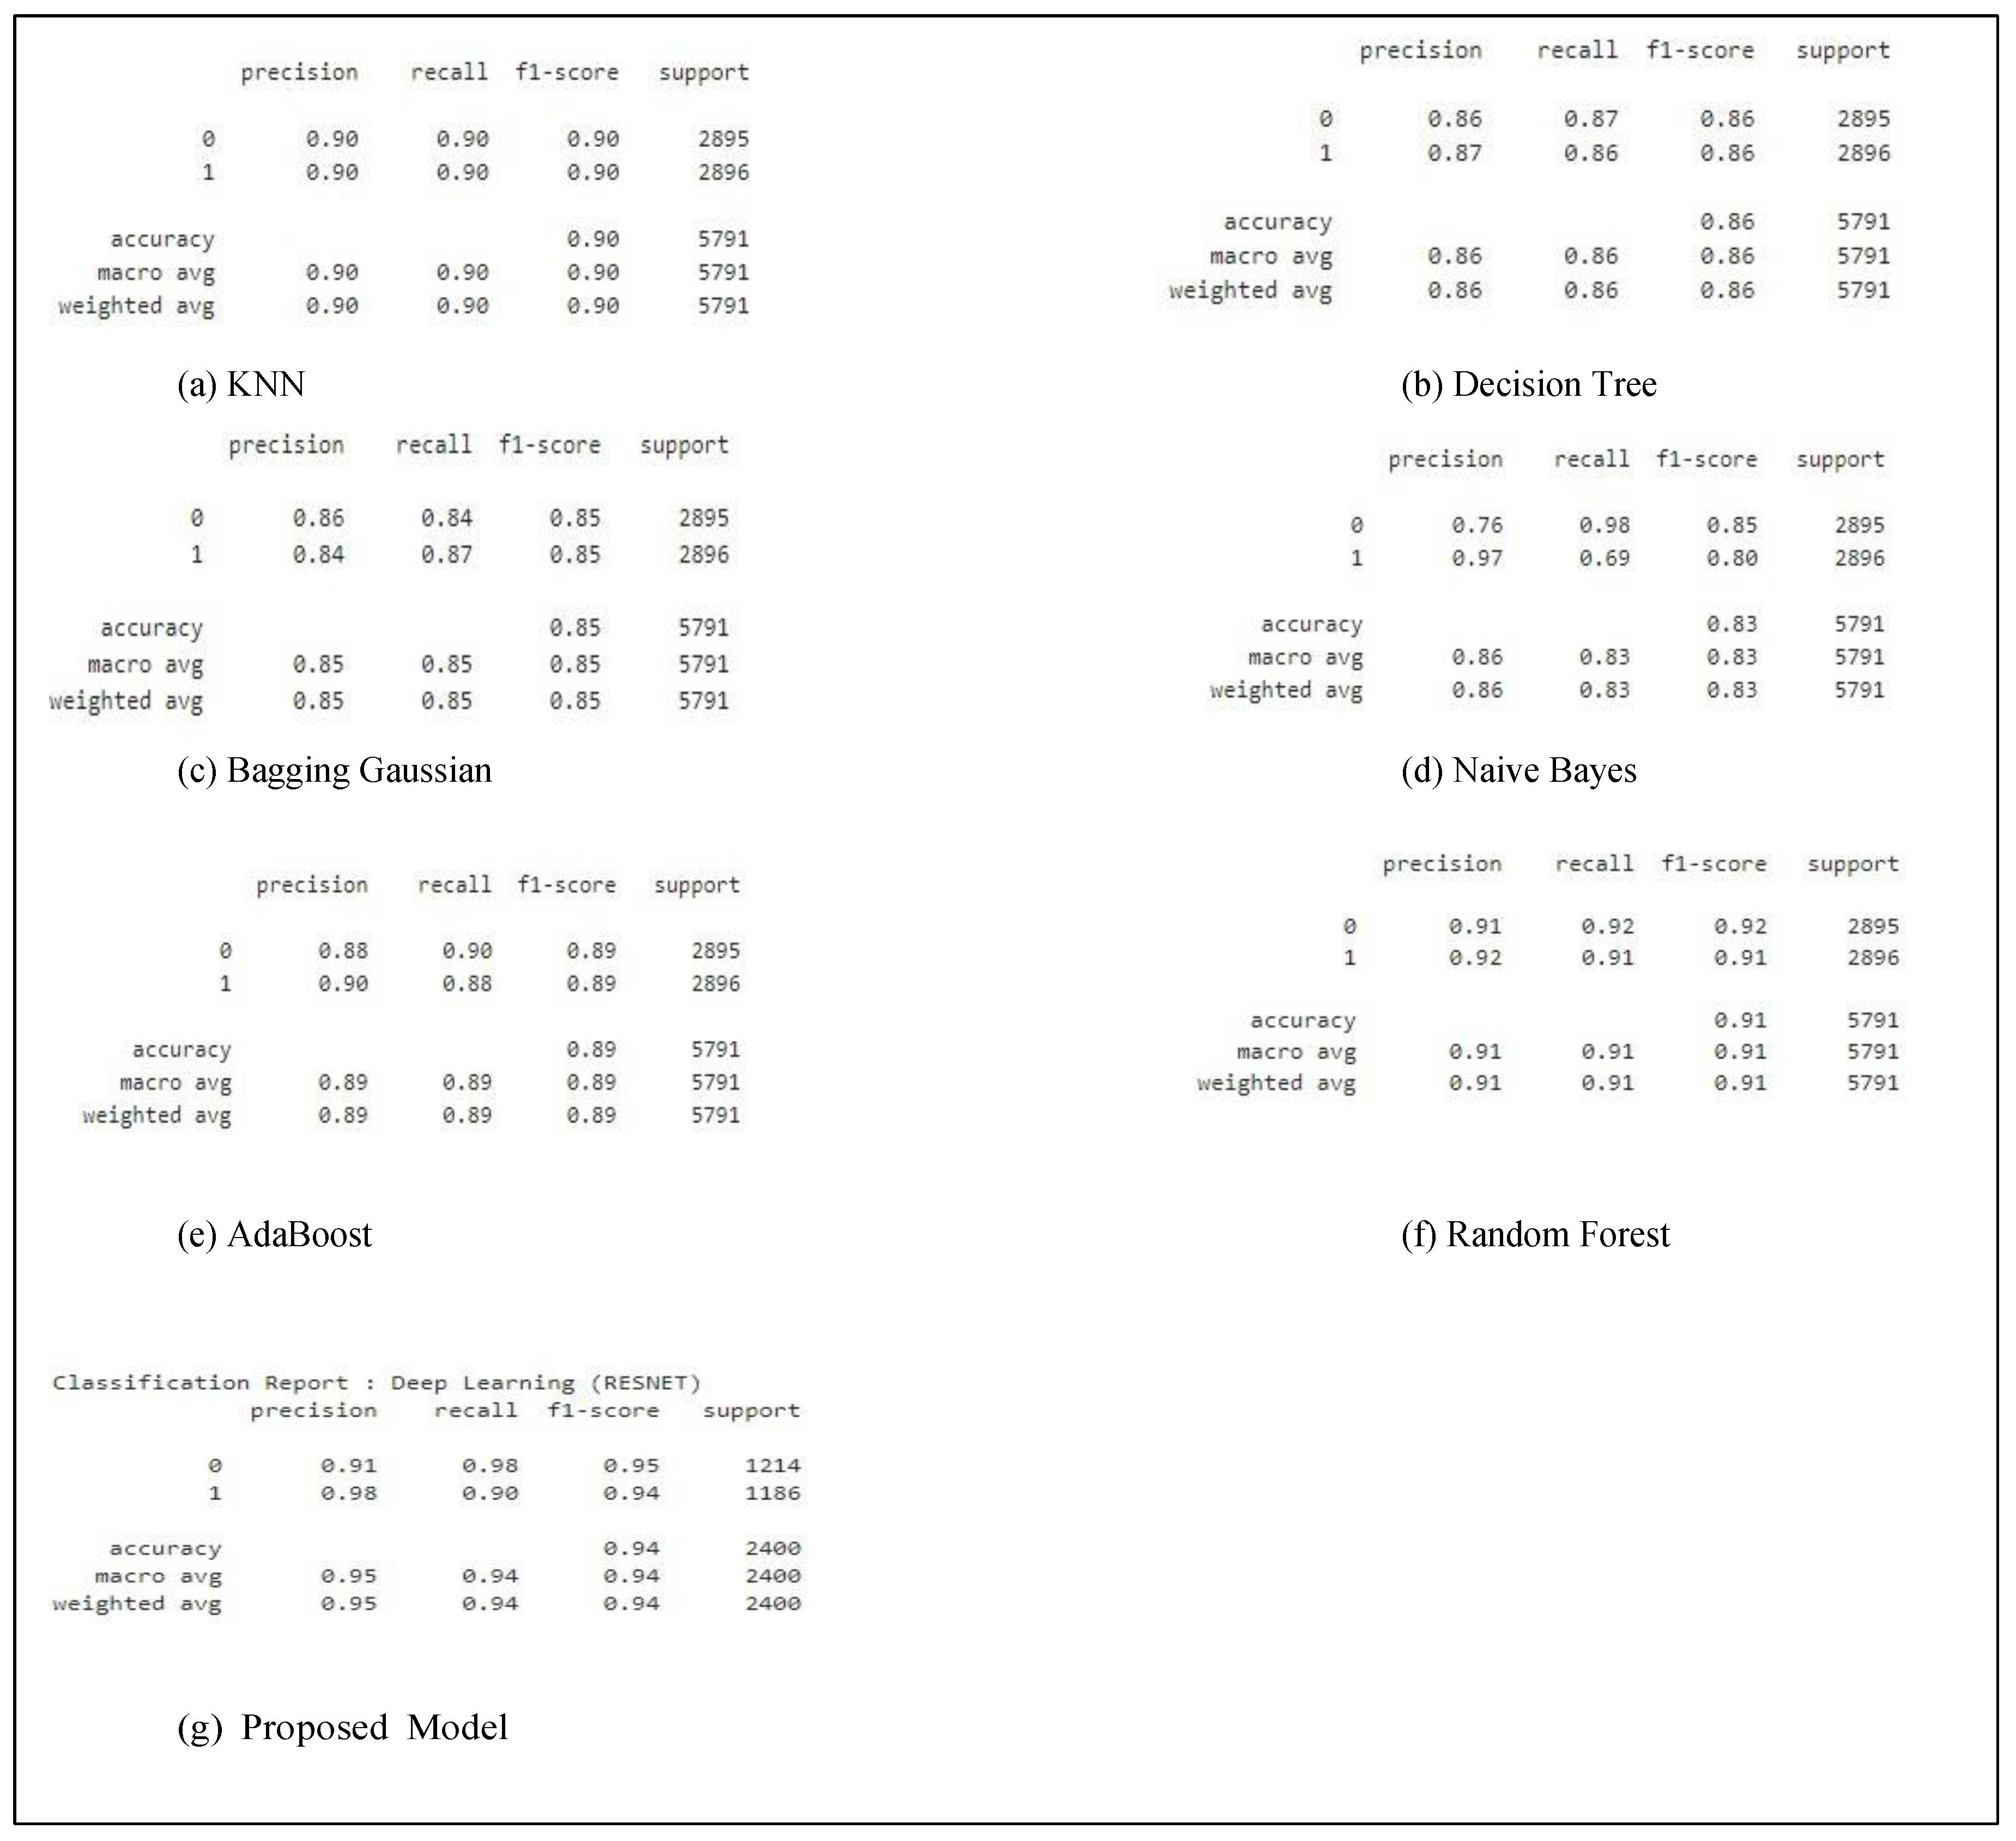
Figure 4.
21: Receiver Operating Curve for Under-sampling data balancing technique.
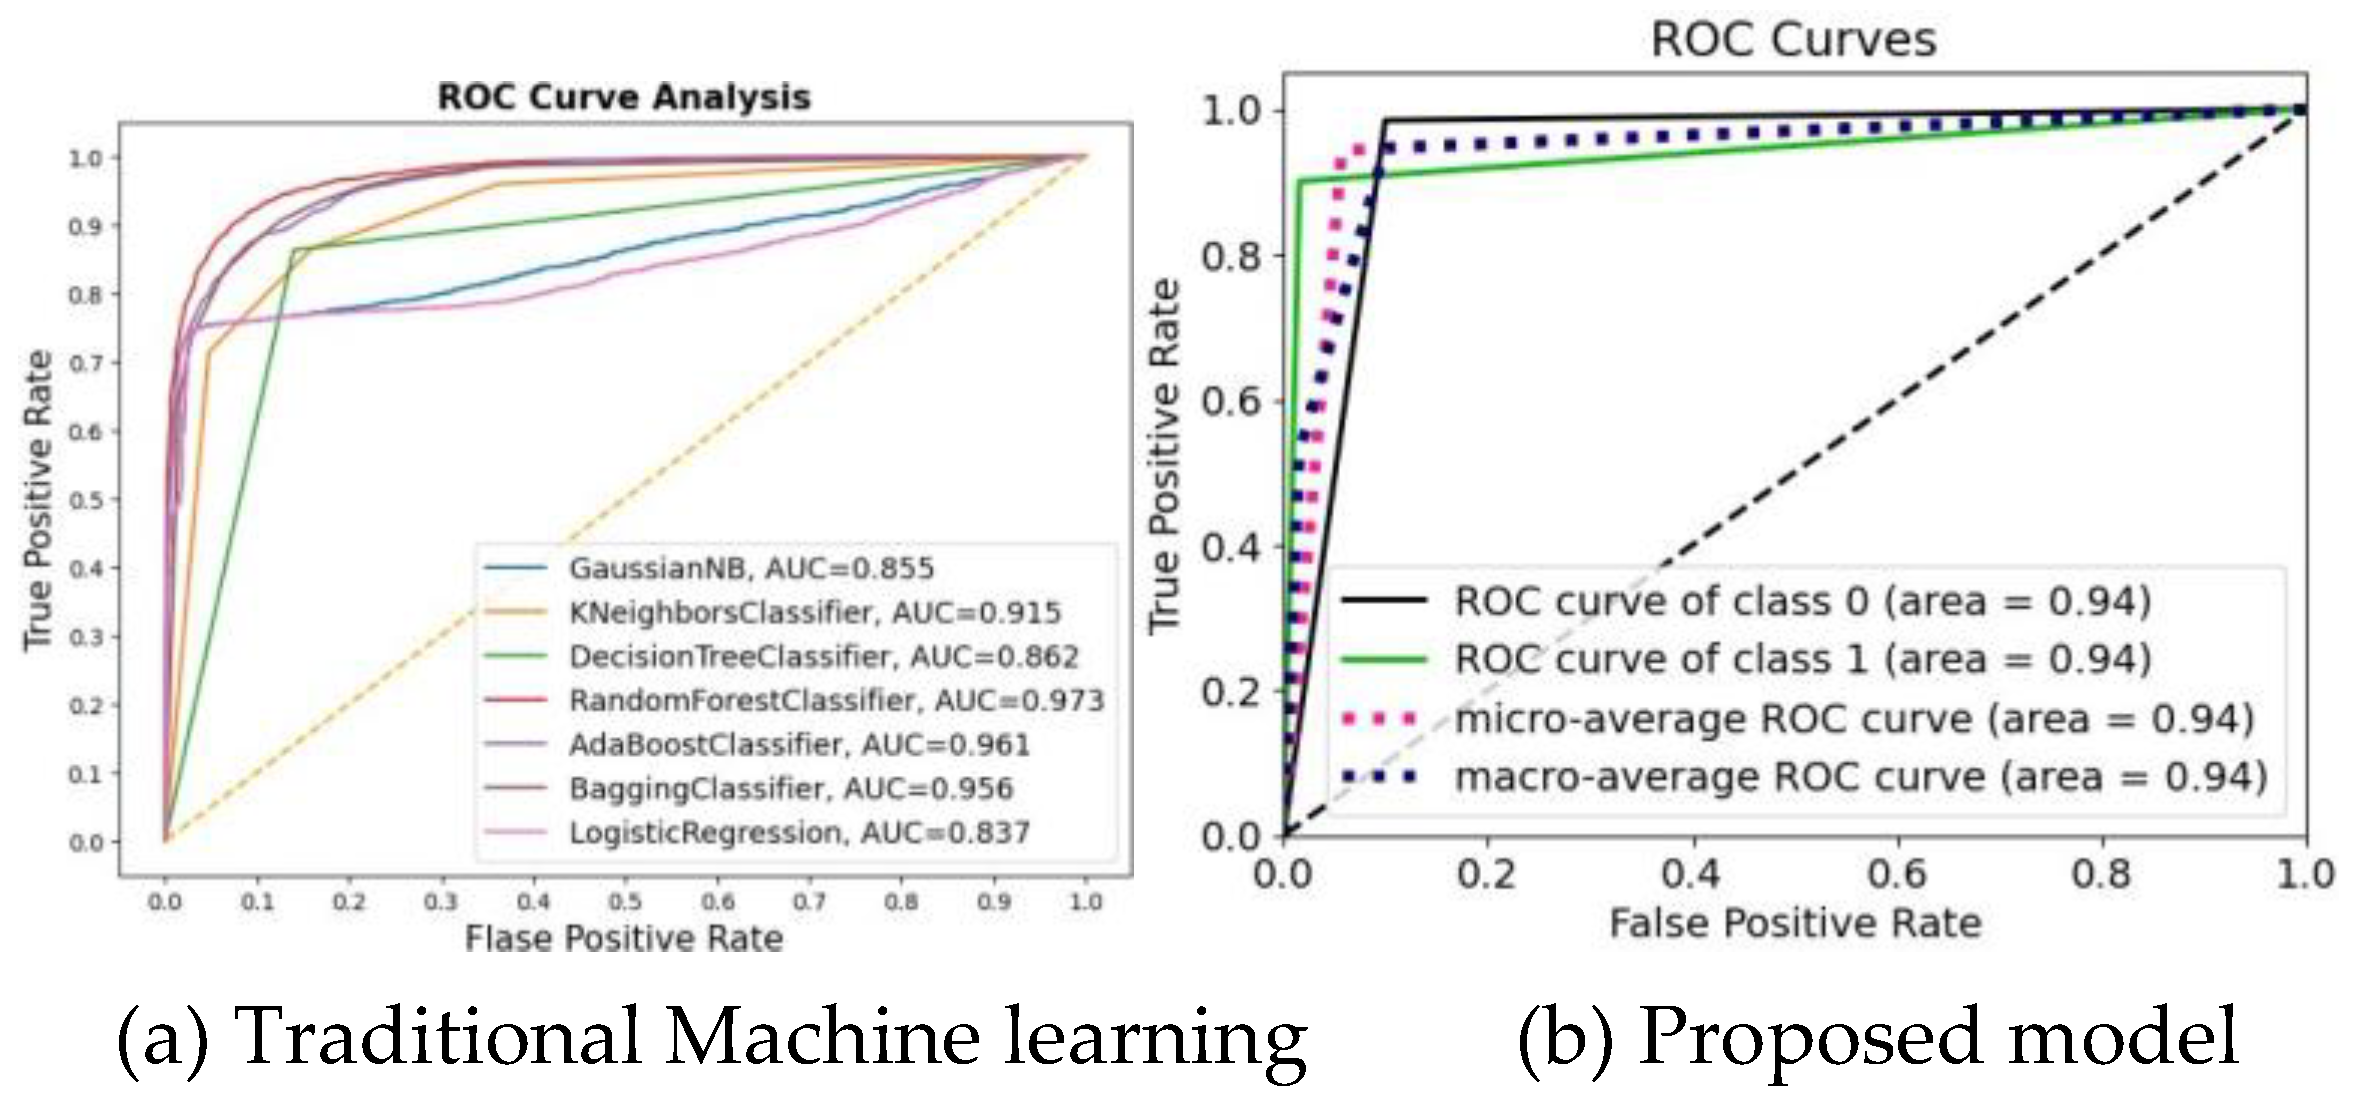
Table 4.
17: Classification report.
| Model | Accuracy % | Precision % | Recall % | F1 score % |
| KNN | 0.99 | 0.99 | 1.00 | 0.99 |
| Decision Tree | 0.98 | 0.98 | 0.99 | 0.98 |
| Random Forest | 0.99 | 0.99 | 1.00 | 0.99 |
| Adaboost | 0.92 | 0.95 | 0.88 | 0.92 |
| Bagging | 0.99 | 0.99 | 0.99 | 0.99 |
| GaussianNB | 0.85 | 0.96 | 0.74 | 0.83 |
| Proposed Model | 0.94 | 0.96 | 0.92 | 0.94 |
Table 4.
2: Classification report.
| Model | Accuracy % | Precision % | Recall % | F1 score % |
| KNN | 0.85 | 0.85 | 0.85 | 0.85 |
| Decision Tree | 0.86 | 0.86 | 0.86 | 0.86 |
| Random Forest | 0.91 | 0.91 | 0.91 | 0.91 |
| Adaboost | 0.92 | 0.95 | 0.88 | 0.92 |
| Bagging | 0.90 | 0.99 | 0.99 | 0.99 |
| GaussianNB | 0.83 | 0.96 | 0.74 | 0.83 |
| Proposed Model | 0.94 | 0.95 | 0.94 | 0.94 |
Disclaimer/Publisher’s Note: The statements, opinions and data contained in all publications are solely those of the individual author(s) and contributor(s) and not of MDPI and/or the editor(s). MDPI and/or the editor(s) disclaim responsibility for any injury to people or property resulting from any ideas, methods, instructions or products referred to in the content. |
© 2025 by the authors. Licensee MDPI, Basel, Switzerland. This article is an open access article distributed under the terms and conditions of the Creative Commons Attribution (CC BY) license (http://creativecommons.org/licenses/by/4.0/).
Copyright: This open access article is published under a Creative Commons CC BY 4.0 license, which permit the free download, distribution, and reuse, provided that the author and preprint are cited in any reuse.


