Submitted:
03 June 2025
Posted:
05 June 2025
You are already at the latest version
Abstract
Resistance spot welding was performed to join 2 mm thick TA2 titanium plate and Q235 steel plate using nickel foil with thicknesses of 0.02 mm, 0.04 mm, and 0.06 mm as interlayers. The microstructure of the nugget zone and the interface region of the joint was systematically observed and analyzed, and the tensile shear bearing capacity of the joint was evaluated. As the welding current increased, the tensile shear load of the joint exhibited a trend of initially increasing and subsequently decreasing. When the welding current was 8 kA, the tensile shear load of the joints with the interlayer of 0.04 mm thickness reached the maximum of 8.02 kN. The results indicate that employing a reduced welding current can effectively prevent the mixing of nuggets on both sides of the titanium and steel interface. This ensures that the intermetallic compounds formed in the interface region are confined to the Ti-Ni series, which is crucial for enhancing the tensile shear load of the joint.
Keywords:
titanium
; steel
; resistance spot welding
; nickel interlayer
1. Introduction
Titanium and its alloys have gained extensive applications in aerospace, shipping, petrochemicals, automotive industry, nuclear power, and other fields owing to their exceptional properties, including high specific strength, superior corrosion resistance, remarkable high-temperature strength, and excellent low-temperature toughness [1]. However, their application is somewhat limited owing to their relatively high cost, low elastic modulus, and insufficient creep resistance. Dissimilar material structural components can fully leverage the respective advantages of the two materials, create complementary strengths, and thus hold broad application prospects. The composite structure of titanium and steel with high strength and toughness offers advantages such as lightweight design, low cost, and excellent corrosion resistance, which holds great significance for further expanding the application scope of titanium and its alloys [2]. However, achieving this necessitates an effective joining of titanium and steel, which presents a significant challenge due to the substantial differences in their physical and metallurgical properties.
A substantial quantity of hard and brittle intermetallic compounds (IMCs) formed at the joining interface when titanium and steel were directly welded using the fusion welding process, which significantly compromises the mechanical properties and reliability of the joint [3]. To suppress the growth of IMCs and mitigate their adverse effects on joint performance, specific solid-state welding techniques, which are characterized by relatively low welding temperatures such as explosion welding [4], diffusion bonding [5], ultrasonic welding [6], and friction welding [7], were employed for joining titanium and steel. Although prior researches have demonstrated that solid-state welding technology yields promising results in titanium/steel welding [1], each welding technique exhibits specific characteristics and inherent limitations when applied in practice [8]. Therefore, in addition to solid-state welding, it is also necessary to explore the feasibility of joining titanium and steel using other welding techniques. Resistance spot welding (RSW) is a welding technique specifically designed for joining thin plates in lap configurations. While it is classified as a pressure welding process, localized melting of the base metal occurs during the welding operation. Therefore, directly joining titanium and steel through RSW poses significant challenges due to the formation of a substantial amount of IMCs at the welding interface [9].
For the welding of dissimilar materials, the application of an interlayer (or filler material) can effectively suppress the formation of brittle IMCs or promote the generation of less brittle IMCs as replacements, which is widely recognized as a robust strategy to enhance the mechanical and metallurgical performance of the joint [10]. Unfortunately, the addition of a single pure metal interlayer (or filler material) is insufficient to overcome the brittleness of Ti/steel joints [2]. This suggests that suitable interlayers must be carefully selected based on the characteristics of the base materials on both sides and used in combination to achieve optimal performance. In the prior research [11], considering the properties of titanium, a niobium foil was chosen as an interlayer to conduct RSW between Ti and steel. It was observed that the Nb interlayer achieved a strong bond with the titanium base material, while a FeNb layer formed at the Nb/steel interface within the joint [11]. In this study, an interlayer was selected according to the specific characteristics of steel for RSW of Ti/steel with the aim of providing fundamental insights for subsequent research on RSW of Ti/steel with bimetallic interlayers.
Among the commonly used metals, Cu and Ni exhibit relatively high solid solubility in iron (the primary component of steel) and are thus considered suitable interlayer materials for Ti/steel welding [10]. However in comparison to Cu, Ni has a linear expansion coefficient that is closer to that of the base materials, thereby reducing the risk of thermal stress-induced damage during welding [12]. In the investigation of other welding techniques for Ti/steel using Ni as an interlayer, it was observed that Ti-Ni IMCs formed in the interface region [13,14,15]. These Ti-Ni IMCs exhibited higher ductility compared to Ti-Fe IMCs, thereby improving the performance of the joint [13,14,15]. Therefore, Ni was chosen as the interlayer material for RSW of Ti/steel, and a comprehensive investigation was carried out on the microstructure and mechanical properties of the joint.
Experimental Materials and Procedures
In this study, the base materials consisted of a 2-mm thick TA2 pure titanium plate and a Q235 steel plate, both of which were machined into dimensions of 100 mm × 30 mm. Their chemical composition is listed in Table 1. Pure nickel foil with shapes of 30 mm×3 0mm was used as the interlayer. The nickel interlayer used for welding was available in three different thicknesses: 0.02 mm, 0.04 mm, and 0.06 mm. Before welding, the oxides on the surfaces of the titanium plates and Q235 steel plates were removed using a wire brush. Subsequently, the surfaces were cleaned with acetone and dried with hot air to ensure adequate preparation for welding. The titanium plate and Q235 steel plate, after undergoing cleaning treatment, were overlapped and assembled along the length direction with a lap length of 30 mm. Meanwhile, a Ni foil interlayer was inserted between the titanium plate and the Q235 steel plate.
The titanium plate was positioned on the upper electrode side and was welded using a medium-frequency variable-frequency RSW machine. The electrode employed had a tip diameter of 6 mm and was fabricated from CrZrCu alloy. RSW was performed by respectively varying the welding current and welding time. The detailed welding conditions are presented in Table 2.
After welding, the tensile shear test of the joint was carried out at room temperature using the WDW-100D microcomputer-controlled electronic universal testing machine (at a rate of 1 mm/min). The joint was cut along the diameter of the weld, and its cross-section was ground and polished. The microstructure of the joint was observed by using a scanning electron microscope (SEM) equipped with an energy dispersive spectrometer (EDS), and the composition of the characteristic zones was analyzed. The phase composition was analyzed by X-ray diffraction (XRD) in the cross-section and fracture of the joint.
Results and Discussion
Figure 1(a) and Figure 1(b) present the cross-sections of the joints between TA2 pure titanium and Q235 steel (hereafter referred to as Ti/steel joints), which were produced by RSW with a 0.04 mm thick nickel foil interlayer under currents of 7 kA and 9 kA, respectively. As shown in Figure 1(a), a nugget was observed on the Ti side (hereafter referred to as Ti-nugget), which consisted of coarser grains. On the steel side, a nearly semi-circular light gray area was observed (taken from location A in Figure 1(a)), and its enlarged view is presented in Figure 1(c). As shown, a nugget was also formed on the steel side (hereafter referred to as Fe-nugget). Figure 1(d) presents an enlarged view of the local melt core, clearly demonstrating that the grain size within the Fe-nugget was substantially larger than that in the base steel shown in Figure 1(e). As illustrated in Figure 1(c), the heat-affected zone (HAZ), approximately 750 µm in width and formed outside the Fe-nugget, can be subdivided into two distinct regions: the dark area (HAZ1) adjacent to the nugget and the light area (HAZ2) near the base material. Figure 1(f) and 1(g) respectively present the magnified images of the local regions for HAZ1 and HAZ2. As shown, the grain size in the HAZ was relatively uneven, primarily consisting of ferrite and pearlite. This is because, upon being heated to a specific temperature, some grains underwent phase transformation and formed austenite. Subsequently, at a higher cooling rate, these grains transformed into fine ferrite and pearlite. Meanwhile, the ferrite grains that did not austenitize during the heating process coarsened due to grain growth. Compared with HAZ2, more austenitizing grains occurred in HAZ1.
As depicted in Figure 1(a) and 1(c), a reaction layer formed between the Ti-nugget and the Fe-nugget, effectively isolating the two. Therefore, this type of joint is referred to as the joint with double-single nugget (DS-nugget), and its structure is illustrated in Figure 2 (a). As the welding current increased, a greater amount of metal melted during the welding process. The reaction layer was breached, allowing the nuggets on both sides to penetrate and form a mixed nugget as shown in Figure 1 (b). The type of joint is referred to as a joint with a collusion nugget (C-nugget), and its structure is illustrated in Figure 2(b). In the cases of interlayers with thicknesses of 0.02 mm, 0.04 mm, and 0.06 mm, when the welding current exceeded 8 kA, the obtained joints were the joint with C-nugget in this study. This welding current level is referred to as the critical welding current. Figure 1(h) shows an enlarged view of location B in Figure 1(b). As shown, the microstructure of the Fe-nugget and the HAZ outside it on the steel side of the joint with C-nugget was similar to that observed in the joint with DS-nugget. In addition, some voids were observed between the Fe-nugget and the mixed nugget. This phenomenon can be attributed to the formation of IMCs within the mixed nugget, as detailed later, which induced volume shrinkage during solidification.
Figure 3(a) presents a SEM image of the interfacial zone between Ti and steel in the joint with DS-nugget. As shown, layered structures were observed at the interface between Ti and steel. Figure 3(b) and 3(c) respectively show the enlarged images of the peripheral zone (location B) and the central zone (location C) of the weld. In the peripheral zone of the weld, the Ni interlayer was observed, effectively bonding the Ti and steel on both sides, as illustrated in Figure 3(b). As approaching the weld center, the Ni interlayer gradually disappeared and layered reactants were formed. In the central zone of the weld, dendritic reaction layers were formed near the Ti side and the steel side, respectively, as illustrated in Figure 3(c).
Figure 4(a) presents the XRD analysis results obtained from the cross-section of the joint containing the DS-nugget. In addition to Ti and Fe, the presence of Ti2Ni and TiNi phases was also detected. Figure 4(b) and Figure 4(c) respectively display the high-magnification SEM images at locations D and E in Figure 3. EDS analysis was performed at the corresponding feature locations, and the results are summarized in Table 3. A small amount of Ni was detected in both the base metal Ti (location A1) and the steel (location G1), resulting from Ni diffusion to the base metals of both sides during welding. Similarly, Fe and Ti were detected in the residual interlayer (location F1). As shown in Figure 4(b), within the interfacial region between steel and Ti, two types of reactants were predominantly observed: dark gray reactants (at locations B1 and C1) and light gray reactants (at locations D1 and E1). According to the EDS results, the dark gray reactants are inferred to represent a eutectic structure composed of (α-Ti) and Ti2Ni, while the light gray reactants correspond to the TiNi phase. During the heating process, Ni, which has a higher resistivity, heated up more rapidly and exhibited greater reactivity, thereby diffusing quickly toward the base metals on both sides. When the Ti-Ni reached the eutectic composition, liquefaction occurred at 942 °C [16]. As the heating process continued and the temperature increased further, more Ti and Ni transitioned into the liquid phase, while solid-state Ti and Ni also dissolved into the liquid metal. At the periphery of the weld, the shorter high-temperature duration led to inadequate mixing of the liquid phase. During the subsequent cooling and solidification process, as the temperature decreased to 1310°C, the Ni-rich region experienced a liquid-solid phase transformation of invariant composition, thereby forming TiNi [16]. As the temperature decreased, the Ti-rich region experienced eutectic transformation, leading to the formation of (β-Ti) + Ti2Ni. Further reduction in temperature caused the subsequent formation of (α-Ti) and Ti2Ni.
Due to the long duration of high temperature in the center zone of the weld, Ni and Ti atoms also diffused fully to the steel side, and Fe atoms also diffused into the liquid phase. After solidification, a multi-layer structure as shown in Figure 4(c) was formed. Based on the EDS results, it can be inferred that L1, L2, L3, and L4 layers were primarily composed of (α-Ti) + Ti2Ni, TiNi, TiNi + Ti(Ni, Fe)3, and (Fe, Ni), respectively. During the cooling process, on the side adjacent to the steel, as the temperature decreased, the steel, which contained diffused Ni and Ti atoms, formed an (Fe, Ni) solid solution layer (L4 layer). Subsequently, the temperature continued to decrease, and a eutectic reaction occurred at the front of the L4 layer, leading to the formation of TiNi and Ti(Ni, Fe)3 eutectic structure layer (L3 layer). Here, owing to the relatively scarce formation of Ti(Ni, Fe)3, its presence was not detectable by XRD. Then, at the forefront of the L3 layer, a solid-liquid phase transformation occurred, resulting in the formation of the TiNi layer (L2 layer). Meanwhile, (β-Ti) initially precipitated near the Ti side, with Ni atoms being expelled to the surrounding regions. As the temperature continued to decrease, a eutectic transformation occurred, resulting in the formation of (β-Ti) + TiNi. Following the phase transformation of Ti, a dendritic primary precipitate phase (α-Ti) and an (α-Ti) + TiNi eutectic structure were formed.
To sum up, although IMCs were formed in the joint with DS-nugget, the predominant IMCs identified belonged to the Ti-Ni series.
Figure 5(a) shows the SEM image of the cross-section of the Ti/steel joint with C-nugget. EDS analysis was performed along the line PQ as depicted in Figure 5(a), and the resulting data are shown in Figure 5(b). It can be seen from the EDS results that the mixed nugget in the joint primarily consisted of Ti-Fe IMCs. Layered reactants were observed at the Ti/steel interface beside the mixed nugget. Figure 5(c) presents the SEM image of the Ti/steel interface zone in the joint containing a C-nugget, captured at location D in Figure 5(a). EDS analysis was performed at the characteristic locations, and the resulting data are presented in Table 4. According to the EDS results, the microstructure composition in the interfacial zone was similar to that of the joint with DS-nugget, as both are predominantly composed of Ti-Ni series IMCs. However, the reaction layer formed in the Ti/steel interface zone of the joint containing C-nugget contained a certain concentration of Fe. This not only increased the brittleness of the reaction layer but also resulted in crack formation, as illustrated in Figure 5(c).
Figure 5(d), 5(e), and 5(f) present the SEM images of the boundaries and central region of the mixed nugget, which were obtained from locations B, C, and D in Figure 5(a), respectively. EDS analysis was performed at the characteristic locations, and the resulting data are also presented in Table 4. According to the EDS analysis, it can be inferred that the LT layer adjacent to the Ti side was primarily composed of (α-Ti) and TiFe, whereas the LS layer adjacent to the steel side consisted predominantly of (Fe) and TiFe2. The remaining portion of the mixed nugget was composed of coarse dendritic TiFe and interdendritic (α-Ti), resembling the structure of the nugget in the Ti/steel joint directly welded by RSW [17]. The Ti-nugget and the Fe-nugget mixed to form the mixed nugget in the joint welded under conditions of high welding current or extended welding time. However, the very brief heating time during RSW, combined with the closed nature of the nugget and its relatively weak internal stirring force, resulted in only partial mixing of the nuggets on either side of the welding interface. After the power was cut off, the liquid metal began to solidify from both sides under the cooling influence of the electrodes. Near the Ti side, owing to the lower concentrations of Fe and Ni, the (β-Ti) precipitate phase formed initially during solidification. Subsequently, as the temperature decreased, eutectic transformation occurred, leading to the formation of the (β-Ti)+TiFe eutectic structure. Upon further cooling, the (α-Ti)+TiNi phase (LT layer) was formed. Similarly, the LS layer composed of (Fe) + TiFe2 was also formed on the side adjacent to the steel in the meantime. During the subsequent solidification process, owing to the Ti and Fe concentrations being nearly equimolar (approximately 1:1), a significant amount of TiFe dendrites formed alongside a minor presence of α-Ti. These phenomena were elaborated upon in reference [17].
Figure 6(a) and Figure 6(b) respectively illustrate the effects of welding current on the nugget diameter and the tensile shear load of the Ti/steel joint. Here, the nugget diameter refers to the average of measurements taken in mutually perpendicular directions on the Ti side fracture surface of the joint. As shown, with the increase in welding current, the nugget diameter for joints with all three thicknesses of interlayer increased accordingly. This is because the increase in welding current led to an increase in the heat generated during the welding, and thus more metal melted. Under the same welding current, the nugget diameter of the resulting joint decreased as the thickness of the applied Ni interlayer increased; however, this reduction was not substantial as shown in Figure 6(a). This may be attributed to the relatively high thermal conductivity of Ni, which led to the use the application of a thicker interlayer, resulting in greater heat loss.
For the three types of joints, as the welding current increased, the tensile shear load exhibited a trend of initially increasing and subsequently decreasing as shown in Figure 6(b). When the welding current was 8 kA, the tensile shear load of the joints with the interlayer of 0.02 mm, 0.04 mm and 0.06 mm thickness reached their maximum values, which were approximately 5.73 kN, 8.02 kN and 7.41 kN, respectively.
The joints obtained in this study consistently demonstrated an interface tearing failure mode during the tensile test. For joints with interface tearing failure, the factors influencing the tensile shear load of the joint are mainly the nugget size and the microstructure of the interface zone. As mentioned earlier, within the welding current range of 6 kA to 8 kA, the welded joints featured DS-nugget, and the IMCs formed in these joints belonged to the Ti-Ni series. In contrast, when the welding current was greater than 8 kA, the resulting joints exhibited C-nugget, with a significant amount of Ti-Fe series IMCs forming in the joints. Therefore, as the welding current increased within the 6~8 kA range, the nugget diameter increased, consequently enhancing the tensile shear load of the joint. However, when the welding current was greater than 8 kA, although the nugget diameter also increased with the increase in the welding current, the tensile shear load of the joint actually decreased as the welding current increased. This is because a large amount of Ti-Fe series IMCs were formed in the joint in this case, and they are more brittle than Ti-Ni series IMCs [13,14,15]. The formation of Ti-Fe series IMCs in the joint also induced the formation of voids and cracks. These led to a decrease in the tensile shear load of the joint under larger welding currents. Furthermore, under the same welding current, the application of an interlayer with a thickness of 0.04 mm or 0.06 mm resulted in no significant difference in the tensile shear load of the joints. However, when an interlayer of 0.02 mm thickness was used and welded with a current exceeding 7 kA, the tensile shear load of the joints was found to be lower. This is attributed to the fact that the main load-bearing area occupied a smaller proportion of the entire joint (as described later) when a thinner interlayer (0.02 mm) and a higher welding current were used.
Figure 7(a) and Figure 7(b) respectively illustrate the effects of welding time on the nugget diameter and the tensile shear load of the Ti/steel joint. By comparing Figure 7 with Figure 6, it is evident that the influence of welding time on the nugget diameter and the tensile shear load of the joint exhibited a remarkable similarity to the effect of welding current on these. For RSW, the welding time, similar to the welding current, primarily influences the microstructure and properties of the joint by affecting the heat generation and distribution. Therefore, the internal factors responsible for the changes in nugget diameter and tensile shear load, as depicted in Figure 7 with the increase in welding time, are consistent with the previously mentioned analyses. Additionally, it may have been noticed that when the thickness of the interlayer was 0.06 mm and the welding time was 100 ms, the data was missing. This was because in this case, an effective joining was not achieved.
Figure 8 shows the fractures of the Ti/steel joints. Figure 8(a) and Figure 8(b) respectively illustrate the fracture surfaces on the Ti side and steel side of the joint containing DS-nugget. This joint was produced under the following welding conditions: a welding current of 7 kA, a welding time of 200 ms, an electrode pressure of 3 kN, and an interlayer thickness of 0.04 mm. According to their morphological characteristics, macroscopically, fractures can be categorized into two distinct regions: the annular region (S1) located at the periphery of the fracture and the circular region (S2) situated at the center of the fracture.
Figure 8(c) and Figure 8(d) respectively show the fracture surfaces on the Ti side and steel side of the joint with C-nugget. This joint was produced under the welding conditions of 9 kA welding current and 0.04 mm thick interlayer. In this case, the fracture can be categorized into three distinct regions: the S1 region located on the periphery of the fracture, the S3 region situated at the center of the fracture, and the S2 region positioned between the two.
Figure 9 presents the EDS analysis results obtained from the local regions of the fracture surfaces for both types of joints. As shown, for both types of joints, Ni was predominantly detected in the S1 region, regardless of whether the fracture occurred on the steel side or the Ti side. In the S1 region, therefore, it is inferred that the Ti/steel joint failure occurred within the Ni interlayer. Similarly, Ti and trace amounts of Ni were identified in the S2 region of the fracture surfaces on both the steel and Ti sides of the two joint types. Combined with the prior analysis of the interfacial microstructure of the joint, it is inferred that in the S2 region, the Ti/steel joint failure occurred within the mixed phase layer of (α-Ti) , Ti2Ni, and TiNi. In the S3 region, a unique zone within the Ti/steel joint characterized by C-fusion nugget, both Ti and Fe elements were identified. Therefore, in the S3 region, it is inferred that the failure of the Ti/steel joint occurred within the IMC layer of TiFe.
The area of each region was quantitatively measured on the fracture images of the Ti/steel joint. Figure 10 illustrates the measured areas of the S1, S2, and S3 regions on the fracture surfaces of each joint, along with their respective proportions. Under the assumption that the stresses in the S1, S2, and S3 regions of all joints remain constant, these are respectively denoted as σ1, σ2, and σ3. The values of σ1, σ2 and σ3 were calculated using the least square method as described below [18].
Here, i denotes the index number of the joint; Pi represents the tensile shear load of the ith joint; A1i, A2i, and A3i represent the areas of S1, S2, and S3 for the ith joint, respectively. The condition for S to attain its minimum value is given by the following equations.
The values of σ1, σ2, and σ3 were calculated to be approximately 364.89 MPa, 275.84 MPa, and 33.63 MPa, respectively, by solving Eqs. (2), (3), and (4) using the experimental data of tensile shear load of the joint and the area of each region on the fractures of the joint.
As described above, the S1 and S2 regions, which consisted of Ni and a mixed phase layer of (α-Ti) and Ti-Ni IMCs, respectively, played a more significant role in contributing to the tensile shear load of the Ti/steel joint. In contrast, the S3 region, primarily composed of TiFe, contributed less to the tensile shear load of the Ti/steel joint. This indicates that when using a Ni interlayer for RSW of titanium and steel, with appropriately selected welding parameters, only Ti-Ni series IMCs formed in the welding interface region, while the formation of Ti-Fe series IMCs was effectively avoided. As a result, the joint performance was significantly enhanced.
4. Conclusions
Through this study, the following conclusions can be drawn:
Using a Ni interlayer for RSW of titanium and steel, a distinct nugget formed on each side of the titanium and steel when the welding current was relatively low. When the welding current exceeded 8 kA, the nuggets on the titanium side and the steel side partially mixed.
In the Ti/steel joint, when the nuggets on both sides of titanium and steel remained unmixed, the IMCs formed in the interfacial zone were predominantly of the Ti-Ni type. Conversely, when the nuggets were mixed, the IMCs formed were primarily of the Ti-Fe type.
As the welding current increased, the tensile shear load of the joint exhibited a trend of initially increasing and subsequently decreasing. When the welding current was 8 kA, the tensile shear load of the joints with the interlayer of 0.04 mm thickness reached the maximum value, approximately 8.02 kN.
In the Ti/steel joint, the Ni and mixed phase layer of (α-Ti) and Ti-Ni IMCs played a more significant role in contributing to the tensile shear load of the joint.
Acknowledgments
The authors would like to express their gratitude to International Science and Technology Cooperation Project of Henan Province, China (Grant No. 242102521037, 252102521088) for financial support.
Disclosure statement
No potential conflict of interest was reported by the author(s).
References
- Zhang, Y.; Bi, Y.B.; Zhou, J.P.; Sun, D.Q.; Li, H.M. Weldability and machinability of the dissimilar joints of Ti alloy and stainless steel -A review. Int. J. Mater. Res. 2021, 112 (10), 826-847. [CrossRef]
- Lee, M.K.; Lee, J.G.; Choi, Y.H.; Kima, D.W.; Rhee, C.K.; Lee, Y.B.; Hong, S.J. Interlayer engineering for dissimilar bonding of titanium to stainless steel. Materials Letters, 2010, 64, 1105-1108. [CrossRef]
- Chang, J.; Yan, Y.; Cao, R. Lap joining of titanium to galvanized steel by cold metal transfer technology. Materials Transactions, 2020, 61, 2312-2319. [CrossRef]
- Chen, X.; Inao, D.; Tanaka, S.; Li, X.J.; Bataev, I.A.; Hokamoto, K. Comparison of explosive welding of pure titanium/SUS 304 austenitic stainless steel and pure titanium/SUS 821L1 duplex stainless steel. Transactions of Nonferrous Metals Society of China, 2021, 31, 2687-2702. [CrossRef]
- Kurt, B.; Orhan, N.; Kaya, M. Interface characterisation of diffusion bonded Ti–6Al–4V alloy and austenitic stainless steel couple. Materials Science and Technology, 2009, 25(4): 556-560. [CrossRef]
- Lin, J.Y.; Nambu, S.; Koseki, T. Interfacial phenomena during ultrasonic welding of ultra-low-carbon steel and pure Ti. Scripta Materialia, 2020, 178, 218–222. [CrossRef]
- Liu, H.; Fuji, H. Ultralow rotation speed produces high-quality joint in dissimilar friction welding of Ti–6Al–4V alloy and SUS316L stainless steel. Materials Science and Engineering: A, 2021, 800(7), 140303.
- Giri, R.S.; Khamari, K.B.; Moharana, R.B. Joining of titanium and stainless steel by using different welding processes: A review. Materials Today: Proceedings, 2022, 66, 505-508.
- Muhammad, S.M.M.; Yusof, F.; Ariga, T.; Miyashita, Y. Microstructure and mechanical properties of micro-resistance spot welding between stainless steel 316L and Ti-6Al-4V. The International Journal of Advanced Manufacturing Technology, 2018, 96, 2567-2581. [CrossRef]
- Fang, Y.; Jiang, X.; Mo, D.; Zhu, D.; Luo, Z. A review on dissimilar metals’ welding methods and mechanisms with interlayer. The International Journal of Advanced Manufacturing Technology, 2019, 102. 2845-2863. [CrossRef]
- Liu, C.; Zhang, J.; Shi, H.; Li Q. Influence of interlayer Nb on the performance of joint between titanium and steel welded by resistance spot welding. Journal of Materials Engineering and Performance, 2022, 31, 1155-1162. [CrossRef]
- Yan, J.C.; Zhao, D.S.; Wang, C.W.; Wang, L.Y.; Wang, Y.; Yang, S.Q. Vacuum hot roll bonding of titanium alloy and stainless steel using nickel interlayer. Materials Science and Technology, 2009, 25(7): 914-918. [CrossRef]
- Kundu, S.; Chatterjee, S. Characterization of diffusion bonded joint between titanium and 304 stainless steel using a Ni interlayer. Materials Characterization, 2008, 59, 631-637. [CrossRef]
- Muralimohan, C.H.; Ashfaq, M.; Ashiri, R.; Muthupandi, V.; Sivaprasad, K. Analysis and characterization of the role of Ni interlayer in the friction welding of titanium and 304 austenitic stainless steel. Metallurgical and Materials Transactions A, 2016, 47, 347-359. [CrossRef]
- Yıldız, A.; Kaya, Y.; Kahraman, N. Joint properties and microstructure of diffusion-bonded grade 2 titanium to AISI 430 ferritic stainless steel using pure Ni interlayer. Int. J. Adv. Manuf. Technol., 2016, 86, 1287-1298. [CrossRef]
- Baker, H.; Okamoto, H. Alloy phase diagrams, Vol. 3, ASM International, Ohio, USA 1992.
- Qiu, R.; Li, Q.; Shi, H.; Satonaka, S. Resistance spot welding of titanium and mild steel. Transactions of The China Welding Institution, 2018, 39(4): 45-48.
- Qiu, R.; Iwamoto, C.; Satonaka, S. The influence of reaction layer on the strength of aluminum/steel joint welded by resistance spot welding, Materials Characterization, 2009, 60(2): 156-159. [CrossRef]
Figure 1.
Cross-sections and metallograph of Ti/steel joint, (a) cross-section (7 kA); (b) cross-section (9 kA); (c) enlarged view at location A; (d) Fe-nugget; (e) base metal of steel; (f) HAZ1; (g) HAZ2; (h) enlarged view at location B.
Figure 1.
Cross-sections and metallograph of Ti/steel joint, (a) cross-section (7 kA); (b) cross-section (9 kA); (c) enlarged view at location A; (d) Fe-nugget; (e) base metal of steel; (f) HAZ1; (g) HAZ2; (h) enlarged view at location B.
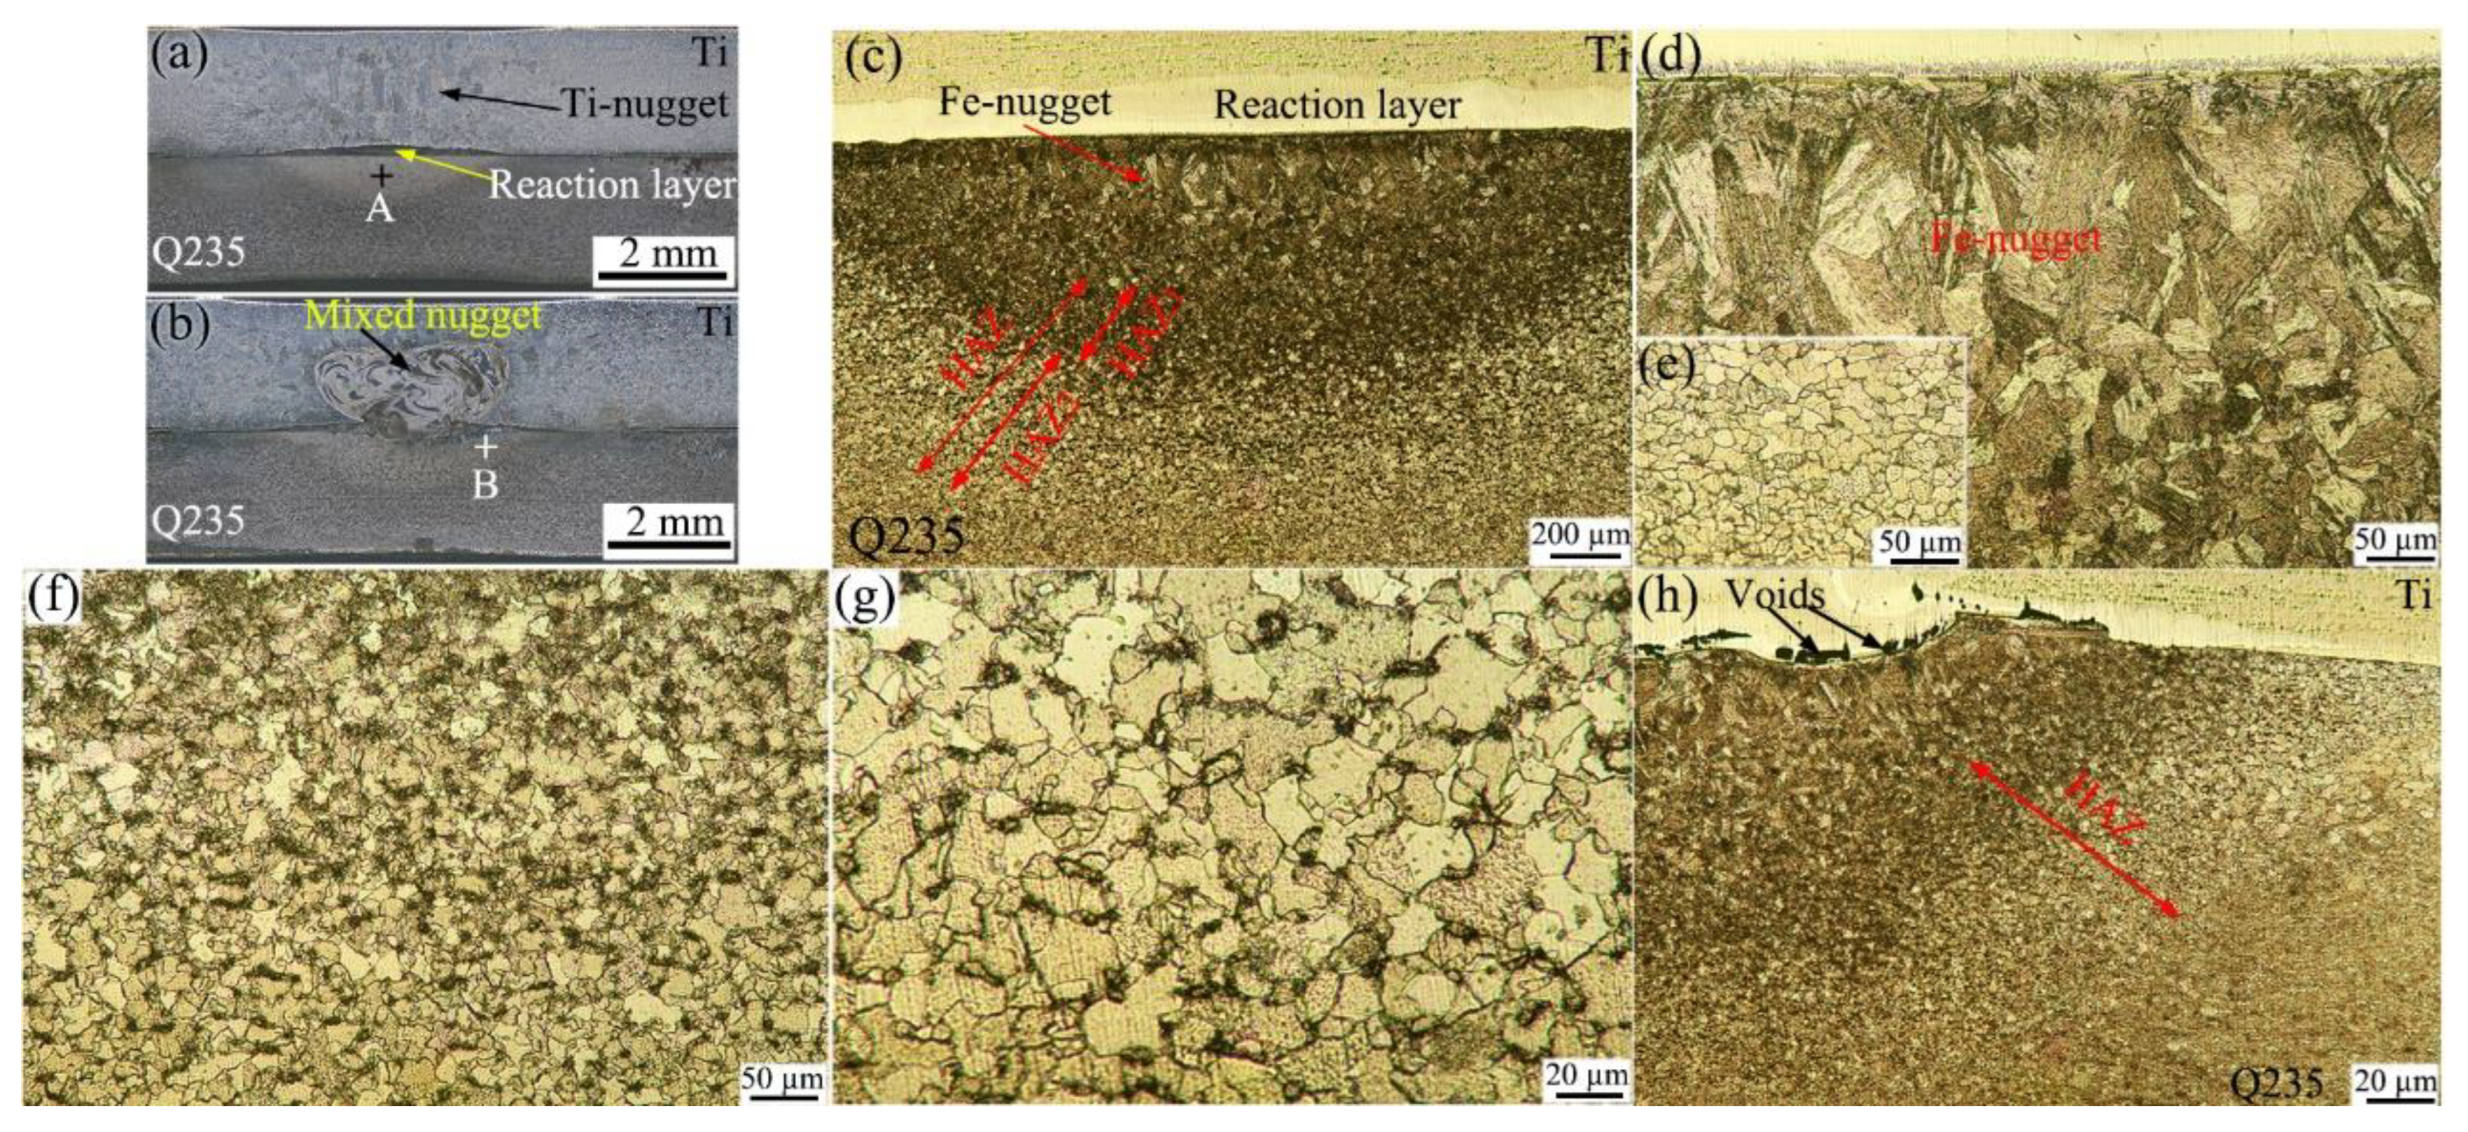
Figure 2.
Schematic diagram of Ti/steel joint, (a) joint with DS-nugget; (b) joint with C-nugget.
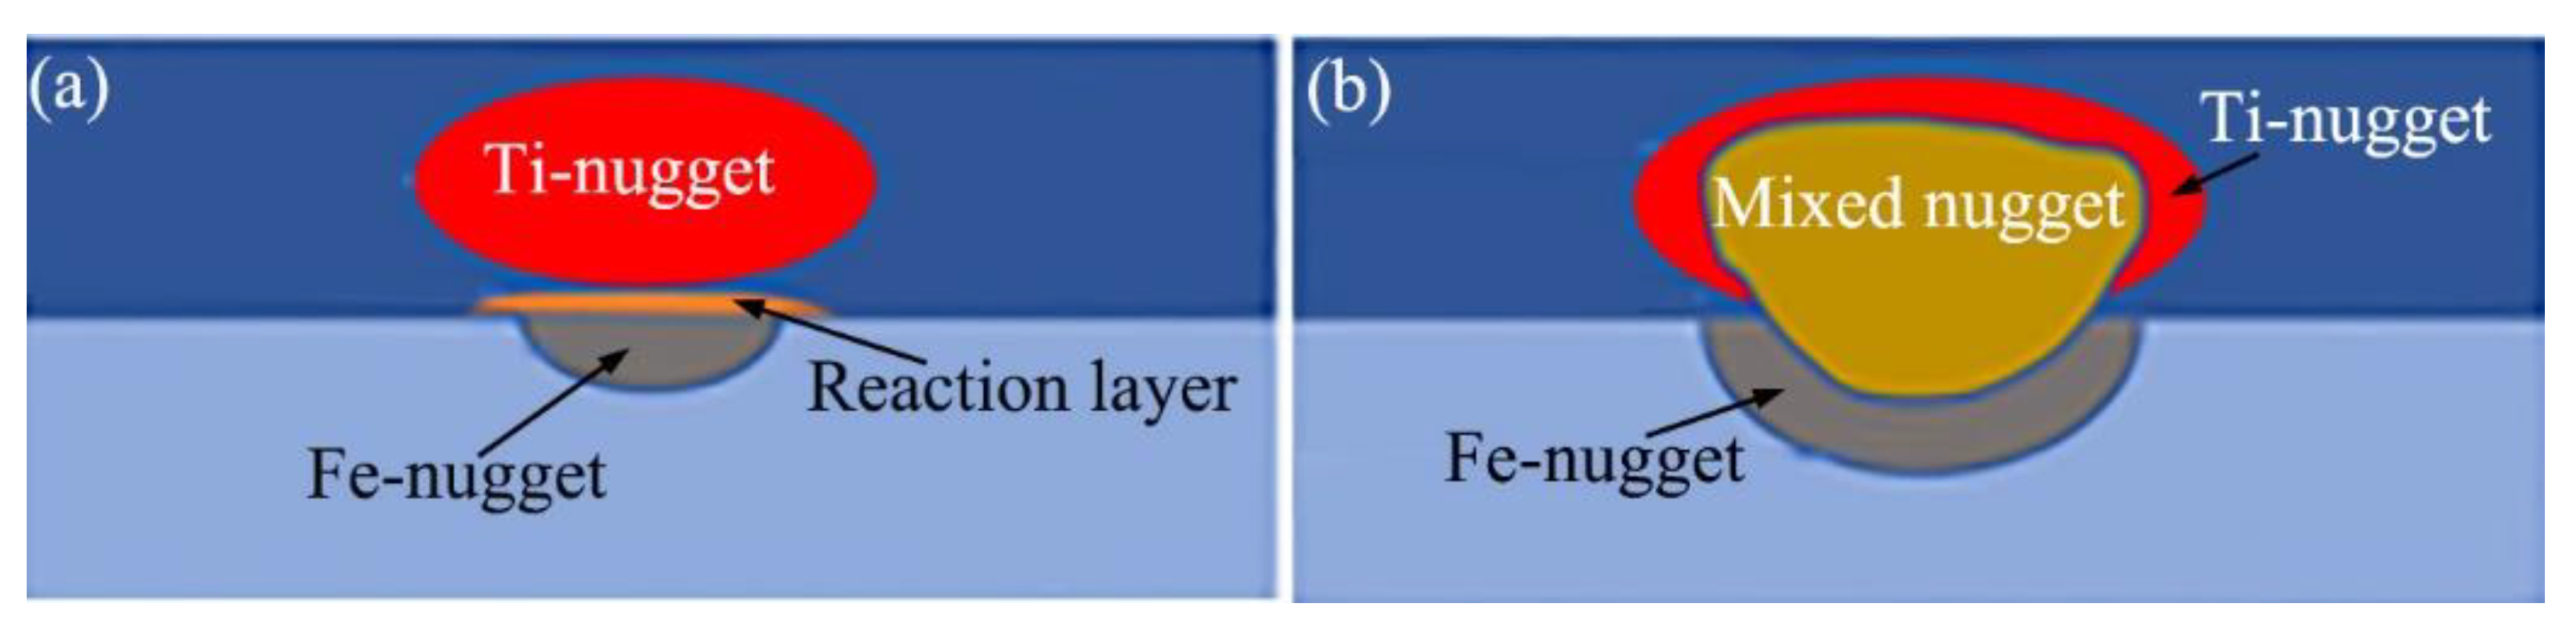
Figure 3.
SEM images of Ti/steel joint with DS-nugget, (a) interface SEM image; (b) enlarged image at location B; (c) enlarged image at location C.
Figure 3.
SEM images of Ti/steel joint with DS-nugget, (a) interface SEM image; (b) enlarged image at location B; (c) enlarged image at location C.
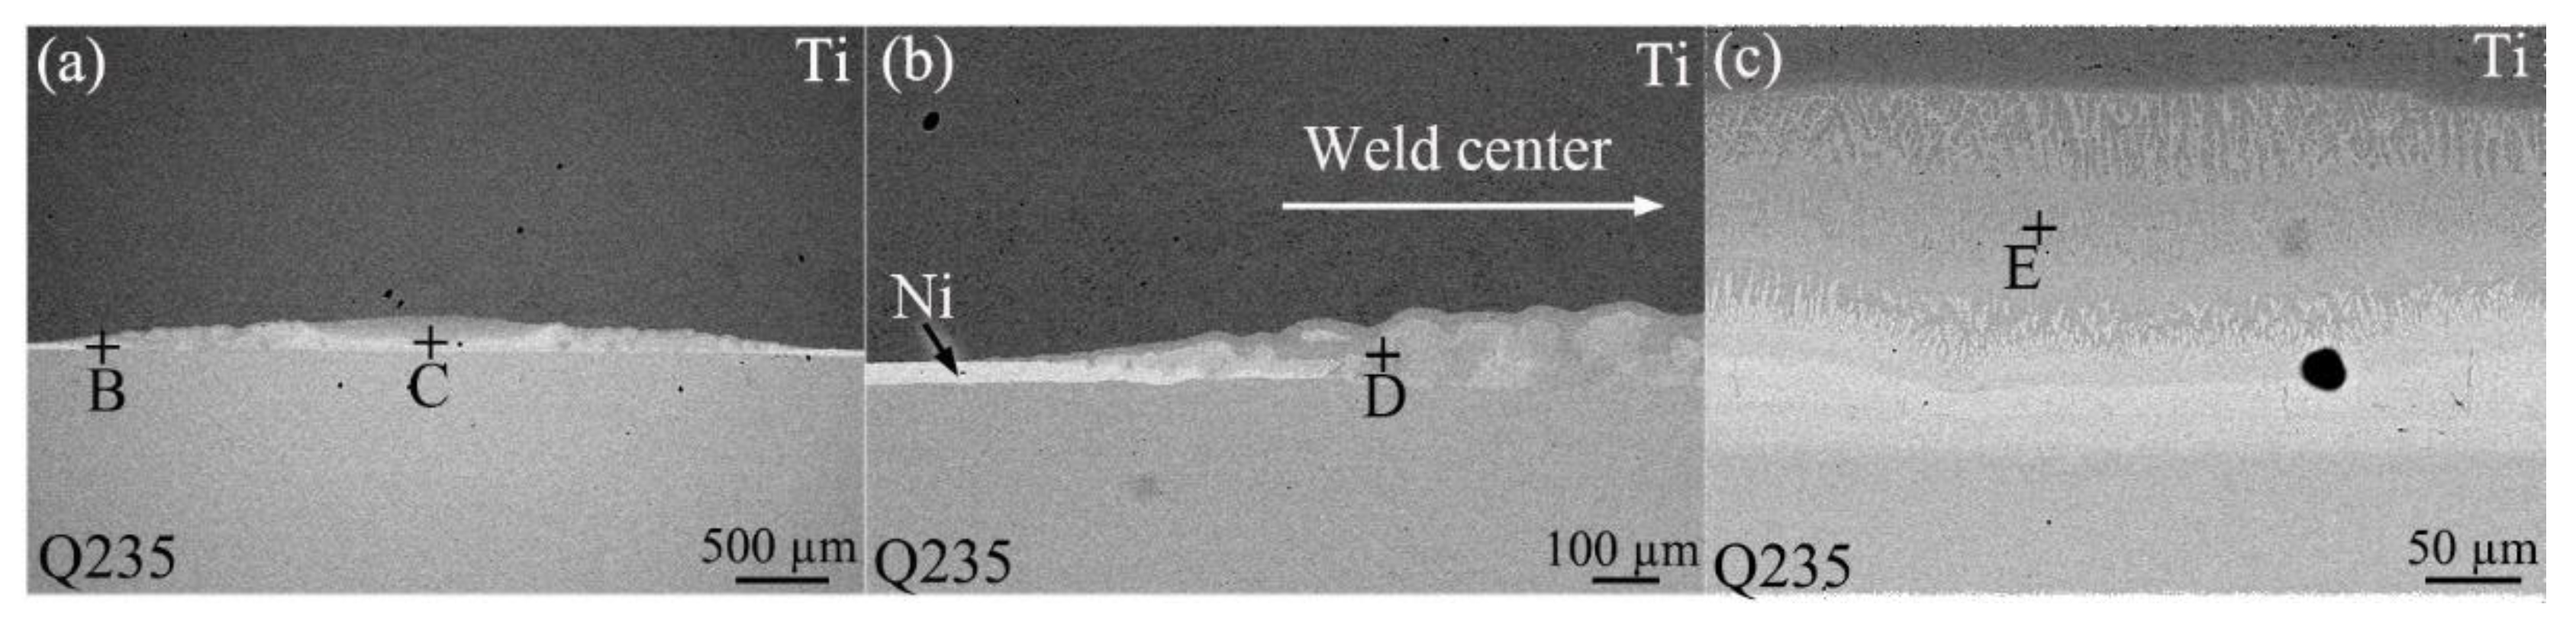
Figure 4.
XRD results and SEM images of Ti/steel joint with DS-nugget, (a) XRD results obtained from the cross-section of joint; (b) enlarged image at location D in Figure 3; (c) enlarged image at location E in Figure 3.
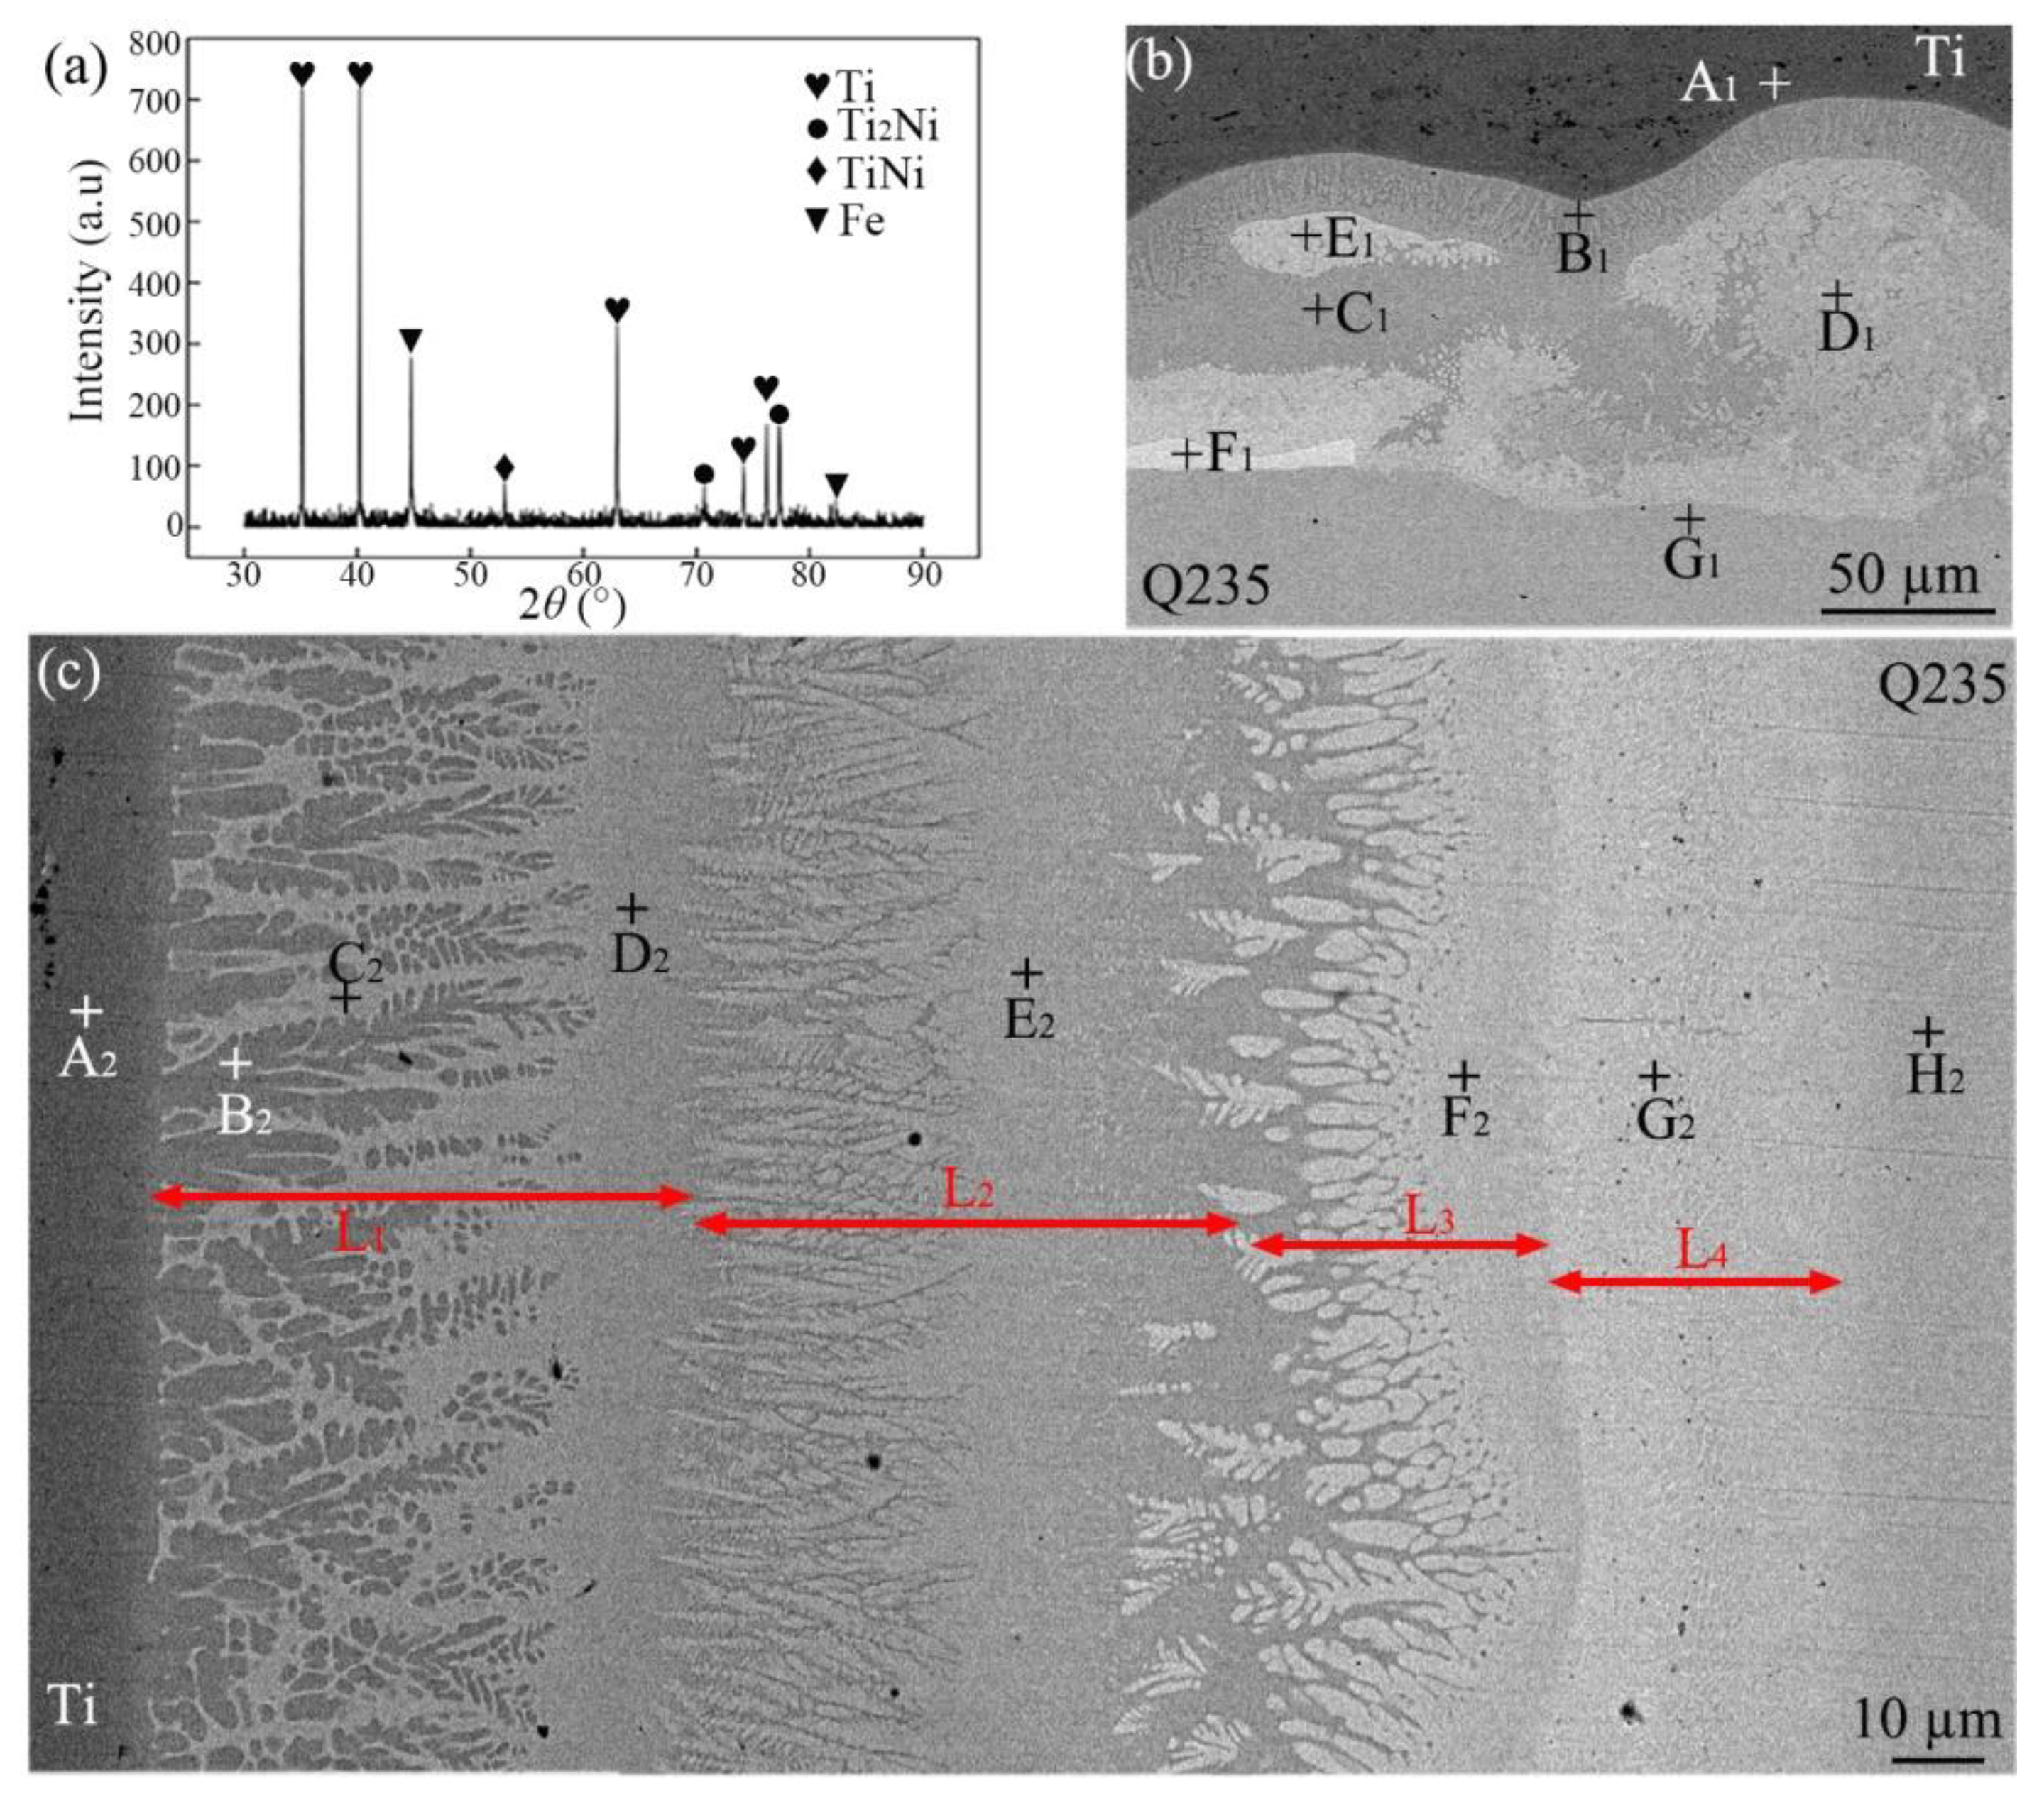
Figure 5.
SEM images and EDS results of Ti/steel joint with C-nugget, (a) SEM image of cross-section; (b) EDS results; (c), (d), (e) and (f) enlarged image taken from A, B, C and, respectively.
Figure 5.
SEM images and EDS results of Ti/steel joint with C-nugget, (a) SEM image of cross-section; (b) EDS results; (c), (d), (e) and (f) enlarged image taken from A, B, C and, respectively.
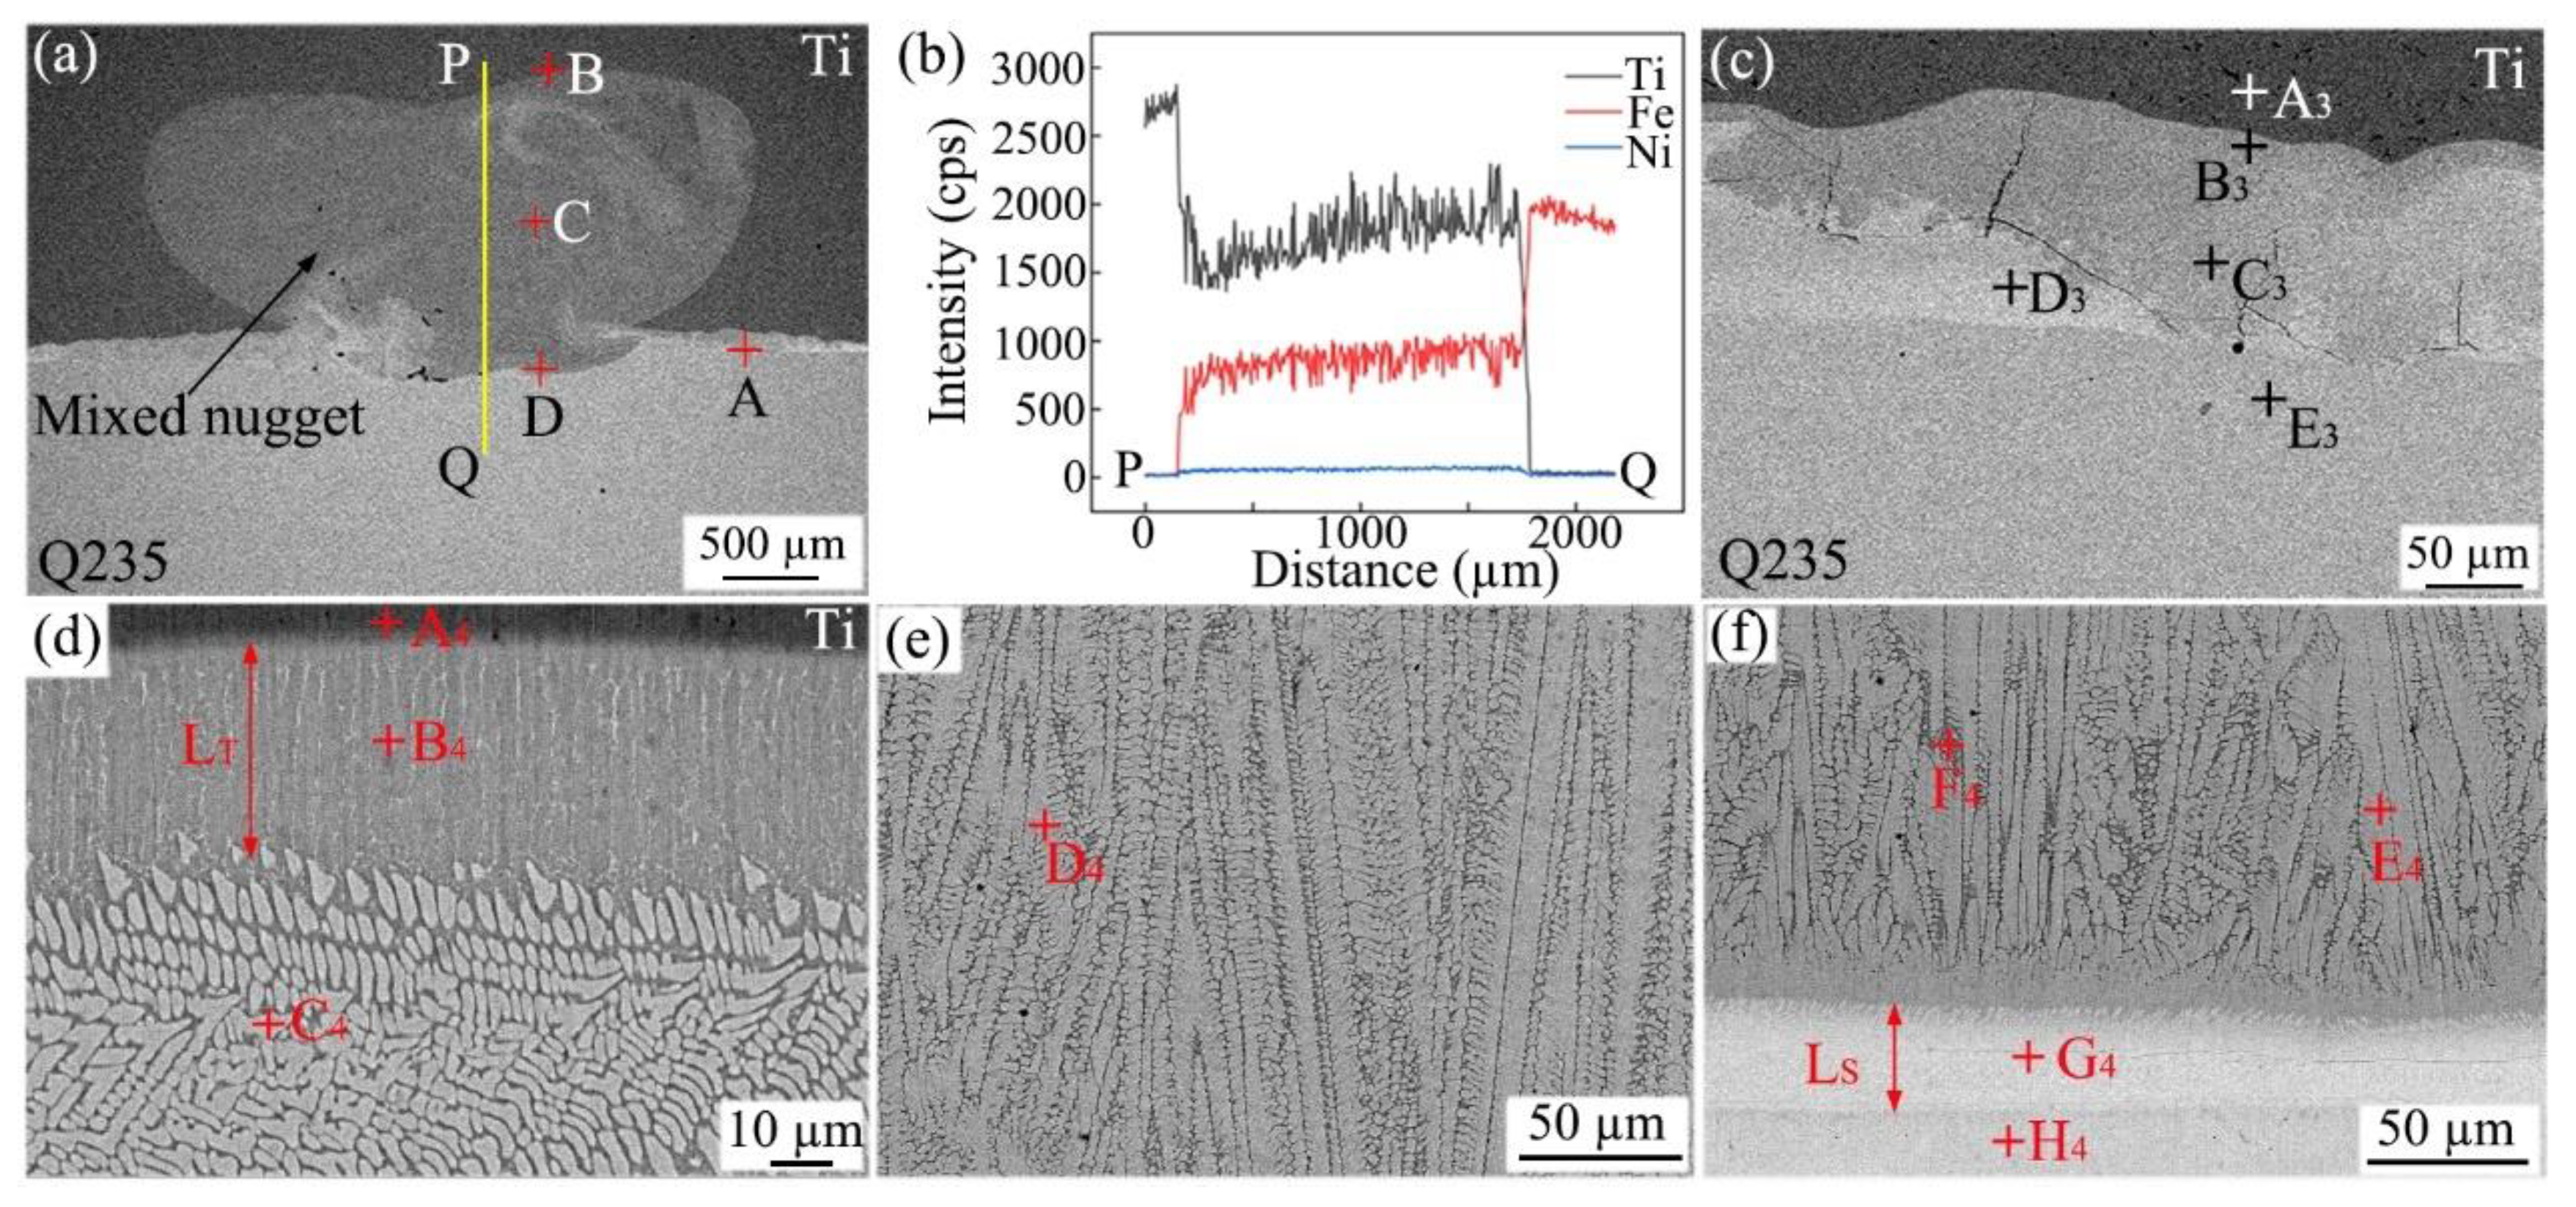
Figure 6.
Effect of welding current on the nugget diameter and tensile shear load of the Ti/steel joint, (a) nugget diameter; (b) tensile shear load.
Figure 6.
Effect of welding current on the nugget diameter and tensile shear load of the Ti/steel joint, (a) nugget diameter; (b) tensile shear load.
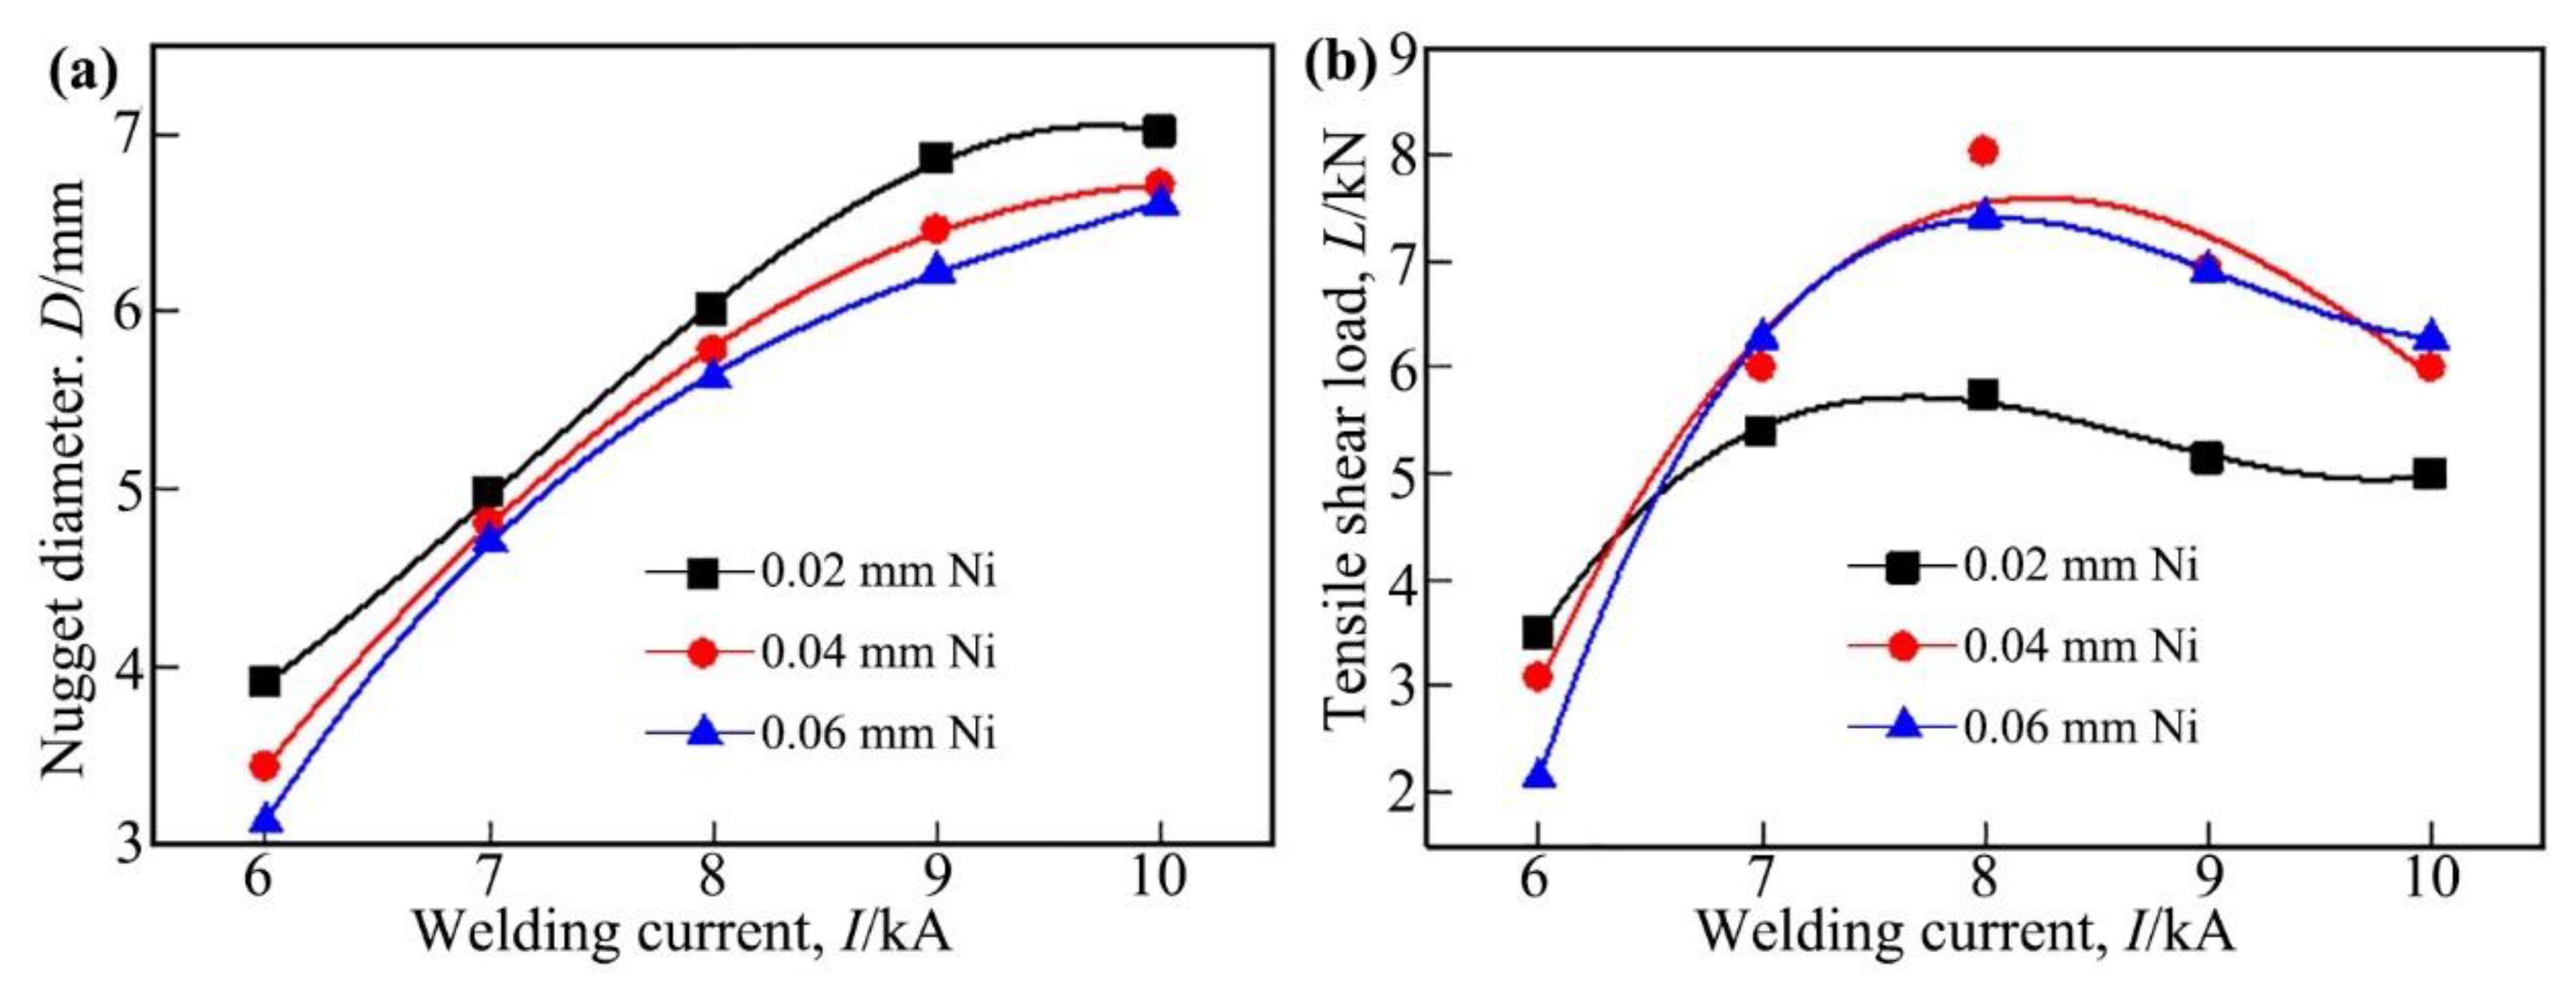
Figure 7.
Effect of welding time on the nugget diameter and tensile shear load of the Ti/steel joint, (a) nugget diameter; (b) tensile shear load.
Figure 7.
Effect of welding time on the nugget diameter and tensile shear load of the Ti/steel joint, (a) nugget diameter; (b) tensile shear load.
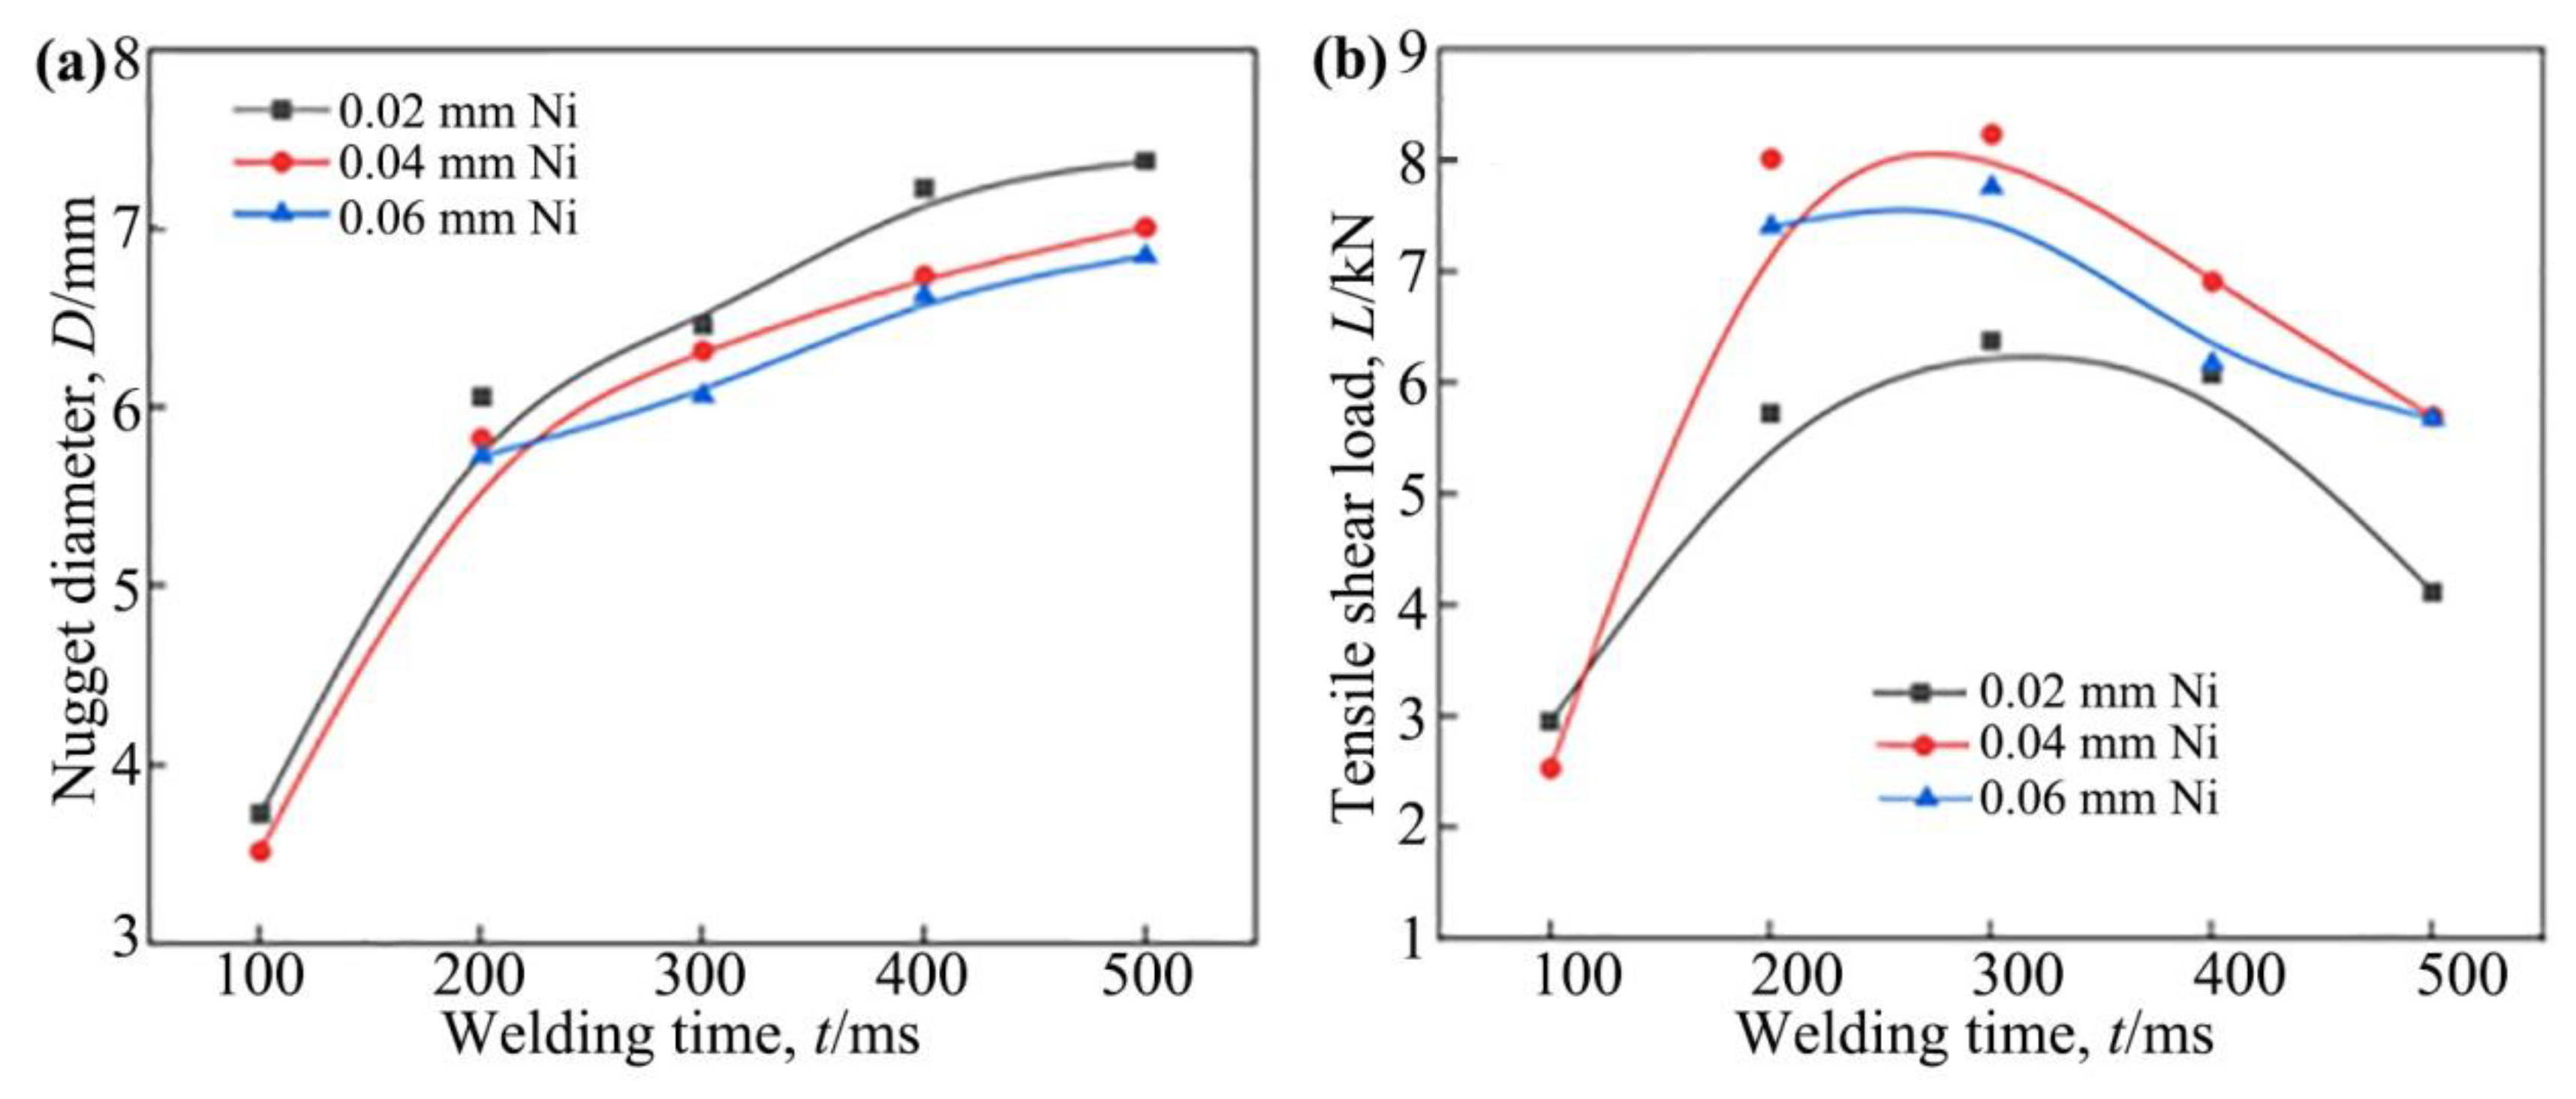
Figure 8.
Fractures of Ti/steel joint, (a) Ti side of joint containing DS-nugget; (b) steel side of joint containing DS-nugget; (c) Ti side of joint with C-nugget; (d) steel side of joint with C-nugget.
Figure 8.
Fractures of Ti/steel joint, (a) Ti side of joint containing DS-nugget; (b) steel side of joint containing DS-nugget; (c) Ti side of joint with C-nugget; (d) steel side of joint with C-nugget.
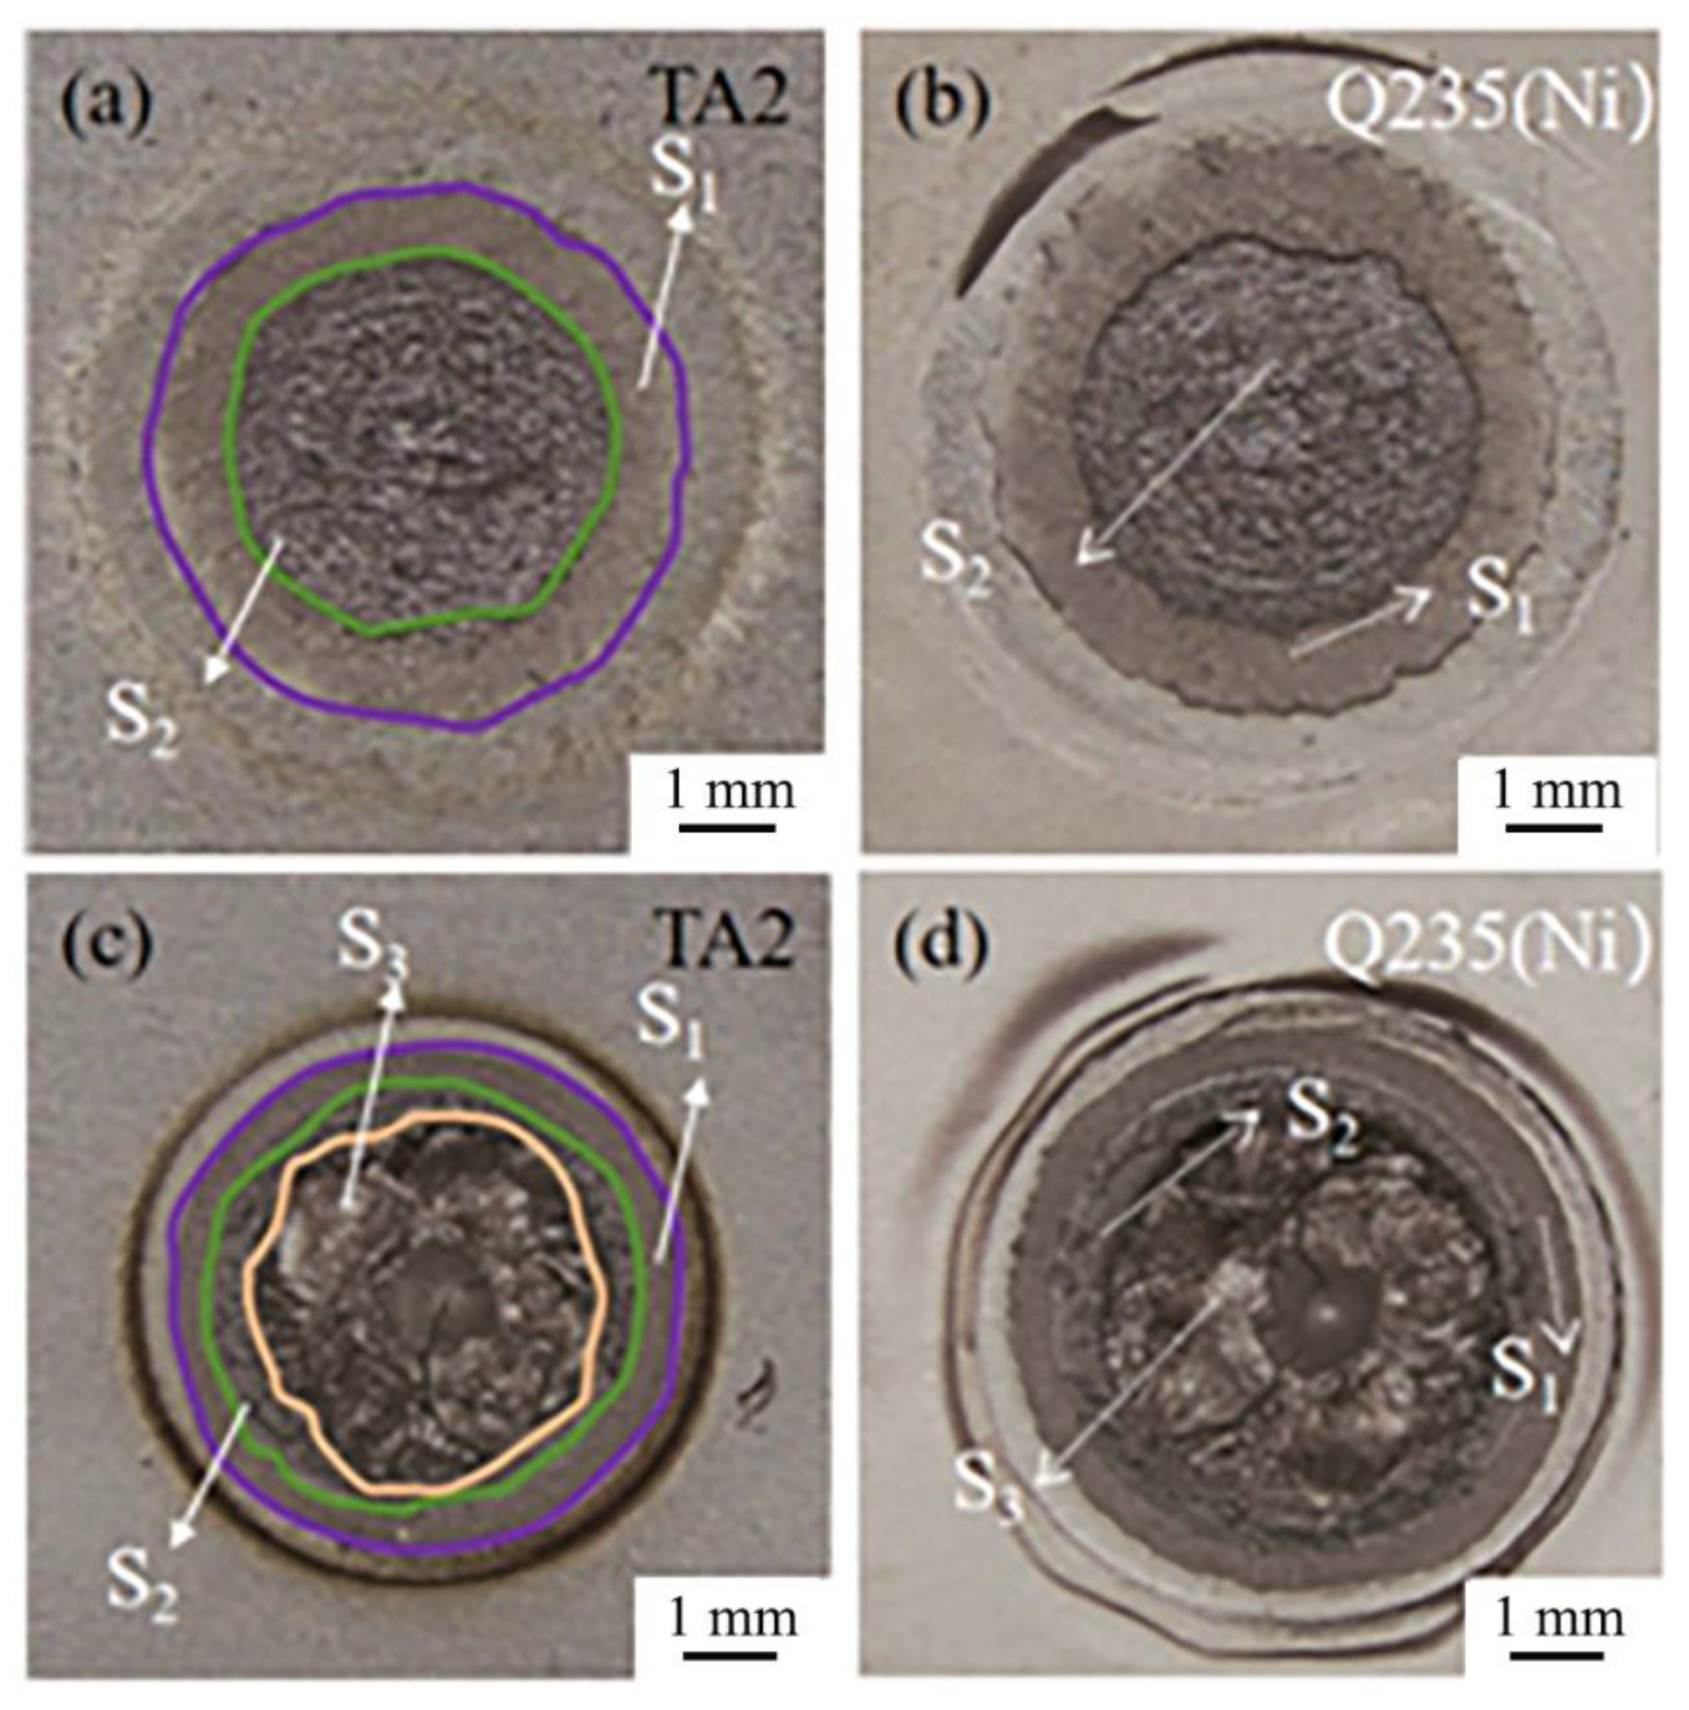
Figure 9.
EDS results on the fractures, (a1)~ (a4) composite image of SEM and EDS layered images for steel and Ti sides of the joint with DS-nugget and C-nugget; (b1)~ (b4) distribution of Ti on the fractures of steel and Ti sides of the joint with DS-nugget and C-nugget; (c1)~ (c4) distribution of Ni on the fractures of steel and Ti sides of the joint with DS-nugget and C-nugget; (d1)~ (d4) distribution of Fe on the fractures of steel and Ti sides of the joint with DS-nugget and C-nugget;.

Figure 10.
Area of each region and its proportion.
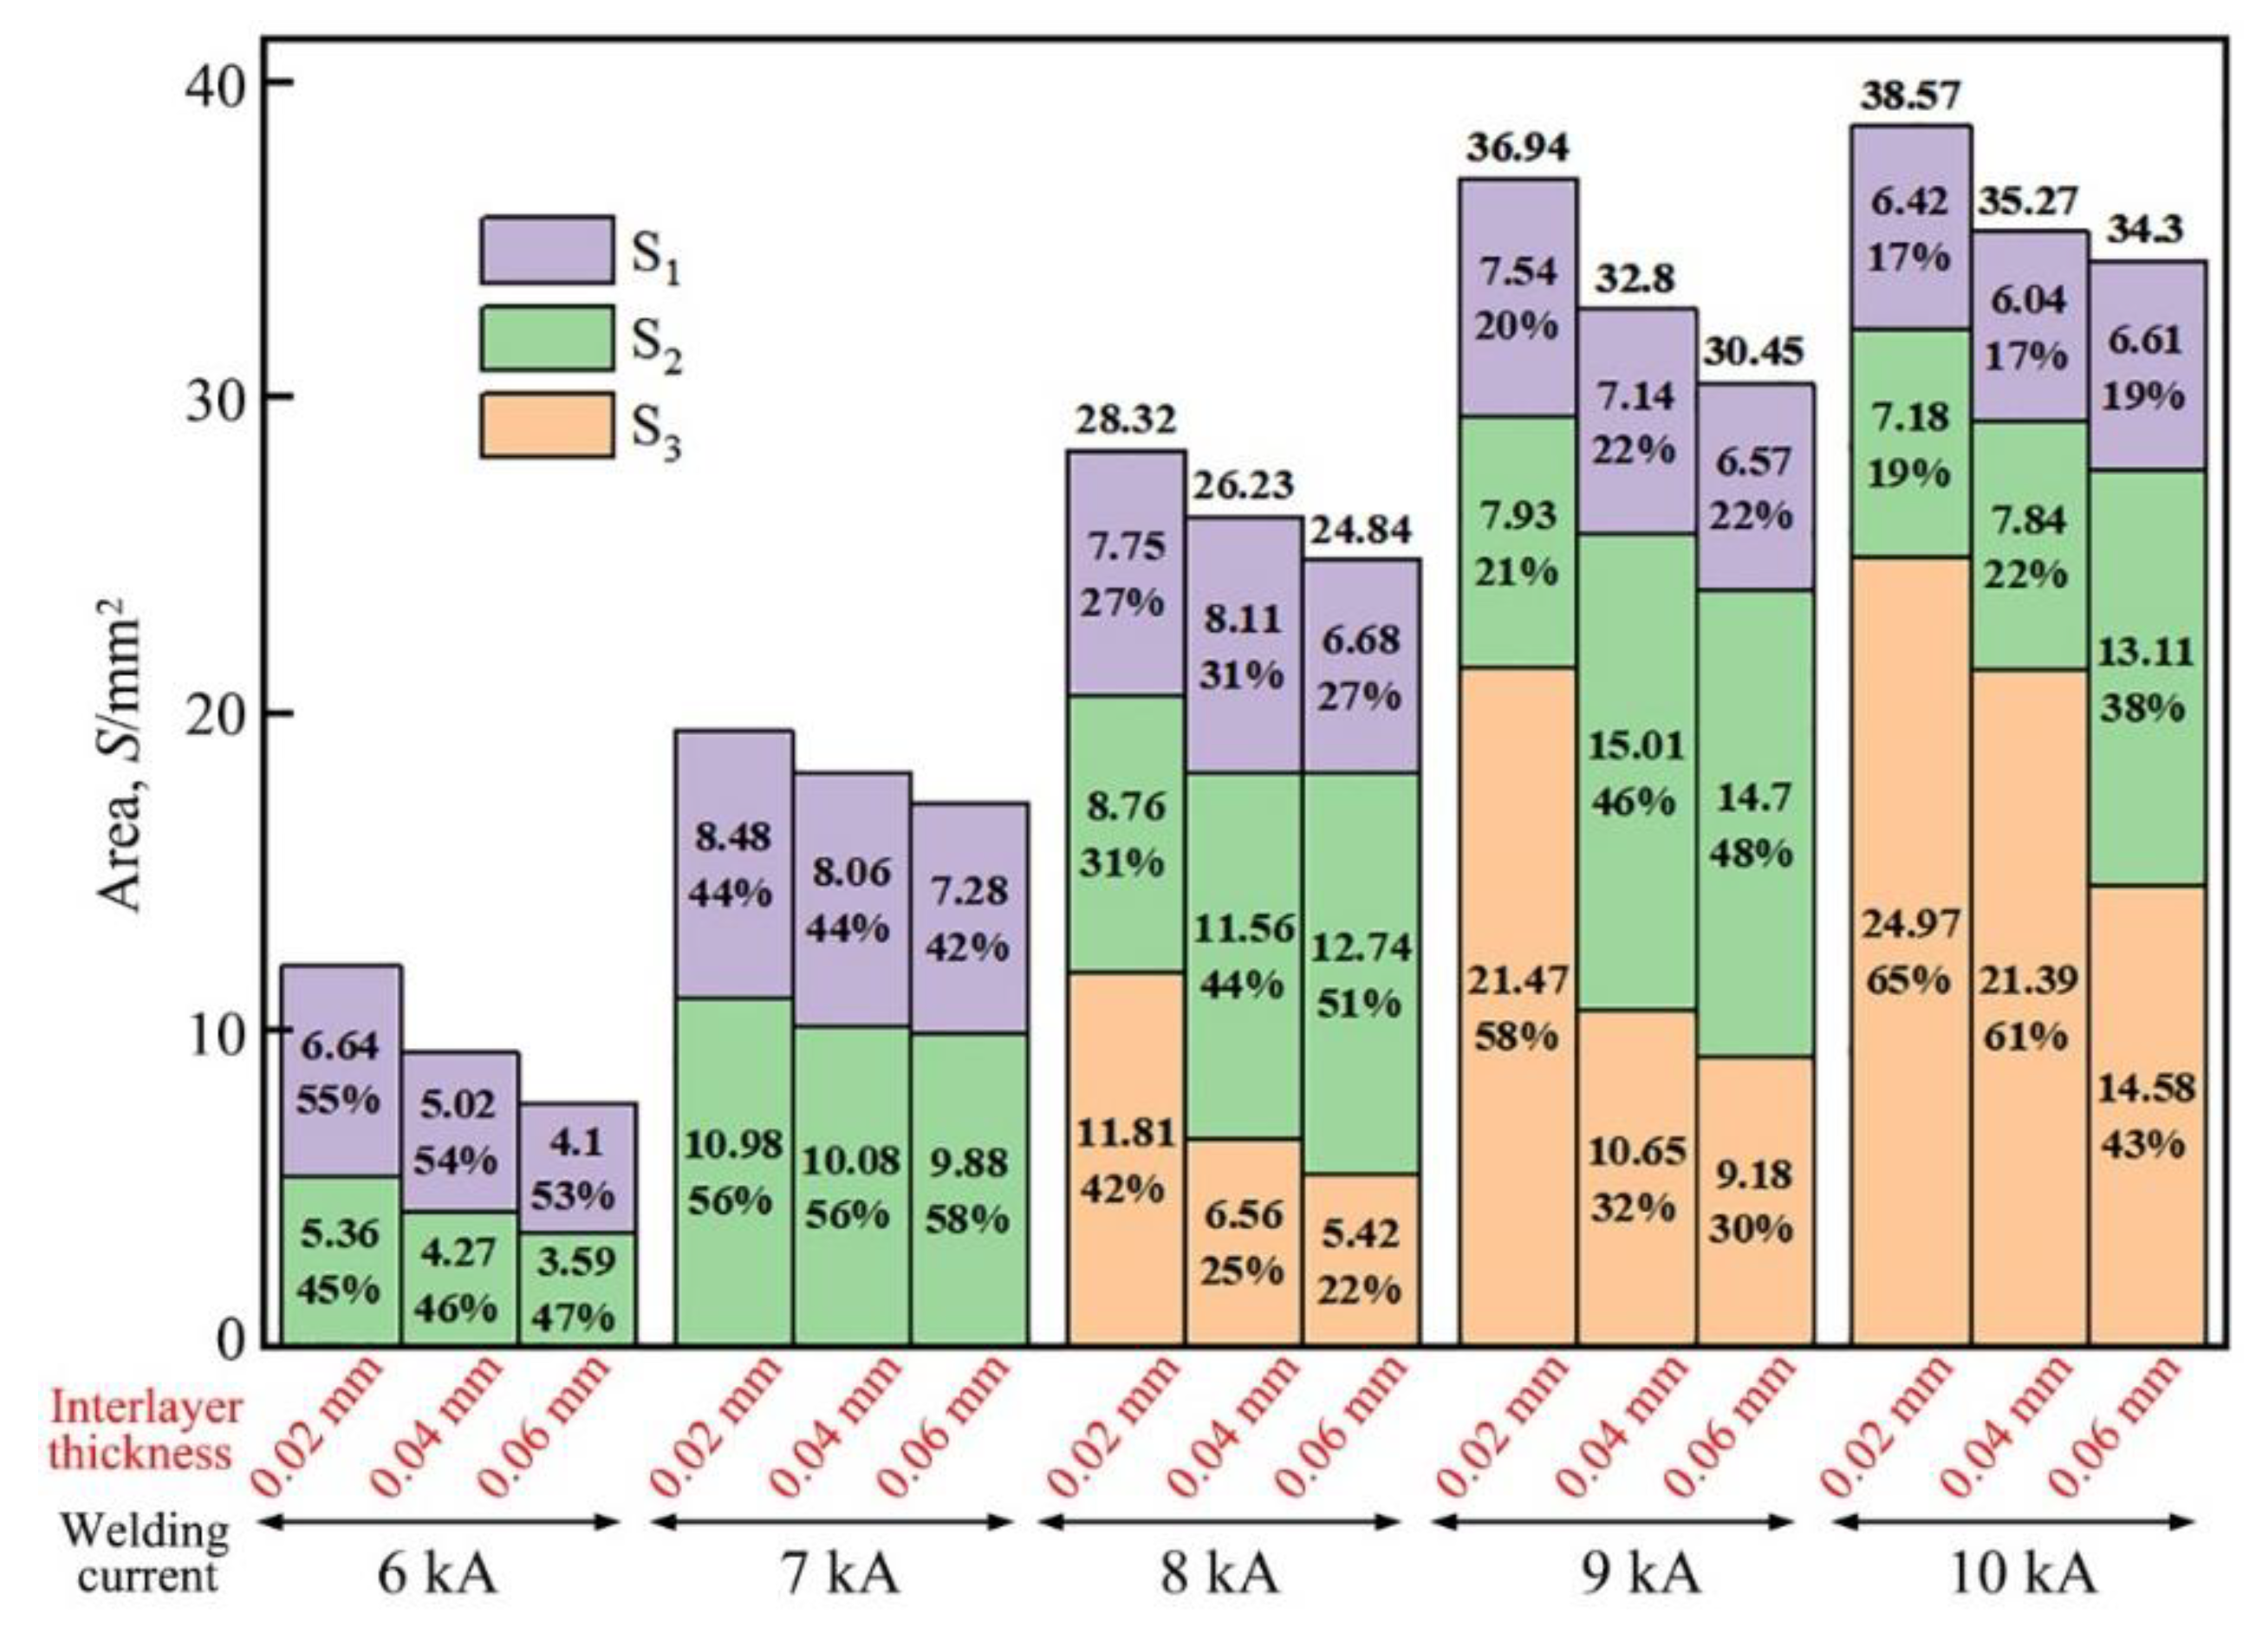

Table 1.
Chemical compositions of the experimental materials (mass fraction,%).
| C | N | H | O | Fe | Mn | P | S | Si | V | Ti | |
|---|---|---|---|---|---|---|---|---|---|---|---|
| TA2 | 0.01 | 0.02 | 0.002 | 0.14 | 0.07 | - | - | - | - | - | Bal. |
| Q235 | 0.14 | - | - | - | Bal. | 1.0 | 0.04 | 0.02 | 0.4 | 0.06 | - |
Table 2.
Welding conditions.
| Changing welding current | Changing welding time | ||||||
| Interlayer thickness (mm) | 0.02 | 0.04 | 0.06 | 0.02 | 0.04 | 0.06 | |
| Welding current (kA) | 6~10 | 6~10 | 6~10 | 8 | 8 | 8 | |
| Welding time (ms) | 200 | 200 | 200 | 100~500 | 100~500 | 100~500 | |
| Electrode force (kN) | 3 | 3 | 3 | 3 | 3 | 3 | |
Table 3.
EDS results of each location marked in Figure 4 (at.%).
Table 3.
EDS results of each location marked in Figure 4 (at.%).
| A1 | B1 | C1 | D1 | E1 | F1 | G1 | A2 | B2 | C2 | D2 | E2 | F2 | G2 | H2 | |
|---|---|---|---|---|---|---|---|---|---|---|---|---|---|---|---|
| Ti | 99.4 | 76.0 | 70.5 | 49.9 | 49.8 | 0.6 | 0.0 | 99.3 | 88.1 | 74.1 | 70.4 | 45.9 | 33.1 | 4.3 | 0.0 |
| Fe | 0.0 | 0.0 | 0.0 | 0.0 | 0.0 | 3.7 | 99.8 | 0.0 | 0.0 | 0.0 | 0.0 | 2.7 | 17.1 | 83.1 | 100 |
| Ni | 0.6 | 24.0 | 29.5 | 50.1 | 50.2 | 95.7 | 0.2 | 0.7 | 11.9 | 25.9 | 29.6 | 51.4 | 49.8 | 12.6 | 0.0 |
Table 4.
EDS results of each location marked in Figure 5 (at.%).
Table 4.
EDS results of each location marked in Figure 5 (at.%).
| A3 | B3 | C3 | D3 | E3 | A4 | B4 | C4 | D4 | E4 | F4 | G4 | H4 | |
|---|---|---|---|---|---|---|---|---|---|---|---|---|---|
| Ti | 100 | 73.6 | 49.4 | 46.4 | 0.2 | 100 | 67.9 | 55.2 | 52.9 | 47.1 | 66.7 | 21.9 | 0.0 |
| Fe | 0.0 | 11.2 | 18.1 | 9.3 | 99.8 | 0.0 | 29.9 | 42.1 | 43.7 | 48.7 | 32.6 | 77.5 | 100 |
| Ni | 0.0 | 15.2 | 32.5 | 44.3 | 0.0 | 0.0 | 2.9 | 2.7 | 3.4 | 4.2 | 0.7 | 0.6 | 0.0 |
Disclaimer/Publisher’s Note: The statements, opinions and data contained in all publications are solely those of the individual author(s) and contributor(s) and not of MDPI and/or the editor(s). MDPI and/or the editor(s) disclaim responsibility for any injury to people or property resulting from any ideas, methods, instructions or products referred to in the content. |
© 2025 by the authors. Licensee MDPI, Basel, Switzerland. This article is an open access article distributed under the terms and conditions of the Creative Commons Attribution (CC BY) license (http://creativecommons.org/licenses/by/4.0/).
Copyright: This open access article is published under a Creative Commons CC BY 4.0 license, which permit the free download, distribution, and reuse, provided that the author and preprint are cited in any reuse.


