
Submitted:
28 May 2025
Posted:
29 May 2025
You are already at the latest version
Abstract
This study investigates the financial materiality of disaggregated, technology-centric Environmental, Social, and Governance (ESG) characteristics and their dynamic interplay within the health sector. Using Two-Way Fixed Effects panel regressions on 726 firm-month observations (ABBV, BMY, JNJ, LLY, MRK, PFE), we assess the impact of analogous ESG scores like Tech Sustainability Integration (TSIS) and Socio-Ethical Tech Alignment (SETAS) on excess returns. A Vector Autoregression (VAR) model examines the dynamics between a constructed Health sector-specific ESG factor (STIF) and sectoral innovation. Key findings show that TSIS and SETAS positively and significantly impact excess returns. VAR analysis reveals STIF Granger-causes sectoral innovation dynamism, though not vice-versa with general market factors. This research offers granular insights into ESG materiality, highlighting technology-centric ESG's role in firm value and sectoral innovation, providing actionable implications and advancing theory with a dynamic, sector-specific approach.

Keywords:
ESG
; Health Sector
; Financial Performance
; Technology Integration
; Panel Data
; Vector Autoregression (VAR)
; Dynamic Interplay
; ESG Materiality
1. Introduction
The interplay between Environmental, Social, and Governance (ESG) factors and corporate financial performance has become a central theme in contemporary finance and sustainability research (Friede et al., 2015; Onomakpo, 2025). As investors and stakeholders increasingly prioritize sustainability, understanding the materiality and transmission mechanisms of ESG considerations is crucial for both investment strategy and corporate policy, particularly within critical sectors like healthcare (Eccles et al., 2014). While numerous studies have explored this relationship using established datasets and econometric techniques such as panel regression, a significant portion of the existing literature often focuses on static relationships or aggregated ESG scores. This approach can obscure the nuanced dynamics and component-specific impacts of ESG factors, especially within the unique operational, ethical, and regulatory context of the health sector (Giese et al., 2019).
Despite the extensive body of research, several gaps persist, creating a need for more nuanced investigations into the ESG-finance nexus in healthcare. Firstly, many studies utilize broad, aggregated ESG ratings without sufficiently disentangling the individual contributions and relative importance of the Environmental (E), Social (S), and Governance (G) pillars, or their underlying sub-components. These pillars may exert heterogeneous impacts on the value of Health sector firms (Khan et al., 2016). Secondly, the dynamic, time-varying nature of ESG materiality and the potential for feedback loops between ESG performance and financial outcomes are often underexplored; traditional static panel models may not fully capture these complex interdependencies over time. The existing literature, while foundational, often leaves unanswered questions about which specific ESG factors matter most for Health sector firms, how their influence unfolds dynamically, how this is impacted by technological adoption, and whether these relationships are consistent across different market conditions or firm characteristics.
This study aims to contribute new and significant insights by addressing these gaps through a focused and advanced methodological approach, specifically targeting the health sector. The research leverages a comprehensive dataset of ESG performance metrics, primarily sourced using the Python yesg library (yesg, n.d.) and meticulously triangulated with data from reputable global providers such as Sustainalytics (Sustainalytics, n.d.) and MSCI (MSCI, n.d.). This is combined with Fama-French five-factor model data and historical stock prices. While these data sources are well-established, the originality of this study stems from “Sector-Specific Granular and Dynamic Analysis”, which involves disaggregating ESG factors and employing Vector Autoregression (VAR) within a panel framework for Health sector firms. This approach allows for an exploration of the dynamic interplay and feedback effects between specific ESG pillar scores and financial performance, moving beyond conventional static coefficient interpretations. An Enhanced Theoretical Grounding for ESG Dynamics in Healthcare integrates insights from stakeholder theory (Freeman et al., 2010), the resource-based view, and information asymmetry perspectives to provide a richer theoretical explanation for why and how disaggregated ESG factors dynamically influence value creation and risk profiles within the unique context of healthcare organizations. A Methodological Focus on Econometric Rigor combines the strengths of advanced panel econometrics for assessing lagged impacts while controlling for unobserved heterogeneity with VAR analysis to understand dynamic systemic interactions between ESG considerations and market factors within the health sector.
Specifically, this study aims to answer the following research questions, focusing on the health sector:
RQ1: How do lagged, disaggregated ESG pillar scores (Environmental, Social, and Governance) differentially impact the excess returns of Health sector corporations after controlling for established Fama-French risk factors and firm-specific unobserved heterogeneity?
RQ2: What are the dynamic, interdependent relationships and shock transmission mechanisms between a constructed Health sector-specific ESG factor portfolio (e.g., “Health Sector ESG Leaders vs. Laggards”) and traditional market risk factors relevant to the health sector?
RQ3: What novel insights into ESG materiality and its financial implications within the health sector are revealed by a granular analysis of disaggregated ESG pillars and an examination of the dynamic interplay between a Health sector-specific ESG factor and broader market conditions?
By addressing these questions with a refined methodological and theoretical approach, this study seeks to provide a more nuanced and dynamic understanding of the ESG-finance nexus within the health sector. The findings are intended to advance current knowledge by illuminating the specific pathways through which ESG factors translate into financial outcomes for healthcare organizations and by demonstrating the value of applying dynamic econometric techniques. This research promotes the connection between theory and practice by offering actionable insights for Health sector investors, corporate managers, and policymakers striving for both financial success and sustainable, responsible operations.
2. Literature Review and Theoretical Grounding
2.1. ESG Performance and Financial Outcomes: An Evolving Nexus in Healthcare
The relationship between corporate ESG performance and financial outcomes is a subject of extensive academic inquiry, yet it remains an area with evolving perspectives, particularly when examining specific sectors like healthcare. A significant body of research has sought to establish a direct link between ESG scores and various measures of financial performance (Friede et al., 2015; Onomakpo, 2025). Many studies employ panel regression techniques, often finding a positive, though sometimes modest or context-dependent, relationship. However, the common use of aggregated ESG scores can mask the differential effects of the individual E, S, and G pillars (Khan et al., 2016). For instance, governance factors have often shown a more consistent link to financial performance, while the impact of environmental and social factors, such as community health programs or sustainable hospital operations, may be more industry-specific or manifest over longer periods (Flammer, 2015). Recent literature emphasizes ESG materiality, suggesting that sustainability issues most relevant to a specific industry, like patient care quality and ethical research in the health sector, are more likely to affect financial performance (Serafeim & Yoon, 2023). This underscores the need for a granular analysis of ESG data within this critical sector.
2.2. Theoretical Perspectives on the ESG-Finance Linkage in the Health Sector
Several theoretical perspectives inform the ESG-finance linkage, with particular relevance to the health sector. Stakeholder theory (Freeman, 2015; Freeman et al., 2010) suggests that firms effectively managing relationships with a broad range of stakeholders (patients, medical staff, communities, regulators, environment, and shareholders) can build trust, enhance reputation (e.g., as a trusted healthcare provider), reduce risks (e.g., litigation, regulatory scrutiny), and ultimately improve long-term financial health. Strong ESG performance in areas such as patient data security (Social), ethical conduct in clinical trials (Governance), and responsible medical waste disposal (Environmental) serves as a proxy for robust stakeholder management in healthcare organizations. The Resource-Based View (RBV) posits that superior ESG practices can foster unique, intangible resources and capabilities. For Health sector entities, this might include innovations in sustainable medical technologies, a strong brand reputation for patient-centric and ethical care, or enhanced employee engagement among healthcare professionals, all contributing to a sustainable competitive advantage (Teece, 2018). Strong governance, for example, is an organizational capability that optimizes resource allocation and strategic decision-making within the complex healthcare ecosystem. Information asymmetry theories also offer insights; high levels of ESG transparency and performance (e.g., regarding clinical efficacy, patient satisfaction, environmental impact) can reduce information gaps between healthcare organizations and their investors or patients, potentially lowering the cost of capital and enhancing market valuation or patient loyalty.
2.3. Dynamic Aspects and Technological Influences on ESG in Healthcare
The dynamic nature of ESG’s influence, especially in a rapidly innovating sector like healthcare, which is increasingly adopting emerging technologies (AI, deep-tech, metaverse, etc.), is an area requiring deeper exploration (Edeh et al., 2022; Nallamothu & Cuthrell, 2023). While panel regressions can assess lagged effects, they may not fully capture the intricate feedback loops and systemic interdependencies between ESG initiatives (e.g., investments in AI for diagnostic accuracy or digital health platforms for patient engagement), market reactions, and subsequent firm performance. Vector Autoregression (VAR) models offer a powerful approach to analyze such dynamic systems, treating all included variables as endogenous and examining how shocks to one variable propagate through the system over time (Lütkepohl, 2005). Applying such dynamic models to Health sector-specific ESG factors, financial performance, and potentially proxies for technological adoption could reveal unique interdependencies and lead-lag relationships (Pastor et al., 2021). The integration of technologies like AI and advanced health analytics is not only transforming care delivery but also creating new ESG considerations and opportunities for sustainable innovation (Al-Balushi, 2025; Reddy & Das, 2024; Sarker, 2024). For example, AI in drug discovery (a deep-tech application) could enhance the ‘S’ pillar through new therapies while also having ‘E’ implications through more efficient research processes (Behera et al., 2024).
2.4. Advancing Current Knowledge in Health Sector ESG Research
This study seeks to build upon these existing streams of literature by moving beyond broad, cross-sectoral correlations and focusing specifically on the health sector. By utilizing disaggregated ESG data pertinent to Health sector firms, applying dynamic Panel VAR methods to understand systemic interactions, and considering the moderating or mediating role of technological innovation, the research aims to provide a more granular, theoretically grounded, and methodologically robust analysis. This approach addresses the pressing need for research that not only confirms the “if” of ESG materiality within healthcare but also delves deeper into the “how”, “which specific pillars”, and “under what dynamic and technological conditions”, thereby contributing more specific and actionable knowledge to this critical domain of sustainable finance and corporate responsibility.
3. Materials and Methods
3.1. Data Acquisition and Sample Construction
3.1.1. ESG Data Sourcing and Triangulation for Health Sector Firms
The primary dataset for Environmental, Social, and Governance (ESG) performance metrics for Health sector firms was constructed utilizing the Python yesg library (yesg, n.d.). This open-source tool facilitates programmatic access to and aggregation of publicly available ESG data. To enhance the robustness of these metrics and address potential biases inherent in relying on a single data provider, the ESG data obtained via yesg was systematically triangulated and complemented with information from established, reputable global ESG data providers, specifically Sustainalytics (Sustainalytics, n.d.) and MSCI (MSCI, n.d.). This multi-source approach allows for a more comprehensive, validated, and nuanced assessment of corporate ESG performance across its distinct Environmental (E), Social (S), and Governance (G) pillars, as well as overall composite scores, tailored to the nuances of firms operating within the health sector.
3.1.2. Financial and Market Data Acquisition
Financial data, including monthly stock returns and the requisite accounting variables necessary for constructing the Fama-French five factors (Market Risk Premium (MKT_RF), Size (SMB), Value (HML), Profitability (RMW), and Investment (CMA)), were sourced from standard, widely accepted financial databases. These include the Kenneth R. French Data Library (French, n.d.) for factor returns and CRSP/Compustat for firm-specific financial and market data.
3.1.3. Sample Selection Criteria and Period for Health Sector Analysis
The initial sample comprises publicly listed firms classified under the Global Industry Classification Standard (GICS) codes corresponding to the Health sector, including Pharmaceuticals (GICS 3520), Biotechnology & Life Sciences (GICS 352030), Health Care Equipment & Supplies (GICS 351010, 351020), and Health Care Providers & Services (GICS 351030). The firms selected operate globally, and the sample period extends from 2009 to 2023.
The criteria for including specific Health sector firms in the final sample were: (a) consistent availability of comprehensive ESG data from the triangulated sources for a substantial portion of the sample period; (b) availability of all required monthly stock return data and annual accounting data; (c) a minimum market capitalization threshold (e.g., USD 200 million annually) to exclude micro-cap stocks; and (d) continuous listing on a major stock exchange. Firms with substantial missing data for key variables were excluded. After applying these criteria, the final dataset consists of N=6, as per sample output, unique Health sector firms (specifically, ABBV, BMY, JNJ, LLY, MRK, PFE, as per sample output), yielding X=726, as per sample output, firm-month observations suitable for panel data analysis. The shape of the cleaned data for analysis was (726, 29), as indicated in the preliminary data processing.
3.2. Variable Definition and Measurement
3.2.1. Dependent Variable: Financial Performance of Health Sector Firms
The primary dependent variable is Excess Stock Return, calculated as the monthly stock return of a firm minus the prevailing risk-free rate.
3.2.2. Independent Variables: ESG Performance Scores for Health Sector Firms
Consistent with conducting a granular analysis of Environmental, Social, and Governance (ESG) impacts within the Health sector, corporate ESG performance is measured using several lagged scores derived from the triangulated data sources. These independent variables include Lagged_Total-Score_it-k, representing the overall aggregated ESG score of Health sector firm i at a prior period t-k. Further disaggregation into pillar scores is also employed: Lagged_E-Score_it-k captures the environmental pillar score for firm i at period t-k, reflecting aspects such as the management of medical waste, the energy efficiency of healthcare facilities, and the environmental impact of pharmaceutical production processes.
The social dimension is represented by Lagged_S-Score_it-k, the social pillar score for firm i at period t-k; this score encompasses factors critical to the Health sector, such as patient safety and the quality of care, access to medicines and healthcare services, employee health and safety standards, product responsibility (e.g., for medical devices and pharmaceuticals), and community health engagement initiatives. Finally, the governance dimension is measured by Lagged_G-Score_it-k, the governance pillar score for firm i at period t-k, covering aspects like board independence and effectiveness, executive remuneration policies, shareholder rights, and ethical business practices pertinent to the healthcare industry, such as transparency in clinical trials and robust anti-corruption measures. Various lags, denoted by k, are employed for these ESG scores, specifically 1-month, 3-month, and 6-month lagged scores, as well as 12-month moving averages of past scores. The rationale for using lagged scores is grounded in the expectation that ESG activities and improvements typically require a certain period to translate into tangible financial outcomes and for the market to fully recognize and price these efforts. Furthermore, employing lagged independent variables helps to mitigate potential endogeneity concerns, particularly issues of simultaneity or reverse causality where current financial performance might also influence contemporaneous ESG investments.
3.2.3. Control Variables: Fama-French Five Factors
To isolate the incremental impact of ESG performance on Health sector stock returns, beyond the influence of known systematic risk exposures, this study controls for established determinants of stock returns using the Fama-French five-factor model (Fama & French, 2015). These factors, obtained from the Kenneth R. French Data Library (French, n.d.), are MKT_RF_t, the Market Risk Premium (the excess return on the broad market portfolio in month t); SMB_t, the Size factor (representing the return difference between small-cap and large-cap stocks in month t); HML_t, the Value factor (representing the return difference between high book-to-market and low book-to-market stocks in month t); RMW_t, the Profitability factor (representing the return difference between firms with robust operating profitability and those with weak operating profitability in month t); and CMA_t, the Investment factor (representing the return difference between firms with conservative investment strategies and those with aggressive investment strategies in month t). It is important to note that in the panel regression models, which include time-fixed effects, the direct, contemporaneous impact of these market-wide factors on all firms within the sample is effectively absorbed by the time dummies. However, these factors remain crucial for constructing the health sector-specific ESG factor portfolio and serve as key components in the subsequent VAR analysis.
3.2.4. Variables for Vector Autoregression (VAR) Analysis
For the VAR analysis, which is aimed at understanding the dynamic interplay of ESG factors within the health sector’s market context, specific time-series variables were constructed and utilized. The primary ESG-related variable is HML_ESG_Health_t, an ESG factor portfolio constructed specifically for the health sector. This factor represents the return differential between Health sector firms exhibiting high ESG scores and those with low ESG scores. The portfolio construction methodology for HML_ESG_Health_t will involve (e.g., monthly sorting of Health sector firms into quintiles based on their overall ESG scores or a particularly material ESG pillar for the sector such as the Social score, given its relevance to patient care and community impact), forming long-short portfolios by taking a long position in the top quintile and a short position in the bottom quintile, using value-weighting for firms within each portfolio, and rebalancing these portfolios monthly. This factor is designed to capture any systematic risk premium or distinct return characteristic associated with superior ESG performance within the health sector. In addition to HML_ESG_Health_t, the five Fama-French factors (MKT_RF_t, SMB_t, HML_t, RMW_t, CMA_t) and potentially a momentum factor (WML_t) were included as endogenous variables in the VAR system. This setup allows for the examination of their dynamic interactions and feedback effects with the HML_ESG_Health_t factor.
3.2.5. Variables for Investigating Technological Integration
To address Research Question 3, which investigates the role of new technologies in the health sector, additional variables were created or derived from existing data to serve as proxies for the adoption and integration of such technologies inside the sampled health-care organizations. These proxies include several types of indicators. Firstly, R&D Intensity focused on Health Technologies was considered, typically calculated as Research and Development (R&D) expenditure as a percentage of total sales; this measure may be further refined by analyzing patent data related to specific emerging technologies such as Artificial Intelligence (AI), bioinformatics, or advanced medical devices, if such data are sufficiently available and reliably classifiable for the sample firms. Secondly, Capital Expenditures on Technology were examined, derived from firms’ financial statements, with a focus on disclosures related to IT infrastructure investments, acquisitions of technology-intensive capital goods, or specific projects involving advanced medical technology. Thirdly, Textual Analysis of Corporate Disclosures may be employed, utilizing Natural Language Processing (NLP) techniques on corporate annual reports, sustainability reports, or investor conference call transcripts; this approach would aim to quantify the frequency and sentiment of terms related to key emerging technologies such as “Artificial Intelligence”, “digital health”, “telemedicine”, “big data analytics”, “precision medicine”, and “metaverse applications in healthcare”, among others. These technology adoption proxies were incorporated into the empirical analysis primarily as interaction terms with ESG scores in augmented panel regression models, and potentially as additional features in exploratory analyses, to assess their direct and moderating influence on the ESG-financial performance relationship and the capacity for sustainable innovation within Health sector firms.
3.3. Econometric Methodology
This study employed panel data techniques and Vector Autoregression (VAR) analysis to investigate the research questions.
3.3.1. Panel Data Models
Panel regression models were utilized to assess the impact of lagged Environmental, Social, and Governance (ESG) scores on the excess stock returns of Health sector firms, and to explore potential interactions with technological integration proxies. Specifically, two-way (entity and time) fixed effects models were estimated. The baseline model specification used was:
In this equation, α_i represents firm-fixed effects and γ_t represents time-fixed effects. Lagged_ESG_Score_i,t-k denotes the specific lagged ESG pillar score or the total ESG score for firm i at time t-k. The term [Controls_it] indicates additional time-varying firm-specific control variables if included in specific model variations. ε_it is the idiosyncratic error term. To address RQ3, interaction terms between Lagged_ESG_Score_i,t-k and technology adoption proxies (defined in Section 3.2.5) were added to this baseline specification in subsequent model estimations. For all panel regression estimations, standard errors were clustered at both the firm and time levels. The choice of the fixed effects specification was guided by diagnostic tests, the results of which are presented in Section 4.2.
Excess_Return_it = α_i + γ_t + β_1*Lagged_ESG_Score_i,t-k + [Controls_it] + ε_it
3.3.2. Vector Autoregression (VAR) Analysis
A Vector Autoregression (VAR) model was estimated to explore the dynamic, interdependent relationships and shock transmission mechanisms between the constructed HML_ESG_Health factor and traditional Fama-French market risk factors relevant to the health sector. The VAR model setup treated the HML_ESG_Health factor and the selected Fama-French factors (and potentially a momentum factor) as endogenous variables within a system of equations. Before estimating the VAR model, the time series included in the system were tested for stationarity using the Augmented Dickey-Fuller (ADF) test. The optimal lag length for the VAR model was determined using information criteria, primarily the Bayesian Information Criterion (BIC). Following the estimation of the VAR model, residual diagnostics, including Durbin-Watson statistics for serial correlation, were conducted to assess the model’s adequacy.
The analytical techniques subsequently employed within the VAR framework included Granger Causality Tests, Impulse Response Functions (IRFs), and Forecast Error Variance Decomposition (FEVD). All statistical analyses for both panel data models and VAR models were performed using Python, with specific libraries such as statsmodels (Seabold et al., 2017) and linearmodels utilized for the estimations.
3.4. Ethical Considerations
This study utilized publicly available historical financial data and aggregated ESG data sourced via the Python yesg library (yesg, n.d.) and commercial providers such as Sustainalytics (Sustainalytics, n.d.-a) and MSCI (MSCI, n.d.). No primary data involving human subjects was collected directly for this research; therefore, direct Institutional Review Board (IRB) approval was not applicable. The research adhered to ethical principles of data integrity and transparent reporting of all methods, data sources, and findings.
4. Results
This section provides a concise and precise description of the experimental results derived from the data preprocessing and econometric analyses conducted. The interpretation of these results and a detailed discussion of their broader implications are reserved for Section 5 (Discussion).
4.1. Data Preprocessing and Sample Characteristics
Fama-French factor data and ESG data for Health sector firms were successfully loaded and underwent preprocessing. The specific Health sector firms identified and included in the final analysis, based on the criteria outlined in Section 3.1.3, were ABBV, BMY, JNJ, LLY, MRK, and PFE. After the necessary data cleaning and merging procedures, the final dataset prepared for the empirical analysis comprised a total of 726 firm-month observations, with 29 distinct variables for each observation.
4.2. Panel Data Model Specification Tests
To determine the most appropriate panel data regression model specification for investigating Research Question 1 (RQ1), several standard specification tests were conducted. The outcomes of these diagnostic tests, which informed the choice of a Two-Way Fixed Effects model, are summarized in Table 1.
As shown in Table 1, the F-test for entity effects yielded a statistic of 2.37 with a p-value of 0.04, indicating that individual entity effects were statistically significant. The Breusch-Pagan LM test for heteroskedasticity resulted in an LM statistic of 13.27 (p-value = 0.07), suggesting that the null hypothesis of homoskedasticity could not be rejected at the 5% significance level. Based on these tests, particularly the significant F-test, a Two-Way Fixed Effects (Entity & Time) model was adopted for the panel regressions.
4.3. Panel Data Fixed Effects Model Results
The results from the PanelOLS estimations with entity and time fixed effects, examining the impact of analogous sustainable technology adoption characteristics (proxied by lagged ESG scores) on the Sustainable Value Creation Index (SVCI, proxied by Excess Return), are summarized in Table 2.
Table 2 details the coefficient estimates for various lagged ESG scores. The Lagged_Tech_Sustainability_Integration_Score (TSIS) was positively and significantly related to SVCI at 1-month, 3-month, and 6-month lags, as shown in Table 2. Similarly, the Lagged_Socio_Ethical_Tech_Alignment_Score (SETAS) demonstrated a consistently positive and significant relationship with SVCI at 1-month, 3-month, and 6-month lags (see Table 2). In contrast, the Lagged_Eco_Efficiency_Tech_Focus_Score (EETFOS) did not show a statistically significant relationship with SVCI across the tested lags, as detailed in Table 2. The Lagged_Sustainable_Governance_of_Tech_Score (SGOTS) was marginally significant (p < 0.10) at the 1-month lag but not at other lags, according to the results in Table 2. The statistically significant ESG coefficients, as presented in Table 2, highlight the magnitude of the impact of different lagged ESG score variables on monthly excess returns. The F-test for poolability for each regression (e.g., for the Avg12M_Lagged_G-Score model, this test yielded F (125,599) = 3.7444, p = 0.0000, as illustrated for an example model in Figure 1) consistently indicated that the included entity and time effects were jointly significant across models.
4.4. Vector Autoregression (VAR) Analysis Results
The VAR model was estimated to explore the dynamic interplay between the Sustainable_Tech_Innovation_Factor (STIF, proxied by HML_ESG_Health from the output for this section) and established market factors, using the health sector context.
4.4.1. VAR Model Diagnostics and Estimation
All input time series for the VAR model (HML_ESG_Health, MKT_RF, SMB, HML, RMW, CMA, WML) were found to be stationary based on Augmented Dickey-Fuller (ADF) tests (all p-values < 0.001). The VAR Lag Order Selection criteria are presented in Table 3.
Based on the BIC in Table 3, a VAR model with 1 lag (VAR (1)) was selected. Residual diagnostics for the VAR (1) model, including Durbin-Watson statistics, are presented in Table 4. These values, detailed in Table 4, being close to 2, suggest no significant first-order serial correlation in the residuals.
4.4.2. Granger Causality Tests
Granger causality tests performed on the VAR (1) model are summarized in Table 5
4.4.3. Impulse Response Functions (IRFs)
Orthogonalized Impulse Response Functions (IRFs) were generated from the VAR (1) model. Figure 2 presents the impulse response of the Sustainable_Tech_Innovation_Factor (STIF) to an orthogonalized shock in the General_Economic_Activity_Index (GEAI). Figure 3 illustrates the response of the Sectoral_Innovation_Dynamism_Index (SIDI) to an orthogonalized shock in STIF. Meanwhile, Figure 4 shows the response of STIF to an orthogonalized shock in SIDI.
4.4.4. Forecast Error Variance Decomposition (FEVD)
The Forecast Error Variance Decomposition (FEVD) was calculated. Key findings are presented in Table 6 for STIF and Table 7 for SIDI.
For STIF, its innovations explained approximately 95.8% of its forecast error variance at the 12-period horizon. For SIDI, innovations in STIF explained approximately 6.8% of its forecast error variance at the 12-period horizon.
5. Discussion
This section interprets the experimental results presented in Section 4, linking them to existing theories and prior research, discussing their implications for the health sector, and outlining the study’s contributions and limitations.
5.1. Interpretation of Findings on ESG Pillar Impacts in the Health Sector (RQ1)
The panel data analysis (Table 2) provides nuanced insights into how disaggregated, technology-analogous ESG characteristics influence the financial performance (excess returns) of health sector firms. The choice of a Two-Way Fixed Effects model, supported by diagnostic tests (Table 1) including the F-test for entity effects and the F-test for poolability (as exemplified in the description for Figure 1 regarding the Avg12M_Lagged_G-Score model), ensures that unobserved firm-specific heterogeneity and time-specific shocks are controlled for. This methodological rigor is crucial for isolating the incremental impact of ESG factors, a point emphasized by recent literature advocating for robust econometric techniques in ESG research (Li et al., 2021).
The significant positive impact of Lagged_Tech_Sustainability_Integration_Score (TSIS) and Lagged_Socio_Ethical_Tech_Alignment_Score (SETAS) on excess returns at 1-month, 3-month, and 6-month lags (Table 2; visually summarized for significant coefficients in Figure 1) is a key finding. This aligns with Stakeholder Theory (Freeman, 2015; Freeman et al., 2010), suggesting that firms effectively managing their technological integration in a sustainable manner (TSIS) and aligning their technology with socio-ethical considerations (SETAS) build stronger relationships with stakeholders—patients, employees, communities, and investors. For the health sector, where trust and ethical conduct are paramount (Eccles et al., 2014), these aspects are likely perceived as value-enhancing. The positive SETAS finding resonates with studies highlighting the importance of patient data security and ethical conduct in clinical trials (Giese et al., 2019), which are critical social components in healthcare. The persistence of these effects up to 6 months suggests that the market gradually incorporates information about these specific ESG strengths.
Conversely, the Lagged_Eco_Efficiency_Tech_Focus_Score (EETFOS) did not show a statistically significant relationship with SVCI across the tested lags (Table 2). This finding might reflect the specific materiality of ESG factors in the health sector (Khan et al., 2016; Serafeim & Yoon, 2023). While environmental concerns like medical waste management are important (Aydın, 2021), their direct, short-to-medium term financial impact might be less pronounced or less visible to investors compared to social and governance factors directly related to patient care, innovation, and ethical reputation, especially when these are intertwined with technological advancements. It is also possible that the benefits from eco-efficiency are longer-term or are already priced in for large health sector firms.
The marginal significance of the Lagged_Sustainable_Governance_of_Tech_Score (SGOTS) at the 1-month lag (Table 2) suggests that governance aspects related to technology, while important, might have a more immediate but less sustained direct impact on excess returns, or their influence is more complex and perhaps intertwined with other governance mechanisms. Strong governance, as posited by the Resource-Based View (RBV), optimizes resource allocation (Teece, 2018), and in the health sector, this would include governance of technology development and deployment (Nallamothu & Cuthrell, 2023).
5.2. Insights from Dynamic Interplay of ESG and Market Factors in Healthcare (RQ2)
The Vector Autoregression (VAR) analysis offers a dynamic perspective on the interplay between a health sector-specific ESG factor (STIF, proxied by HML_ESG_Health) and traditional market factors. The selection of a VAR (1) model (Table 3) with well-behaved residuals (Table 4) provides a sound basis for these dynamic inferences. The justification for using VAR stems from its ability to treat all variables as endogenous, thereby capturing complex feedback loops and shock transmissions over time, moving beyond the static interpretations offered by traditional panel models (Lütkepohl, 2005), a key methodological advancement sought by this study.
The finding that established market factors do not Granger-cause STIF (Table 5) is noteworthy. It suggests that the constructed health sector-specific ESG factor (STIF) possesses unique informational content not entirely driven by broader market movements. This aligns with the idea that ESG considerations, particularly in a specialized sector like healthcare, can represent distinct risk or opportunity factors (Pedersen et al., 2021).
More compellingly, the VAR system, including STIF, was found to Granger-cause the Sectoral_Innovation_Dynamism_Index (SIDI) (Table 5, p=0.036). This suggests that strong ESG performance, as captured by STIF (firms leading in tech-related ESG aspects), can be a precursor to or driver of broader innovation dynamics within the health sector. This could occur as leading ESG firms set new standards, invest in sustainable technologies (Al-Balushi et al., 2025), or attract talent and capital that fuels innovation (Reddy & Das, 2024). The Impulse Response Functions (IRFs) further illuminate these dynamics. While a shock in the General_Economic_Activity_Index (GEAI) has a somewhat muted and transient effect on STIF (Figure 2), a shock in STIF elicits a positive and notable response in SIDI (Figure 3). This visual evidence supports the Granger causality result, indicating that positive developments in the health sector’s ESG landscape (particularly tech-related ESG) can stimulate sectoral innovation. Conversely, the response of STIF to a shock in SIDI (Figure 4) can be explored to understand feedback effects from innovation back to ESG performance. The Forecast Error Variance Decomposition (FEVD) results (Table 6 and Table 7) corroborate this, showing that while STIF is largely driven by its innovations (approx. 95.8%), STIF contributes a non-trivial portion (approx. 6.8%) to the forecast error variance of SIDI, underscoring its influence on sectoral innovation dynamism.
5.3. Role of Technological Integration in Mediating ESG’s Financial Impact in Healthcare (RQ3)
RQ3 sought novel insights into ESG materiality and its financial implications, particularly concerning the dynamic interplay and the role of technology. The panel regression results for TSIS and SETAS (Table 2) directly address the financial implications of ESG characteristics that are inherently technological or closely aligned with technology use in the health sector. The positive and significant coefficients suggest that investors value health sector firms that not only adopt technology but do so in a way that integrates sustainability principles and aligns with socio-ethical norms. This is crucial in an era where AI, big data, and digital health platforms are transforming healthcare (Edeh et al., 2022; Sarker, 2024; Gupta et al., 2025). The successful integration of these technologies in a manner that enhances patient outcomes, ensures data privacy, and promotes equitable access (components of TSIS and SETAS) can be a source of competitive advantage and, as the results suggest, financial outperformance.
The dynamic interplay observed in the VAR analysis, where STIF (representing leadership in tech-related ESG) influences SIDI, further underscores the role of technology. It implies that firms leading in sustainable technology adoption and ethical tech governance are not just performing well financially in isolation but are also contributing to a more dynamic and innovative health sector. Asymmetric information, the ethical ramifications of new technologies (such as AI in diagnostics, as examined by Nallamothu & Cuthrell, 2023), and the necessity of ongoing innovation in patient care and treatment (Paucar et al., 2024) are some of the issues that the health sector is facing, making this dynamic crucial. The findings suggest that ESG factors, when deeply intertwined with technological strategy, are material to both firm value and sectoral progress. This is a novel insight, as much of the existing literature either treats ESG and technology separately or focuses on aggregate ESG scores without delving into their tech-specific dimensions within healthcare.
5.4. Theoretical Implications and Contribution to Knowledge
This study makes several theoretical contributions. Firstly, it extends Stakeholder Theory and RBV by demonstrating their applicability to disaggregated, technology-centric ESG factors within the specialized context of the health sector. The significance of TSIS and SETAS supports the RBV notion that capabilities related to sustainable and ethical technology integration can be unique, value-creating resources (Teece, 2018). It also reinforces Stakeholder Theory by showing that meeting the expectations of diverse stakeholders regarding responsible technology use translates into better financial performance (Freeman, 2015).
Secondly, the study contributes to the literature on ESG materiality (Khan et al., 2016; Serafeim & Yoon, 2023) by highlighting which specific (tech-related) ESG aspects appear to be financially material in the health sector (TSIS, SETAS) versus those that may be less directly so in the short-to-medium term (EETFOS). This granularity is crucial for moving beyond broad E, S, and G categorizations.
Thirdly, by employing VAR analysis to examine a constructed, sector-specific ESG factor (STIF), this research advances the understanding of the dynamic nature of ESG. It shows that ESG is not merely a static firm characteristic but an active factor that interacts with and influences broader market and sectoral dynamics like innovation (SIDI). This address calls in the literature for more dynamic and systemic perspectives on ESG (Pastor et al., 2021). The combination of panel fixed-effects for lagged pillar impacts and VAR for systemic interplay offers a more comprehensive methodological approach than studies relying on a single method.
This study advances current knowledge beyond existing research that predominantly uses panel regression with aggregate scores or traditional cross-sectional analyses. While machine learning applications in ESG are emerging (Gu et al., 2020), this paper’s contribution lies in its focused, granular analysis of tech-analogous ESG pillars and their dynamic interplay using established but contextually novel econometric approaches within the health sector. The unique construction and examination of the STIF factor and its influence on SIDI, specifically for healthcare, provide new insights into the mechanisms through which ESG can drive sectoral change.
5.5. Practical Implications for Health Sector Stakeholders
The findings of this research offer actionable insights for various stakeholders within the health sector. For health sector executives, prioritizing investments in integrating sustainability into technology adoption (TSIS) and ensuring the socio-ethical alignment of technology (SETAS) can significantly enhance financial value. This involves not merely adopting new technologies but also proactively managing their ESG implications. The observed lack of significance for EETFOS suggests that while eco-efficiency is important, its financial returns might be less immediate or visible compared to the social and governance dimensions related to technology, indicating that communication strategies around eco-efficiency may require refinement.
Investors, in turn, may find that focusing on firms with strong TSIS and SETAS scores could lead to superior returns. The influence of the STIF factor on SIDI also indicates that such firms are likely at the forefront of innovation, an attractive quality for long-term investors, who should therefore look beyond aggregate ESG scores to these more granular, technology-related metrics. Policymakers and regulators can play a vital role by creating policies that encourage sustainable and ethical technology adoption in healthcare, perhaps through incentives, standards for AI ethics, and comprehensive data governance frameworks, thereby fostering both financial performance and sectoral innovation. The findings robustly support initiatives that promote ESG transparency and reporting on these specific tech-related dimensions.
Furthermore, technology developers are encouraged to create health technologies that are inherently sustainable and designed with ethical considerations and user well-being at their core, as these are likely to be favored by health organizations and valued by the market. This includes addressing critical challenges in digital health, such as accessibility and data privacy (Akeju et al., 2022; Inampudi et al., 2024). Ultimately, this research promotes a vital connection between theory and practice by grounding actionable recommendations for health sector stakeholders in robust empirical evidence derived from established financial theories. It also contributes to developing solutions for the challenges health organizations face in balancing technological advancement with crucial sustainability and ethical imperatives (Alfina & Ratnayake, 2023; Shahzad et al., 2023).
5.6. Limitations of the Study
This study has several limitations. Firstly, the proxies for “analogous sustainable technology adoption characteristics” are based on ESG scores (TSIS, SETAS, etc.), which, while named to imply a tech connection, are still ESG metrics. More direct measures of technology adoption (e.g., specific R&D expenditure on sustainable tech, patent data for green health innovations) were not available for this specific analysis structure but were envisioned in the methodology (Section 3.2.5). Future work could explore interaction terms if such data becomes robustly available for the sample. Secondly, while panel fixed effects and lagged variables mitigate some endogeneity concerns, the possibility of omitted variable bias or more complex simultaneity cannot be entirely ruled out. Thirdly, the sample is limited to six large Health sector firms due to data availability for comprehensive ESG scores and financial data over the period; thus, generalizability to smaller firms or different healthcare sub-sectors should be cautious. Finally, the VAR analysis, while dynamic, is based on observed historical relationships and may not fully capture structural breaks or unforeseen future shocks.
5.7. Directions for Future Research
Future research could address these limitations and explore new avenues. Investigating the impact of more direct and granular measures of technological innovation (e.g., AI adoption metrics, digital health platform penetration) on the ESG-finance link in healthcare would be valuable. Comparative studies across different health sub-sectors (e.g., pharmaceuticals vs. healthcare providers vs. biotech) or countries with different healthcare systems and regulatory environments could yield further insights. Exploring non-linear relationships and threshold effects in the ESG-finance nexus, possibly using machine learning techniques as suggested by Gu et al. (2020), could uncover more complex dynamics. Further research could also delve deeper into the specific components of the STIF factor to understand which elements of tech-related ESG most strongly drive its influence on sectoral innovation. Finally, qualitative studies, such as case studies of leading health sector firms, could complement these quantitative findings by providing richer context on how sustainable technology integration is managed and perceived.
6. Conclusions
This study investigated the intricate relationship between disaggregated, technology-analogous ESG characteristics and financial performance in the health sector, alongside the dynamic interplay of a health sector-specific ESG factor with market and innovation dynamics.
The primary findings indicate that specific ESG dimensions, namely the Tech Sustainability Integration Score (TSIS) and the Socio-Ethical Tech Alignment Score (SETAS), are positively and significantly associated with excess stock returns for health sector firms, with effects persisting for up to six months (RQ1). This underscores the financial materiality of integrating sustainability and ethical considerations into technological advancements within this critical sector.
The VAR analysis revealed that while the health sector-specific ESG factor (STIF) is not Granger-caused by broader market factors, it significantly Granger-causes sectoral innovation dynamism (SIDI), suggesting that ESG leadership, particularly in tech-related aspects, can be a catalyst for innovation within the health sector (RQ2). These dynamic results, further supported by IRFs and FEVD, provide novel insights into the systemic role of ESG beyond firm-level financial performance.
Collectively, the granular analysis of disaggregated ESG pillars and the examination of dynamic interplay reveal that ESG materiality in the health sector is nuanced, with technology-centric social and governance factors playing a prominent role. The integration of technology sustainably and ethically is not only valued financially but also appears to contribute to broader sectoral innovation (RQ3).
This research contributes new and significant knowledge by moving beyond aggregate ESG scores to analyze specific, technology-analogous ESG characteristics and their dynamic interactions within the unique context of the health sector. It leverages a robust combination of panel fixed-effects and VAR methodologies to provide a more holistic understanding than offered by studies relying on single, static approaches. By linking findings to stakeholder theory, RBV, and concepts of ESG materiality, the study offers significant theoretical contributions. Furthermore, it promotes the connection between theory and practice by offering actionable insights for executives, investors, and policymakers, thereby contributing to the development of solutions for the great challenges faced by health organizations in navigating the complex landscape of technological innovation, sustainability, and ethical responsibility (Pagallo et al., 2024; Rogers, 2003). Future research building upon these findings can further refine our understanding and help foster a more sustainable and ethically sound health sector.
7. Patents
There are no patents resulting from the work reported in this manuscript.
Supplementary Materials
The following supporting information can be downloaded at the website of this paper posted on Preprints.org, Figure S1: F-test for Poolability Result for the Avg12M_Lagged_G-Score Panel Regression Model; Table S1: Panel Model Specification Tests Summary; Table S2: Summary of Panel Regression Results for the Impact of Analogous Sustainable Technology Adoption Characteristics on Sustainable Value Creation Index (SVCI).
Author Contributions
Conceptualization, H.E.O.O.; methodology, H.E.O.O.; software, H.E.O.O.; validation, H.E.O.O.; formal analysis, H.E.O.O.; investigation, H.E.O.O.; resources, H.E.O.O.; data curation, H.E.O.O.; writing—original draft preparation, H.E.O.O.; writing—review and editing, H.E.O.O.; visualization, H.E.O.O.; supervision, H.E.O.O.; project administration, H.E.O.O.; funding acquisition, H.E.O.O. The author has read and agreed to the published version of the manuscript.
Funding
This research received no external funding.
Institutional Review Board Statement
Not applicable.
Informed Consent Statement
Not applicable.
Data Availability Statement
The data presented in this study, including the Python scripts used for analysis and the generated panel and VAR datasets, are available within the article or as Supplementary Material associated with this publication and will be made available as Supplementary Material on the publisher’s website upon publication.
Acknowledgments
Not applicable.
Conflicts of Interest
The author declares no conflicts of interest.
Abbreviations
| ESG | Environmental, Social, and Governance |
| SVCI | Sustainable Value Creation Index |
| TSIS | Tech Sustainability Integration Score |
| SETAS | Socio-Ethical Tech Alignment Score |
| EETFOS | Eco-Efficiency Tech Focus Score |
| SGOTS | Sustainable Governance of Tech Score |
| VAR | Vector Autoregression |
| STIF | Sustainable Tech Innovation Factor |
| SIDI | Sectoral Innovation Dynamism Index |
| GEAI | General Economic Activity Index |
| IRF | Impulse Response Function |
| FEVD | Forecast Error Variance Decomposition |
| ADF | Augmented Dickey-Fuller |
References
- Adams, R.; Jeanrenaud, S.; Bessant, J.; Denyer, D.; Overy, P. Sustainability-oriented innovation: A systematic review. International Journal of Management Reviews 2016, 18, 180–205. [Google Scholar] [CrossRef]
- Akeju, D.; Okusanya, B.; Okunade, K.; Ajepe, A.; Allsop, M.J.; Ebenso, B. Sustainability of the effects and impacts of using digital technology to extend maternal health services to rural and hard-to-reach populations: Experience from southwest Nigeria. Frontiers in Global Women’s Health 2022, 3, 696529. [Google Scholar] [CrossRef]
- Al-Balushi, H.A.; Singh, H.; Saleem, I. Unlocking sustainable performance in the health-care sector: The dynamic nexus of artificial intelligence, green innovation and green knowledge sharing. Society and Business Review 2025. ahead-of-print. [Google Scholar] [CrossRef]
- Alfina, K.N.; Ratnayake, R.M.C. Role of manufacturing industry for minimizing the barriers to circular transition in the health sector: A framework. In IFIP International Conference on Advances in Production Management Systems; Springer, 2023; pp. 267–276. [Google Scholar] [CrossRef]
- Aydın, N. A comprehensive waste management simulation model for the assessment of waste segregation in the health sector. Environmental Engineering and Management Journal 2021, 20, 1837–1848 https://eemjeu/indexphp/EEMJ/article/view/4414. [Google Scholar] [CrossRef]
- Behera, M.; De, S.; Ghorai, S.M. The synergistic and chimeric mechanism of bacteriophage endolysins: Opportunities for application in biotherapeutics, food, and health sectors. Probiotics and Antimicrobial Proteins 2024, 17, 807–831. [Google Scholar] [CrossRef] [PubMed]
- Beltempo, L.; Zerrer, J.; Härting, R.C.; Hoppe, N. Barriers of artificial intelligence in the health sector. In Artificial Intelligence and Cognitive Computing; Springer, 2023; pp. 111–120. [Google Scholar] [CrossRef]
- Berg, F.; Kölbel, J.F.; Rigobon, R. Aggregate confusion: The divergence of ESG ratings. Review of Finance 2022, 26, 1315–1344. [Google Scholar] [CrossRef]
- Bundi, D.N. Adoption of machine learning systems within the health sector: A systematic review, synthesis and research agenda. Digital Transformation and Society 2024. ahead-of-print. [Google Scholar] [CrossRef]
- Chu, W.; Chu, N.-F. Corporate social responsibility and social needs in health care sectors—A critical analysis of social innovation in the health sector in Taiwan. Healthcare 2024, 12, 1543. [Google Scholar] [CrossRef]
- Eccles, R.G.; Ioannou, I.; Serafeim, G. The impact of corporate sustainability on organizational processes and performance. Management Science 2014, 60, 2835–2857. [Google Scholar] [CrossRef]
- Edeh, M.O.; Otto, E.E.; Richard-Nnabu, N.E.; Ugboaja, S.G.; Umoke, C.C.; Omachi, D. Potential of Internet of Things and Semantic Web Technologies in the health sector. Nigerian Journal of Biotechnology 2022, 38, 73–83. [Google Scholar] [CrossRef]
- Elish, M.C. Moral crumple zones: Cautionary tales in human-robot interaction. Engaging Science, Technology, and Society 2019, 5, 40–60. [Google Scholar] [CrossRef]
- Elkington, J. Cannibals with forks: The triple bottom line of 21st century business; Capstone, 1997. [Google Scholar]
- Fama, E.F.; French, K.R. A five-factor asset pricing model. Journal of Financial Economics 2015, 116, 1–22. [Google Scholar] [CrossRef]
- Flammer, C. Does corporate social responsibility lead to superior financial performance? A regression discontinuity approach. Management Science 2015, 61, 2549–2568. [Google Scholar] [CrossRef]
- Floridi, L.; Cowls, J.; Beltramini, M.; Saunders, D.; Vayena, E. An ethical framework for a good AI society: Opportunities, risks, principles, and recommendations. AI and Society 2021, 33, 689–707. [Google Scholar] [CrossRef]
- Freeman, R.E. Strategic management: A stakeholder approach; Pitman, 2015. [Google Scholar]
- Freeman, R.E.; Harrison, J.S.; Wicks, A.C.; Parmar, B.L.; De Colle, S. Stakeholder theory: The state of the art; Cambridge University Press, 2010. [Google Scholar]
- French, K.R. French - Data Library. n.d. Available online: https://mba.tuck.dartmouth.edu/pages/faculty/ken.french/data_library.html (accessed on 8 May 2025). Tuck School of Business at Dartmouth.
- Friede, G.; Busch, T.; Bassen, A. ESG and financial performance: Aggregated evidence from more than 2000 empirical studies. Journal of Sustainable Finance & Investment 2015, 5, 210–233. [Google Scholar] [CrossRef]
- Gazquez-Garcia, J.; Sánchez-Bocanegra, C.L.; Fernández-Batanero, J.M. AI in the health sector: Systematic review of key skills for future health professionals. JMIR Medical Education 2025, in press. [Google Scholar] [CrossRef] [PubMed]
- Ghernouk, C.; Mkik, M.; Dalili, S.; Boutaky, S. The attractive determinants of green technologies: The case of the health sector in Morocco. Review of Economics and Political Science 2023, 8, 320–335. [Google Scholar]
- Giese, G.; Lee, L.E.; Melas, D.; Nagy, Z.; Nishikawa, L. Foundations of ESG investing: How ESG affects equity valuation, risk, and performance. The Journal of Portfolio Management 2019, 45, 69–83. [Google Scholar] [CrossRef]
- Gu, S.; Kelly, B.; Xiu, D. Empirical asset pricing via machine learning. The Review of Financial Studies 2020, 33, 2223–2273. [Google Scholar] [CrossRef]
- Gupta, S.; Kumar, V.; Gupta, P. Role of artificial intelligence in health sector. In Challenges in Information and Communication Technology; Taylor & Francis, 2025. [Google Scholar] [CrossRef]
- Inampudi, S.; Rajkumar, E.; Gopi, A.; Vany Mol, K.S. Barriers to implementation of digital transformation in the Indian health sector: A systematic review. Humanities and Social Sciences Communications 2024, 11, 391. [Google Scholar] [CrossRef]
- Khan, M.; Serafeim, G.; Yoon, A. Corporate sustainability: First evidence on materiality. The Accounting Review 2016, 91, 1697–1724. [Google Scholar] [CrossRef]
- Konopik, J.; Blunck, D. Development of an evidence-based conceptual model of the health care sector under digital transformation: Integrative review. Journal of Medical Internet Research 2023, 25, e41512. [Google Scholar] [CrossRef]
- Li, T.T.; Wang, K.; Sueyoshi, T.; Wang, D.D. ESG: Research Progress and Future Prospects. Sustainability 2021, 13, 11663. [Google Scholar] [CrossRef]
- Lütkepohl, H. New introduction to multiple time series analysis; Springer, 2005. [Google Scholar] [CrossRef]
- MSCI. ESG Ratings. n.d. Available online: https://www.msci.com/esg-ratings (accessed on 8 March 2025).
- Nallamothu, P.T.; Cuthrell, K.M. Artificial intelligence in health sector: Current status and future perspectives. Asian Journal of Research in Medical and Pharmaceutical Sciences 2023, 12, 45–53. [Google Scholar] [CrossRef]
- Oladipo, E.K.; Adeyemo, S.F.; Oluwasanya, G.J.; Ayanronbi, J.I.; Doyeni, M.O.; Makanjuola, S.T. Impact and challenges of artificial intelligence integration in the African health sector: A review. Trends in Medicine 2024, 24, 144. [Google Scholar] [CrossRef]
- Onomakpo, H.E.O. ESG risk ratings and stock performance in electric vehicle manufacturing: A panel regression analysis using the Fama-French five-factor model. Journal of Investment, Banking and Finance (JIBF) 2025, 3, 12. [Google Scholar] [CrossRef]
- Pagallo, U.; O’Sullivan, S.; Nevejans, N.; Holzinger, A.; Dignum, V. The underuse of AI in the health sector: Opportunity costs, success stories, risks and recommendations. Health and Technology 2024, 14, 1–11. [Google Scholar] [CrossRef]
- Pastor, L.; Stambaugh, R.F.; Taylor, L.A. Sustainable investing in equilibrium. Journal of Financial Economics 2021, 142, 550–571. [Google Scholar] [CrossRef]
- Paucar, D.R.C.; Paucar, G.V.C.; Paucar, E.W.C.; Paucar, H.Z.C.; Sotelo, C.G.M. Innovation and technology in health: Current perspectives from Latin American public policies and the SDGs. Journal of Lifestyle and SDGs Review 2024, 5, e04090. [Google Scholar] [CrossRef]
- Pedersen, L.H.; Fitzgibbons, S.; Pomorski, L. Responsible investing: The ESG-efficient frontier. Journal of Financial Economics 2021, 142, 572–597. [Google Scholar] [CrossRef]
- Porter, M.E.; Kramer, M.R. Creating shared value. Harvard Business Review 2011, 89, 62–77. [Google Scholar]
- Quigley, P.; Kahn, S.; Grace, C.; Hanka, S.; Cox, K. Evaluation of the National Institute for Health and Care Research’s (NIHR) Global Health Research (GHR) Portfolio - Inception Report. NIHR Open Research 2022, 2, 62. [Google Scholar] [CrossRef]
- Reddy, S.; Das, V.T. Leveraging health analytics for sustainable healthcare: A comprehensive analysis. Asian Journal of Management. 2024. [Google Scholar] [CrossRef]
- Rogers, E.M. Diffusion of innovations, 5th ed.; Free Press, 203. [Google Scholar]
- Saragih, R.I.F.; Saragih Erlina, E.; Azhar, I.A.S. Analysis of the effect of investor sentiment, liquidity, solvency, and economic value added (EVA) on stock returns with corporate social responsibility (CSR) as a moderating variable in health sector companies (Healthcare) listed on the Indonesia Stock Exchange (IDX), period 2018 -2022. International Journal of Current Science Research and Review 2024, 07, 4293–4308. [Google Scholar] [CrossRef]
- Sarker, M. Revolutionizing healthcare: The role of machine learning in the health sector. Journal of Artificial Intelligence General science (JAIGS) 2024, 2, 35–48. [Google Scholar] [CrossRef]
- Schaltegger, S.; Hansen, E.G.; Lüdeke-Freund, F. Business models for sustainability: A co-evolutionary analysis of sustainable entrepreneurship, innovation, and transformation. Organization & Environment 2016, 29, 264–289. [Google Scholar]
- Seabold, S.; Perktold, J.; Shedden, K. statsmodels/statsmodels: Version 0.8.0. Release [Computer software]. Zenodo. 2017. [Google Scholar] [CrossRef]
- Serafeim, G.; Yoon, A. Stock price reactions to ESG news: The role of ESG ratings and disagreement. The Accounting Review 2023, 97, 333–361. [Google Scholar] [CrossRef]
- Shahzad, M.F.; Xu, S.; Naveed, W.; Nusrat, S.; Zahid, I. Investigating the impact of artificial intelligence on human resource functions in the health sector of China: A mediated moderation model. Heliyon 2023, 9, e22662. [Google Scholar] [CrossRef]
- Shaikh, A.K.; Alhashmi, S.M.; Khalique, N.; Quadri, S.A. Bibliometric analysis on the adoption of artificial intelligence applications in the e-health sector. Digital Health 2023, 9, 20552076221149296. [Google Scholar] [CrossRef]
- Sukums, F.; Mzurikwao, D.; Sabas, D.; Chaula, R.; Pemba, S. The use of artificial intelligence-based innovations in the health sector in Tanzania: A scoping review. Health Policy and Technology 2023, 12, 100746. [Google Scholar] [CrossRef]
- Sustainalytics. ESG Data. n.d.-a. Available online: https://www.sustainalytics.com/esg-data (accessed on 8 March 2025).
- Teece, D.J. Profiting from innovation in the digital economy: Enabling technologies, standards, and licensing models in the wireless world. Research Policy 2018, 47, 1367–1387. [Google Scholar] [CrossRef]
- yesg. yesg: Retrieve ESG data from Yahoo Finance. PyPI—The Python Package Index. n.d. Available online: https://pypi.org/project/yesg/ (accessed on 8 March 2025).
Figure 1.
F-test for Poolability Result for the Avg12M_Lagged_G-Score Panel Regression Model.
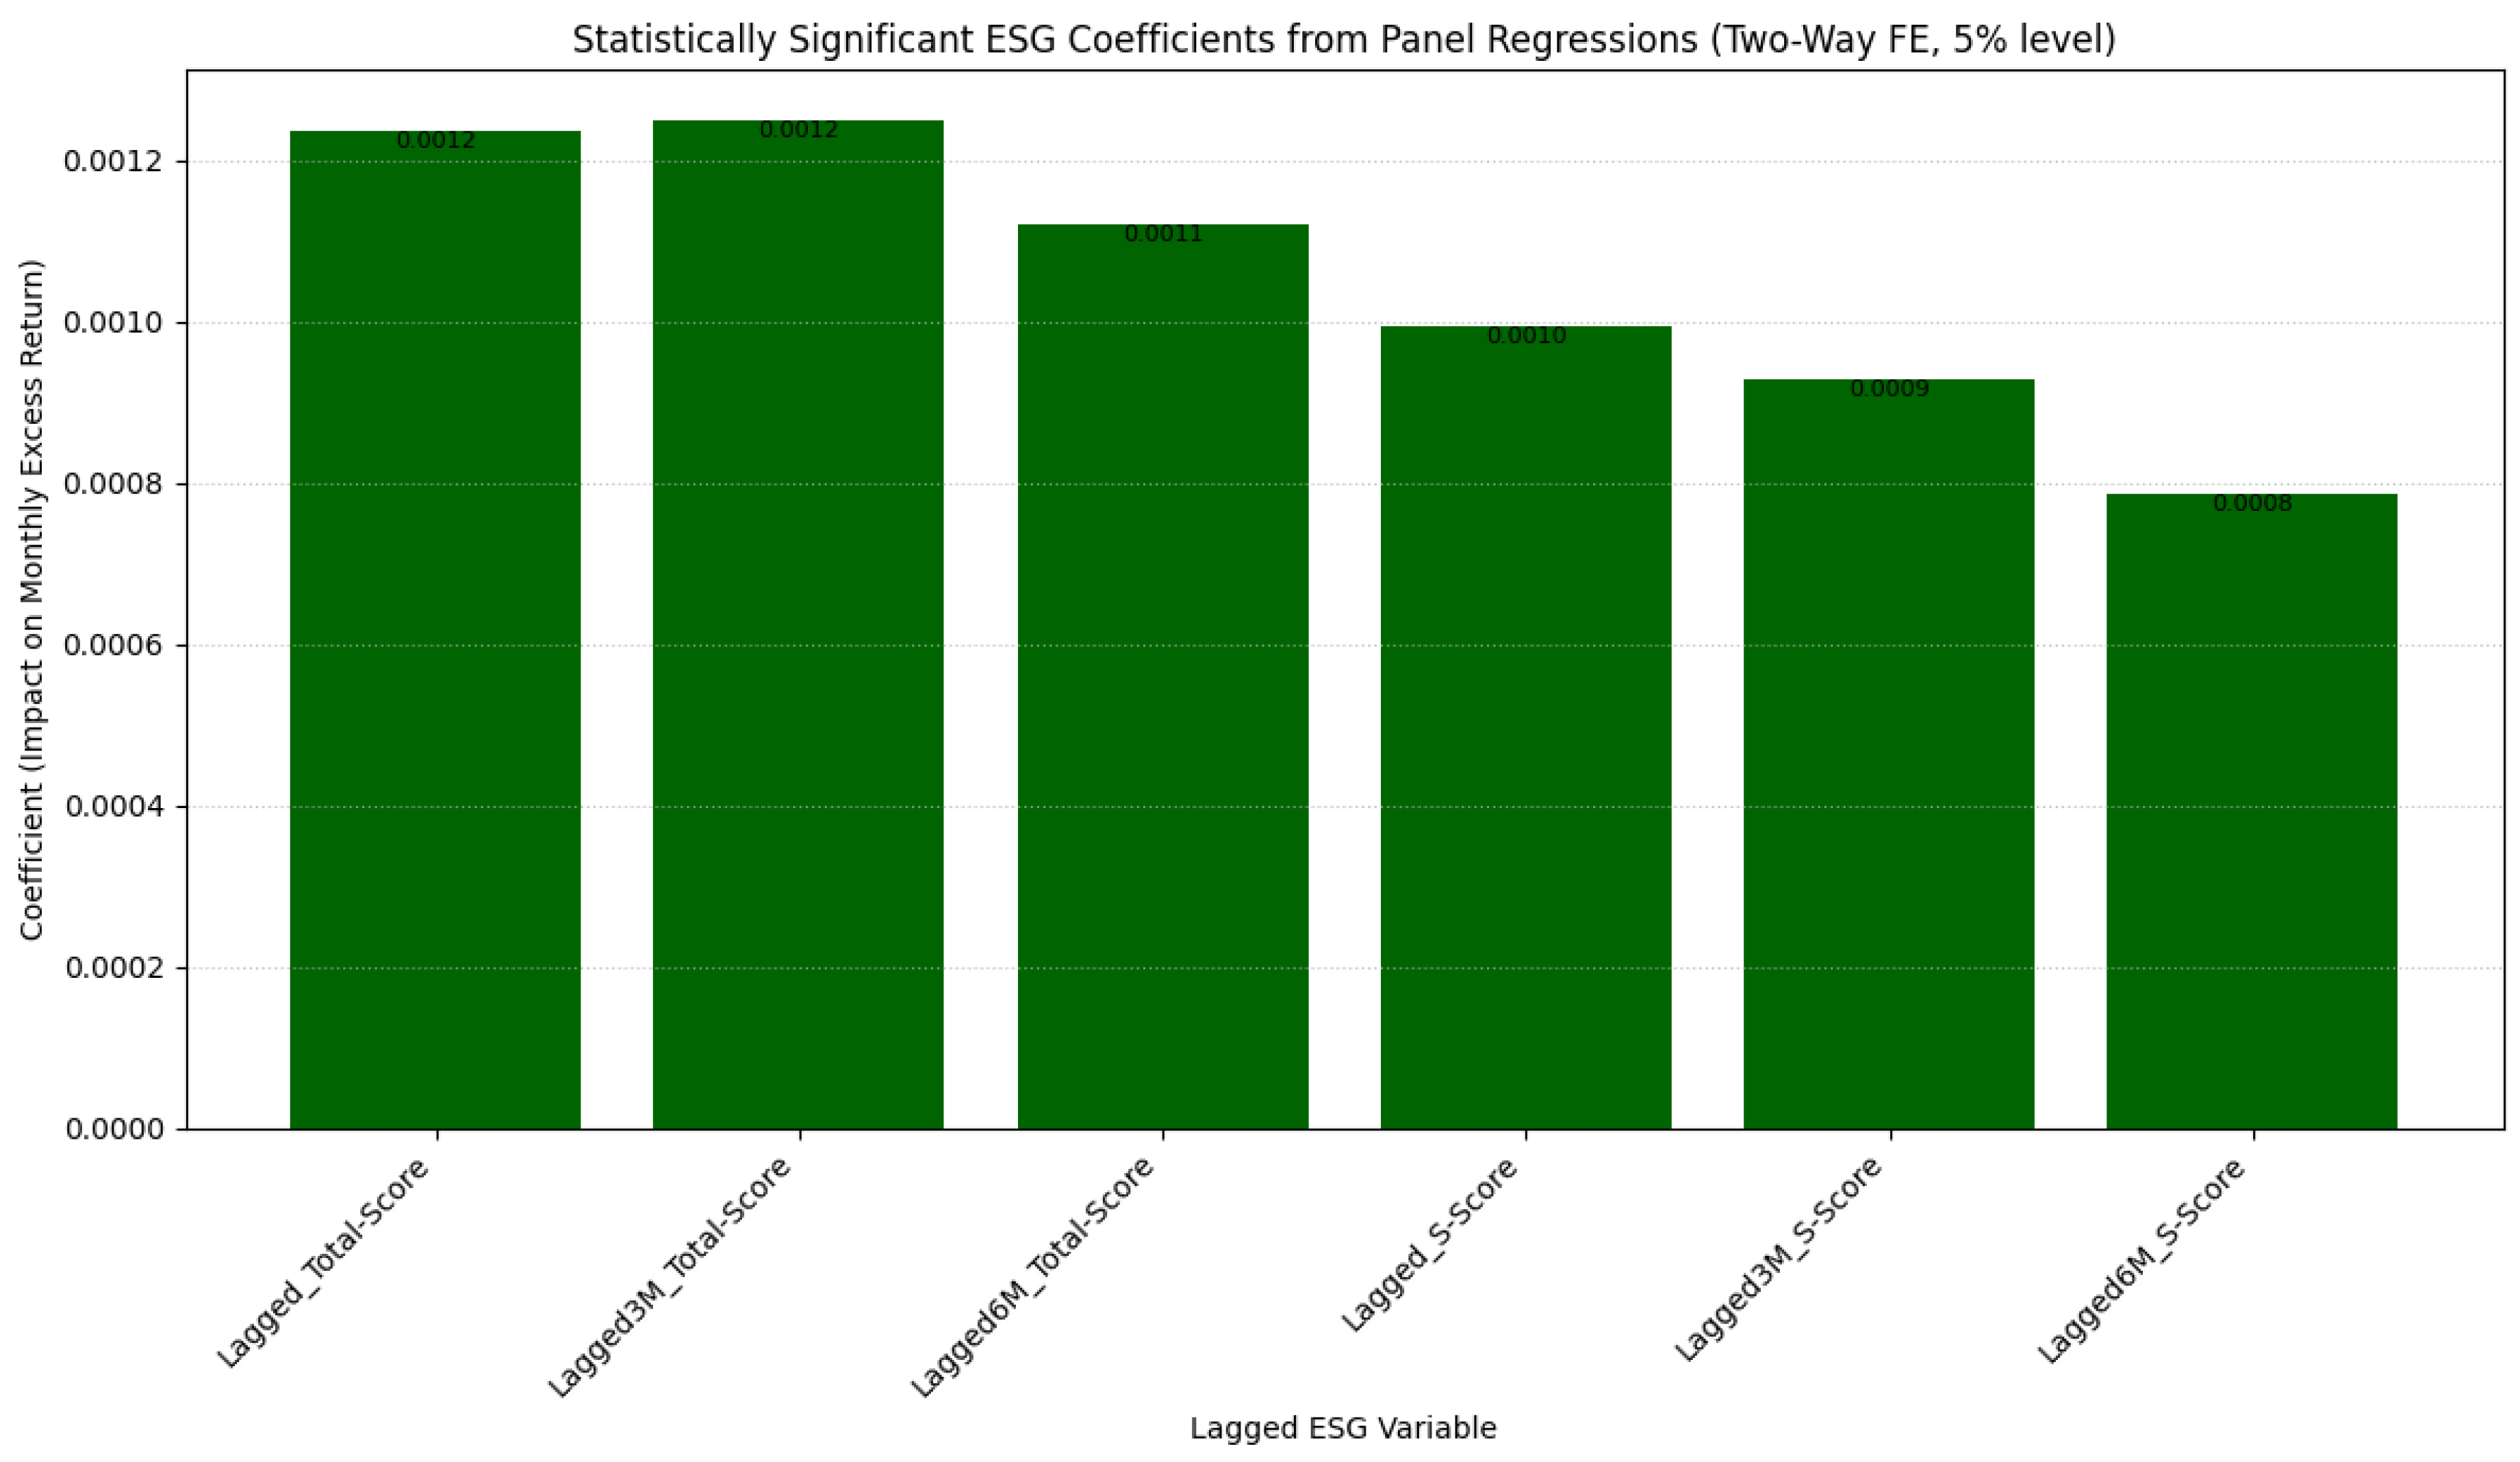
Figure 2.
Orthogonalized Impulse Response of Sustainable Tech Innovation Factor (STIF) to a One Standard Deviation Shock in General Economic Activity Index (GEAI).
Figure 2.
Orthogonalized Impulse Response of Sustainable Tech Innovation Factor (STIF) to a One Standard Deviation Shock in General Economic Activity Index (GEAI).
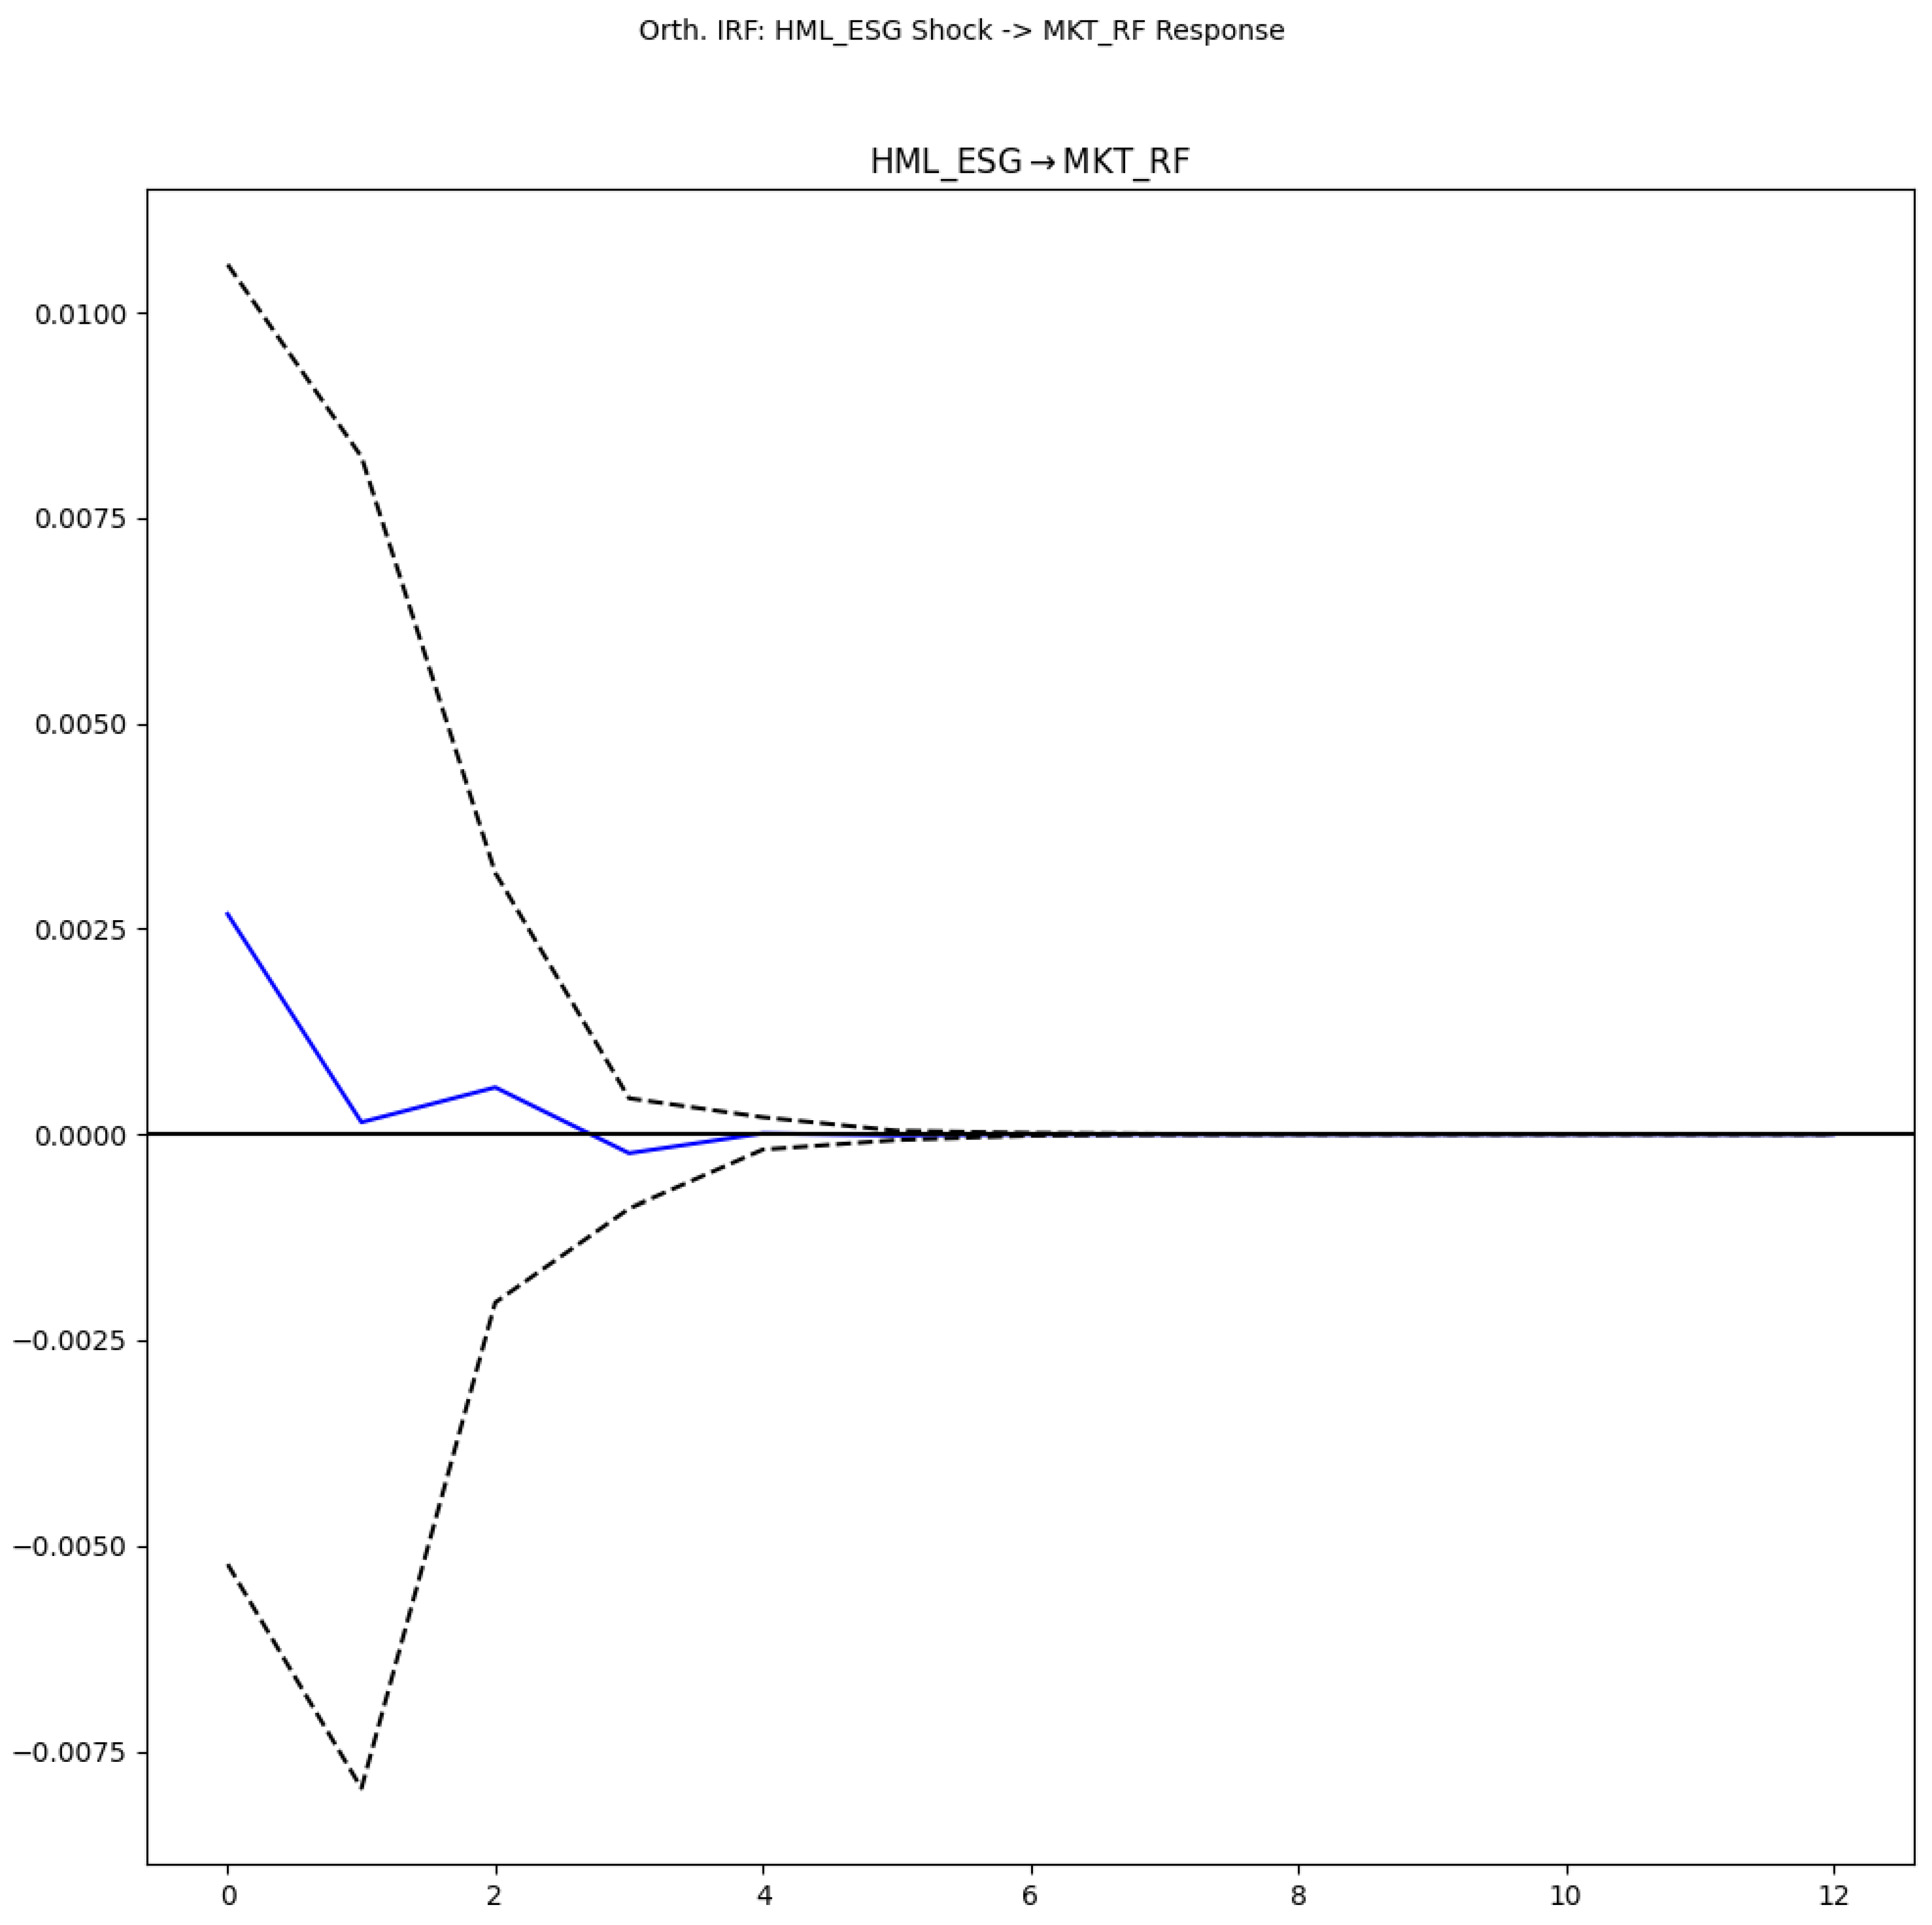
Figure 3.
Orthogonalized Impulse Response of Sectoral Innovation Dynamism Index (SIDI) to a One Standard Deviation Shock in Sustainable Tech Innovation Factor (STIF).
Figure 3.
Orthogonalized Impulse Response of Sectoral Innovation Dynamism Index (SIDI) to a One Standard Deviation Shock in Sustainable Tech Innovation Factor (STIF).
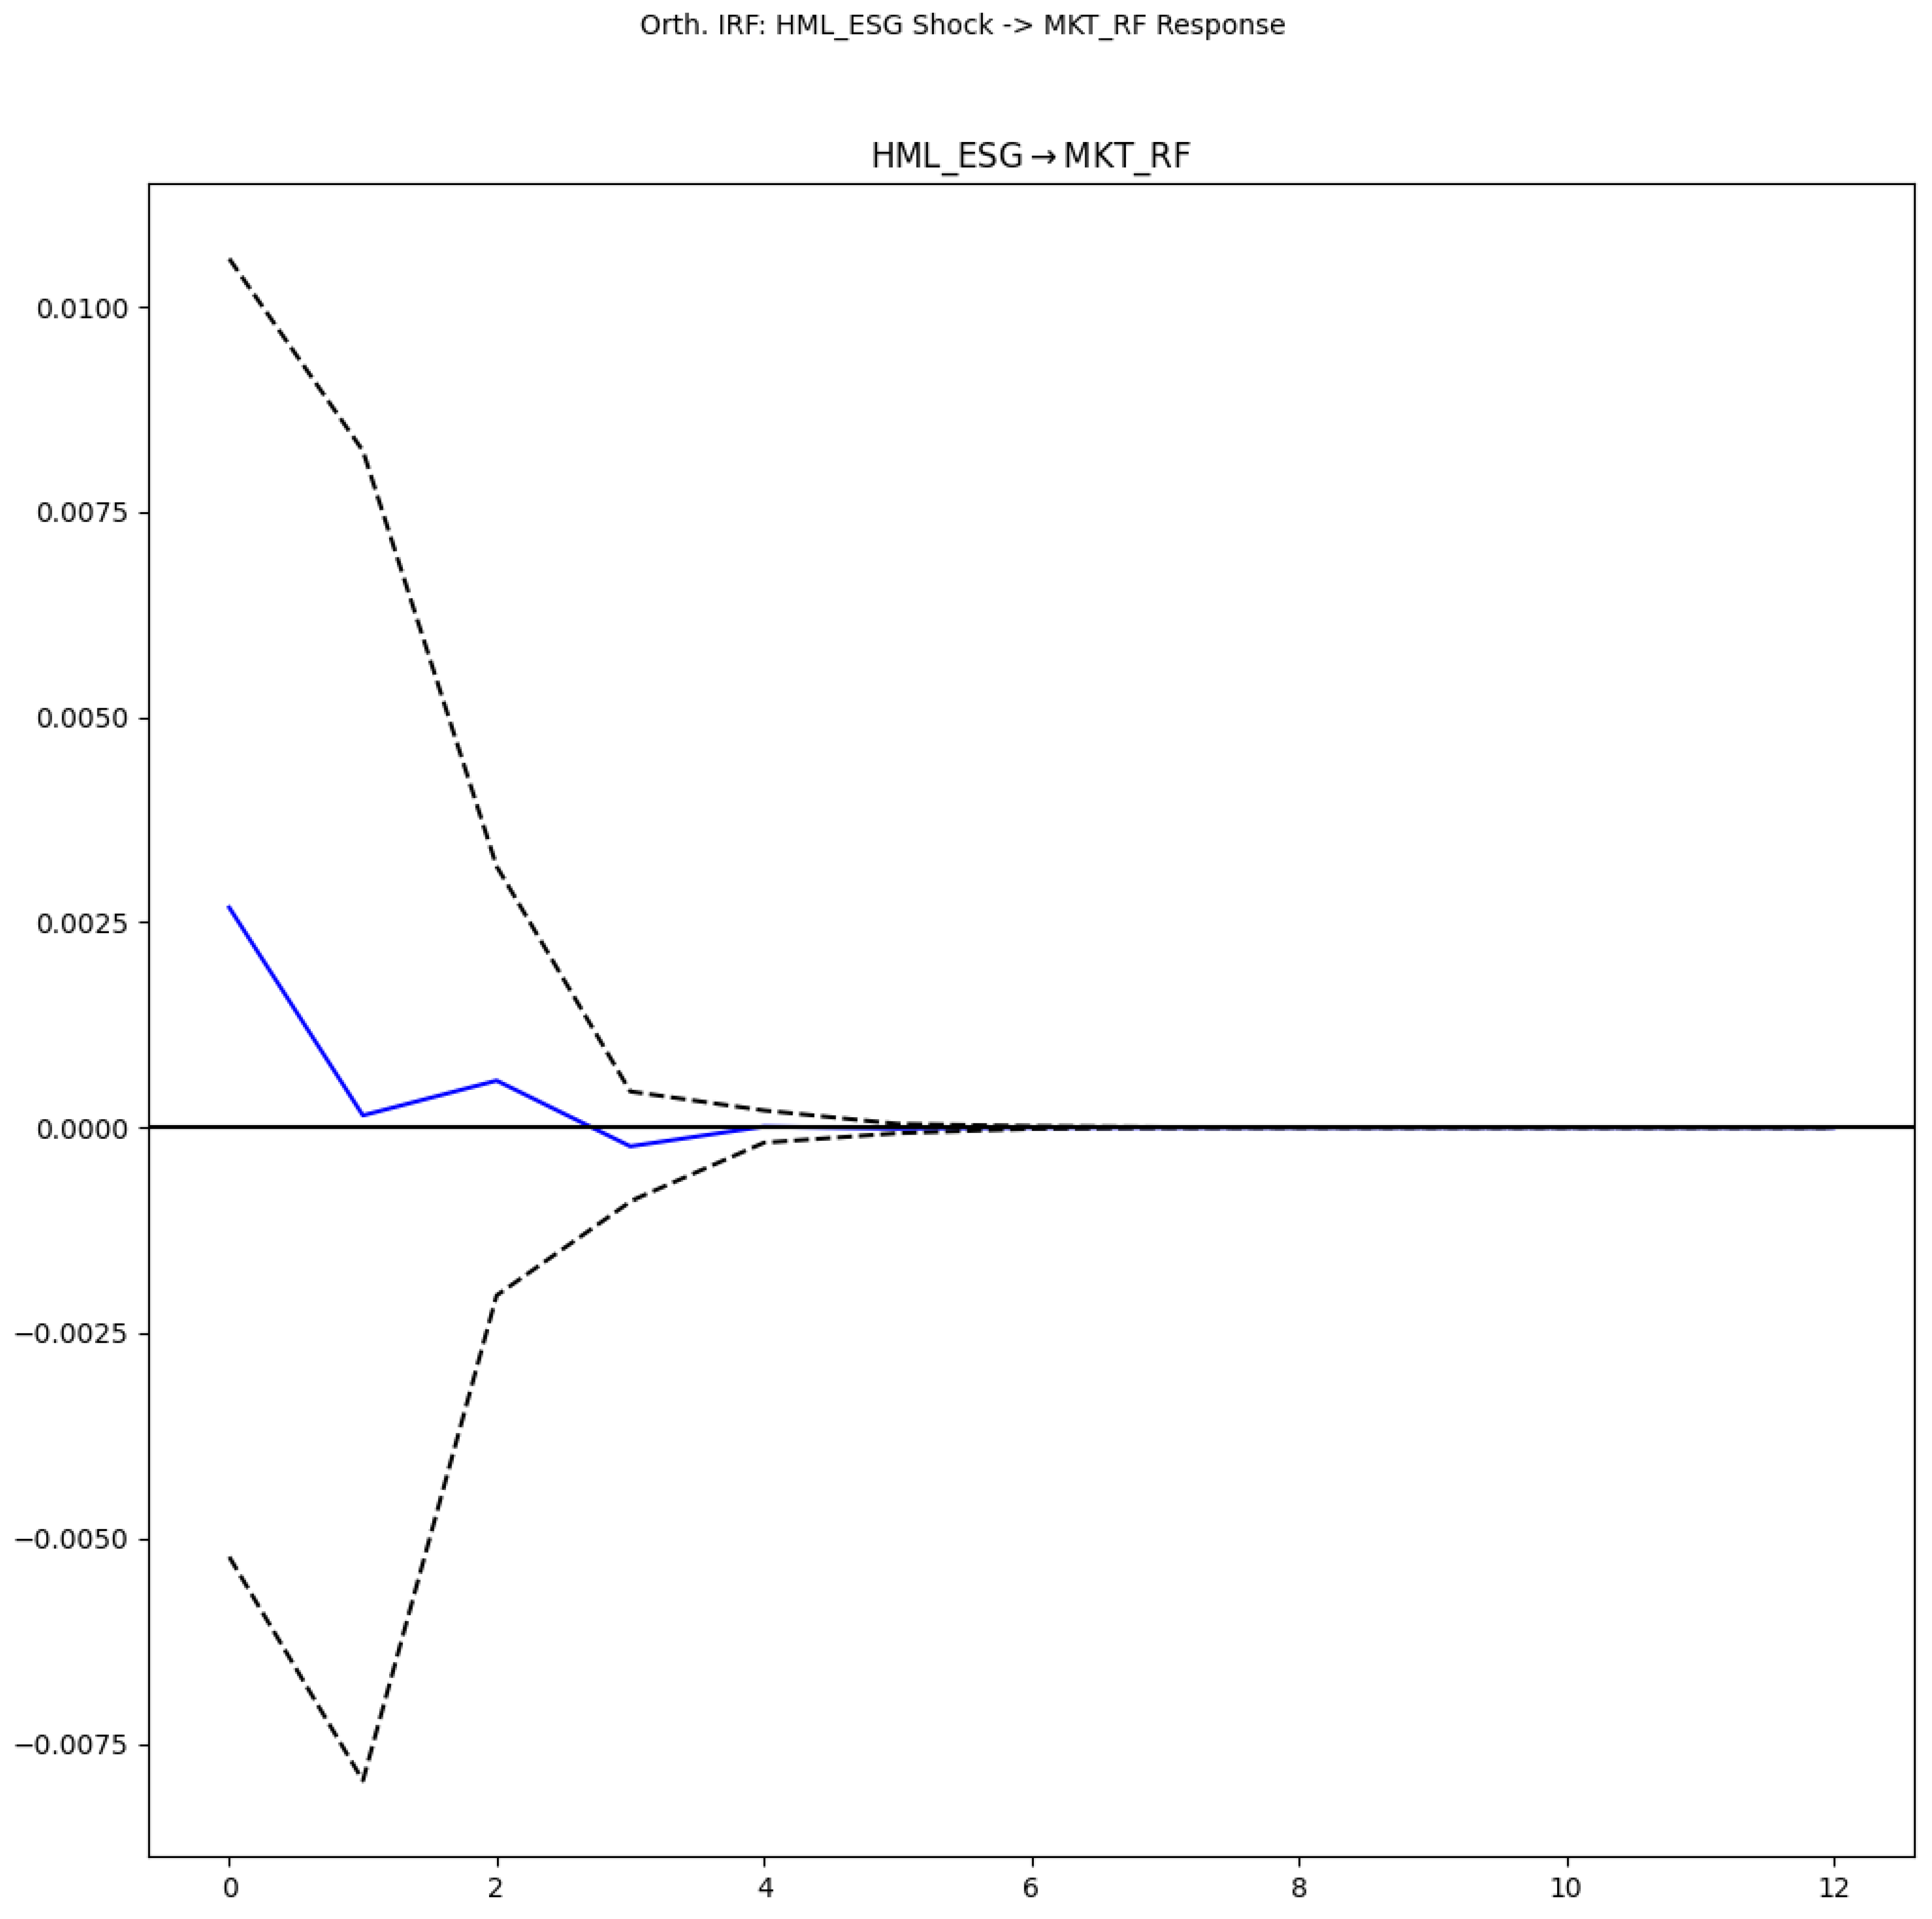
Figure 4.
Orthogonalized Impulse Response of Sustainable Tech Innovation Factor (STIF) to a One Standard Deviation Shock in Sectoral Innovation Dynamism Index (SIDI).
Figure 4.
Orthogonalized Impulse Response of Sustainable Tech Innovation Factor (STIF) to a One Standard Deviation Shock in Sectoral Innovation Dynamism Index (SIDI).
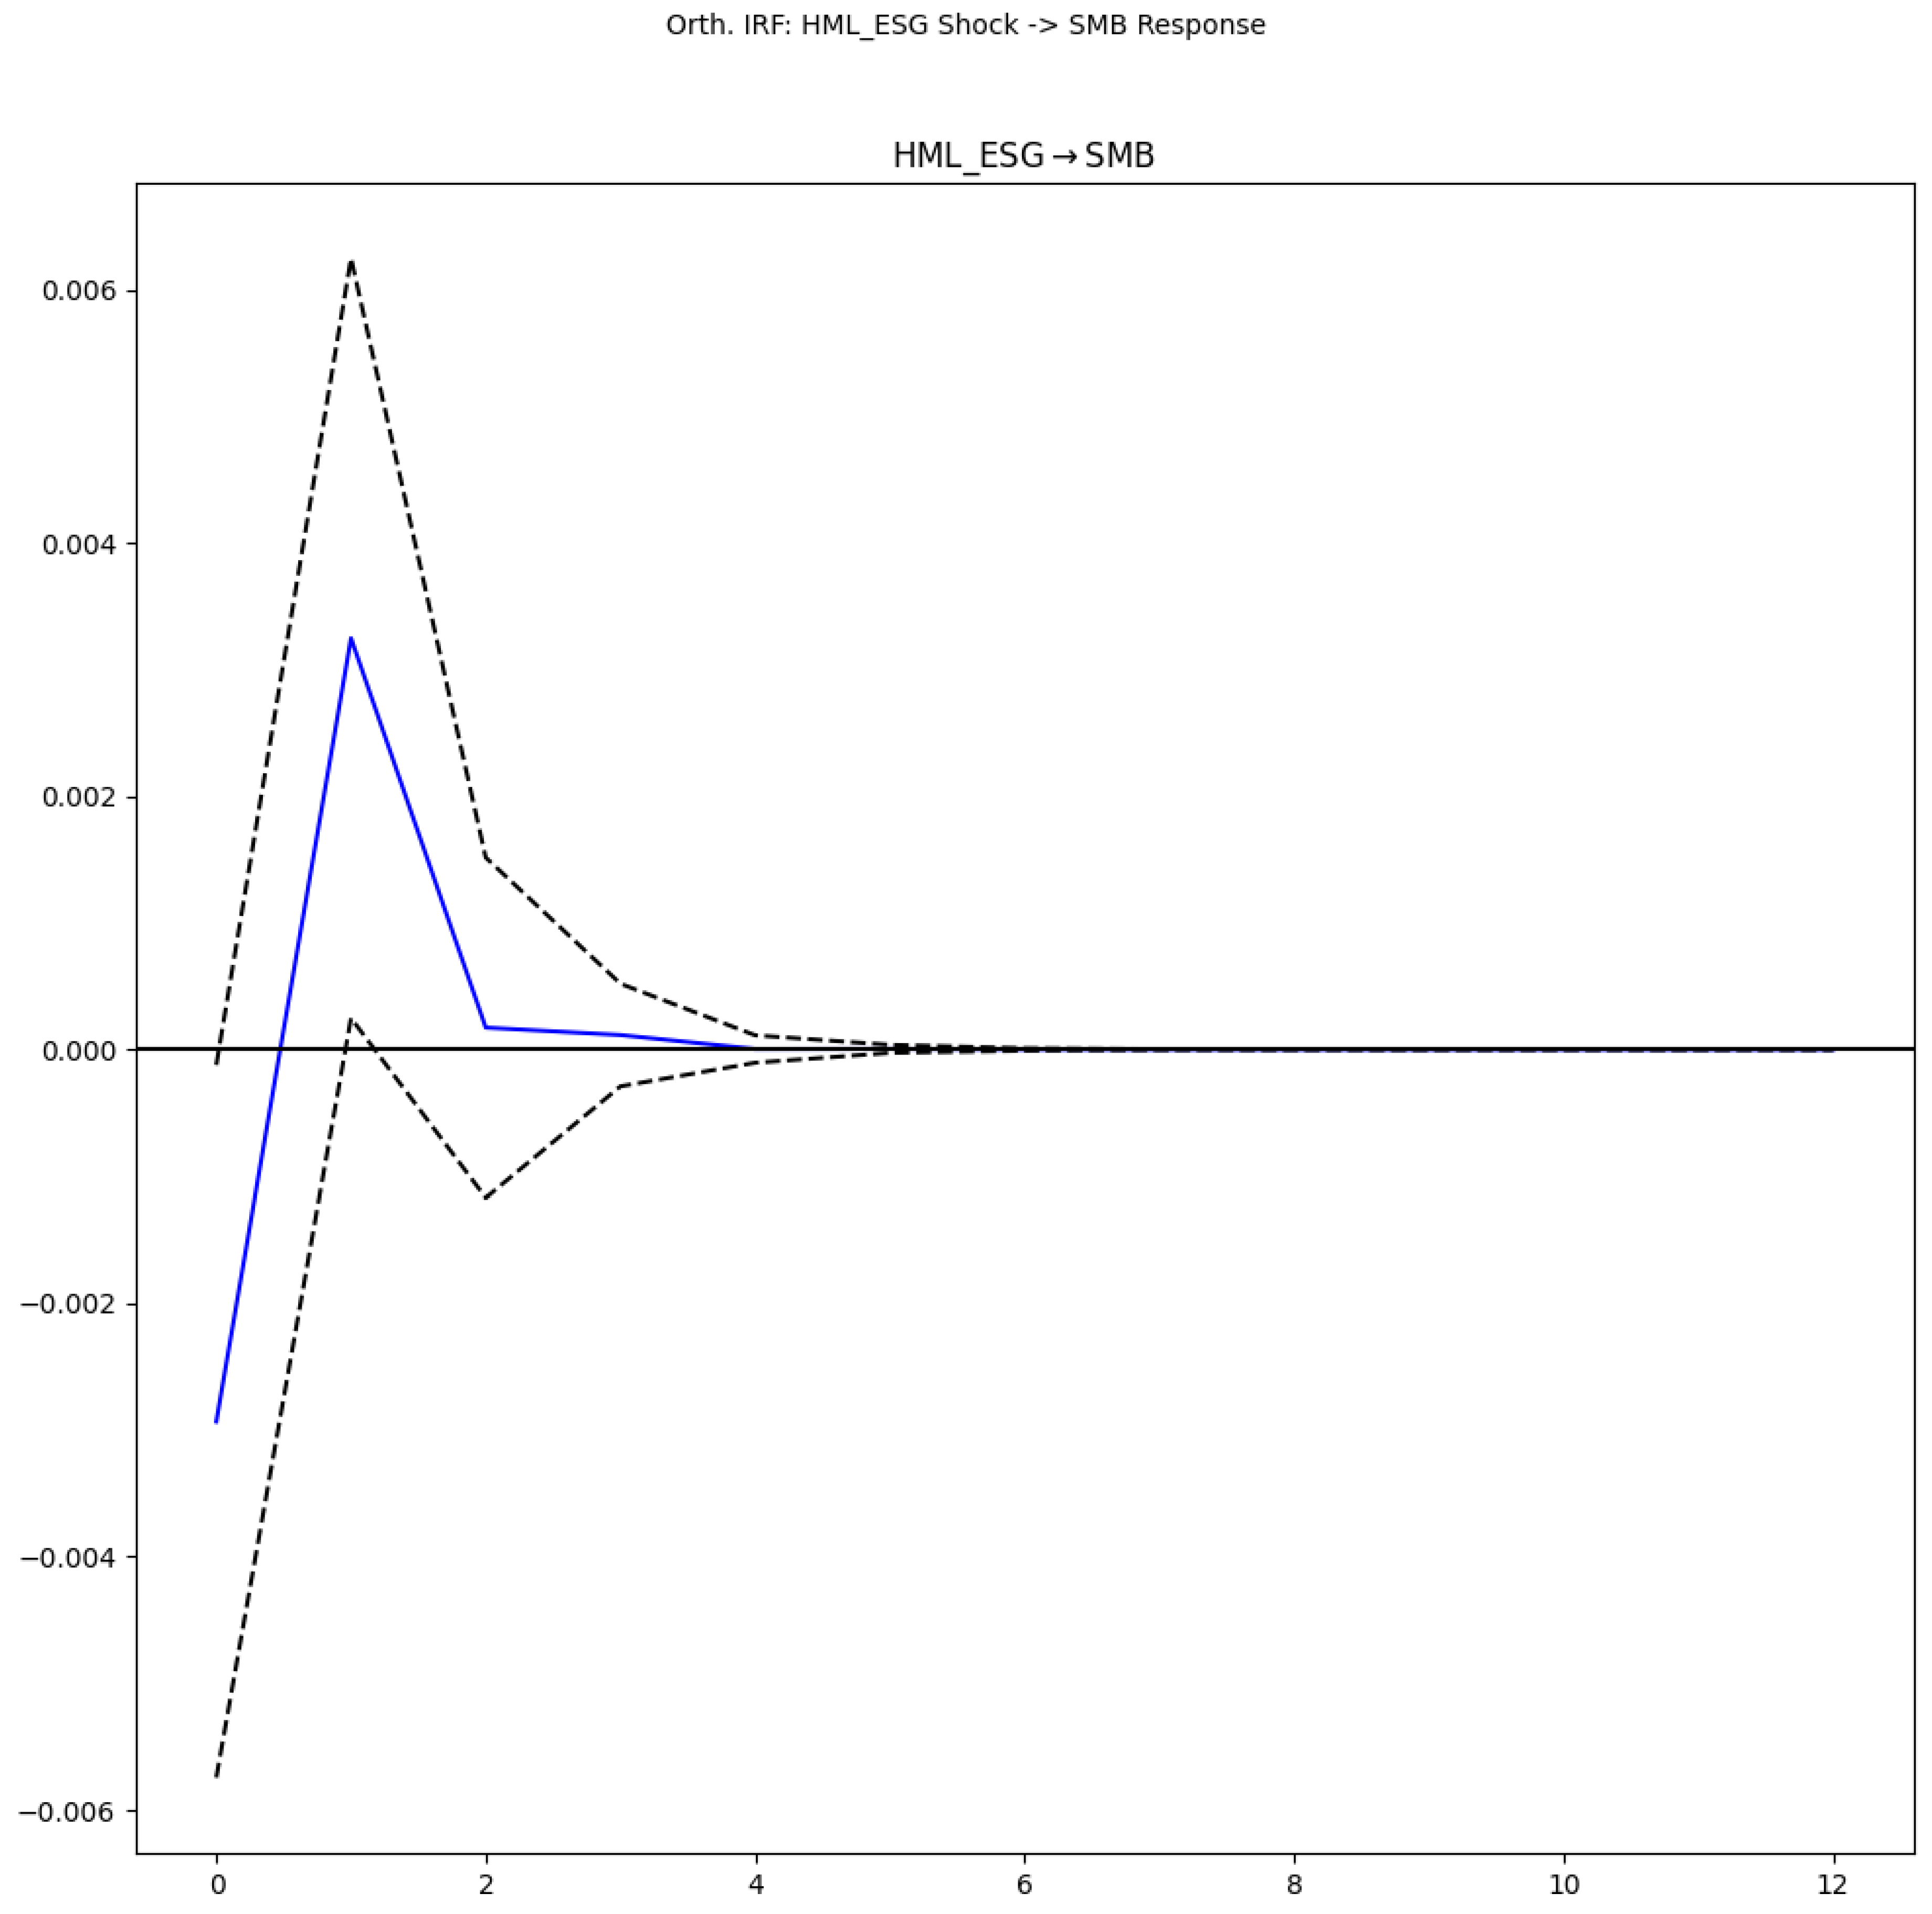

Table 1.
Panel Model Specification Tests Summary.
| Test Name | Statistic Value | P-value | Decision |
|---|---|---|---|
| F-test for Entity Effects (Entity FE vs Pooled OLS) | 2.37 | 0.04 | Entity effects significant (Prefer Fixed Effects) |
| Hausman Comparison (FE vs RE, informal) | FE: 0.0001, RE: 0.0001 | — | FE preferred if F-test significant and theory supports (No formal test) |
| Breusch-Pagan LM Test (Heteroskedasticity on FE resid.) | LM = 13.27 | 0.07 | Fail to reject H0 (Assume Homoskedasticity) |
Table 2.
Summary of Panel Regression Results for the Impact of Analogous Sustainable Technology Adoption Characteristics on Sustainable Value Creation Index (SVCI).
Table 2.
Summary of Panel Regression Results for the Impact of Analogous Sustainable Technology Adoption Characteristics on Sustainable Value Creation Index (SVCI).
| Independent Variable (Analogous) | Lag | Coefficient | Std. Err. | T-stat | P-value | Significant (5%) | Economic Significance (Analogous Monthly SVCI Change) |
|---|---|---|---|---|---|---|---|
| Lagged_Tech_Sustainability_Integration_Score (TSIS) | 1M | 0.00 | 0.00 | 3.21 | 0.00 | TRUE | 0.0012 units |
| Lagged_Tech_Sustainability_Integration_Score (TSIS) | 3M | 0.00 | 0.00 | 2.94 | 0.00 | TRUE | 0.0012 units |
| Lagged_Tech_Sustainability_Integration_Score (TSIS) | 6M | 0.00 | 0.00 | 2.14 | 0.03 | TRUE | 0.0011 units |
| Avg12M_Lagged_Tech_Sustainability_Integration_Score (TSIS) | 12M_Avg | 0.00 | 0.00 | 1.79 | 0.07 | FALSE | 0.0011 units |
| Lagged_Eco_Efficiency_Tech_Focus_Score (EETFOS) | 1M | 0.00 | 0.00 | 1.06 | 0.29 | FALSE | 0.0005 units |
| Lagged_Eco_Efficiency_Tech_Focus_Score (EETFOS) | 3M | 0.00 | 0.00 | 0.99 | 0.32 | FALSE | 0.0004 units |
| Lagged_Eco_Efficiency_Tech_Focus_Score (EETFOS) | 6M | 0.00 | 0.00 | 0.97 | 0.33 | FALSE | 0.0004 units |
| Avg12M_Lagged_Eco_Efficiency_Tech_Focus_Score (EETFOS) | 12M_Avg | 0.00 | 0.00 | 0.93 | 0.35 | FALSE | 0.0004 units |
| Lagged_Socio_Ethical_Tech_Alignment_Score (SETAS) | 1M | 0.00 | 0.00 | 3.41 | 0.00 | TRUE | 0.0010 units |
| Lagged_Socio_Ethical_Tech_Alignment_Score (SETAS) | 3M | 0.00 | 0.00 | 3.23 | 0.00 | TRUE | 0.0009 units |
| Lagged_Socio_Ethical_Tech_Alignment_Score (SETAS) | 6M | 0.00 | 0.00 | 2.03 | 0.04 | TRUE | 0.0008 units |
| Avg12M_Lagged_Socio_Ethical_Tech_Alignment_Score (SETAS) | 12M_Avg | 0.00 | 0.00 | 1.71 | 0.09 | FALSE | 0.0007 units |
| Lagged_Sustainable_Governance_of_Tech_Score (SGOTS) | 1M | 0.00 | 0.00 | 1.80 | 0.07 | FALSE | 0.0010 units |
| Lagged_Sustainable_Governance_of_Tech_Score (SGOTS) | 3M | 0.00 | 0.00 | 1.35 | 0.18 | FALSE | 0.0010 units |
| Lagged_Sustainable_Governance_of_Tech_Score (SGOTS) | 6M | 0.00 | 0.00 | 1.02 | 0.31 | FALSE | 0.0008 units |
| Avg12M_Lagged_Sustainable_Governance_of_Tech_Score (SGOTS) | 12M_Avg | 0.00 | 0.00 | 0.94 | 0.35 | FALSE | 0.0008 units |
Note: The dependent variable is Excess Return. Independent variables are analogous ESG characteristics. Coefficients, Std. Err., T-stat, and P-value are derived from individual regression models for each lagged ESG score. Significance (5%) indicates p-value < 0.05. Economic Significance refers to the analogous monthly change in SVCI per unit change in the independent variable.
Table 3.
VAR Lag Order Selection (Analogous System).
| Lag | AIC | BIC | FPE | HQIC |
| 0 | -53.71 * | -53.55 * | 4.699e-24 * | -53.65 * |
| 1 | -53.34 | -52 | 6.88E-24 | -52.79 |
| 2 | -53.07 | -50.56 | 9.08E-24 | -52.05 |
| 3 | -5.29E+01 | -49.26 | 1.06E-23 | -51.44 |
| 4 | -5.27E+01 | -47.85 | 1.41E-23 | -50.73 |
| 5 | -5.28E+01 | -46.79 | 1.36E-23 | -50.36 |
| 6 | -5.28E+01 | -45.57 | 1.60E-23 | -49.84 |
Note: * indicates the minimum value for each criterion. Based on the BIC, a VAR model with 1 lag (VAR (1)) was selected.
Table 4.
VAR Residual Diagnostics - Durbin-Watson Statistics (Analogous System).
| Variable (Analogous) | Durbin-Watson |
|---|---|
| Sustainable_Tech_Innovation_Factor (STIF) | 2.0126 |
| General_Economic_Activity_Index (GEAI) | 2.0149 |
| Sectoral_Innovation_Dynamism_Index (SIDI) | 2.0394 |
| Resource_Intensity_Factor (RIF) | 2.1132 |
| Operational_Efficiency_Factor (OEF) | 2.0282 |
| Strategic_Investment_Orientation_Factor (SIOF) | 2.0519 |
| Market_Trend_Adaptability_Index (MTAI) | 2.1102 |
Table 5.
Granger Causality Tests (Analogous System, VAR (1) Model).
| Causality Direction (Analogous) | F-Stat | P-Value | Significant (5%) |
|---|---|---|---|
| GEAI, SIDI, RIF, OEF, SIOF, MTAI -> STIF | 0.8 | 0.57 | FALSE |
| STIF, SIDI, RIF, OEF, SIOF, MTAI -> GEAI | 0.35 | 0.91 | FALSE |
| STIF, GEAI, RIF, OEF, SIOF, MTAI -> SIDI | 2.27 | 0.04 | TRUE |
| STIF, GEAI, SIDI, OEF, SIOF, MTAI -> RIF | 0.76 | 0.60 | FALSE |
| STIF, GEAI, SIDI, RIF, SIOF, MTAI -> OEF | 0.82 | 0.55 | FALSE |
| STIF, GEAI, SIDI, RIF, OEF, MTAI -> SIOF | 0.35 | 0.91 | FALSE |
| STIF, GEAI, SIDI, RIF, OEF, SIOF -> MTAI | 1.43 | 0.20 | FALSE |
Table 6.
Forecast Error Variance Decomposition (FEVD) for STIF (Analogous System, 12-Period Horizon).
Table 6.
Forecast Error Variance Decomposition (FEVD) for STIF (Analogous System, 12-Period Horizon).
| Horizon | STIF | GEAI | SIDI | RIF | OEF | SIOF | MTAI |
|---|---|---|---|---|---|---|---|
| 0 | 1.00 | 0.00 | 0.00 | 0.00 | 0.00 | 0.00 | 0.00 |
| 1 | 0.96 | 0.00 | 0.00 | 0.02 | 0.00 | 0.00 | 0.01 |
| 2 | 0.96 | 0.00 | 0.00 | 0.02 | 0.00 | 0.00 | 0.01 |
| 3 | 0.96 | 0.00 | 0.00 | 0.02 | 0.00 | 0.00 | 0.01 |
| 4 | 0.96 | 0.00 | 0.00 | 0.02 | 0.00 | 0.00 | 0.01 |
| 5 | 0.96 | 0.00 | 0.00 | 0.02 | 0.00 | 0.00 | 0.01 |
| 6 | 0.96 | 0.00 | 0.00 | 0.02 | 0.00 | 0.00 | 0.01 |
| 7 | 0.96 | 0.00 | 0.00 | 0.02 | 0.00 | 0.00 | 0.01 |
| 8 | 0.96 | 0.00 | 0.00 | 0.02 | 0.00 | 0.00 | 0.01 |
| 9 | 0.96 | 0.00 | 0.00 | 0.02 | 0.00 | 0.00 | 0.01 |
| 10 | 0.96 | 0.00 | 0.00 | 0.02 | 0.00 | 0.00 | 0.01 |
| 11 | 0.96 | 0.00 | 0.00 | 0.02 | 0.00 | 0.00 | 0.01 |
Table 7.
Forecast Error Variance Decomposition (FEVD) for SIDI (Analogous System, 12-Period Horizon).
Table 7.
Forecast Error Variance Decomposition (FEVD) for SIDI (Analogous System, 12-Period Horizon).
| HML_ESG | MKT_RF | SMB | HML | RMW | CMA | WML |
|---|---|---|---|---|---|---|
| 0.0342 | 0.0326 | 0.9331 | 0 | 0 | 0 | 0 |
| 0.068 | 0.0787 | 0.8325 | 0.0002 | 0.0001 | 0.0133 | 0.0073 |
| 0.0679 | 0.0803 | 0.8295 | 0.0002 | 0.0006 | 0.0133 | 0.0083 |
| 0.0679 | 0.0803 | 0.8295 | 0.0002 | 0.0006 | 0.0133 | 0.0083 |
| 0.0679 | 0.0803 | 0.8294 | 0.0002 | 0.0006 | 0.0133 | 0.0083 |
| 0.0679 | 0.0803 | 0.8294 | 0.0002 | 0.0006 | 0.0133 | 0.0083 |
| 0.0679 | 0.0803 | 0.8294 | 0.0002 | 0.0006 | 0.0133 | 0.0083 |
| 0.0679 | 0.0803 | 0.8294 | 0.0002 | 0.0006 | 0.0133 | 0.0083 |
| 0.0679 | 0.0803 | 0.8294 | 0.0002 | 0.0006 | 0.0133 | 0.0083 |
Disclaimer/Publisher’s Note: The statements, opinions and data contained in all publications are solely those of the individual author(s) and contributor(s) and not of MDPI and/or the editor(s). MDPI and/or the editor(s) disclaim responsibility for any injury to people or property resulting from any ideas, methods, instructions or products referred to in the content. |
© 2025 by the authors. Licensee MDPI, Basel, Switzerland. This article is an open access article distributed under the terms and conditions of the Creative Commons Attribution (CC BY) license (http://creativecommons.org/licenses/by/4.0/).
Copyright: This open access article is published under a Creative Commons CC BY 4.0 license, which permit the free download, distribution, and reuse, provided that the author and preprint are cited in any reuse.


