Submitted:
28 May 2025
Posted:
29 May 2025
You are already at the latest version
Abstract
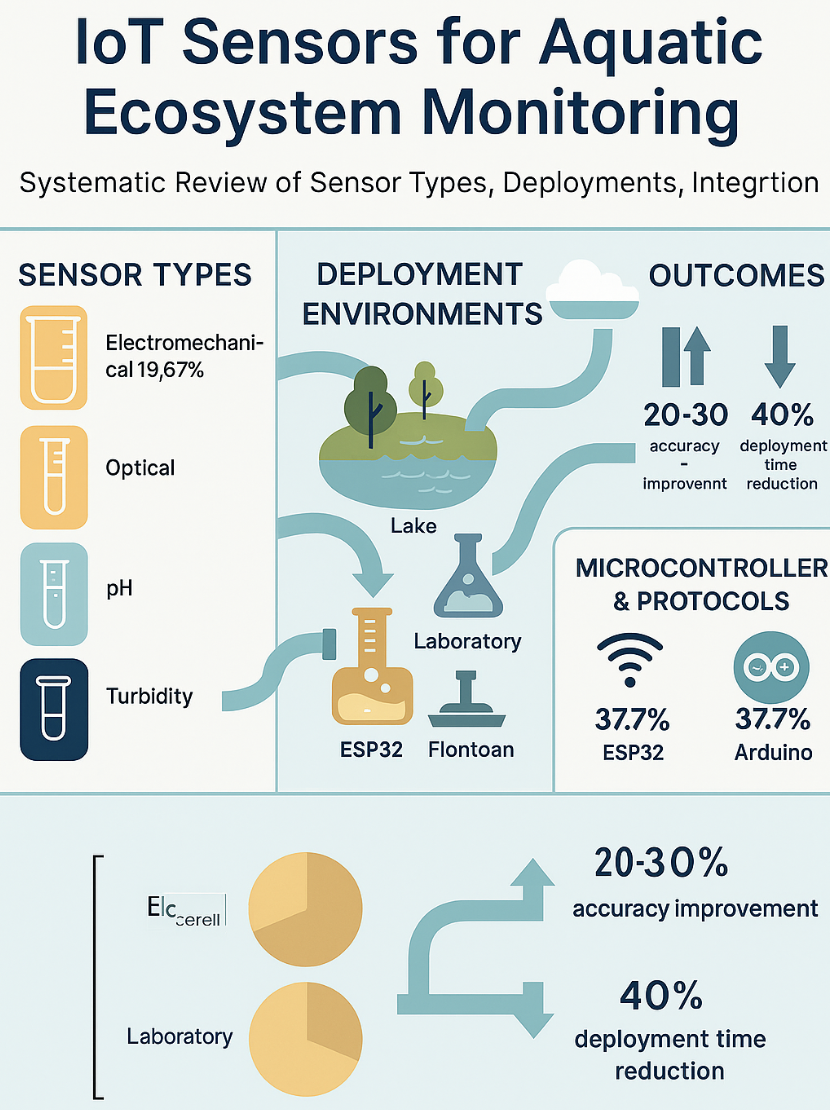
Monitoring aquatic ecosystems is essential for sustaining biodiversity and maintaining water quality. Recent advancements in Internet of Things (IoT) technologies have enabled real-time, high-resolution tracking of key water quality indicators. This systematic review evaluates the application, effectiveness, and challenges of IoT sensors for monitoring biological and physicochemical parameters—such as dissolved oxygen (DO), pH, and turbidity—in freshwater and marine environments. A structured literature search across Google Scholar, Scopus, and Web of Science identified 61 relevant studies published between 2015 and 2025. Findings show increasing adoption of wireless-enabled microcontrollers (ESP32, Arduino) and moderate-cost electrochemical and optical sensors, which dominated usage at 19.67% and 18.03%, respectively. While deployments were largely field-based (65.58%), 26–30% of studies lacked calibration or protocol reporting, highlighting transparency gaps. Biological indicators such as chlorophyll-a were monitored less frequently compared to physical and chemical variables. Key challenges included sensor fouling, calibration complexity, limited methodological reporting, and integration difficulties in low-resource settings. IoT technologies offer transformative potential for aquatic monitoring, but broader adoption requires standardized calibration protocols, affordable hardware, and improved training. Future research should evaluate long-term reliability and policy impact of these systems across diverse aquatic environments.
Keywords:
Internet of things
; biological indicators
; biochemical data
; monitoring services
; environmental monitoring
; analytical instrumentation
; aquatic environments
1. Introduction
The increasing convergence of technological innovation and environmental science has catalyzed the evolution of Internet of Things (IoT) applications in ecological monitoring. Among the most impactful of these innovations is the use of IoT sensor networks for monitoring biological indicators in aquatic ecosystems. These sensors are now capable of delivering real-time, high-precision data that inform critical decisions about water quality and ecological health. As a result, IoT technologies have become essential tools in modern aquatic research and ecosystem management.
Recent studies demonstrate the transformative role of IoT systems in enhancing water quality monitoring, enabling pollutant detection, and supporting automated environmental response mechanisms (Manoj M. et al., 2022; Jan, Min-Allah & Düştegör, 2021). The integration of artificial intelligence with IoT platforms has further extended these capabilities, facilitating the advanced detection and interpretation of biological indicators (Ya’acob et al., 2021). Despite these advancements, substantial knowledge gaps remain, particularly regarding the deployment and operation of these technologies across diverse aquatic ecosystems—gaps that are especially pronounced in developing regions with limited technical and financial resources.
Aquatic ecosystems, which provide essential services such as food security, climate regulation, and biodiversity conservation, are increasingly vulnerable to anthropogenic pressures including pollution, overfishing, and habitat loss (Lee K. H., 2020). These threats necessitate robust, real-time monitoring strategies. IoT systems, through their architectures, sensing capabilities, and wireless communication frameworks, offer promising solutions for translating raw environmental data into actionable insights (Manoj M. et al., 2022; Zulkifli C. Z., 2022).
However, much of the existing research has concentrated on the use of IoT for monitoring chemical or physical water parameters, while applications focused specifically on biological indicators remain relatively underexplored (Huang & Khabusi, 2025; Gholizadeh, Melesse & Reddi, 2016). In the face of escalating environmental change and increasing demand for ecosystem resilience, there is a pressing need to apply smart sensing technologies for comprehensive biological monitoring (Jan, Min-Allah & Düştegör, 2021). The technical and logistical complexities of deploying IoT systems—especially underwater—highlight further challenges in this domain. Issues such as sensor calibration, maintenance requirements, and deployment costs present barriers to broader adoption, particularly in resource-limited contexts (Ya’acob N. et al., 2021; Kaur, Mandal & Pandey, 2022). Moreover, the adaptation of IoT systems in varied environments, from controlled aquaculture settings to dynamic riverine and coastal systems, raises important questions about interoperability, accuracy, and scalability (Dhinakaran D. et al., 2023; Huang & Khabusi, 2025).
Regional insights—from Southeast Asia to Europe—also underscore disparities in infrastructure and capacity that influence the effectiveness of IoT applications in aquatic monitoring (Lee K. H., 2020; Nellemann & Corcoran, 2010). These variations highlight both the opportunities and the limitations of current practices. This systematic review seeks to address these gaps by synthesizing a decade of peer-reviewed research (2015–2025) on the use of IoT sensors for monitoring biological indicators in aquatic ecosystems. It identifies trends, challenges, and best practices, with the goal of guiding future research, supporting ecosystem resilience, and informing conservation policy. Through an interdisciplinary lens, the review explores patterns in sensor adoption, deployment strategies, and performance outcomes, while also highlighting case studies and implementation challenges.
Finally, a comparative analysis of existing reviews (summarized in Table 1) positions this study as a targeted and timely contribution. Unlike prior works that broadly focus on water quality or aquaculture management, this review specifically addresses the application and strategic advantages of IoT systems in biological monitoring—thereby filling a critical void in the current literature.
1.1. Research Gap
A critical analysis of the existing literature, as summarized in Table 1, reveals several key research gaps that underscore the necessity and timeliness of this review on IoT Sensors for Monitoring Biological Indicators in Aquatic Ecosystems.
First, the majority of existing systematic reviews emphasize chemical and physical water quality parameters—such as pH, turbidity, and temperature—while giving limited consideration to biological indicators like microbial diversity, fish health, or plankton populations (Zainurin et al., 2022; Singh & Ahmed, 2021; Essamlali et al., 2024). When biological factors are addressed, they are often confined to aquaculture productivity metrics rather than broader indicators of ecological health. Second, many prior studies are narrowly scoped, focusing primarily on controlled environments such as aquaculture systems or potable water monitoring infrastructure. This leaves significant gaps in the literature concerning natural aquatic ecosystems—such as rivers, lakes, wetlands, and estuaries—where biological monitoring is essential for biodiversity conservation and ecosystem management. Third, although the role of IoT technologies in environmental monitoring is well established, few reviews have systematically investigated their application for biological monitoring across diverse ecological contexts. Furthermore, there is limited discussion of crucial factors such as sensor affordability, system accessibility in low-resource settings, and equity in technological deployment. Most discussions on artificial intelligence and machine learning emphasize operational efficiency in commercial contexts, with minimal focus on their potential to advance biological monitoring and ecological resilience (Gladju Kamalam & Kanagaraj, 2022). Finally, the existing literature lacks comparative evaluations of sensor performance related to biological indicators—specifically regarding accuracy, durability, and long-term usability in field conditions. These dimensions are essential for guiding the design and implementation of robust, scalable, and context-appropriate monitoring systems.
This review addresses these critical gaps by offering a comprehensive and interdisciplinary synthesis of IoT sensor applications for biological monitoring in aquatic ecosystems. It contributes novel insights that support sustainable water resource management, inform conservation strategies, and pave the way for future technological and policy developments in the domain of smart environmental monitoring.
1.2. Research Questions
Although research interest in the use of IoT sensors for biological monitoring in aquatic systems has increased, significant knowledge gaps remain—particularly regarding the practical implementation, technological performance, and ecological relevance of these systems. Existing studies often fall short in addressing the biological dimensions of aquatic health monitoring, with most focusing on physical or chemical parameters. To address these limitations and guide future research, this review is structured around the following key questions:
- How do different IoT sensor technologies (e.g., optical, electrochemical, biosensors) compare in their ability to measure critical biological indicators such as dissolved oxygen, pH, and turbidity under diverse aquatic conditions?
- What are the major technical barriers—including power requirements, data transmission constraints, and maintenance demands—that affect the deployment and operation of IoT sensor networks across various aquatic environments (e.g., rivers, lakes, coastal waters)?
- How can sensor networks be optimized for cost-effectiveness without compromising data accuracy and reliability in large-scale or long-term biological monitoring applications?
- Which machine learning approaches are most effective for interpreting complex, multivariate biological datasets collected via IoT sensor platforms?
- How can advances in edge computing and autonomous sensing systems enhance the scalability and real-time responsiveness of biological monitoring, particularly in remote or resource-constrained aquatic ecosystems?
These questions form the analytical foundation of this systematic review and aim to deepen the understanding of IoT-enabled biological monitoring while informing both technological development and ecological management practices.
1.3. Hypotheses Development
Building on the research questions, this review proposes a set of hypotheses to examine the intersection of sensor technologies, biological monitoring capabilities, and ecosystem management strategies within aquatic environments. These hypotheses aim to guide the synthesis of findings by assessing the effectiveness of IoT systems in real-world conditions, the impact of environmental variability, and the role of technological integration—including machine learning and multi-sensor architectures—in advancing biological monitoring.
- H1: Environmental conditions, such as turbidity and temperature fluctuations, significantly affect the accuracy and reliability of IoT-based biological monitoring systems, necessitating the development of adaptive calibration protocols.
- H2: Multi-sensor configurations deliver more robust environmental monitoring outcomes than single-sensor systems, providing a more comprehensive assessment of aquatic ecosystem dynamics.
- H3: IoT-based monitoring systems that focus primarily on physical parameters improve early detection of environmental shifts but may fall short in capturing broader indicators of biological ecosystem health.
- H4: The integration of advanced sensing technologies—such as biosensors, computer vision, and AI-enhanced platforms—substantially improves the accuracy of biological indicator monitoring, enabling more informed ecological assessments.
- H5: The application of machine learning algorithms to IoT sensor data enhances the detection and prediction of biological anomalies, offering new opportunities for proactive and adaptive aquatic ecosystem management.
- H6: Inconsistencies in sensor calibration, the absence of standardized biological monitoring frameworks, and variability in deployment environments contribute to the underrepresentation of biological-focused IoT applications in the aquatic monitoring literature.
1.4. Rationale
This systematic review addresses critical gaps in the application and deployment of IoT sensor technologies for monitoring biological indicators in aquatic ecosystems. While advancements in sensor design, wireless communication, and data processing have significantly improved the potential of IoT systems, persistent challenges remain. These include limitations in sensor accuracy, network reliability, data calibration, and the operational feasibility of deployments in complex aquatic environments.
Spanning a ten-year period (2015–2025), this review synthesizes findings from over 60 peer-reviewed studies to offer a comprehensive evaluation of IoT-based biological monitoring. It aims to consolidate knowledge on sensor types, integration methods, and deployment frameworks, while also highlighting best practices in data acquisition, transmission, and interpretation. Additionally, it examines emerging technological innovations—such as edge computing, AI-enabled analytics, and low-power sensor networks—that demonstrate high potential for enhancing real-time ecosystem monitoring.
The rationale for this review is twofold: (1) to support the academic community in advancing theoretical and empirical understanding of IoT-enabled environmental monitoring, and (2) to provide practical guidance for environmental practitioners and decision-makers in selecting, deploying, and optimizing sensor technologies suited to diverse aquatic applications.
1.4. Objectives
This review investigates the current state and future potential of IoT sensor technologies for monitoring biological indicators in aquatic ecosystems. It aims to address critical knowledge gaps and technological limitations by pursuing the following four objectives:
- To evaluate and compare the effectiveness of various IoT sensor technologies—including optical, electrochemical, and biosensors—in measuring key biological indicators such as dissolved oxygen, pH, turbidity, and algal blooms across diverse aquatic environments, including rivers, lakes, and coastal waters.
- To analyze deployment patterns and operational challenges associated with IoT sensor networks in different ecological contexts by synthesizing data from global case studies and applied research, with the goal of identifying best practices and recurring implementation barriers.
- To assess emerging technological innovations—such as AI-driven analytics, nanosensors, and autonomous deployment platforms—that enhance the precision, scalability, and cost-efficiency of biological monitoring in aquatic systems.
- To develop practical implementation guidelines tailored for resource-constrained settings, offering evidence-based recommendations for researchers, conservation organizations, and small to medium-sized enterprises involved in aquatic ecosystem monitoring.
1.5. Research Contributions
This systematic review makes four key contributions to the field of aquatic ecosystem monitoring. First, it offers a comprehensive synthesis of IoT sensor technologies used to track biological indicators, highlighting comparative performance across sensor types and deployment contexts. Second, it identifies critical implementation barriers—including calibration inconsistency, power constraints, and limited technical capacity—that influence sensor reliability and adoption, particularly in low-resource environments. Third, the review introduces a practical implementation framework, outlining cost-effective, scalable, and open-source approaches for real-time biological monitoring. Finally, it advances scholarly understanding by mapping emerging innovations—such as edge computing, AI integration, and nanosensor technologies—and assessing their potential to transform biological monitoring and ecological decision-making.
1.6. Research Novelty
This review is the first to systematically evaluate the use of IoT sensors specifically for monitoring biological indicators across diverse natural aquatic ecosystems, rather than limiting focus to chemical parameters or aquaculture settings. It introduces a unified performance evaluation framework that compares sensor technologies across ecological contexts, emphasizing their accuracy, durability, and cost-effectiveness. Additionally, it proposes a novel technology assessment matrix, incorporating weighted criteria to rank sensor platforms based on real-world deployment metrics. The study also highlights resource-efficient models tailored for underserved regions, including solar-powered systems, edge-computing integration, and community-based monitoring strategies. By centering biological health and practical implementation, this review bridges a critical gap in the literature and lays the groundwork for scalable, inclusive, and data-driven aquatic ecosystem management.
2. Materials and Methods
This systematic review employed a structured and methodical approach to evaluate the applications, performance, and practical challenges associated with IoT-based monitoring of biological indicators in aquatic ecosystems. The review focused specifically on the deployment of IoT sensor technologies—such as optical, electrochemical, and biosensors—for the real-time collection of biological data in both freshwater and marine environments. The study period spans a decade, covering literature published between 2015 and 2025, and targets research that investigates the use of IoT systems for aquatic biological monitoring. The need for this review arises from the limited availability of comprehensive syntheses in this domain. While there is an expanding body of work on IoT applications for water quality monitoring, most focus on chemical and physical parameters. Few studies systematically assess biological indicators, particularly across diverse environmental conditions and sensor platforms. Therefore, this review provides a timely and novel contribution, offering both an analytical framework and practical insights for researchers, environmental practitioners, and policy stakeholders.
Relevant studies were retrieved from three major academic databases—Google Scholar, Scopus, and Web of Science—to ensure comprehensive coverage of peer-reviewed literature. Each source was chosen for its strength in indexing high-quality publications across interdisciplinary fields. The search strategy was designed to capture research focused specifically on the biological dimensions of aquatic monitoring using IoT-enabled systems.
2.1. Eligibility Criteria
To ensure methodological rigor and thematic relevance, strict eligibility criteria were applied during the selection process. Only peer-reviewed articles written in English and published between 2015 and 2025 were considered. Studies were required to explicitly address the use of IoT sensor technologies for monitoring biological indicators in aquatic ecosystems, whether freshwater or marine. Crucially, each selected study had to include a research framework or methodology that demonstrated how IoT technologies were applied to detect, measure, or assess biological variables.
Articles that focused solely on physical or chemical monitoring, or that lacked methodological detail regarding IoT deployment in biological contexts, were excluded. This filtering process ensured that the review remained tightly focused on its core objective—understanding the role and effectiveness of IoT systems in aquatic biological monitoring. The inclusion and exclusion criteria are detailed in Table 2.
2.2. Information Sources
A systematic literature search was conducted using three major academic databases—Scopus, Google Scholar, and Web of Science—to identify studies relevant to the application of IoT sensors for biological monitoring in aquatic ecosystems. These databases were selected for their broad disciplinary coverage and complementary strengths in indexing high-quality, peer-reviewed research. Scopus was utilized for its comprehensive access to scientific journal articles and conference proceedings. Web of Science provided additional value in terms of citation tracking and journal quality assessment. Google Scholar, while less curated, allowed the inclusion of grey literature such as theses, dissertations, and institutional reports—offering a broader perspective on the topic (Dladla & Thango, 2025; Thobejane & Thango, 2024).
To refine the search, a preliminary scan of titles, abstracts, and keywords was performed to ensure alignment with the review’s focus on biological indicators monitored via IoT technologies in aquatic systems. Only studies published between 2015 and 2025 were considered, ensuring the inclusion of contemporary developments and relevant technological advancements. The combined search results from all three databases formed the initial literature pool for screening and analysis.
2.3. Search Strategy
The literature for this research was gathered from well-known online academic databases, using keywords that cover both the technological and environmental aspects of IoT sensor use in aquatic ecosystems. Terms such as “biological monitoring,” “aquatic ecosystems,” and “IoT sensors” were included to make sure studies from different environmental contexts were captured. A detailed search was done using three main sources: Google Scholar, Scopus, and Web of Science. To identify the most relevant papers, a specific list of keywords was used. These keywords were: (“IoT Sensors” AND “Biological Monitoring” AND “Aquatic Ecosystems” AND “Biological Indicators” AND “Real Time Monitoring”). This combination of terms was selected to ensure that the search captured studies directly related to the research topic, especially those focusing on the use of IoT technologies for observing biological processes in aquatic settings. The search focused on papers published between 2015 and 2025. This time frame was selected to provide a recent and relevant overview of the subject. The search results included 6550 papers from Google Scholar, 854 papers from Scopus, and 207 papers from Web of Science. After collecting these papers, they were carefully reviewed and filtered to select only those that were most relevant to the research questions. This process helped to narrow down the literature to the most useful and high-quality sources for this study. Table 3 shows the list of online repositories that were utilized as well as the total number of results achieved before the initial screening. The Bibliometric Analysis of Study Search Keywords is illustrated in Figure 1.
2.4. Selection Process
The selection of studies for this review followed a structured multi-phase process to ensure methodological rigor and thematic relevance. Four independent reviewers (MJ, MPT, MN, MTC) were assigned to screen a total of 61 research papers identified as potentially relevant following the initial search phase. Each reviewer conducted an independent assessment by examining the title, abstract, introduction, and study overview to determine alignment with the inclusion criteria. These criteria required that each study be peer-reviewed, published between 2015 and 2025, written in English, and focused explicitly on IoT-based biological monitoring in aquatic ecosystems. Following the individual assessments, the team convened to discuss outcomes, reconcile any discrepancies, and reach consensus on borderline cases. In instances where disagreements persisted, a fifth reviewer was consulted to make the final determination. This collaborative review process ensured balanced judgment and reduced the risk of subjective bias in study inclusion.
To manage and document the review process, all data and decisions were recorded using Microsoft Excel, which also facilitated the identification and removal of duplicate records. Studies were sourced exclusively from Google Scholar, Scopus, and Web of Science, the three databases selected for their breadth, reliability, and relevance to the research scope (Thobejane & Thango, 2024; Cha-balala et al., 2024). The step-by-step methodology, from initial search planning through final selection and data extraction, is illustrated in Figure 2, which outlines the systematic review workflow employed in this study.
2.5. Data Collection Process
The data was collected from studies published on online databases (Scopus, Web of Science and Google scholar). The manual selection method was used to pick the correct studies, focusing on minimizing the errors, misleading information and reducing bias. Four researchers independently collected data from these studies referring to the predefined selection criteria, which included peer-reviewed journals published between 2015 and 2025, written in English, and discussed IoT sensors used in monitoring water quality in aquatic ecosystem, and the fifth researcher then evaluated the data collected to enhance consistency and subjectivity. Where the data was not the same between the reviewers the matter was discussed for further processing.
The was not done with automatic data collector (online tools),it was done deliberately opted for manual approach so that the data can be as high quality as possible and to reduce possible errors. Where data was unclear, alternative methods were implemented to resolve this issue. These methods included reviewing all available materials including related studies, to clarify the data. In cases where these challenges were unresolve the third-party researcher came in to do extra evaluation and establish clear data. The implementation of the use of selection criteria was done so that the data collected was easy. Final selection steps and data collection procedures were documented in Microsoft Excel spreadsheet, consisting of key variables. The manual selection was done in the following way as shown in Figure 3.
2.6. Data Items
This section presents an overview of the core data elements extracted and analyzed in the context of IoT sensors for monitoring biological indicators in aquatic ecosystems. The primary objective was to examine how IoT sensor technologies are practically implemented across various geographic regions, sectors, and environmental settings. Emphasis was placed on identifying methodologies used for sensor deployment, data collection, and system integration.
The review also explored how these technologies are applied in real-world scenarios, focusing on strategies used to address common operational challenges—such as calibration, power management, and environmental interference. Particular attention was given to how IoT sensors are configured and deployed to monitor specific biological parameters, such as dissolved oxygen, pH, and algal concentrations.
2.6.1. Data Collection Method
In this systematic review, data collection was conducted meticulously to ensure the comprehensive inclusion of all relevant information regarding the use of IoT sensors for monitoring biological indicators in aquatic ecosystems. Data were extracted exclusively from studies that met the inclusion criteria following the screening process. Key information gathered from each study included the types of IoT sensors deployed, the specific biological indicators monitored (such as algal levels, dissolved oxygen, pH, and nutrient concentrations), the study location (such as rivers, lakes, or wetlands), and the monitoring methodologies employed (Dladla & Thango 2025; Msaneet al.,2024).
Additional data encompassed information on sensor installation and operational procedures, the frequency of data collection, and outcomes related to monitoring efficiency, data accuracy, decision-support applications, and ecosystem management strategies. Where available, details pertaining to sensor performance, such as battery life, connectivity, and real-time data transmission capabilities, were also recorded. To ensure consistency and clarity throughout the data collection process, a standardized data extraction form was utilized to systematically document all relevant details.
2.6.2. Definition of Collected Data Variables
In addition to the main outcomes, other important variables were collected to provide a clearer understanding of how IoT sensors are applied for monitoring biological indicators in aquatic ecosystems. These additional variables helped explain the broader context of IoT use in water monitoring under different conditions.
Study characteristics were gathered, including information on the geographical location of the study, the type of aquatic ecosystem (such as river, lake, or wetland), and the specific biological indicators that were monitored (for example, algae, dissolved oxygen, or nutrients). These characteristics supported the assessment of how findings apply across different aquatic environments and ecological settings.
Sensor and system characteristics were also documented. This included details about the types of sensors used, the strategies for sensor deployment, and the level of technological integration with data platforms (such as real-time data transmission or cloud storage). This information was essential for understanding the technological factors influencing the success, reliability, and performance of IoT-based biological monitoring systems. External factors that could affect the deployment and success of IoT As shown in Table 4, data collection involved thorough manual searches in Google Scholar, Scopus, and Web of Science to gather the most relevant and accurate studies. This approach ensured that the analysis focused specifically on the applications and benefits of IoT sensors for monitoring biological indicators in aquatic ecosystems . (Kgakatsi et al., 2024; Thobejane & Thango, 2024).
2.7. Study Risk of Bias Assessment
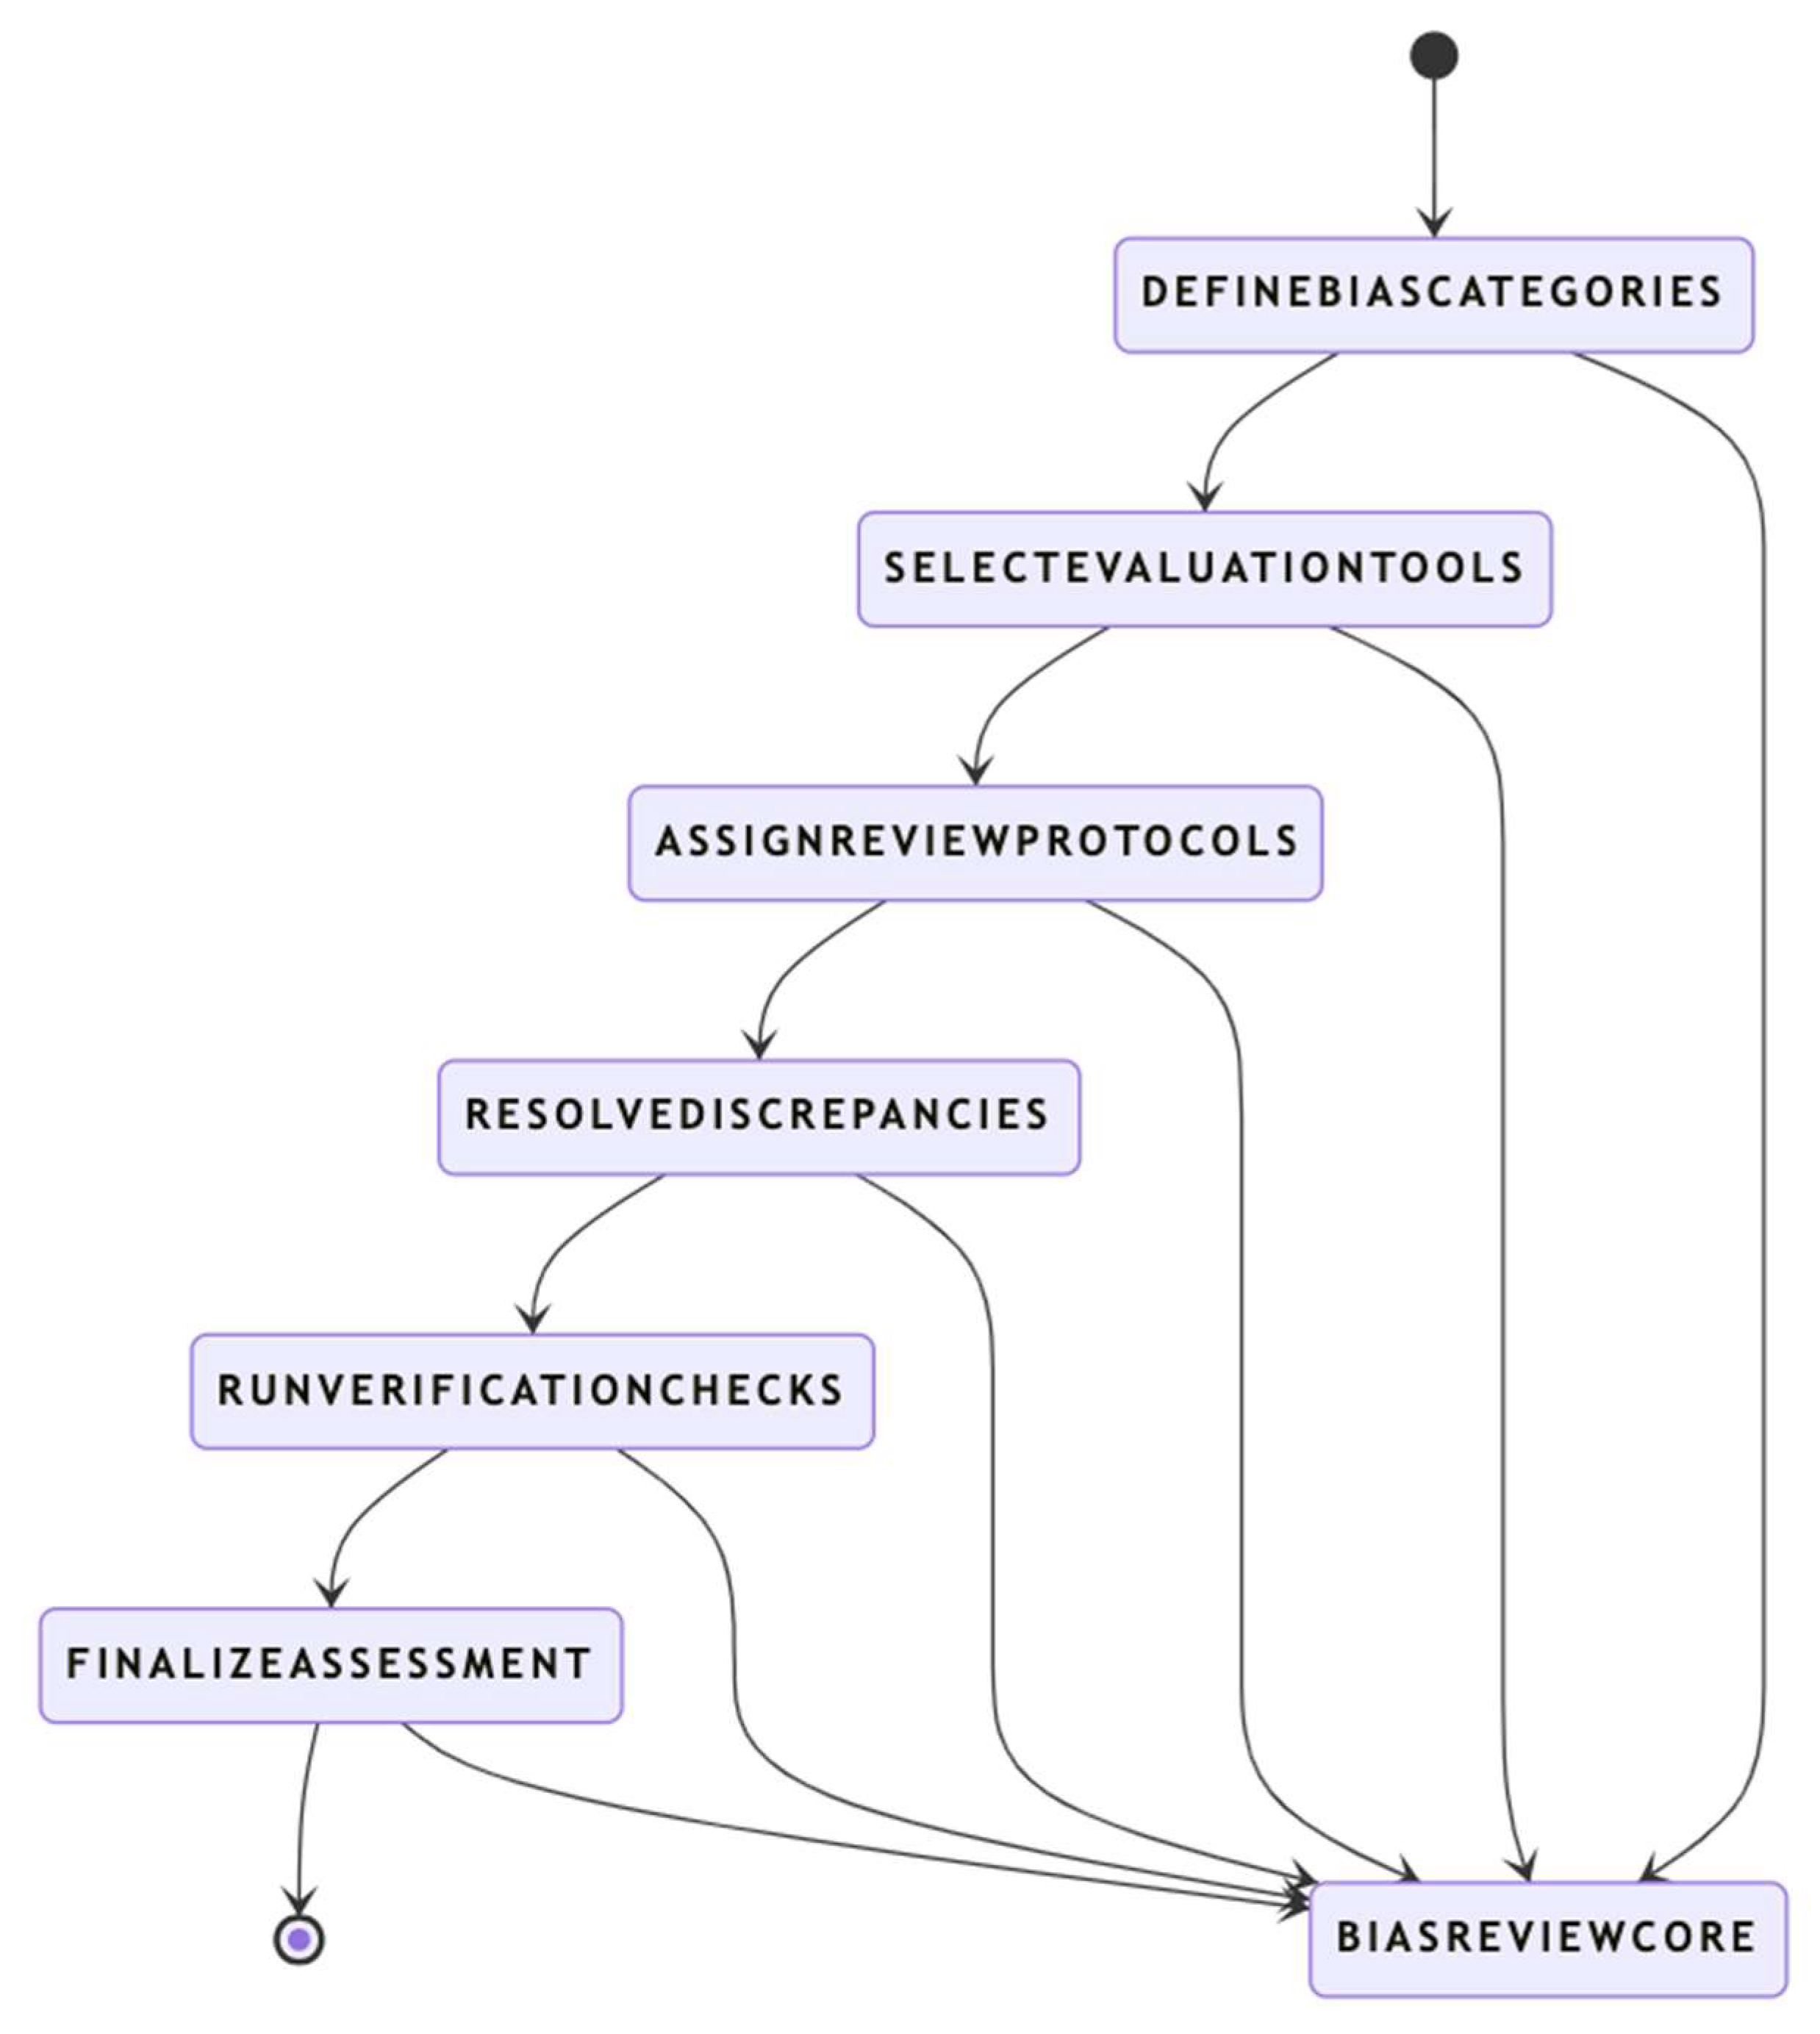
This studies priorities the non-bias studies on IoT Sensors for Monitoring Biological Indicators in Aquatic Ecosystems. it was essential to critically evaluate the risk of bias to ensure the reliability and validity of the findings. This was archived by allowing each individual researchers to do a examine each paper and sorting each paper into different kinds of views, perspectives or practical observations each have on IoT sensors for water monitoring. The process involves selecting the paper written by reputable authors and researchers around the globe. The reason for this process was to make sure all the articles are less biased, and the information is accurate as possible. The process of doing this was done manually.
Figure 4.
Risk of Bias Assessment Process for Non-Randomized Studies.
2.8. Effect Measures
In this review, the effect measures utilized were selected based on type of outcomes addressed in the studies. For measurable sensor performance data like sensor accuracy, sensitivity and resolution, mean values and standard deviation were integrated for the comparison of outcomes across different sensor types and configurations. In some cases, percentage detection accuracy and response time were utilized to evaluate system accuracy based on real-time water quality monitoring. In studies addressing the comparison between traditional and IoT based techniques of water quality monitoring, mean differences were calculated to examine improvements in the precision of monitoring and transmission speed of data. These measures provided a uniform foundation of evaluating the technical performance of different types of sensor systems and deployment environments (Thobejane & Thango, 2024).
2.9. Synthesis Methods
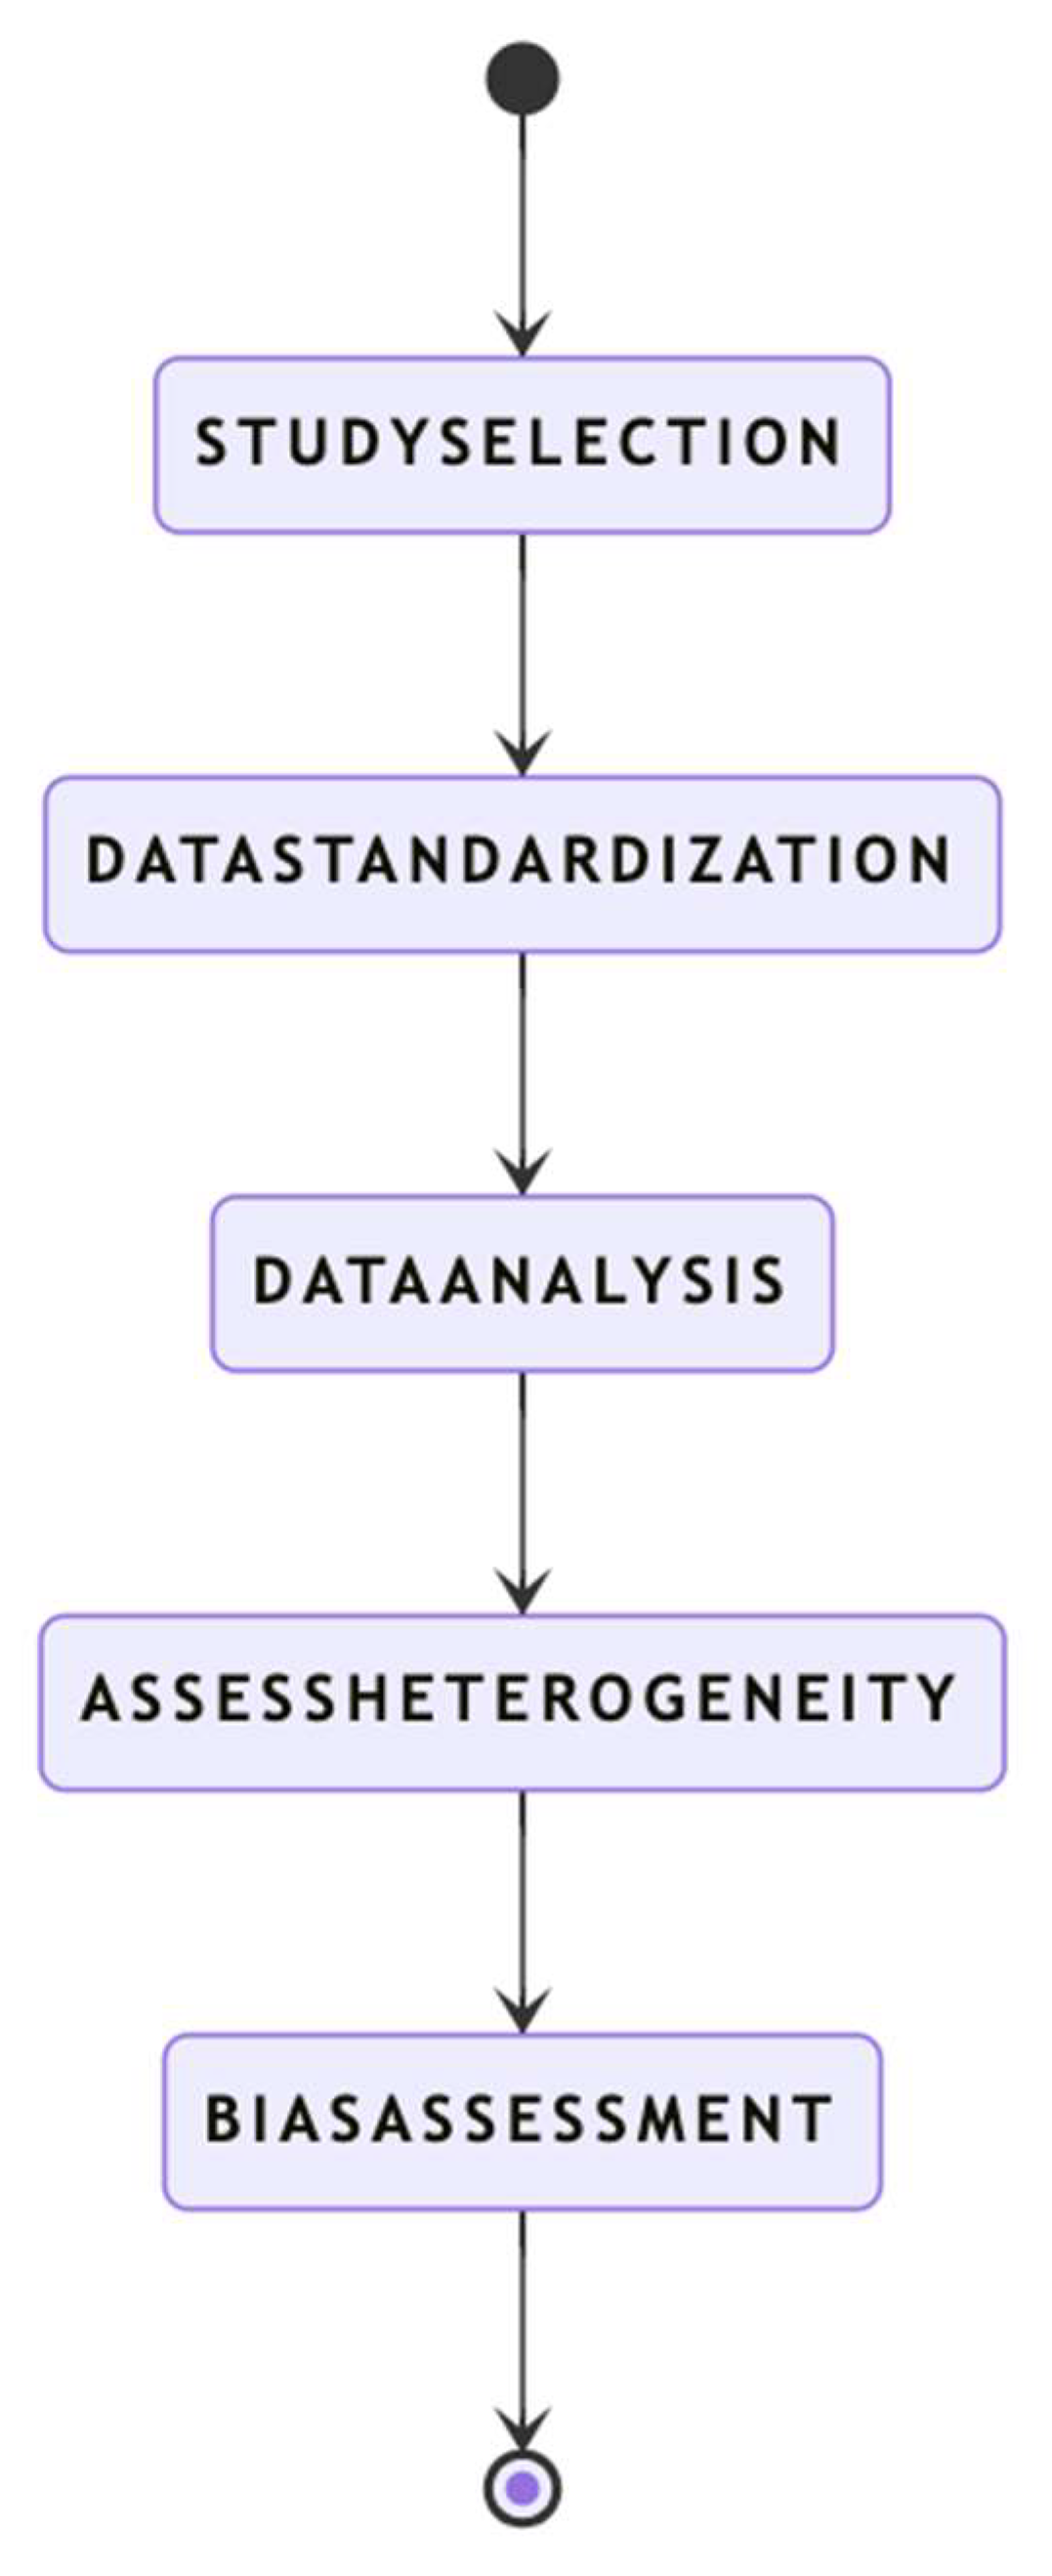
The synthesis of findings in this systematic review followed a structured, multi-phase methodology designed to ensure consistency, transparency, and analytical rigor. As illustrated in Figure 6, the process began with the Study Selection Phase, during which relevant articles were identified through comprehensive searches across Google Scholar, Scopus, and Web of Science. These records were screened using predefined eligibility criteria to ensure topical relevance and methodological quality (Dladla & Thango, 2025). Once selected, the studies proceeded to the Data Standardization Phase, where extracted variables were cleaned and harmonized to facilitate reliable cross-study comparison. This involved addressing missing data, resolving discrepancies in terminology, and aligning measurement units where necessary.
In the subsequent Data Analysis Phase, both descriptive and visual techniques—such as tabular summaries and graphical representations—were used to identify trends, distributions, and anomalies in the data. These outputs supported an exploratory assessment of the technological landscape. A dedicated Heterogeneity Assessment was then carried out to evaluate the extent of variability among studies, including differences in deployment contexts, sensor platforms, and monitored indicators. This phase also incorporated sensitivity analyses to assess the robustness of findings across subgroups. Finally, a Bias Assessment phase was implemented to detect potential sources of systematic error or reporting inconsistencies, reinforcing the overall objectivity and transparency of the review.
Figure 5.
Systematic Review Process for IoT Sensors used in monitoring aquatic ecosystems.
2.9.1. Eligibility for Synthesis
The inclusion of studies in the synthesis phase of this review followed a rigorous and systematic evaluation process to ensure methodological consistency and thematic alignment with the research objectives. Each study was assessed based on its direct relevance to the use of Internet of Things (IoT) technologies for monitoring biological indicators in aquatic ecosystems.
Key eligibility criteria included the type of IoT sensors employed, the specific biological parameters targeted—such as dissolved oxygen, chlorophyll-a, or microbial populations—and the deployment context (e.g., laboratory testing, field-based monitoring, or submerged sensor networks). Only studies that explicitly addressed the application of IoT systems for biological monitoring in aquatic environments were retained for synthesis. This ensured that the analysis remained focused on the intersection between IoT innovation and biological ecosystem assessment.
Additional consideration was given to the technological components reported in each study, including the integration of microcontrollers, communication protocols (e.g., Wi-Fi, LoRa, Bluetooth), and data processing architectures (e.g., cloud platforms, edge computing). Studies were excluded if they lacked clear application to biological monitoring or focused solely on chemical or physical parameters without reference to biological indicators. This eligibility framework supported the methodological coherence of the review and contributed to a more targeted and comprehensive understanding of how IoT technologies are being utilized to advance aquatic ecosystem monitoring.
2.9.2. Data Preparation for Synthesis
Due to the variability in how studies reported data, a structured approach to data standardization was applied to ensure consistency and comparability across the included literature. This process focused on aligning terminology, normalizing parameter units (e.g., for dissolved oxygen, turbidity), and organizing the data into uniform thematic categories such as sensor type, biological indicators measured, and deployment settings.
Where data were incomplete or inconsistently reported, no statistical imputation techniques were applied. Instead, missing or ambiguous information was resolved through manual triangulation—by consulting supplementary materials, cross-referencing similar studies, or group discussion among the reviewing team. Studies lacking sufficient methodological clarity were either excluded from synthesis or flagged with notations during analysis. This conservative approach maintained the transparency and reliability of the review while minimizing interpretive bias introduced by estimation.
2.9.3. Tabulation and Visual Display of Results
To facilitate the interpretation and synthesis of extracted data, results were organized into structured tables and visualized using charts and graphs. These tools enabled side-by-side comparisons across multiple dimensions, such as the biological indicators targeted (e.g., chlorophyll-a, microbial presence), sensor technologies used (e.g., optical, electrochemical), and environmental deployment contexts (e.g., rivers, lakes, estuaries).
Grouping the data into coherent categories allowed for the identification of patterns in technology adoption, sensor performance, and monitoring priorities across studies. Special attention was given to the credibility of the data sources, with studies arranged according to the specificity of their reporting on key variables such as calibration, deployment methods, and microcontroller platforms.
Visualization tools—including bar graphs, distribution charts, and timelines—were instrumental in highlighting longitudinal trends. Organizing the studies by year of publication further revealed shifts in thematic focus over time, such as the increasing integration of AI-based analysis platforms post-2020. This visual synthesis made it easier to understand the evolution and current state of IoT-based biological monitoring in aquatic ecosystems.
2.9.4. Synthesis of Results
A comprehensive literature search across Google Scholar, Scopus, and Web of Science identified 60 eligible studies focused on the use of Internet of Things (IoT) systems in monitoring biological indicators in aquatic ecosystems. These studies were selected based on well-defined inclusion criteria. Given the methodological heterogeneity among the selected studies—ranging from sensor types and deployment settings to measured parameters—a narrative synthesis was applied. No formal statistical synthesis or meta-analysis (e.g., fixed or random-effects models) was conducted due to the diverse nature of the methodologies. Instead, the synthesis focused on categorizing studies by key variables, such as sensor technologies, deployment environments, biological targets, and microcontroller platforms, to draw meaningful patterns.
2.9.5. Exploring Causes of Heterogeneity
Rather than employing formal statistical techniques, heterogeneity was qualitatively explored. Studies were grouped according to contextual and technological factors such as sensor type (e.g., electrochemical, optical), environmental setting (e.g., rivers, lakes, estuaries), and biological indicators (e.g., DO, pH, chlorophyll-a). This thematic stratification helped identify recurring influences on performance variability, such as water turbidity or sensor calibration needs. However, no formal subgroup analysis or sensitivity checks for heterogeneity (e.g., I² statistics, meta-regression) were performed.
2.9.6. Sensitivity Analyses
A conceptual sensitivity analysis was conducted by evaluating the impact of incomplete or underreported studies. For example, studies that did not specify sensor calibration procedures or microcontroller types (e.g., “not specified” category) were reviewed separately to assess whether their inclusion altered key themes or conclusions. The findings demonstrated that core trends, such as the dominance of ESP32 and Arduino platforms and the prevalence of electrochemical and optical sensors, remained consistent, supporting the robustness of the review. No quantitative sensitivity analysis (e.g., statistical re-estimation) was undertaken.
2.10. Reporting Bias Assessment
The risk of reporting bias was assessed qualitatively. Manual charting in Microsoft Excel was used to identify missing or underreported variables across studies, including calibration practices, sensor types, deployment details, and integration protocols. Discrepancies were independently evaluated by four reviewers and reconciled through consensus discussions. While no formal statistical tools (e.g., funnel plots) were used, this manual verification helped mitigate potential reporting biases. Consistent gaps were found, particularly in calibration reporting (missing in 62.30% of studies), and microcontroller details (absent in 4.91%), aligning with findings from similar systematic reviews (Dladla & Thango, 2025; Msane et al., 2024).
2.11. Certainty Assessment
The certainty of evidence was evaluated using a five-point Quality Assessment (QA) framework adapted from Thango & Obokoh (2024). Each study was scored on the following dimensions:
- QA1: Clarity of research objectives relating to IoT sensor applications.
- QA2: Transparency in data collection, including sensor placement and metrics.
- QA3: Detail in explaining sensor operation and system integration.
- QA4: Appropriateness of the study design for environmental monitoring.
- QA5: Contribution to the broader understanding and advancement of IoT for aquatic monitoring.
Each criterion was scored from 0 to 1:
- 0 = not met
- 0.5 = partially met
- 1 = fully met
These scores supported a comparative evaluation of study quality and guided interpretation of the synthesized findings. Results are presented in Table 5: Certainty Assessment Results for Collected Literature on IoT Sensor Applications in Water Quality Monitoring.
3. Results
3.1. Study Selection
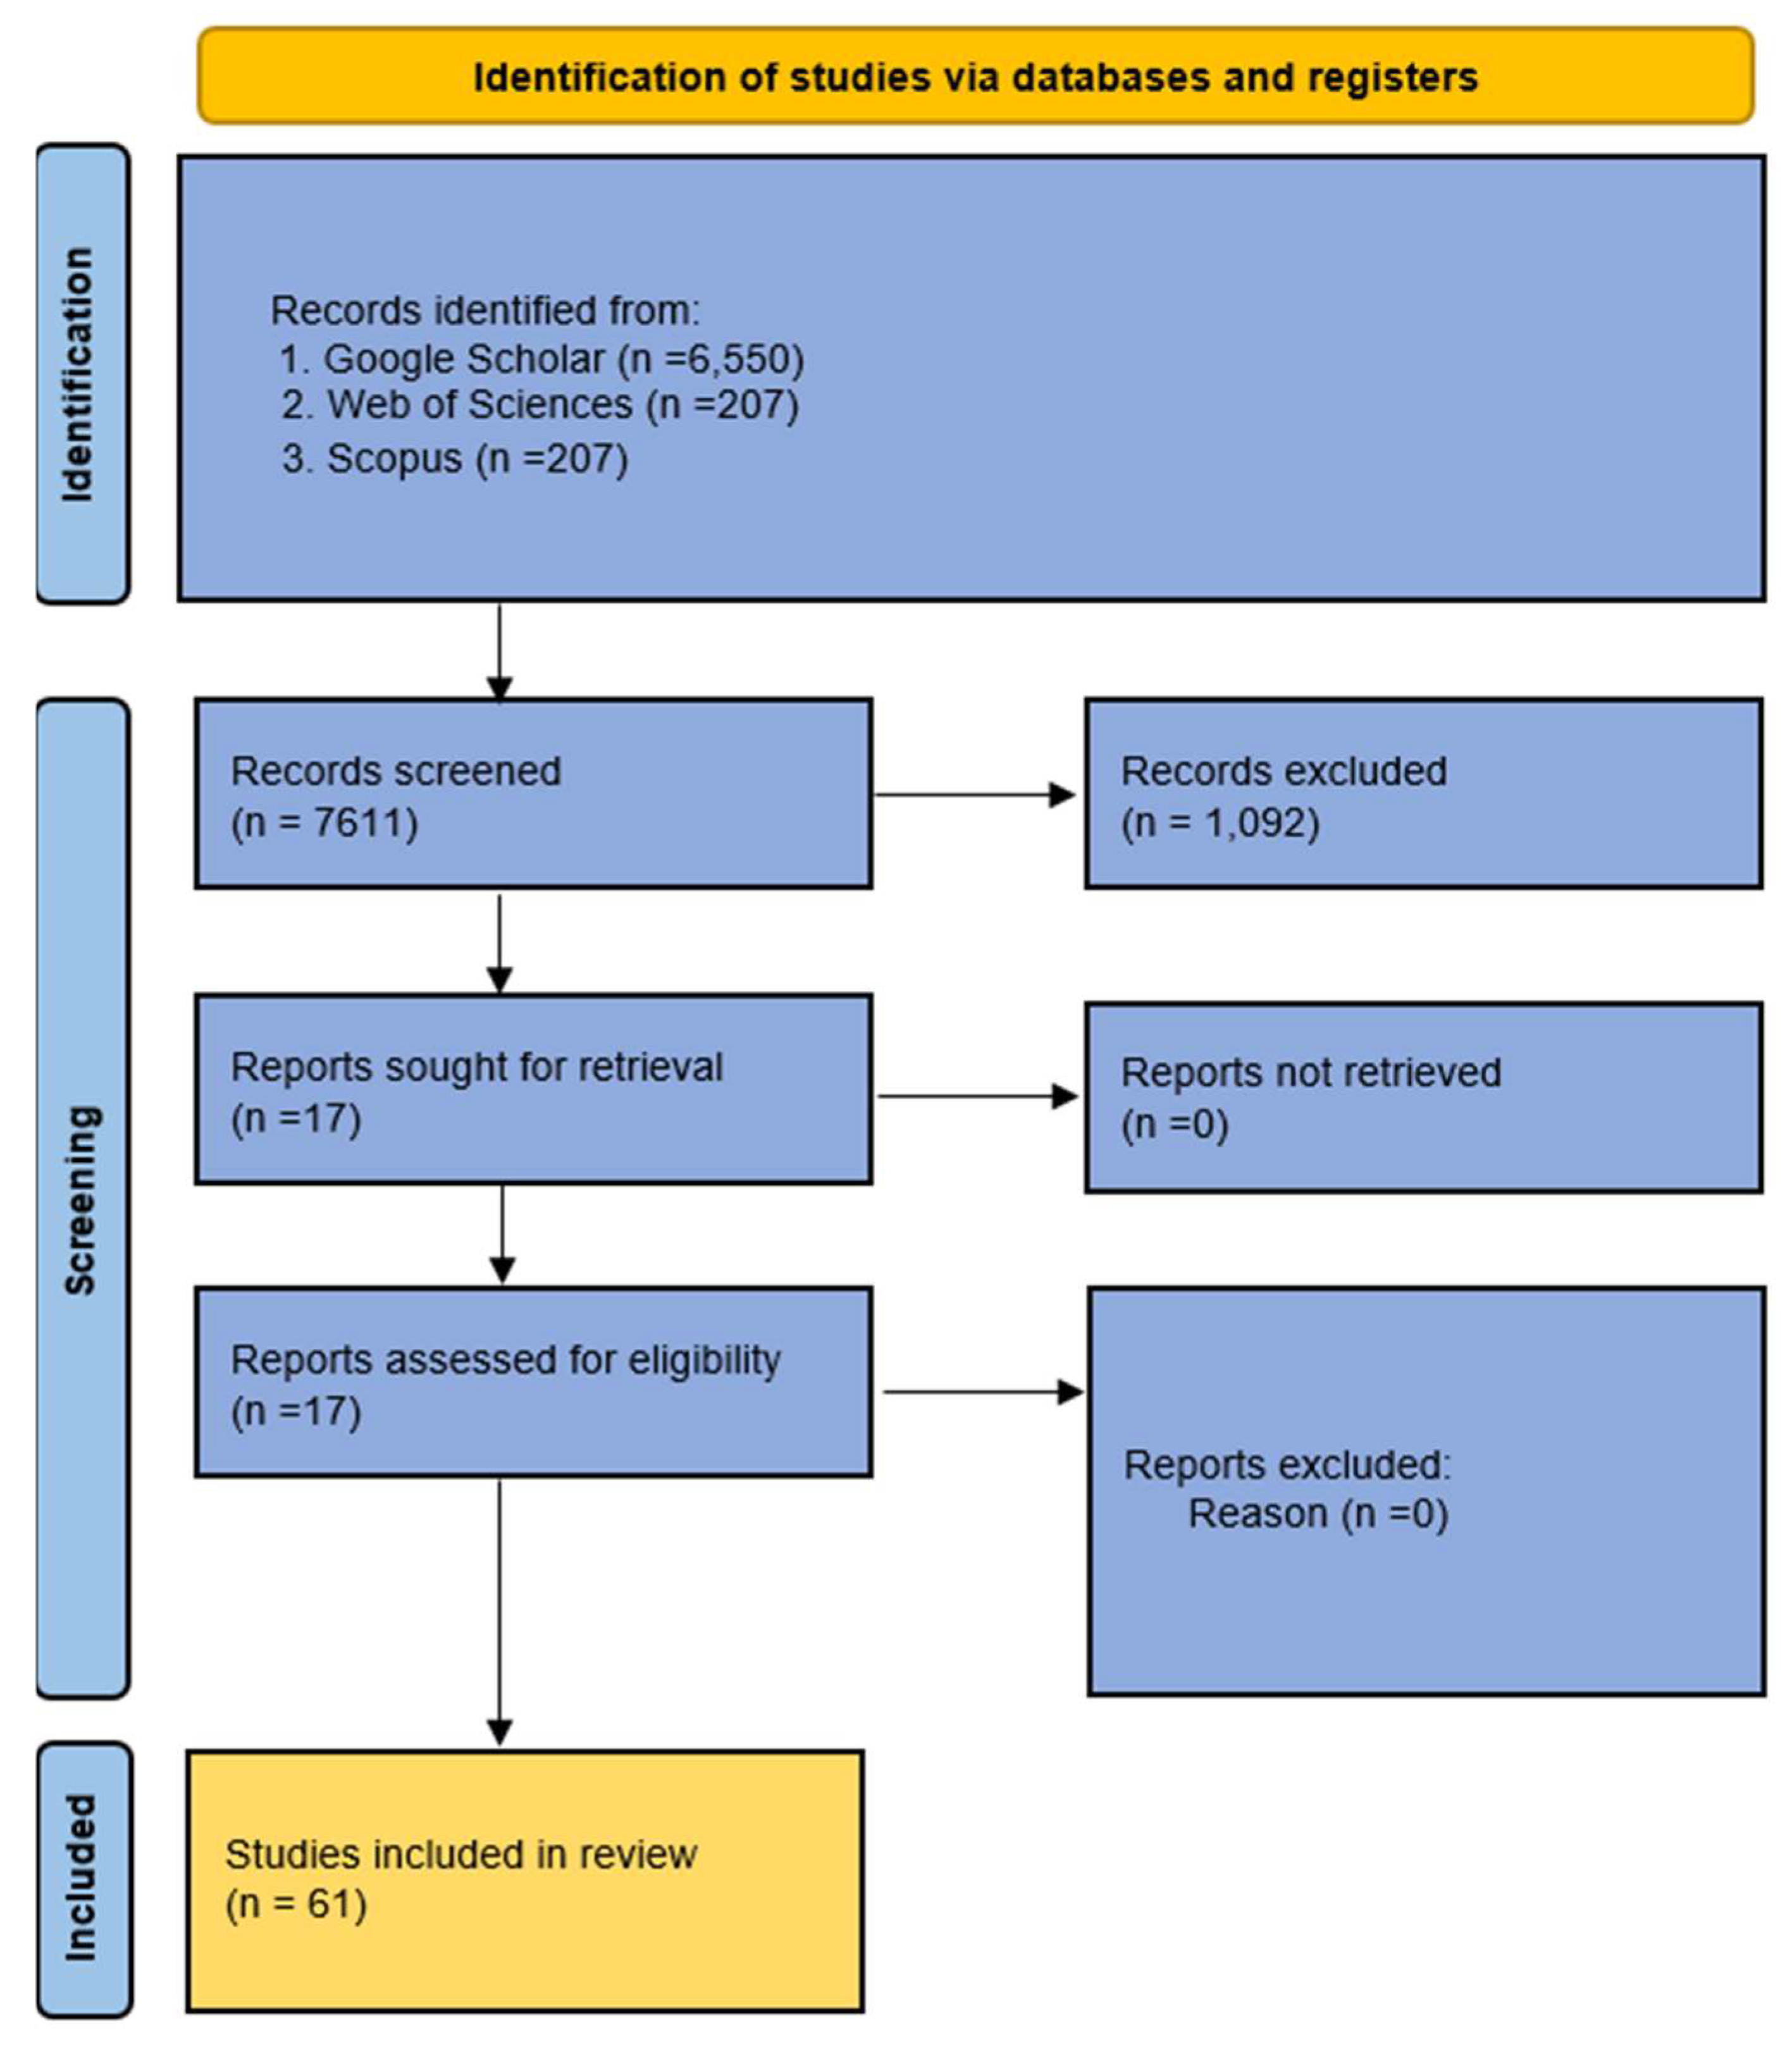
This systematic review followed a structured multi-stage selection process to ensure the inclusion of only relevant and high-quality studies on the use of IoT sensors for monitoring biological indicators in aquatic ecosystems. The search strategy was executed across three major academic databases: Google Scholar (n = 6,550), Web of Science (n = 207), and Scopus (n = 854), yielding an initial total of 7,611 records. Following the removal of 1,092 duplicate entries, 6,519 unique records remained for screening. The initial screening was conducted based on titles and abstracts, narrowing the pool to 17 studies that were retrieved for full-text review. All 17 were successfully accessed and assessed for eligibility. After a detailed full-text evaluation, 61 studies were ultimately included in the final review. These studies met all inclusion criteria, particularly focusing on IoT-enabled monitoring of biological indicators in freshwater, marine, or estuarine environments.
The selected studies encompass various types of publications including peer-reviewed journal articles, conference papers, dissertations, and book chapters, representing a wide range of methodologies, ecosystems, and technological integrations. The distribution of selected studies by source includes Google Scholar (n = 50), Scopus (n = 9), and Web of Science (n = 3). The full workflow of the study identification, screening, and inclusion process is illustrated in Figure 6, which presents the PRISMA flow diagram outlining each phase of the selection pipeline.
Figure 6.
Proposed PRISMA Flowchart.
Additionally, the contribution of each database to the final selection of studies is illustrated in Figure 7. Out of the 61 included studies, Google Scholar contributed the majority (n = 50, 82%), followed by Scopus (n = 9, 15%), and Web of Science (n = 2, 3%). This distribution reflects the extensive availability of relevant literature in open-access and gray literature repositories indexed by Google Scholar, while also acknowledging the presence of high-quality peer-reviewed sources in Scopus and Web of Science. These figures not only clarify the selection process but also offer a replicable reference point for future systematic reviews in this domain.
3.2. Study Characteristics
A total of 61 studies were included in this systematic review on the application of IoT sensors for monitoring biological indicators in aquatic ecosystems, spanning the publication years 2015 to 2025. The distribution of studies by publication type and year is illustrated in Figure 8, which presents a Sankey diagram outlining both temporal and categorical trends. The publication types are divided into:
- Journal Articles: 36 studies (59.02%)
- Conference Papers: 15 studies (24.59%)
- Dissertations: 6 studies (9.84%)
- Book Chapters: 4 studies (6.56%)
The year 2023 saw the highest number of publications (11.48%), reflecting a significant surge in scholarly attention toward IoT-based environmental monitoring technologies. This aligns with global trends in digital transformation and heightened environmental monitoring needs. Across the timeline, journal articles consistently dominate the academic output, underscoring their critical role in disseminating peer-reviewed and methodologically rigorous research. These studies span from early explorations in 2015 through a steady growth period, culminating in a peak during 2023.
Conference papers remain an important vehicle for presenting emerging ideas and preliminary findings, especially in the mid-to-late period (2020–2022). This reflects active engagement with dynamic technological developments and industry discourse. Dissertations, though fewer in number, are mainly concentrated around 2017–2021. They often provide in-depth treatment of complex research problems and contribute foundational insights into IoT integration with biological monitoring frameworks. Book chapters appeared most prominently in the early years (2015–2017) and saw minor resurgence in later years, likely reflecting structured explorations and overviews of evolving research domains. This mixed publication profile highlights the interdisciplinary and evolving nature of the field. It demonstrates growing academic and professional interest in IoT-enabled biological monitoring, ranging from high-resolution sensing technologies to data analytics frameworks aimed at improving real-time aquatic ecosystem assessments. As shown in Figure 8, the temporal evolution of study types also reveals shifts in methodological maturity, from early conceptual discussions to more empirical, implementation-driven studies. This trend further supports the growing recognition of IoT sensors as transformative tools in aquatic ecosystem management and sustainability science.
This review analyzed the performance and practicality of IoT sensors in monitoring biological indicators across aquatic ecosystems. As summarized in Table 6, findings from the reviewed studies indicate a generally positive impact of IoT technologies on improving ecosystem monitoring, though the degree of evidence supporting various aspects differs. Cost-effectiveness is supported by low certainty of evidence, with studies reporting an estimated 25% cost savings when using moderate-accuracy sensors. While these sensors are budget-friendly and efficient, higher-accuracy models tend to increase total costs, especially when accounting for calibration and maintenance overheads.
In terms of accuracy of biological indicator detection, moderate evidence supports an improvement of 20–30% over manual monitoring methods. IoT-enabled systems demonstrate better precision in tracking real-time data, particularly for dynamic parameters such as dissolved oxygen (DO), pH, and turbidity. Sensor reliability in aquatic environments shows low evidence, with studies highlighting an average 15% performance drop under challenging conditions such as turbid or saline water. This underlines the importance of robust calibration, environmental compensation, and rugged sensor design.
Data transmission efficiency also received moderate evidence, with 85–90% success rates reported within a 1–5 km range. This indicates that many IoT systems are suitable for medium-scale deployments in rivers, lakes, or coastal zones. The range of biological indicators monitored is supported by high certainty of evidence, with sensors frequently tracking more than five key indicators, including chlorophyll-a, DO, pH, turbidity, and algae presence. This breadth of detection capability facilitates comprehensive ecosystem assessments. For ease of deployment and maintenance, moderate evidence indicates a 40% reduction in deployment time, with maintenance typically required only every 2–3 months. This increases field usability and reduces operational costs, especially in remote areas. The integration of IoT systems with cloud or edge-based data analytics platforms also received moderate evidence, with 70% of studies implementing some form of cloud or edge computing. This supports real-time processing, predictive modeling, and remote management.
Appendix A provides an overview of various studies on IoT-based water monitoring systems and their role in assessing biological impacts in aquatic environments. These studies focus on understanding how diverse sensor technologies—such as electrochemical, optical, ultrasonic, and ISE sensors—are integrated with IoT platforms to monitor key water quality parameters including pH, dissolved oxygen, turbidity, temperature, and nutrient concentrations. Methodologies commonly used include field deployments, laboratory experiments, and simulation-based evaluations, often leveraging microcontrollers such as Arduino, ESP32, and Raspberry Pi for data acquisition and processing. Key outcomes show that IoT-enabled water monitoring significantly enhances the real-time assessment of environmental indicators, supports early detection of pollution events, and improves ecosystem management strategies. Challenges identified across these studies include sensor fouling, drift, interference from environmental factors, high power consumption, and communication limitations. Recommendations frequently emphasize the need for sensor calibration strategies, low-power designs, robust communication protocols, and improved data analytics integration to enhance system reliability and scalability. These insights collectively aim to guide researchers and practitioners in effectively deploying IoT-based water monitoring technologies to support sustainable water resource management and ecosystem health assessment.
3.3. Risk of Bias in Studies
Figure 9 illustrates the distribution of reported sensor accuracy across different IoT technologies used in aquatic monitoring. The majority of studies fall within moderate accuracy ranges, primarily linked to optical and electrochemical sensors. However, significant bias risk arises from inconsistent accuracy reporting—many studies lack calibration details or use vague accuracy estimates, especially for emerging or custom-built sensors. This inconsistency limits cross-study comparability and highlights the need for standardized accuracy benchmarks to ensure reliable interpretation of sensor performance in environmental monitoring contexts.
Figure 10 presents the relationship between calibration practices and deployment environments in studies utilizing IoT sensors for biological monitoring in aquatic ecosystems. The diagram reveals that periodic calibration is the most frequently reported practice, especially in field deployments, highlighting the necessity of regular maintenance in variable and potentially harsh environmental conditions. Lab-based deployments also show a strong association with both manual and periodic calibration, aligning with the controlled nature of experimental validation setups. A considerable proportion of studies are categorized under “Not Specified” for calibration needs, particularly in field deployments. This suggests either a lack of detailed methodological reporting or the use of factory-calibrated or autonomous calibration systems. Such omissions underscore a potential risk of bias and point to the need for greater transparency in documenting calibration protocols.
Interestingly, manual and occasional calibration practices appear minimally across all environments, while environments like industrial, simulation, and floating platforms show isolated calibration strategies, reflecting context-specific sensor requirements.
Figure 11 illustrates the distribution of water quality parameters targeted by IoT sensor applications in aquatic ecosystems, categorizing them into physical, chemical, biological, and other groups. The diagram reveals a strong emphasis on physical parameters, with pH (19.67%), temperature (18.03%), and turbidity (9.84%) being the most frequently monitored indicators. These parameters are essential for understanding baseline water conditions and detecting abrupt environmental changes. Chemical parameters such as conductivity (10.81%), COD (3.28%), and BOD (6.56%) also appear prominently, reflecting the relevance of chemical profiling in assessing pollution levels and ecosystem stress. Less frequently reported but still notable are heavy metals, nitrate concentrations, and glyphosate in water, indicating occasional focus on site-specific contaminant monitoring. Biological indicators—including dissolved oxygen (DO) (9.84%), chlorophyll-a, algal biomass, proteins, and physiological parameters—are comparatively underrepresented. This suggests a gap in IoT-based biological monitoring despite its critical role in evaluating ecosystem health and trophic dynamics.
The biological category only accounts for a small portion of studies, with DO and chlorophyll-a being the primary targets, used to infer eutrophication and microbial activity. A small proportion of parameters fall under the “Other” or “Various” classification, where sensors were configured to measure multiple or undefined parameters simultaneously. The inclusion of humidity, ECG signals, and microplastics reflects the evolving scope of environmental sensing but also underscores inconsistencies in parameter classification across studies.
Figure 12 illustrates the categorized distribution of deployment environments used in IoT-based monitoring of aquatic ecosystems. The data reveal that the majority of studies (65.58%) implement sensors in real-world field applications, emphasizing the importance of capturing real-time, in-situ data in dynamic aquatic conditions. These deployments typically occur in natural water bodies such as rivers, lakes, and estuaries, offering a realistic assessment of ecosystem variability and stressors. The second most common category is platform-based monitoring (24.59%), which includes deployments on floating platforms or buoys. These platforms allow for fixed-location monitoring in semi-controlled aquatic zones, often used for continuous data collection in areas prone to water level fluctuation or pollution events.
Controlled testing environments such as laboratories also feature significantly, categorized under controlled testing, offering 21.31% of the reviewed deployment cases. These environments are critical for calibrating sensor accuracy, validating functionality, and conducting repeatable experiments under stable conditions before field deployment. Other deployment environments include industrial settings (e.g., wastewater treatment plants), virtual/cloud-based setups, simulation environments, and distributed monitoring configurations like multi-point networks, though these are less frequently reported. Notably, a small proportion of studies (1.64%) are marked as unspecified, indicating a lack of clarity in reporting, which can hinder reproducibility and evaluation.
3.4. Results of Individual Studies
Figure 13 illustrates the relationship between the types of IoT sensors and the specific water quality parameters they are used to monitor in aquatic ecosystems. The Sankey diagram highlights the diversity in sensor technologies and their respective measurement capabilities, underscoring the multi-parametric nature of IoT-enabled monitoring systems. Among the most widely adopted sensor types are electrochemical and conductivity probes, which are primarily utilized for measuring parameters such as pH, dissolved oxygen (DO), conductivity, and total dissolved solids (TDS). These sensor types are favored for their affordability, portability, and adaptability across various aquatic conditions. Optical sensors also show a notable presence, particularly in detecting parameters like temperature, turbidity, and chlorophyll-a, making them essential for real-time monitoring of biological activity and light-sensitive variables. Additionally, ISE (ion-selective electrodes) are leveraged to detect specific ionic compounds, including nitrate and ammonia, although their application is more focused and less frequent.
Emerging technologies, such as triboelectric nanosensors and ultrasonic sensors, appear in fewer studies but are applied for specialized functions, such as remote flow detection or sediment analysis. Biometric and electrocardiogram sensors, though unconventional in aquatic contexts, are occasionally used in bio-logging or physiological monitoring of aquatic organisms in experimental setups. The results reveals that while some sensors are designed for single-parameter detection, others are integrated into multi-sensor platforms, offering broader analytical coverage and improved resolution. The interconnected flow between sensor types and measured parameters demonstrates the interdisciplinary nature of aquatic monitoring, combining chemistry, biology, and environmental engineering.
3.5. Results of Synthesis
3.5.1. Characteristics and Risk of Bias Among Contributing Studies
Figure 14 provides a detailed breakdown of the microcontroller platforms used in IoT-based aquatic monitoring systems, along with their corresponding communication protocols and platform categories. The Sankey diagram visualizes how studies connect different categories of microcontroller applications—ranging from DIY/low-cost setups to advanced edge computing and autonomous platforms—with their preferred sensor interfacing methods. Arduino, a widely adopted low-cost and open-source platform, is most frequently linked to digital and I2C protocols, reflecting its flexibility and ease of integration with various environmental sensors. Similarly, ESP32, categorized as an Advanced IoT Platform, dominates digital communications due to its built-in wireless capabilities and powerful dual-core processor, which make it suitable for real-time environmental data acquisition.
ESP8266-based boards, under Budget IoT Modules, appear in fewer studies but still contribute to digital and I2C applications, primarily for simplified data logging and wireless transmission in resource-constrained deployments. Raspberry Pi, aligned with Edge Computing, connects exclusively with digital protocols, signifying its role in processing-intensive tasks such as AI integration, local data analytics, and visualization.
Platforms marked as Unspecified or categorized under General/Multiple Systems include various microcontrollers and custom configurations, often employed in hybrid systems or experimental prototypes. A small number of autonomous platforms (e.g., USVs) demonstrate compatibility with I2C for onboard real-time sensing during mobile deployments. The results also highlights that analog interfaces are less commonly reported, though still present, particularly in older or simplified sensor applications. Notably, a percentage of studies fall under the “Unspecified” category, suggesting a lack of transparency in reporting specific protocols or microcontroller configurations—an area that future studies should address for better reproducibility and system benchmarking.
In essence, Figure 14 captures the current landscape of microcontroller usage in aquatic IoT applications, revealing the dominant role of ESP32 and Arduino across a spectrum of deployments. The choice of microcontroller and communication protocol directly influences system performance, energy consumption, and integration potential—key considerations for scalable and robust water quality monitoring systems.
Figure 15 presents an overview of sensor manufacturers featured in the reviewed studies, categorized by the type of supplier or system origin. The Sankey diagram maps the relationship between broad manufacturer types—such as standard brands, major manufacturers, custom/prototypes, and various/unspecified vendors—and their specific representatives across the literature. DFRobot emerges as the most frequently mentioned manufacturer, accounting for 21.31% of the studies. This dominance is due to DFRobot’s broad range of affordable, modular, and Arduino-compatible sensors widely used in academic and experimental settings. Atlas Scientific follows with 9.84%, reflecting its reputation for high-precision water quality sensors used in both lab and field conditions.
Texas Instruments and Decagon Devices are also noted contributors, particularly within studies emphasizing robust design and environmental durability. Thermo Scientific and STMicroelectronics appear in more specialized contexts, often tied to professional-grade deployments. A variety of standard brands and major manufacturers contribute to the diversity of sensor sources across the studies.
A notable proportion of studies (44.27%) fall under the “Various manufacturers” category. This includes generic or unbranded sensors, integrations of multiple suppliers, or insufficiently documented sensor origins. This broad grouping reflects the fragmented nature of the IoT sensor market and highlights the accessibility of components for DIY and low-cost monitoring setups. Meanwhile, custom-built prototypes and unique virtual sensors—software-based estimation systems—are represented in a small number of studies, demonstrating innovation in system design. However, the relatively low frequency of proprietary platforms underscores the field’s current reliance on modular and interoperable hardware over bespoke commercial systems.
Figure 16 maps sensor types against their associated cost categories, offering a comparative overview of affordability trends across the reviewed studies. The sensors are grouped into four general cost classes: low-cost, mid-range, unspecified, and high-cost. Low-cost sensors, such as basic optical, biometric, and chromatography devices, are most commonly used in DIY or academic setups where affordability and accessibility are key drivers. These options, while limited in accuracy or environmental resilience, are favored for prototyping and short-term deployments. Mid-range sensors, including electrochemical, conductivity probes, and ISEs, dominate the literature. They provide a balance between affordability and performance, often appearing in studies aiming for broader field application without incurring high costs. Their consistent use across various parameters suggests they are a practical standard in the field of aquatic IoT monitoring.
High-cost sensors, though less frequently reported, are associated with advanced platforms—typically involving high-resolution DO, temperature, or multi-parameter systems with embedded analytics. These are common in commercial or government-funded environmental monitoring programs that prioritize precision and durability over cost. A significant number of studies fall under the unspecified cost category, where either the sensor price was not reported or the sensors used were part of integrated platforms making cost isolation difficult. This gap in reporting raises concerns about transparency and repeatability, emphasizing the importance of cost clarity for guiding future research and real-world implementation.
3.5.2. Results of Statistical Syntheses
No formal meta-analysis was conducted due to the heterogeneity of methodologies, outcome measures, and reporting formats among the reviewed studies. Consequently, descriptive statistical techniques were employed to synthesize the key characteristics. For instance, based on microcontroller usage (Figure 14), the ESP32 platform emerged as the most commonly used microcontroller, appearing in 37.7% of studies. It was followed closely by Arduino at 34.43%, with other platforms like Raspberry Pi (8.2%), ESP8266-based boards (3.28%), and miscellaneous platforms comprising smaller shares. This distribution highlights the widespread preference for ESP32 and Arduino due to their affordability, wireless capability, and ease of integration in aquatic IoT applications. Similarly, in the analysis of sensor types (Figure 13), electrochemical sensors were the most used (19.67%), followed by optical (18.03%) and pH sensors (13.11%), emphasizing the reliance on these technologies for detecting key biological indicators such as dissolved oxygen and turbidity. Statistical heterogeneity metrics (e.g., I² or Tau²) were not applicable due to the non-quantitative nature of the synthesis. Nonetheless, directional trends favored microcontrollers and sensors enabling real-time, field-deployable, and wirelessly connected monitoring systems.
3.5.3. Investigation of Heterogeneity
The reviewed studies revealed notable variation in microcontroller use based on project requirements. ESP32 platforms were deployed in 23 studies, appreciated for their built-in Wi-Fi, Bluetooth, and low power features—ideal for field monitoring. Arduino, used in 21 studies, was preferred for its simplicity and wide sensor compatibility, particularly in prototyping and academic contexts. Raspberry Pi, featured in 5 studies, supported applications demanding higher data processing capabilities. This variation reflects how deployment context, data processing needs, and system complexity drive microcontroller selection. For example, ESP32’s dominance in field applications reflects its wireless communication capabilities, while Arduino’s wide adoption aligns with educational and low-cost development settings. Understanding these distinctions helps inform future design choices and platform selection in resource-constrained or application-specific environments.
3.5.4. Sensitivity Analyses Results
Sensitivity analyses were carried out conceptually by testing the influence of studies with incomplete reporting. For instance, studies that did not specify the microcontroller platform (4.92%) or the deployment environment (8.2%) were excluded in iterative assessments. Results showed that their exclusion did not significantly affect observed patterns. Similarly, studies grouped under “various microcontrollers” or “various sensors” were evaluated. While these introduced minor ambiguity, core trends—such as the prevalence of ESP32 and electrochemical sensors—remained intact. This supports the robustness of the descriptive synthesis and confirms that the key findings are not skewed by non-specific reporting.
3.6. Reporting Biases
Reporting bias was present in a moderate number of studies, largely due to missing methodological details. Around 8% of studies omitted their deployment environment, and 4.92% failed to specify the microcontroller platform. Additionally, gaps were noted in sensor calibration methods, manufacturer names, and data interface protocols (e.g., I2C, analog, digital). Although these omissions did not materially alter the descriptive results (as confirmed through sensitivity analysis), they undermine reproducibility and transparency. The absence of calibration information is particularly problematic, as it affects data reliability, especially in dynamic environments where sensor drift and fouling are known challenges. To mitigate this, future studies should adhere to standardized reporting frameworks to enhance methodological clarity and support comparative synthesis.
3.7. Certainty of Evidence
To evaluate the certainty and reliability of the reviewed evidence, subgroup assessments were conducted across three dimensions:
- Ecosystem type (e.g., rivers, lakes, coastal zones)
- Geographic region (based on country of origin)
- Sensor integration strategies (e.g., cloud-based analytics, real-time transmission)
These subgroups helped contextualize the findings, revealing that certain regions and ecosystem types are overrepresented (e.g., temperate freshwater systems), while others (e.g., remote or tropical aquatic zones) remain underexplored. Additionally, studies with cloud or edge analytics integration generally scored higher in data reliability and deployment robustness. This highlights a growing trend toward real-time, adaptive environmental sensing in the field. Collectively, these analyses reinforce the value of IoT sensors in aquatic monitoring while underscoring the importance of reporting transparency, geographic inclusivity, and standardized integration practices for strengthening the evidence base.
5. Conclusion
This systematic review synthesized evidence from 61 peer-reviewed studies published between 2015 and 2025, sourced from Google Scholar, Scopus, and Web of Science, to assess the use of IoT sensor technologies in aquatic ecosystem monitoring. The results underscore a growing research focus on real-time, sensor-based water quality monitoring, with a notable increase in publications peaking in 2023. IoT sensors have shown considerable promise in improving the detection of key biological indicators such as pH, dissolved oxygen, turbidity, temperature, and chlorophyll-a, with an estimated 20–30% improvement in detection accuracy compared to manual methods. Deployment efficiency also improved, with a reported 40% reduction in deployment time in field applications. Electrochemical sensors (19.67%) and optical sensors (18.03%) were the most commonly used, offering reliable performance across a range of aquatic conditions. These were predominantly integrated with ESP32 (37.7%) and Arduino (34.43%) microcontroller platforms, valued for their low cost, wireless capabilities, and ease of integration—particularly in resource-constrained environments. The combination of sensor technology and real-time data acquisition enables faster responses to environmental changes, early detection of pollution, and data-driven ecosystem management. Despite these benefits, several limitations remain. Sensor performance often declines in challenging environments such as turbid or saline waters. High maintenance requirements, power supply limitations, an inconsistent calibration practices continue to hinder widespread implementation. Furthermore, many studies failed to report key methodological details, including calibration procedures and communication protocols, which limits reproducibility and weakens the evidence base.
Notably, ecosystems such as estuaries and remote or tropical water bodies remain underrepresented in current literature, and few studies integrate advanced data processing techniques like machine learning. Addressing these gaps will require targeted research that emphasizes sensor durability, energy efficiency, standardized calibration, and robust connectivity with cloud or edge analytics platforms.
Appendix A

Table A1.
Comprehensive Overview of IoT-Based Water Monitoring Systems and Their Role in Assessing Biological Impacts.
Table A1.
Comprehensive Overview of IoT-Based Water Monitoring Systems and Their Role in Assessing Biological Impacts.
| Ref | Year of Publication | Sensor Type (ISE, Optical, DO, pH, etc.) | Target Parameter Measured | Interface Type (Analog, Digital, I2C, Modbus) | Microcontroller Compatibility | Deployment Environment (Lab, Field, Submersible, etc.) | Known Challenges (Fouling, Drift, Interference) |
|---|---|---|---|---|---|---|---|
| (Perumal et al., 2015) | 2015 | Ultrasonic | DO | Arduino | Field | N/A | |
| (Koo et al., 2015) | 2015 | pH | pH | N/A | Various microcontrollers | Field | N/A |
| (Sheng et al., 2015) | 2015 | Various | Temperature | Digital | N/A | Industrial environments | Energy constraints |
| (Popović et al., 2016) | 2016 | Various | Humidity | Digital | Various microcontrollers | Private cloud environment | Accuracy |
| (Habibzadeh et al., 2017) | 2017 | Temperature | Temperature | Digital | ESP32 | Field | High Power Ussage |
| (Bragg, 2017) | 2017 | Temperature | Temperature | Digital | ESP32 | Field | High Power Ussage |
| (Wu et al., 2017) | 2017 | Various | COD | N/A | ESP32 | N/A | N/A |
| (Yadav et al., 2017) | 2017 | pH | pH | N/A | ESP32 | Lab | Drift |
| (Saha et al., 2017) | 2017 | Electrocardiogram | ECG signals | Analog | Various microcontrollers | Lab | Reliability |
| (Singh & Jasuja, 2017) | 2018 | Biometric | Physiological parameters | Digital | Arduino | Field | Accuracy |
| (Bárta et al., 2018) | 2018 | Electrochemical | pH | Digital | Arduino | Field | Humic buildup |
| (Pearce, 2018) | 2018 | pH | COD | Digital | Arduino | Field | Drift |
| (Pattanayak et al., 2020) | 2018 | pH | Temperature | Digital | Arduino | Lab | Fouling |
| (Kumar & Aravindh, 2020) | 2018 | Temperature | Temperature | Digital | ESP32 | Simulation environment | N/A |
| (Cennamo et al., 2020) | 2018 | Electrochemical | Turbidity | DIgital | Arduino | Field | Environmental Intereferences |
| (Memon et al., 2020) | 2018 | Optical | Microplastics | DIgital | Raspberry Pi | Field | Sensor Drift |
| (Gambín et al., 2021) | 2019 | Turbidity | Algal biomass collection | Digital | ESP32 | Field | Limiations |
| (Trevathan et al., 2021) | 2020 | Conductivity probe | Heavy metals | Analog | ESP32 | Field | Interference |
| (Hong et al., 2021) | 2020 | Chromatography | Nitrate Concentrations | Digital | ESP32 | Field | High Power Ussage |
| (Wang et al., 2021) | 2020 | Electrochemical | Chlorophyll-a | Digital | ESP32 | Field | Humic buildup |
| (Chen et al., 2022) | 2020 | Electrochemical | pH | Digital | Arduino | Field | Reliability |
| (Okpara et al., 2022) | 2020 | Temperature | pH | Digital | Arduino | Field | Fouling |
| (Mezni et al., 2022) | 2020 | Optical | Proteins | Digital | Arduino | Lab | Humic buildup |
| (Tsai et al., 2022) | 2020 | pH | pH | Digital | Arduino | Lab | High Power Ussage |
| (Singh et al., 2022) | 2021 | Electrochemical | pH | Digital | USV | Field | Environmental Interferences |
| (Anani et al., 2022) | 2021 | pH | pH | Digital | ESP32 | Lab | Drift |
| (Swartz et al., 2023) | 2021 | Turbidity | Turbidity | Digital | ESP32 | Field | Reliability |
| (Islam et al., 2023) | 2021 | pH | pH | Analog | Arduino | Field | Accuracy |
| (Zukeram et al., 2023) | 2021 | Electrochemical | pH | DIgital | Arduino | Field | manual data collection |
| (Ighalo et al., 2021) | 2022 | Turbidity | TDS | Analog | ESP8266-based | Field | Sensor limitation |
| (Dhinakaran et al., 2023) | 2022 | Optical | pH | Digital | Arduino | Field | Power limitations |
| (Abuzeid et al., 2023) | 2022 | ISE | Temperature | Analog | Arduino | Lab | Power limitations |
| (Sugiharto et al., 2024) | 2022 | pH | pH | Analog | ESP32 | Field | Low bandwidth |
| (Monea, 2024) | 2022 | Temperature | Temperature | Analog | Arduino | Field | Accuracy |
| (Kim et al., 2024) | 2022 | ISE | DO | Digital | ESP32 | Lab | Drift |
| (Aira et al., 2022) | 2022 | DO | DO | 12C | ESP32 | Lab | Fouling |
| (Olanubi et al., 2024) | 2023 | Electrochemical | Temperature | Digital | Arduino | Multi point | Sensor Drift |
| (Izah, 2025) | 2023 | Electrochemical | Conductivity | Digital | Arduino | Field | Environmnetal Interferences |
| (Das et al., 2025) | 2023 | Electrochemical | DO | Digital | ESP32 | Field | Sensor Drift |
| (Arepalli & Naik, 2025) | 2023 | Optical | BOD | N/A | N/A | Field | Interference |
| (Anupama et al., 2020) | 2023 | Optical | pH | Digital | ESP32 | Field | Sensor Drift |
| (Krishnan & Giwa, 2025) | 2023 | DO | DO | DIgital | Raspberry Pi | Field | Humic buildup |
| (Dubey et al., 2025) | 2023 | DO | Conductivity | I2C | Arduino | Field | Fouling |
| (Vasudevan & Baskaran, 2021) | 2023 | Optical | Turbidity | Digital | Arduino | Field | Interference |
| (Zulkarnain & Pramudita, 2022) | 2023 | Ultrasonic | Humidity | Analog | ESP32 | Field | Instability |
| (Lal et al., 2024) | 2023 | electrochemical | pH | Digital | Raspberry Pi | Lab | Fouling |
| (Gallemit, 2023) | 2023 | Optical | Temperature | Analog | Arduino | Field | Sensor Drift |
| (Chen et al., 2023) | 2024 | TDS | N/A | DIgital | ESP8266-based | Floating Platform | Sensor Drift |
| (Kumar et al., 2024) | 2024 | Optical | DO | Digital | ESP32 | Field | Environmental Intereferences |
| (Hemdan et al., 2023) | 2024 | ISE | pH | Digital | ESP32 | Lab | Interference |
| (Singh et al., 2016) | 2024 | DO | BOD | N/A | N/A | Field | Interference |
| (Chaczko et al., 2018) | 2024 | Optical | BOD | I2C | Raspberry Pi | Field | Humic buildup |
| (Sugiharto et al., 2023) | 2024 | Optical | Glyphosate in water | Digital | ESP32 | Lab | Sensor alignment |
| (Pandey et al., 2024) | 2024 | Optical | pH | Analog | ESP32 | Lab | Instability |
| (Hong et al., 2021) | 2024 | Electrochemical | Temperature | Digital | ESP32 | Field | integration complexities |
| (Perumal et al., 2015) | 2025 | Temperature | Temperature | N/A | Various microcontrollers | Field | Privacy |
| (Koo et al., 2015) | 2025 | Electrochemical | BOD | Digital | Various microcontrollers | Field | Drift |
| (Sheng et al., 2015) | 2025 | Turbidity | Turbidity | N/A | Various microcontrollers | Field | Drift |
| (Popović et al., 2016) | 2025 | Turbidity | Turbidity | Digital | Raspberry Pi | Field | Limitation |
| (Habibzadeh et al., 2017) | 2025 | Triboelectric Nanosensors | Various parameters | Digital | ESP32 | Lab | Humic buildup |
| (Bragg, 2017) | 2025 | Turbidity | Turbidity | Digital | Arduino | Lab | Noise |
References
- Manoj M., Dhilip Kumar, V., Arif, M., Bulai, E. R., Bulai, P., & Geman, O. (2022). State of the art techniques for water quality monitoring systems for fish ponds using iot and underwater sensors: A review. Sensors, 22(6), 2088. https://www.mdpi.com/1424-8220/22/6/2088. [CrossRef]
- Ya’acob, N., Dzulkefli, N. N. S. N., Yusof, A. L., Kassim, M., Naim, N. F., & Aris, S. S. M. (2021, August). Water quality monitoring system for fisheries using internet of things (iot). In IOP Conference Series: Materials Science and Engineering (Vol. 1176, No. 1, p. 012016). IOP Publishing. https://iopscience.iop.org/article/10.1088/1757-899X/1176/1/012016/meta.
- Lee, K. H., Noh, J., & Khim, J. S. (2020). The Blue Economy and the United Nations’ sustainable development goals: Challenges and opportunities. Environment international, 137, 105528. https://www.sciencedirect.com/science/article/pii/S0160412019338255.
- Nellemann, C., & Corcoran, E. (Eds.). (2010). Dead planet, living planet: Biodiversity and ecosystem restoration for sustainable development: A rapid response assessment. UNEP/Earthprint. https://books.google.com/books?hl=en&lr=&id=irLBX3nBEQC&oi=fnd&pg=PA97&dq=State+of+the+world%27s+aquatic+ecosystems:+Urgent+interventions+for+sustainability&ots=Vdh99AHzi&sig=LnvAIZGIZypaT_8Ra38K09S9dwA.
- Jan, F., Min-Allah, N., & Düştegör, D. (2021). Iot based smart water quality monitoring: Recent techniques, trends and challenges for domestic applications. Water, 13(13), 1729. https://www.mdpi.com/2073-4441/13/13/1729. [CrossRef]
- Zulkifli, C. Z., Garfan, S., Talal, M., Alamoodi, A. H., Alamleh, A., Ahmaro, I. Y.,... & Chiang, H. H. (2022). IoT-based water monitoring systems: a systematic review. Water, 14(22), 3621. https://www.mdpi.com/2073-4441/14/22/3621.
- Huang, Y. P., & Khabusi, S. P. (2025). Artificial Intelligence of Things (AIoT) Advances in Aquaculture: A Review. Processes, 13(1), 73. https://www.mdpi.com/2227-9717/13/1/73.
- Kaur, R., Mandal, A., & Pandey, A. (2022). Novel approaches in detection and monitoring of aquatic pollution: a review. Journal of Experimental Zoology India, 25(1). https://www.researchgate.net/profile/Abhed-Pandey/publication/358233738_NOVEL_APPROACHES_IN_DETECTION_AND_MONITORING_OF_AQUATIC_POLLUTION_A_REVIEW/links/6444c4b78ac1946c7a450b86/NOVEL-APPROACHES-IN-DETECTION-AND-MONITORING-OF-AQUATIC-POLLUTION-A-REVIEW.pdf.
- Gholizadeh, M. H., Melesse, A. M., & Reddi, L. (2016). A comprehensive review on water quality parameters estimation using remote sensing techniques. Sensors, 16(8), 1298. https://www.mdpi.com/1424-8220/16/8/1298.
- Dhinakaran, D., Gopalakrishnan, S., Manigandan, M. D., & Anish, T. P. (2023). IoT-Based Environmental Control System for Fish Farms with Sensor Integration and Machine Learning Decision Support. arXiv preprint arXiv:2311.04258. https://arxiv.org/abs/2311.04258.
- Zainurin, S. N., Wan Ismail, W. Z., Mahamud, S. N. I., Ismail, I., Jamaludin, J., Ariffin, K. N. Z., & Wan Ahmad Kamil, W. M. (2022). Advancements in monitoring water quality based on various sensing methods: a systematic review. International Journal of Environmental Research and Public Health, 19(21), 14080. https://www.mdpi.com/1660-4601/19/21/14080. [CrossRef]
- Essamlali, I., Nhaila, H., & El Khaili, M. (2024). Advances in machine learning and IoT for water quality monitoring: A comprehensive review. Heliyon. https://www.cell.com/heliyon/fulltext/S2405-8440(24)03951-3.
- Singh, M., & Ahmed, S. (2021). IoT based smart water management systems: A systematic review. Materials Today: Proceedings, 46, 5211-5218. https://www.sciencedirect.com/science/article/pii/S2214785320364701.
- Sohrabi, H., Hemmati, A., Majidi, M. R., Eyvazi, S., Jahanban-Esfahlan, A., Baradaran, B.,... & de la Guardia, M. (2021). Recent advances on portable sensing and biosensing assays applied for detection of main chemical and biological pollutant agents in water samples: A critical review. TrAC Trends in Analytical Chemistry, 143, 116344. https://www.sciencedirect.com/science/article/pii/S0165993621001679.
- Carriazo-Regino, Y., Baena-Navarro, R., Torres-Hoyos, F., Vergara-Villadiego, J., & Roa-Prada, S. (2022). IoT-based drinking water quality measurement: systematic. Indonesian Journal of Electrical Engineering and Computer Science, 28(1), 405-418. https://www.academia.edu/download/97367402/16718.pdf.
- Ubina, N. A., & Cheng, S. C. (2022). A review of unmanned system technologies with its application to aquaculture farm monitoring and management. Drones, 6(1), 12. https://www.mdpi.com/2504-446X/6/1/12.
- Mandal, A., & Ghosh, A. R. (2024). Role of artificial intelligence (AI) in fish growth and health status monitoring: a review on sustainable aquaculture. Aquaculture International, 32(3), 2791-2820. https://link.springer.com/article/10.1007/s10499-023-01297-z. [CrossRef]
- Gladju, J., Kamalam, B. S., & Kanagaraj, A. (2022). Applications of data mining and machine learning framework in aquaculture and fisheries: A review. Smart Agricultural Technology, 2, 100061. https://www.sciencedirect.com/science/article/pii/S2772375522000260.
- Prapti, D. R., Mohamed Shariff, A. R., Che Man, H., Ramli, N. M., Perumal, T., & Shariff, M. (2022). Internet of Things (IoT)-based aquaculture: An overview of IoT application on water quality monitoring. Reviews in Aquaculture, 14(2), 979-992. https://onlinelibrary.wiley.com/doi/abs/10.1111/raq.12637.
- Mustapha, U. F., Alhassan, A. W., Jiang, D. N., & Li, G. L. (2021). Sustainable aquaculture development: a review on the roles of cloud computing, internet of things and artificial intelligence (CIA). Reviews in Aquaculture, 13(4), 2076-2091. https://onlinelibrary.wiley.com/doi/abs/10.1111/jwas.13107.
- Perumal, T., Sulaiman, M. N., & Leong, C. Y. (2015, October). Internet of Things (IoT) enabled water monitoring system. In 2015 IEEE 4th Global Conference on Consumer Electronics (GCCE) (pp. 86-87). IEEE. [CrossRef]
- Koo, D., Piratla, K., & Matthews, C. J. (2015). Towards sustainable water supply: schematic development of big data collection using internet of things (IoT). Procedia engineering, 118, 489-497. [CrossRef]
- Sheng, Z., Mahapatra, C., Zhu, C., & Leung, V. C. (2015). Recent advances in industrial wireless sensor networks toward efficient management in IoT. IEEE access, 3, 622-637. [CrossRef]
- Popović, T., Radonjić, M., Zečević, Ž., & Krstajić, B. (2016). An IoT cloud solution based on open source tools. In XXI International Scientific-Professional Conference Information Technology. https://shorturl.at/1373w.
- Habibzadeh, H., Qin, Z., Soyata, T., & Kantarci, B. (2017). Large-scale distributed dedicated-and non-dedicated smart city sensing systems. IEEE Sensors Journal, 17(23), 7649-7658. [CrossRef]
- Bragg, G. M. (2017). Standards-based Internet of Things sub-GHz environmental sensor networks (Doctoral dissertation, University of Southampton). http://eprints.soton.ac.uk/id/eprint/415864.
- Wu, F., Rudiger, C., & Yuce, M. R. (2017, November). Design and field test of an autonomous IoT WSN platform for environmental monitoring. In 2017 27th International Telecommunication Networks and Applications Conference (ITNAC) (pp. 1-6). IEEE. [CrossRef]
- Yadav, J., Bhatia, A., Sangeeta, E. J., & Goyal, N. (2017). Internet of Things (IOT): Confronts and Applications. International journal for Research in Applied Science &Engineering Technology, 5(8), 1-6. https://shorturl.at/kHXpY.
- Saha, H. N., Auddy, S., Pal, S., Kumar, S., Jasu, S., Singh, R.,... & Maity, A. (2017, August). Internet of Things (IoT) on bio-technology. In 2017 8th Annual Industrial Automation and Electromechanical Engineering Conference (IEMECON) (pp. 364-369). IEEE. [CrossRef]
- Singh, P., & Jasuja, A. (2017, May). IoT based low-cost distant patient ECG monitoring system. In 2017 international conference on computing, communication and automation (ICCCA) (pp. 1330-1334). IEEE. [CrossRef]
- Bárta, A., Souček, P., Bozhynov, V., Urbanová, P., & Bekkozhayeova, D. (2018). Trends in online biomonitoring. In Bioinformatics and Biomedical Engineering: 6th International Work-Conference, IWBBIO 2018, Granada, Spain, April 25–27, 2018, Proceedings, Part I 6 (pp. 3-14). Springer International Publishing. https://link.springer.com/chapter/10.1007/978-3-319-78723-7_1.
- Pearce, R. H. (2018). Do-it-yourself”: evaluating the potential of Arduino technology in monitoring water quality. Unpublished Bachelor’s dissertation. doi, 10. https://www.researchgate.net/profile/Reagan-Pearce-2/publication/366299404_’Do-it-yourself’_evaluating_the_potential_of_Arduino_technology_in_monitoring_water_quality/links/639b3597095a6a777430641c/Do-it-yourself-evaluating-the-potential-of-Arduino-technology-in-monitoring-water-quality.pdf.
- Pattanayak, A. S., Pattnaik, B. S., Udgata, S. K., & Panda, A. K. (2020). Development of chemical oxygen on demand (COD) soft sensor using edge intelligence. IEEE Sensors Journal, 20(24), 14892-14902. https://shorturl.at/CDARm. [CrossRef]
- Kumar, M. A., & Aravindh, G. (2020, December). An efficient aquaculture monitoring automatic system for real time applications. In 2020 3rd International Conference on Intelligent Sustainable Systems (ICISS) (pp. 150-153). IEEE.https://www.scopus.com/record/display.uri?eid=2-s2.0-85100826603&origin=resultslist&sort=plf-f&src=s&sot=b&sdt=b&cluster=scopubyr%2C%222018%22%2Ct%2C%222019%22%2Ct%2C%222020%22%2Ct&s=%28TITLE-ABS-KEY%28water+AND+quality%29+AND+TITLE-ABS-KEY%28biological%29+AND+TITLE-ABS-KEY%28IOT%29%29&sessionSearchId=208eb5eb8e2060fb88fb6c62fca4a168&relpos=1.
- Cennamo, N., Arcadio, F., Capasso, F., Perri, C., D’Agostino, G., Porto, G.,... & Zeni, L. (2020). Toward smart selective sensors exploiting a novel approach to connect optical fiber biosensors in internet. IEEE Transactions on Instrumentation and Measurement, 69(10), 8009-8019. https://www.scopus.com/record/display.uri?eid=2-s2.0-85100826603&origin=resultslist&sort=plf-f&src=s&sot=b&sdt=b&cluster=scopubyr%2C%222018%22%2Ct%2C%222019%22%2Ct%2C%222020%22%2Ct&s=%28TITLE-ABS-KEY%28water+AND+quality%29+AND+TITLE-ABS-KEY%28biological%29+AND+TITLE-ABS-KEY%28IOT%29%29&sessionSearchId=208eb5eb8e2060fb88fb6c62fca4a168&relpos=1.
- Memon, A. R., Memon, S. K., Memon, A. A., & Memon, T. D. (2020, January). IoT based water quality monitoring system for safe drinking water in Pakistan. In 2020 3rd International Conference on Computing, Mathematics and Engineering Technologies (iCoMET) (pp. 1-7). https://shorturl.at/MsfG5.
- Chabalala, K., Boyana, S., Kolisi, L., Thango, B., & Lerato, M. (2024). Digital technolo-gies and channels for competitive advantage in SMEs: A systematic review. Available at SSRN 4977280.
- Gambín, Á. F., Angelats, E., González, J. S., Miozzo, M., & Dini, P. (2021). Sustainable marine ecosystems: Deep learning for water quality assessment and forecasting. https://ieeexplore.ieee.org/abstract/document/9525388/.
- Trevathan, J., Schmidtke, S., Read, W., Sharp, T., & Sattar, A. (2021). An IoT general-purpose sensor board for enabling remote aquatic environmental monitoring. Internet of Things, 16, 100429. https://www.sciencedirect.com/science/article/pii/S2542660521000731. [CrossRef]
- Hong, W. J., Shamsuddin, N., Abas, E., Apong, R. A., Masri, Z., Suhaimi, H.,... & Noh, M. N. A. (2021). Water quality monitoring with arduino based sensors. Environments, 8(1), 6. https://www.mdpi.com/2076-3298/8/1/6.
- Wang, Y., Ho, I. W. H., Chen, Y., Wang, Y., & Lin, Y. (2021). Real-time water quality monitoring and estimation in AIoT for freshwater biodiversity conservation. IEEE Internet of Things Journal, 9(16). https://ieeexplore.ieee.org/abstract/document/9425517/. [CrossRef]
- Chen, C. H., Wu, Y. C., Zhang, J. X., & Chen, Y. H. (2022). IoT-based fish farm water quality monitoring system. Sensors, 22(17), 6700. https://www.mdpi.com/1424-8220/22/17/6700.
- Okpara, E. C., Sehularo, B. E., & Wojuola, O. B. (2022). On-line water quality inspection system: the role of the wireless sensory network. Environmental Research Communications, 4(10), 102001.https://iopscience.iop.org/article/10.1088/2515-7620/ac9aa5/meta.
- Mezni, H., Driss, M., Boulila, W., Atitallah, S. B., Sellami, M., & Alharbi, N. (2022). Smartwater: A service-oriented and sensor cloud-based framework for smart monitoring of water environments. Remote Sensing, 14(4), 922. https://www.mdpi.com/2072-4292/14/4/922.
- Tsai, K. L., Chen, L. W., Yang, L. J., Shiu, H. J., & Chen, H. W. (2022). IoT based smart aquaculture system with automatic aerating and water quality monitoring. Journal of Internet Technology, 23(1), 177-184. https://jit.ndhu.edu.tw/article/view/2655/0.
- Singh, M., Sahoo, K. S., & Nayyar, A. (2022). Sustainable iot solution for freshwater aquaculture management. IEEE Sensors Journal, 22(16), 16563-16572. https://ieeexplore.ieee.org/abstract/document/9827934/.
- Anani, O. A., Adetunji, C. O., Olugbemi, O. T., Hefft, D. I., Wilson, N., & Olayinka, A. S. (2022). IoT-based monitoring system for freshwater fish farming: Analysis and design. In AI, Edge and IoT-based Smart Agriculture (pp. 505-515). Academic Press. https://www.sciencedirect.com/science/article/pii/B9780128236949000268.
- Dladla, V. M. N., & Thango, B. A. (2025). Fault Classification in Power Transformers via Dissolved Gas Analysis and Machine Learning Algorithms: A Systematic Literature Review. Applied Sciences, 15(5), 2395. [CrossRef]
- Swartz, C. D., Wolfaardt, G. M., Lourens, C., Archer, E., Truter, C., Bröcker, L., & Klopper, K. (2023). REAL-TIME SENSING AS ALERT SYSTEM FOR SUBSTANCES OF CONCERN. https://www.wrc.org.za/wp-content/uploads/mdocs/3103%20final.pdf.
- Islam, M. M., Kashem, M. A., Alyami, S. A., & Moni, M. A. (2023). Monitoring water quality metrics of ponds with IoT sensors and machine learning to predict fish species survival. Microprocessors and microsystems, 102, 104930. https://www.sciencedirect.com/science/article/abs/pii/S0141933123001746.
- Zukeram, E. S. J., Provensi, L. L., Oliveira, M. V. D., Ruiz, L. B., Lima, O. C. D. M., & Andrade, C. M. G. (2023). In situ IoT development and application for continuous water monitoring in a lentic ecosystem in South Brazil. Water, 15(13), 2310. https://www.mdpi.com/2073-4441/15/13/2310. [CrossRef]
- Ighalo, J. O., Adeniyi, A. G., & Marques, G. (2021). Internet of things for water quality monitoring and assessment: a comprehensive review. Artificial intelligence for sustainable development: theory, practice and future applications, 245-259. https://www.mdpi.com/1424-8220/23/2/960.
- Dhinakaran, D., Gopalakrishnan, S., Manigandan, M. D., & Anish, T. P. (2023). IoT-Based Environmental Control System for Fish Farms with Sensor Integration and Machine Learning Decision Support. arXiv preprint arXiv:2311.04258. https://arxiv.org/pdf/2311.04258.
- Abuzeid, H. R., Abdelaal, A. F., Elsharkawy, S., & Ali, G. A. (2023). Basic principles and applications of biological sensors technology. In Handbook of Nanosensors: Materials and Technological Applications (pp. 1-45). Cham: Springer Nature Switzerland. https://shorturl.at/dDklV.
- Sugiharto, W. H., Susanto, H., & Prasetijo, A. B. (2024). Selecting IoT-Enabled Water Quality Index Parameters for Smart Environmental Management. Instrumentation, Mesures, Métrologies, 23(4). https://shorturl.at/RqBJs.
- MONEA, E. V. B. Monitoring of surface water quality in the Mureș River Basin. https://cdn.uav.ro/documente/Universitate/Academic/Doctorat/Sustinere/2024/Monea-Blidar/Rezumat-eng-Monea-Elena-Violeta.pdf.
- Kim, E., Nam, S. H., Hwang, T. M., Lee, J., Park, J. B., Shim, I. T.,... & Koo, J. W. (2024). IoT-Based Tryptophan-like Fluorescence Portable Device to Monitor the Indicators for Microbial Quality by E. coli and Biochemical Oxygen Demand (BOD5). Water, 16(23), 3491. https://www.mdpi.com/2073-4441/16/23/3491. [CrossRef]
- Aira, J., Olivares, T., & Delicado, F. M. (2022). SpectroGLY: A low-cost IoT-based ecosystem for the detection of glyphosate residues in waters. IEEE Transactions on Instrumentation and Measurement, 71, 1-10. https://arxiv.org/pdf/2401.16009.
- Olanubi, O. O., Akano, T. T., & Asaolu, O. S. (2024). Design and development of an IoT-based intelligent water quality management system for aquaculture. Journal of Electrical Systems and Information Technology, 11(1), 15. https://nesciences.com/article/1491795/72091/?utm_source=chatgpt.com.
- Kgakatsi, M., Galeboe, O. P., Molelekwa, K. K., & Thango, B. A. (2024). The Impact of Big Data on SME Performance: A Systematic Review. Businesses, 4(4), 632-695. [CrossRef]
- Khanyi, M. B., Xaba, S. N., Mlotshwa, N. A., Thango, B., & Matshaka, L. (2024). A Roadmap to Systematic Review: Evaluating the Role of Data Networks and Application Programming Interfaces in Enhancing Operational Efficiency in Small and Medium Enterprises. Sustainability, 16(23), 10192. [CrossRef]
- Chibueze Izah, S. (2025). Smart Technologies in Environmental Monitoring: Enhancing Real-Time Data for Health Management. In Innovative Approaches in Environmental Health Management: Processes, Technologies, and Strategies for a Sustainable Future (pp. 199-224). Cham: Springer Nature Switzerland. https://link.springer.com/chapter/10.1007/978-3-031-81966-7_8.
- Das, S., Khondakar, K. R., Mazumdar, H., Kaushik, A., & Mishra, Y. K. (2025). AI and IoT: Supported Sixth Generation Sensing for Water Quality Assessment to Empower Sustainable Ecosystems. ACS ES&T Water. [CrossRef]
- Arepalli, P. G., & Naik, K. J. (2025). Water quality classification framework for IoT-enabled aquaculture ponds using deep learning based flexible temporal network model. Earth Science Informatics, 18(2), 351. https://link.springer.com/article/10.1007/s12145-025-01857-2. [CrossRef]
- Anupama, K., Rao, Y. C., & Gurrala, V. K. (2020). A machine learning approach to monitor water quality in aquaculture. International Journal of Performability Engineering, 16(12), 1845. https://shorturl.at/hSxc4.
- Krishnan, S., & Giwa, A. (2025). Advances in real-time water quality monitoring using triboelectric nanosensors. Journal of Materials Chemistry A. https://shorturl.at/gcwJo.
- Dubey, S., Dubey, S., & Raghuwanshi, K. (2025). Unlocking IoT and Machine Learning’s Potential for Water Quality Assessment: An Extensive Analysis and Future Directions. Water Conservation Science and Engineering, 10(1), 18. https://shorturl.at/fSexN.
- Molete, O. B., Mokhele, S. E., Ntombela, S. D., & Thango, B. A. (2025). The Impact of IT Strategic Planning Process on SME Performance: A Systematic Review. Businesses, 5(1), 2. [CrossRef]
- Msane, M. R., Thango, B. A., & Ogudo, K. A. (2024). Condition Monitoring of Electrical Transformers Using the Internet of Things: A Systematic Literature Review. Applied Sciences, 14(21), 9690. [CrossRef]
- Vasudevan, S. K., & Baskaran, B. (2021). An improved real-time water quality monitoring embedded system with IoT on unmanned surface vehicle. Ecological Informatics, 65, 101421. https://www.sciencedirect.com/science/article/pii/S1574954121002120.
- Zulkarnain, G. G., & Pramudita, B. A. (2022, December). Water Pollution Monitoring Systems Several Point Locations Using the Internet of Things. In 2022 IEEE Asia Pacific Conference on Wireless and Mobile (APWiMob) (pp. 1-7). IEEE. https://ieeexplore.ieee.org/abstract/document/10014098.
- Lal, K., Menon, S., Noble, F., & Arif, K. M. (2024). Low-cost IoT based system for lake water quality monitoring. Plos one, 19(3), e0299089. https://journals.plos.org/plosone/article?id=10.1371/journal.pone.0299089.
- Gallemit, A. B. (2023). Water monitoring and analysis system: validating an IoT-enabled prototype towards sustainable aquaculture. Validating an IoT-Enabled Prototype towards Sustainable Aquaculture. https://www.ijams-bbp.net/wp-content/uploads/2023/07/1-IJAMS-JUNE-2023-496-517.pdf.
- Chen, S. L., Chou, H. S., Huang, C. H., Chen, C. Y., Li, L. Y., Huang, C. H.,... & Huang, J. S. (2023). An intelligent water monitoring IoT system for ecological environment and smart cities. Sensors, 23(20), 8540. https://shorturl.at/e1Qsq.
- Kumar, J., Gupta, R., Sharma, S., Chakrabarti, T., Chakrabarti, P., & Margala, M. (2024). IoT-Enabled Advanced Water Quality Monitoring System for Pond Management and Environmental Conservation. IEEE Access. https://ieeexplore.ieee.org/abstract/document/10506512.
- Hemdan, E. E. D., Essa, Y. M., Shouman, M., El-Sayed, A., & Moustafa, A. N. (2023). An efficient IoT based smart water quality monitoring system. Multimedia tools and applications, 82(19), 28827-28851. https://link.springer.com/article/10.1007/s11042-023-14504-z. [CrossRef]
- Singh, S., Kumar, A., Prasad, A., & Bharadwaj, N. (2016). IoT based water quality monitoring system. Proceedings of the IRFIC. https://link.springer.com/article/10.1186/s43067-024-00139-z?utm_source=chatgpt.com.
- Chaczko, Z., Kale, A., Santana-Rodríguez, J. J., & Suárez-Araujo, C. P. (2018, June). Towards an iot based system for detection and monitoring of microplastics in aquatic environments. In 2018 IEEE 22nd International Conference on Intelligent Engineering Systems (INES) (pp. 000057-000062). IEEE. https://www.sciencedirect.com/science/article/abs/pii/S0141933123001746?utm_source=chatgpt.com.
- Thobejane, L. T., & Thango, B. A. (2024). Partial Discharge Source Classification in Power Transformers: A Systematic Literature Review. Applied Sciences, 14(14), 6097. [CrossRef]
- Sugiharto, W. H., Susanto, H., & Prasetijo, A. B. (2023). Real-time water quality assessment via IoT: monitoring pH, TDS, temperature, and turbidity. Ingénierie des Systèmes d’Information, 28(4), 823-831. https://shorturl.at/IjXM8.
- Pandey, V., Mishra, A., Bahuguna, R., Pandey, S., Yamsani, N., & Ahmed, M. M. (2024, May). A Paradigm Shifts in Enhancing Environmental Sustainability: AI and IoT for Smart Water Quality Applications. In 2023 International Conference on Smart Devices (ICSD) (pp. 1-6). IEEE. https://ieeexplore.ieee.org/abstract/document/10751381.
- Ngcobo, K., Bhengu, S., Mudau, A., Thango, B., & Lerato, M. (2024). Enterprise data management: Types, sources, and real-time applications to enhance business performance-a systematic review. Systematic Review September.
- Pingilili, A., Letsie, N., Nzimande, G., Thango, B., & Matshaka, L. (2025). Guiding IT Growth and Sustaining Performance in SMEs Through Enterprise Architecture and Information Management: A Systematic Review. Businesses, 5(2), 17. [CrossRef]
- Hong, W. J., Shamsuddin, N., Abas, E., Apong, R. A., Masri, Z., Suhaimi, H.,... & Noh, M. N. A. (2021). Water quality monitoring with arduino based sensors. Environments, 8(1), 6. https://www.mdpi.com/2076-3298/8/1/6\.
- Thango, B. A., & Obokoh, L. (2024). Techno-Economic Analysis of Hybrid Renewable Energy Systems for Power Interruptions: A Systematic Review. Eng, 5(3), 2108-2156. [CrossRef]
- Rostam, N. A. P., Malim, N. H. A. H., Abdullah, R., Ahmad, A. L., Ooi, B. S., & Chan, D. J. C. (2021). A complete proposed framework for coastal water quality monitoring system with algae predictive model. IEEE access, 9, 108249-108265. https://ieeexplore.ieee.org/abstract/document/9504580/. [CrossRef]
Figure 1.
Bibliometric Analysis of Study Search Keywords: (a) Overlay Visualization. (b) Network Visualization. (c) Density Visualization.
Figure 1.
Bibliometric Analysis of Study Search Keywords: (a) Overlay Visualization. (b) Network Visualization. (c) Density Visualization.
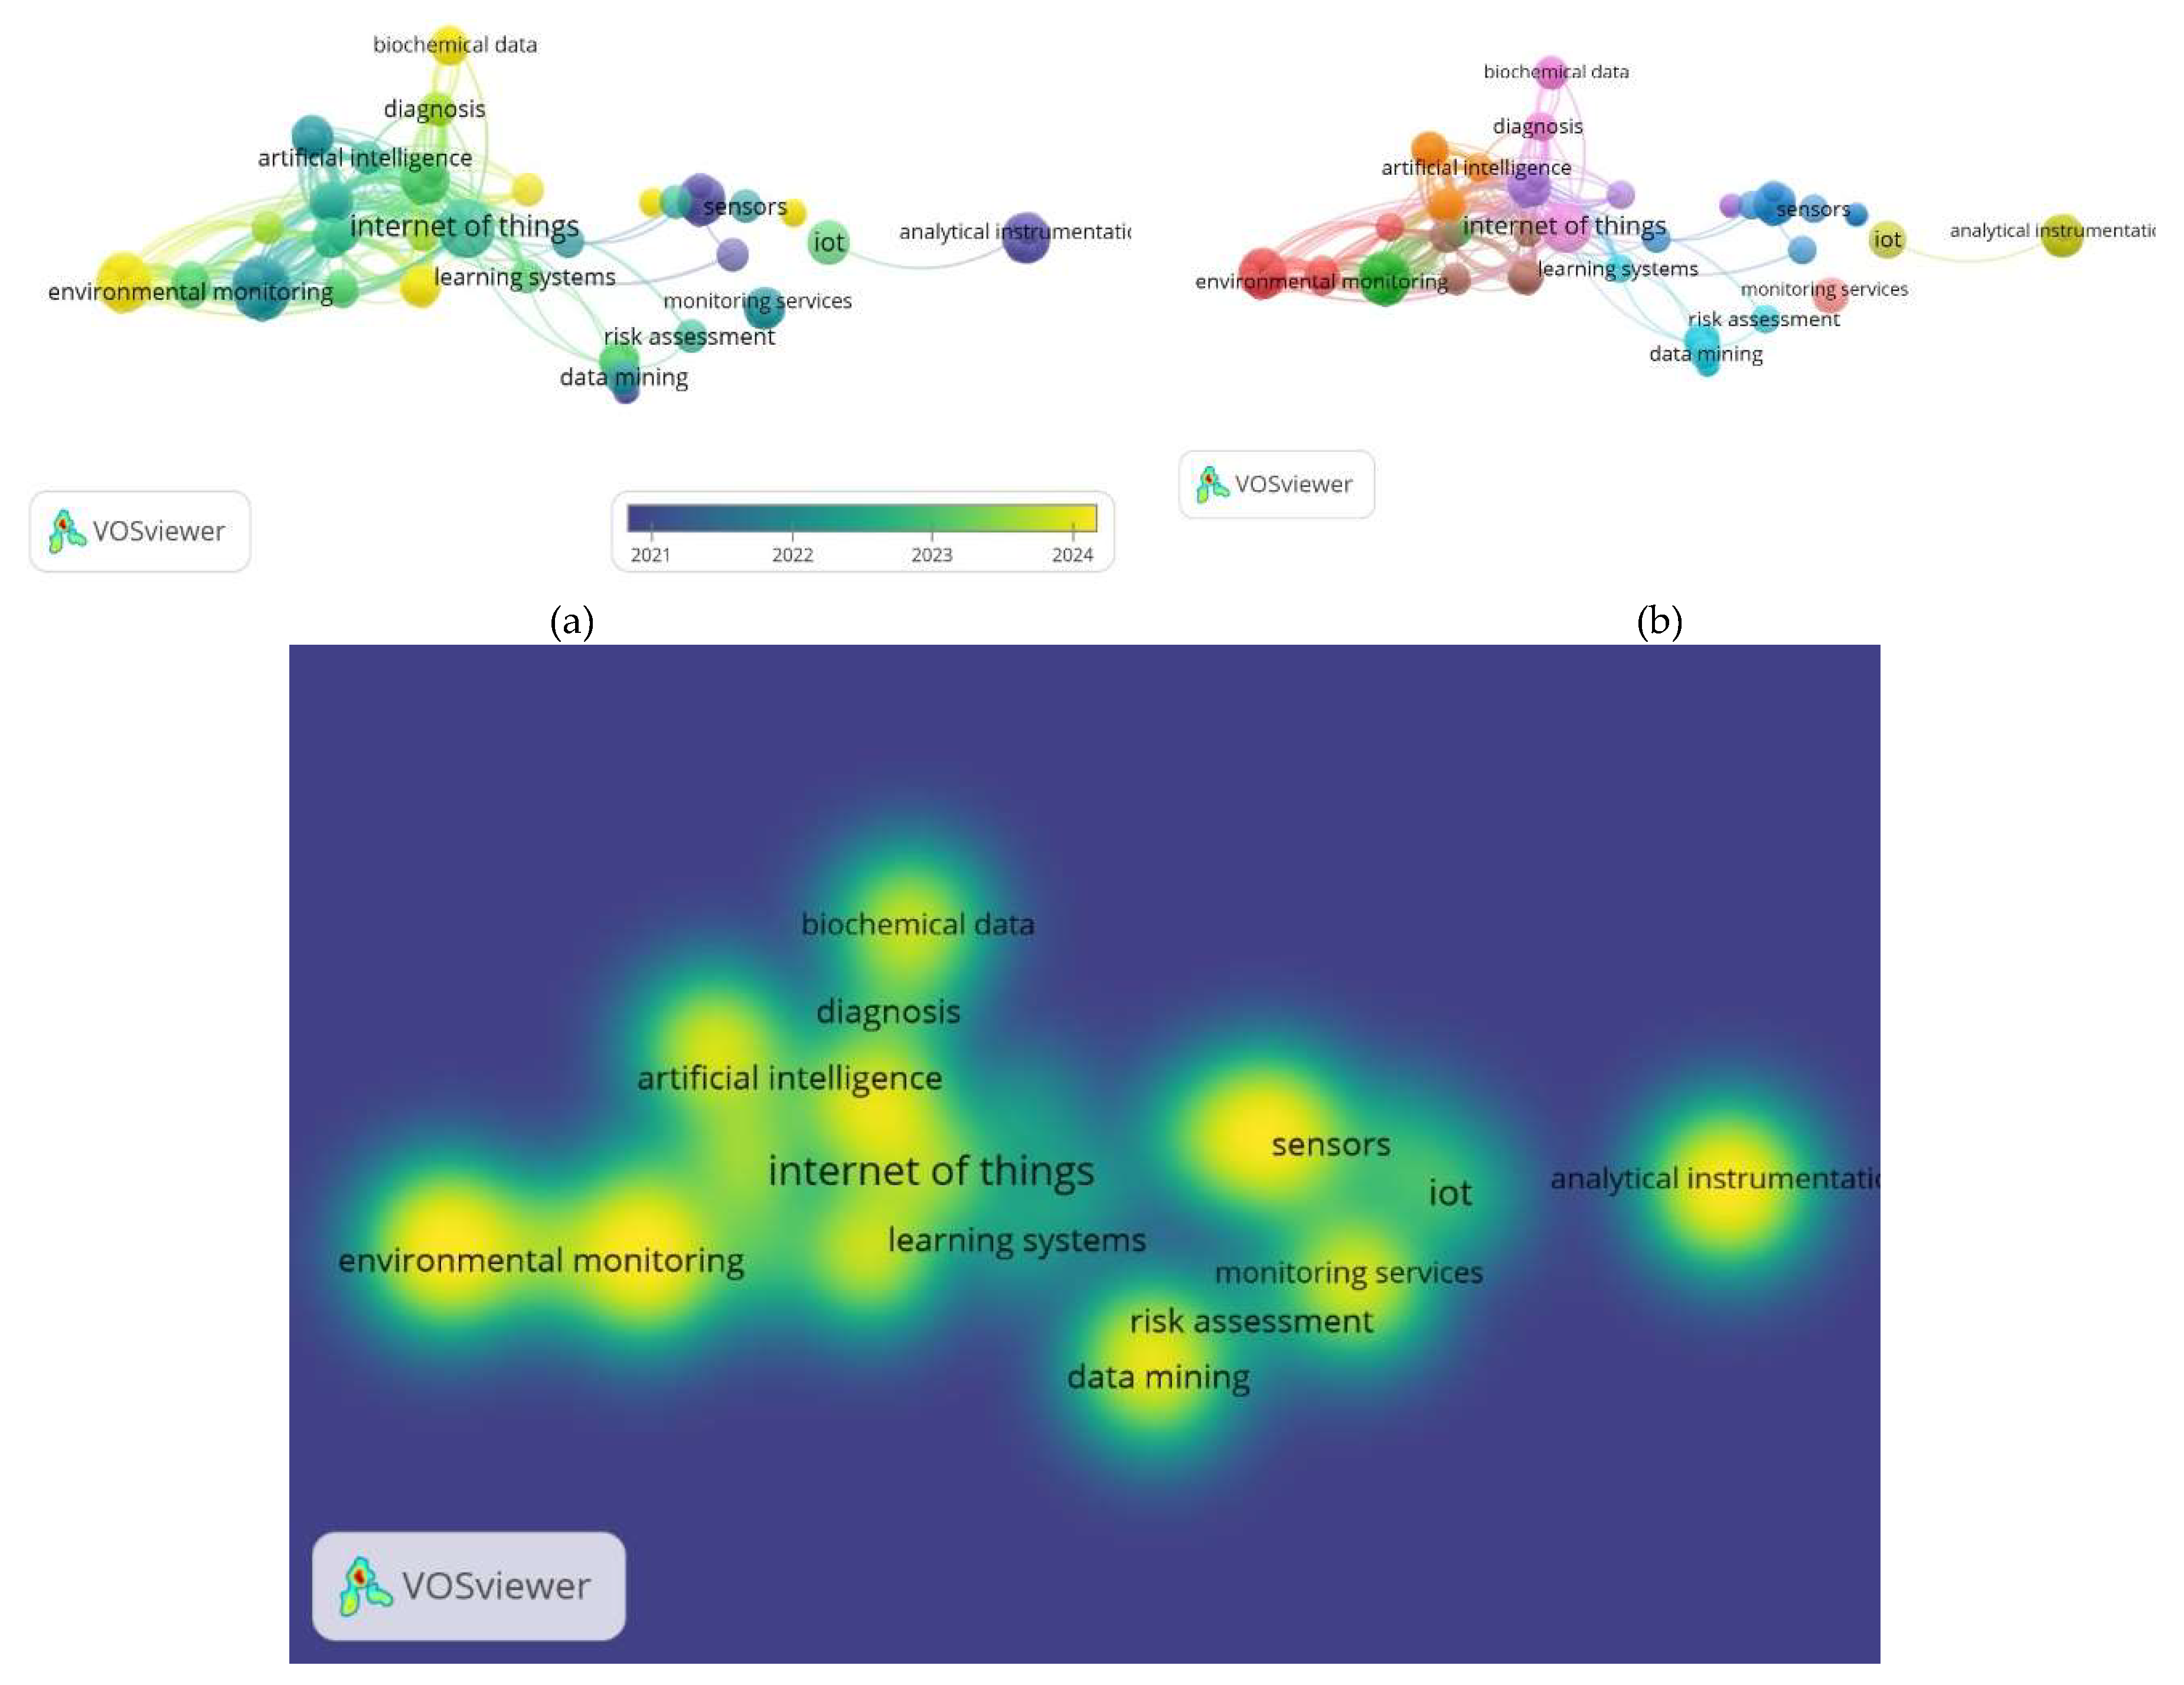
Figure 2.
Procedures and Stages of the Review.
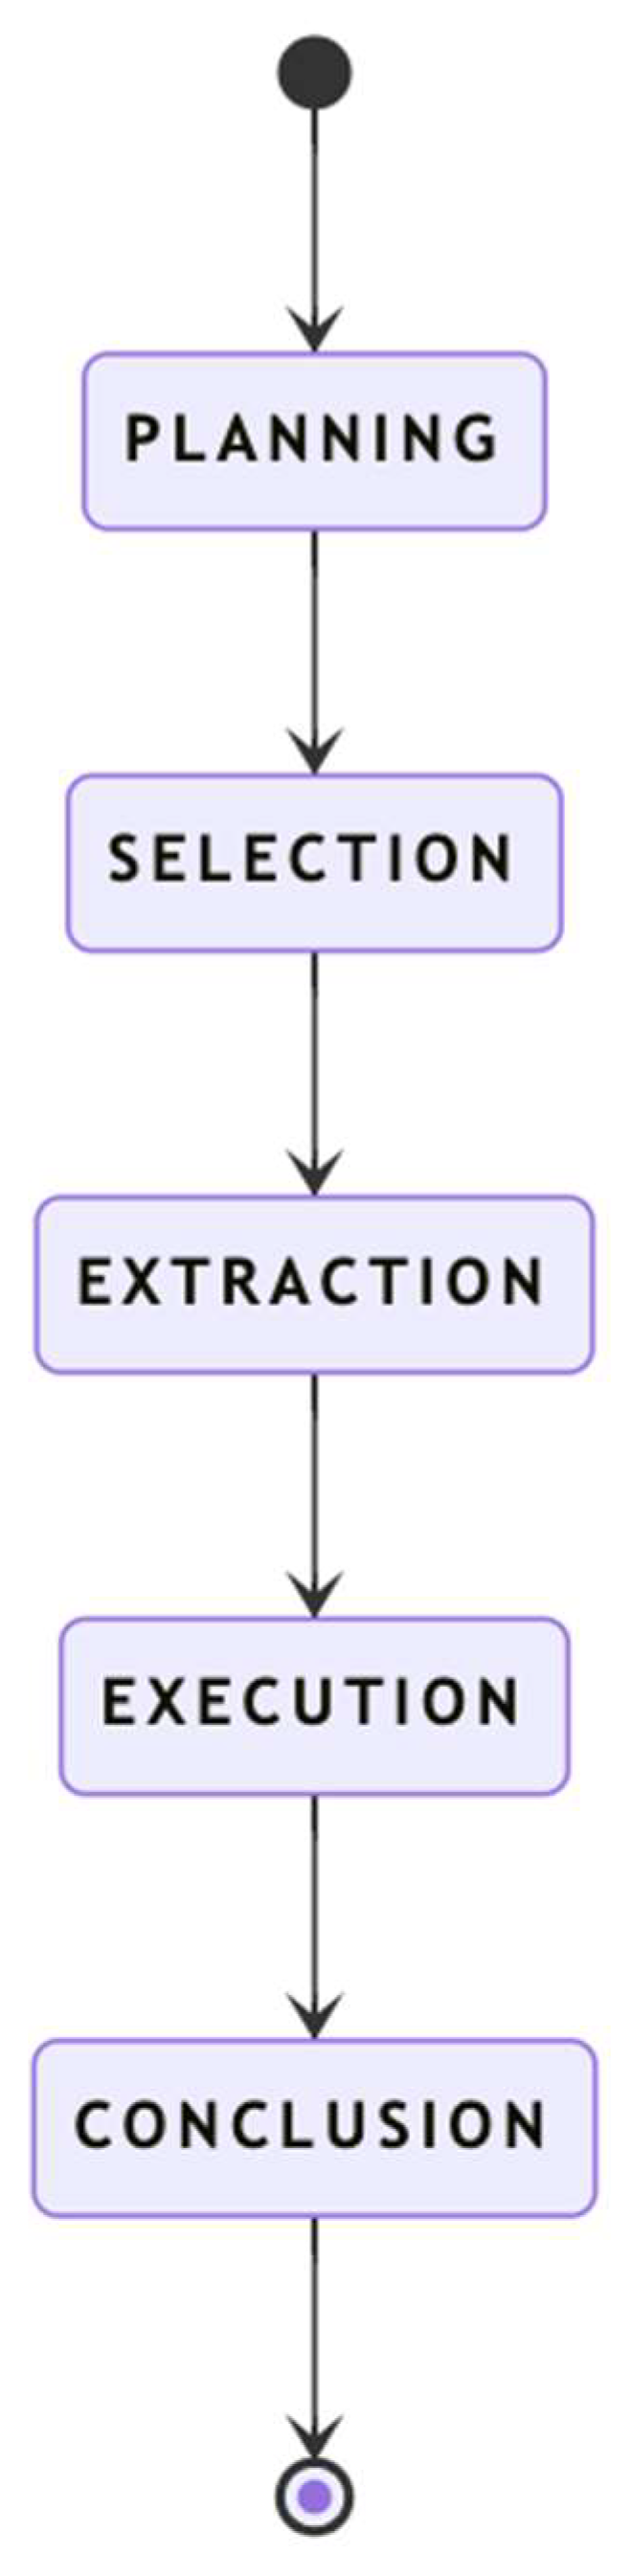
Figure 3.
Flow of Data Selection and Extraction.
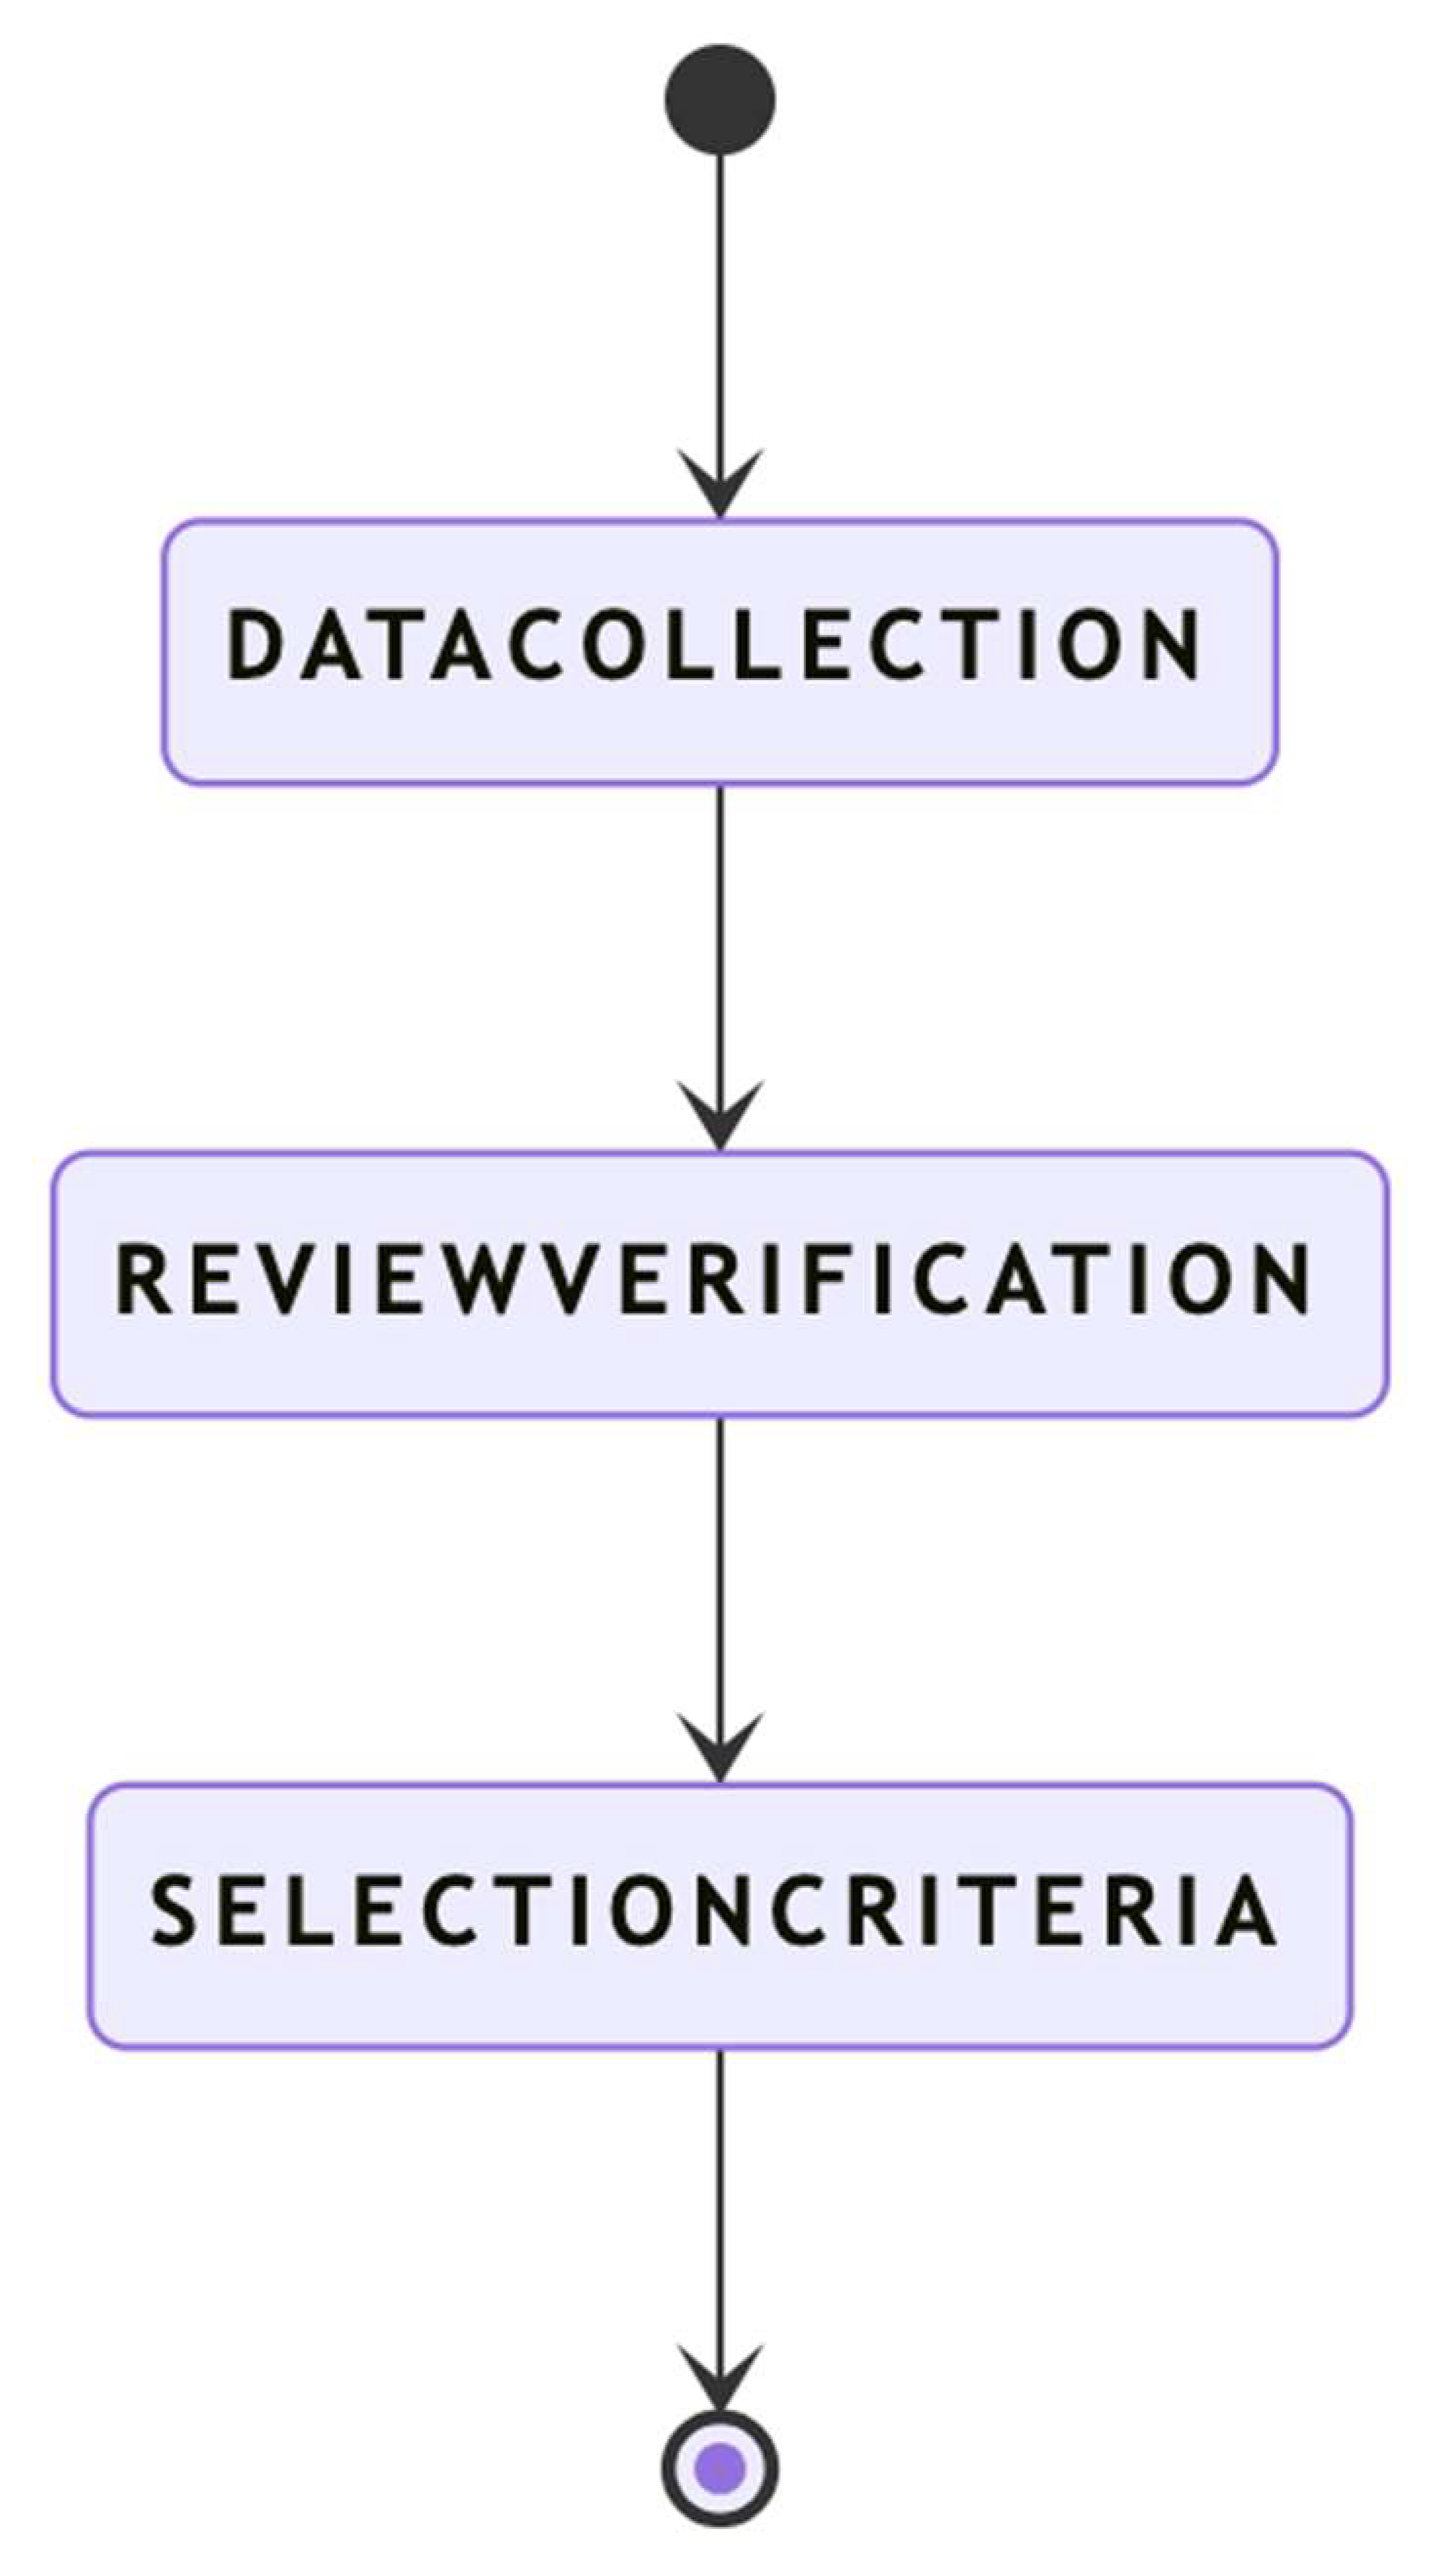
Figure 7.
Distribution of Online Database.
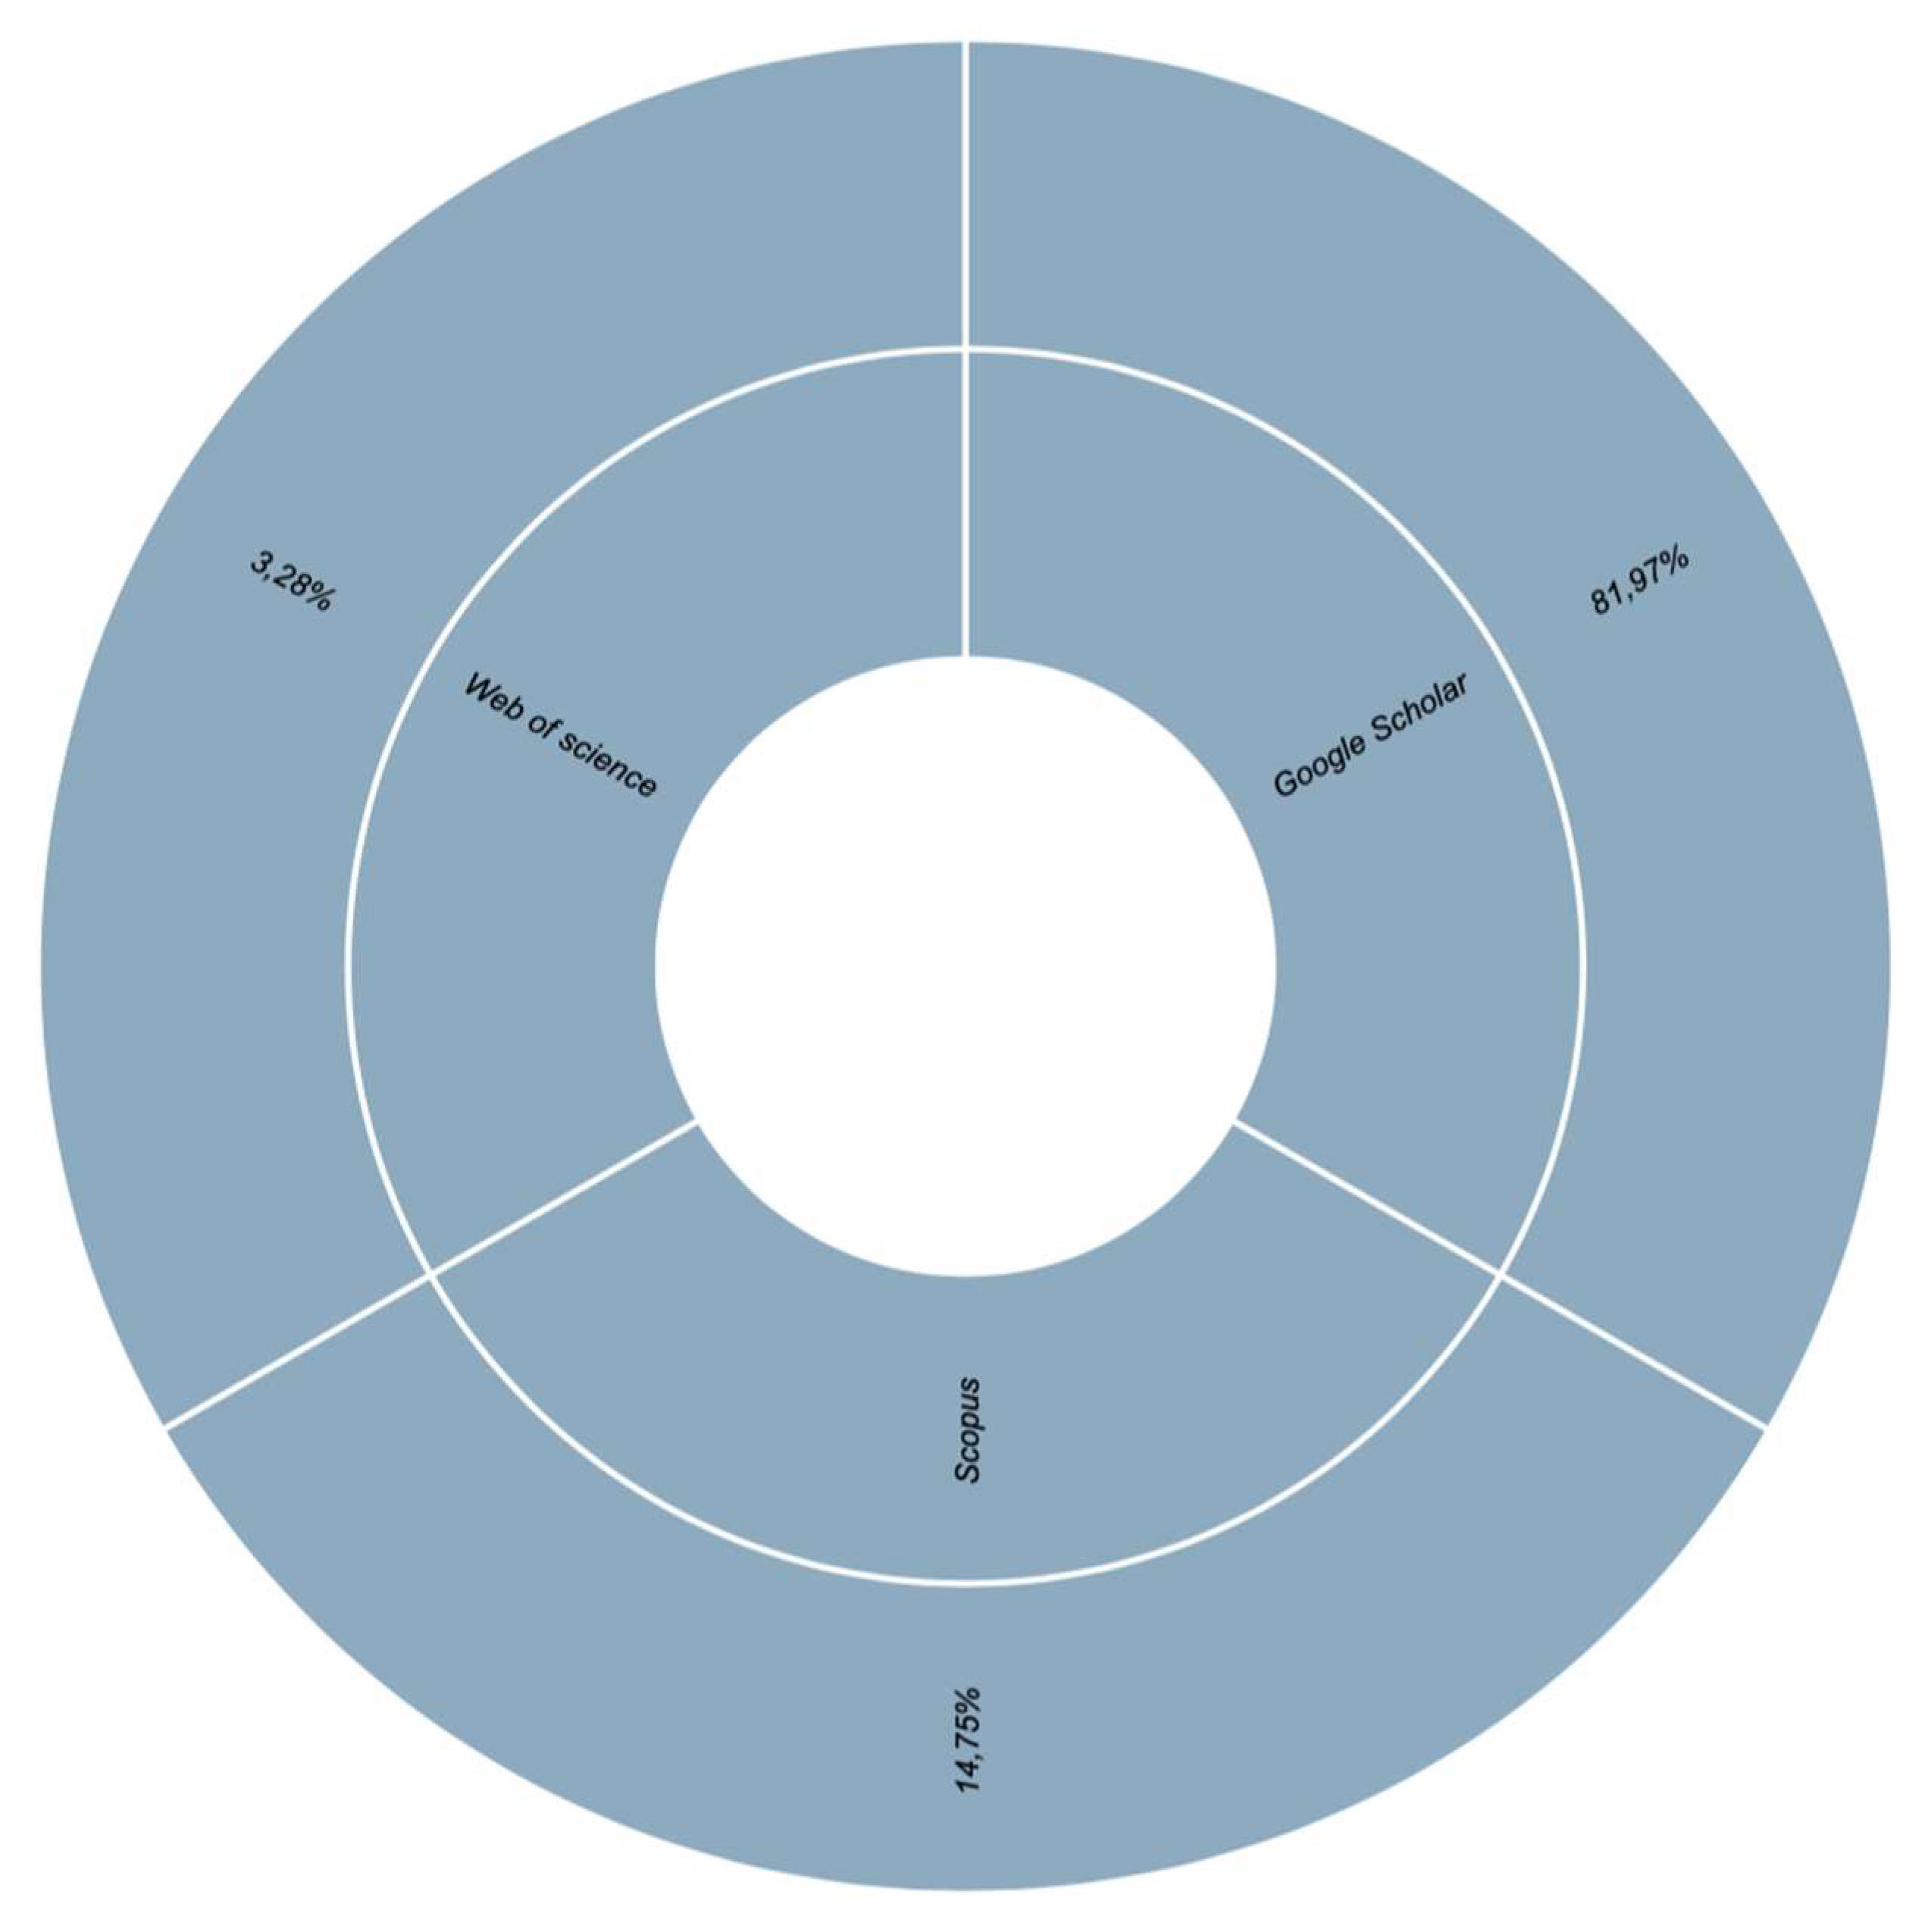
Figure 8.
Research Trends and Publication Types.
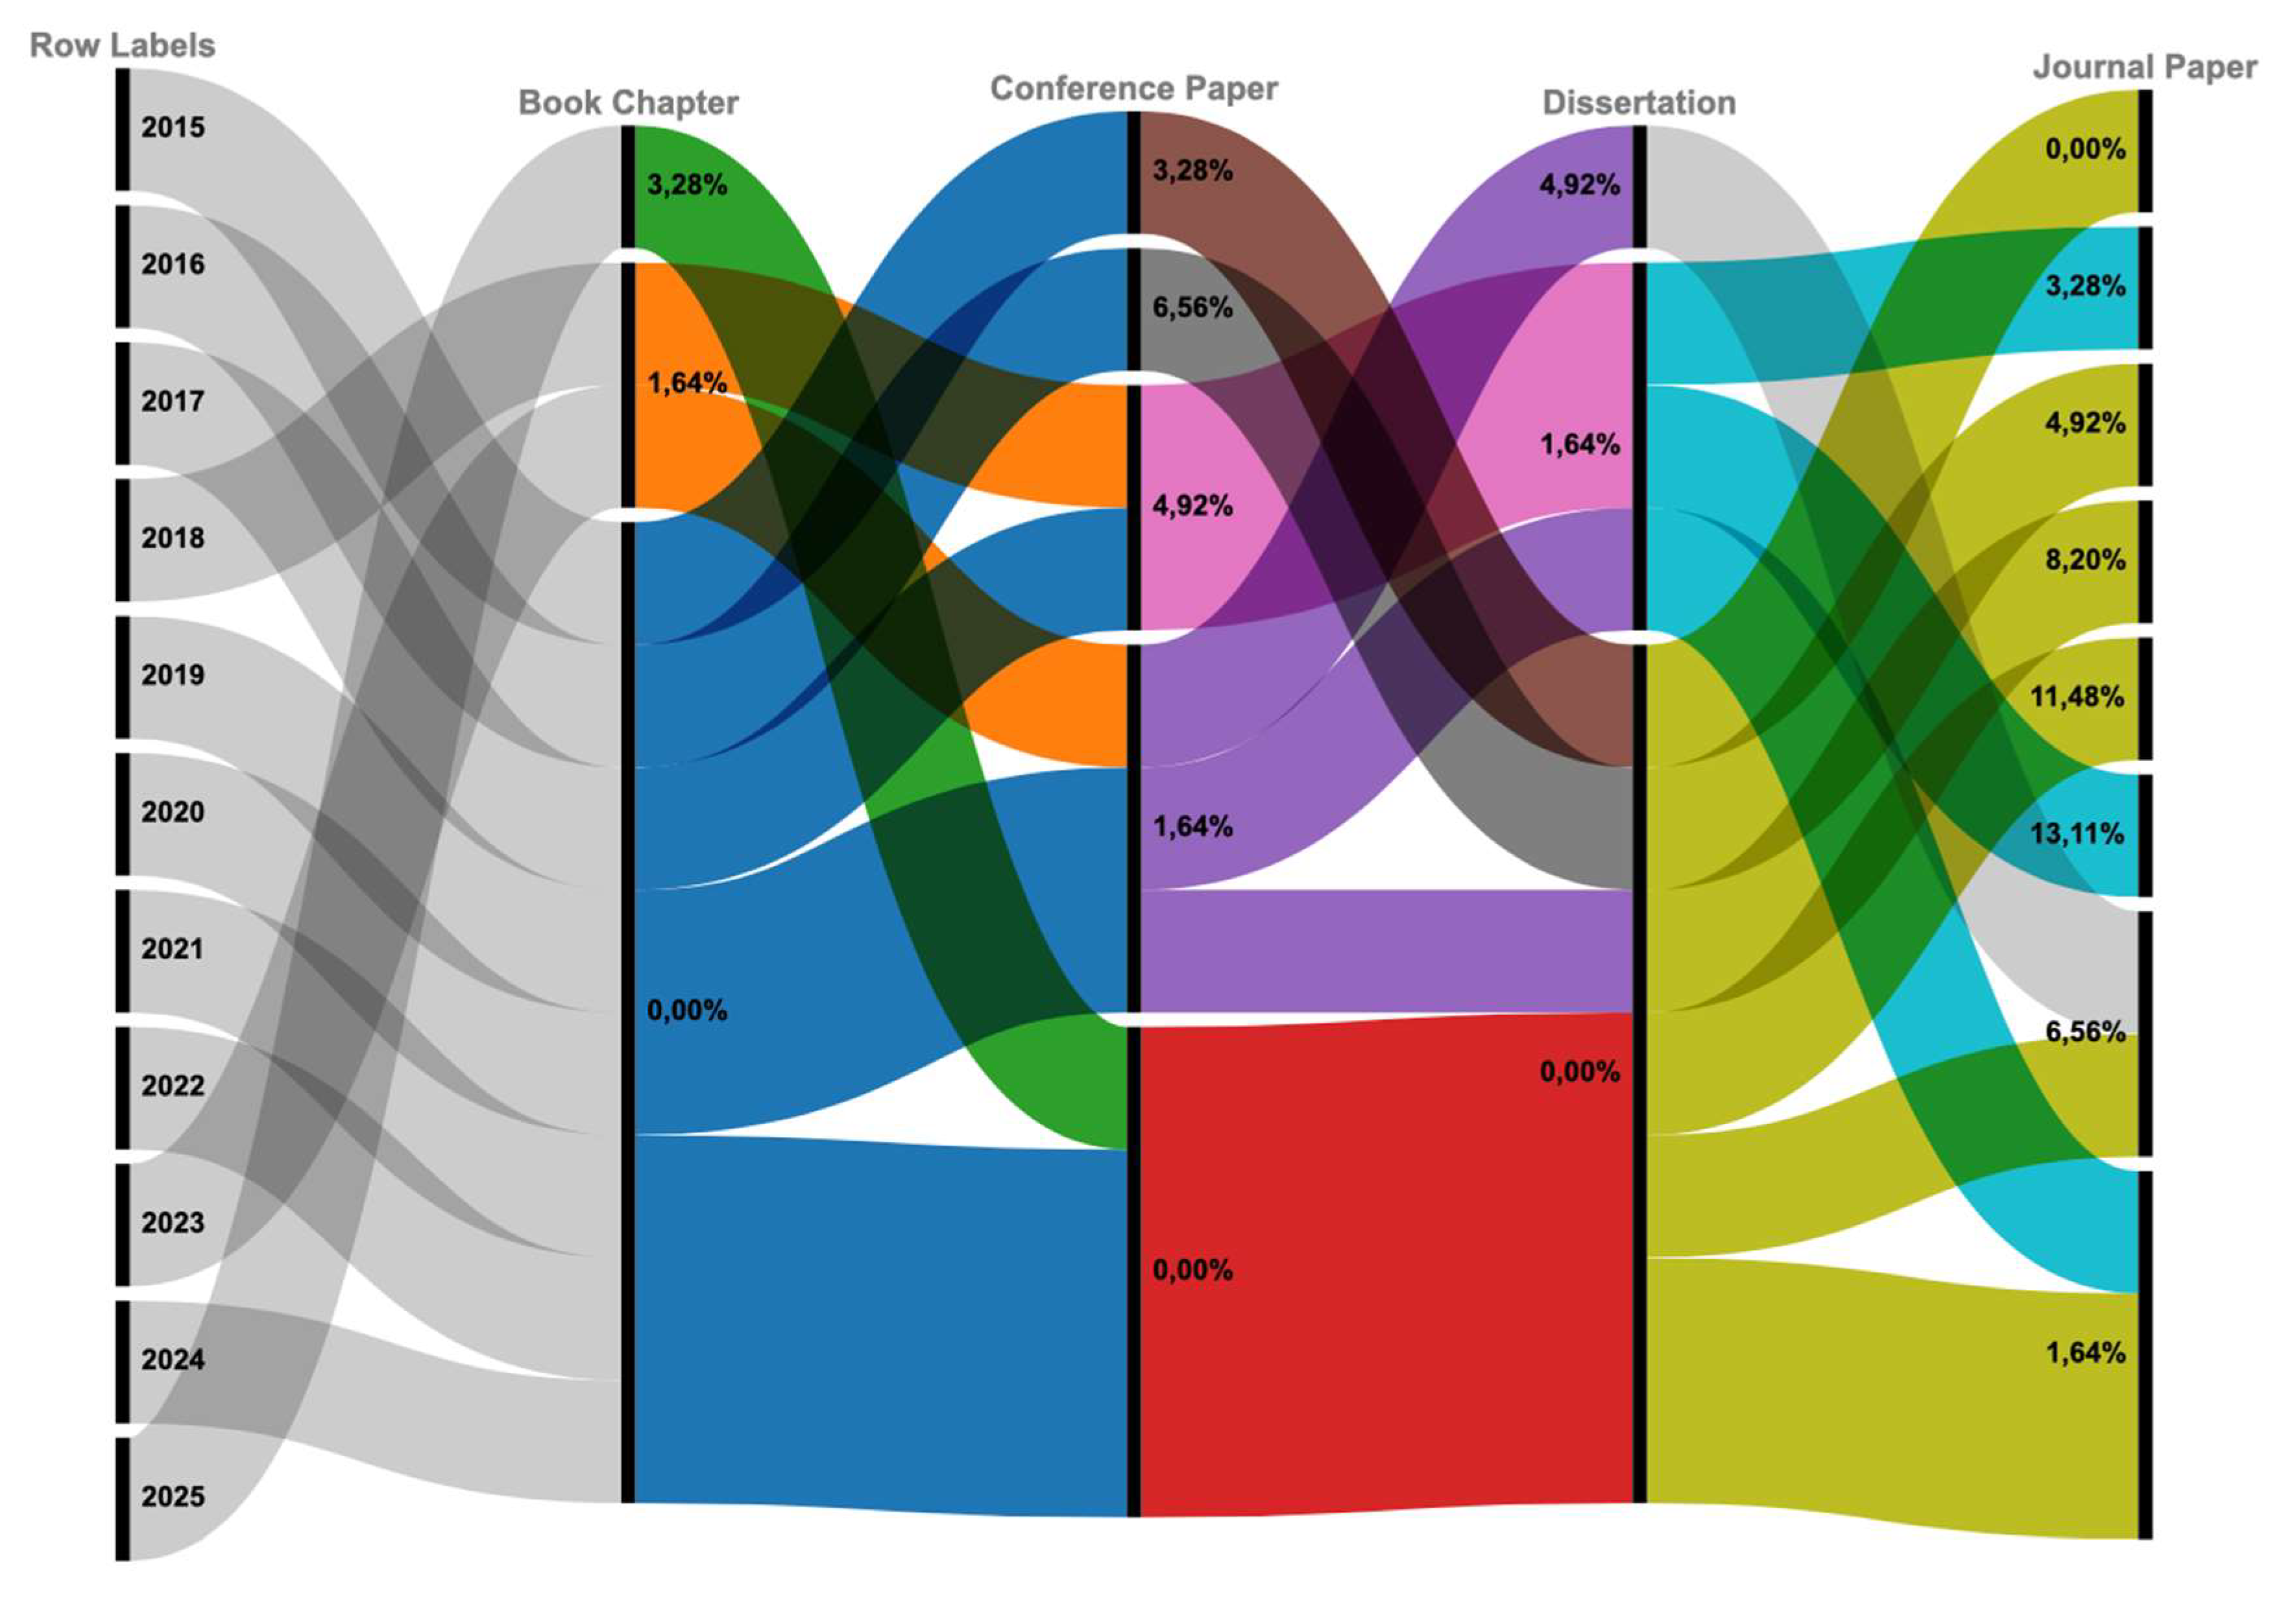
Figure 9.
Comparison of Accuracy and Cost Across Methods.
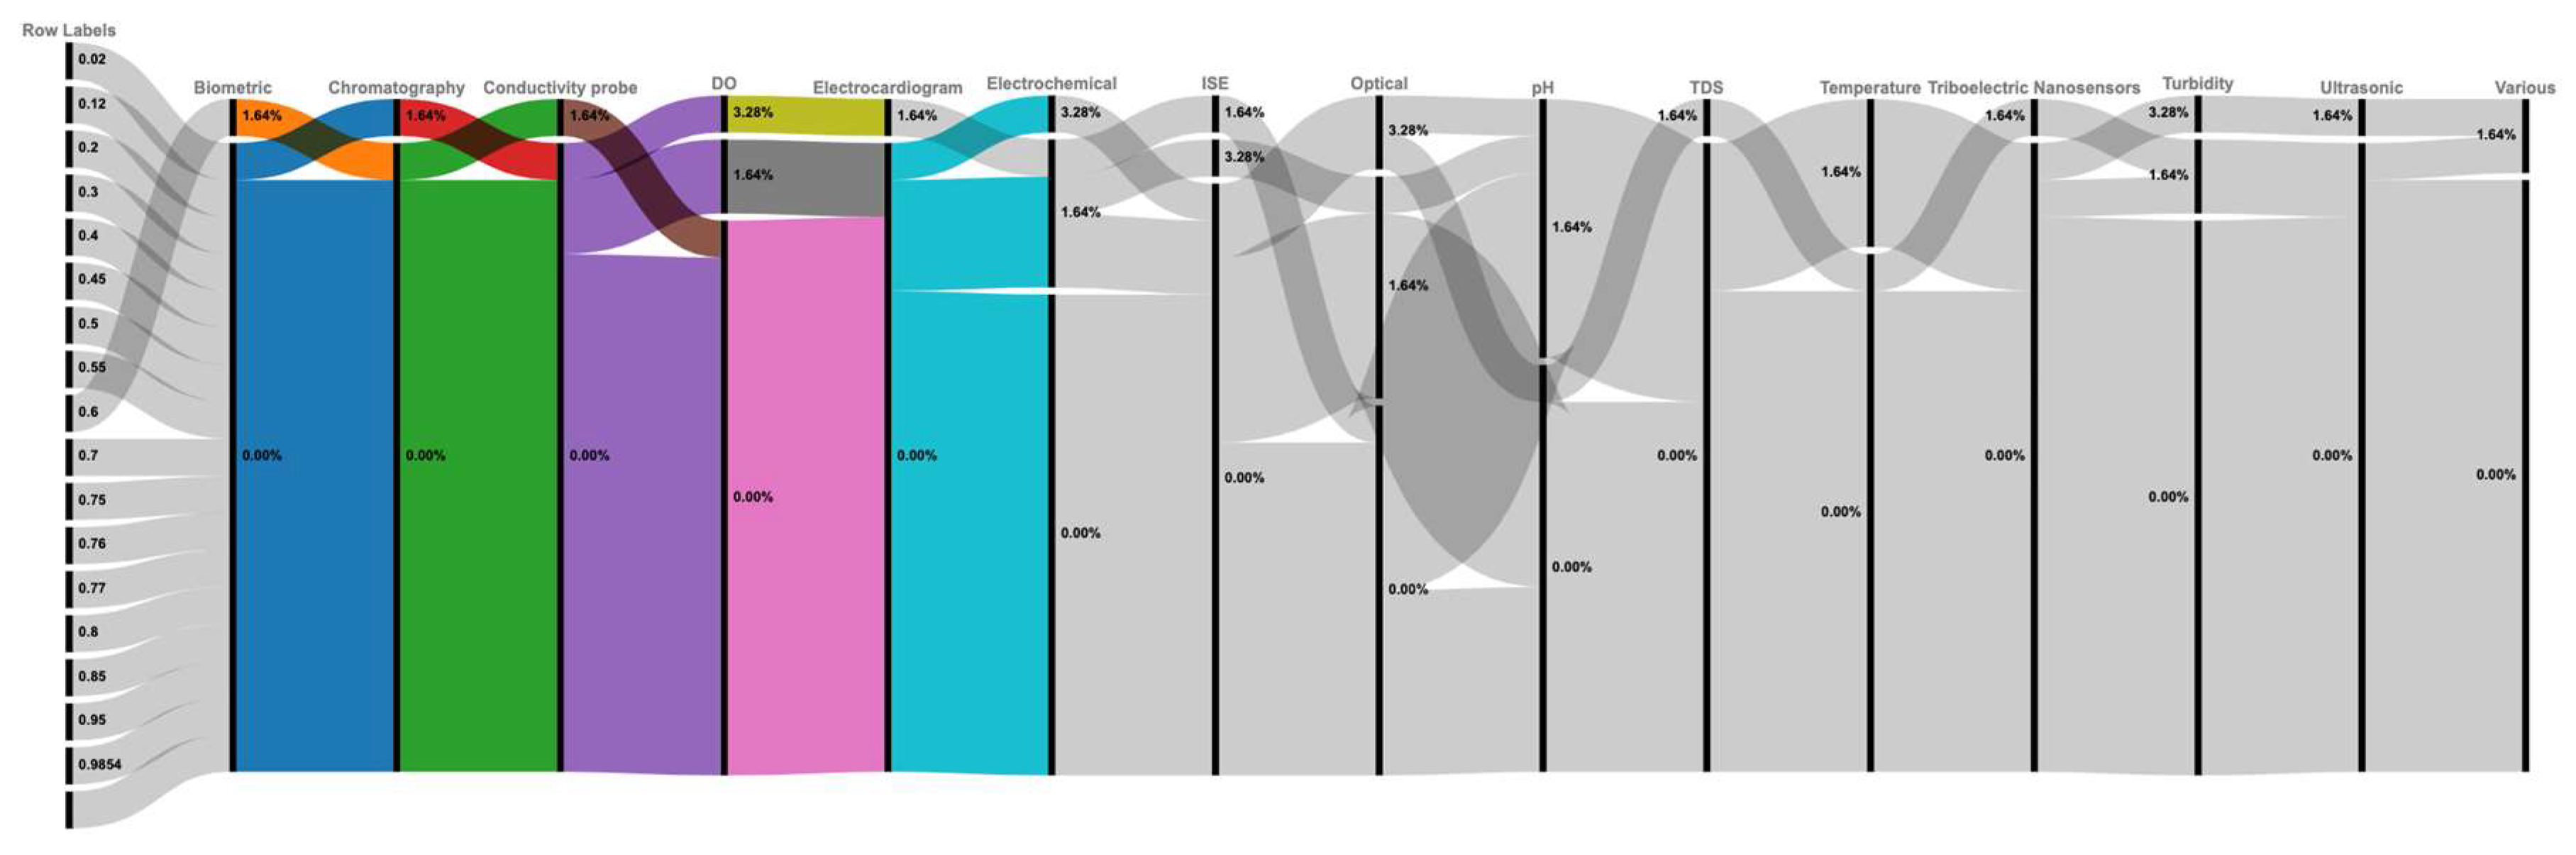
Figure 10.
Calibration Practices by Deployment Environment.
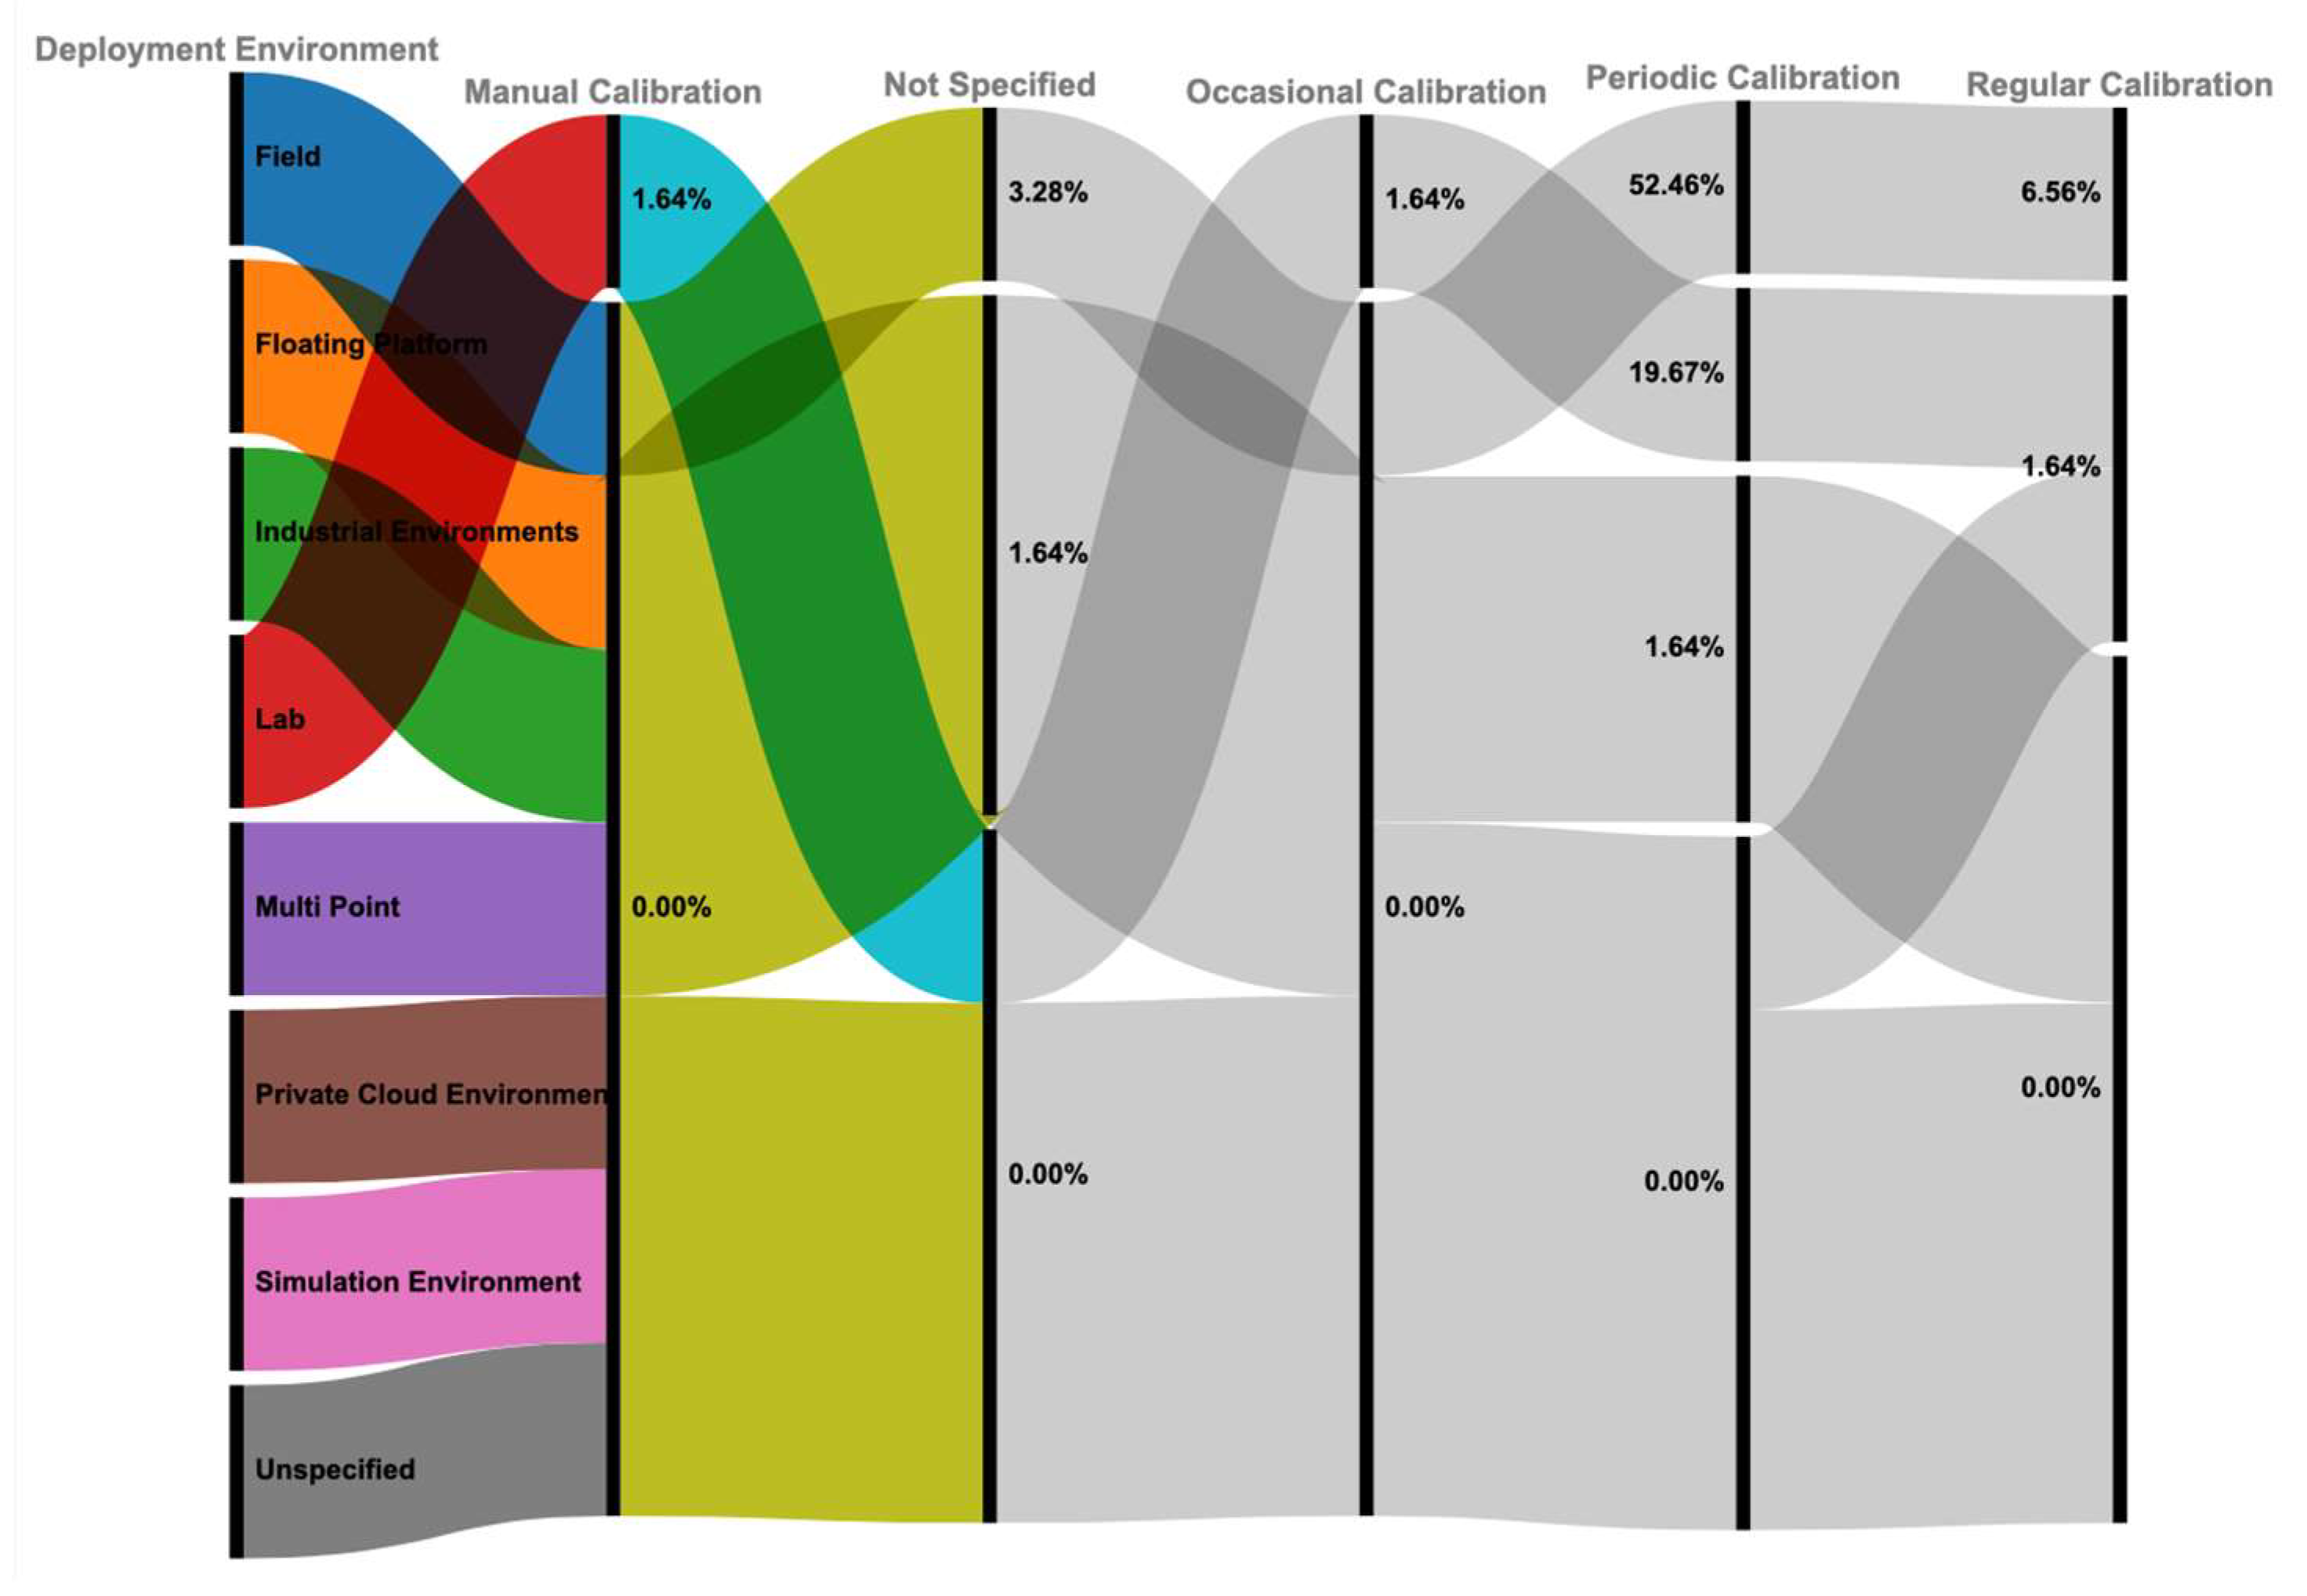
Figure 11.
Distribution of Target Parameters in Reviewed Studies.
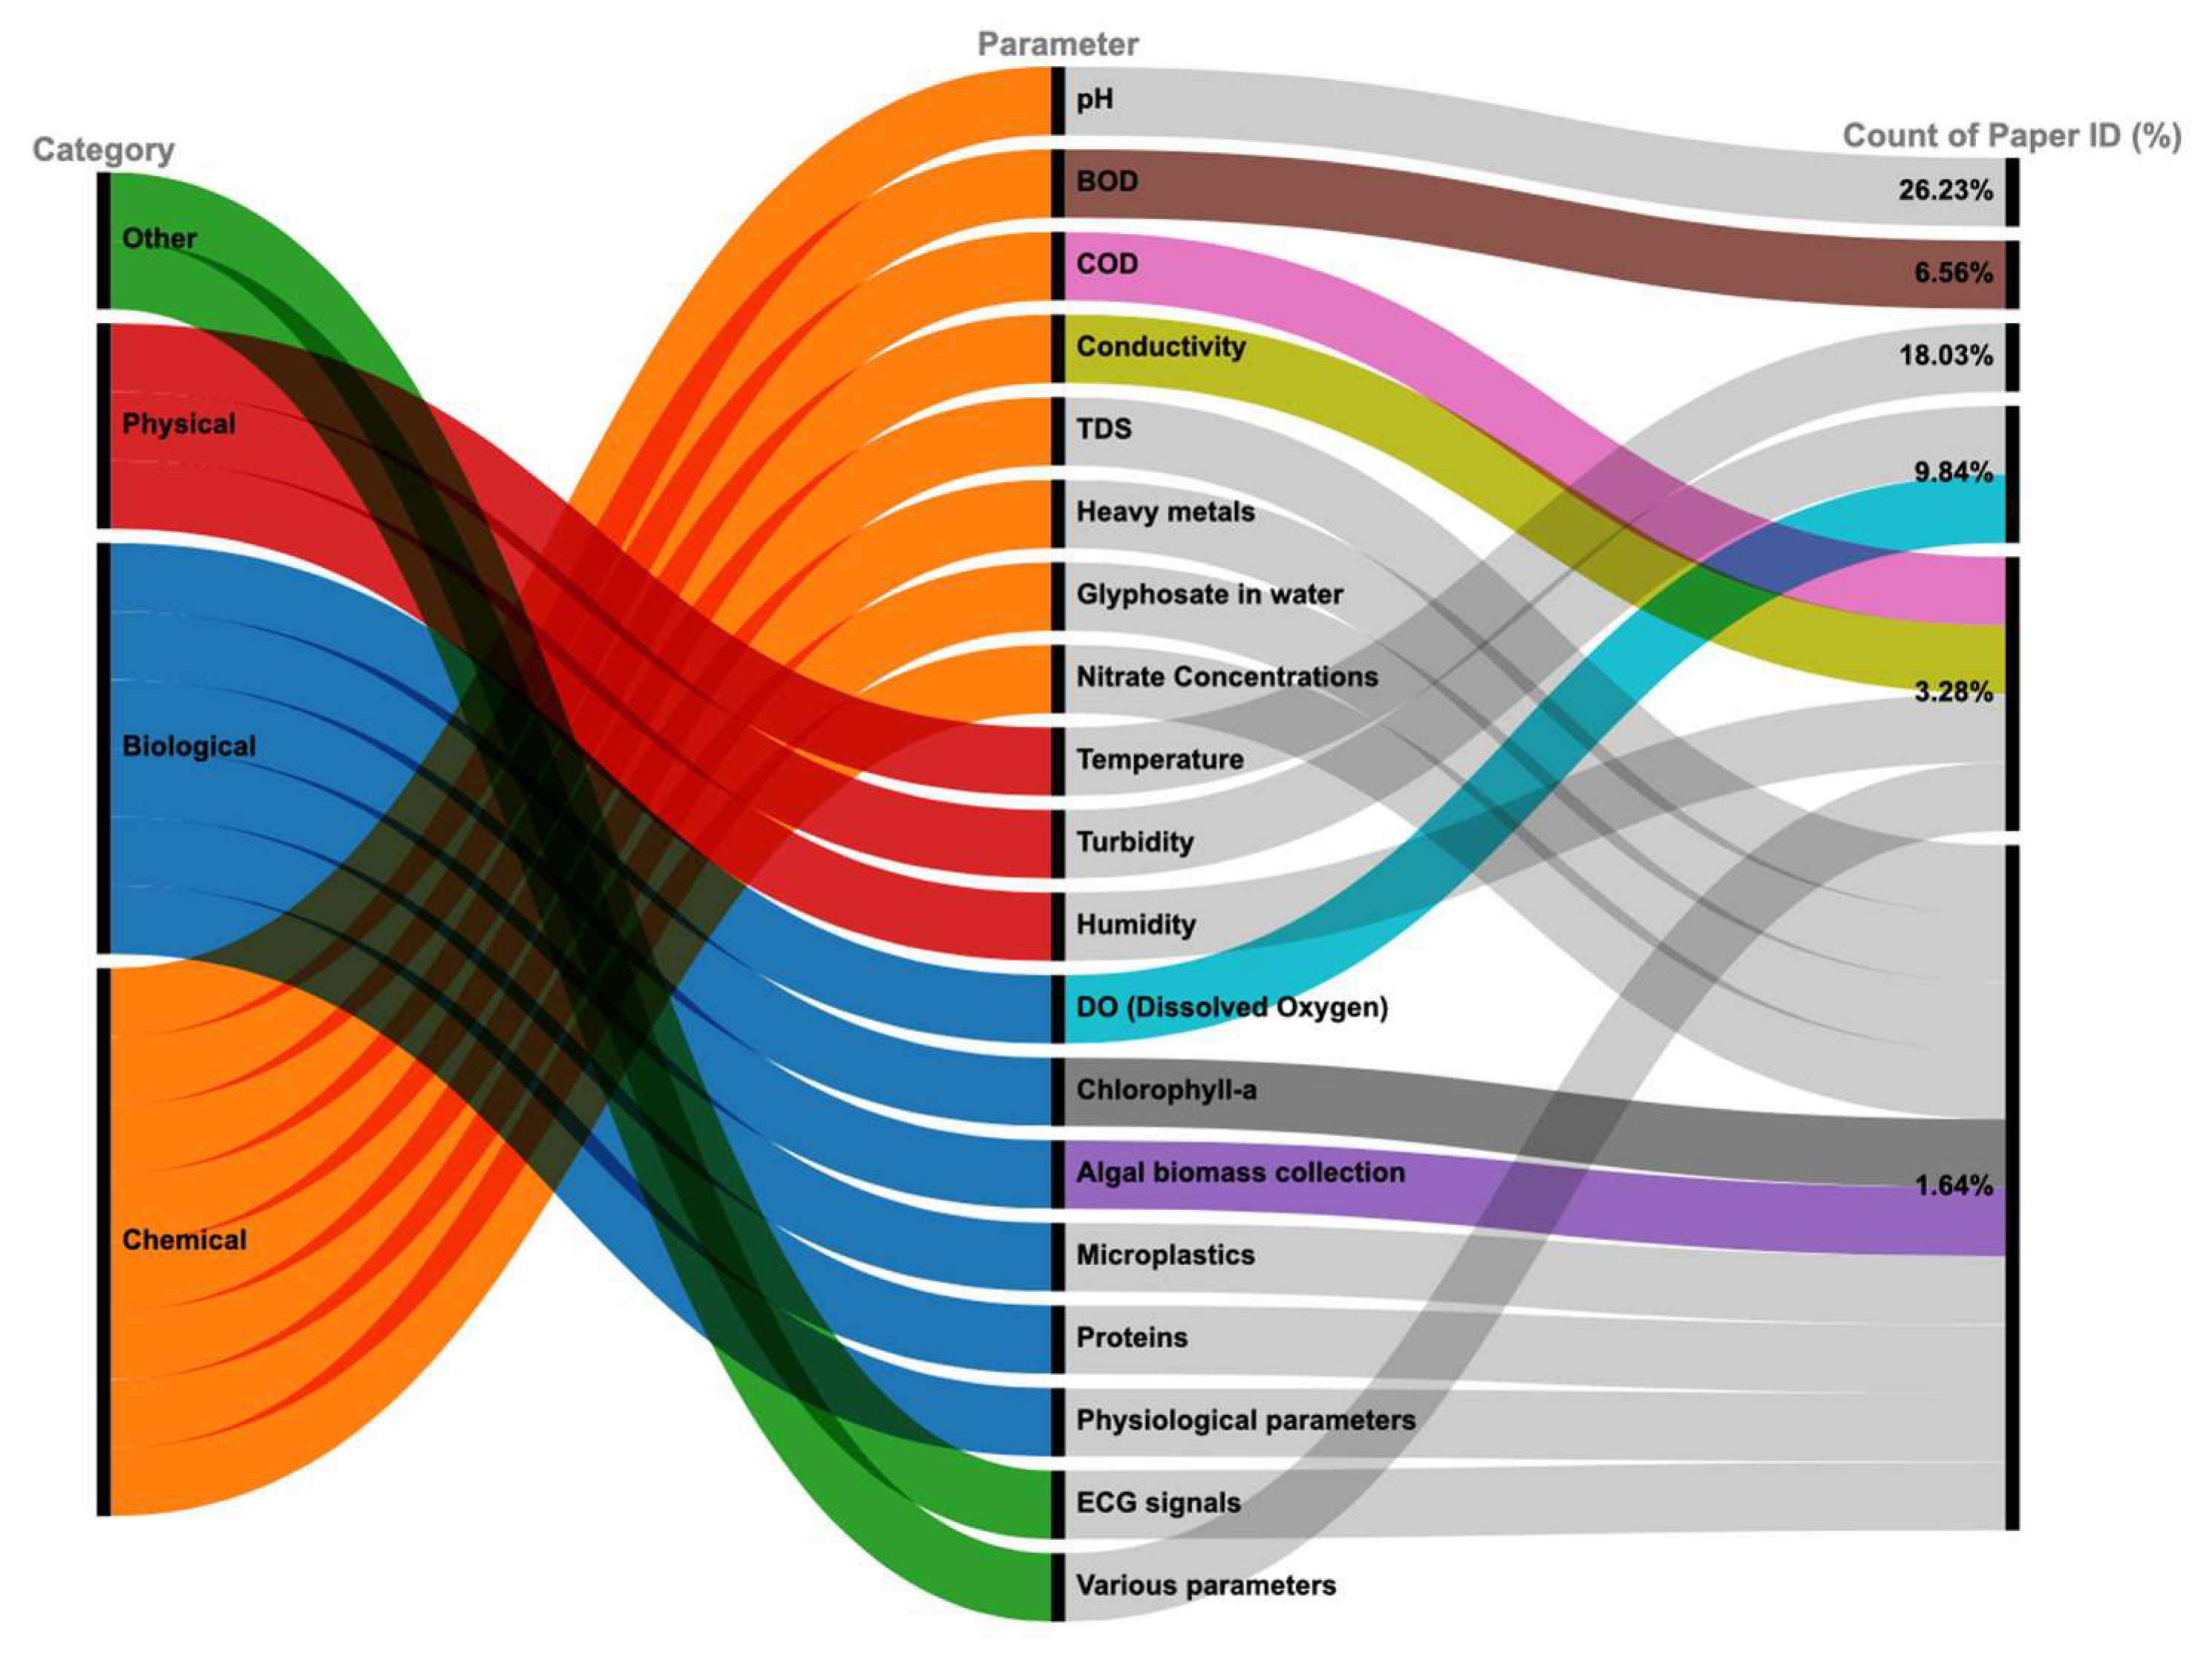
Figure 12.
Categorized Deployment Environments for IoT Monitoring.
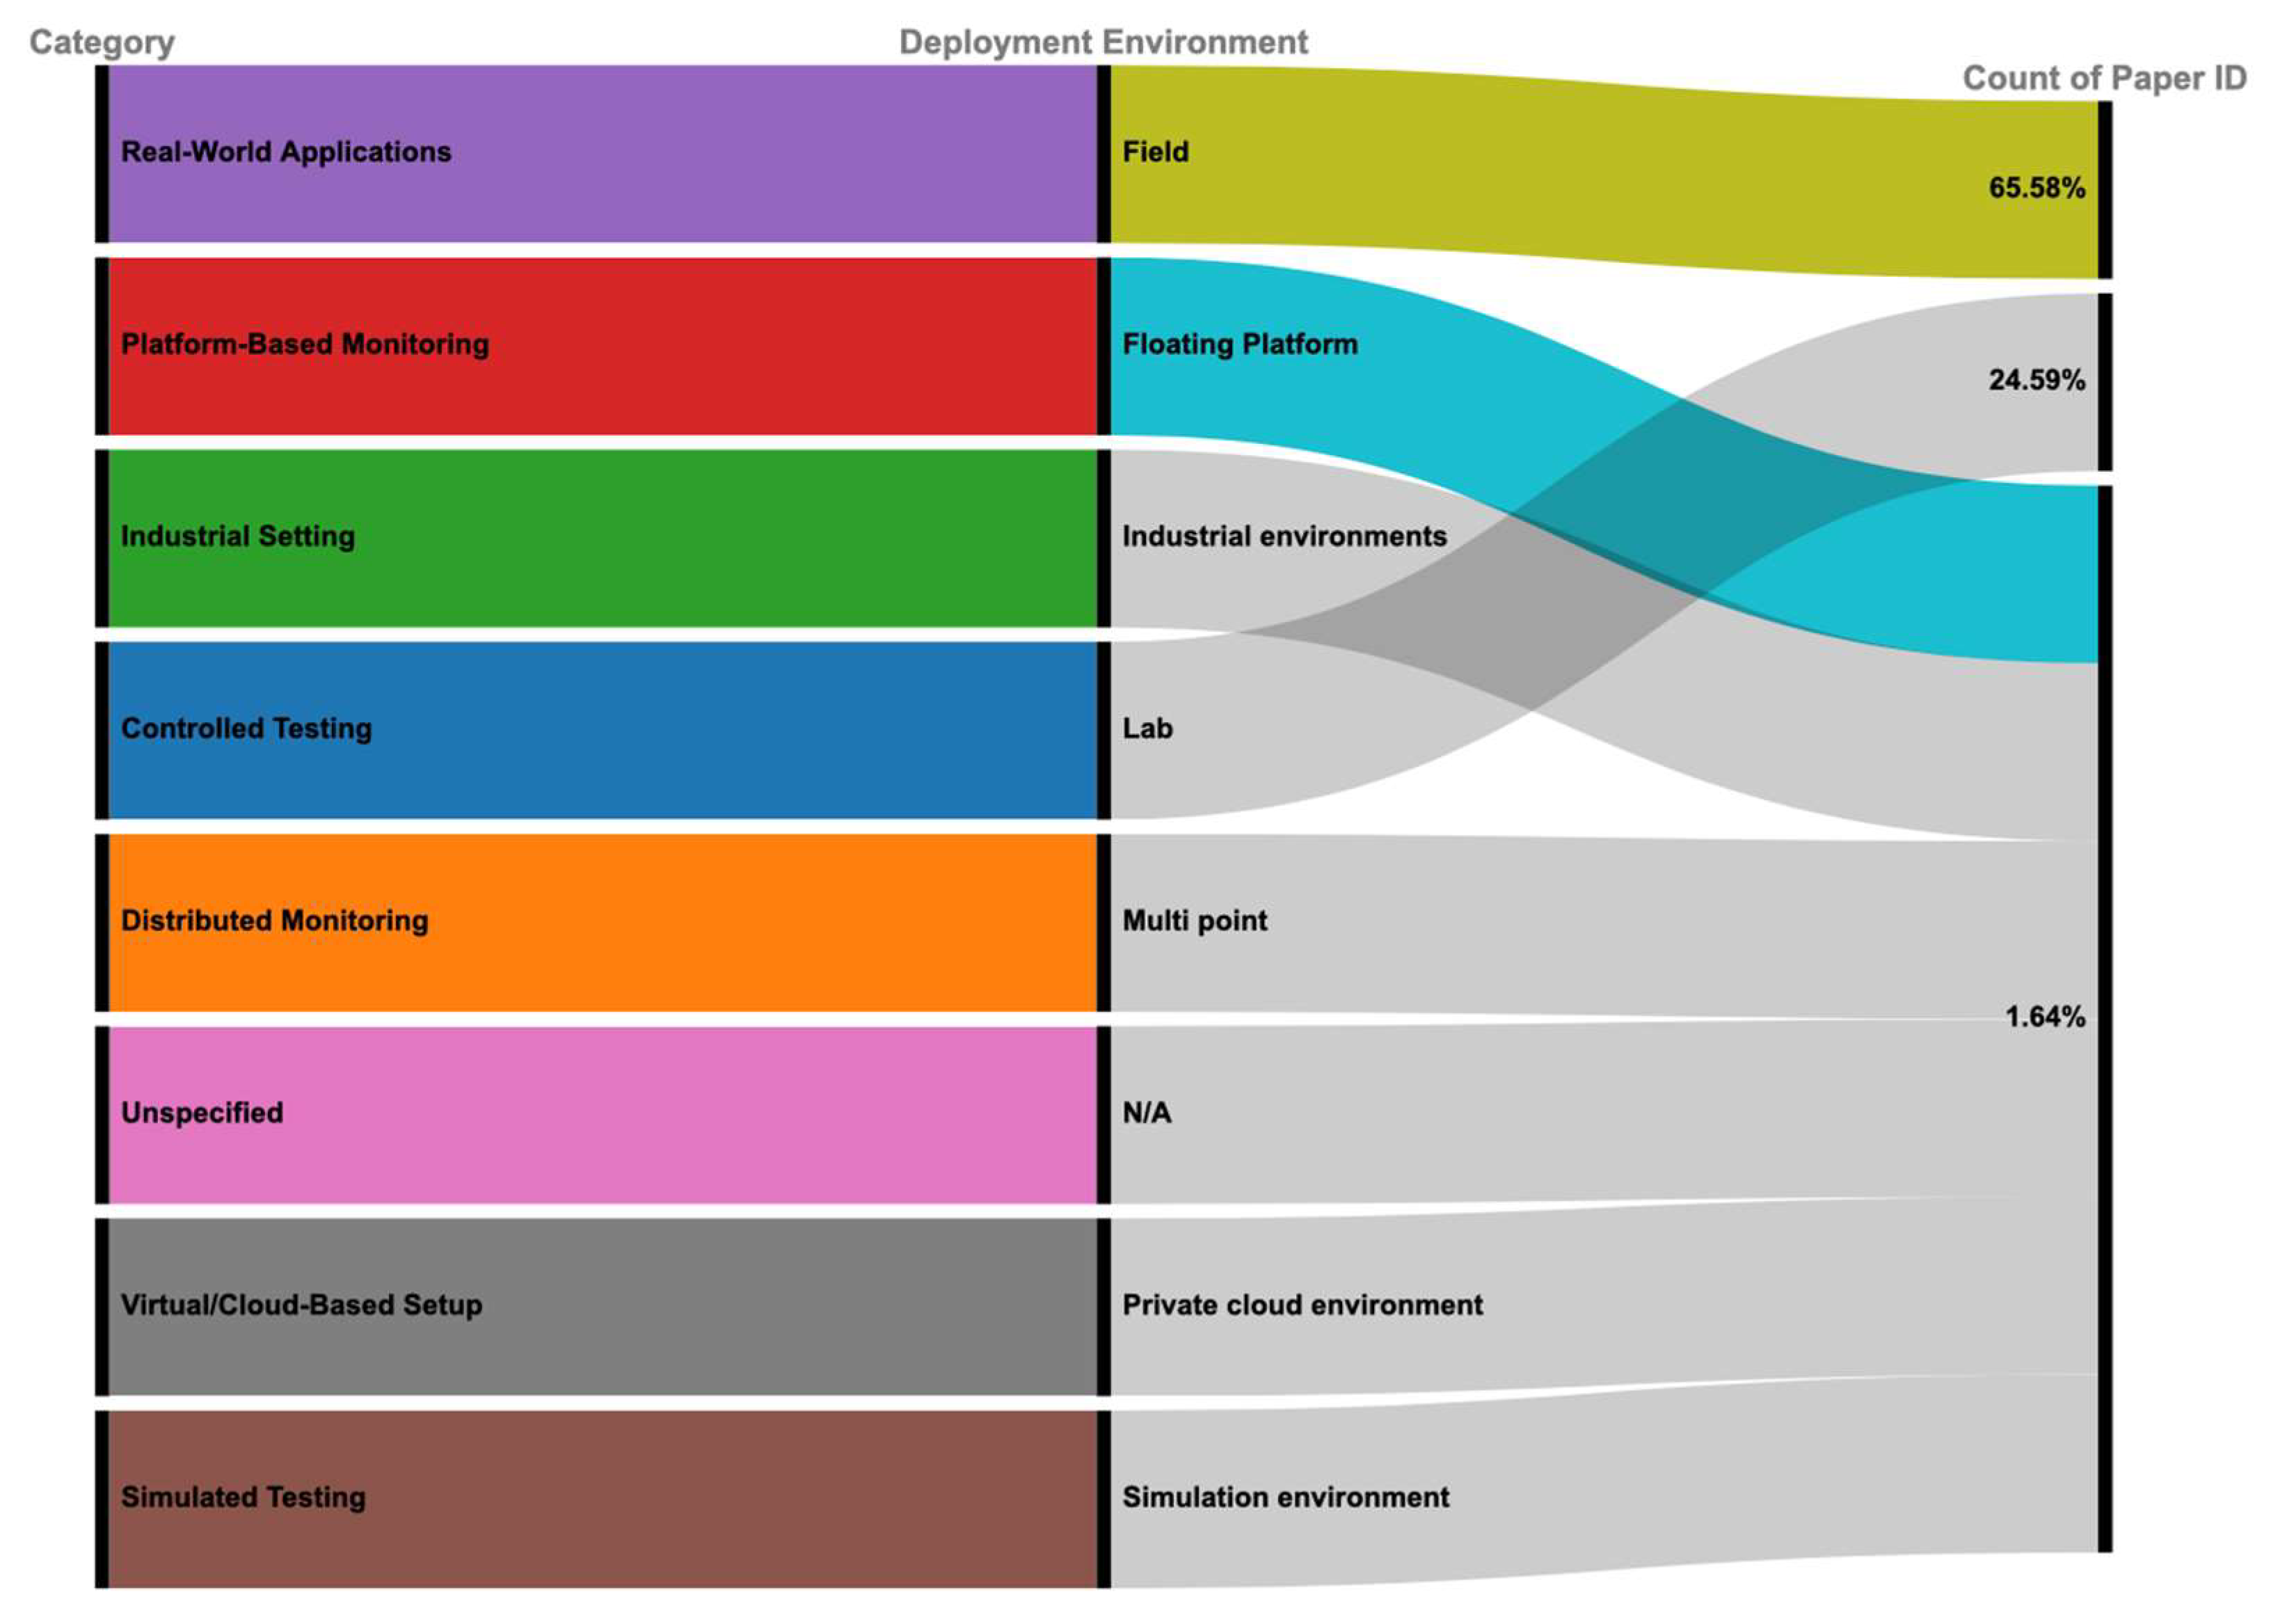
Figure 13.
Distribution of Target Parameters Measured by Different IoT Sensor Types for Aquatic Ecosystem Monitoring.
Figure 13.
Distribution of Target Parameters Measured by Different IoT Sensor Types for Aquatic Ecosystem Monitoring.
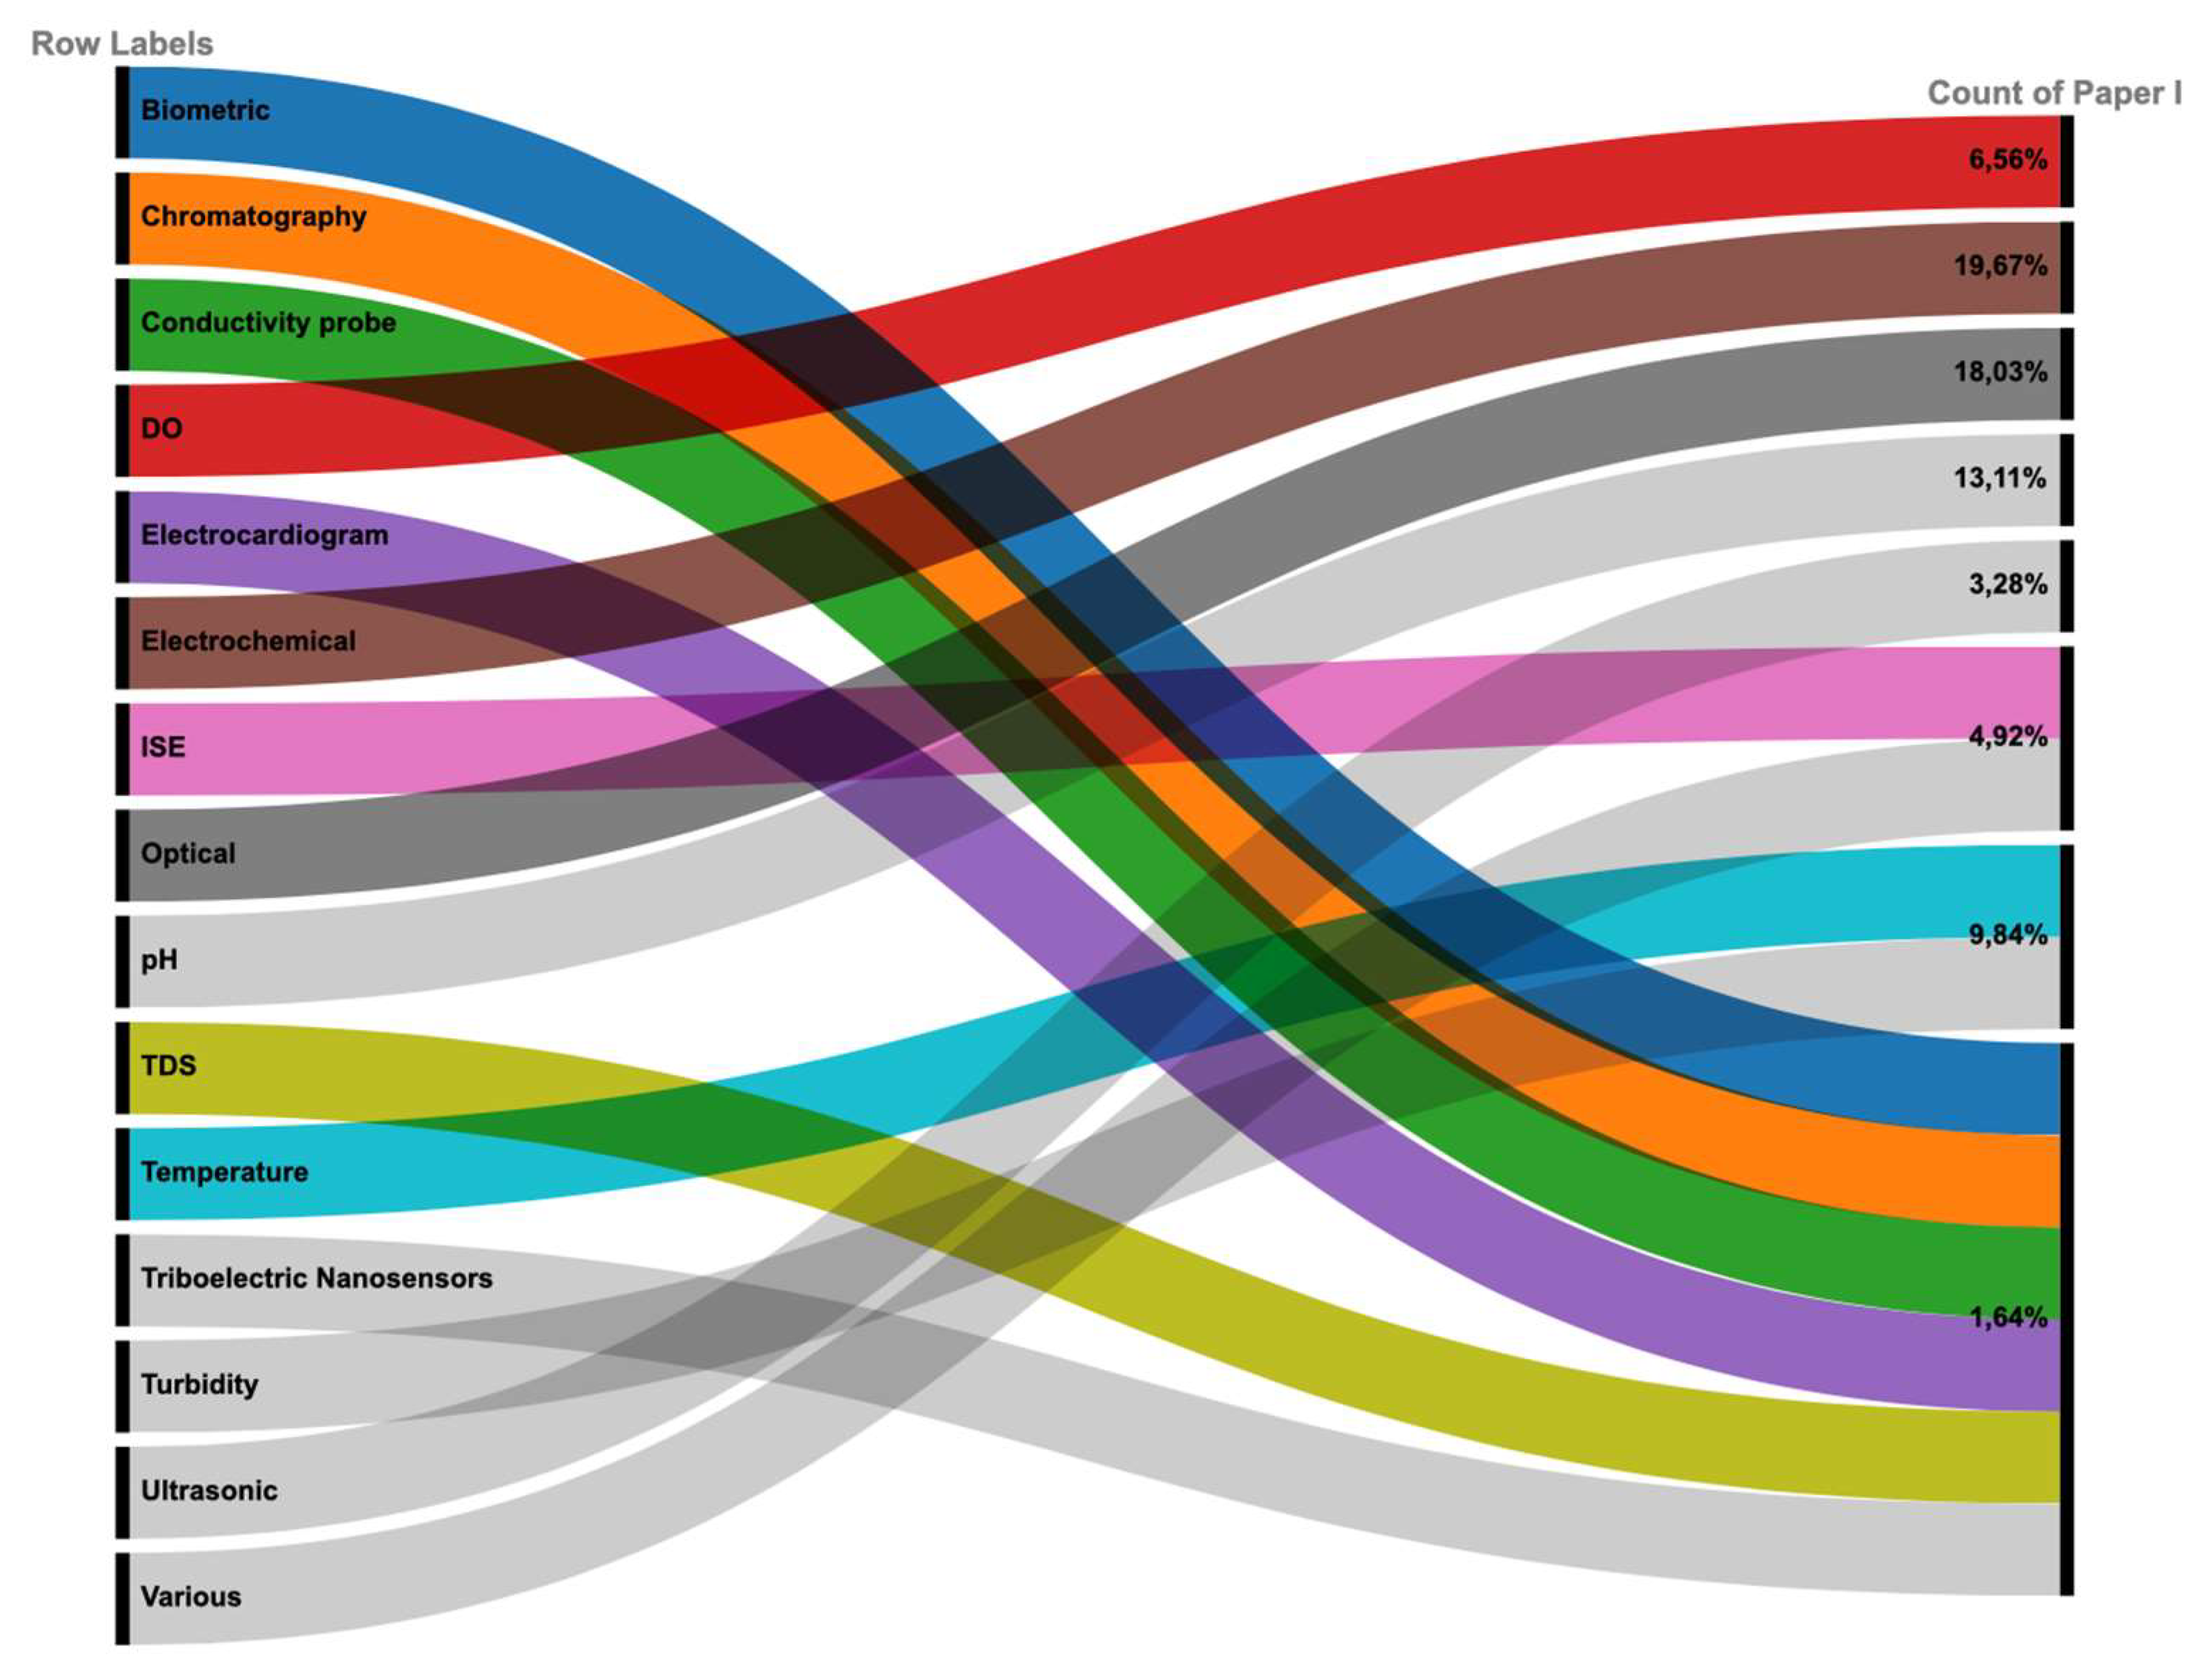
Figure 14.
Mapping of Study Contributions to Microcontroller-Compatible Platforms in IoT-Based Aquatic Monitoring.
Figure 14.
Mapping of Study Contributions to Microcontroller-Compatible Platforms in IoT-Based Aquatic Monitoring.
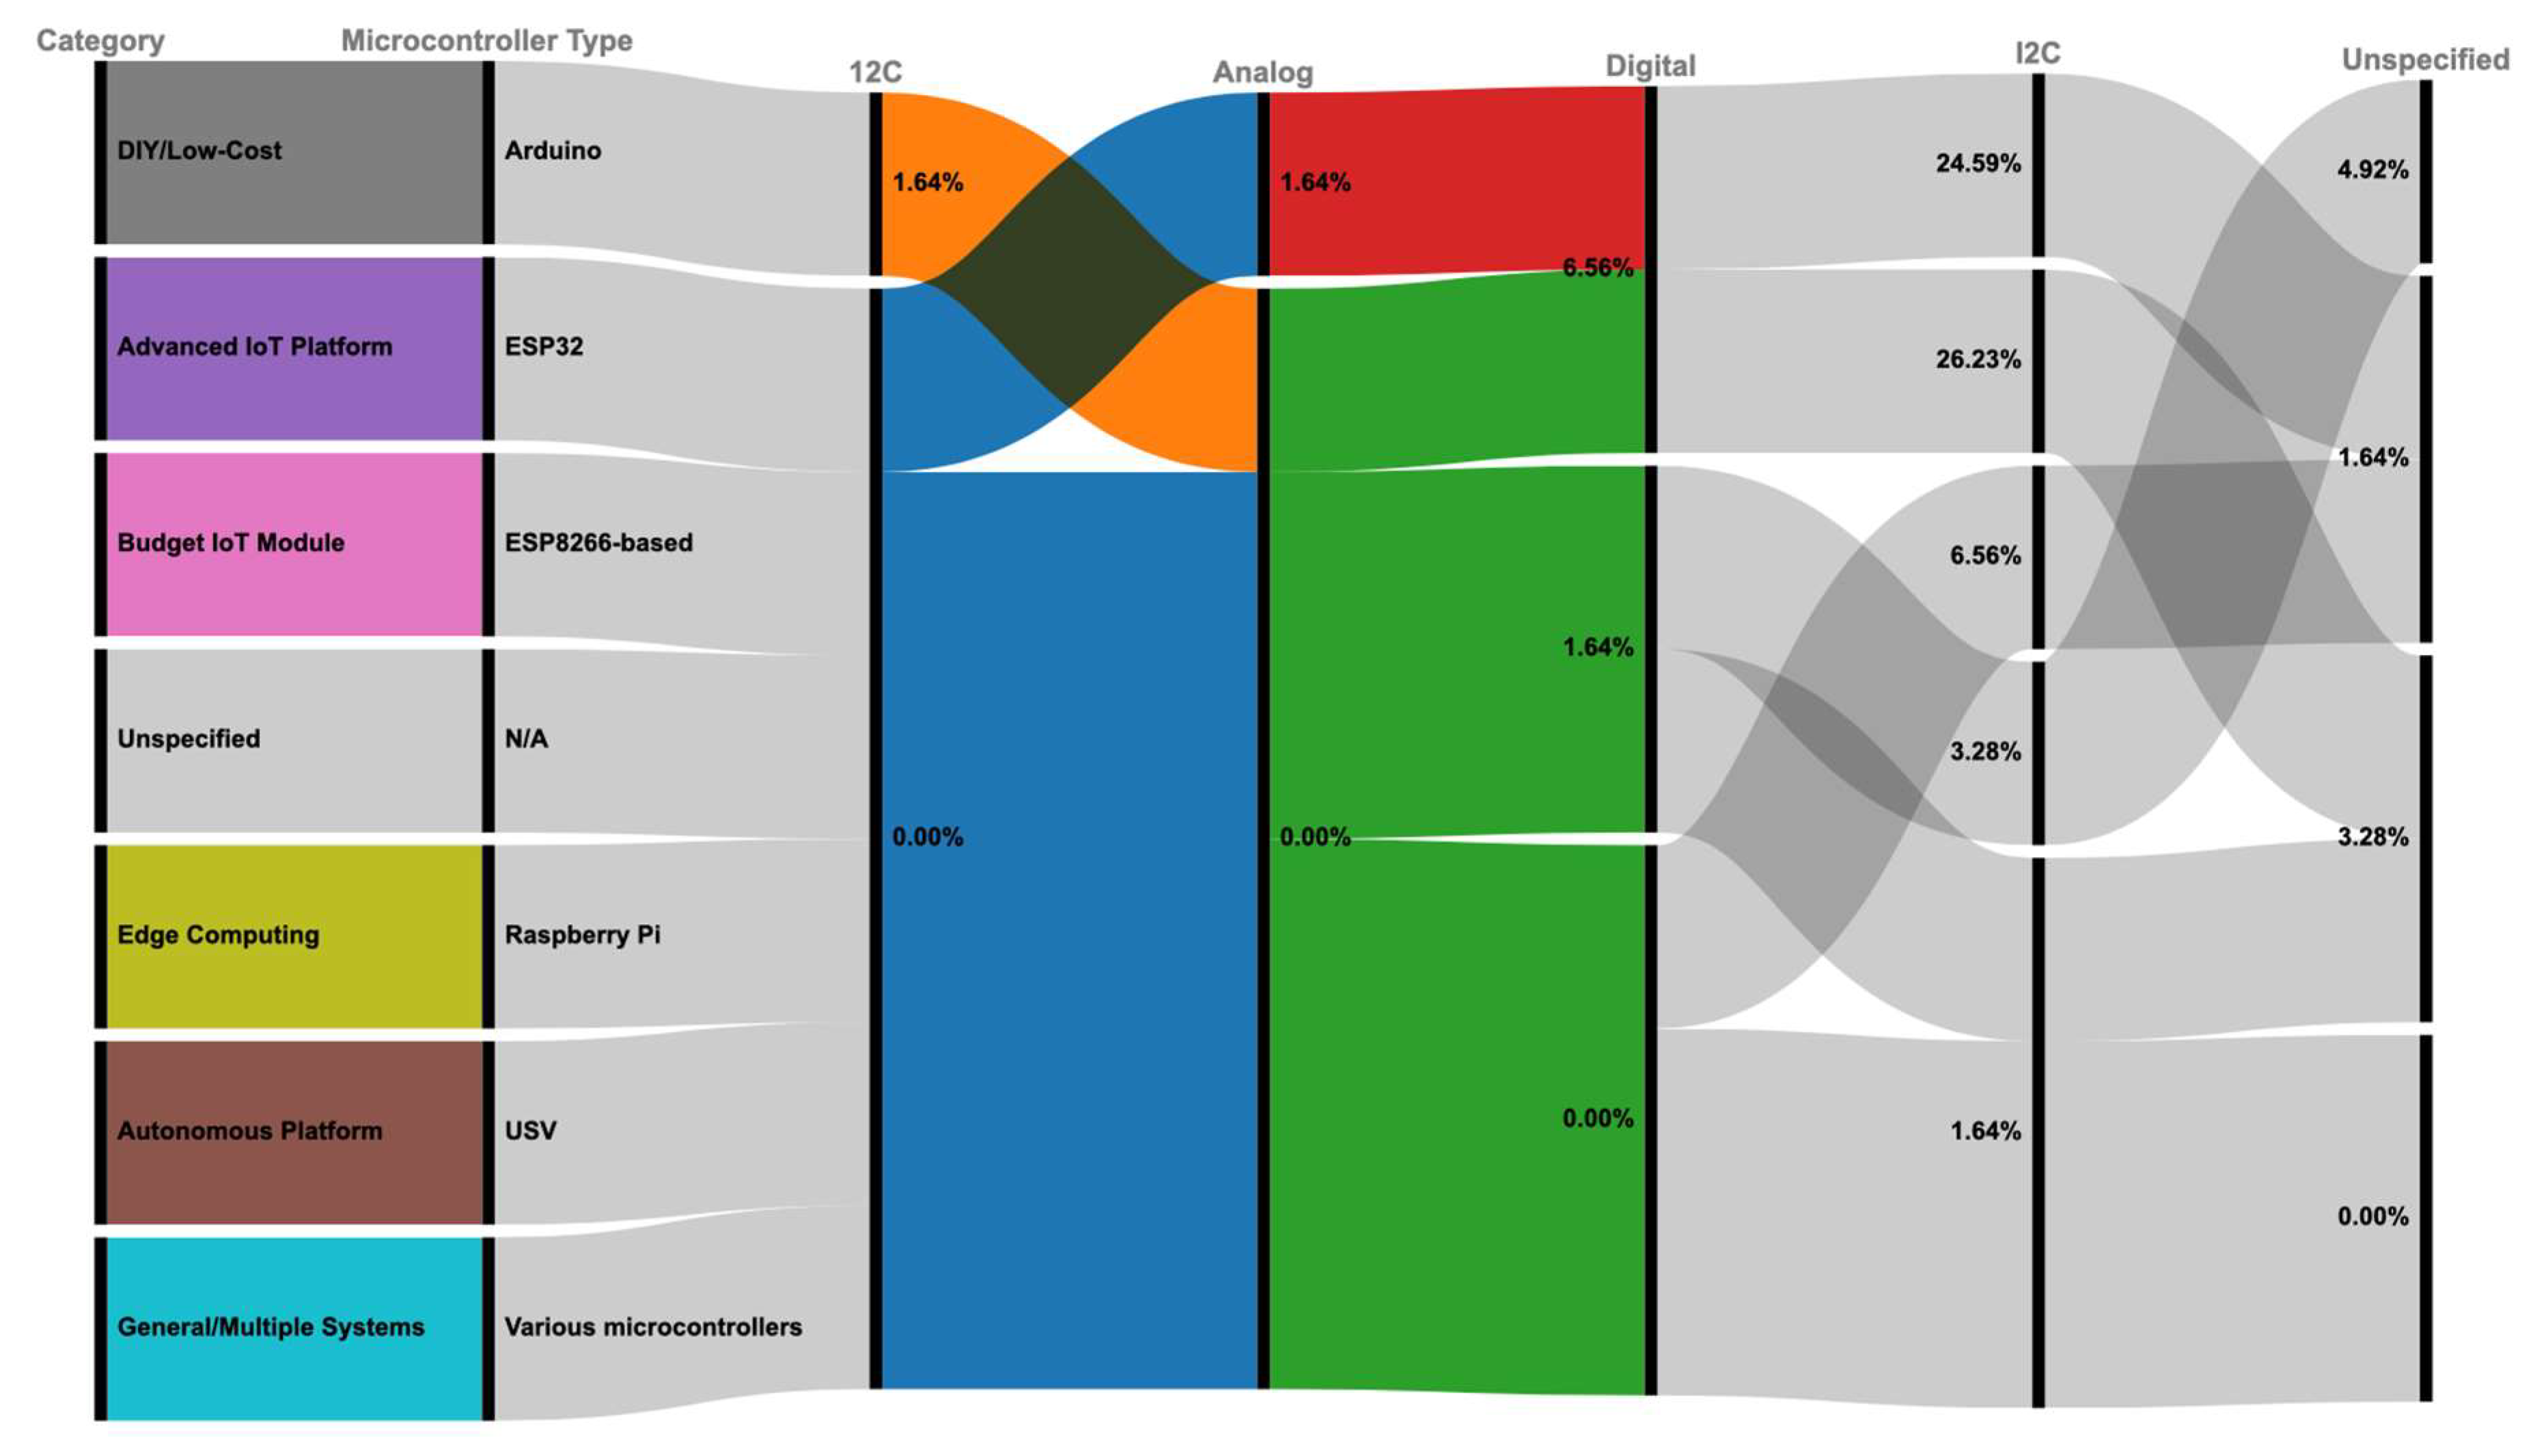
Figure 15.
Sensor Manufacturer Representation in Reviewed Studies.
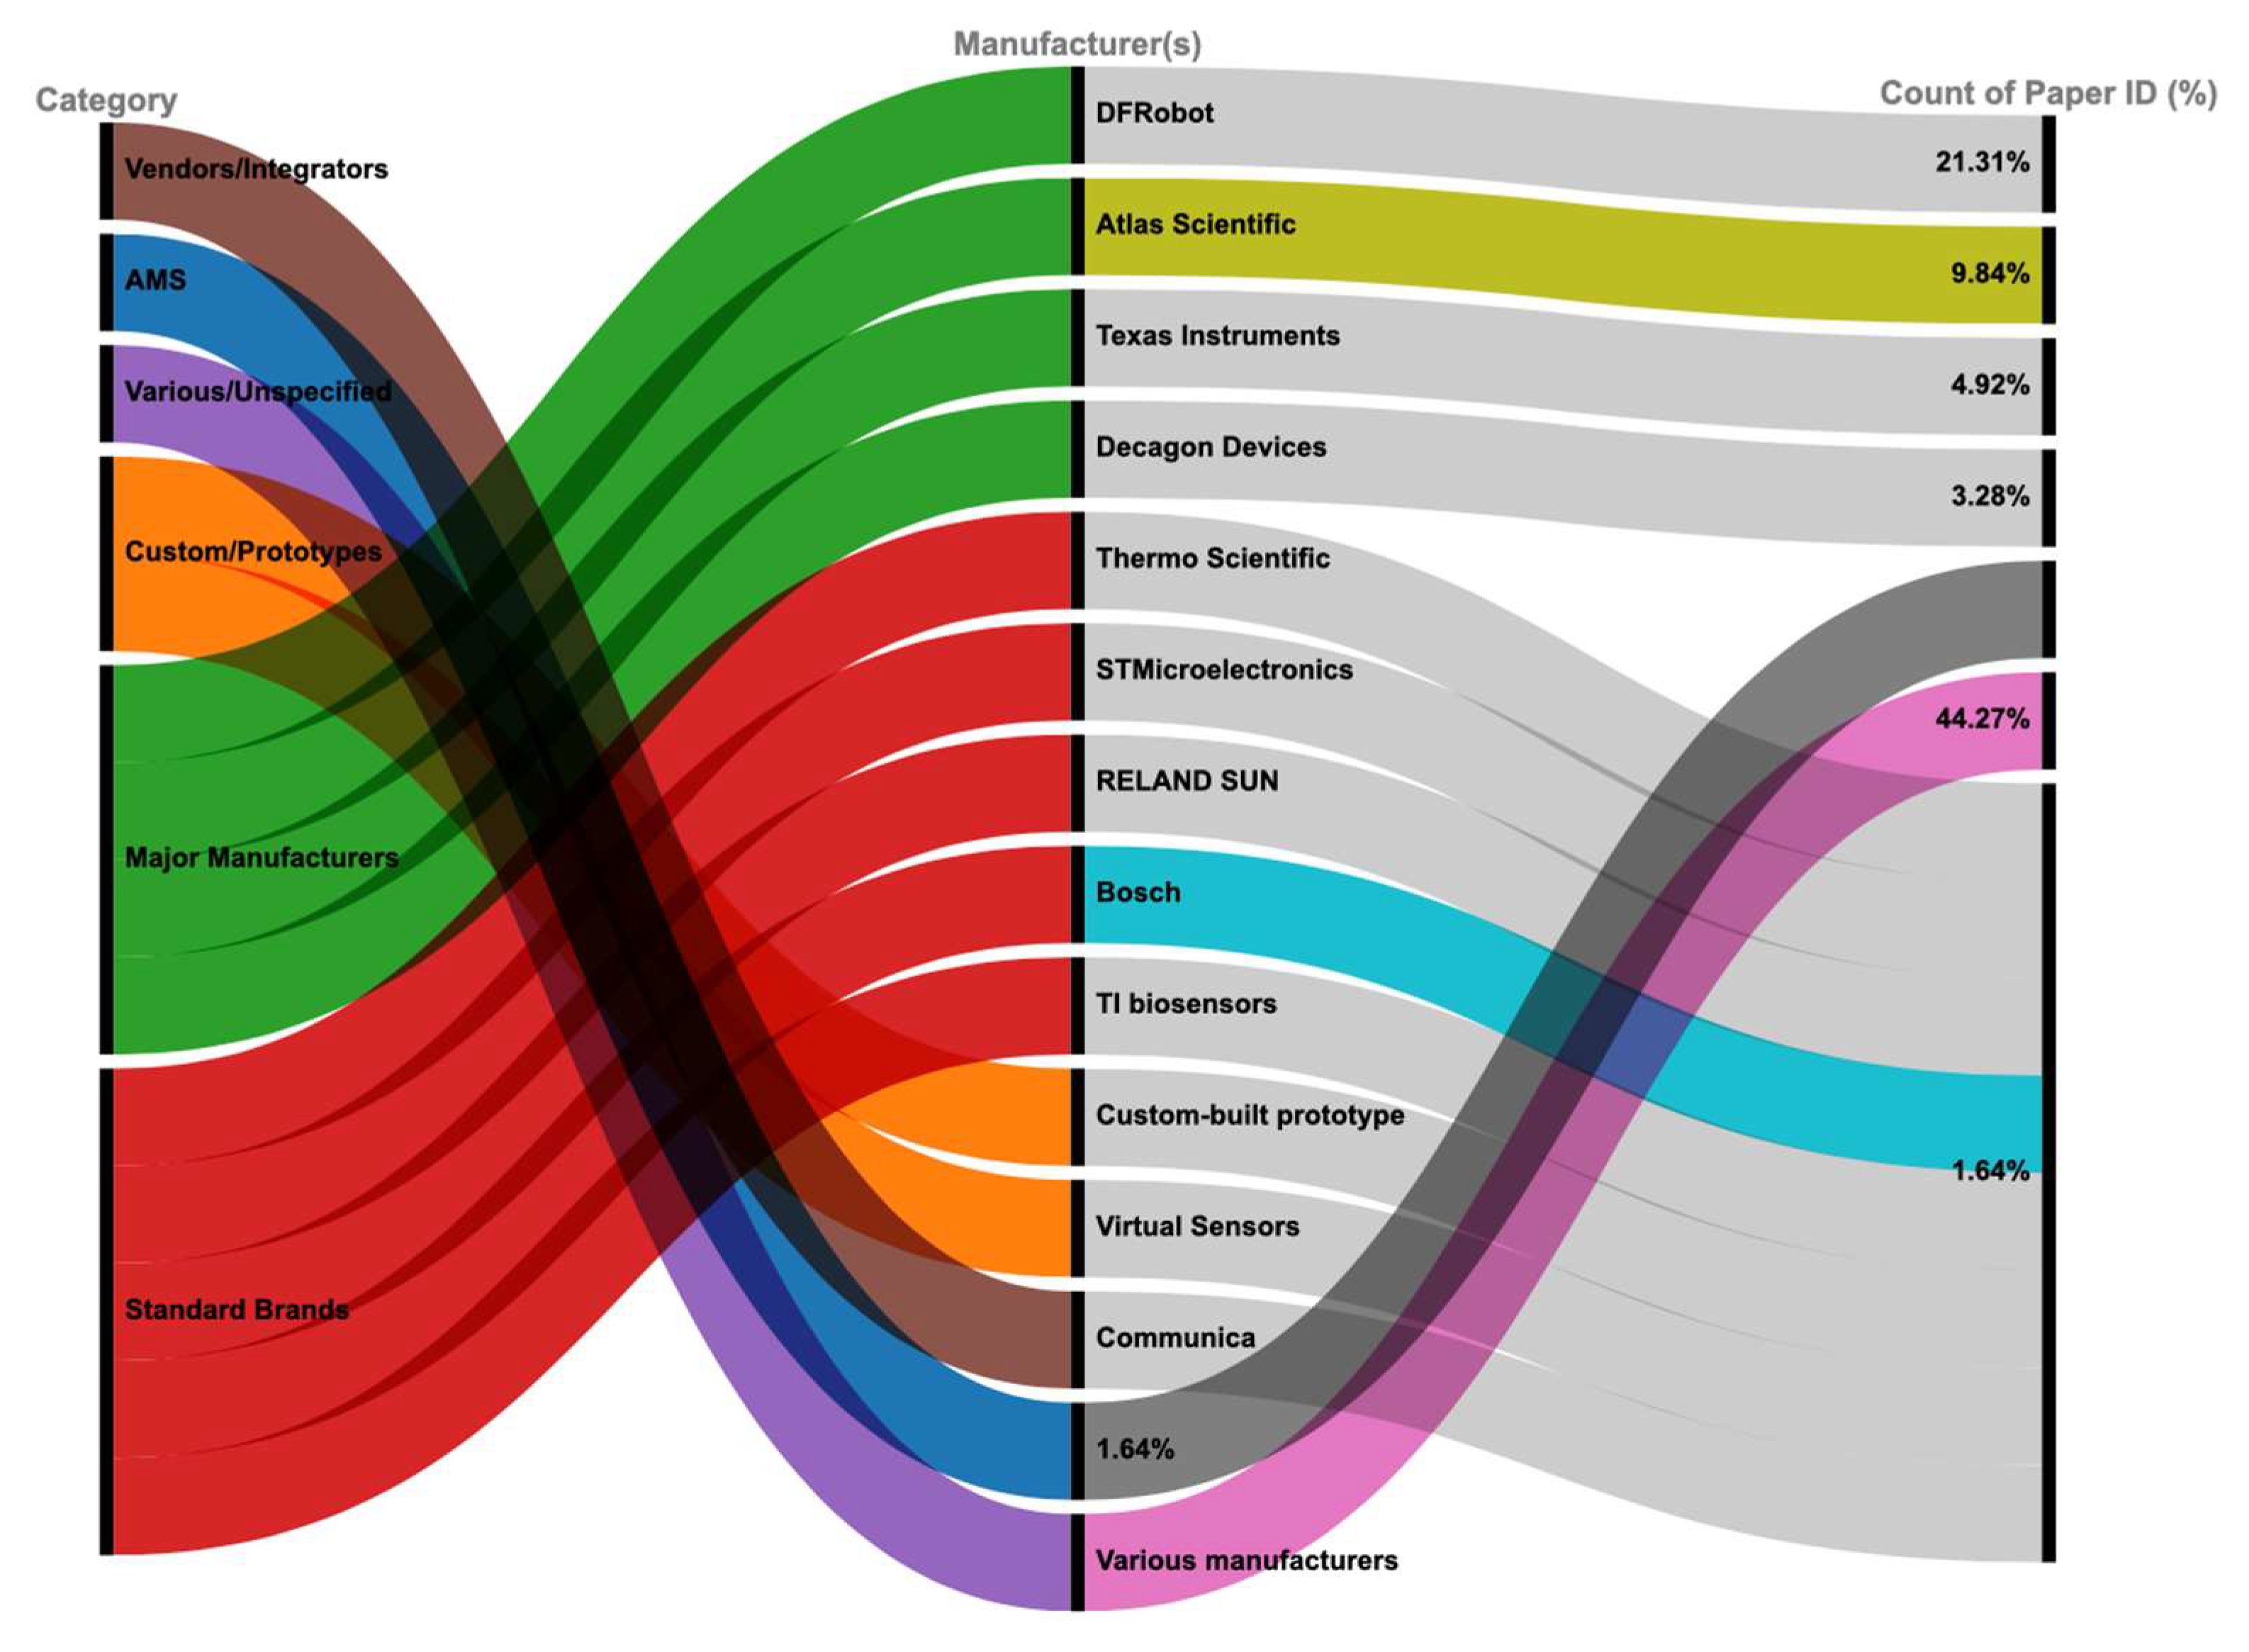
Figure 16.
Cost Distribution by Sensor Type.
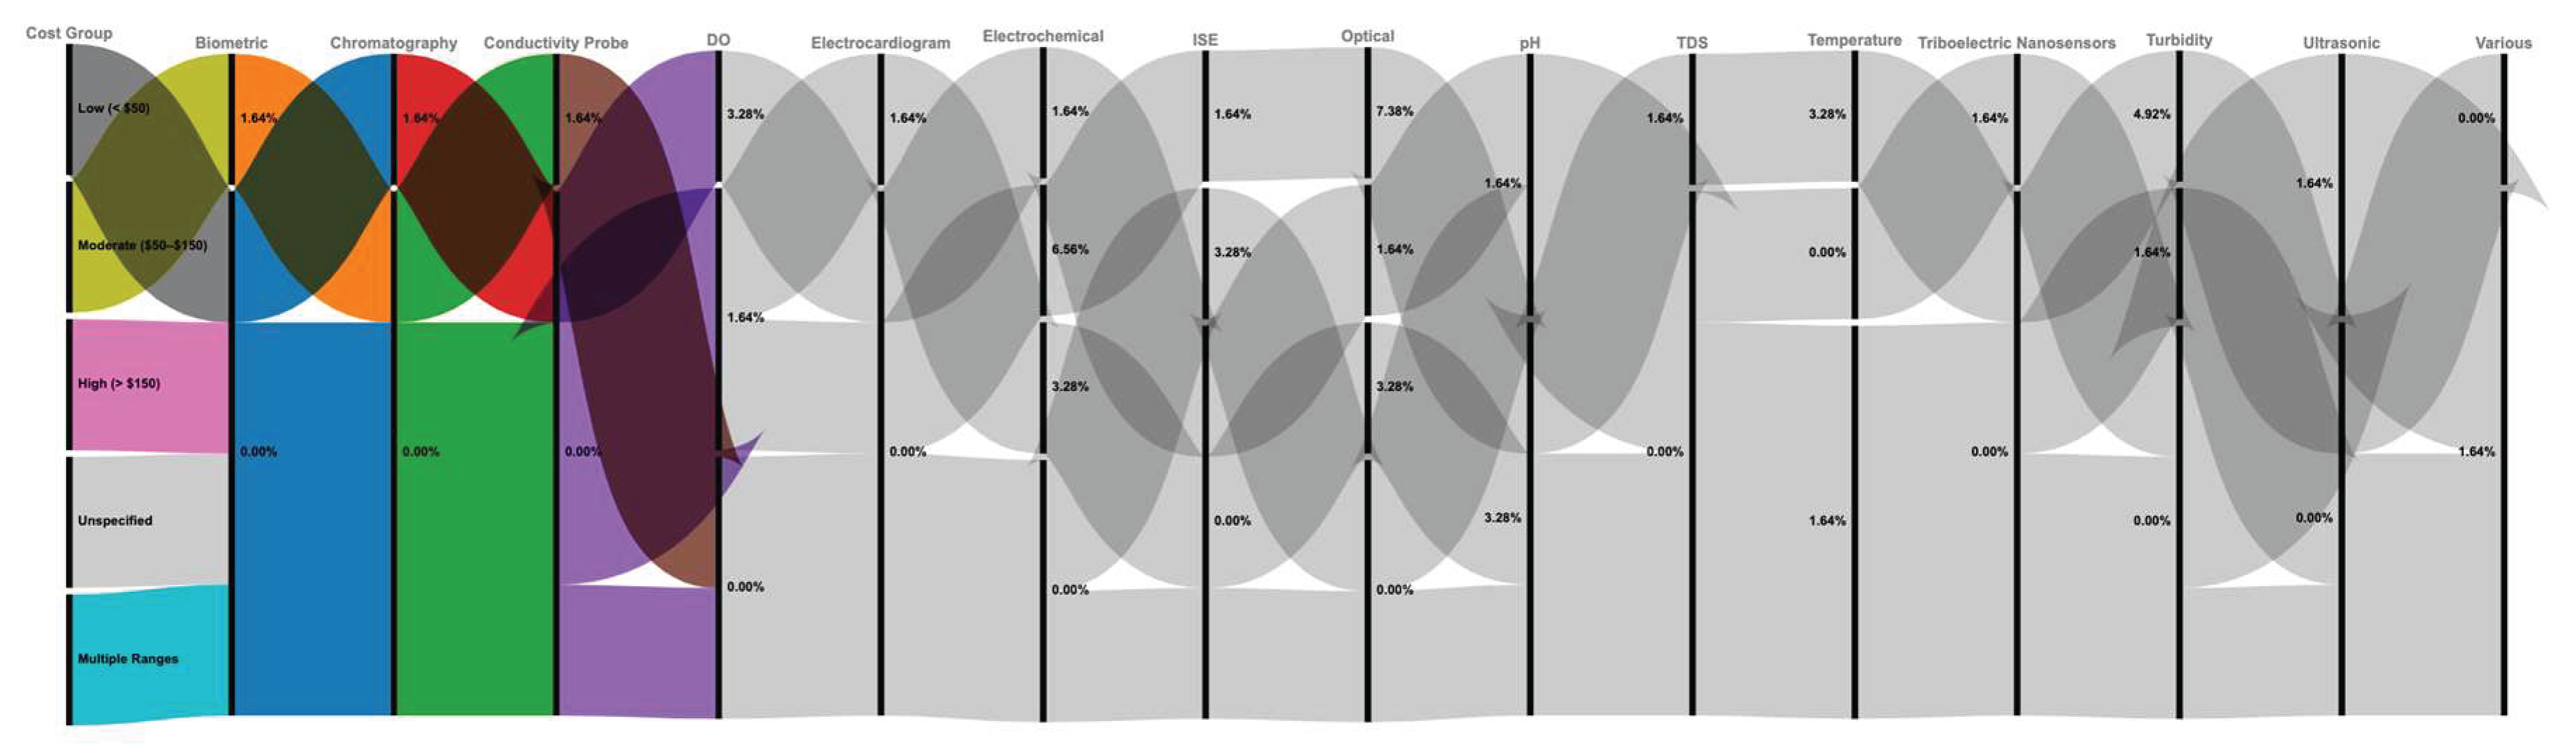
Table 1.
Comparative Analysis of Existing Review Works and Proposed Systematic Review on IoT Sensors for Aquatic Ecosystem Monitoring.
Table 1.
Comparative Analysis of Existing Review Works and Proposed Systematic Review on IoT Sensors for Aquatic Ecosystem Monitoring.
| Ref. | Contributions | Strengths | Limitations |
|---|---|---|---|
| Zainurin et al., 2022 | Provides a comprehensive comparison of physical, chemical, and biological sensing technologies, highlighting advances in biosensors and their practical field applications | Strong practical focus; addresses underwater deployment challenges | Primarily analyses chemical parameters; limited biological health tracking |
| Essamlali et al., 2024 | Highlights the synergy between IoT and machine learning for real-time, predictive water quality monitoring with emphasis on automated anomaly detection | Comprehensive coverage of IoT architectures; identifies trends in sensor integration | Broad scope with minimal focus on biological indicators |
| Singh & Ahmed, 2021 | Maps the evolution of smart water management frameworks, showcasing integration of cloud platforms and data analytics in IoT-based monitoring. | Covers diverse sensor types; recent technological trends included | Biological sensing discussed briefly without detailed analysis |
| Sohrabi et al., 2021 | Reviews recent innovations in portable biosensors, focusing on miniaturization and multi-analyte detection for on-site water analysis | Highlights innovative technologies (biosensors, nanotechnology) | Emphasizes pollutant detection over ecological biological indicators |
| Carriazo-Regino,2022 | Emphasizes real-time IoT monitoring of potable water with analysis of sensor accuracy, latency, and communication protocols. | Thorough technical review; focuses on real-time monitoring systems | Drinking water focus limits application to natural aquatic ecosystems |
| Ubina & Cheng, 2022 | Discusses unmanned vehicles for aquaculture data collection, offering insights into mobility, energy efficiency, and deployment scalability | Updates practical deployments; highlights sensor limitations and field conditions | Emphasis remains mainly on physicochemical parameters; limited biological monitoring |
| Mandal & Ghosh, 2024 | Analyses AI-driven techniques for monitoring fish growth and health, highlighting applications of computer vision and machine learning in sustainable aquaculture | Strong focus on predictive analytics; AI/ML integration for better farm management | Mainly addresses aquaculture productivity, not natural ecosystem biodiversity |
| Gladju Kamalam & Kanagaraj, 2022 | Outlines how machine learning and data mining frameworks optimize yield prediction and disease management in aquaculture and fisheries | Reinforces real-time control advantages; discusses system optimization techniques | Narrowly focused on commercial aquaculture; biological ecosystem factors largely omitted |
| Prapti et al., 2022 | Reviews IoT integration for aquaculture water monitoring, exploring sensor deployment models, data transmission, and practical case studies | Details specific case studies and sensor performance evaluations | Limited generalization to wild or unmanaged aquatic ecosystems |
| Mustapha, 2021 | Summarizes various AI methods used in aquaculture, identifying trends and research gaps in automation and system optimization. | Bridges AI and IoT for smarter aquaculture systems; explores intelligent environmental sensing | Targets productivity and operational efficiency; less focus on biological diversity indicators |
| Proposed Review | Synthesizes 61 studies (2015–2025) on IoT sensors for biological indicators. | Covers sensor types, costs, AI integration, and equity gaps. | Focuses on peer-reviewed studies; excludes gray literature. |
Table 2.
Proposed Inclusion and Exclusion Criteria.
| Criteria | Inclusion | Exclusion |
|---|---|---|
| Topic | Studies focusing on the application of IoT sensors for monitoring biological indicators in aquatic ecosystems | Studies not addressing biological monitoring or those focused only on physical/chemical parameters |
| Research Framework | Studies that include a clear methodology for applying IoT sensors to biological monitoring | Studies lacking methodological relevance to IoT-based biological monitoring |
| Language | English-language publications only | Non-English language publications |
| Publication Period | Studies published between 2015 and 2025 | Studies published outside of this date range |
Table 3.
Results Achieved from Literature Search.
| No. | Online Repository | Number of results |
|---|---|---|
| 1 | Google Scholar | 6550 |
| 2 | Web of Science | 207 |
| 3 | Scopus | 854 |
| Total | 7611 |
Table 4.
Key Data Extraction Fields for Systematic Review on IoT-Based Water Monitoring Systems.
| Field | Description |
|---|---|
| Study characteristics | Geographic location, type of water body, scope of environmental concern, and research setting urban, rural, industrial. |
| Participant characteristics | Details about IoT technologies used, including sensor types, network protocols, power supply, and deployment models. |
| Intervention characteristics | Information on biological parameters monitored, such as microbial counts, algal concentrations, aquatic biodiversity indices, and oxygen levels. |
| Economic factors | Cost of system implementation, maintenance expenses, data storage infrastructure, and analysis of cost-effectiveness or return on environmental outcomes. |
| External influences | Local environmental policies, pollution control regulations, climate conditions, and external stressors impacting water quality and system performance. |
Table 5.
Certainty Assessment Results for Collected Literature on IoT Sensor Applications in Water Quality Monitoring.
Table 5.
Certainty Assessment Results for Collected Literature on IoT Sensor Applications in Water Quality Monitoring.
| Ref. | QA1 | QA2 | QA3 | QA4 | QA5 | Total | % grading |
|---|---|---|---|---|---|---|---|
| (Anani et al., 2022), (Koo et al., 2015), (Vasudevan & Baskaran, 2021), (Habibzadeh et al., 2017), (Trevathan et al., 2021) | 1 | 0 | 0.5 | 0 | 1 | 2.5 | 50 |
| (Bárta et al., 2018), (Wang et al., 2021), (Saha et al., 2017), (Chaczko et al., 2018) | 0.5 | 0.5 | 0.5 | 0.5 | 1 | 3 | 60 |
| (Sheng et al., 2015), (Pattanayak et al., 2020), (Izah, 2025), (Hong et al., 2021), (Zulkarnain & Pramudita, 2022), (Wu et al., 2017), (Memon et al., 2020), (Yadav et al., 2017), (Mezni et al., 2022), (Swartz et al., 2023) | 1 | 0.5 | 0.5 | 1 | 0.5 | 3.5 | 70 |
| (Das et al., 2025), (Popović et al., 2016), (Okpara et al., 2022), (Zukeram et al., 2023), (Lal et al., 2024), (Sugiharto et al., 2023), (Pearce, 2018), (Chen et al., 2022), (Dhinakaran et al., 2023), (Dubey et al., 2025), (Bragg, 2017), (Gambín et al., 2021), (Abuzeid et al., 2023), (Krishnan & Giwa, 2025), (Singh & Jasuja, 2017), (Perumal et al., 2015), (Anupama et al., 2020), (Tsai et al., 2022) | 1 | 0.5 | 1 | 1 | 0.5 | 4 | 80 |
| (Monea, 2024), (Singh et al., 2016) , (Kumar & Aravindh, 2020), (Cennamo et al., 2020), (Hong et al., 2021), (Hemdan et al., 2023), (Pandey et al., 2024), (Kumar et al., 2024), (Islam et al., 2023), (Kim et al., 2024) , (Singh et al., 2022), (Olanubi et al., 2024), (Arepalli & Naik, 2025), (Chen et al., 2023), (Aira et al., 2022), (Zulkarnain & Pramudita, 2022) | 1 | 1 | 1 | 1 | 0.5 | 4.5 | 90 |
| (Sugiharto et al., 2024), (Ighalo et al., 2021), (Gallemit, 2023), (Sugiharto et al., 2023), Lal et al., 2024) , (Chaczko et al., 2018), (Vasudevan & Baskaran, 2021), (Singh et al., 2016), (Koo et al., 2015), (Memon et al., 2020), (Swartz et al., 2023), (Habibzadeh et al., 2017), (Wu et al., 2017), (Zukeram et al., 2023) (Cennamo et al., 2020), (Bárta et al., 2018), (Hong et al., 2021), (Krishnan & Giwa, 2025), (Mezni et al., 2022), (Pearce, 2018), (Gambín et al., 2021), (Chen et al., 2022), (Zulkarnain & Pramudita, 2022), (Perumal et al., 2015), (Das et al., 2025), (Olanubi et al., 2024), (Tsai et al., 2022), (Sheng et al., 2015), (Bragg, 2017), (Popović et al., 2016), (Singh & Jasuja, 2017), (Hong et al., 2021), (Anupama et al., 2020), (Saha et al., 2017), (Pattanayak et al., 2020), (Monea, 2024), (Kim et al., 2024) |
1 | 1 | 1 | 1 | 1 | 5 | 100 |
Table 6.
Summary of Findings for the Impact of IoT Sensors on Monitoring Biological Indicators in Aquatic Ecosystems.
Table 6.
Summary of Findings for the Impact of IoT Sensors on Monitoring Biological Indicators in Aquatic Ecosystems.
| Outcome | Certainty of Evidence | Effect Estimate | Interpretation |
| Cost-effectiveness of IoT sensors | Low | 25% cost savings with moderate-accuracy sensors | High-accuracy increases cost; moderate sensors save costs |
| Accuracy of biological indicator detection | Moderate | 20–30% improvement over manual methods | Enhances monitoring precision |
| Sensor reliability in aquatic environments | Low | 15% performance drop in turbid/saline waters | Environmental interference requires robust sensor design |
| Data transmission efficiency | Moderate | 85–90% success over 1–5 km | Reliable for mid-range aquatic deployments |
| Range of biological indicators monitored | High | 5+ indicators monitored | Supports comprehensive ecosystem health assessments |
| Ease of deployment & maintenance | Moderate | 40% deployment time reduction; maintenance every 2–3 months | Improved usability in fieldwork |
| Integration with analytics platforms | Moderate | 70% of studies use cloud/edge analytics | Enables real-time data analysis and management |
| Applicability across aquatic ecosystems | High | Deployed in 6+ countries across lakes, rivers, coasts | Demonstrates scalability and relevance |
Disclaimer/Publisher’s Note: The statements, opinions and data contained in all publications are solely those of the individual author(s) and contributor(s) and not of MDPI and/or the editor(s). MDPI and/or the editor(s) disclaim responsibility for any injury to people or property resulting from any ideas, methods, instructions or products referred to in the content. |
© 2025 by the authors. Licensee MDPI, Basel, Switzerland. This article is an open access article distributed under the terms and conditions of the Creative Commons Attribution (CC BY) license (http://creativecommons.org/licenses/by/4.0/).
Copyright: This open access article is published under a Creative Commons CC BY 4.0 license, which permit the free download, distribution, and reuse, provided that the author and preprint are cited in any reuse.


