Submitted:
28 May 2025
Posted:
29 May 2025
Read the latest preprint version here
Abstract
In this paper, a kernel Extreme Learning Machine (KELM) model based on vector weighted average algorithm is proposed for the prediction of national tax revenue ratio, which provides a new way of thinking and method for tax revenue prediction. By analyzing the correlation between each index and tax share, it is found that gasoline price and life expectancy are significantly positively correlated with tax share, while fertility rate and birth rate are significantly negatively correlated. The model shows excellent predictive performance on both training set and test set, with an R² of 0.995 in training set and 0.994 in test set, indicating that the model has excellent generalization ability. In addition, the root mean square error (RMSE) of the training set and the test set are 0.185 and 0.177, respectively, and the relative prediction deviation (RPD) is 14.234 and 13.178, respectively, which further verifies the high accuracy and stability of the model. Scatter plots of actual predicted versus actual values show that the model is able to accurately capture trends in tax shares with little prediction error. In summary, the optimized KELM model proposed in this paper not only has excellent performance on known data, but also has good expansion ability, and can be effectively applied to the tax share prediction of unknown data, providing a reliable tool for relevant policy making and economic analysis. The research of this paper provides a new technical path for the field of tax forecasting, which has important theoretical significance and practical value.
Keywords:
Vector weighted average algorithm
; Nuclear extreme learning machine
; Tax share forecast
1. Introduction
The ratio of tax revenue to GDP is an important indicator of a country's fiscal health and economic structure. As the main source of government financial revenue, taxation directly affects the provision of public services, the construction of infrastructure and the distribution of social welfare [1]. With the global economic integration and the complexity of national economic structure, the design and optimization of tax policy has become an important issue faced by governments. Studying the tax-to-GDP ratio not only helps to understand the fiscal capacity of different countries, but also provides data support for policymakers to assess the fairness and efficiency of tax policies [2]. In addition, this study can also reveal the relationship between tax revenue and economic growth, income distribution, and social welfare, and provide references for tax reform on a global scale [3].
Machine learning algorithms have played an important role in the study of countries' tax as a percentage of GDP. First of all, machine learning can process large-scale and multi-dimensional economic data, and identify key factors affecting the proportion of tax revenue through data mining technology [4], such as economic growth rate, industrial structure, population structure, etc. Second, machine learning models (such as regression analysis, decision trees, neural networks, etc.) can predict the impact of different tax policies on the proportion of GDP, helping policymakers model the effects of policies [5]. For example, through time series analysis and clustering algorithm, researchers can identify the similarities and differences of tax patterns in different countries, thus providing scientific basis for international comparison of tax policies [6]. In addition, machine learning can also analyze policy texts through natural language processing technology, extract key features of tax policies, and provide suggestions for policy optimization [7].
Tax research is of great strategic significance to the country. First of all, a reasonable tax policy can promote sustainable economic development [8]. By adjusting the tax ratio, the government can strike a balance between economic growth and social equity. Secondly, tax research helps to optimize resource allocation, improve the efficiency of financial funds, and thus improve the quality of public services. For example, by analyzing the ratio of tax revenue to GDP, the government can identify areas where the tax burden is too heavy or too light and adjust the structure of the tax system. In addition, tax research can enhance a country's international competitiveness, improve its tax system, attract foreign investment and promote international trade by learning from the successful experience of other countries [9]. In short, tax research is not only an important tool for financial management, but also a key support for achieving the long-term development goals of the country. In this paper, the kernel extreme learning machine algorithm is optimized based on vector weighted average algorithm, which provides a new idea and method for tax share prediction.
2. Data Set Sources and Data Analysis
We chose to experiment with a classic open source data set in the field of taxation, which has been extensively validated to verify the predictive power of machine learning algorithms. This dataset contains a number of annual economic indicators of many countries, such as population, unemployment rate, birth rate, higher education enrollment rate, urban population, latitude and more than a dozen other indicators, which can be used to analyze the correlation between various indicators and the tax proportion, and then use machine learning algorithms to predict the tax proportion [10]. This dataset is collected from 2023 and covers national tax data from all over the world, totalling 187 entries. Due to limited space, we select some indicators for presentation, and some open source data sets are shown in Table 1.
Pearson correlation analysis method is used to explore the indicators that have the greatest correlation with the tax revenue proportion, output the correlation coefficients of each indicator and the tax revenue proportion, and rank them. The ranking of correlation coefficients is shown in Figure 1.
According to the ranking of correlation coefficients, the index most positively correlated with the tax share is gasoline price, followed by life expectancy, and the index negatively correlated with the tax share is fertility rate, followed by birth rate.
3. Method
3.1. Vector Weighted Average Algorithm
Vector weighted average algorithm is a method to calculate the average vector by the weighted sum of multiple vectors [11]. The core idea is to assign a weight to each vector, and the weight reflects the importance or contribution of the vector in the whole. By weighted average, the information of multiple vectors can be synthesized to obtain a more representative result [12].
The advantage of vector-weighted average algorithm lies in its flexibility and interpretability. By adjusting the weights, you can control the contribution of different vectors to the final result, thus adapting to different task requirements. For example, in natural language processing, weighted averages can be used for the representation of sentences or documents to improve the accuracy of semantic representations by assigning higher weights to important words. In the recommendation system, weighted average can be used to integrate the characteristics of multiple users or items to generate more accurate recommendation results [13].
3.2. Nuclear Extreme Learning Machine
Kernel Extreme Learning Machine (KELM) is a machine learning algorithm based on ELM and kernel method. ELM is a single hidden layer feedforward neural network (SLFN), its core idea is to randomly initialize the weight and bias from the input layer to the hidden layer, and directly calculate the weight from the hidden layer to the output layer through the least square method. ELM is extremely fast to train because it avoids the time-consuming backpropagation process in traditional neural networks. However, when ELM deals with nonlinear problems, the random initialization of hidden layer nodes may lead to unstable performance [14].
Kernel method can deal with nonlinear problems effectively by mapping data to high-dimensional feature space. Common kernel functions include radial basis function (RBF), polynomial kernel, etc [15]. KELM introduced the kernel method into the ELM framework to calculate the inner product in the high-dimensional feature space implicitly through the kernel function, thus avoiding the need for explicitly designing hidden layer nodes [16].
3.3. Vector Weighted Average Algorithm to Optimize the Kernel Extreme Learning Machine
Vector weighted average algorithm (VWA) is an ensemble learning method used to improve the performance of prediction models. When applied to the Kernel Extreme Learning Machine (KELM), the VWA generates the final prediction output by combining the predictions of multiple KELM models using a weighted average. The core idea of this method is to give different weights to different models and make full use of the advantages of each model to improve the accuracy and stability of the overall prediction [17].
In the VWA-KELM framework, you first need to train multiple KELM models. These models can be constructed with different kernel functions, parameter Settings, or subsets of data to increase the diversity of the model. Each KELM model makes an independent prediction of the input data and produces its own output. Next, the VWA algorithm assigns a weight to each model's prediction, which can be assigned based on the model's performance on the validation set, the model's confidence level, or other optimization strategies. Finally, the forecast results of all models are combined by a weighted average to generate the final forecast output [18]. This integrated approach can not only reduce the overfitting risk of a single model, but also effectively improve the generalization ability of the model.
The strength of VWA-KELM is its flexibility and robustness [19]. By introducing a weighted averaging mechanism, VWA-KELM is able to adaptively adjust the contributions of each model, thus showing greater stability in complex data distributions and noisy environments. In addition, VWA-KELM is computationally efficient because KELM itself trains and predicts faster, while the weighted average operation has a relatively small computational overhead [20].
4. Result
In terms of experimental parameter setting, the number of population is 20, the maximum number of iterations is 35, and the dimension of the optimization problem is 2, that is, C and S are optimized simultaneously. The lower and upper boundaries of the parameters are set to [1,1] and [50,50], respectively, and the objective function fobj calculates the fitness value by calling fun on the function handle. The final output of the best fitness value, the best parameter position and the fitness curve in the optimization process.
After the training, the scatterplot of the predicted value and actual value of the model on the training set is output, as shown in Figure 2. The scatterplot of the predicted value and actual value of the test set is output, as shown in Figure 3.
It can be seen from the predicted value and actual value scatter plots of the training set and the test set that the model can accurately predict the tax share, R2 of the training set is 0.995, R2 of the test set is 0.994, there is little difference between the R2 of the training set and the test set, indicating that the model has good generalization ability.
The scatter plot of the actual forecast results of the training concentration tax share is output, as shown in Figure 4. The scatter plot of the actual forecast results of the concentration tax share of the test is output, as shown in Figure 5.
According to the actual forecast results of the training set and the test set, it can be seen that this model can accurately predict the national tax share, and the error between the forecast value and the actual tax share is small. In addition, in terms of specific evaluation indicators, RMSE of training set is 0.185, RMSE of test set is 0.177, RPD of training set is 14.234, and RPD of test set is 13.178. The model shows good effect on test set, has good expansion ability, and can be applied to the prediction of tax share of unknown data.
5. Conclusion
In this paper, a new method of kernel extreme Learning machine (KELM) optimization based on vector weighted average algorithm is proposed and applied to tax revenue share prediction. By optimizing the regularization coefficient and kernel function parameters of KELM, the model can more accurately capture the complex relationship between the tax share and related indicators. The results show that the gasoline price is the most positively correlated index with the tax share, followed by the life expectancy; The fertility rate and birth rate showed a significant negative correlation with the tax share. These findings provide an important reference for understanding the factors affecting the tax share.
From the perspective of model performance, the scatterplot of the predicted and actual values of the training and test sets shows that the model can predict the tax share very accurately. The R² of the training set is 0.995, and the R² of the test set is 0.994. The difference between the two is very small, indicating that the model has excellent generalization ability and can adapt to unknown data well. In addition, the RMSE of the training set and the test set are 0.185 and 0.177, and the RPD of the test set are 14.234 and 13.178, respectively, which further verifies the high accuracy and stability of the model. These evaluation indicators show that the model not only performs well on the training data, but also shows strong predictive ability on the test data.
The method proposed in this paper not only performs well in tax share forecasting, but also provides a new way to solve similar economic index forecasting problems. By combining vector weighted average algorithm and kernel extreme learning machine, the model can deal with nonlinear relationship and high dimensional data effectively, and avoid overfitting problem. In the future, this method can be further extended to other economic and social fields to provide scientific support for policy making and decision analysis.
In short, the research in this paper not only provides an efficient and accurate model for the tax share forecast, but also provides an important methodological reference for the research in related fields, which has high theoretical value and practical application significance.
6. Discuss
The kernel extreme learning machine algorithm based on vector weighted average algorithm proposed in this paper performs well in tax revenue share prediction, with high prediction accuracy and good generalization ability. Through correlation coefficient analysis, we find that gasoline prices and life expectancy are significantly positively correlated with the tax share, while fertility and birth rates are negatively correlated. These findings provide a new perspective for understanding the factors affecting the tax share. The R2 values of the training set and the test set of the model are close to 1, and the RMSE and RPD indicators also show that the model has high accuracy and stability in predicting the tax share. This shows that the application of vector weighted average algorithm in the optimized kernel extreme learning machine algorithm is effective, and can better capture the complex relationship in the data, so as to achieve the accurate prediction of tax share.
In future studies, we will further explore and verify the applicability and robustness of this model in different economic environments and policy contexts. For example, consider introducing more macroeconomic indicators and socioeconomic variables to enhance the explanatory and predictive power of the model. In addition, the real-time updating and dynamic adjustment mechanism of the model is also an important direction of future research to adapt to the rapidly changing economic environment. At the same time, consider applying this model to the prediction of other economic indicators, such as GDP growth rate, unemployment rate, etc., to verify its wide applicability. Finally, the explainability and transparency of the model are also the focus of future research. By improving the explainability of the model, the policy making and decision-making process can be better supported.
References
- Köppl, A.; Schratzenstaller, M. Carbon taxation: A review of the empirical literature. Journal of Economic Surveys 2023, 37, 1353–1388. [Google Scholar] [CrossRef]
- Piketty, T.; Saez, E.; Zucman, G. Rethinking capital and wealth taxation. Oxford Review of Economic Policy 2023, 39, 575–591. [Google Scholar] [CrossRef]
- Jacob, M. Real effects of corporate taxation: A review. European Accounting Review 2022, 31, 269–296. [Google Scholar] [CrossRef]
- Guvenen, F.; et al. Use it or lose it: Efficiency and redistributional effects of wealth taxation. The Quarterly Journal of Economics 2023, 138, 835–894. [Google Scholar] [CrossRef]
- Delgado, F.J.; Freire-González, J.; Presno, M.J. Environmental taxation in the European Union: Are there common trends? Economic Analysis and Policy 2022, 73, 670–682. [Google Scholar] [CrossRef]
- Avi-Yonah, R.; Kim, Y.R.; Sam, K. A new framework for digital taxation. Harv. Int'l LJ 2022, 63, 279. [Google Scholar]
- World Health Organization. WHO manual on sugar-sweetened beverage taxation policies to promote healthy diets. World Health Organization, 2022.
- Bachas, Pierre, et al. Globalization and factor income taxation. No. w29819. National Bureau of Economic Research, 2022.
- Abigail, E.C. Unlocking Economic Growth Through Taxation in the case Nigeria. Journal of Business and Economic Options 2023, 6, 21–27. [Google Scholar]
- Andreyeva, T.; et al. Outcomes following taxation of sugar-sweetened beverages: a systematic review and meta-analysis. JAMA Network Open 2022, 5, e2215276–e2215276. [Google Scholar] [CrossRef] [PubMed]
- Ahmad, M.; Elma, S. "How do transportation-based environmental taxation and globalization contribute to ecological sustainability? Ecological Informatics 2023, 74, 102009. [Google Scholar] [CrossRef]
- Nchofoung, T.N.; Hervé, K.F.; Clovis, W.M. Green taxation and renewable energy technologies adoption: A global evidence. Renewable Energy Focus 2023, 44, 334–343. [Google Scholar] [CrossRef]
- Dray, Sacha, Camille Landais, and Stefanie Stantcheva. Wealth and property taxation in the United States. No. w31080. National Bureau of Economic Research, 2023.
- Saez, Emmanuel, and Gabriel Zucman. "Wealth taxation: lessons from history and recent developments." AEA Papers and Proceedings. Vol. 112. 2014 Broadway, Suite 305, Nashville, TN 37203: American Economic Association, 2022.
- Ganghof, Steffen. The politics of income taxation: A comparative analysis. ecpr Press, 2024.
- Hebous, S. ; Michael, Keen. Pareto-improving minimum corporate taxation. Journal of Public Economics 2023, 225, 104952. [Google Scholar]
- Paul, A.; et al. A green inventory model with the effect of carbon taxation. Annals of Operations Research 2022, 309, 233–248. [Google Scholar] [CrossRef]
- Paraje, G.R.; et al. Taxation of tobacco, alcohol, and sugar-sweetened beverages: reviewing the evidence and dispelling the myths. BMJ Global Health 2023, 8 Suppl 8, e011866. [Google Scholar] [CrossRef]
- Vishnevsky, V.P.; et al. The principles of taxation for digital economy. Terra Economicus 2022, 20, 59–71. [Google Scholar] [CrossRef]
- Máté, D.; László, T.; Judit, T.K. The impacts of energy supply and environmental taxation on carbon intensity. Technological and Economic Development of Economy 2023, 29, 1195–1215. [Google Scholar] [CrossRef]
Figure 1.
The ranking of correlation coefficients.
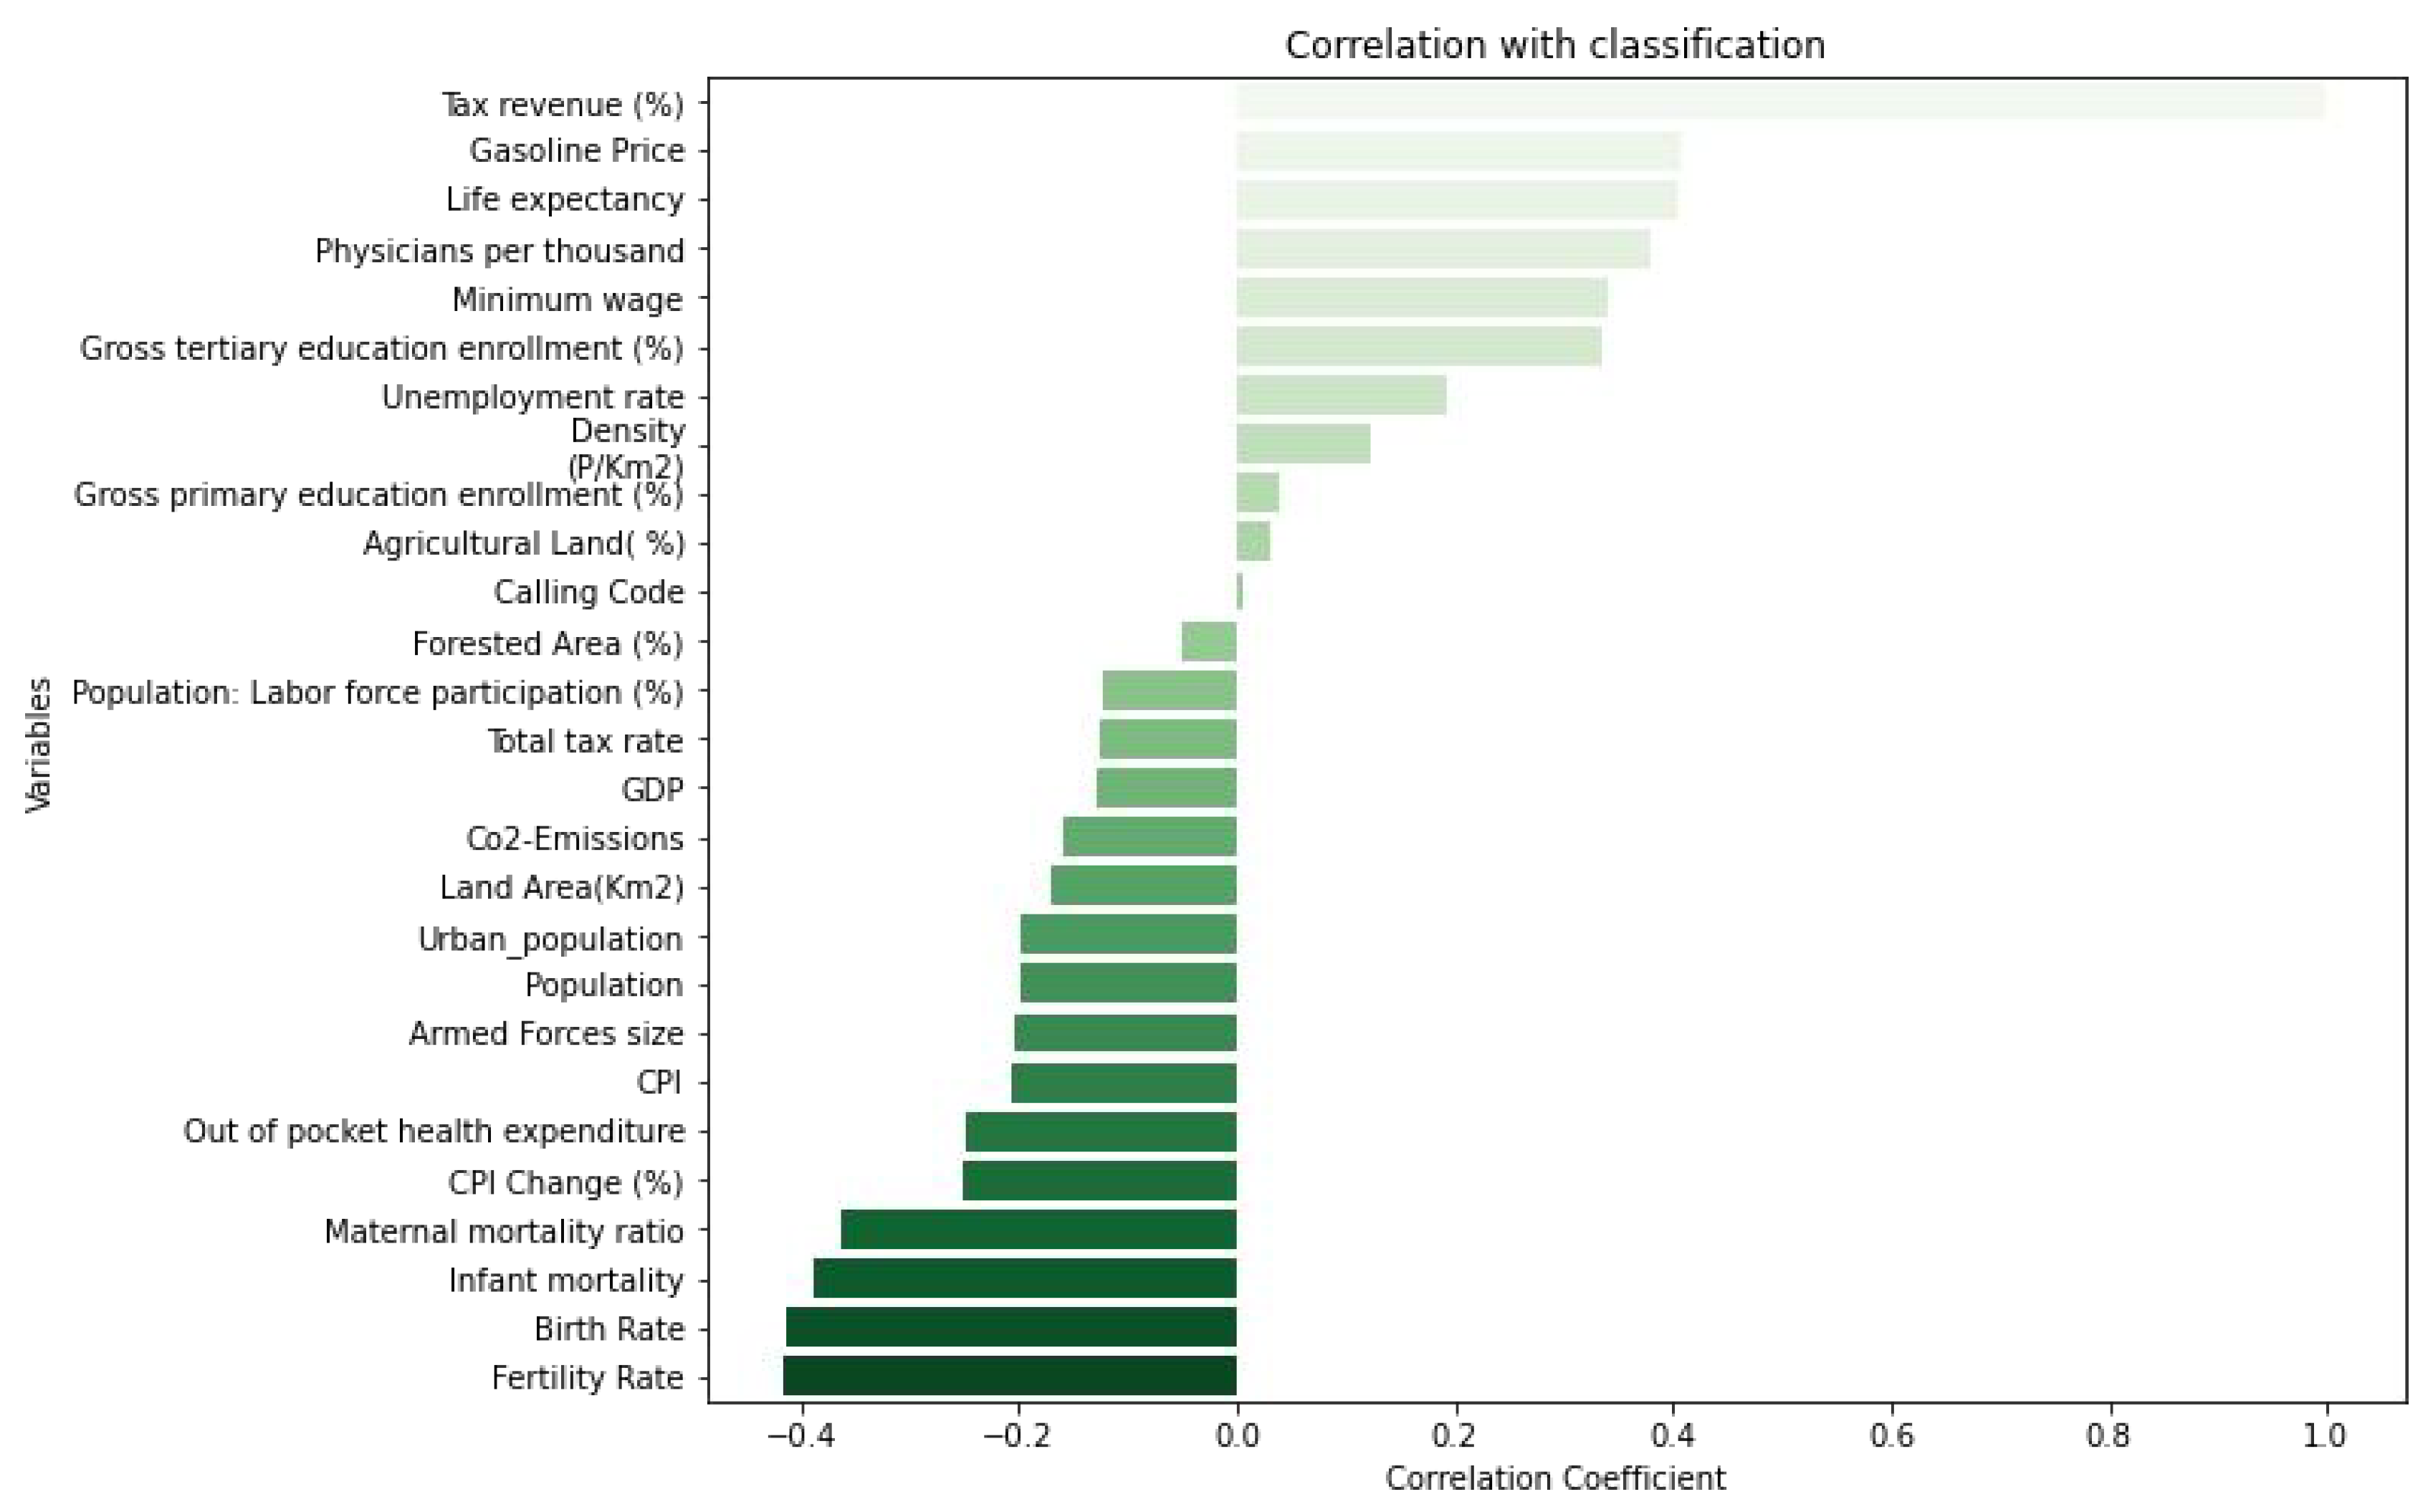
Figure 2.
The scatterplot of the predicted value and actual value of the model on the training set.
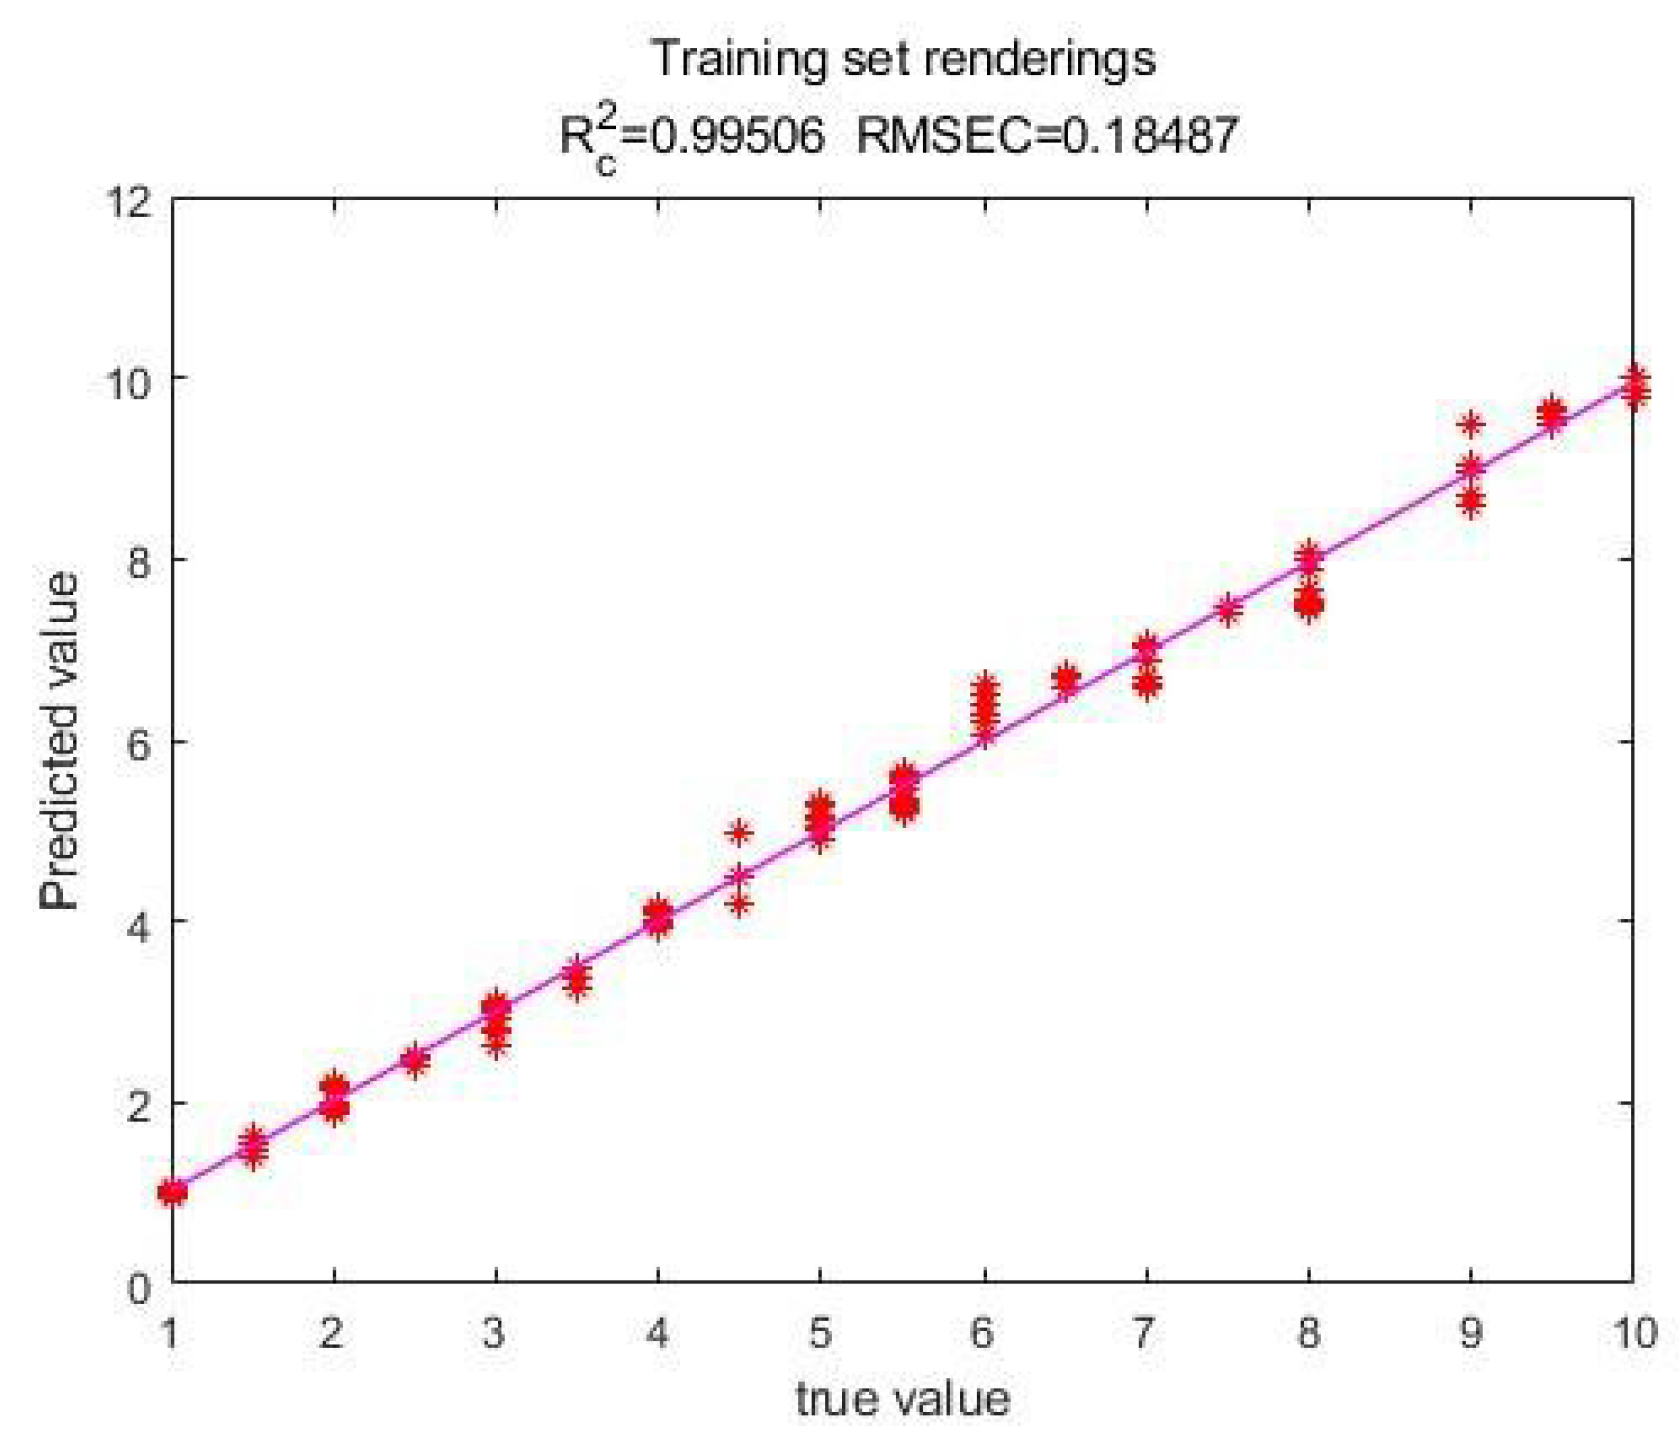
Figure 3.
The scatterplot of the predicted value and actual value of the test set.
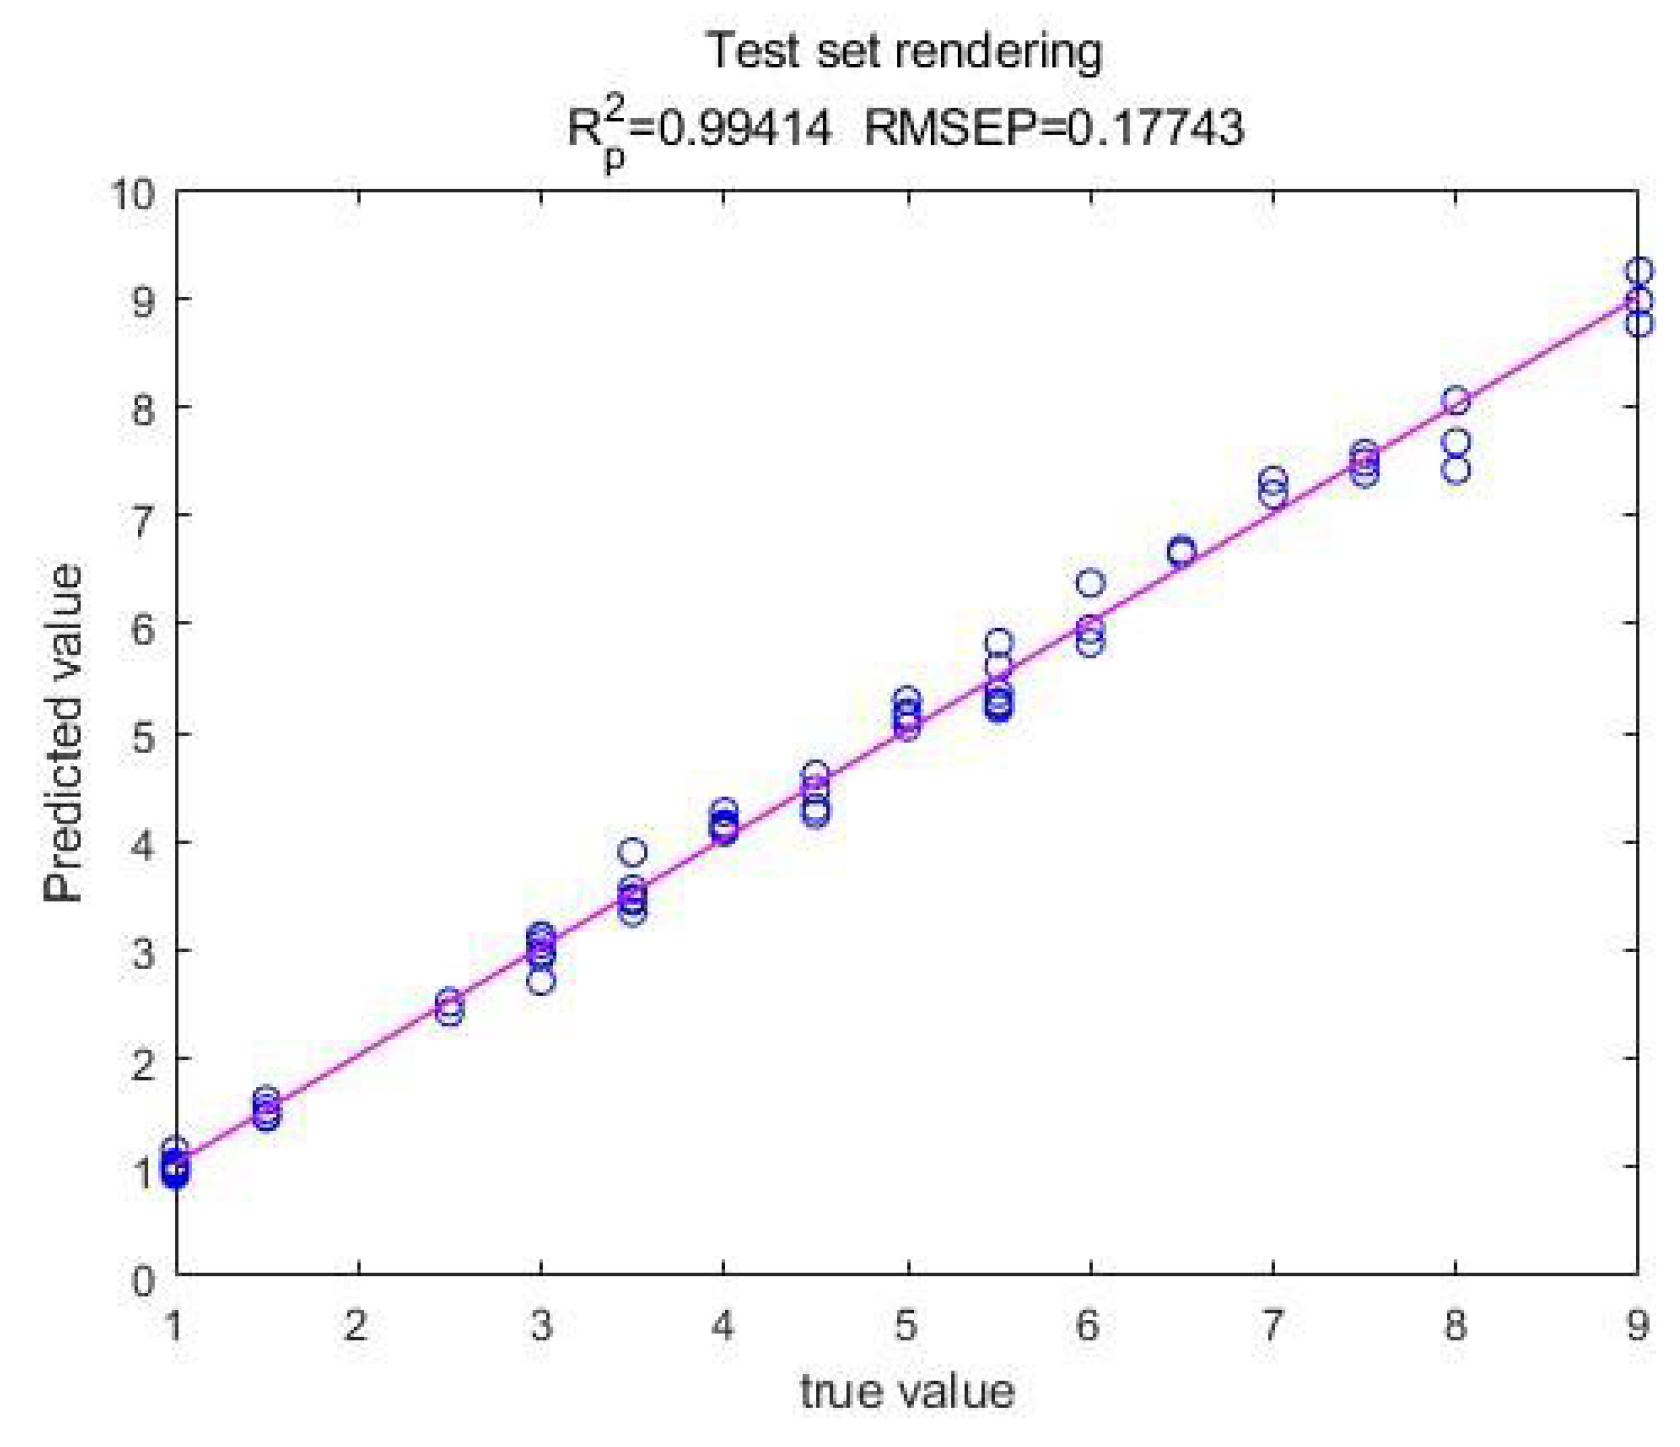
Figure 4.
The scatter plot of the actual forecast results of the training concentration tax share.
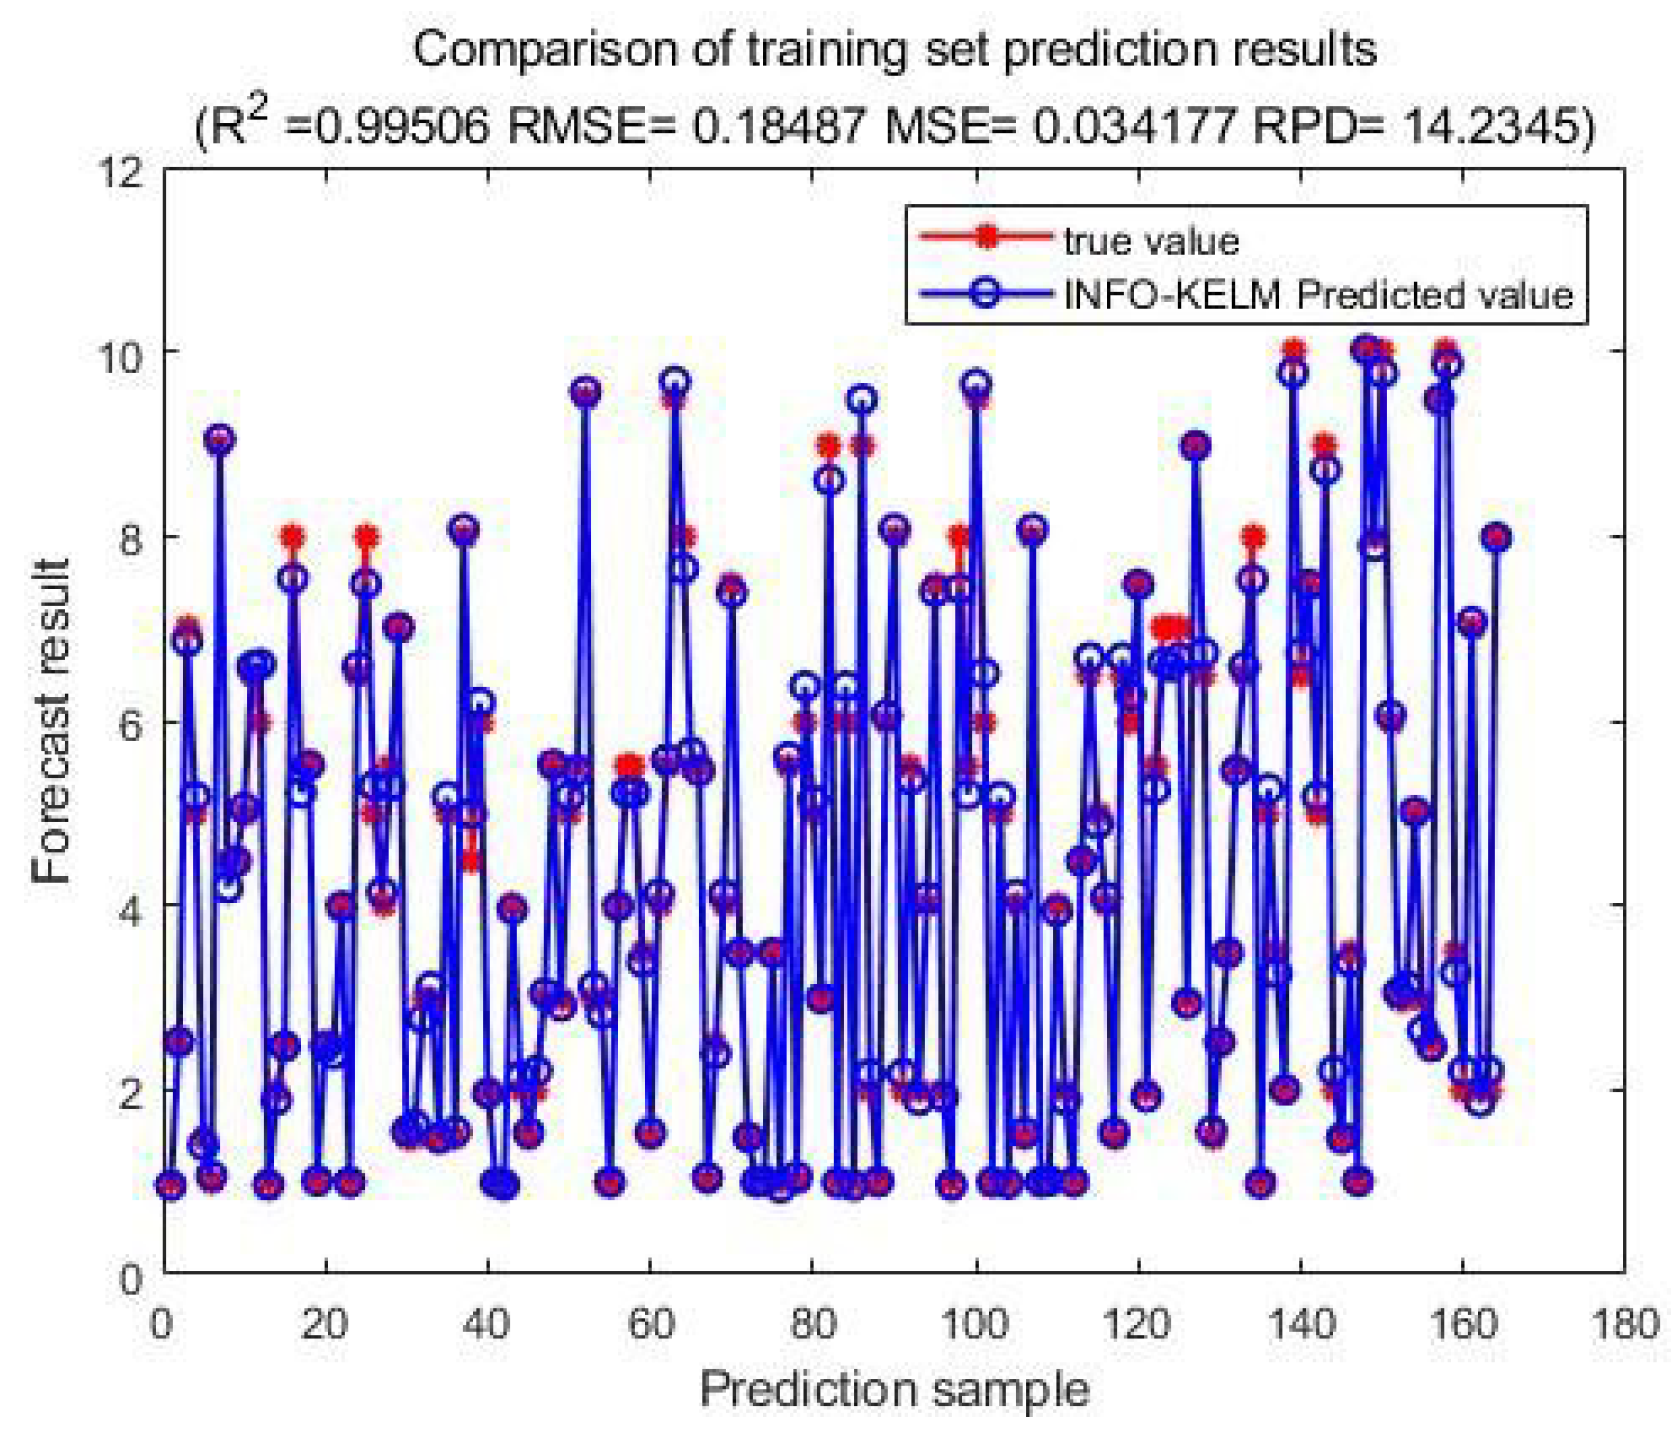
Figure 5.
The scatter plot of the actual forecast results of the concentration tax share.
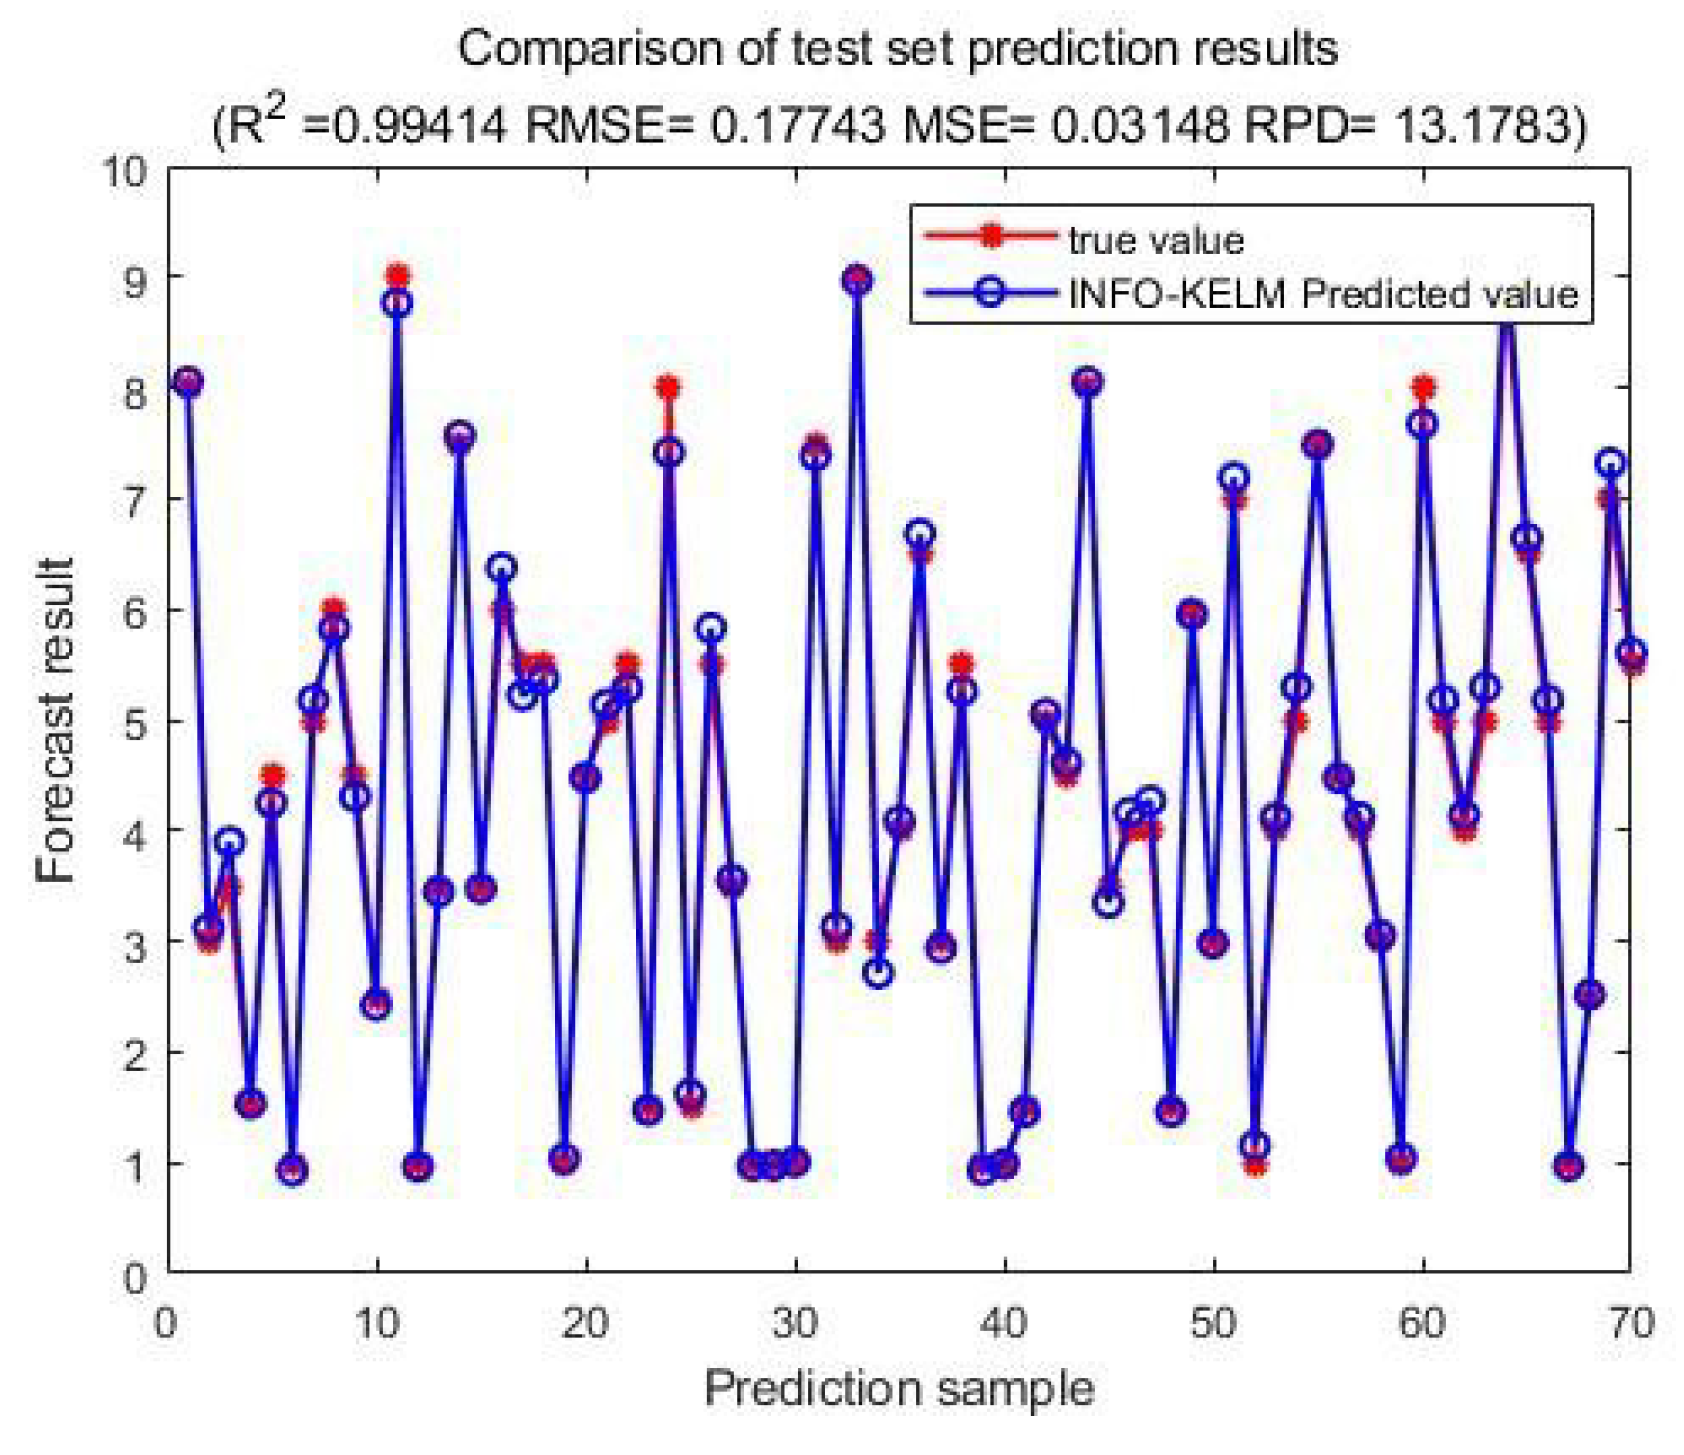

Table 1.
Partial data.
| Density (P/Km2) | Agricultural Land( %) | Birth Rate | Calling Code | Co2-Emissions | CPI |
|---|---|---|---|---|---|
| 60.00 | 0.58 | 32.49 | 93.00 | 8672.00 | 149.90 |
| 105.00 | 0.43 | 11.78 | 355.00 | 4536.00 | 119.05 |
| 18.00 | 0.17 | 24.28 | 213.00 | 150006.00 | 151.36 |
| 26.00 | 0.48 | 40.73 | 244.00 | 34693.00 | 261.73 |
| 17.00 | 0.54 | 17.02 | 54.00 | 201348.00 | 232.75 |
| 104.00 | 0.59 | 13.99 | 374.00 | 5156.00 | 129.18 |
| 3.00 | 0.48 | 12.60 | 61.00 | 375908.00 | 119.80 |
| 123.00 | 0.58 | 14.00 | 994.00 | 37620.00 | 156.32 |
| 39.00 | 0.01 | 13.97 | 1.00 | 1786.00 | 116.22 |
| 1265.00 | 0.71 | 18.18 | 880.00 | 84246.00 | 179.68 |
| 668.00 | 0.23 | 10.65 | 1.00 | 1276.00 | 134.09 |
| 383.00 | 0.45 | 10.30 | 32.00 | 96889.00 | 117.11 |
| 17.00 | 0.07 | 20.79 | 501.00 | 568.00 | 105.68 |
| 108.00 | 0.33 | 36.22 | 229.00 | 6476.00 | 110.71 |
| 20.00 | 0.14 | 17.26 | 975.00 | 1261.00 | 167.18 |
| 4.00 | 0.46 | 24.82 | 267.00 | 6340.00 | 149.75 |
| 25.00 | 0.34 | 13.92 | 55.00 | 462299.00 | 167.40 |
Disclaimer/Publisher’s Note: The statements, opinions and data contained in all publications are solely those of the individual author(s) and contributor(s) and not of MDPI and/or the editor(s). MDPI and/or the editor(s) disclaim responsibility for any injury to people or property resulting from any ideas, methods, instructions or products referred to in the content. |
© 2025 by the authors. Licensee MDPI, Basel, Switzerland. This article is an open access article distributed under the terms and conditions of the Creative Commons Attribution (CC BY) license (http://creativecommons.org/licenses/by/4.0/).
Copyright: This open access article is published under a Creative Commons CC BY 4.0 license, which permit the free download, distribution, and reuse, provided that the author and preprint are cited in any reuse.


