
Submitted:
26 May 2025
Posted:
27 May 2025
You are already at the latest version
Abstract
This study applies an artificial neural networks (ANN) to simulate monthly tempera-ture and salinity variations at three stations in the Venice lagoon, which have been se-lected to represent different regimes (marine, riverine and intermediate) in terms of relevance of local processes and exchanges with the open sea. Four key predictors are shown to paly a major role: mean offshore sea level, 2-meter air temperature, precipi-tation for the lagoon water temperature, integrated with offshore surface salinity for the lagoon water salinity. The development of the ANN is based on only 4 years of ob-servations, taken irregularly in time with an approximately monthly frequency. De-spite this, the ANN achieves an accurate reproduction of both variables with large R2 and reasonably small, normalized root-mean-square errors at all stations, except for the salinity at the marine station, where the model presents a spurious variability, which is absent in observations. Sensitivity analysis shows that the 2-meter air tem-perature is the dominant predictor for water temperature while sea-level and sea sur-face salinity are the principal drivers of salinity fluctuations, with precipitation exert-ing a relevant role mainly at the riverine station. The ANN has been used for a set of synthetic climate change analyses considering 1.5, 2 and 3°C global warming levels with respect to preindustrial. It is expected an overall warming of lagoon water with maximum increase in summer (up to 6°C in the 3°C global warming level) resulting in an amplification of the annual cycle amplitude. The expected increases of salinity have a strong gradient across the lagoon, are largest at the riverine station, and (analogously to the changes of temperature) amplify the salinity annual cycle amplitude.
Keywords:
Artificial Neural Network
; Venice Lagoon
; climate-change
; temperature
; salinity
1. Introduction
Coastal lagoons, such as the Venice Lagoon, represent highly dynamic and ecologically significant environments that provide essential ecosystem services, including habitat provisioning, nutrient cycling, and coastal protection [1,2,3]. These transitional systems act as biodiversity hotspots, supporting a wide range of species, including commercially and ecologically valuable fish and invertebrates [4]. Rising global temperatures are leading to higher water temperatures, altering species distribution and metabolic rates, while changes in evaporation and precipitation patterns influence salinity gradients and nutrient dynamics [5,6]. Sea-level rise poses a direct threat to these low-lying coastal systems by altering tidal regimes and increasing the risk of coastal erosion and habitat submersion [7]. Additionally, marine heatwaves are becoming more frequent and intense [8] leading to physiological stress in aquatic organisms and altering trophic interactions [9,10,11,12]. Projections suggest that these climate-induced pressures will intensify in the coming decades, potentially surpassing the impacts of traditional non-climatic drivers and leading to irreversible ecological shifts in coastal lagoons worldwide [13,14]. This study considers the Venice lagoon, an environment that is increasingly threatened by the combined effects of climate change and anthropogenic pressures, leading to profound alterations in their physical, chemical, and biological characteristics [15]. Understanding and assessing the future impact of climate change on coastal lagoons is crucial for developing adaptive management strategies to enhance the resilience of the lagoons [16].
This study proposes an artificial neural network (ANNs) for simulating salinity (S) and temperature (T) variations in the Venice Lagoon. The analysis is based on data collected from three monitoring stations (Figure 1) within the lagoon, chosen to be representative of the internal variability of this complex and dynamic coastal system [17]. The locations of these stations were identified by a based on local hydrodynamic conditions, considering freshwater inflows and water exchanges with the sea [18]. The selected stations represent key transitional areas within the lagoon, where the influence of freshwater inputs, tidal exchange, and meteorological variability combine to create distinct hydrographic patterns [19](Figure 1). we aim to show that the ANN approach can allow for a comprehensive assessment of the factors shaping the system’s dynamics and provides a framework for understanding salinity and temperature variability over time. In general, parameters such as water salinity and temperature are generally investigated through field observations and dynamic modeling approaches. However, dynamic modelling approach are computationally extremely expensive because of the very fine required spatial resolution (of order of 1 meter) [20]. This in general prevents long simulations and ensemble projections. In fact, in spite of the existing demand, at the best of our knowledge, monitoring and projection services for the physicochemical parameters of coastal lagoons are not available in major repositories such as Copernicus. For this reason, we considered applying a neural approach suitable for modeling surface temperature and salinity based on field observations and outputs from climate and meteorological models for the variables that primarily influence these two parameters, using a combination of meteorological and oceanographic predictors, including air temperature, sea surface temperature, precipitation, wind speed, and tidal fluctuations. Furthermore, the ANN methodology provides a flexible framework that can be adapted to different temporal scales, allowing for both short-term forecasting and long-term trend analysis, thereby offering a valuable tool for ongoing environmental monitoring and decision-making.
Beside this introduction, this paper contains a “Data and Methods” section that describes the Artificial Neural Network (ANN) model, the datasets used, and their sources and investigates multicollinearity among potential predictors. Section 3 “Results” dewcribes the identification of a robust and minimal set of predictors, a sensitivity analysis and the ANN validation. Section 3 includes also an application using a synthetic dataset, based on existing studies on climate change [21] to demonstrate the effectiveness of the ANN model for climate analysis. The final section, “Discussion and Conclusions”, discusses the outcomes of the study, limitations and the potential applications of the ANN model.
2. Data and Methods
Surface temperature and salinity observations at the three selected stations have been provided by the MeLa project (Provveditorato Interregionale per le Opere Pubbliche per il Veneto, Trentino-Alto Adige, e Friuli Venezia Giulia, supported by the Water Authority (Magistrato alle Acque) of the Venice Lagoon. The project monitored the lagoon on a monthly basis producing a database of the main physical, chemical water parameters and key ecological indicators of biodiversity. In this study we use the temperature and salinity data at the three stations (riverine, marine, and intermediate, Figure 1), which are available for the period from September 2001 to December 2004.
The energy and water surface mass fluxes, integrated by the exchanges with the open sea across the lagoon inlets ,represent the phenomenological basis for the computation of the temperature and salinity inside the lagoon [22]. In this study we consider a set of meteorological variables affecting the surface evaporation flux (T2, air temperature at 2-meter level, wind speed zonal and meridional components, Uw, Vw, specific humidity at 2-meter level, q2) and precipitation (P). To account for the exchanges with the open sea we consider sea level (SL), sea surface temperature and salinity (SST and SSS, respectively). For all variables the monthly mean values are used, greatly facilitating in future applications downloading and storing data of climate models and reanalyses. Values of T2, Uw, Vw, q2 and P have been retrieved from the European Union ERA5 Service [23]. SST, SSS and SL are downloaded from the Copernicus Climate Change Service, +Climate Data Store, (2021). SST and SSS are provided by ORAS5 global ocean reanalysis monthly data from 1958 to present. Copernicus Climate Change Service (C3S) Climate Data Store (CDS). DOI: 10.24381/cds.67e8eeb7-. SL values are derived from time series produced using the Deltares Global Tide and Surge Model (GTSM), version 3.0—a hydrodynamic model that simulates water levels at 10-minute intervals. All data have been used for computing monthly mean values at the spatial resolution of 0.25° to ensure spatial consistency across variables. At the monthly scale, T2 and SST have a substantially identical variability (their correlation is 0.989, Figure 2) and using both of them could very likely increase unrealistically the variance without any advantage. Therefore, SST has not been used as input of the ANN.
A convolutional neural network was developed with two hidden layers, each composed of 30 neurons (Figure 3), with sigmoid activation functions applied to each neuron [24]. In order to construct the ANN, the observed time series have been split into a training period (17 values for each variable and station from September 2001 to December 2002) and a test period (24 values from January 2003 to December 2004). The accuracy of the ANN has been assessed using the Normalized root mean square error (NRMSE), where the normalization factor is the standard deviation of the observations [25]. The sensitivity of the ANN to each input variable has been assessed by calculating the associated out-of-bag NRMSE, that is the NRMSE of the ANN when the time series of the single considered variable is resampled using a bootstrapping technique. Large values of the out-of-bag NRMSE denote variables explaining a large fraction of the variability of the observed time series.
Three global warming levels (GWLs) have been considered: 1.5, 2, 3°C with respect to pre-industrial. A set of synthetic climate change simulation have been produced. The time series of the ANN inputs for the period 2001-2004 have been perturbed as a function of the GWL consistently with the results of Lionello and Scarascia (2018). T2 was increased using a seasonal factor obtained multiplying the GWL by 0.5 in winter, 1.0 in spring and autumn, and 1.5 in summer. Offshore sea level was raised by 25 cm, 30 cm, and 50 cm for the 1.5, 2, 3°C , respectively. Precipitation was altered by applying seasonal variation proportional to the GWL: an increase of 4 mm/°C in winter, no change in spring and autumn, and a decrease of 12 mm/°C in summer. Additionally, offshore marine salinity has been increased by 0.15 PSU/°C proportionally to the global warming level.
3. Results
Computation of salinity is not accurate at the marine station. Figure 4 (and Figure 8) shows that for salinity in this station the model introduces a spurious variability, which is larger than at other stations. On the contrary observations show a much lower variability of salinity at the marine station with respect to the others. This results in the large NRMSE in both training and test period shown in Figure 5. In fact, the marine station salinity differs from the others because of a large sensitivity to SL and SSS, and inaccurate values of these two predictors can explain these unsatisfactory results. The ANN with the reduced number of predictors has been used for analyzing the impact of climate change with respect to the 2001-2004 period in case of the 1.5, 2 and 3°C GWL with respect to preindustrial (Figure 9). Results show an overall warming along the whole annual cycle, with values about twice as large as the GWL. Warming is comparable at the three stations with a maximum in the summer season, where the increase is double compared to winter. The consequence is an increase in the amplitude of the annual cycle, with a maximum temperature well above 30°C in summer in case of 3°C GWL. Salinity is expected to increase at all stations, being particularly large in summer at the riverine station (larger than 4psu for the 3°C GWL). Changes at the intermediate station are between the marine and riverine station values. The consequence at all station beside an overall increase of salinity, would be an amplification of the annual cycle, with a contrast between winter and summer salinity larger in the future than nowadays.
Figure 4.
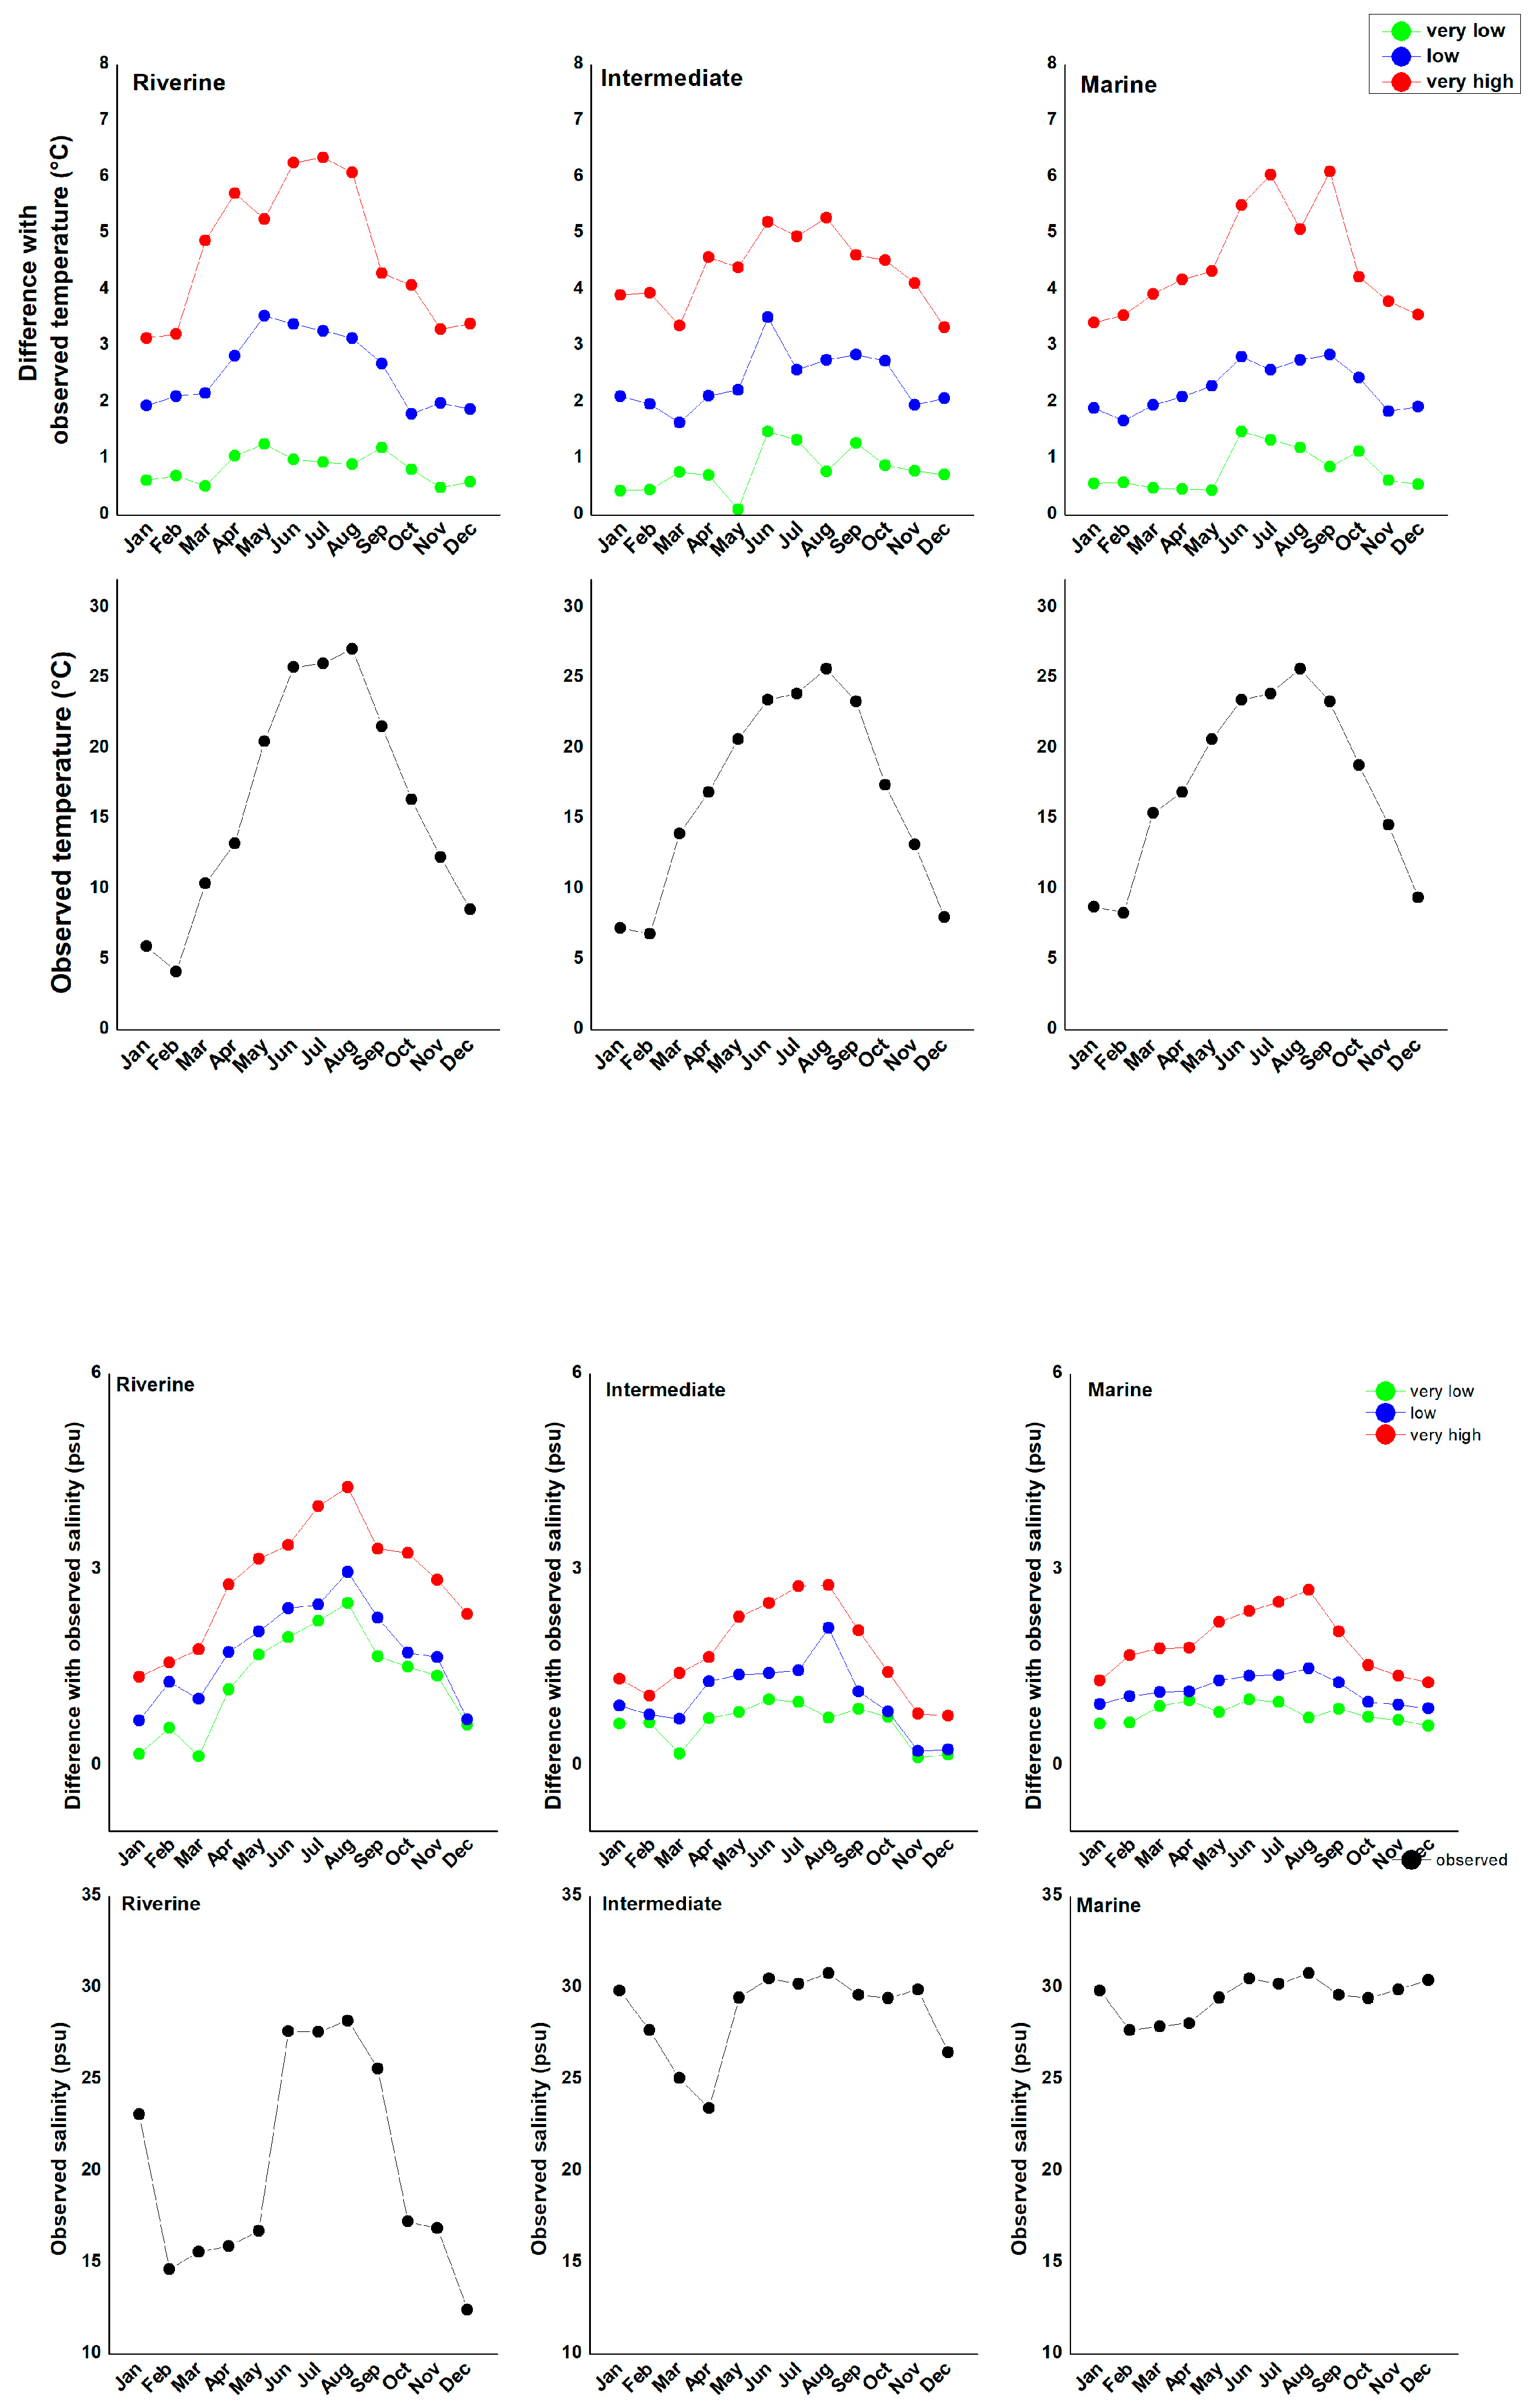
The first column shows the observed salinity (psu, top) and temperature (°C, bottom) observed values at the three stations: riverine , marine, and intermediate. The second column shows the corresponding ANN errors (computed - observed values) The time series of temperature and salinity at the three stations are shown in Figure 4. While temperature variations are similar at the three stations, salinity has quite different values, from the salty water at the marine station to the brackish water of the riverine station. Moreover, inter-monthly variations are much smaller at the marine than at the riverine and intermediate stations. The analysis has focused on the identification of the predictors playing a major role in the observed variability (sensitivity analysis) and on the loss of accuracy that would be produced by reducing their number. Using a set of 6 predictors (T2, P, Uw, Vw, q2, SL) for temperature and of 7 preditors (same variables as for temperature integrated with SSS) for salinity, a reasonably accurate computation is obtained, with NRMSE values in the test period that are only marginally higher than in the training period (Figure 5). However, sensitivity analysis reveals that some predictors (T2, P, SL, integrated with SSS for salinity) play a much larger role than others (Figure 6). Further, using the selected subset (T2, P, SL, for computing temperature, and T2, P, SL, SSS for computing salinity) has a very marginal effect on the ANN accuracy (Figure 5), with the advantage of using a reduced set of variable, all of them with comparable sensitivity(Figure 6) and limiting potential inflation of variance, which is a concrete risk in consideration of the very limited dataset used for training. The reliability of the ANN with the reduced number of predictors is further confirmed by the comparison of the distribution of the errors along the annual cycle (Figure 7 and Figure 8), where no evidence of a dependence on the annual cycle is evident in spite of the large inter-monthly variability of predictors and outputs. The sensitivity analysis offers quantitative support to the identification of the different dynamics at the three stations, which could be anticipated on the basis of their locations. The marine station, which is in the proximity of a lagoon inlet, displays sensitivity to SL larger than in other stations. On the contrary, the salinity of the riverine station, which is far from any lagoon inlet and in the proximity of the mouth of a river whose small basin is adjacent to the lagoon, is mostly determined by T2 and P.
Figure 4.
The first column shows the observed salinity (psu, top) and temperature (°C, bottom) observed values at the three stations: riverine , marine, and intermediate. The second column shows the corresponding ANN errors (computed - observed values) The time series of temperature and salinity at the three stations are shown in Figure 4. While temperature variations are similar at the three stations, salinity has quite different values, from the salty water at the marine station to the brackish water of the riverine station. Moreover, inter-monthly variations are much smaller at the marine than at the riverine and intermediate stations. The analysis has focused on the identification of the predictors playing a major role in the observed variability (sensitivity analysis) and on the loss of accuracy that would be produced by reducing their number. Using a set of 6 predictors (T2, P, Uw, Vw, q2, SL) for temperature and of 7 preditors (same variables as for temperature integrated with SSS) for salinity, a reasonably accurate computation is obtained, with NRMSE values in the test period that are only marginally higher than in the training period (Figure 5). However, sensitivity analysis reveals that some predictors (T2, P, SL, integrated with SSS for salinity) play a much larger role than others (Figure 6). Further, using the selected subset (T2, P, SL, for computing temperature, and T2, P, SL, SSS for computing salinity) has a very marginal effect on the ANN accuracy (Figure 5), with the advantage of using a reduced set of variable, all of them with comparable sensitivity(Figure 6) and limiting potential inflation of variance, which is a concrete risk in consideration of the very limited dataset used for training. The reliability of the ANN with the reduced number of predictors is further confirmed by the comparison of the distribution of the errors along the annual cycle (Figure 7 and Figure 8), where no evidence of a dependence on the annual cycle is evident in spite of the large inter-monthly variability of predictors and outputs. The sensitivity analysis offers quantitative support to the identification of the different dynamics at the three stations, which could be anticipated on the basis of their locations. The marine station, which is in the proximity of a lagoon inlet, displays sensitivity to SL larger than in other stations. On the contrary, the salinity of the riverine station, which is far from any lagoon inlet and in the proximity of the mouth of a river whose small basin is adjacent to the lagoon, is mostly determined by T2 and P.
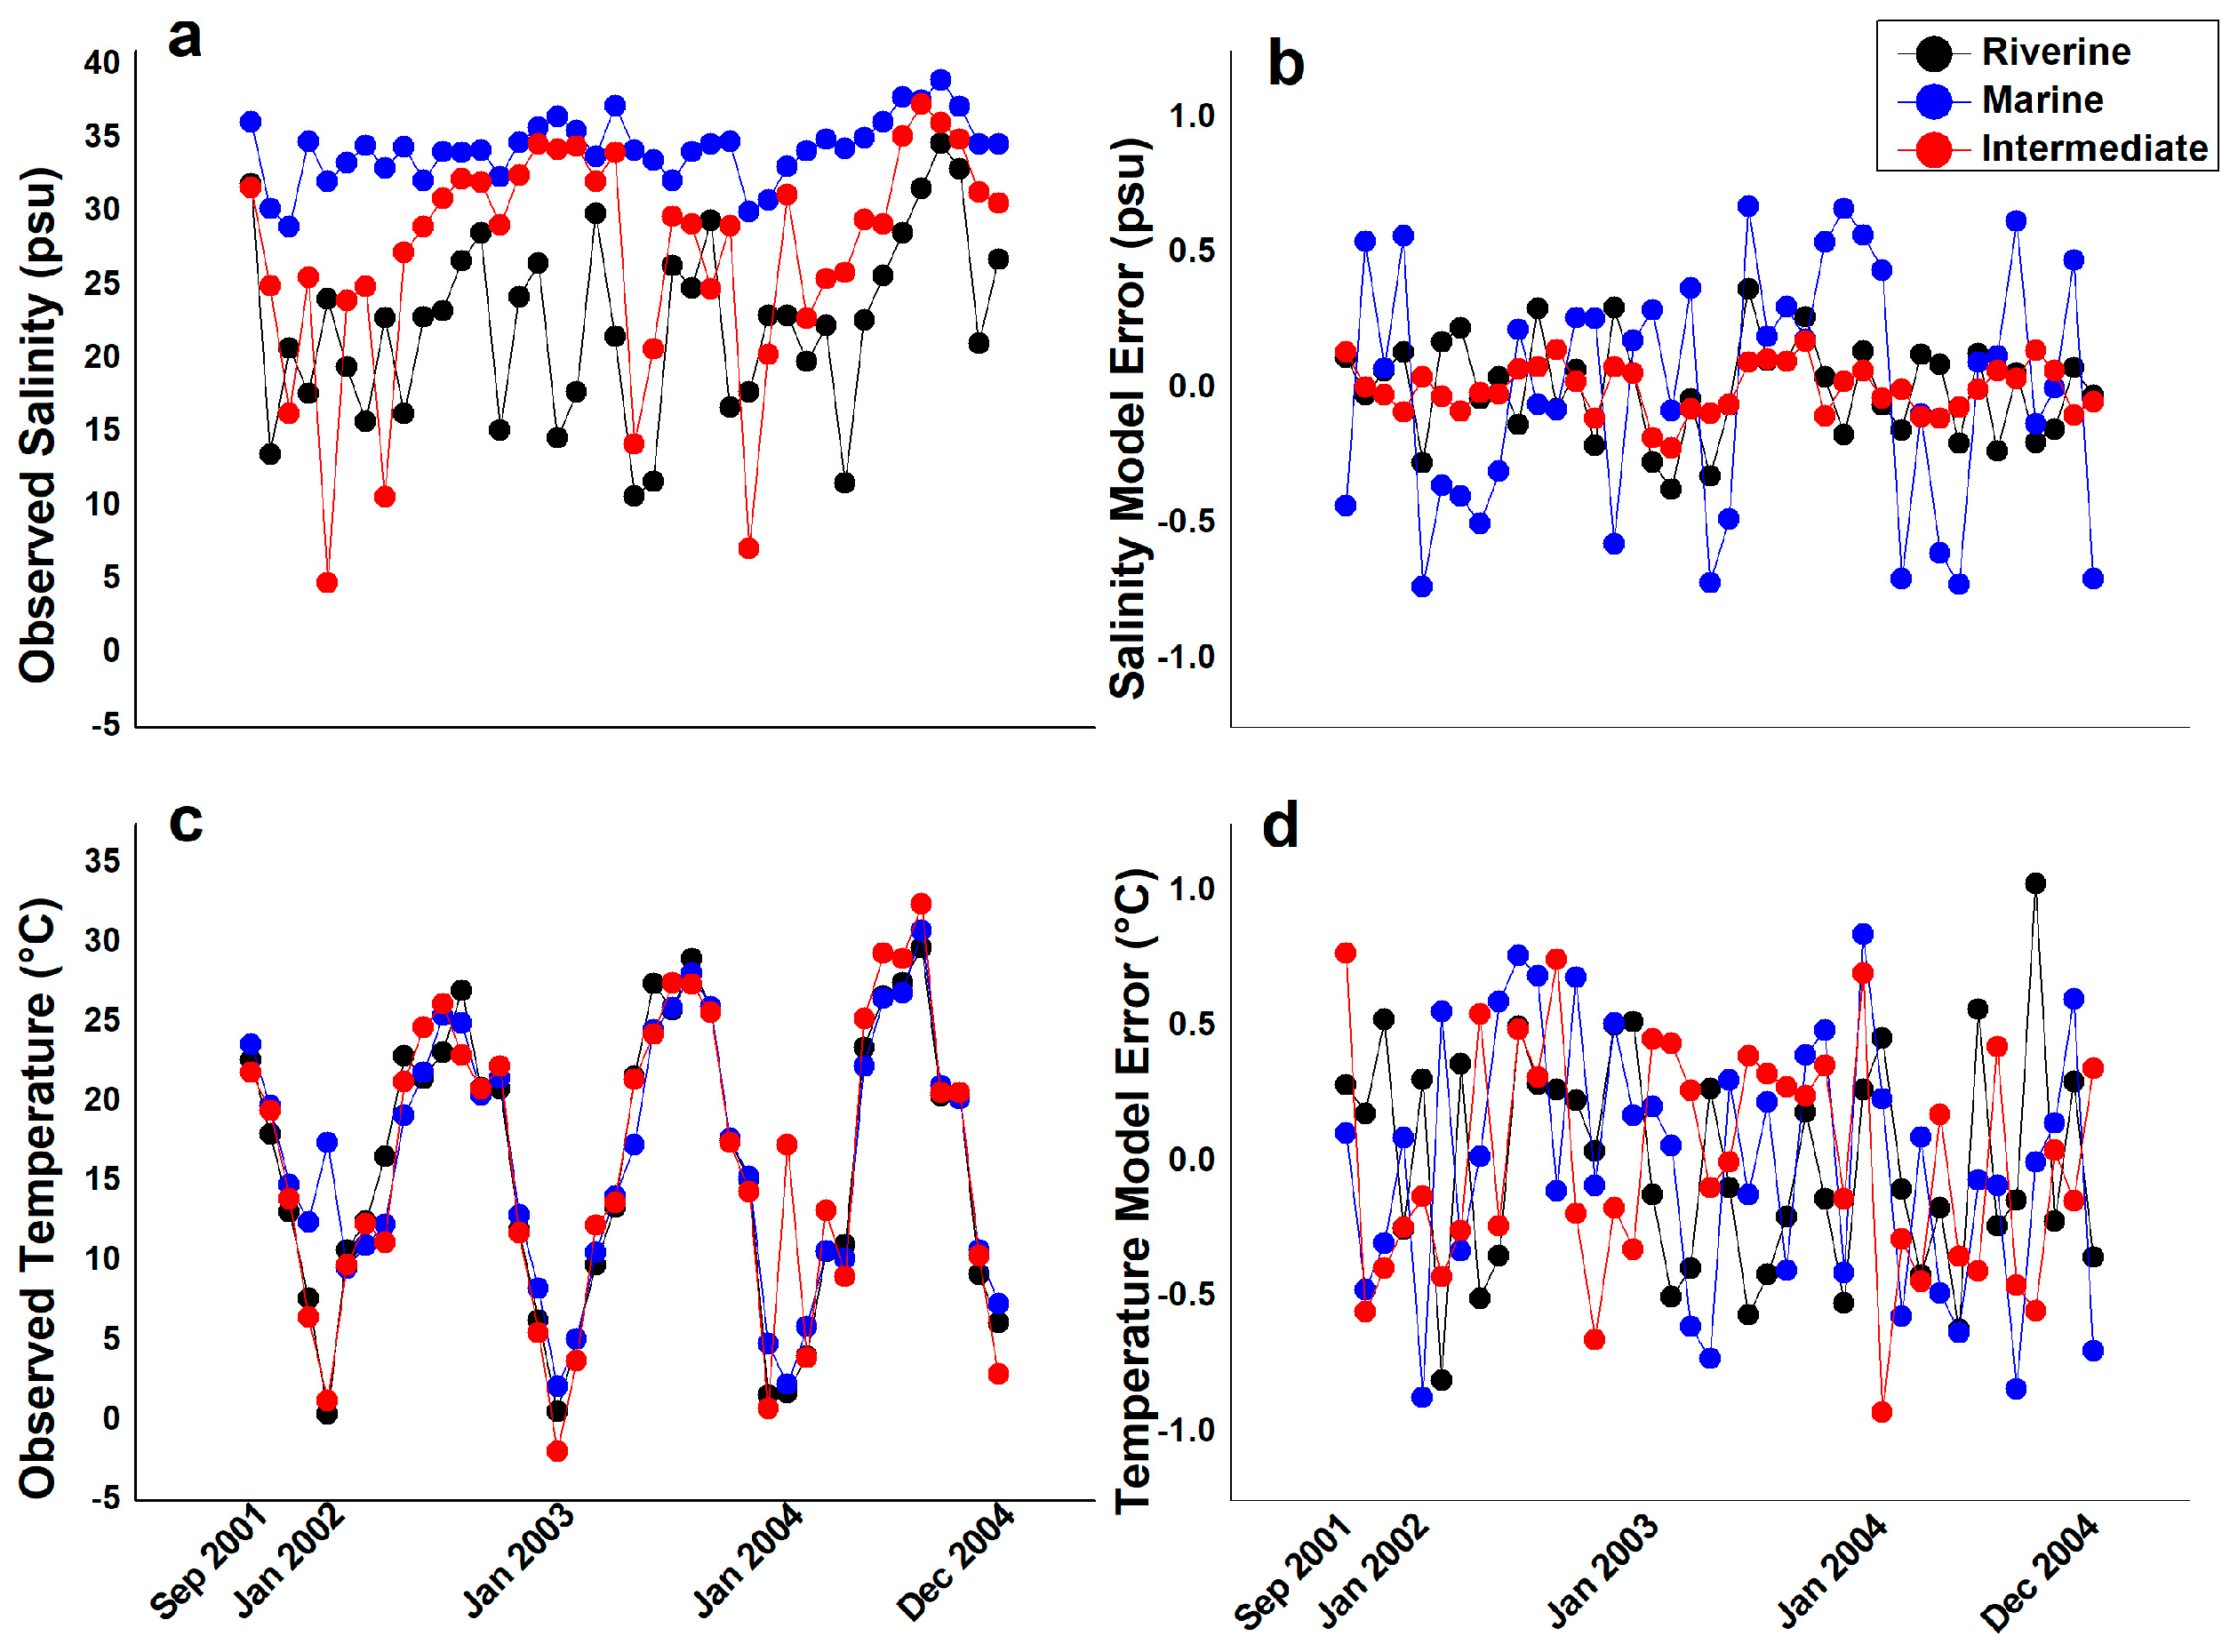
Figure 5.
Normalized Root Mean Square Error (NRMSE) values for the training and testing periods using different number of predictors. For temperature simulations with 3 predictors has used T2, P, SL, to which Uw, Vw, q2 have been added for the simulations with 6 predictors. The same variables integrated with SSS have been used for the simulation salinity with 7 and 4 predictors.
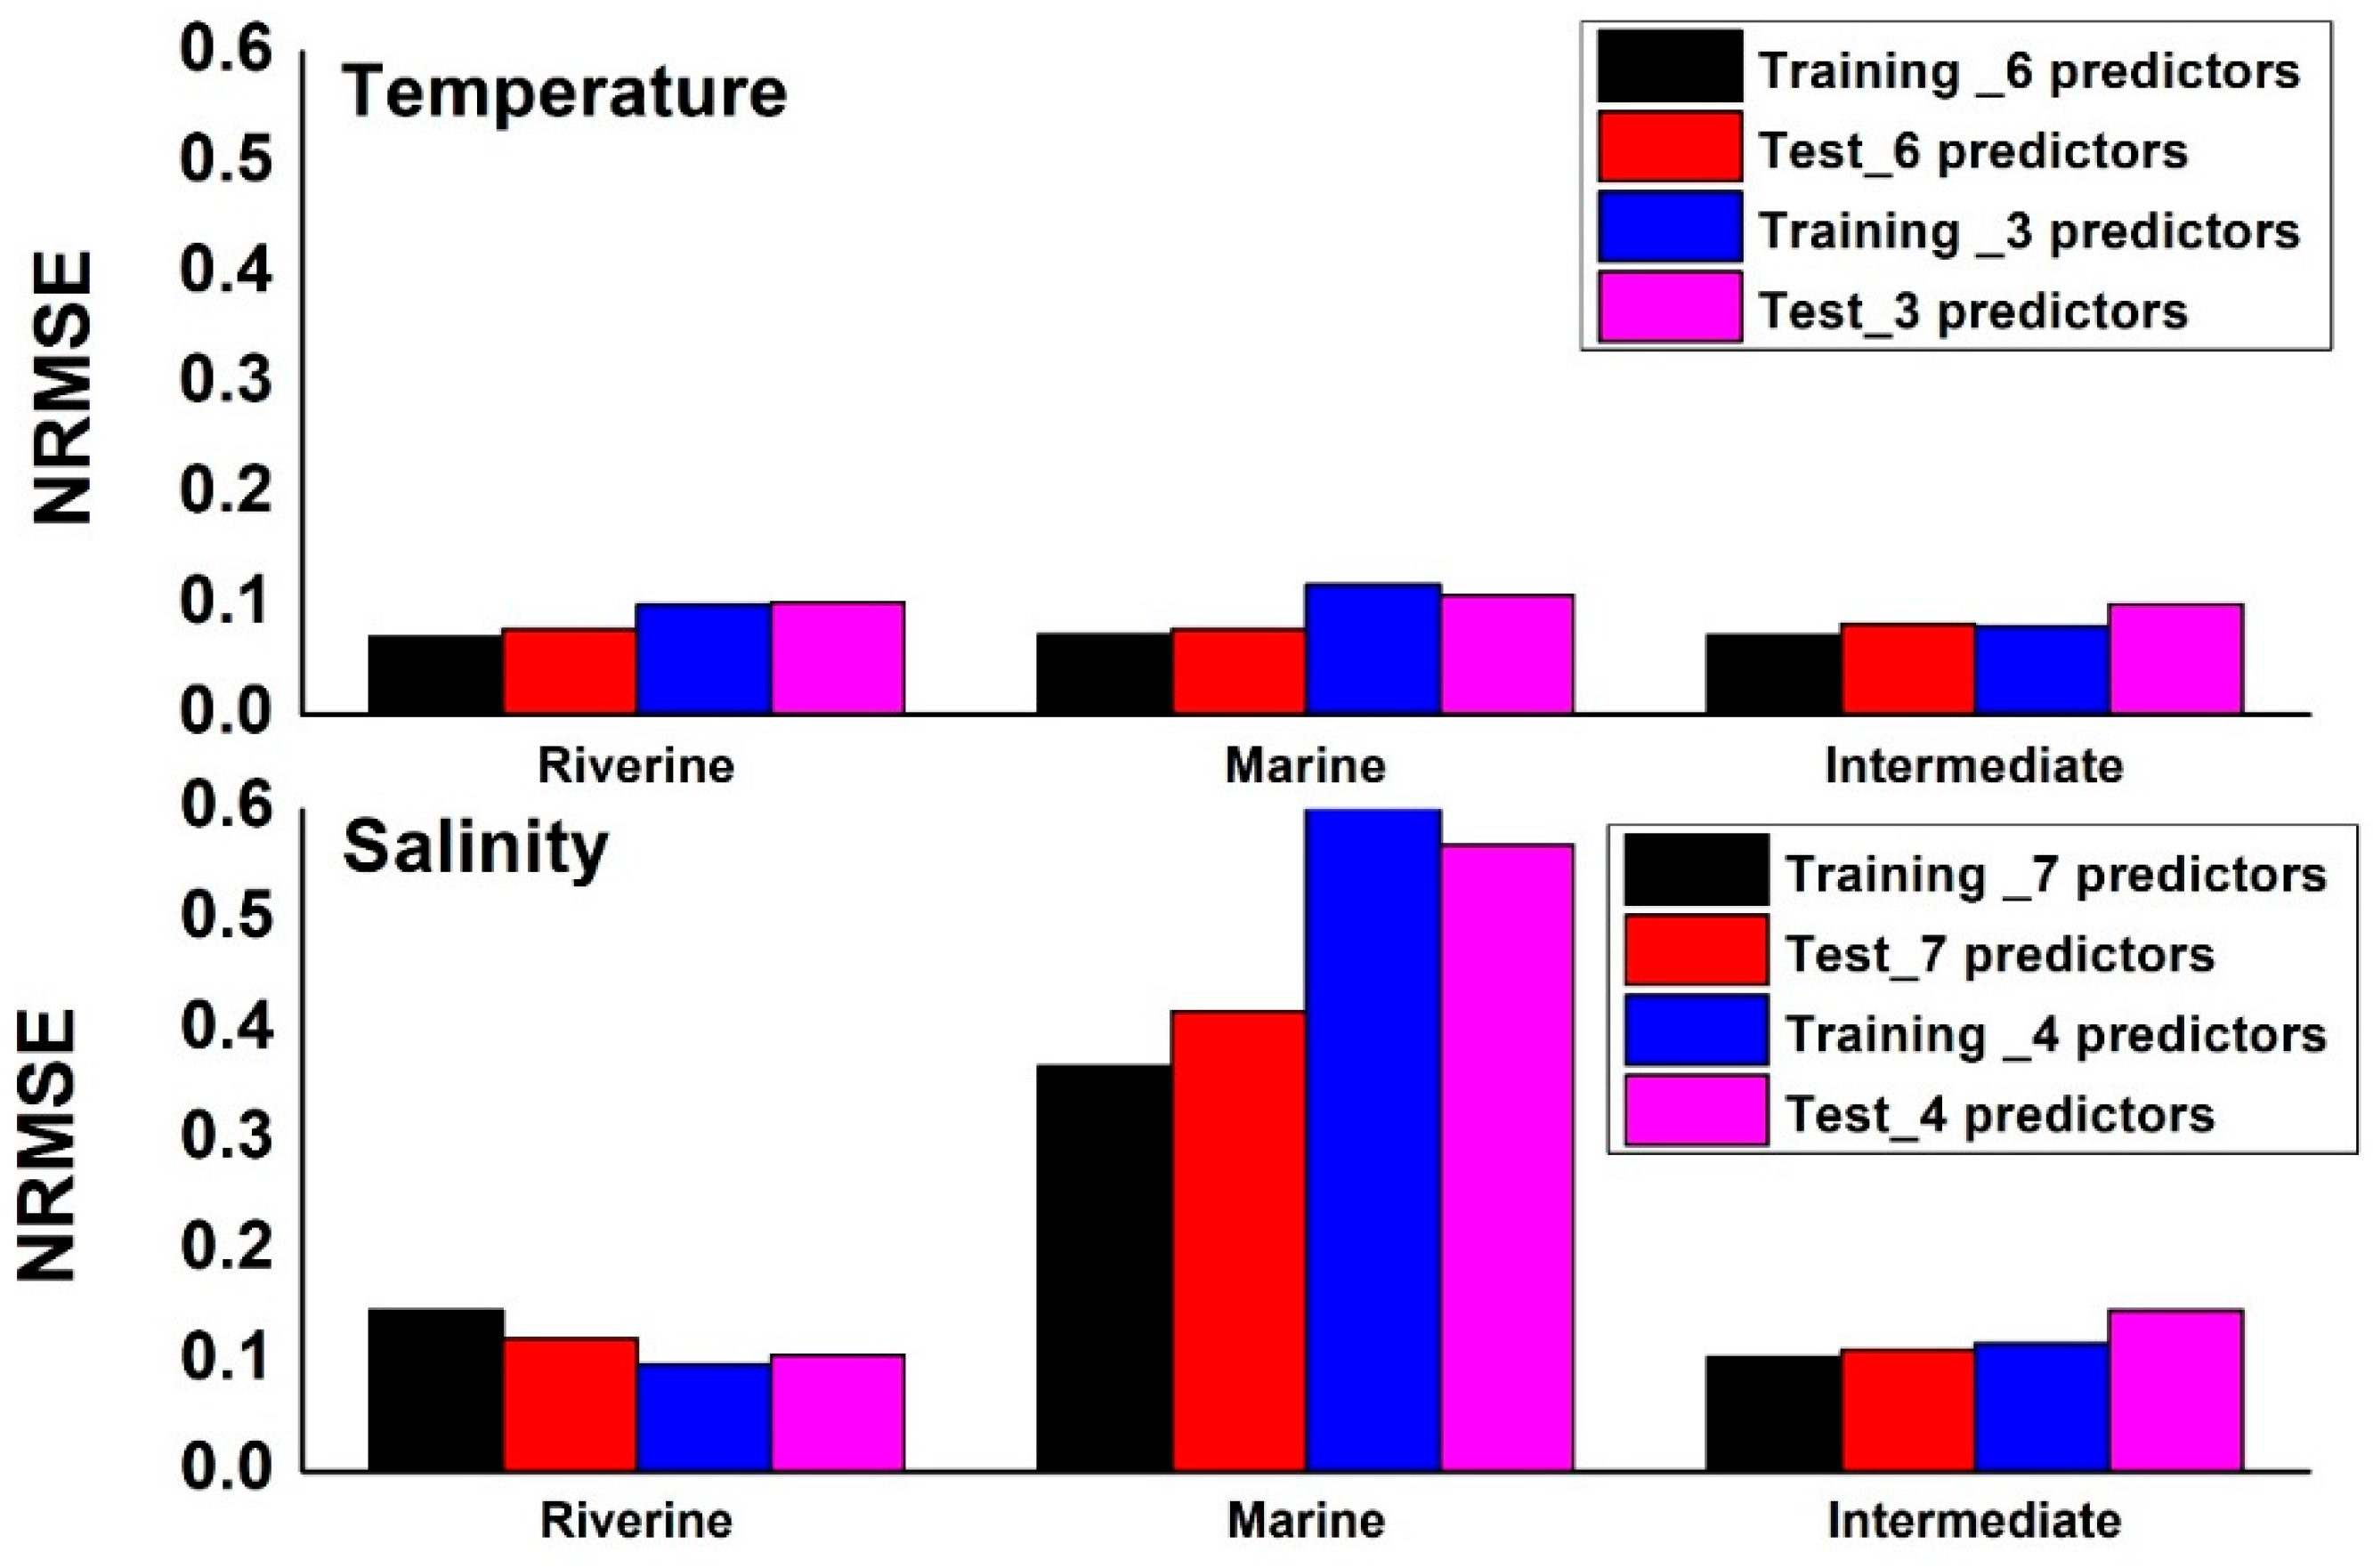
Figure 6.
Sensitivity analysis results showing the out-of-bag NRMSE. Large values denote large sensitivity. The top row shows sensitivity using 6 predictors (for temperature, left) and 7 predictors (for salinity, right). The bottom row shows sensitivity with 3 (for temperature, left) and 4 predictors (for salinity, right).
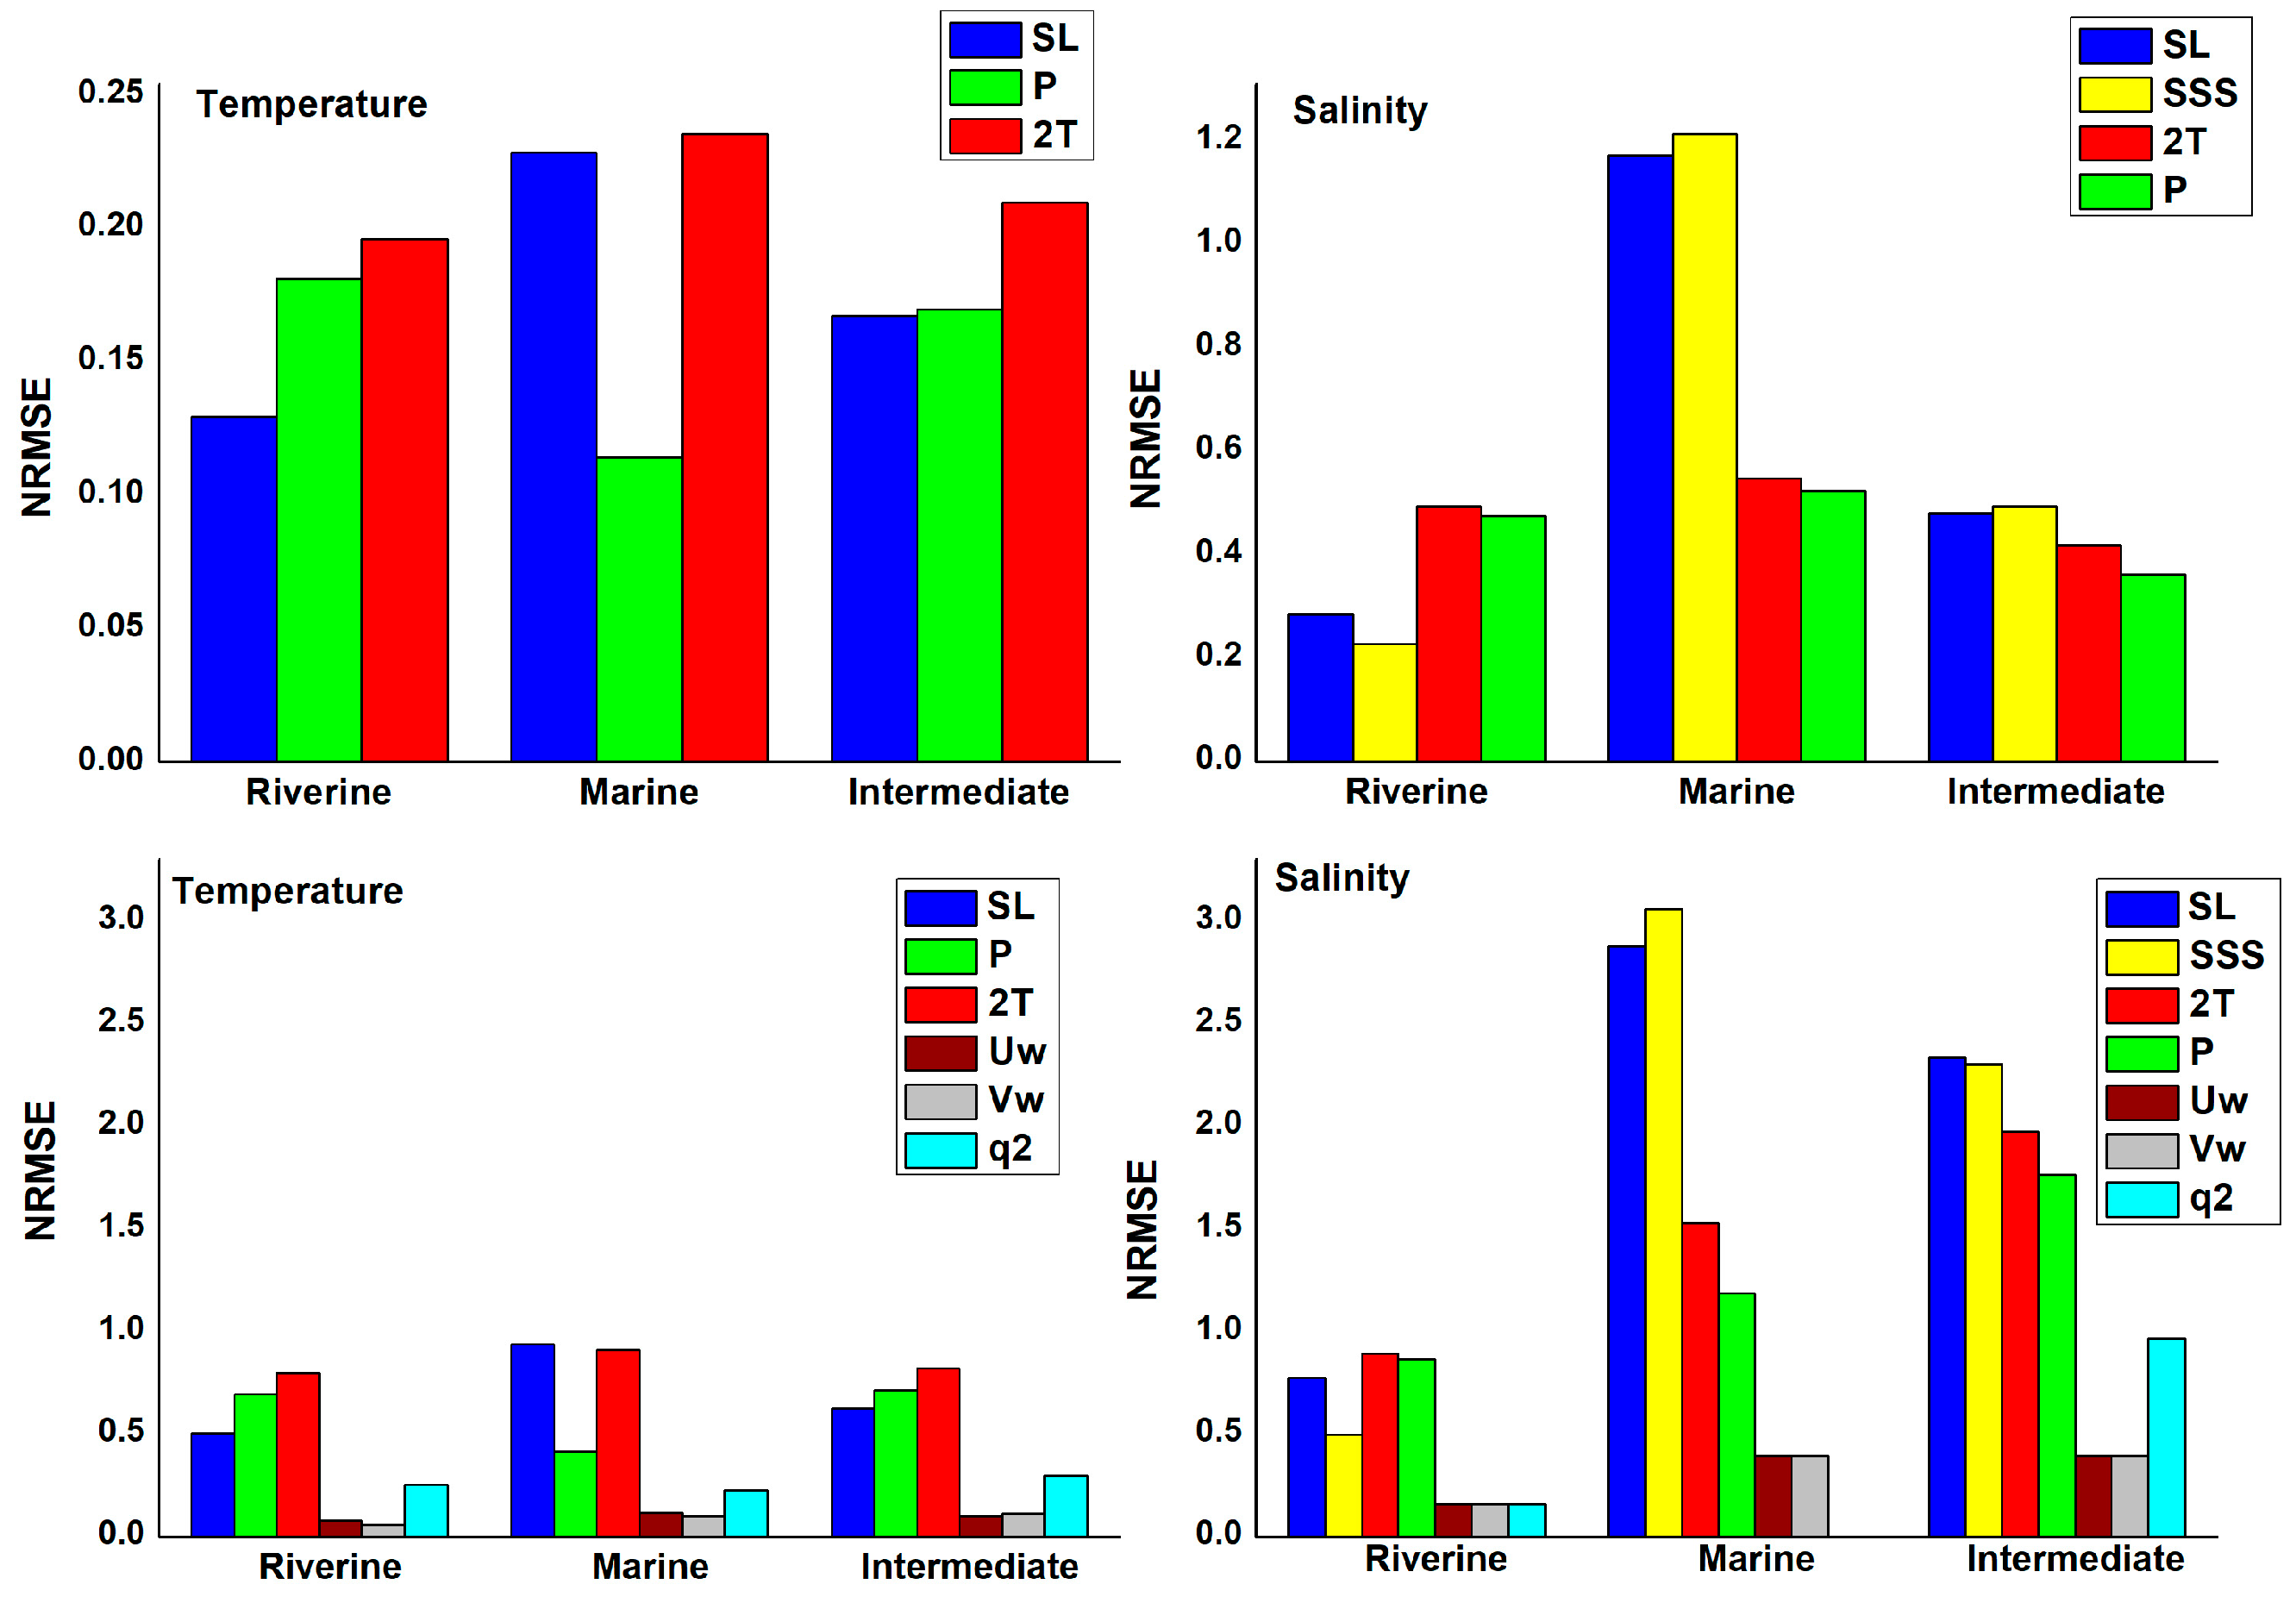
Figure 7.
Temperature errors (simulated - observed temperature) at the riverine, marine, and intermediate stations during the training phase (green) and test phase (red) as a function of months.
Figure 7.
Temperature errors (simulated - observed temperature) at the riverine, marine, and intermediate stations during the training phase (green) and test phase (red) as a function of months.
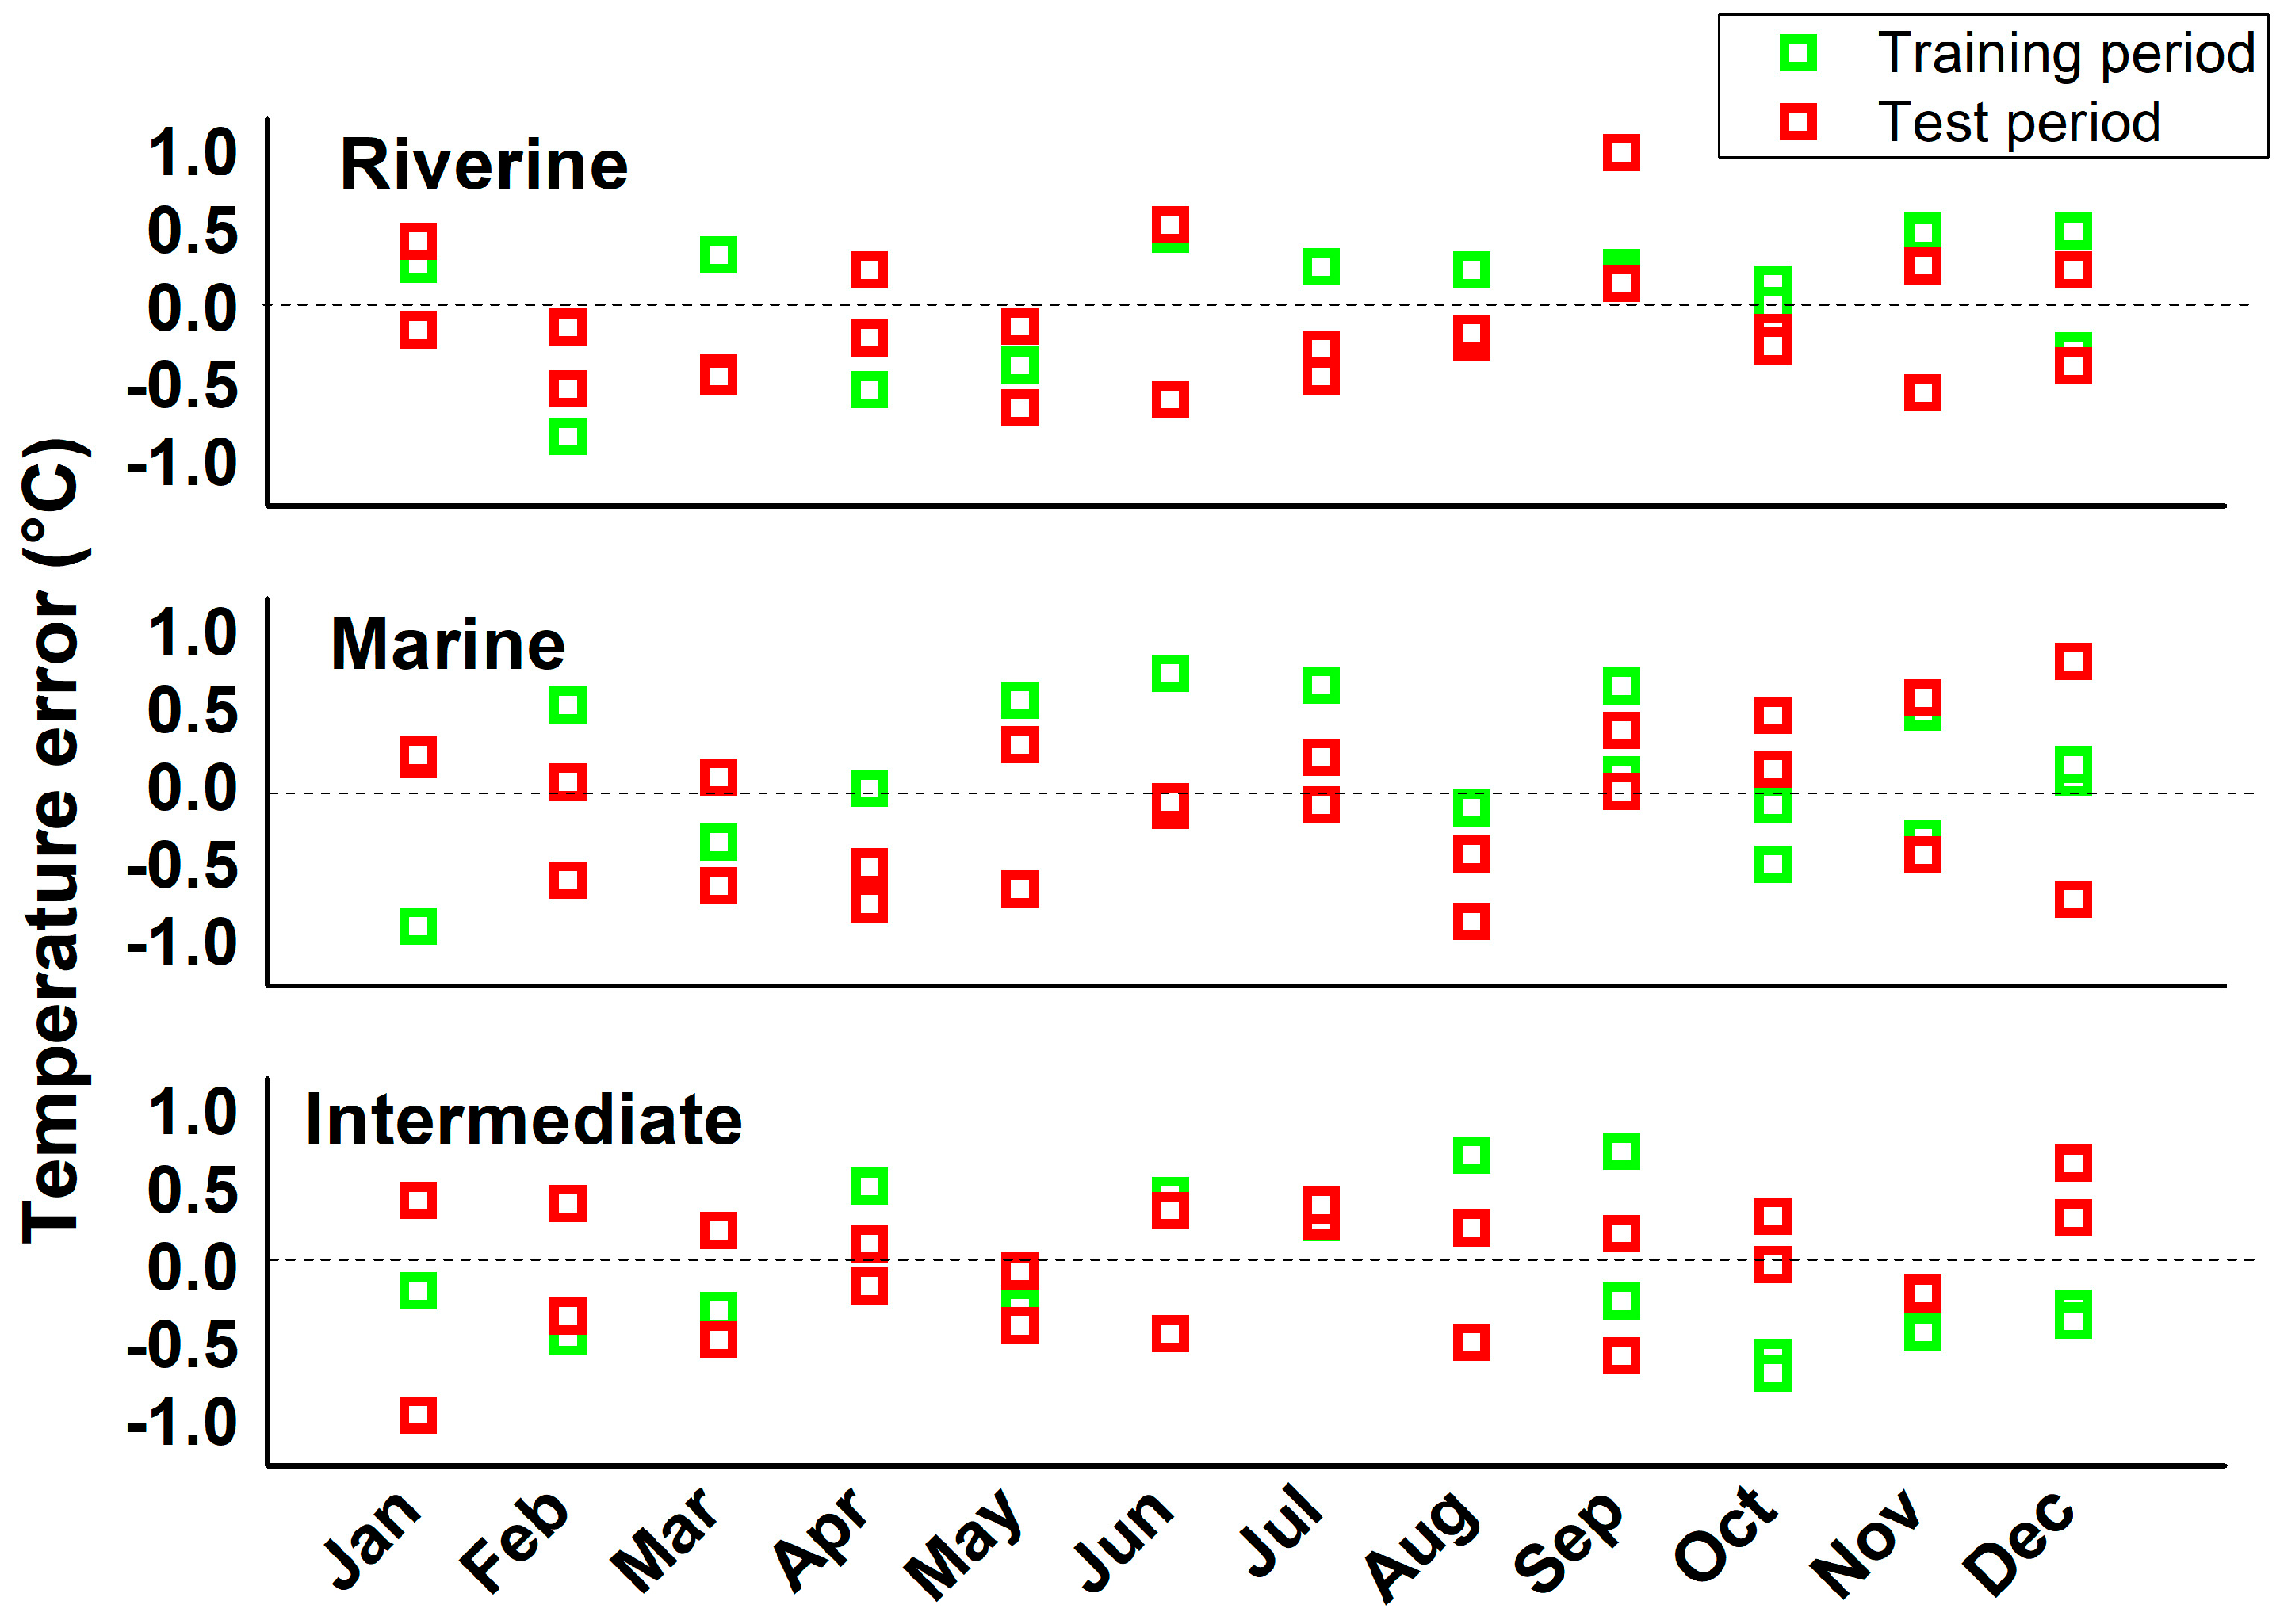
Figure 8.
Salinity errors (simulated minus observed Salinity) at the riverine, marine, and intermediate stations during the training phase (green) and test phase (red) as a function of months.
Figure 8.
Salinity errors (simulated minus observed Salinity) at the riverine, marine, and intermediate stations during the training phase (green) and test phase (red) as a function of months.
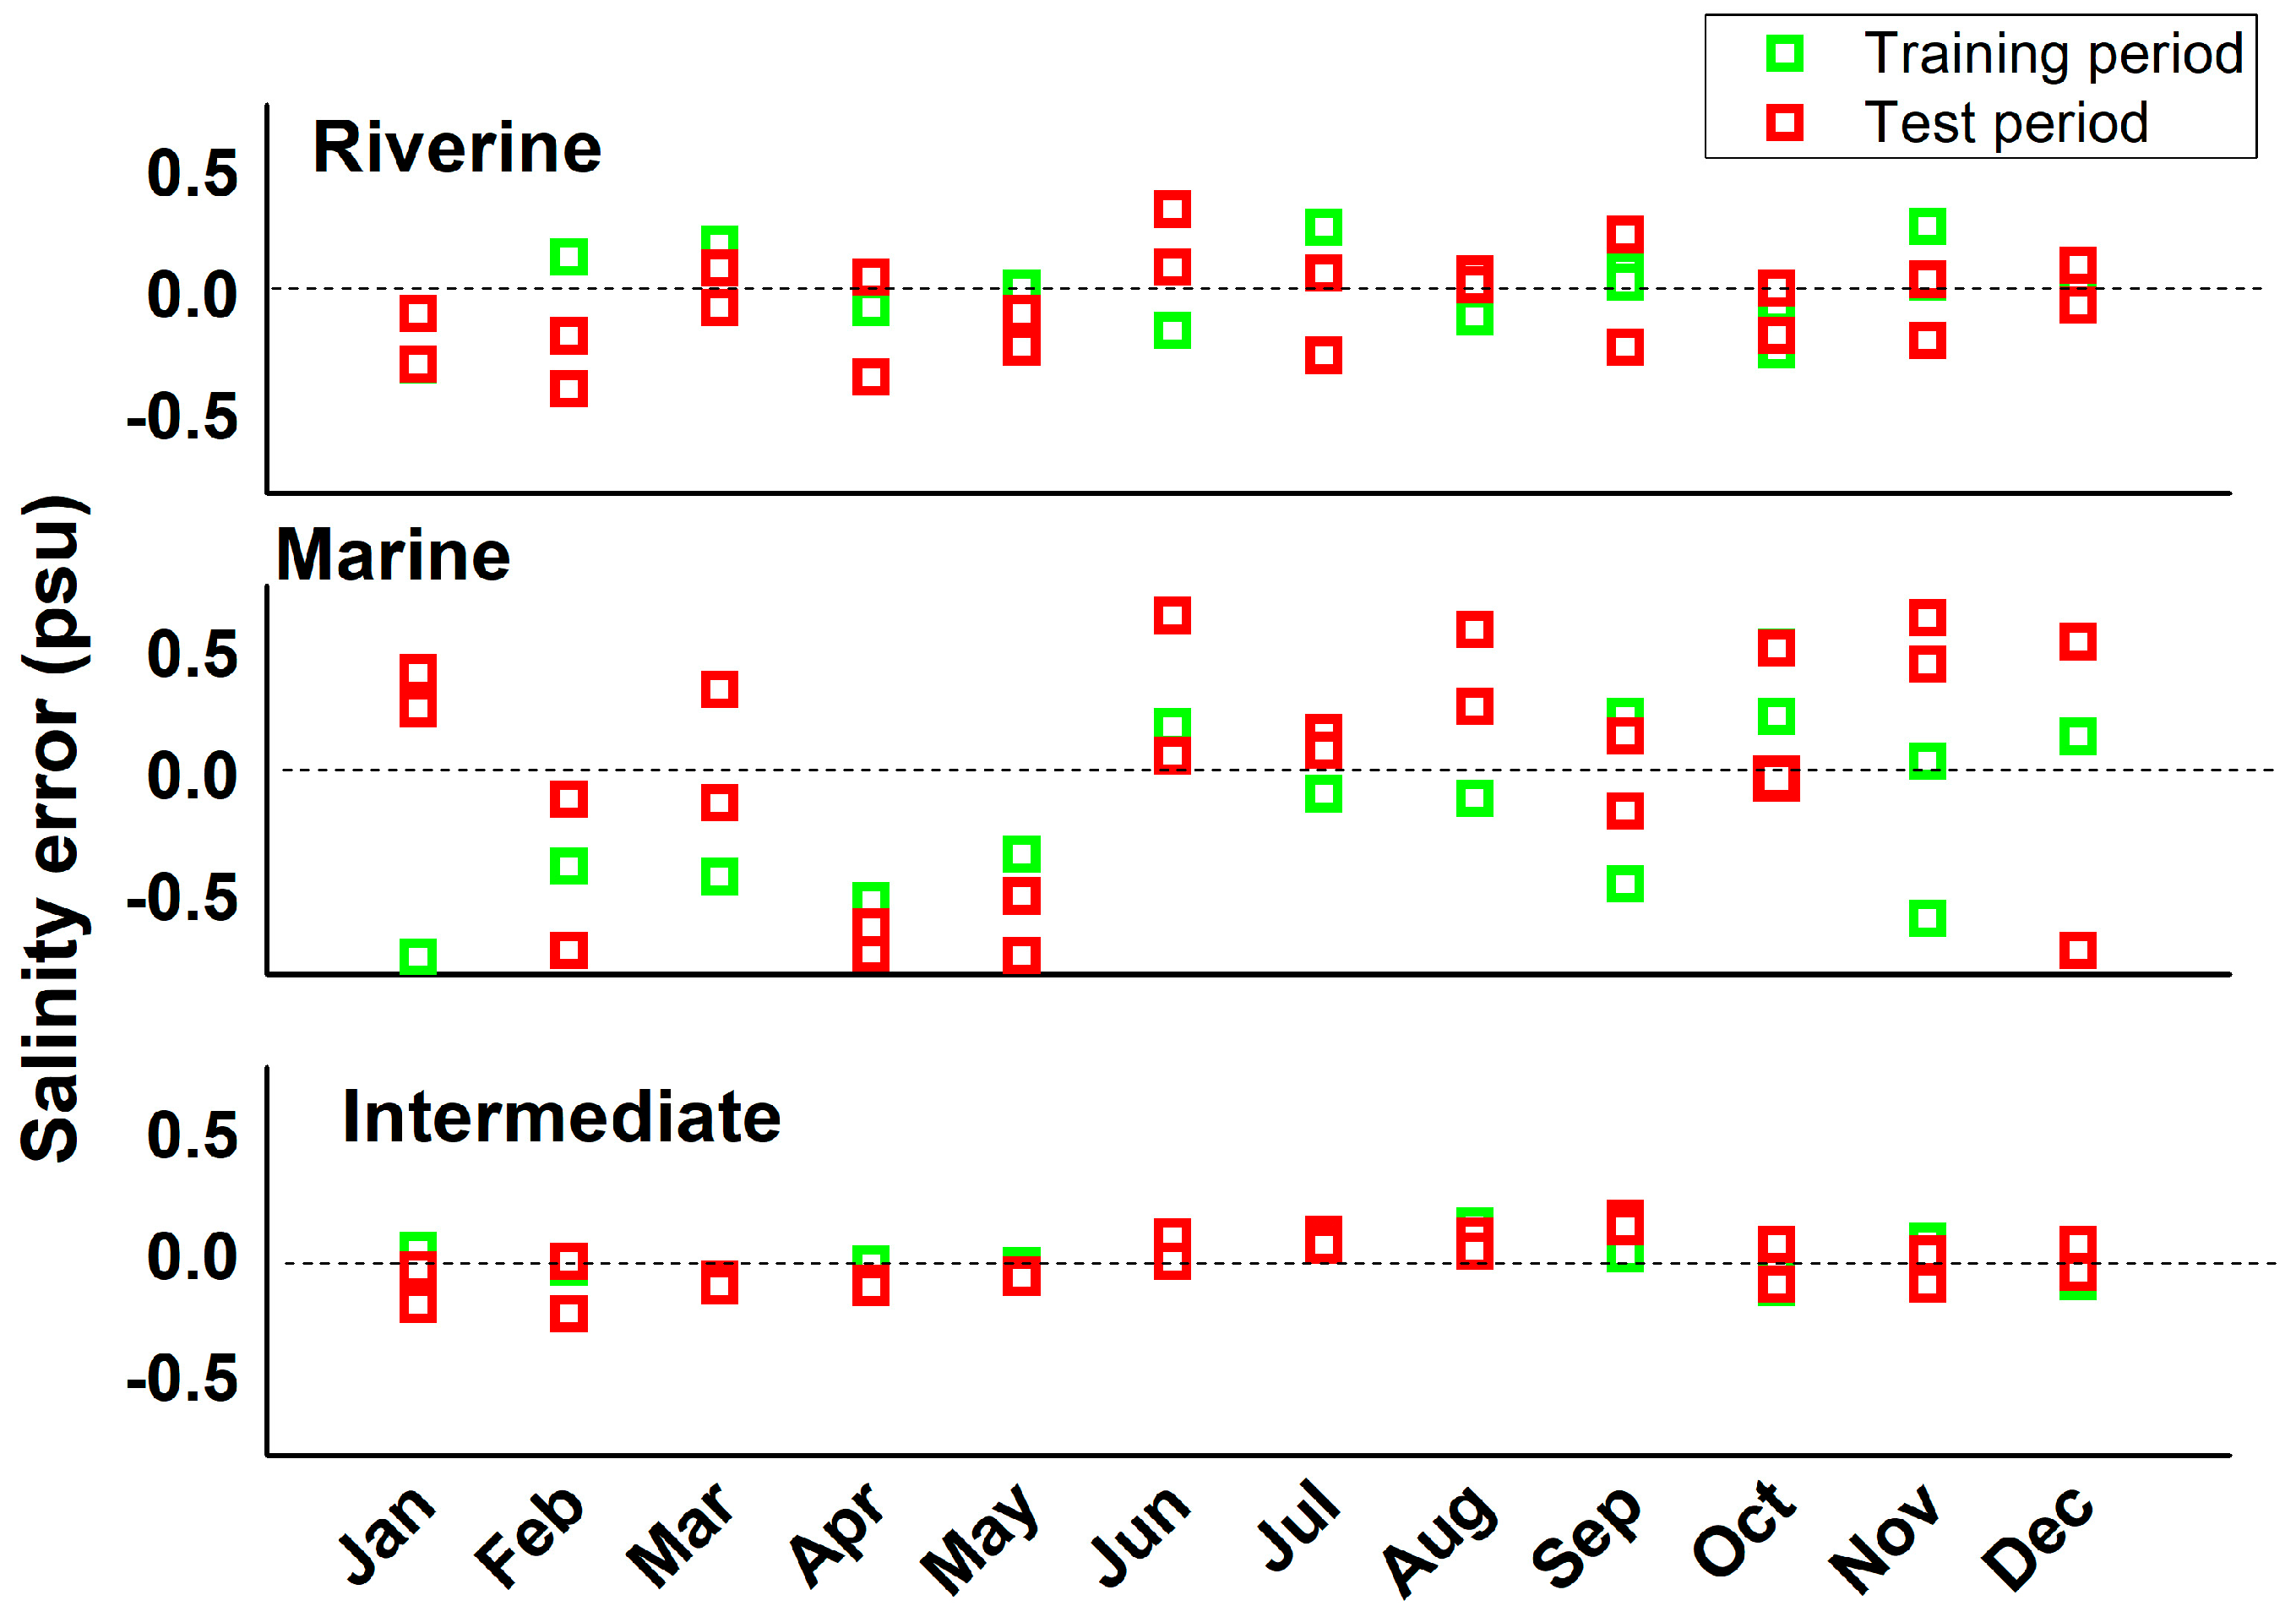
Figure 9.
Changes of temperature (top row) and salinity (bottom row) with respect to the observed period (2001-2004) at the riverine (left column), marine (central column) and intermediate (right column) under the three global warming levels 1.5°C, 2.0°C, and 3.0°C.
Figure 9.
Changes of temperature (top row) and salinity (bottom row) with respect to the observed period (2001-2004) at the riverine (left column), marine (central column) and intermediate (right column) under the three global warming levels 1.5°C, 2.0°C, and 3.0°C.
4. Discussion
The present study demonstrates the effectiveness of artificial neural networks (ANNs) in simulating the hydrographic dynamics of the Venice Lagoon under both historical and projected climatic conditions. The high performance of the ANN, with training and testing R² values exceeding 0.85 for salinity and 0.96 for temperature, confirms its capacity of ANNs to capture nonlinear relationships among environmental drivers and lagoon responses. Adopting a minimal set of variables (sea level (MSL), 2-meter air temperature, precipitation, and, for salinity offshore sea surface salinity) produces only a modest decline in accuracy, underscoring the robustness of the ANN approach and the success of sensitivity analysis for identifying the most relevant predictors. The Salinity sensitivity analysis indirectly reveals the different dynamics of the different areas of the lagoon. Sea level and offshore sea surface salinity are by far the most important predictors for the marine station, which is directly impacted by the exchanges with the open sea because of its proximity to a lagoon inlet. The 2-meter air temperature and precipitations are the main preditors at the riverine station, which is far from the lagoon inlets, experiences a limited direct water exchange with the open sea and it is close to the mouth of a river with a small basin adjacent to the lagoon kland border. At the intermediate station all four predictors exert a role of comparable importance. The same different dynamics do not emerge clearly form the sensitivity analysis of the temperature simulations, though the role exerted by sea level is larger at the marine station than at the others.To assess potential future changes in the lagoon’s hydrography under evolving climatic conditions, the ANN has been forced using environmental drivers representing future climate conditions. Specifically, the models were used to estimate changes in lagoon salinity and temperature under the expected changes of 2-meter air temperature, precipitation, sea level and off shore sea surface salinity. These variables were adjusted according to simplified rates of change established in the scientific literature (Lionello and Scarascia 2018). By integrating these climate-sensitive predictors, the study provides a forward-looking perspective on how the Venice Lagoon’s hydrographic regime may evolve in response to ongoing global climate change. Under the three global warming scenarios (1.5 °C, 2.0 °C, 3.0 °C with respect to pre-industrial), our analysis suggests an overall increase of temperature and salinity, substantially changing the properties of the water masses of the lagoon in the 3°C GWL. In this high warming scenario increases are over 6°C temperature and 4psu for salinity in summer at the riverine station, which is the most affected by climate change. The increases of both temperature and salinity have a clear seasonality, being largest in summer with the consequence of a substantially amplifying the amplitude of the seasonal cycle. Such large changes of the water masses characteristics may affect particularly benthic communities adapted to spatial niches (Solidoro et al., 2010) and that may have limited tolerance to high salinities and temperatures.. Increased temperatures and salinities could exacerbate physiological stress on stenohaline species, promote eutrophication through altered stratification, and shift trophic interactions (Garrabou et al., 2022; Smith et al., 2023). These results align with global observations of marine heatwaves driving mass mortalities and shifts in species distributions (Benthuysen et al., 2020), but extend them by quantifying localized lagoon responses. Furthermore, warmer conditions may intensify stratification, reduce oxygen solubility, and elevate eutrophication risks, necessitating proactive management to mitigate harmful algal blooms. The ANN framework thus provides a valuable scenario-based tool for anticipating ecological thresholds and informing adaptive management. Despite the promising results, several limitations warrant consideration. However, the ANN approach relies on the availability and quality of input data, In our case only 4 years of observations are available and the sampling of the phenomenology is consequently limited. It cannot be excluded that important links between drivers and responses that would be important in a climate change context are completely missed in the observations used for the training of the ANN. Further the monthly temporal resolution of the used dataset may mask sub monthly events (e.g., storm surges, pulsed river floods) that affect lagoon water properties. However, the ANN has demonstrated high predictive accuracy, successfully reconstructing hydrographic conditions during the test perioid and capturing the nonlinear interactions that characterize the Venice Lagoon’s response to external drivers. The climate change analysis is not directly based on an ensemble of model simulations, but it is based on a simplified reproduction of the ensemble mean resulting from a CMIP5 global ensemble (Lionello & Scarascia, 2018). Considering the underlying nonlinear dynamics of the lagoon, this could not represent the outcome of the application of the ANN using the predictors produced by a full ensemble of climate simulations inherent in climate projections. Considering the capability of this approach to depict the actual future of the lagoon temperature and salinity, the ANN does not account for non-climatic anthropogenic pressures, such as land reclamation, navigation dredging, and the effect of closures of the presently operative defense system (MoSE). Therefore, we are aware that further investigations are mandatory, before using these results for prioritize monitoring efforts, designing targeted interventions and assessing the impacts of thermal and salinity extremes. However, this study underscores the potential of data driven models to complement traditional hydrodynamic simulations, providing a flexible, computationally efficient approach for coastal ecosystem management in a changing climate..
Author Contributions
Conceptualization, FB. and PL; methodology, FB.; software, FB; validation, FB and PL.; formal analysis, FB.; investigation, FB and PL; resources, FB and PL; data curation, FB and MS.; writing—original draft preparation, FB.; writing—review and editing, MS and PL.; visualization, FB.; supervision, PL.; project administration, PL.; funding acquisition, PL and MS. All authors have read and agreed to the published version of the manuscript.
Funding
Please add: This research received no external funding.
Acknowledgments
FB was funded from NBFC – National Biodiversity Future Center, funded by European Union – NextGenerationEU, Project code CN_00000033, CUP F87G22000290.
Conflicts of Interest
The authors declare no conflicts of interest.
References
- Newton, A.; Icely, J.; Cristina, S.; Brito, A.; Cardoso, A.C.; Colijn, F.; Riva, S.D.; Gertz, F.; Hansen, J.W.; Holmer, M.; et al. An overview of ecological status, vulnerability and future perspectives of European large shallow, semi-enclosed coastal systems, lagoons and transitional waters. Estuarine, Coast. Shelf Sci. 2014, 140, 95–122. [Google Scholar] [CrossRef]
- Barbier, E.B.; Hacker, S.D.; Kennedy, C.; Koch, E.W.; Stier, A.C.; Silliman, B.R. The value of estuarine and coastal ecosystem services. Ecol. Monogr. 2011, 81, 169–193. [Google Scholar] [CrossRef]
- Solidoro, C. , Bandelj, V., Bernardi, F. A., Camatti, E., Ciavatta, S., Cossarini, G.,... & Torricelli, P. [2010]. Response of the Venice Lagoon ecosystem to natural and anthropogenic pressures over the last 50 years. Coastal lagoons: Critical habitats of environmental change, 8, 483-511.
- Rodrigues-Filho, J.L.; Macêdo, R.L.; Sarmento, H.; Pimenta, V.R.A.; Alonso, C.; Teixeira, C.R.; Pagliosa, P.R.; Netto, S.A.; Santos, N.C.L.; Daura-Jorge, F.G.; et al. From ecological functions to ecosystem services: linking coastal lagoons biodiversity with human well-being. Hydrobiologia 2023, 850, 2611–2653. [Google Scholar] [CrossRef] [PubMed]
- Guild, R.; Wang, X.; A Quijón, P. Climate change impacts on coastal ecosystems. Environ. Res. Clim. 2024, 3, 042006. [Google Scholar] [CrossRef]
- Kennish, M. J. , & Paerl, H. W. (Eds.). [2010]. Coastal lagoons: critical habitats of environmental change. CRC press.
- Carrasco, A.; Ferreira, Ó.; Roelvink, D. Coastal lagoons and rising sea level: A review. Earth-Science Rev. 2016, 154, 356–368. [Google Scholar] [CrossRef]
- Darmaraki, S.; Somot, S.; Sevault, F.; Nabat, P. Past Variability of Mediterranean Sea Marine Heatwaves. Geophys. Res. Lett. 2019, 46, 9813–9823. [Google Scholar] [CrossRef]
- Smith, K.E.; Burrows, M.T.; Hobday, A.J.; King, N.G.; Moore, P.J.; Gupta, A.S.; Thomsen, M.S.; Wernberg, T.; Smale, D.A. Biological Impacts of Marine Heatwaves. Annu. Rev. Mar. Sci. 2023, 15, 119–145. [Google Scholar] [CrossRef] [PubMed]
- Benthuysen, J.A.; Oliver, E.C.J.; Chen, K.; Wernberg, T. Editorial: Advances in Understanding Marine Heatwaves and Their Impacts. Front. Mar. Sci. 2020, 7. [Google Scholar] [CrossRef]
- Garrabou, J.; Gómez-Gras, D.; Medrano, A.; Cerrano, C.; Ponti, M.; Schlegel, R.; Bensoussan, N.; Turicchia, E.; Sini, M.; Gerovasileiou, V.; et al. Marine heatwaves drive recurrent mass mortalities in the Mediterranean Sea. Glob. Chang. Biol. 2022, 28, 5708–5725. [Google Scholar] [CrossRef] [PubMed]
- Rivetti, I.; Fraschetti, S.; Lionello, P.; Zambianchi, E.; Boero, F. Global Warming and Mass Mortalities of Benthic Invertebrates in the Mediterranean Sea. PLOS ONE 2014, 9, e115655. [Google Scholar] [CrossRef] [PubMed]
- Magnan, A.K.; Oppenheimer, M.; Garschagen, M.; Buchanan, M.K.; Duvat, V.K.E.; Forbes, D.L.; Ford, J.D.; Lambert, E.; Petzold, J.; Renaud, F.G.; et al. Sea level rise risks and societal adaptation benefits in low-lying coastal areas. Sci. Rep. 2022, 12, 1–22. [Google Scholar] [CrossRef] [PubMed]
- Brochier, Frédéric, and Emiliano Ramieri. Climate change impacts on the Mediterranean coastal zones. No. 27.2001. Nota di Lavoro, 2001.Solidoro, C., Bandelj, V., Bernardi, F. A., Camatti, E., Ciavatta, S., Cossarini, G.,... & Torricelli, P. [2010]. Response of the Venice Lagoon ecosystem to natural and anthropogenic pressures over the last 50 years. Coastal lagoons: Critical habitats of environmental change, 8, 483-511.
- Zanchettin, D.; Bruni, S.; Raicich, F.; Lionello, P.; Adloff, F.; Androsov, A.; Antonioli, F.; Artale, V.; Carminati, E.; Ferrarin, C.; et al. Sea-level rise in Venice: historic and future trends (review article). Nat. Hazards Earth Syst. Sci. 2021, 21, 2643–2678. [Google Scholar] [CrossRef]
- Jiménez-Navarro, I.C.; López-Ballesteros, A.; Mesman, J.P.; Trolle, D.; Pierson, D.; Senent-Aparicio, J. Modeling climate impacts on ecosystem services in an anthropized coastal lagoon for effective planning and adaptation. Clim. Chang. 2025, 178. [Google Scholar] [CrossRef]
- D’alpaos, C.; D’alpaos, A. The Valuation of Ecosystem Services in the Venice Lagoon: A Multicriteria Approach. Sustainability 2021, 13, 9485. [Google Scholar] [CrossRef]
- D’alpaos, L.; Defina, A. Mathematical modeling of tidal hydrodynamics in shallow lagoons: A review of open issues and applications to the Venice lagoon. Comput. Geosci. 2007, 33, 476–496. [Google Scholar] [CrossRef]
- Bellafiore, D.; Umgiesser, G.; Cucco, A. Modeling the water exchanges between the Venice Lagoon and the Adriatic Sea. Ocean Dyn. 2008, 58, 397–413. [Google Scholar] [CrossRef]
- Hannon, B. , & Ruth, M. [2001]. Dynamic modeling. Springer Science & Business Media.
- Lionello, P.; Scarascia, L. The relation between climate change in the Mediterranean region and global warming. Reg. Environ. Chang. 2018, 18, 1481–1493. [Google Scholar] [CrossRef]
- Smith, N. P. (1994). Water, salt and heat balance of coastal lagoons. In Elsevier Oceanography Series (Vol. 60, pp. 69-101). Elsevier.
- Guo, Q.; He, Z.; Wang, Z. Monthly climate prediction using deep convolutional neural network and long short-term memory. Sci. Rep. 2024, 14, 1–17. [Google Scholar] [CrossRef] [PubMed]
- Hersbach, H. , Bell, B., Berrisford, P., Hirahara, S., Horányi, A., Muñoz-Sabater, J.,... & Thépaut, J. N. [2020]. The ERA5 global reanalysis. Quarterly journal of the royal meteorological society, 146[730], 1999-2049.
- Poli, A.A.; Cirillo, M.C. On the use of the normalized mean square error in evaluating dispersion model performance. Atmospheric Environ. Part A. Gen. Top. 1993, 27, 2427–2434. [Google Scholar] [CrossRef]
Figure 1.
Map of the Venice Lagoon showing the locations of the three monitoring stations: riverine (black), marine (blue), and intermediate (red).
Figure 1.
Map of the Venice Lagoon showing the locations of the three monitoring stations: riverine (black), marine (blue), and intermediate (red).
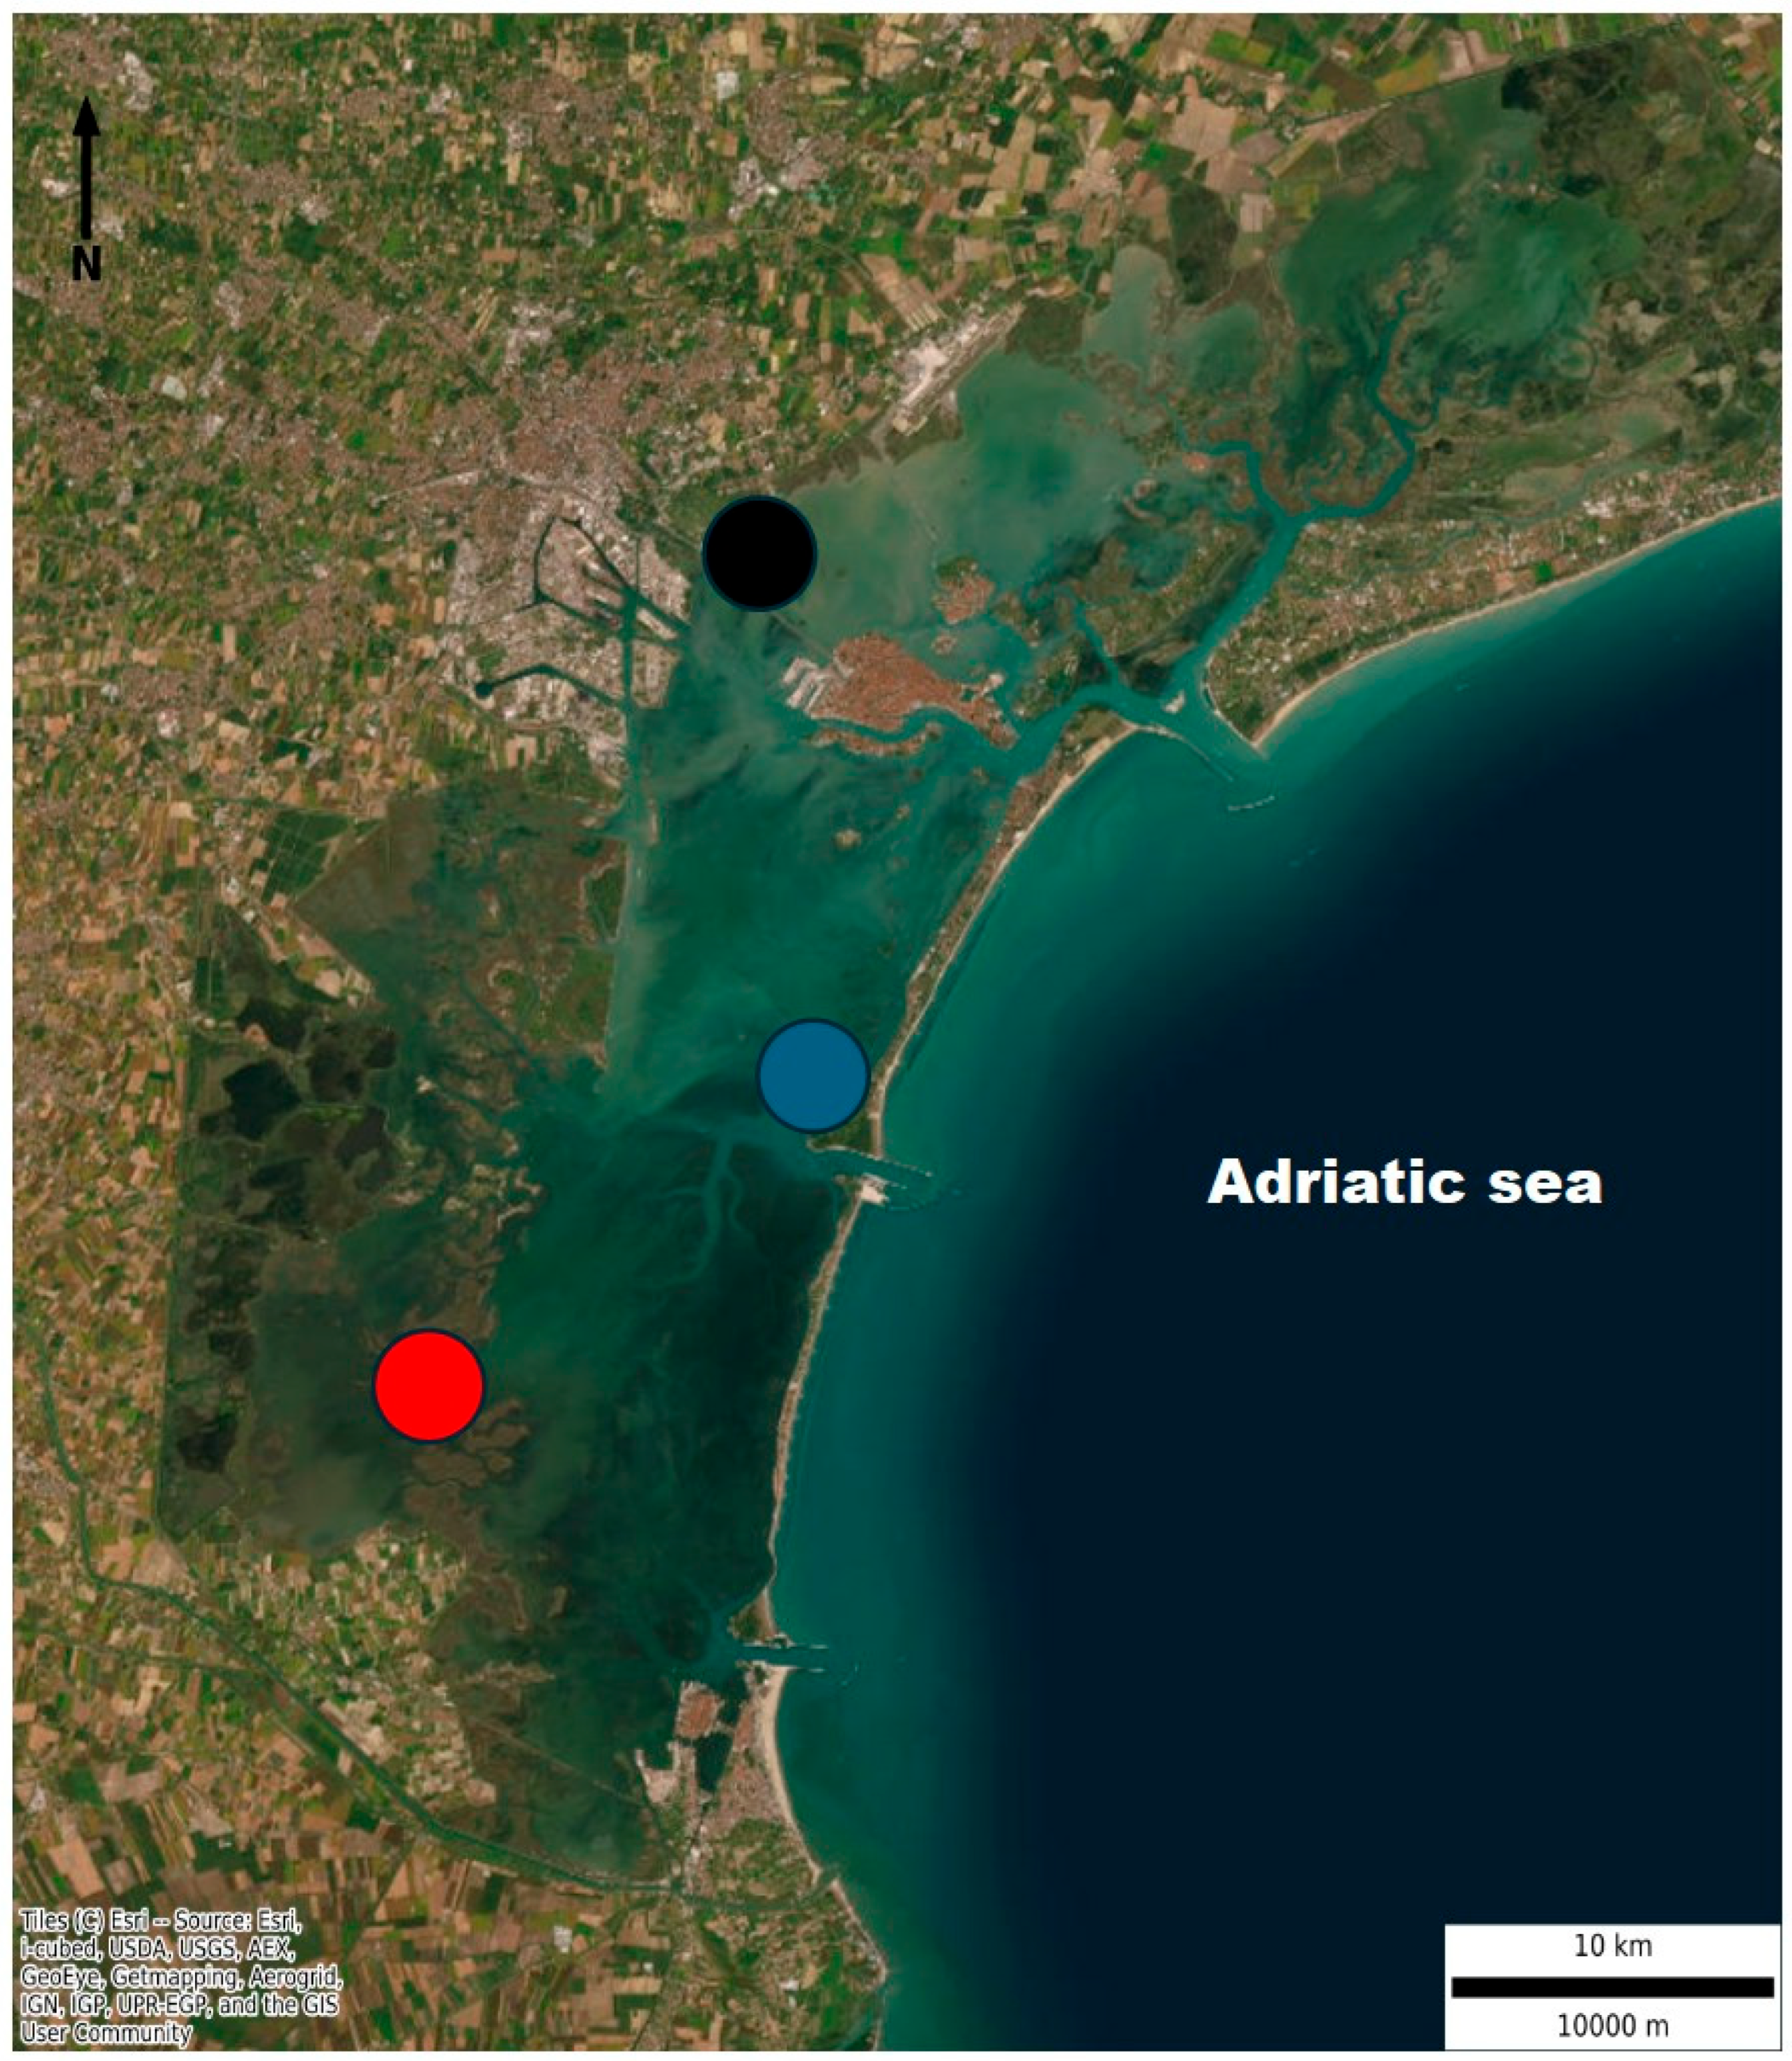
Figure 2.
heatmap showing the correlation coefficients between pairs of predictors.
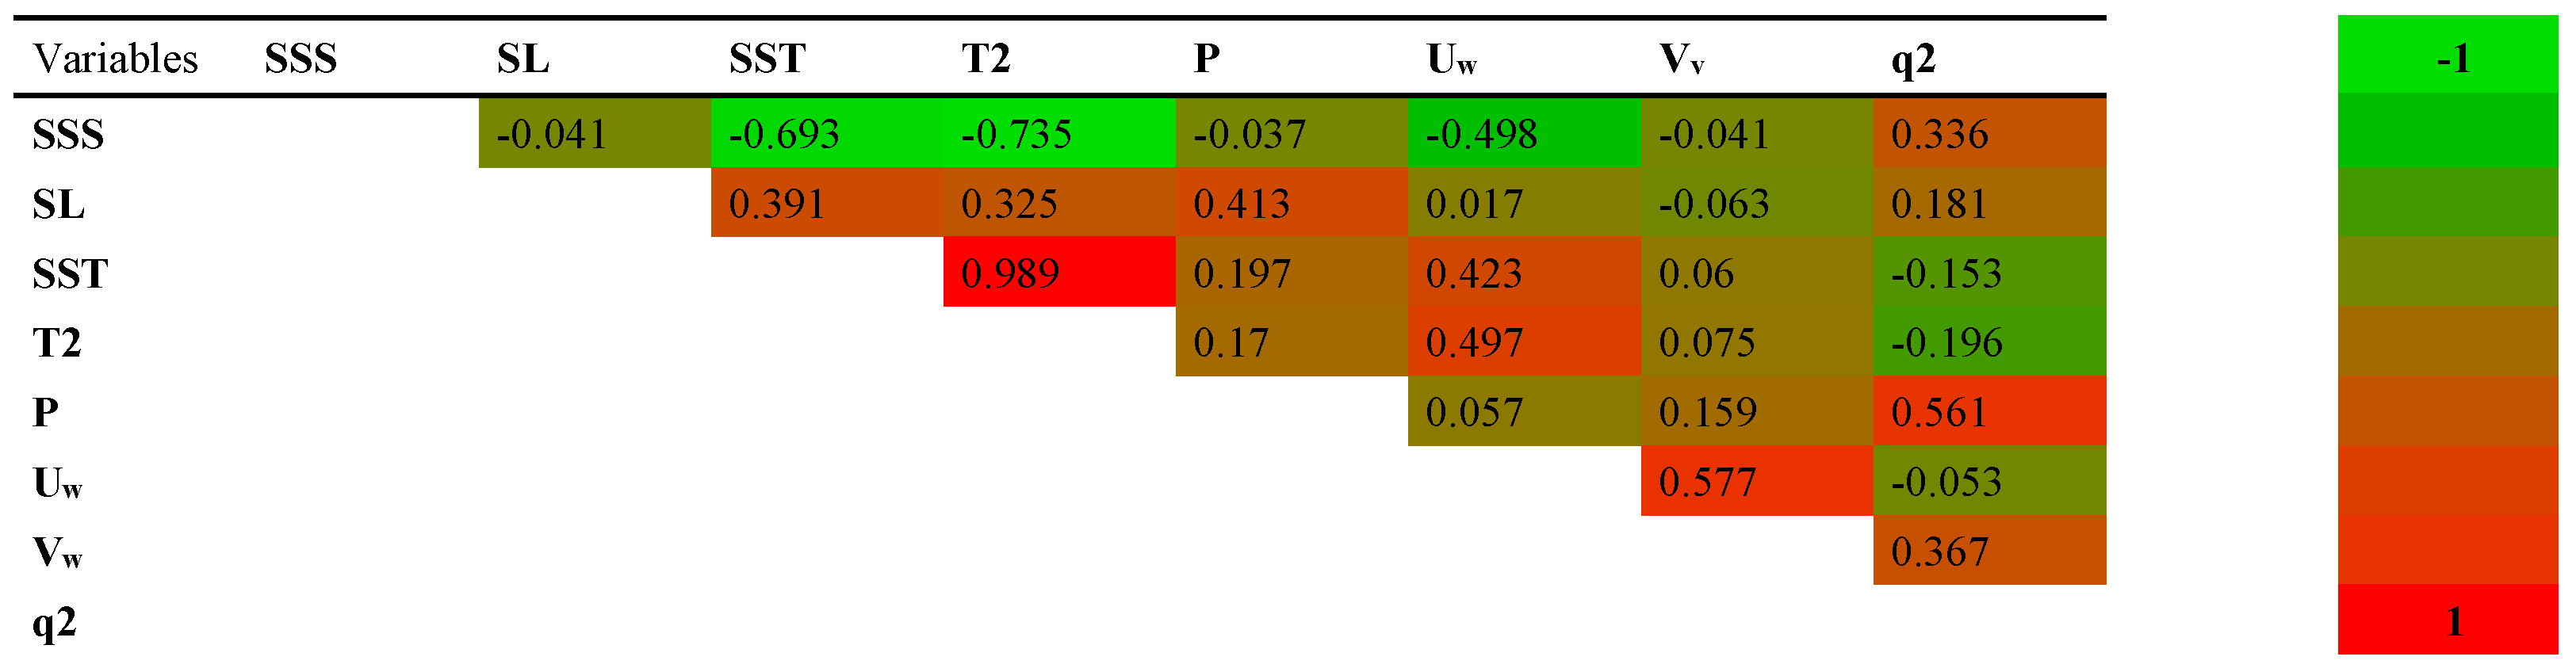
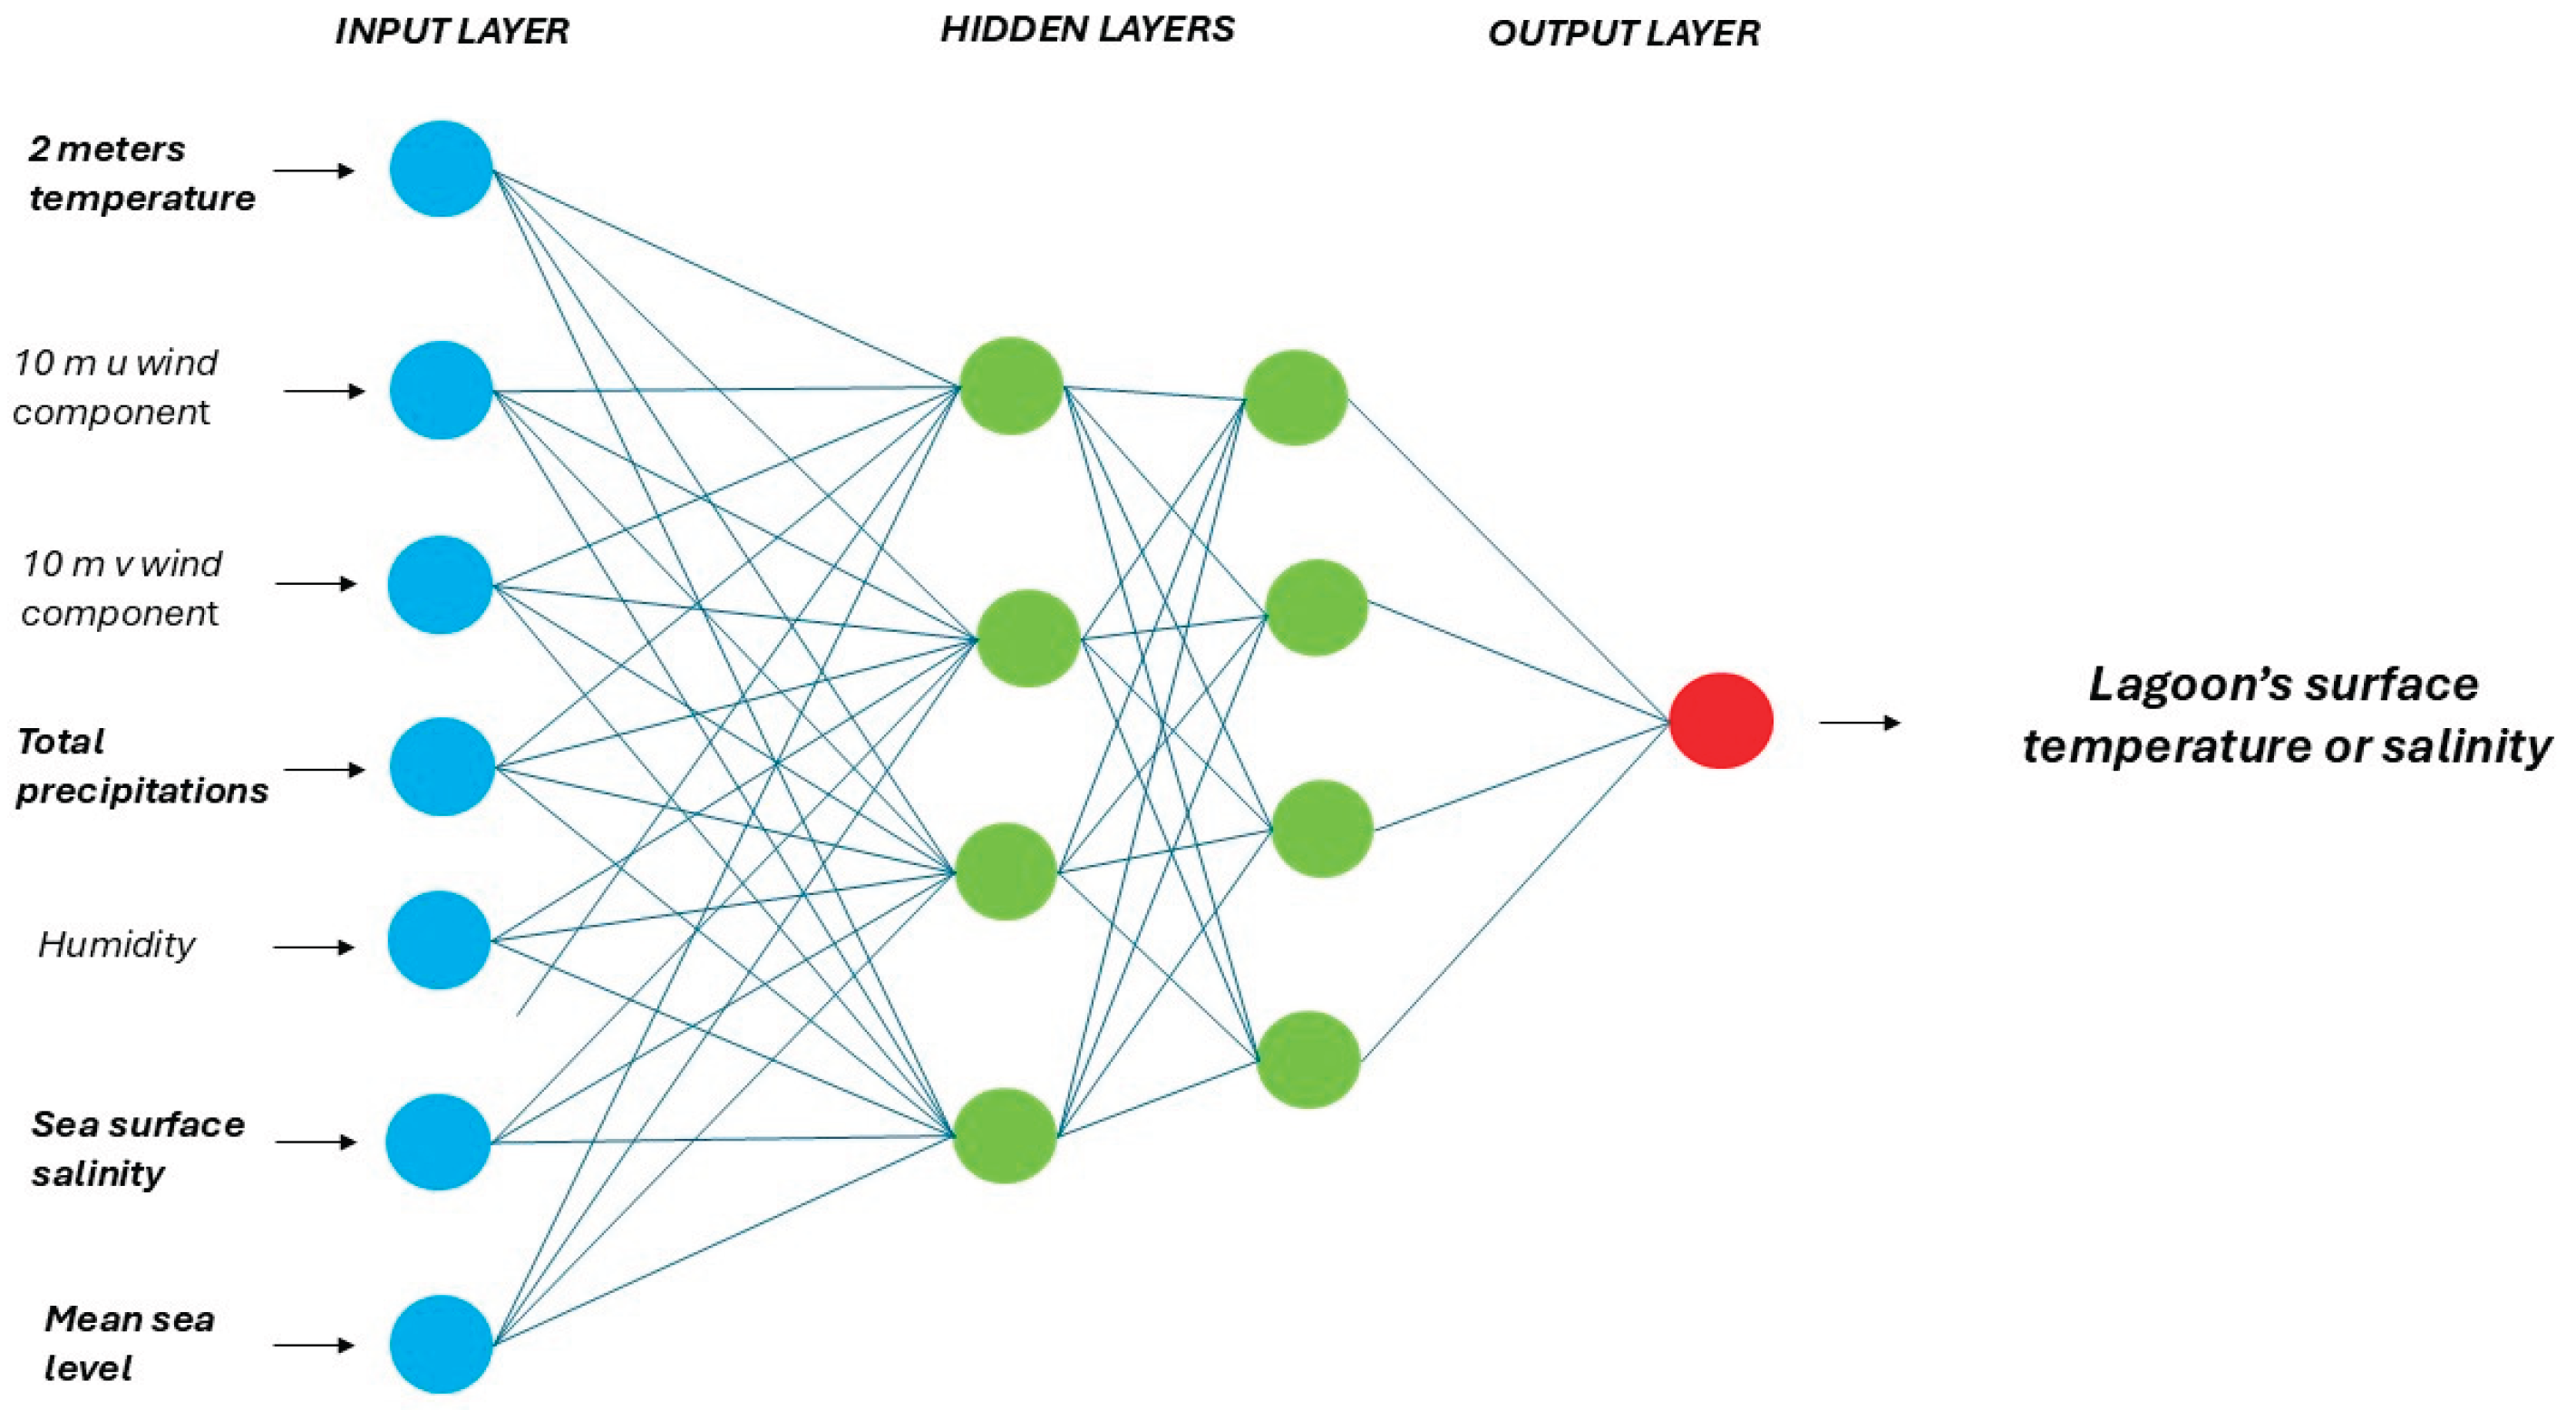
Figure 3.
Architecture of the convolutional neural network (ANN) used for modeling salinity and temperature variations. The network consists of two hidden layers, each with 30 neurons, employing sigmoid activation functions. The inputs of the ANN are the predictors, which consists of meteorological and oceanographic variables. The predictors that have been selected for the climate change simulations are highlighted in bold: 2-meter air temperature, total precipitation, and sea level for the temperature ANN, integrated with the sea surface salinity for the salinity ANN.
Disclaimer/Publisher’s Note: The statements, opinions and data contained in all publications are solely those of the individual author(s) and contributor(s) and not of MDPI and/or the editor(s). MDPI and/or the editor(s) disclaim responsibility for any injury to people or property resulting from any ideas, methods, instructions or products referred to in the content. |
© 2025 by the authors. Licensee MDPI, Basel, Switzerland. This article is an open access article distributed under the terms and conditions of the Creative Commons Attribution (CC BY) license (http://creativecommons.org/licenses/by/4.0/).
Copyright: This open access article is published under a Creative Commons CC BY 4.0 license, which permit the free download, distribution, and reuse, provided that the author and preprint are cited in any reuse.


