Submitted:
24 May 2025
Posted:
26 May 2025
You are already at the latest version
Abstract
The optical floating zone technique was utilized to purify chromium and a single-phase chromium-silicon alloy in this work. The impurity content (carbon, nitrogen and oxygen) can be reduced by decreasing the withdrawal speed of samples during the zone refining process and coarsening of grains was also observed. The effect of the impurities on mechanical property was determined by hardness measurements at room temperature, and the hardness of both, chromium and the chromium-silicon alloy were decreased with lower concentrations of nitrogen and oxygen. In contrast, brittle features were observed in samples prepared by arc melting process with higher concentrations of impurities.
Keywords:
impurities
; Cr‐Si alloys
; optical floating zone technique
; hardness
; low temperature brittleness
1. Introduction
Chromium (Cr) – based alloys show good high-temperature properties and are therefore currently investigated intensively [1,2,3,4,5,6,7,8,9]. However, brittleness at low to moderate temperatures [9,10,11,12,13,14] often prevent their application. Studies show that carbon (C), nitrogen (N) and oxygen (O) promote brittleness of Cr-based alloys [15,16,17,18,19]. In previous investigations, Cr-based alloys were fabricated using arc melting processes, additive manufacturing or investment casting. These manufacturing processes are not reported to lower impurity levels. Here, chemical and physical interactions between the melt and the mold material or a ceramic crucible respectively can occur, as Pelchen et al. show in their work [20]. The optical floating zone (OFZ) technique, described in detail in the work of Liu et al. [21] and illustrated in Figure 1, is suitable for producing high-purity materials because it enables remelting without a crucible and promotes outward diffusion of impurities [22].
In this work, Cr-based alloys are produced by OFZ to exploit its purification potential. Concentrations of C, N, and O are determined by glow discharge optical emission spectroscopy (GDOES). Martens hardness, also known as universal hardness, is measured to evaluate strength. To evaluate the brittle behavior of the specimens, crack formation on Vickers indentations is evaluated.
2. Materials and Methods
Pure Cr (Plansee SE, purity 99.95%) and pure Si (HMW Hauner, purity 99.999%) are arc melted and solidified in Argon (Ar) atmosphere into cuboid shaped ingots with nominal compositions of 100 at. % Cr and 98 at. % Cr and 2 at. % Si respectively. For OFZ, cylindrical bares with a diameter of 9 mm and a length of 110 mm are prepared from the arc melted ingots by electric discharge machining (EDM). The bares are further divided with a length ratio of 4:7, the shorter bares thereafter used as so-called seed rods and the longer bares as so-called feed rods in the OFZ. An OFZ furnace, partially shown in Figure 1 b) (FZ-T-12,000-X-VII-VPO-PC from Crystal Systems Corporation, Japan) with four xenon lamps (total power 12 kW) is used to produce nine specimens (Table 1) with two different alloy compositions. A high-pressure quartz glass tube surrounding the seed- and feed rods enables the use of Ar gas in the quality class 6.0 (purity 99.9999%).
Table 1 provides an overview of the specimens created in the OFZ and the associated process parameters. The withdrawal speed given in Table 1 is often referred to as growth rate in literature, i.e. the speed at which the seed- and feed rod are moved vertically through the focal point in the OFZ furnace. Further details to the OFZ are described by Liu et al. [21].
After OFZ, specimens are cut lengthwise using EDM so that plane-parallel surfaces are created along the longitudinal axis (Figure 2 c) and d)). Both surfaces are ground stepwise from a grain size of 320 to 1000 on a wet grinding machine and diamond sandpaper and then polished with an aqueous SiO2 suspension. For electron backscatter diffraction (EBSD) analysis specimens are vibration polished for 24 hours with a 0.06 µm SiO2 suspension and then ultrasonically cleaned in bath with water and ethanol.
Martens hardness measurements are carried out at room temperature using a Fischerscope® HM 2000. 200 measurement points of the Martens hardness with a test force of 300 mN are recorded along the longitudinal axis of every specimen. Vickers hardness measurements (Matsuzawa VMT-X S3) with a testing force of 98.1 N (= HV10) are carried out on all OFZ processed specimens. The Vickers indentations are investigated for cracks with scanning electron microscopy (SEM).
Microstructures are examined using optical microscopy (OM, Zeiss® Axioplan 2) and SEM, (Zeiss® Gemini 300, Zeiss® Sigma 300 VP and Zeiss® 1540 EsB Cross Beam). Backscattered electron images (BSE) are taken of all specimens. Element distribution maps are recorded by energy dispersive spectroscopy (EDS). Grain sizes are determined from electron backscatter diffraction (EBSD) images. If grains with a diameter larger than 500 µm occur, the grain size is in addition determined by macro etching and OM examination. The chemical composition along the longitudinal specimen axis is measured by µXRF (EDAX® Orbis PC) with a measuring spot of 30 µm in diameter. Phase determination is carried out by X-ray diffraction (XRD) using a Bruker® D8 Discovery.
Carbon (C), nitrogen (N) and oxygen (O) impurity contents are determined using glow discharge optical emission spectroscopy (GDOES, Spectruma® GDA-Alpha). Integral impurity contents of pure Cr from Plansee, pure Cr from EVOCHEM and arc melted Cr98Si2 (in at. %) are measured by inductively coupled plasma optical emission spectroscopy (ICP-OES, LECO ONH 836) to evaluate proprietary GDOES standards. Impurity levels of these standards are given in Table 4 and marked with an asterisk *
3. Results
Figure 3 shows a sliced Cr98Si2 (in at.%) specimen after OFZ, analyzed by SEM, EBSD and EDS. Within the build rod volume, elongated grains are observed (Figure 3 a). The grain length is up to 41 mm. The grain size is additionally determined by macro etching and OM investigations. Figure 3 b) shows the BSE image with corresponding EDS mappings for Cr and Si on the Cr98Si2_20 specimen as an example for all EDS investigations. EDS mappings verify single-phase microstructure of all Cr98Si2 specimens.
Table 1 shows the measured length and number of grains in the build rod of the OFZ specimens. Large grains elongated in the withdrawal direction are observed for all specimens, as shown in Figure 3. For the pure Cr specimens, the measured grain length is slightly shorter compared to the Cr98Si2 specimens.

Table 2.
Length of the largest grain and number of grains within the build rod of the OFZ specimens.
Table 2.
Length of the largest grain and number of grains within the build rod of the OFZ specimens.
| specimen |
nominal composition (in at.%) |
length of largest grain (in mm) |
number of grains within the build rod | |
| Cr | Si | |||
| Cr100_10 | 100.0 | 0.0 | > 30 | 12 |
| Cr100_20 | > 20 | 16 | ||
| Cr100_30 | 17 | |||
| Cr100_40 | 9.8 | > 30 | ||
| Cr98Si2_20LP | 98.0 | 2.0 | 0.6 | > 50 |
| Cr98Si2_10 | > 40 | 11 | ||
| Cr98Si2_20 | 12 | |||
| Cr98Si2_30 | > 20 | 22 | ||
| Cr98Si2_40 | 26 | |||
Table 3 shows the results of the µXRF measurements of all specimens containing Si. For every specimen, the mean element concentration is calculated from 20 measurements along the longitudinal axis. The alloy compositions do not deviate more than 0.3 at. % from the nominal compositions. OM investigations reveal porosities below 0.5 % for all Cr-Si specimens. Porosity of pure Cr specimens is below 0.25 %
Table 3.
Results of the µXRF measurements and pore fraction analysis by OM on the specimens with Si content.
Table 3.
Results of the µXRF measurements and pore fraction analysis by OM on the specimens with Si content.
| specimen |
nominal composition (in at. %) |
µXRF results (in at. %) |
porosity (measured at the surface) (in %) |
||
| Cr | Si | Cr | Si | ||
| Cr100_10 | 100.0 | 0.0 | 100.0 ± 0.0 | 0.0 ± 0.0 | 0.15 |
| Cr100_20 | 0.20 | ||||
| Cr100_30 | |||||
| Cr100_40 | 0.25 | ||||
| Cr, pure from Plansee® | 0.85 | ||||
| Cr, pure from EVOCHEM® | 0.80 | ||||
| Cr98Si2, arc melted | 98.0 | 2.0 | 0.70 | ||
| Cr98Si2_20LP | 97.6 ± 0.1 | 2.4 ± 0.1 | 0.30 | ||
| Cr98Si2_10 | 97.8 ± 0.1 | 2.2 ± 0.1 | 0.20 | ||
| Cr98Si2_20 | 97.9 ± 0.2 | 2.1 ± 0.2 | 0.35 | ||
| Cr98Si2_30 | 97.7 ± 0.2 | 2.3 ± 0.2 | 0.40 | ||
| Cr98Si2_40 | 98.1 ± 0.2 | 1.9 ± 0.2 | |||
XRD patterns reveal a lattice constant of for the pure Cr specimens and a lattice constant of for the Cr98Si2 (in at.%) specimens prepared by OFZ respectively. An influence of the withdrawal speed on the lattice constant is not observed.
Table 4 lists C, N and O levels measured by GDOES. Table 4 shows an almost constant concentration for C for all specimens produced by OFZ. The concentration for N varies considerably between the specimens. The specimens without Si content have the lowest N content, while the specimens that are not processed with OFZ show significantly higher N concentrations. This also applies to the O contents. With increasing withdrawal speed, an increase in the impurities N and O can be observed for both alloys.
Table 4.
Impurities measured by GDOES and of proprietary standard specimens marked with an asterisk *.
Table 4.
Impurities measured by GDOES and of proprietary standard specimens marked with an asterisk *.
| specimen |
withdrawal speed (in mm⸱h-1) |
C (in ppm) |
N (in ppm) |
O (in ppm) |
| Cr100_10 | 10 | 10 ±2 | 32 ±4 | 144 ±5 |
| Cr100_20 | 20 | 11 ±2 | 40 ±3 | 151 ±5 |
| Cr100_30 | 30 | 13 ±2 | 44 ±5 | 150 ±5 |
| Cr100_40 | 40 | 12 ±2 | 118 ±7 | 259 ±5 |
| Cr98Si2_10 | 10 | 12 ±3 | 66 ±9 | 210 ±8 |
| Cr98Si2_20LP | 20 | 12 ±2 | 82 ±7 | 211 ±7 |
| Cr98Si2_20 | 12 ±2 | 76 ±6 | 207 ±6 | |
| Cr98Si2_30 | 30 | 13 ±2 | 83 ±6 | 213 ±6 |
| Cr98Si2_40 | 40 | 12 ±2 | 114 ±9 | 244 ±6 |
| Cr, pure from Plansee®* | -- | 12 ±2 | 144 ±5 | 267 ±5 |
| Cr, pure from Plansee®* | 20 ±10 | 1163 ±50 | 140 ±50 | |
| Cr98Si2, arc melted * | 12 ±2 | 209 ±9 | 315 ±7 |
Figure 4 shows the Martens hardness results. For the measured values in Figure 4 a) and b), the hardness values averaged across all grains are given for each specimen, with scatter bars indicating the deviation. Figure 4 a) shows the pure Cr specimens. The hardness increases with increasing impurity concentration. The starting material (Cr Plansee®) shows the highest hardness at the highest impurity content. Figure 4 b) shows an increase in Martens hardness with increasing impurities. The arc melted master alloy shows the highest hardness and the highest content of C, N and O. For both alloys in Figure 4 a) and b), a grain size effect is ruled out for OFZ specimens because of similar grain sizes. Since the OFZ specimens have very large grains, a grain orientation dependent hardness measurement is possible. Figure 4 c) and d) show increased Martens hardness in grains where the indentation is perpendicular to the (001) plane of the grain, whereas the hardness perpendicular to the (111) plane is reduced. This observation applies to both alloys.
All Vickers indentations on OFZ specimens are examined for crack formation using SEM. At a resolution of 0.1 µm, no crack formation is observed in any of the OFZ specimens. Figure 5 a) and b) show two indentations on the OFZ specimens with the highest impurity content (withdrawal speed = 40 mm⸱h-1). Vickers indentations are also performed on the starting materials. Pure Cr from Plansee® shows no crack formation (Figure 5 c), whereas the arc-melted Cr98Si2 specimen shows crack formation in the corners of the indentations (Figure 5 d).
4. Discussion
Technically pure Cr and single-phase solid solution dilute Cr-Si alloys both have body centered cubic (bcc) crystal structure and therefore exhibit a brittle to ductile transition [9,23]. The brittle to ductile transition temperatures of these alloys are generally above room temperature [24,25]. In 1935, Kroll [14] showed that pure Cr has ductile properties at room temperature, hence a brittle to ductile transition temperature below room temperature, when the oxygen content is reduced to a technically feasible minimum by multi-stage reduction. Edwards et. al. [26] investigated the insertion of the impurities hydrogen (H), N, O, sulfur (S), phosphorus (P) and other elements during the electrolytic extraction of pure Cr from chromite and determined that from a purity of 99.98 at. % on Cr exhibits ductile, hence plastic deformation at room temperature and above. They also showed that impurities accumulate preferentially at grain boundaries and conclude that pure Cr should have a coarse-grained microstructure to reduce the risk of impurities entering during exposure to higher temperatures [26]. Pan et al. [27] too found that impurities in refractory metals tend to accumulate at grain boundaries. They used computer simulations to determine the effects of H, O, Si, P and S on the brittle to ductile transition of tungsten [27]. A low N content is crucial for Cr-Si alloys, since previous studies have shown that N leads to embrittlement of Cr-Si alloys [28].
In this study the impurities N and O are again identified to be crucial for the brittle to ductile transition of pure Cr and dilute Cr-Si alloys. The melting metallurgical process OFZ turned out to purify Cr and dilute Cr-Si alloys to an extend that the brittle to ductile transitions take place below room temperature. The lower the OFZ withdrawal speed, the lower the impurities levels in the processed alloys. In addition, OFZ processed alloys have low porosities and homogeneous microstructures. OFZ generates coarse elongated grains, which is not possible with other melting metallurgical processes such as arc melting or investment casting [29,30]. The melting metallurgical OFZ process is an alternative to the chemical processes of multi-stage reduction [14] and electrolytic extraction [26] of the elemental alloy components to obtain high purity Cr and dilute Cr-Si alloys.
5. Conclusions
Cr and Cr-Si alloys can be purified by OFZ. In particular, the OFZ process results in very low N and O levels. The slower the OFZ withdrawal speed, the lower the impurities levels. Low N and O levels together with grain coarsening through OFZ processing affected the deformation behavior of Cr and Cr-Si alloys. By OFZ purified and coarsened Cr and Cr-Si alloys have decreased hardnesses, but do not show brittle fracture at room temperature. Hence these purified alloys have brittle to ductile transition temperatures below room temperature.
Acknowledgments
This work is financed by the German Research Foundation (DFG) through the research project GL 181/60-1, project number 404942487 and by the “High Entropy Materials Center” from The Featured Areas Research Center Program within the framework of the Higher Education Sprout Project by the Ministry of Education (MOE) in Taiwan. The authors thank the MaDeRaisE project in the aviation research program LuFo VI-3 of the Federal Ministry for Economic Affairs and Climate Action listed under project number 20E2222B for financial support.
Conflicts of Interest
The authors declare no conflicts of interest. The funders had no role in the design of the study; in the collection, analyses, or interpretation of data; in the writing of the manuscript; or in the decision to publish the results.
Abbreviations
The following abbreviations are used in this manuscript:
| EBSD | electron backscattered diffraction |
| EDM | electric discharge machining |
| EDS | energy dispersive spectroscopy |
| GDOES | glow discharge optical emission spectroscopy |
| ICP-OES | inductively coupled plasma optical emission spectroscopy |
| OFZ | optical floating zone |
| OM | optical microscopy |
| ppm | parts per million |
| SEM | scanning electron microscopy |
| XRD | X-ray diffraction |
| µXRF | Micro- x-ray fluorescence spectroscopy |
References
- Dorcheh A.S., Galetz M.C.; Challenges in Developing Oxidation-Resistant Chromium-Based Alloys for Applications Above 900°C; JOM 68, (2016) 2793-2802. [CrossRef]
- Gu Y.F., Harada H., Ro Y.; Chromium and chromium-based alloys: Problems and possibilities for high-temperature service; JOM 56, (2004) 28-33. [CrossRef]
- Ulrich A.S., Pfizenmaier P., Solimani A., Glatzel U., Galetz M.C.; Improving the oxidation resistance of Cr-Si-based alloys by ternary alloying; Corrosion Science 165, (2020) 108376. [CrossRef]
- Pfizenmaier P., Ulrich A.S., Galetz M.C., Glatzel U.; Determination of heat treatment parameters by experiments and CALPHAD for precipitate hardening of Cr-Alloys with Si, Ge and Mo; Intermetallics 116, (2020) 106636. [CrossRef]
- Aono Y., Omori T., Kainuma R.; Microstructure and high-temperature strength in Cr–Si binary alloys; Intermetallics 112, (2019) 106526. [CrossRef]
- Klopp W.D.; Recent Developments in Chromium and Chromium Alloys; JOM 21, (1969) 23-32. [CrossRef]
- Motojima S., Ohashi C., Hattori T., Iwanaga H.; Single crystal growth of Cr3Si and Cr5Si3 using in-situ CVD process; Journal of Crystal Growth 96, (1989) 127-134. [CrossRef]
- Xu J., Sun J., Jiang S.; Mechanical properties of sputter-deposited nanocrystalline Cr3Si film; Materials Letters 63, (2009) 1082-1084. [CrossRef]
- Lu Y., Han W.-Z.; Lowering the ductile-to-brittle transition temperature to -36 °C via fine-grained structures in chromium; Scripta Materialia 239, (2024) 115813. [CrossRef]
- Brandes E.A., Greenaway H.T., Stone H.E.N.; Ductility in Chromium; Nature 178, (1956) 587. [CrossRef]
- Gao M.C., Doğan Ö.N., King P., Rollett A.D., Widom M.; The first-principles design of ductile refractory alloys; JOM 60, (2008) 61-65. [CrossRef]
- Harada Y., Ohmori M.; Ductile–brittle transition behavior of rolled chromium; Journal of Materials Processing Technology 153-154, (2004) 93-99. [CrossRef]
- Johnstone S.T.M., Henderson F., Wain H.L.; Recrystallization and the Ductility of Chromium; Nature 180, (1957) 806. [CrossRef]
- Kroll W.; Das duktile Chrom; Zeitschrift für anorganische und allgemeine Chemie 226, (1935) 23-32. [CrossRef]
- Tervo H., Kaijalainen A., Pikkarainen T., Mehtonen S., Porter D.; Effect of impurity level and inclusions on the ductility and toughness of an ultra-high-strength steel; Materials Science and Engineering: A 697, (2017) 184-193. [CrossRef]
- Smith W.H., Seybolt A.U.; Ductile Chromium; Journal of The Electrochemical Society 103, (1956) 347. [CrossRef]
- Briant C.L.; Impurity Effects in Chromium and Titanium; Materials Transactions, JIM 41, (2000) 161-165. [CrossRef]
- Briant C., Kumar K., Rosenberg N., Tomioka H.; The mechanical properties of high purity chromium; International Journal of Refractory Metals and Hard Materials 18, (2000) 9-11. [CrossRef]
- Brady M., Anderson I., Weaver M., Meyer H., Walker L., Miller M., Larson D., Wright I., Sikka V., Rar A., Pharr G., Keiser J., Walls C.; Nitrogen impurity gettering in oxide dispersion ductilized chromium; Materials Science and Engineering: A 358, (2003) 243-254. [CrossRef]
- Pelchen L., Schenker M., Lepple M., Ulrich A.S.; Reaction of a Molten Cr-Si-Base Alloy with Ceramics and a High Entropy Oxide; High Temperature Corrosion of Materials 101, (2024) 897-909. [CrossRef]
- Liu C.-J., Gadelmeier C., Lu S.-L., Yeh J.-W., Yen H.-W., Gorsse S., Glatzel U., Yeh A.-C.; Tensile creep behavior of HfNbTaTiZr refractory high entropy alloy at elevated temperatures; Acta Materialia 237, (2022) 118188. [CrossRef]
- Wang X., Xiang W., Zhong Y., Wan L., Yan F., Xian Q., Jiang B., Wang J.; Preferential growth of directionally solidified Al2O3/SmAlO3 eutectic ceramics; Scripta Materialia 187, (2020) 424-427. [CrossRef]
- Jiang H., He B.B., Huang M.X.; Understanding the tensile ductility of a novel low-activation BCC high-entropy alloy deformed at intermediate temperature; Scripta Materialia 252, (2024) 116269. [CrossRef]
- Harada Y., Ohmori M.; Effect of Thermo-mechanical Treatment on Ductile-Brittle Transition Behavior of Chromium; Journal of the Japan Institute of Metals 66, (2002) 485-491. [CrossRef]
- Schwartzberg, F.R.; Ogden, H.R.; Jaffee, R.I.; DUCTILE-BRITTLE TRANSITION IN THE REFRACTORY METALS; Battelle Memorial Inst., Defense Metals Information Center, Columbus, Ohio Ausgabe 1959.
- Edwards A.R., Nish J.I., Wain H.L.; The preparation and properties of high-purity chromium; Metallurgical Reviews 4, (1959) 403-449. [CrossRef]
- Pan Z., Kecskes L.J., Wei Q.; The nature behind the preferentially embrittling effect of impurities on the ductility of tungsten; Computational Materials Science 93, (2014) 104-111. [CrossRef]
- Pfizenmaier P., Ulrich A.S., Galetz M.C., Glatzel U.; Tensile Creep Properties of Cr-Si Alloys at 980 °C in Air—Influence of Ge and Mo Addition; Metals 11, (2021) 1072. [CrossRef]
- K. Sandner, R. Völkl, D. Dickes, J.-T. Kuo, A.C. Yeh, U. Glatzel; Investment casting of Cr-Si alloys with liquidus temperatures up to 1900 °C; International Journal of Metalcasting 2024, (2024).
- Chesetti A., Banerjee S., Dasari S., Nartu M.S.K., Varahabhatla S.M., Sharma A., Ramakrishnan A., Satko D., Gorsse S., Salem A., Banerjee R.; 3D printable low density B2+BCC refractory element based complex concentrated alloy with high compressive strength and plasticity; Scripta Materialia 225, (2023) 115160. [CrossRef]
Figure 1.
a) schematic drawing of the essential components of an OFZ furnace. Seed- and feed rods are mounted inside a quartz glass tube which can be evacuated or filled with Ar gas. b) View inside the furnace chamber of the OFZ device used for this work. Heat input into the specimens is provided by four xenon lamps with total power of 12 kW.
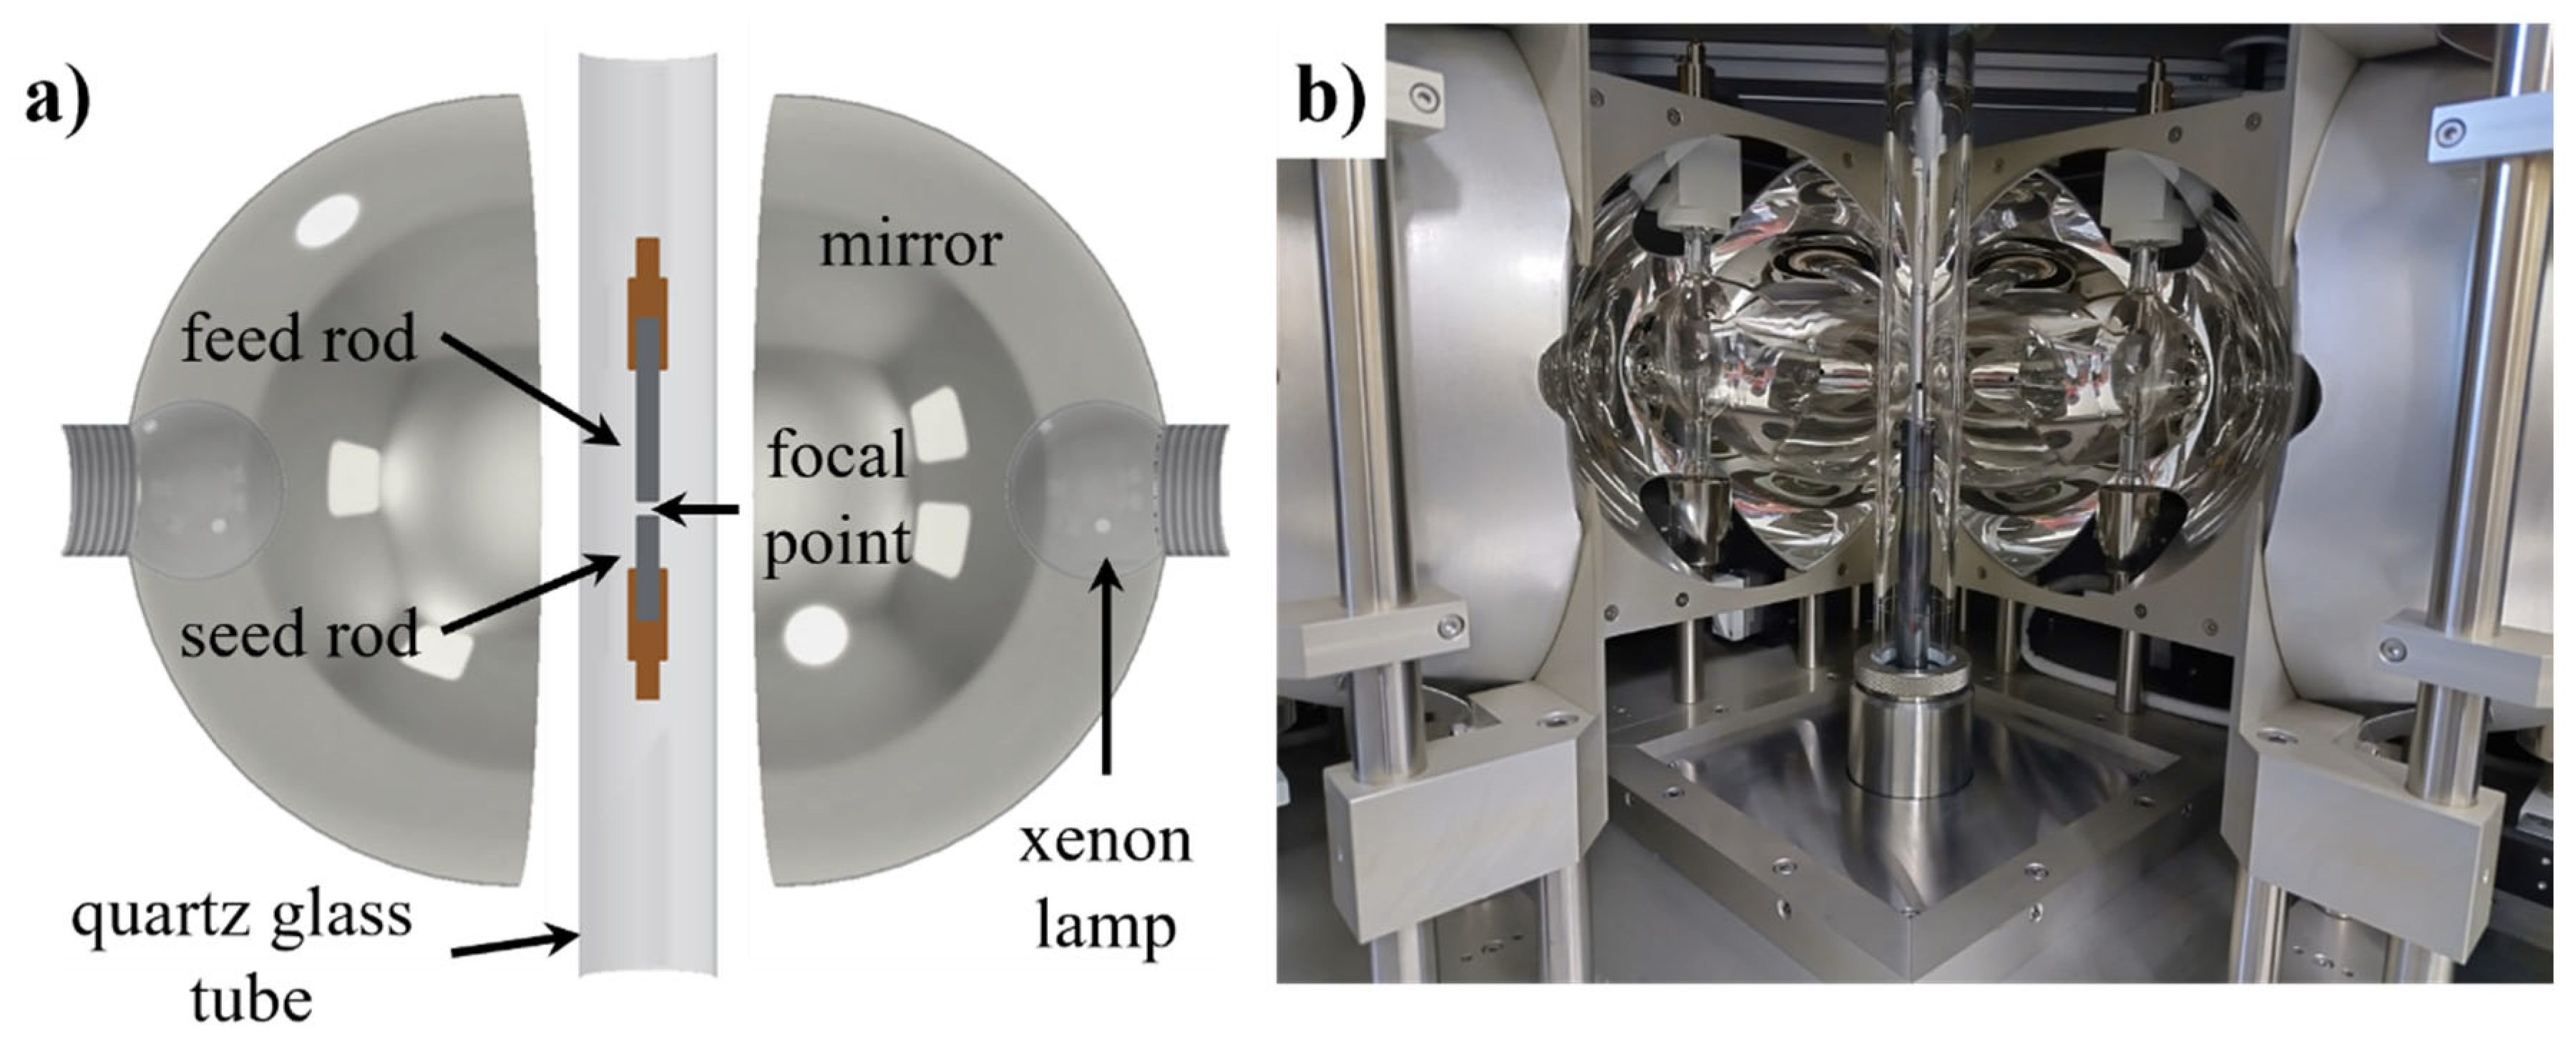
Figure 2.
a) Cr98Si2 (in at.) master alloy ingot produced by arc melting. b) seed- and feed rod prepared out of the master alloy ingot by EDM. c) side- and d) front view of the specimen produced by OFZ. The build rod represents the remelted volume of the feed rod.
Figure 2.
a) Cr98Si2 (in at.) master alloy ingot produced by arc melting. b) seed- and feed rod prepared out of the master alloy ingot by EDM. c) side- and d) front view of the specimen produced by OFZ. The build rod represents the remelted volume of the feed rod.
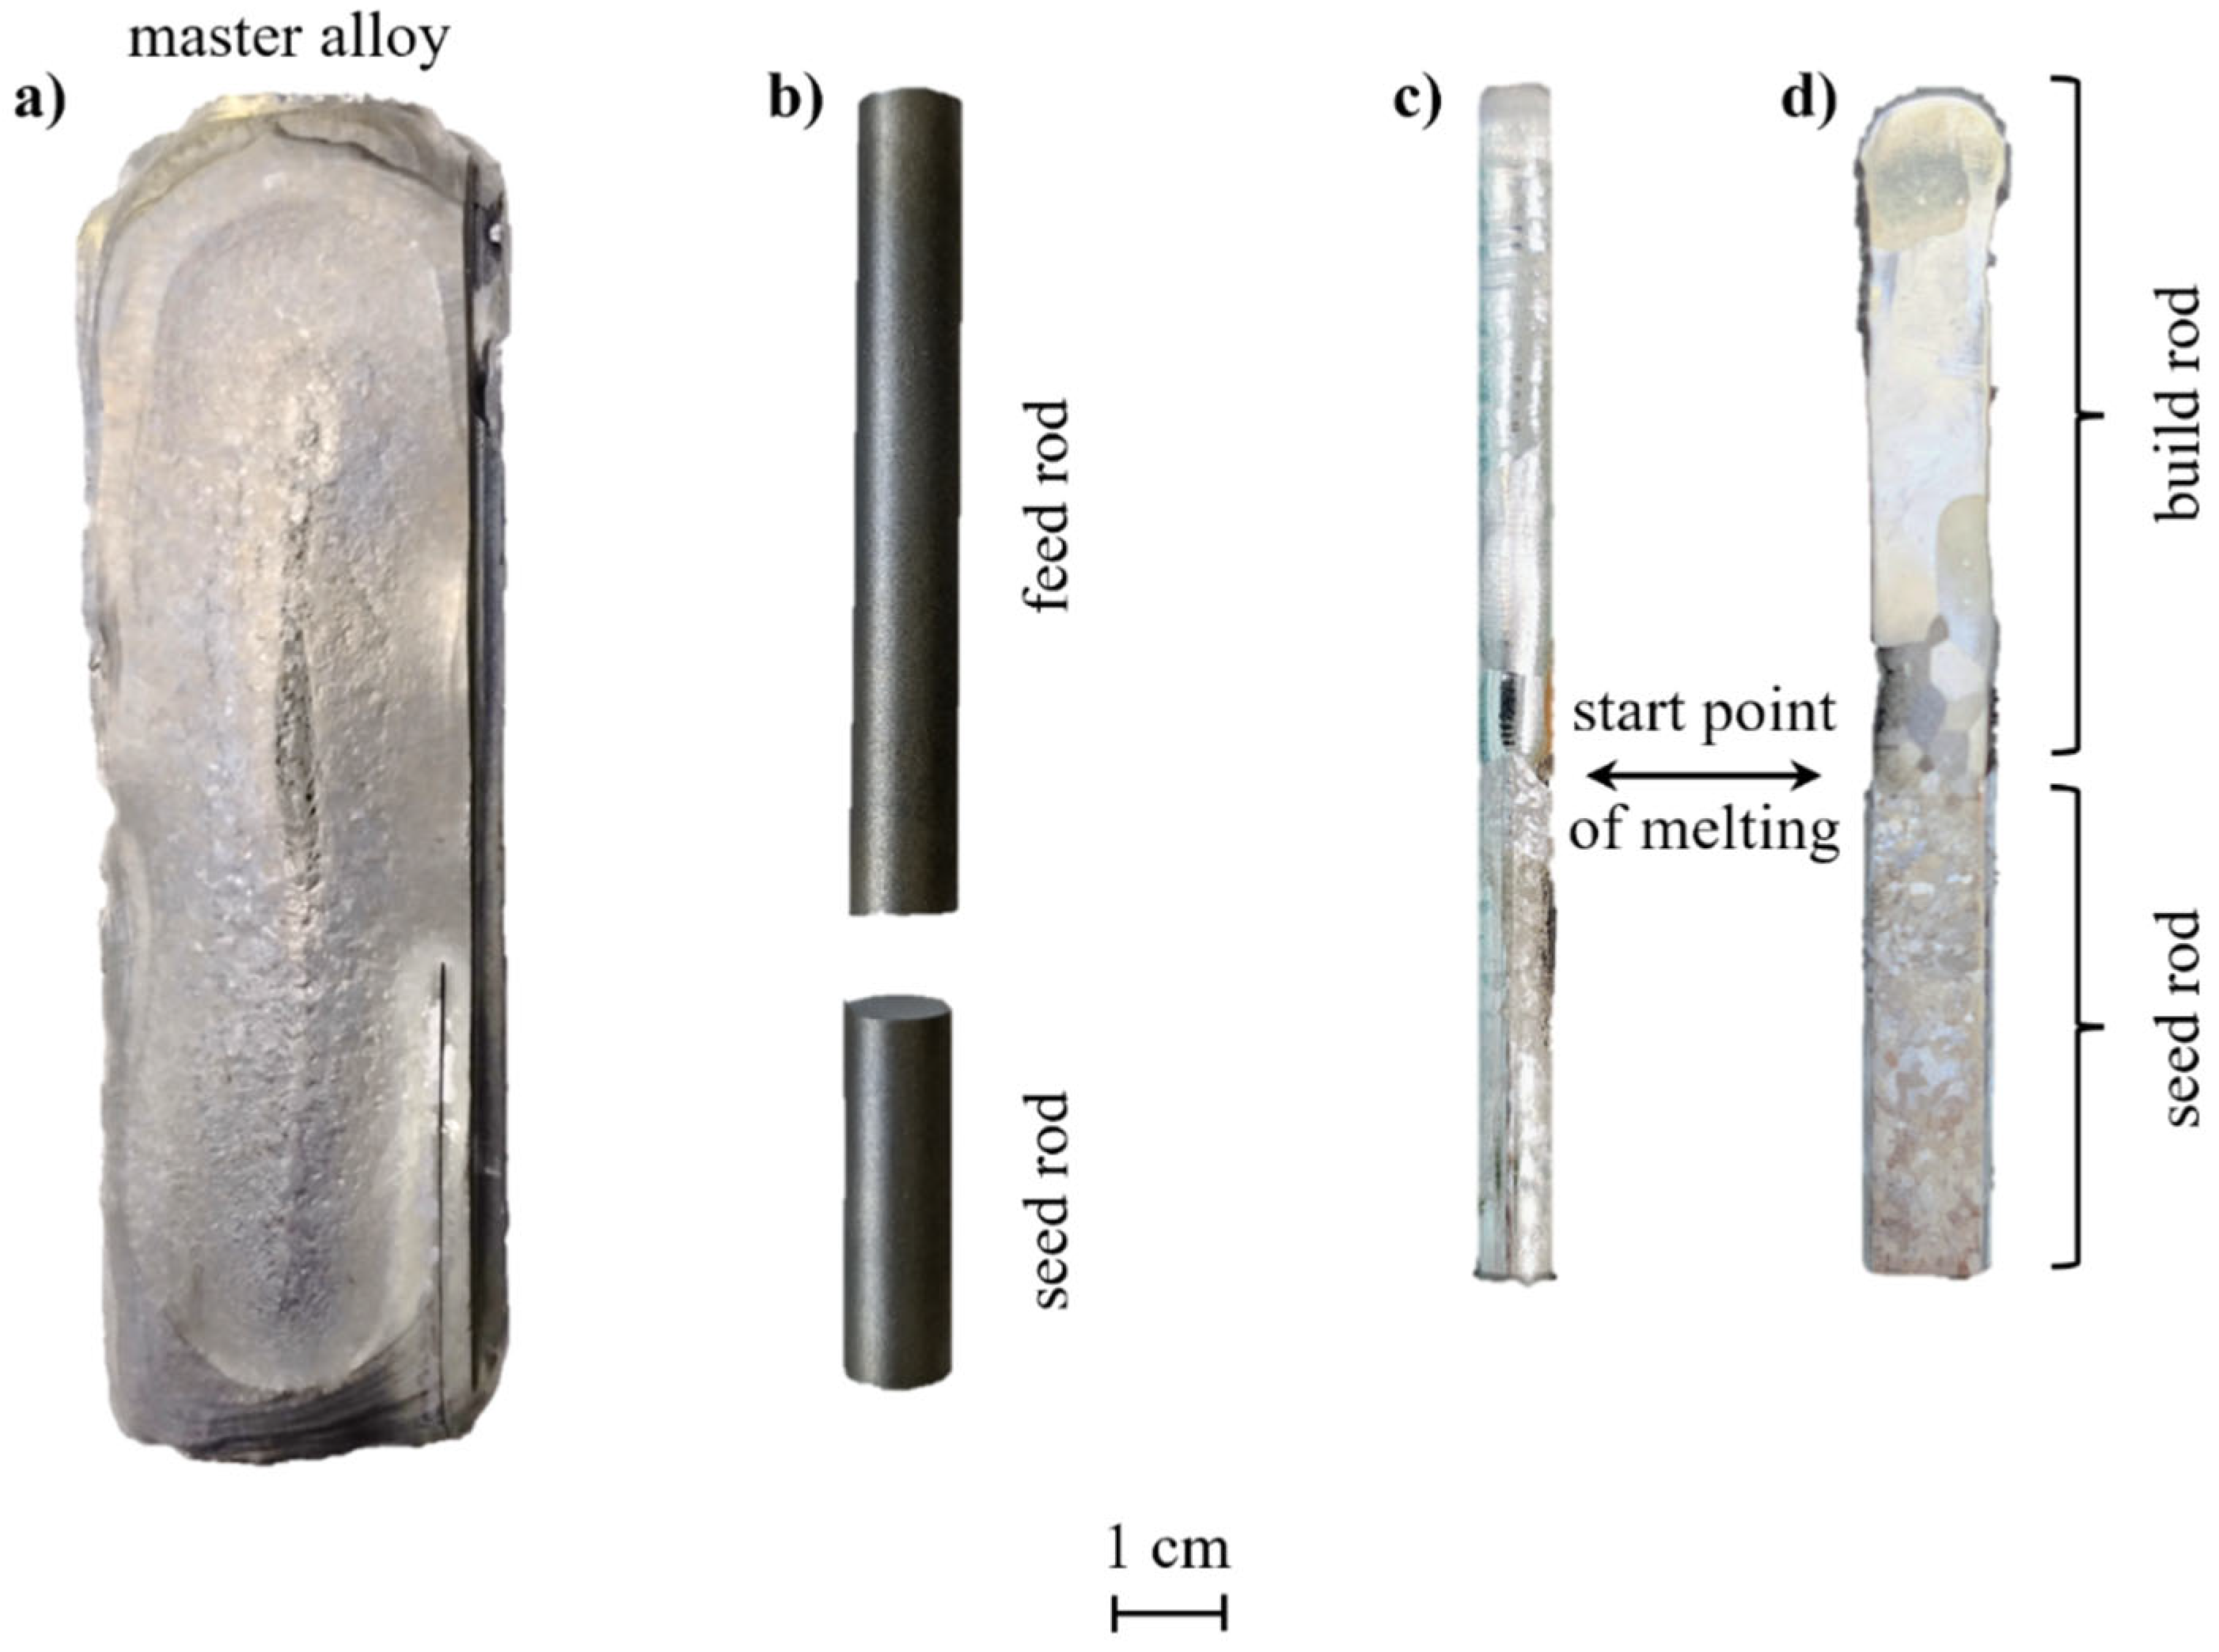
Figure 3.
a) EBSD mappings at three different locations on the front surface of the Cr98Si2_20 specimen with corresponding pole figures. A 41 mm long grain appears in the upper section of the specimen. b) BSE image with EDS mappings for Cr and Si proving the single-phase microstructure of the Cr98Si2 (in at.%) specimen.
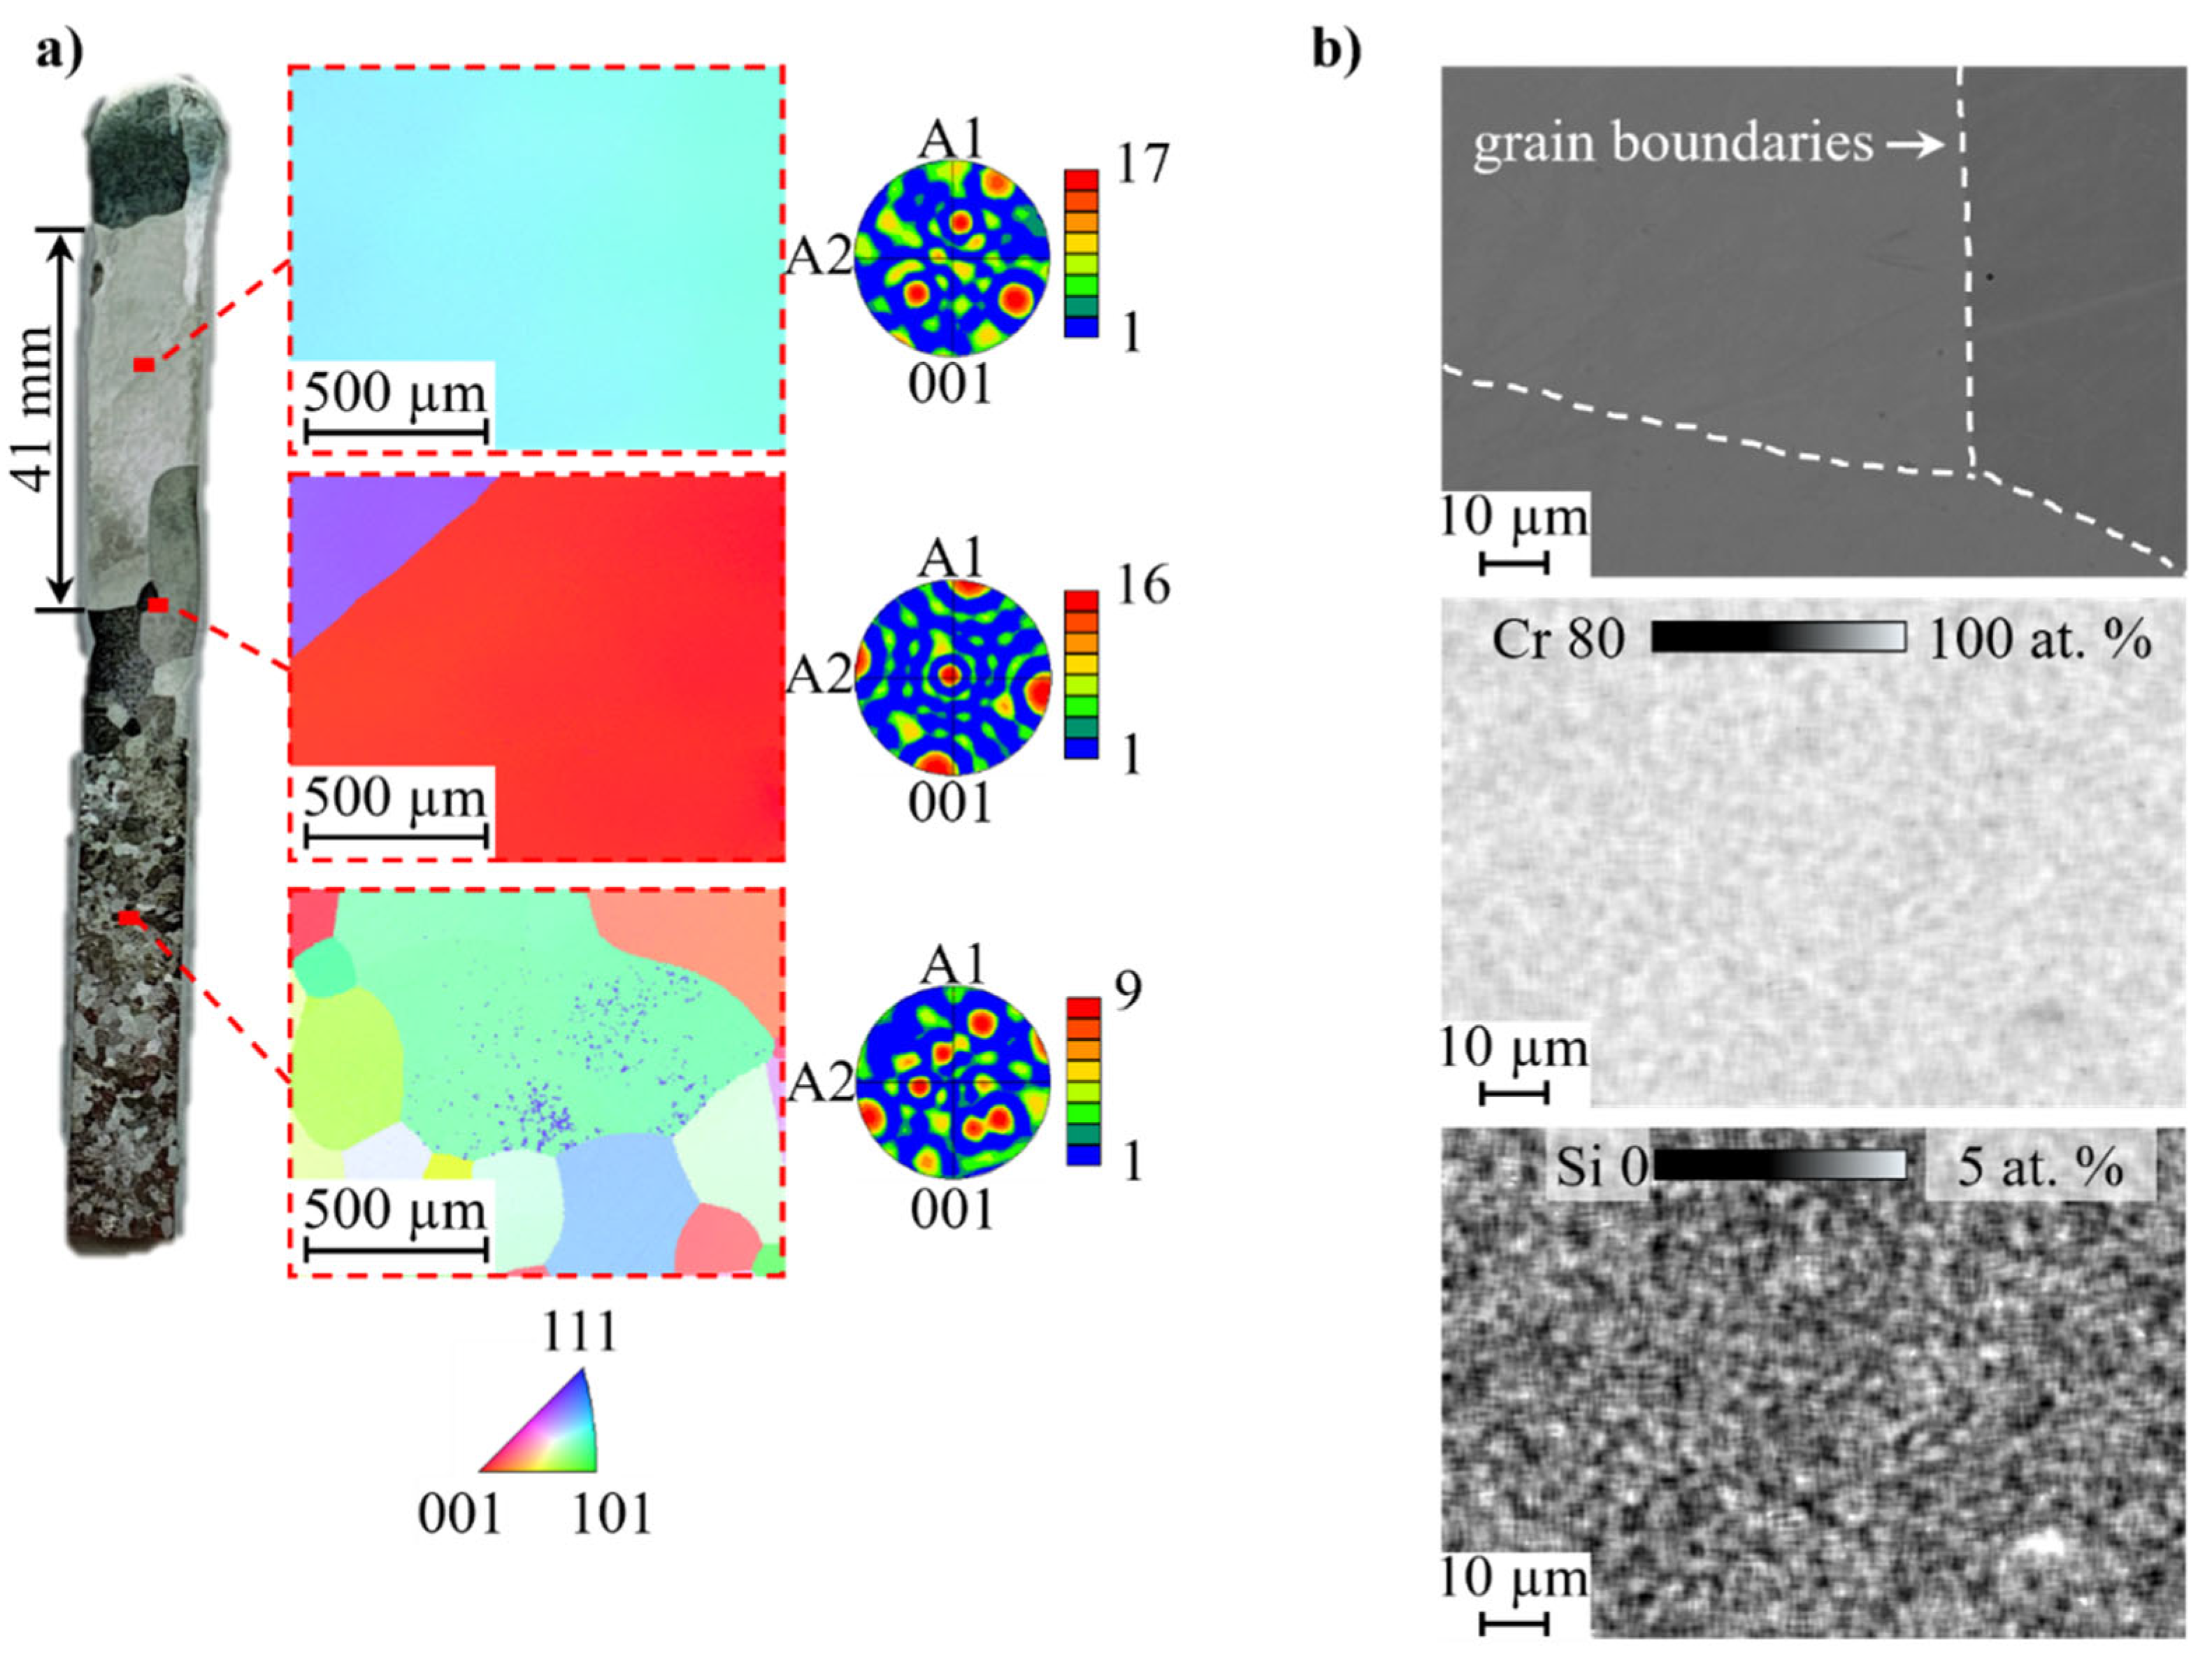
Figure 4.
a) measured Martens hardness over the sum of the impurities C, N and O for all four pure Cr OFZ specimens. As reference, the starting material (Cr Plansee®) and Cr with increased N concentration (Cr EVOCHEM®) are given. b) Martens hardness over the sum of C, N and O for Cr98Si2 (in at.%) specimens prepared by OFZ. The arc melted master alloy showing increased hardness and impurities contents. c) and d) show increased Martens hardness in (001) direction for Cr100 and Cr98Si2 respectively. The scatter of the measured results is lower than the symbol size.
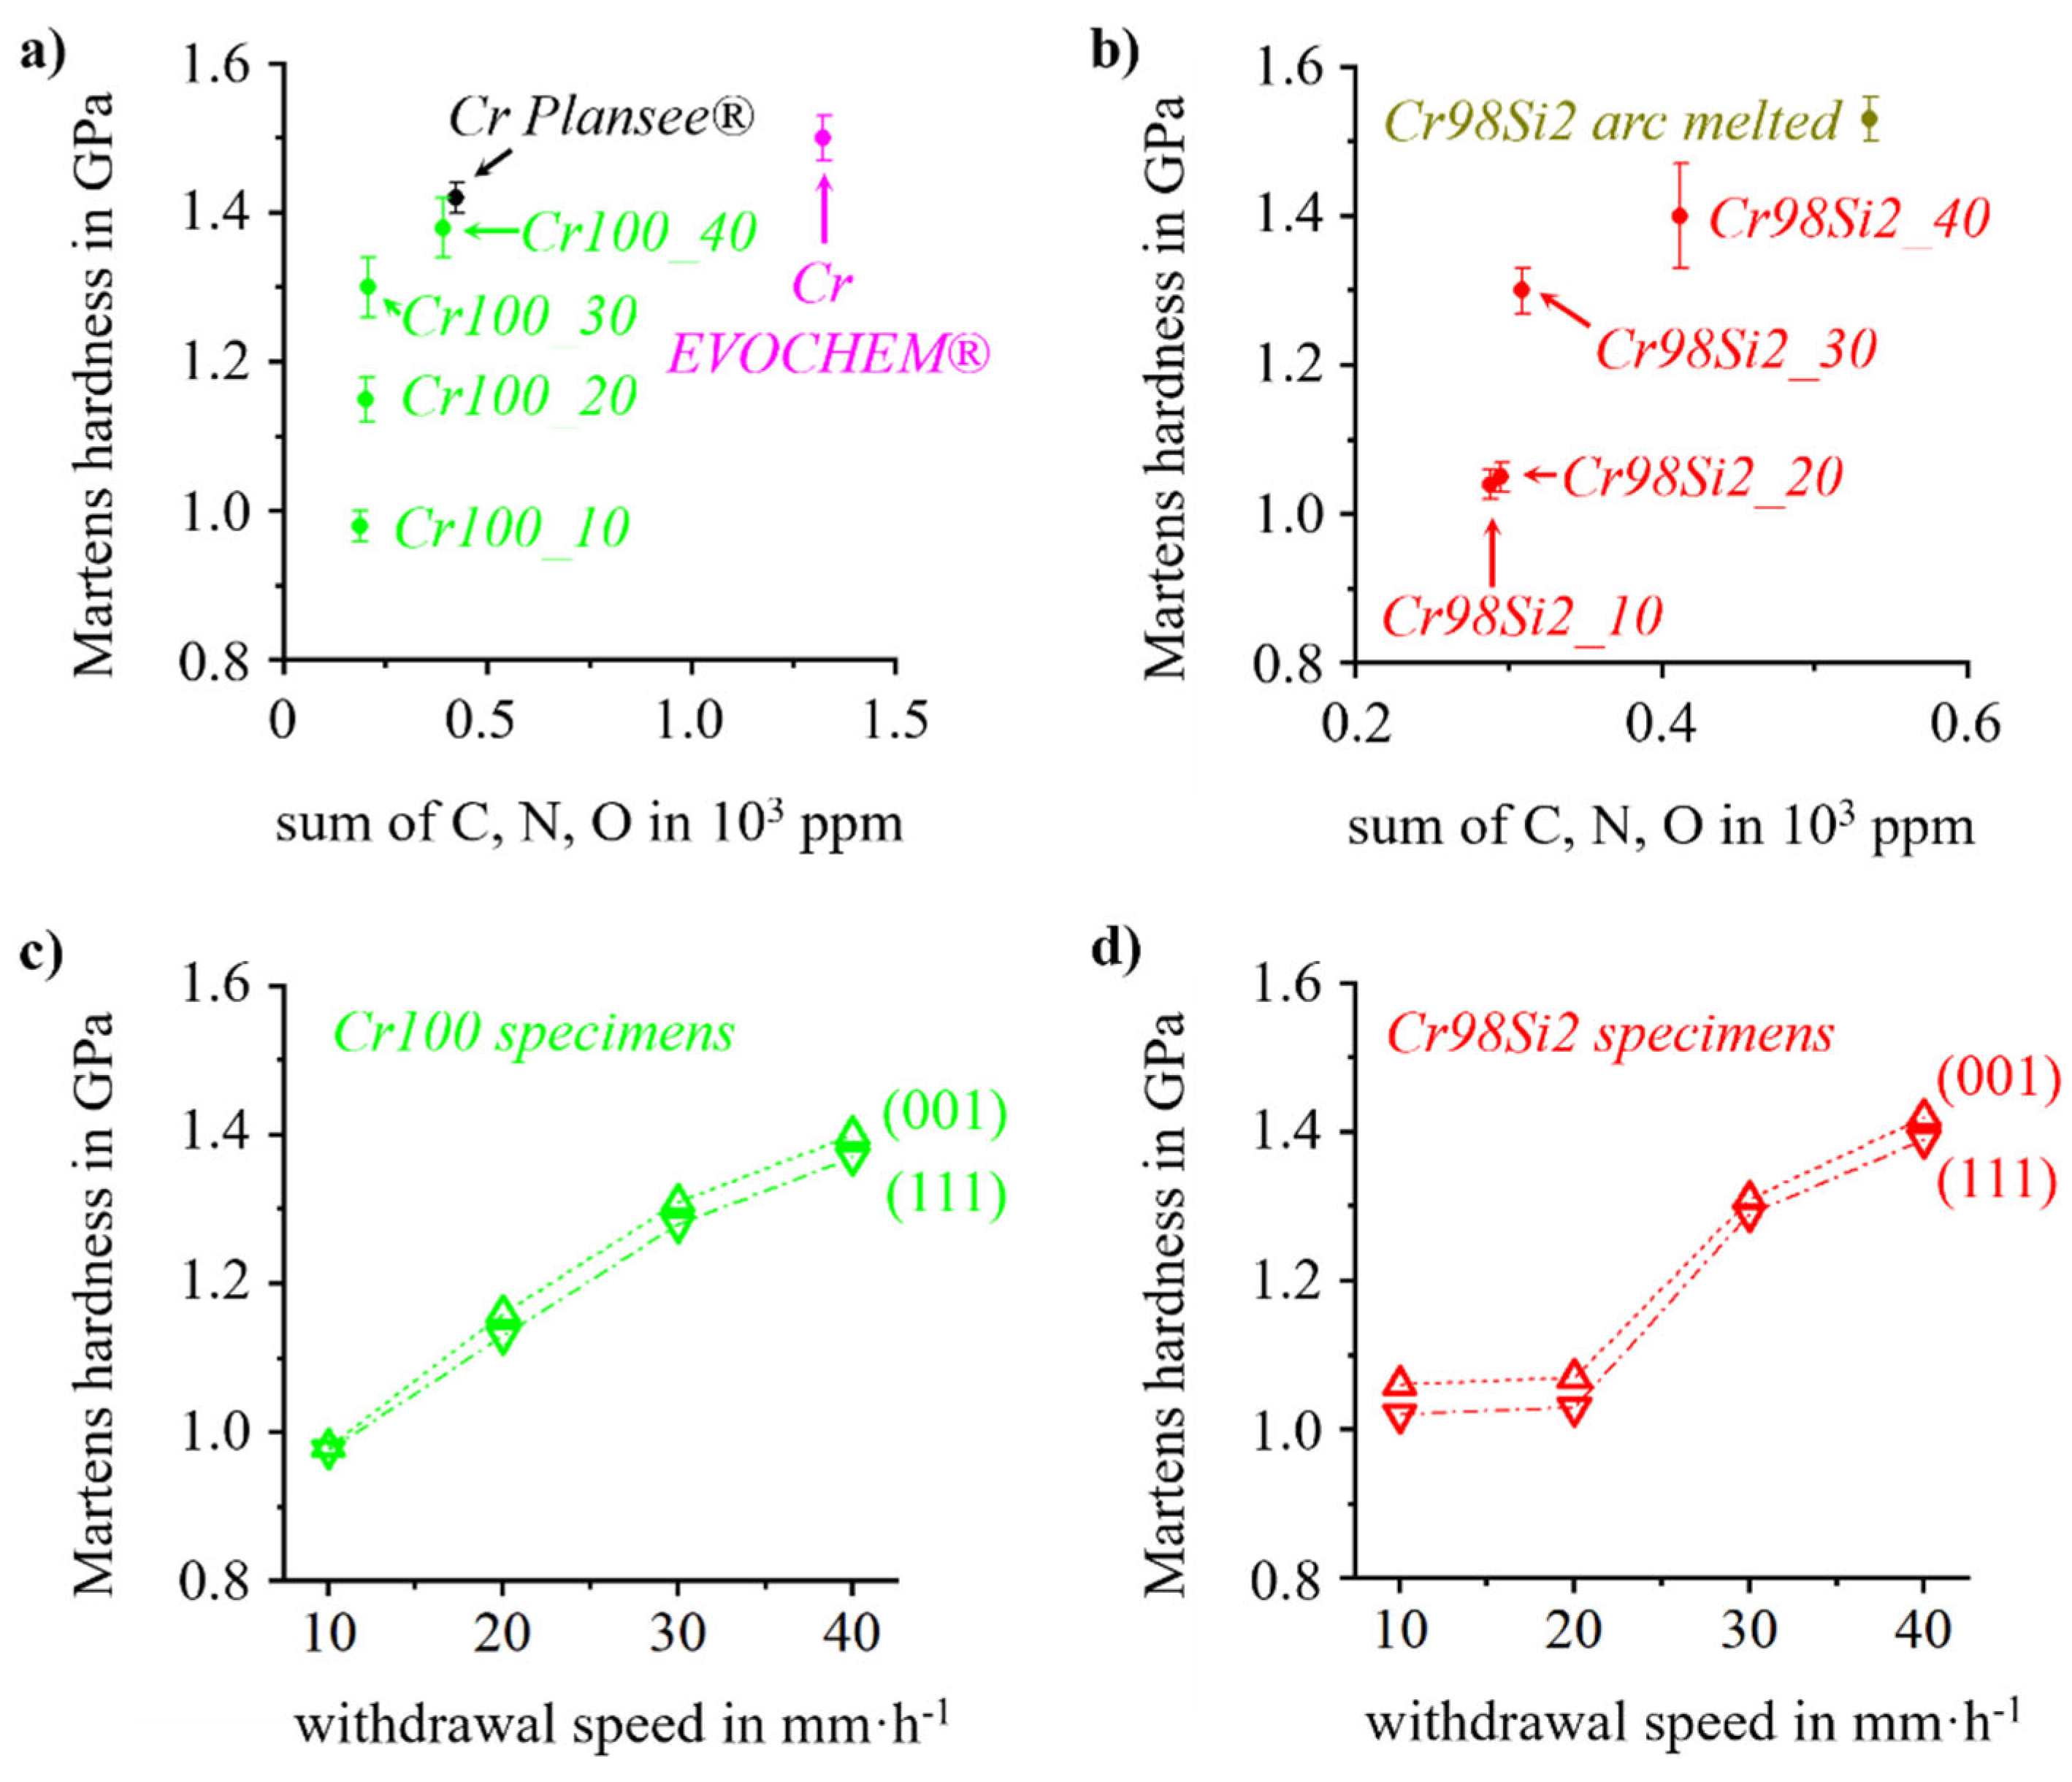
Figure 5.
a) and b) show the Vickers indentations (HV10) on OFZ specimens produced with a withdrawal rate of 40 mm⸱h-1 for Cr100 and Cr98Si2 (in at.%) after macro etching respectively. No cracks in the edges of the indentations are observed for all OFZ specimens. c) Vickers indentation on the polished surface of the Cr starting material. No cracks are observed. d) Vickers indentation on the polished surface of the Cr98Si2 (in at.) master alloy showing crack formation at two edges.
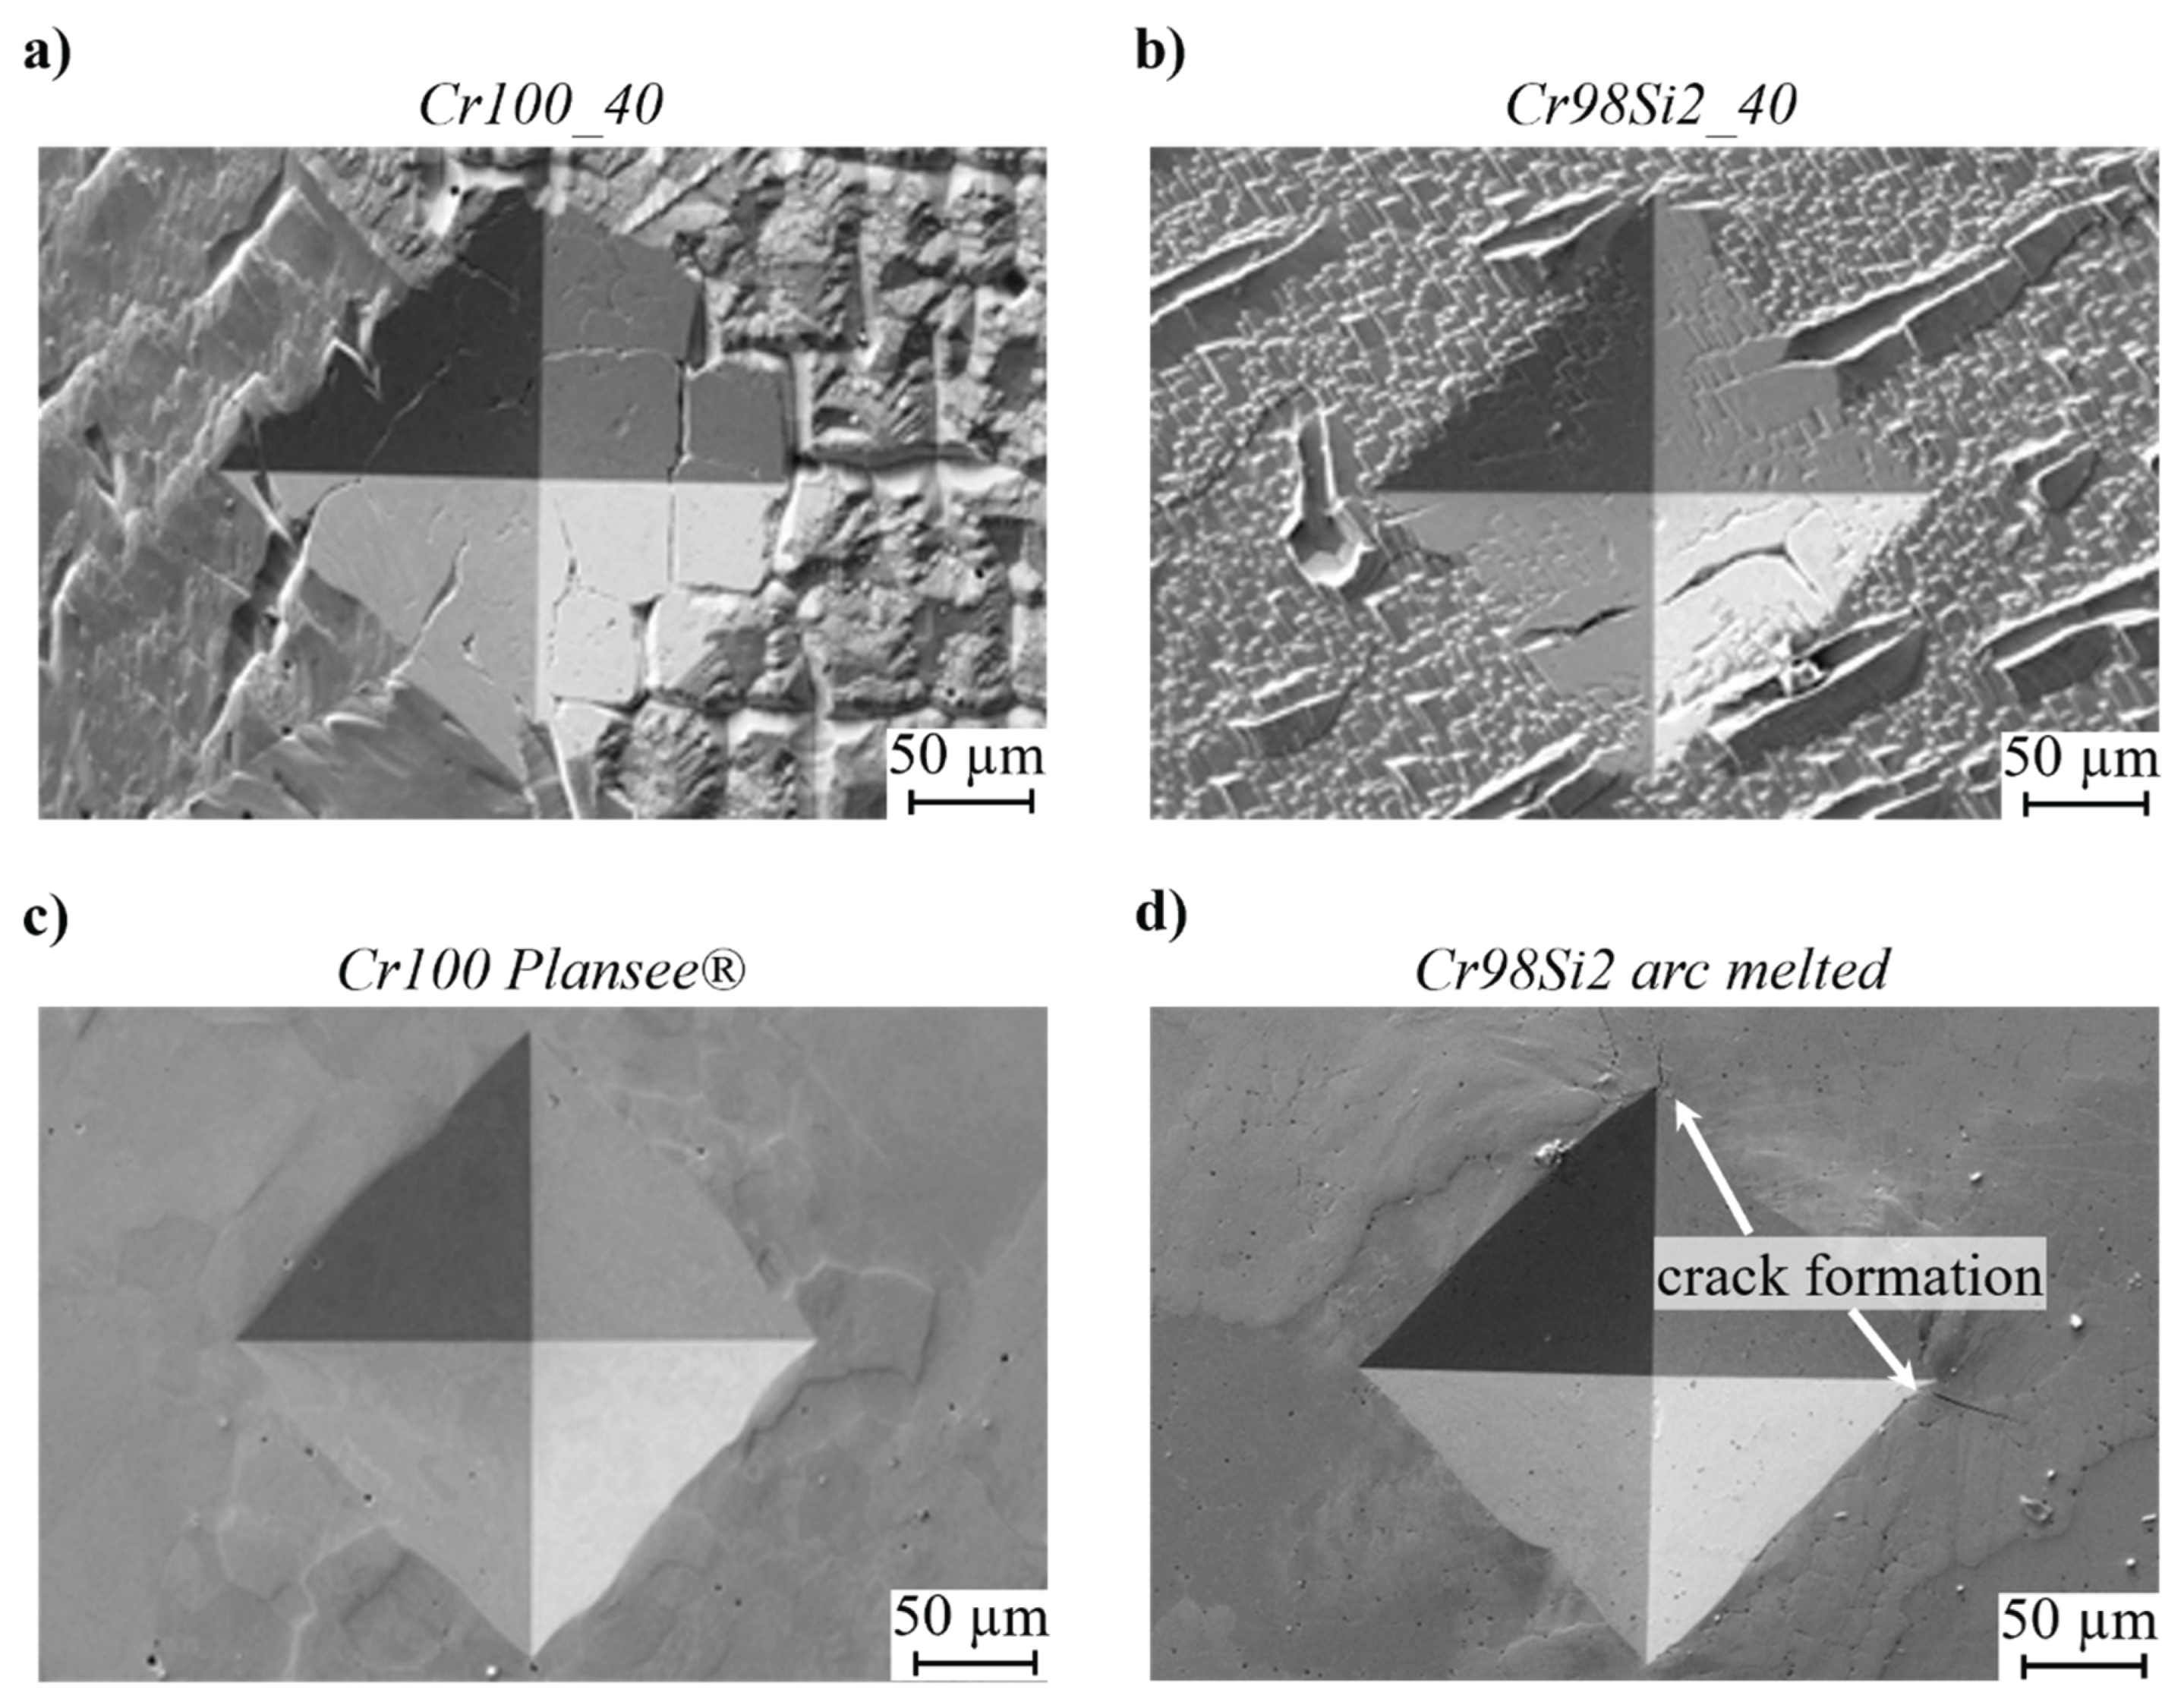
Table 1.
Specimens processed by OFZ and associated process parameters. All specimen processed in high pressure argon atmosphere of 0.7 MPa except for Cr98Si2_20LP, which is processed in argon under ambient pressure of 0.1MPa.
Table 1.
Specimens processed by OFZ and associated process parameters. All specimen processed in high pressure argon atmosphere of 0.7 MPa except for Cr98Si2_20LP, which is processed in argon under ambient pressure of 0.1MPa.
| specimen |
nominal composition (in at. %) |
withdrawal speed (in mm⸱h-1) |
Ar pressure (in MPa) |
Ar gas flow (in l/min) | |
| Cr | Si | ||||
| Cr100_10 | 100.0 | 0.0 | 10 | 0.7 | 2.0 |
| Cr100_20 | 20 | ||||
| Cr100_30 | 30 | ||||
| Cr100_40 | 40 | ||||
| Cr98Si2_20LP | 98.0 | 2.0 | 20 | 0.1 | |
| Cr98Si2_10 | 0.7 | ||||
| Cr98Si2_20 | |||||
| Cr98Si2_30 | 30 | ||||
| Cr98Si2_40 | 40 | ||||
Disclaimer/Publisher’s Note: The statements, opinions and data contained in all publications are solely those of the individual author(s) and contributor(s) and not of MDPI and/or the editor(s). MDPI and/or the editor(s) disclaim responsibility for any injury to people or property resulting from any ideas, methods, instructions or products referred to in the content. |
© 2025 by the authors. Licensee MDPI, Basel, Switzerland. This article is an open access article distributed under the terms and conditions of the Creative Commons Attribution (CC BY) license (http://creativecommons.org/licenses/by/4.0/).
Copyright: This open access article is published under a Creative Commons CC BY 4.0 license, which permit the free download, distribution, and reuse, provided that the author and preprint are cited in any reuse.


