Submitted:
23 May 2025
Posted:
26 May 2025
You are already at the latest version
Abstract
This study investigates the feasibility of meeting Aberdeen’s electric vehicle (EV) electricity demand using wind energy. With concerns about the carbon emissions linked to fossil-fuel-based electricity for EV charging, wind energy is explored as a renewable alternative. The power output of an 80-meter-high wind turbine was calculated using logarithmic equations, and the energy consumption of all registered EVs was estimated. Calculations were validated through the RETScreen software, and carbon emissions reductions were quantified. The results indicate that a single wind turbine, with an annual output of 6651.38 MWh, can fully meet the city's EV electricity demand of 4663 MWh across nine fast-charging stations. This approach, through a central grid connection, also offers significant environmental benefits, with a potential carbon saving of 901.9 tons of CO2e annually. The study concludes that integrating wind energy for EV charging is both technically feasible and environmentally advantageous, despite challenges in accurately estimating turbine output and EV energy demand.
Keywords:
Electrical Vehicles
; Wind Turbine
; Renewable Energy
; Fast Charging Station
; Aberdeen
; RETScreen
1. Introduction
In recent years, the imperative to transition towards sustainable energy sources has become increasingly urgent, driven by concerns over climate change, energy security, and environmental degradation. One promising avenue for reducing carbon emissions and promoting sustainability is the integration of renewable energy into transportation infrastructure, particularly in the realm of electric vehicles (EVs) (1).
According to Digest of UK Energy Statistics (DUKES), the transport sector in the UK consumed approximately 3% (8.3 TWh) of the total electricity production in 2022, which was 320.7 TWh. Also, Digest of UK Energy Statistics (DUKES) shows that in the last 22 years, electricity production from renewable energy has grown significantly, and this positive trend continues and has shown the success of the change to renewable energy (2).
In addition, in spite of using electricity in electric vehicles (EVs), there has been a burgeoning debate surrounding the environmental sustainability of EVs, fueled by contrasting perspectives on their carbon footprint and the broader implications of their widespread adoption. While EVs have been heralded as a promising solution to mitigate greenhouse gas emissions and reduce air pollution in urban centers, recent research has underscored the complexities associated with their production and usage. Emerging studies have revealed that the manufacturing processes involved in EV production, particularly the extraction and processing of raw materials such as lithium, cobalt, and nickel for battery production, can contribute significantly to their carbon footprint (3). As of 2019, transport was responsible for 27% of total UK greenhouse gas (GHG) emissions (4).
Furthermore, a prevalent argument posits that the adoption of EVs merely displaces pollution from urban areas to other regions, particularly those reliant on conventional power generation from fossil fuels. This phenomenon, often referred to as the "carbon-shifting" effect, suggests that while EVs may alleviate local air quality issues in cities, the overall reduction in emissions is limited as the electricity used for charging predominantly originates from fossil fuel-based power plants (5). In essence, the environmental benefits of EVs are contingent upon the decarbonization of the electricity grid and the widespread adoption of renewable energy sources.
Amidst these debates, there is a growing recognition of the imperative to transition towards renewable energy in the charging of EVs (6, 7). The concept of utilizing renewable energy for EV charging is not novel, with various initiatives and advancements in this realm having been underway for some time (From designing charging stations with solar panels and portable panels). With the rapid surge in demand for electric vehicles (EVs) and EV charging, there has been a heightened focus among research institutions and energy providers on alleviating the strain on local electricity grids caused by the proliferation of EV charging points. One promising solution to address this challenge involves leveraging renewable energy sources like wind and solar power to bolster the EV charging infrastructure. However, the scale and scope of integrating renewable energy into the charging infrastructure of EVs present multifaceted challenges that necessitate careful consideration and strategic planning (8).
One of the foremost challenges lies in the scalability of renewable energy deployment to meet the charging demands of EVs across diverse geographic locations. While localized initiatives have demonstrated the feasibility of renewable energy-powered charging stations, achieving widespread adoption requires significant investments in renewable energy infrastructure, grid modernization, and energy storage technologies. Moreover, the intermittency and variability of renewable energy sources, such as solar and wind, pose challenges in aligning energy supply with charging demand, necessitating innovative solutions for energy storage and demand management (9).
Scotland's renewable energy potential for EV charging stations is driven by wind energy. By integrating wind turbines into charging station designs, Scotland can leverage these renewable sources to power EVs. Harnessing Scotland's renewable energy potential not only promotes sustainability and reduces carbon emissions but also fosters energy independence and innovation in the transportation sector (10, 11).
The notion to undertake this study arose from a confluence of challenges including the imperative to achieve Net Zero emission goals, environmental sustainability, the transition to renewable energy, the surging demand for electric vehicles, and the deficiency in charging infrastructure for electric vehicles. Nonetheless the intermittency associated with renewable sources (e.g., seasonal variations in wind speed) and load characteristics of EVs (e.g., battery capacity, number and types of EVs, waiting time, charging start time, and the initial state of charge) are serious challenges in implementing the electrical vehicle charging station (EVCS) (8). However, this research aims to explore the potential for leveraging renewable energy sources to power fast charging stations and on evaluating the feasibility and effectiveness of integrating wind power source for electric vehicles in Scotland.
2. Materials and Methods
This quantitative study was designed and conducted in 2024 as part of an MSc dissertation in Environmental Management using the latest available secondary data to determine the feasibility of using wind energy for fast charging of electric vehicles in Aberdeen, Scotland. Figure 1 shows following steps:
2.1. Site Selection
Identifying the ideal location for the project involves considering various factors such as the availability of renewable energy sources, proximity to community and recreational facilities, population density, flood risk, accessibility to major transportation routes, and environmental impact. However, attempting to comprehensively manipulate all these factors to pinpoint the perfect site exceeds the scope of this study. Therefore, the research relies on the most relevant and accessible data to inform its site selection process. In this study, the onshore wind energy sensitivity map in the UK, extracted from RSPB 2050 Energy Vision spatial data, serves as the basis for determining the site's suitability (12).
2.2. Wind Energy Assessment
Once potential sites are identified, a comprehensive assessment of renewable energy resources was conducted. This assessment involve:
- Estimating the electricity generation capacity of wind energy
- Consumption analyzing and utilization feature
2.3. Wind Speed Calculation
2.3.1. Wind Speed Data
Wind speed details were extracted from www.weatherspark.com. This website presents useful information about weather details in different parts of the world in different ways and different categories.
2.3.2. Methods for Calculating Wind Speed in Different Height
There are two methods for calculation wind speed in different height (13):
Power law method:
V2=V1(h2/h1)α
Where V2 is the wind speed (m/s) at height h2 and V1 is the known wind speed at a reference height h1. The exponent α is the empirical derived coefficient that varies dependent upon the stability of the atmosphere. The value of α, wind shear exponent, is around 0.14 for smooth terrain but can climb as high as 0.5 in areas of high surface roughness or drop lower than 0.1 over very smooth surfaces such as water or ice.
Another method for calculating wind in different height is Logarithmic equation method:
V2/V1 = ln [h2/z0]/[h1/z0]
Where v2 is wind speed at height h2 above ground level, v1 = reference speed at height h1, ln is the natural logarithm function, h2 = height above ground level for the desired velocity, Z0 = roughness length in the current wind direction, h1 = reference height, i.e., the height where we know the exact wind speed,
2.4. Power Output
While the theoretical Betz limit represents the maximum possible efficiency of a wind turbine, practical efficiencies typically range from 35% to 45% limit for modern turbines. Ongoing research and development efforts aim to improve turbine technology and increase practical efficiency levels (13, 14).
P = ½ Cp ρAV3
Where ρ is Air density (kg/m3), A= Swept area by blades (m2), V= wind speed at hub height (m/s), Cp= practical efficiencies or power coefficient typically range from 35% to 45%
2.5. Consumption Analysis (Power Demand)
2.5.1. Performance Evaluation
According to Public Charge Point Regulations 2023 guidance in the UK, Charge point operators must ensure they meet the reliability requirement, which requires their public charge points to be available 99% of the time and charging facilities should be available almost 24 hours a day (15).
2.5.2. Total Daily Charging Demand for Charging Station
The Total Daily Charging Demand for electric vehicles (EVs) can be calculated using the following formula (16, 17):
Total Daily Charging Demand= A×B×C×B
Where A is Number of EVs Near to Selected Site, B= Average Daily Mileage per EV, C= Charging Efficiency, D= Electricity usage per mile (kWh)
2.5.3. Number of Charging Point
The number of charging stations should be done according to the following formula (16, 17):
Number of Charging station= E / (F×G)
Where E is Total Daily Charging Demand, F= Charging Capacity per Station, G= Charging Hours per Day
2.6. Utilization Features
In this part, compatibility of designated system with real demands is considered, I other words how the generated energy can be used in real circumstances and was included:
- Considering Power Stability, Power balance, selecting appropriate charging equipment including fast chargers compatible with EV models commonly used in Scotland
- Integrating renewable energy sources into the charging station's power supply system, including inverters, batteries, grid connection
2.7. Calculation Number of Wind Turbine
In order to achieve more reliability in our estimation in energy demand, the minimum electricity production (Power Output in Min Cp (MWh)) of each wind turbine that estimated in the calculations is used.
Nwind Turbine = H÷ I
Where H is Mean Power Demand in year (MWh), I= Mean Power Generation in year(MWh)
2.8. Calculation Check by RETScreen Software
In this study, RETScreen version 4 was used to check manual calculations. The software provides users with a range of modules and tools to assess the feasibility of renewable energy and energy efficiency projects across different sectors and applications (18).
2.9. System Design and Integration
In this stage, the final decision was made regarding the selection of infrastructure equipment for the charging station, connection to the grid power, backup battery capacity, and the preparation of a schematic model outlining the placement of the designed components.
2.10. Carbon Saving
The formula utilized to determine the quantity of carbon saving, representing the amount of carbon prevented from being released, comprised from following formula. This deduction reflected the carbon emissions avoided due to the adoption of wind energy, effectively quantifying the amount of carbon stored or prevented from entering the atmosphere (19, 20).
Annual Saving Carbon = J – K
Where J is Total carbon footprint by using grid electricity (Ton CO2e), K= Total annual carbon footprint by using wind generated electricity (Ton CO2e)
3. Results
3.1. Site Selection
Selection of a suitable site for wind assessment was not in the scope of this study but authors used all of available and easy access information to select most suitable location for further steps. This area has been selected by using an ecological sensitivity map for wind power generation calculation (21).
3.2. Maximum Wind Speed in Aberdeen
Given that the wind turbine's operational threshold (Table 1) is a maximum wind speed of 22 m/s to 25 m/s (23)., and considering the recorded maximum wind speed at the weather station (h1=10m) to be 48 kph on 13th January (13.33 m/s), the determination of the maximum permissible height for the wind turbine can be computed by using formula (1). The value of α, wind shear exponent, is assumed 0.15 in this study.
v2/v1=h2α/ h1α → h2=125m
This is maximum height of wind turbine which there is possibility of broke because of high wind speed.
3.3. Wind Turbine Profile
After taking into account various factors such as Turbine Size and Capacity, Maintenance and Service, Environmental Considerations and Manufacturer Reputation and Support, wind turbine model GE’s 1.85-82.5 with detailed in table 01, was considered to supply electricity to the charging station.
The height of the tower is typically a multiple of the rotor diameter, ranging from 1.5 to 3 times the diameter (25). In this study, according to the manufacturer's recommendation, Hub height was considered of 80 m, which is approximately equal to: Blade diameter (40.3) * 2 ≈ 80
This height, while achieving appropriate energy, also ensures the safety of the wind turbine structure.
3.4. Power Output of GE’s 1.85 – 82.5 Wind Turbine
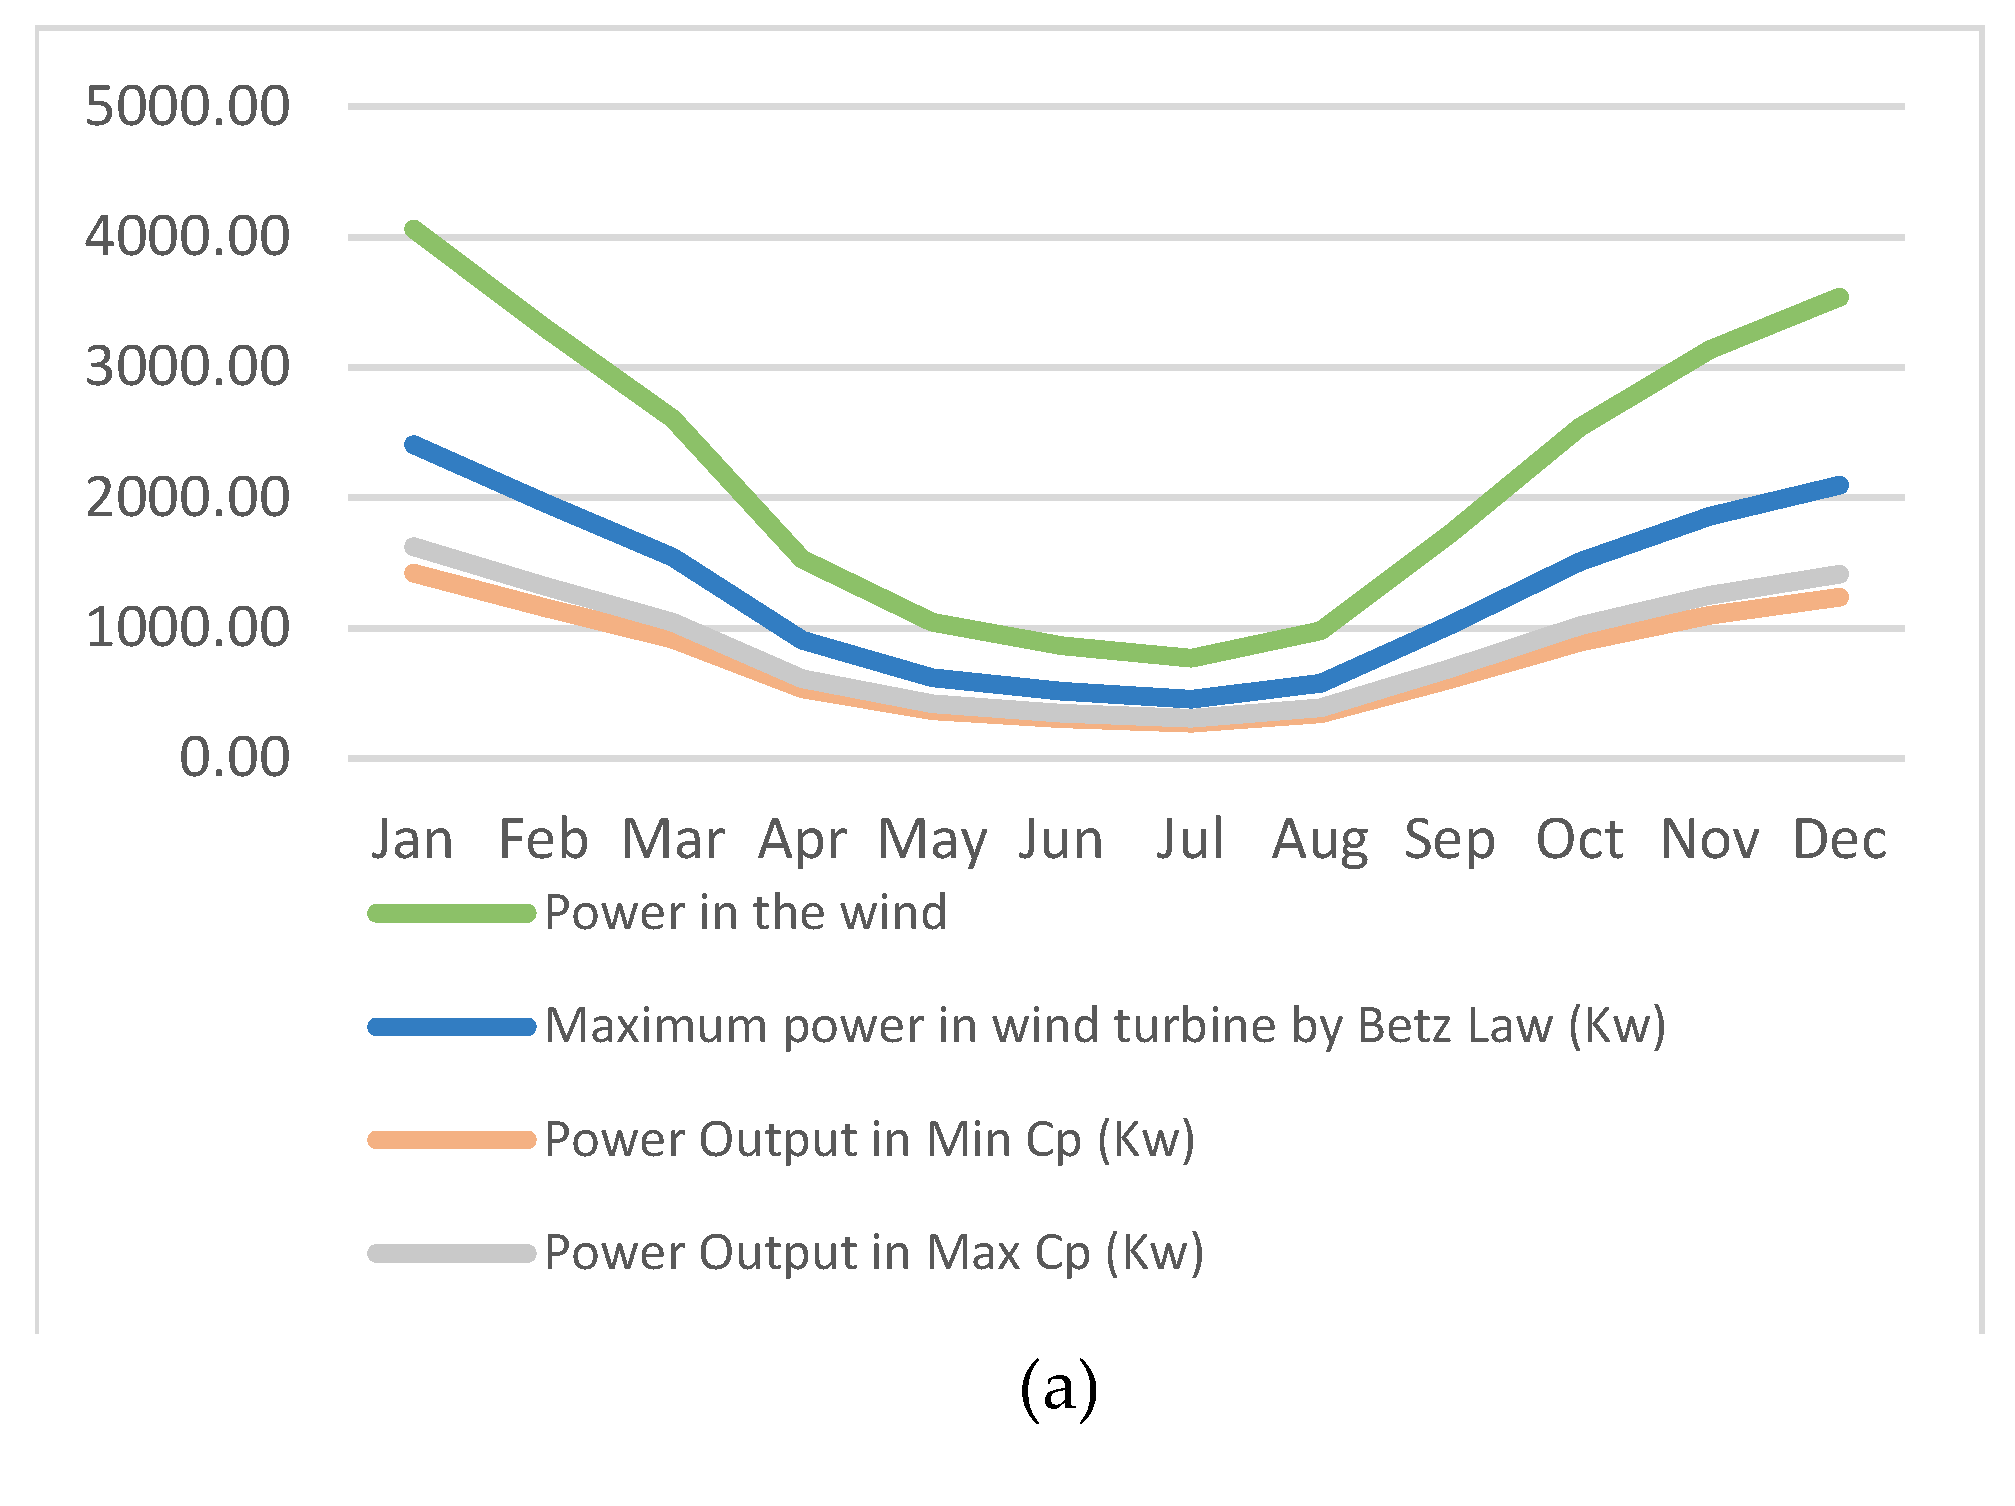
According to logarithmic equation method (formula 2) and power output formula (equation 3), the following results were calculated for power output at hub height (80m). The lowest average speed was in July and the highest in January. The value of Z0, roughness length, is assumed 0.1 in this study. Also, the manufacturer provides the coefficient of performance (CP) ranging from 0.35 to 0.4, which has been calculated for the region. However, to enhance reliability, the minimum value of CP will be utilized in calculations related to electricity production quantity. Table 2 and Figure 3 show the result of power output calculation in different months.
Figure 2.
Wind speed details in Aberdeen - (https://weatherspark.com/) (22). (a) The average of mean hourly wind speeds at 10 meters above the ground (b) Max wind speed in Aberdeen in 2023 (13th Jan).
Figure 2.
Wind speed details in Aberdeen - (https://weatherspark.com/) (22). (a) The average of mean hourly wind speeds at 10 meters above the ground (b) Max wind speed in Aberdeen in 2023 (13th Jan).
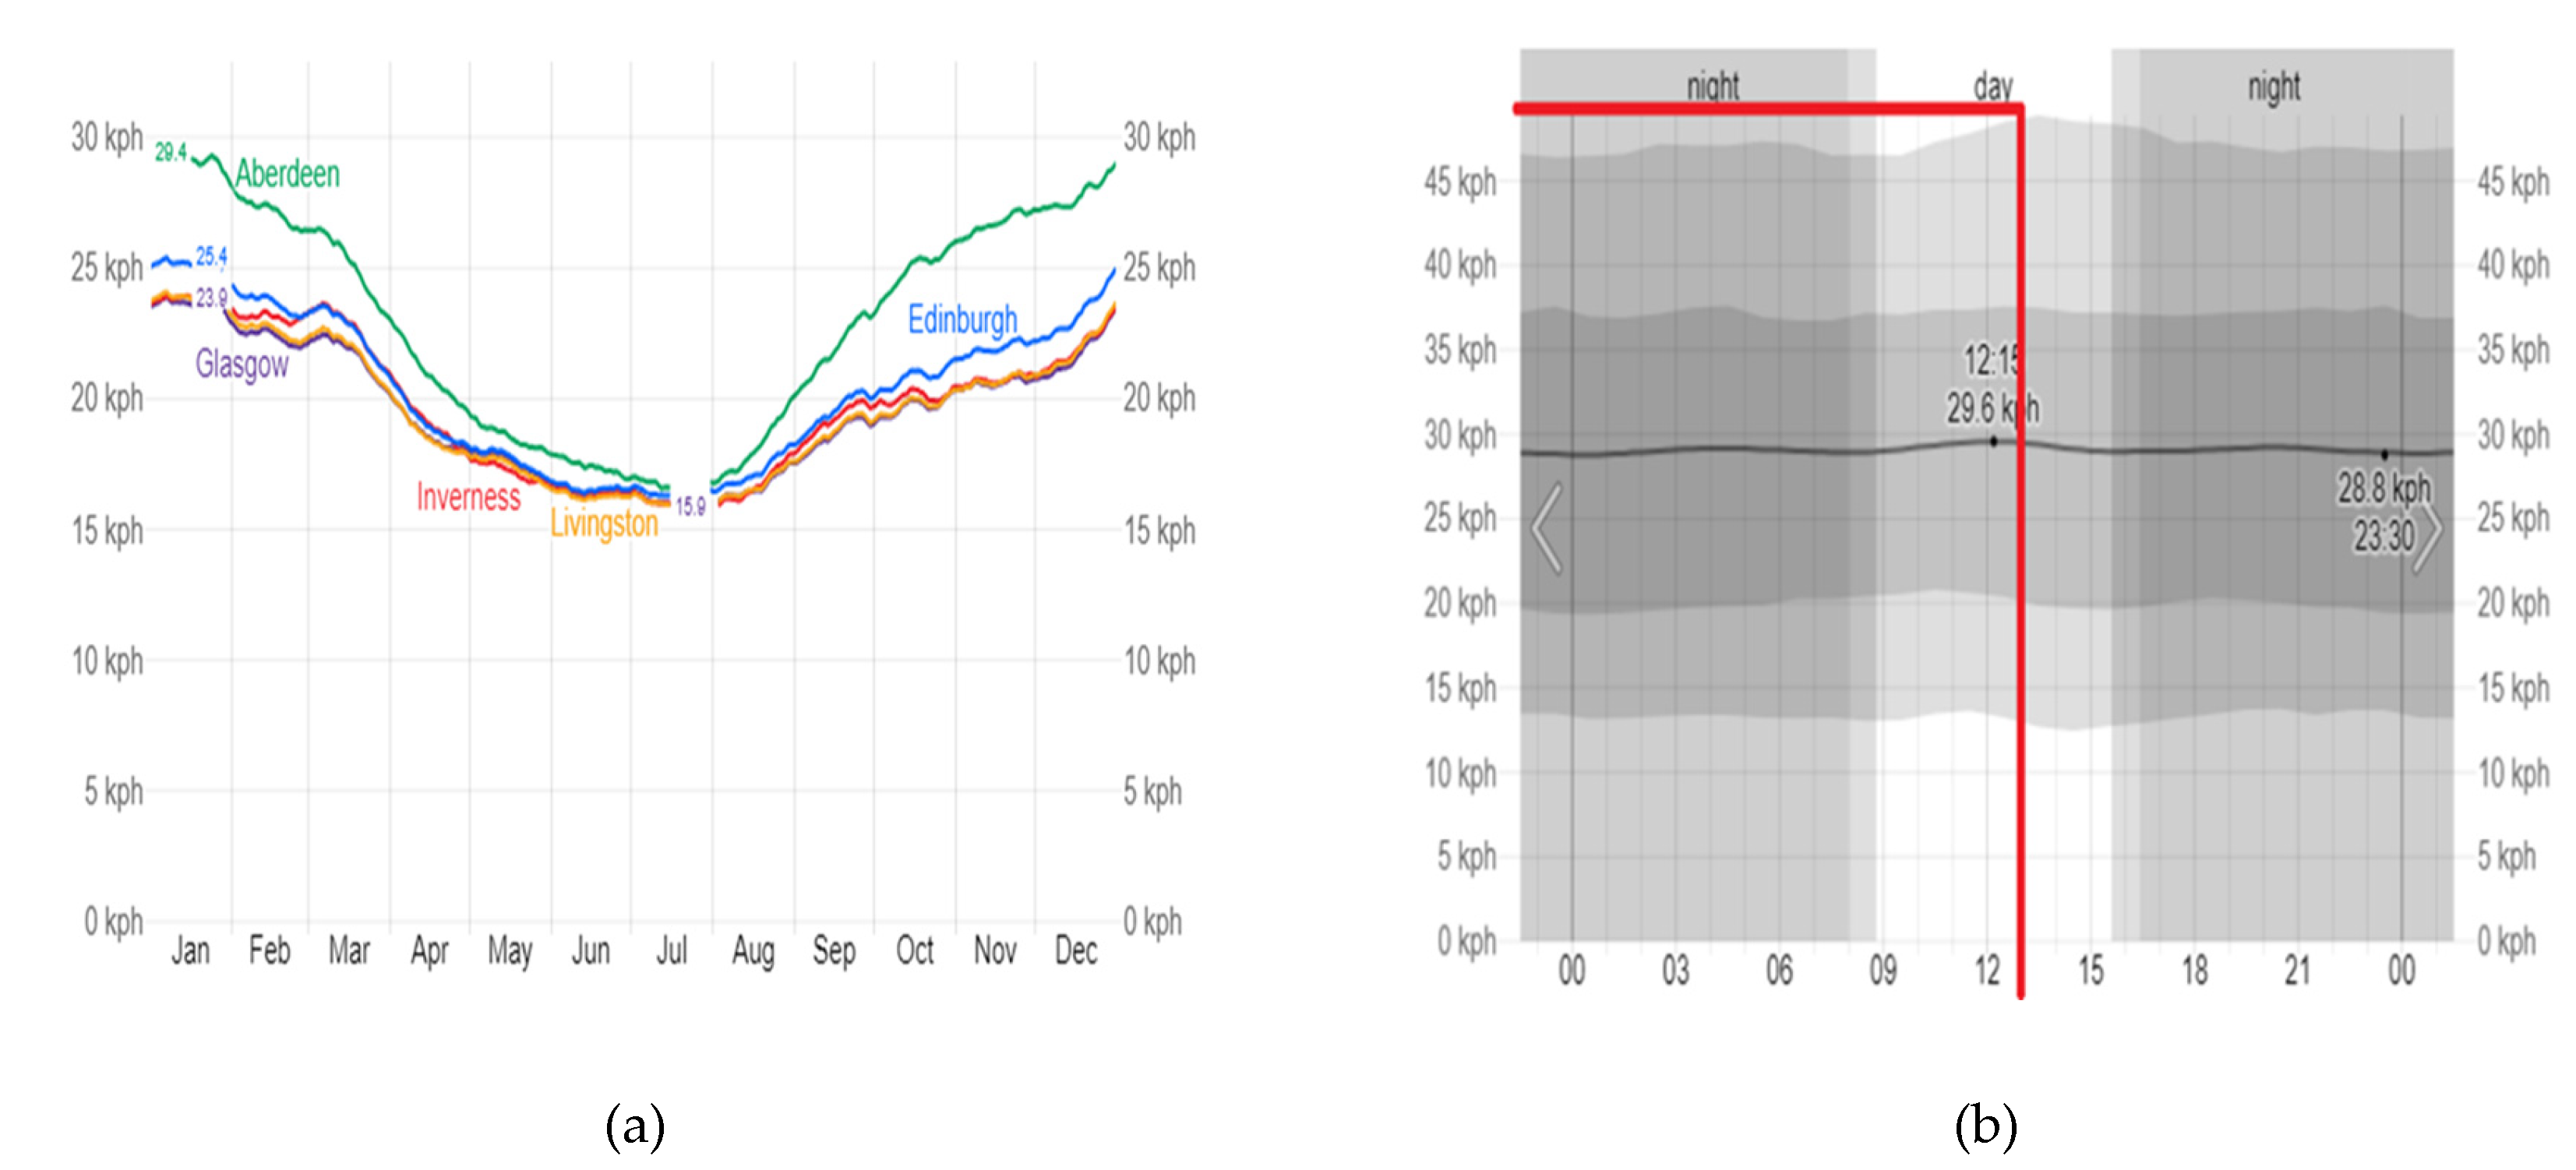
Figure 3.
By examining the details of this map and the proximity to transportation roads as well as being close to population centers and major cities, availability of meteorological information, and high wind potential, an area in the north of Aberdeen (57.214690, -2.086300) with non-ecological sensitivity was selected for site design. (a): Selected Site Area for Designing EVCS (12). (b): Selected Area for Designing EVCS (Google Map).
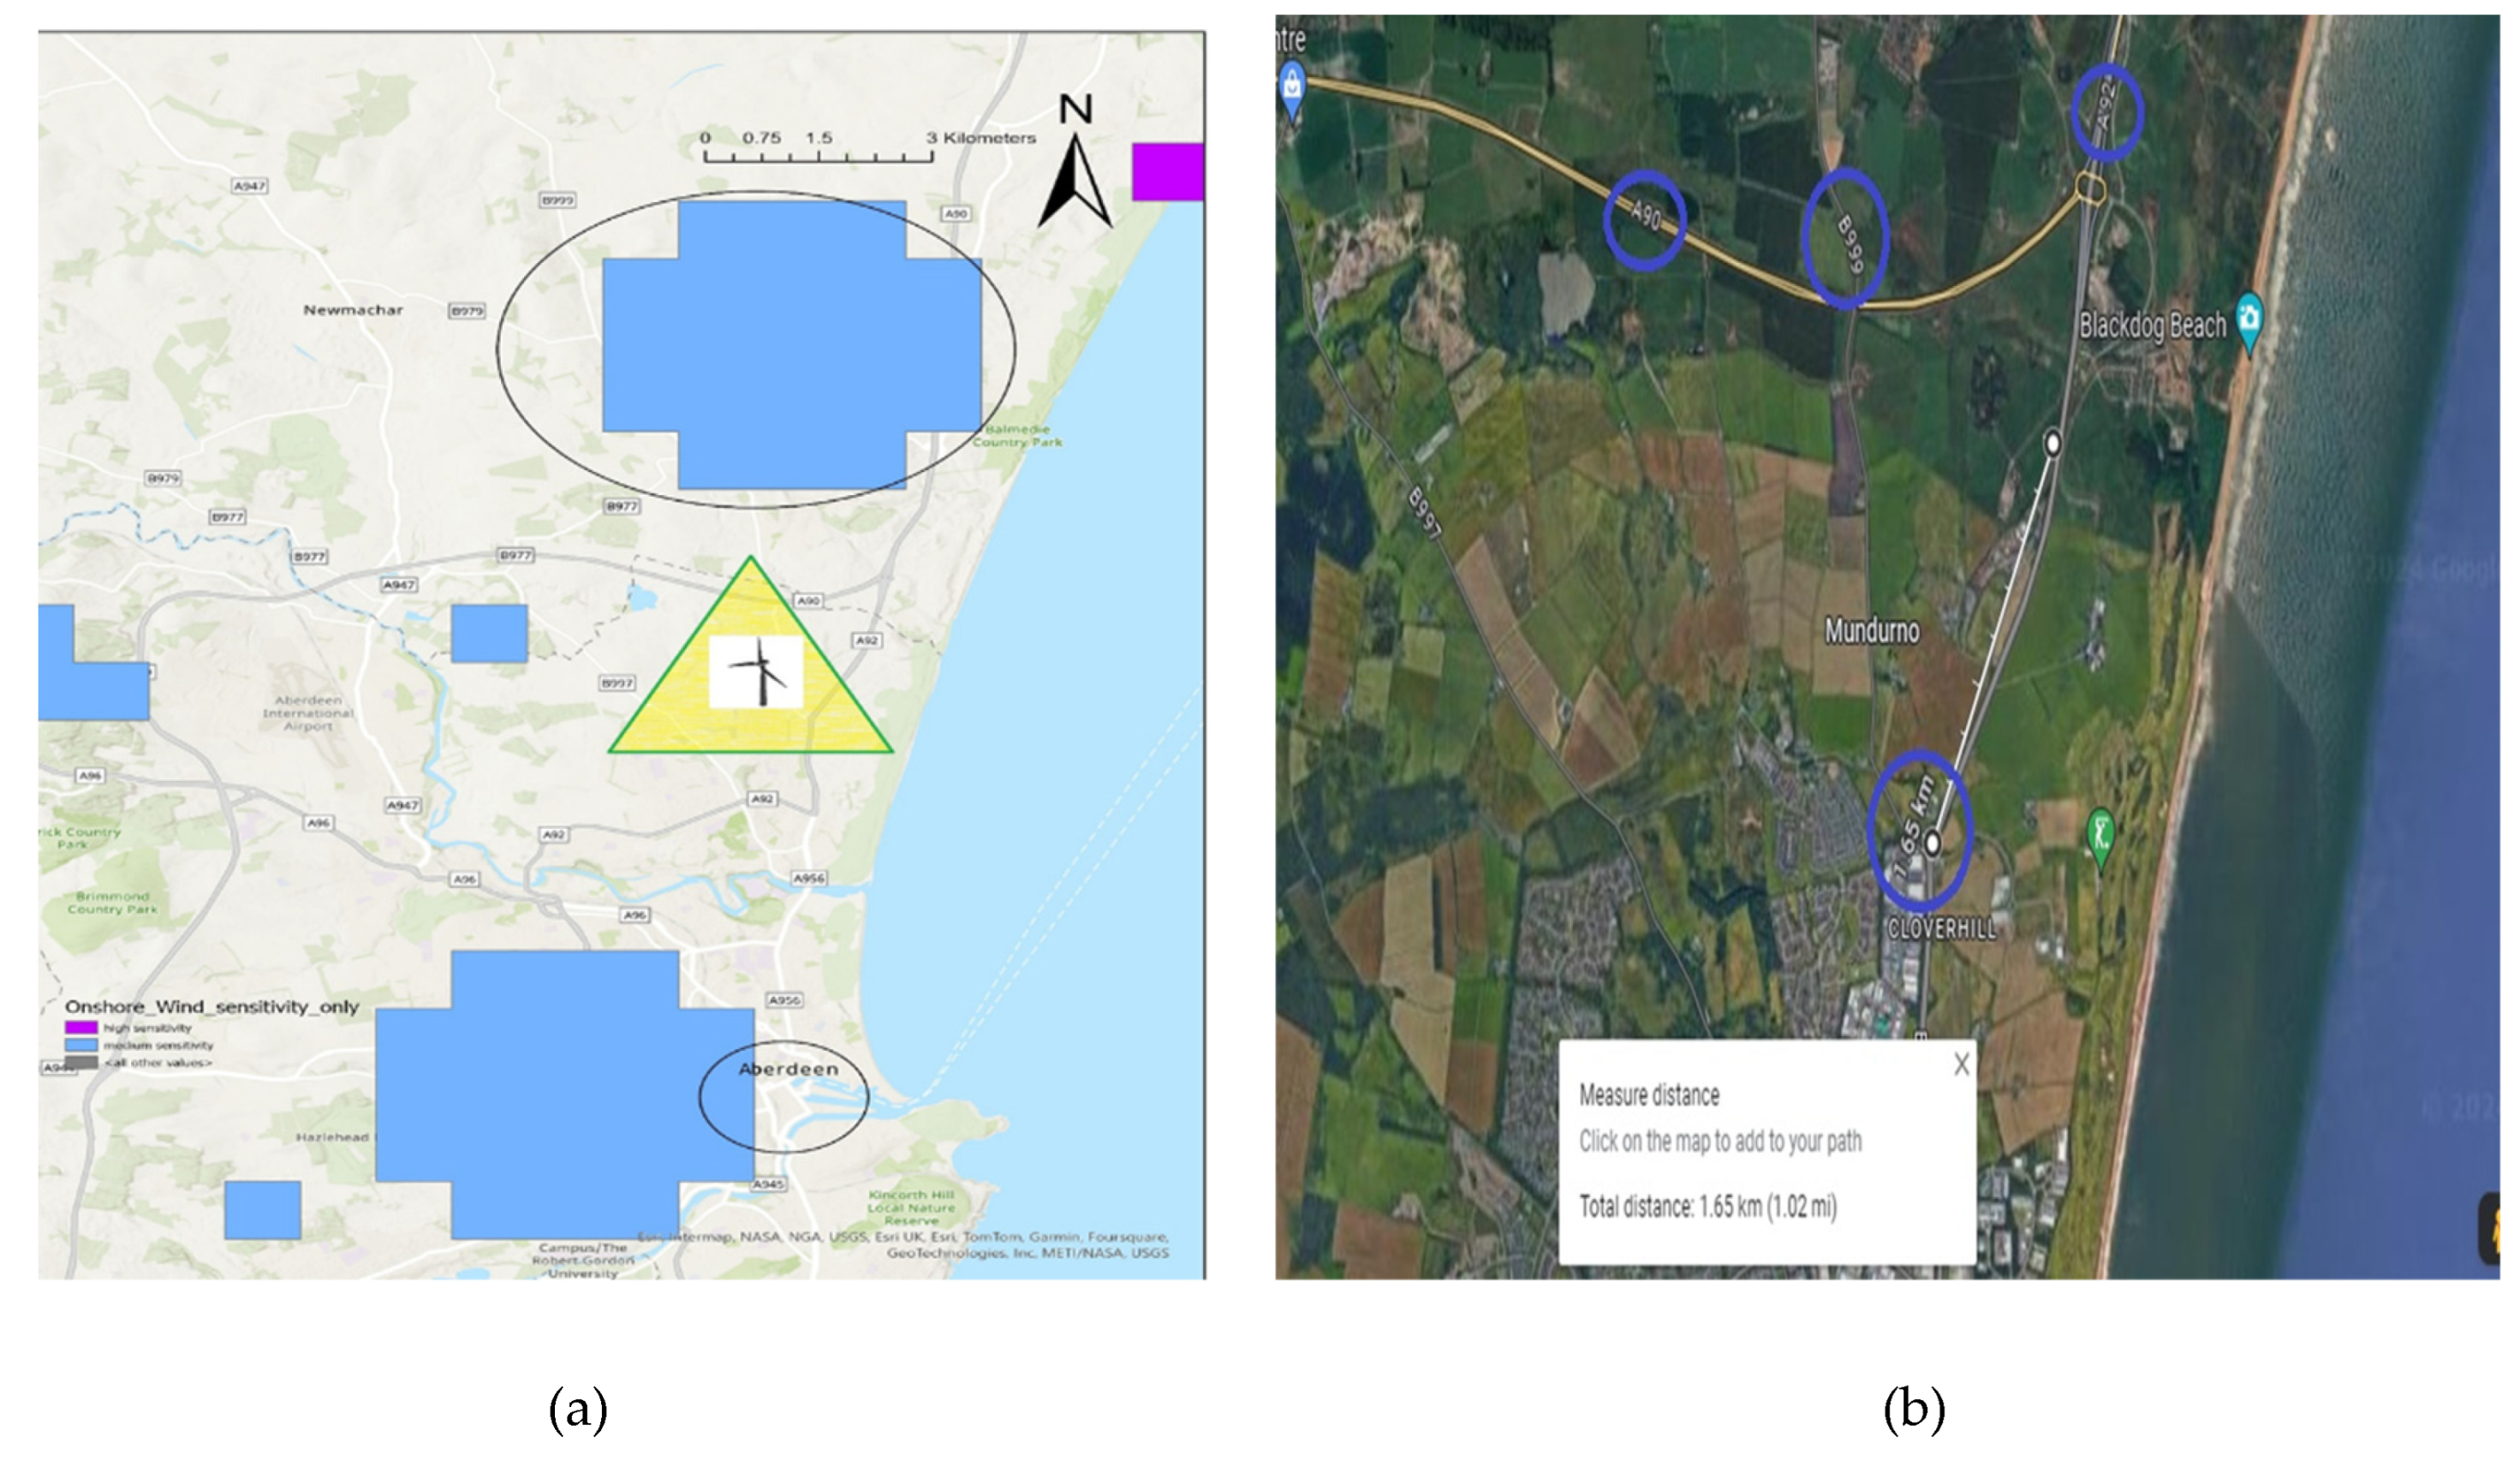
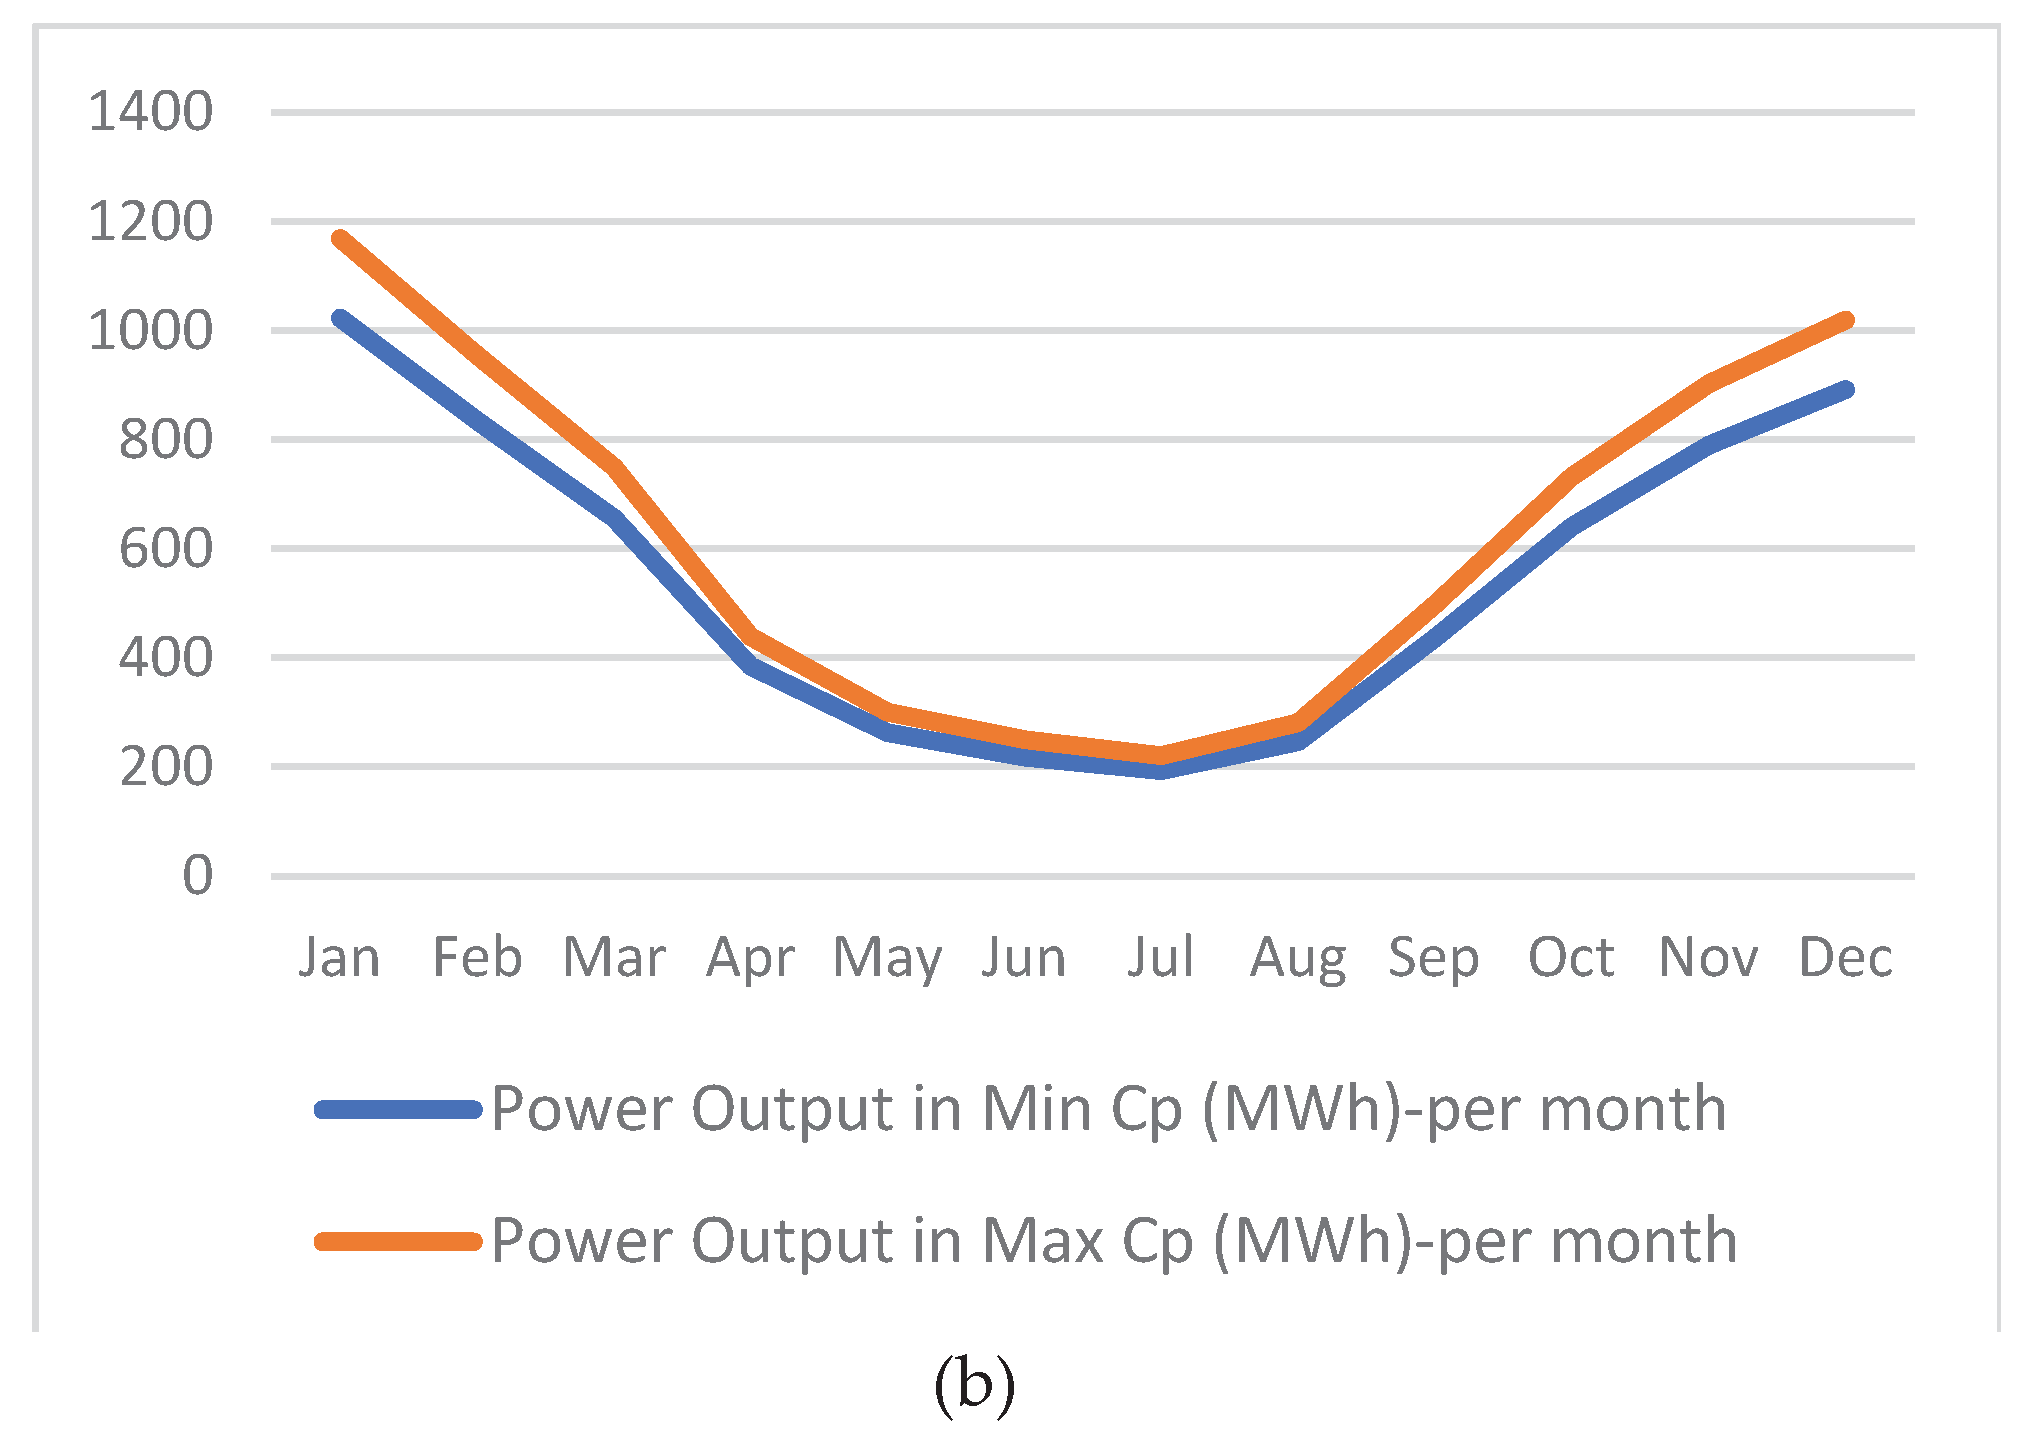
Figure 4.
Total Power Output Calculation and Results in Different Months (author’s own work based on data from wind power calculation). (a) Power output by kW (b) power output by kWh.
Figure 4.
Total Power Output Calculation and Results in Different Months (author’s own work based on data from wind power calculation). (a) Power output by kW (b) power output by kWh.
3.5. Power Demand
The Total Daily Charging Demand for electric vehicles (EVs) can be calculated using formula 4.
According to the Department for Transport figures show 1,151 battery-electric cars were registered in Aberdeen at the end 2023 – up from 689 the year before 2022 (26). Also, according to the ABERDEEN ELECTRIC VEHICLE FRAMEWORK 2020 TO 2030 report, in 2022, the average distance traveled by electric vehicles was 37.5 miles per day (27). As well as the efficiency factor accounting for losses during the charging process, typically expressed as a percentage. DC fast chargers typically have a higher charging efficiency, ranging from 90% to 95% or more (92.5% average) (28). Furthermore, according to the Electric Vehicle Database, the energy consumption of electric vehicles averages out to around 0.32 kilowatt-hours (kWh) per mile. That means, for the average EV, it will use 0.32 kWh of electricity for every mile traveled (29, 30).

Table 3.
Power Demand Calculation (author’s own work based on data from power demand calculation).
| Number of EVsin Aberdeen | Daily Average Mileage per Vehicle | Charging Efficiency (%) | Electricity Usage per Mile (kWh) | Total Daily Charging Demand (kWh) |
|---|---|---|---|---|
| 1151 | 37.5 | 92.5 | 0.32 | 12776.1 |
Figure 5.
Estimated Electricity Generation and Charging Demand in a year (author’s own work based on data from wind power and charging demand calculation).
Figure 5.
Estimated Electricity Generation and Charging Demand in a year (author’s own work based on data from wind power and charging demand calculation).
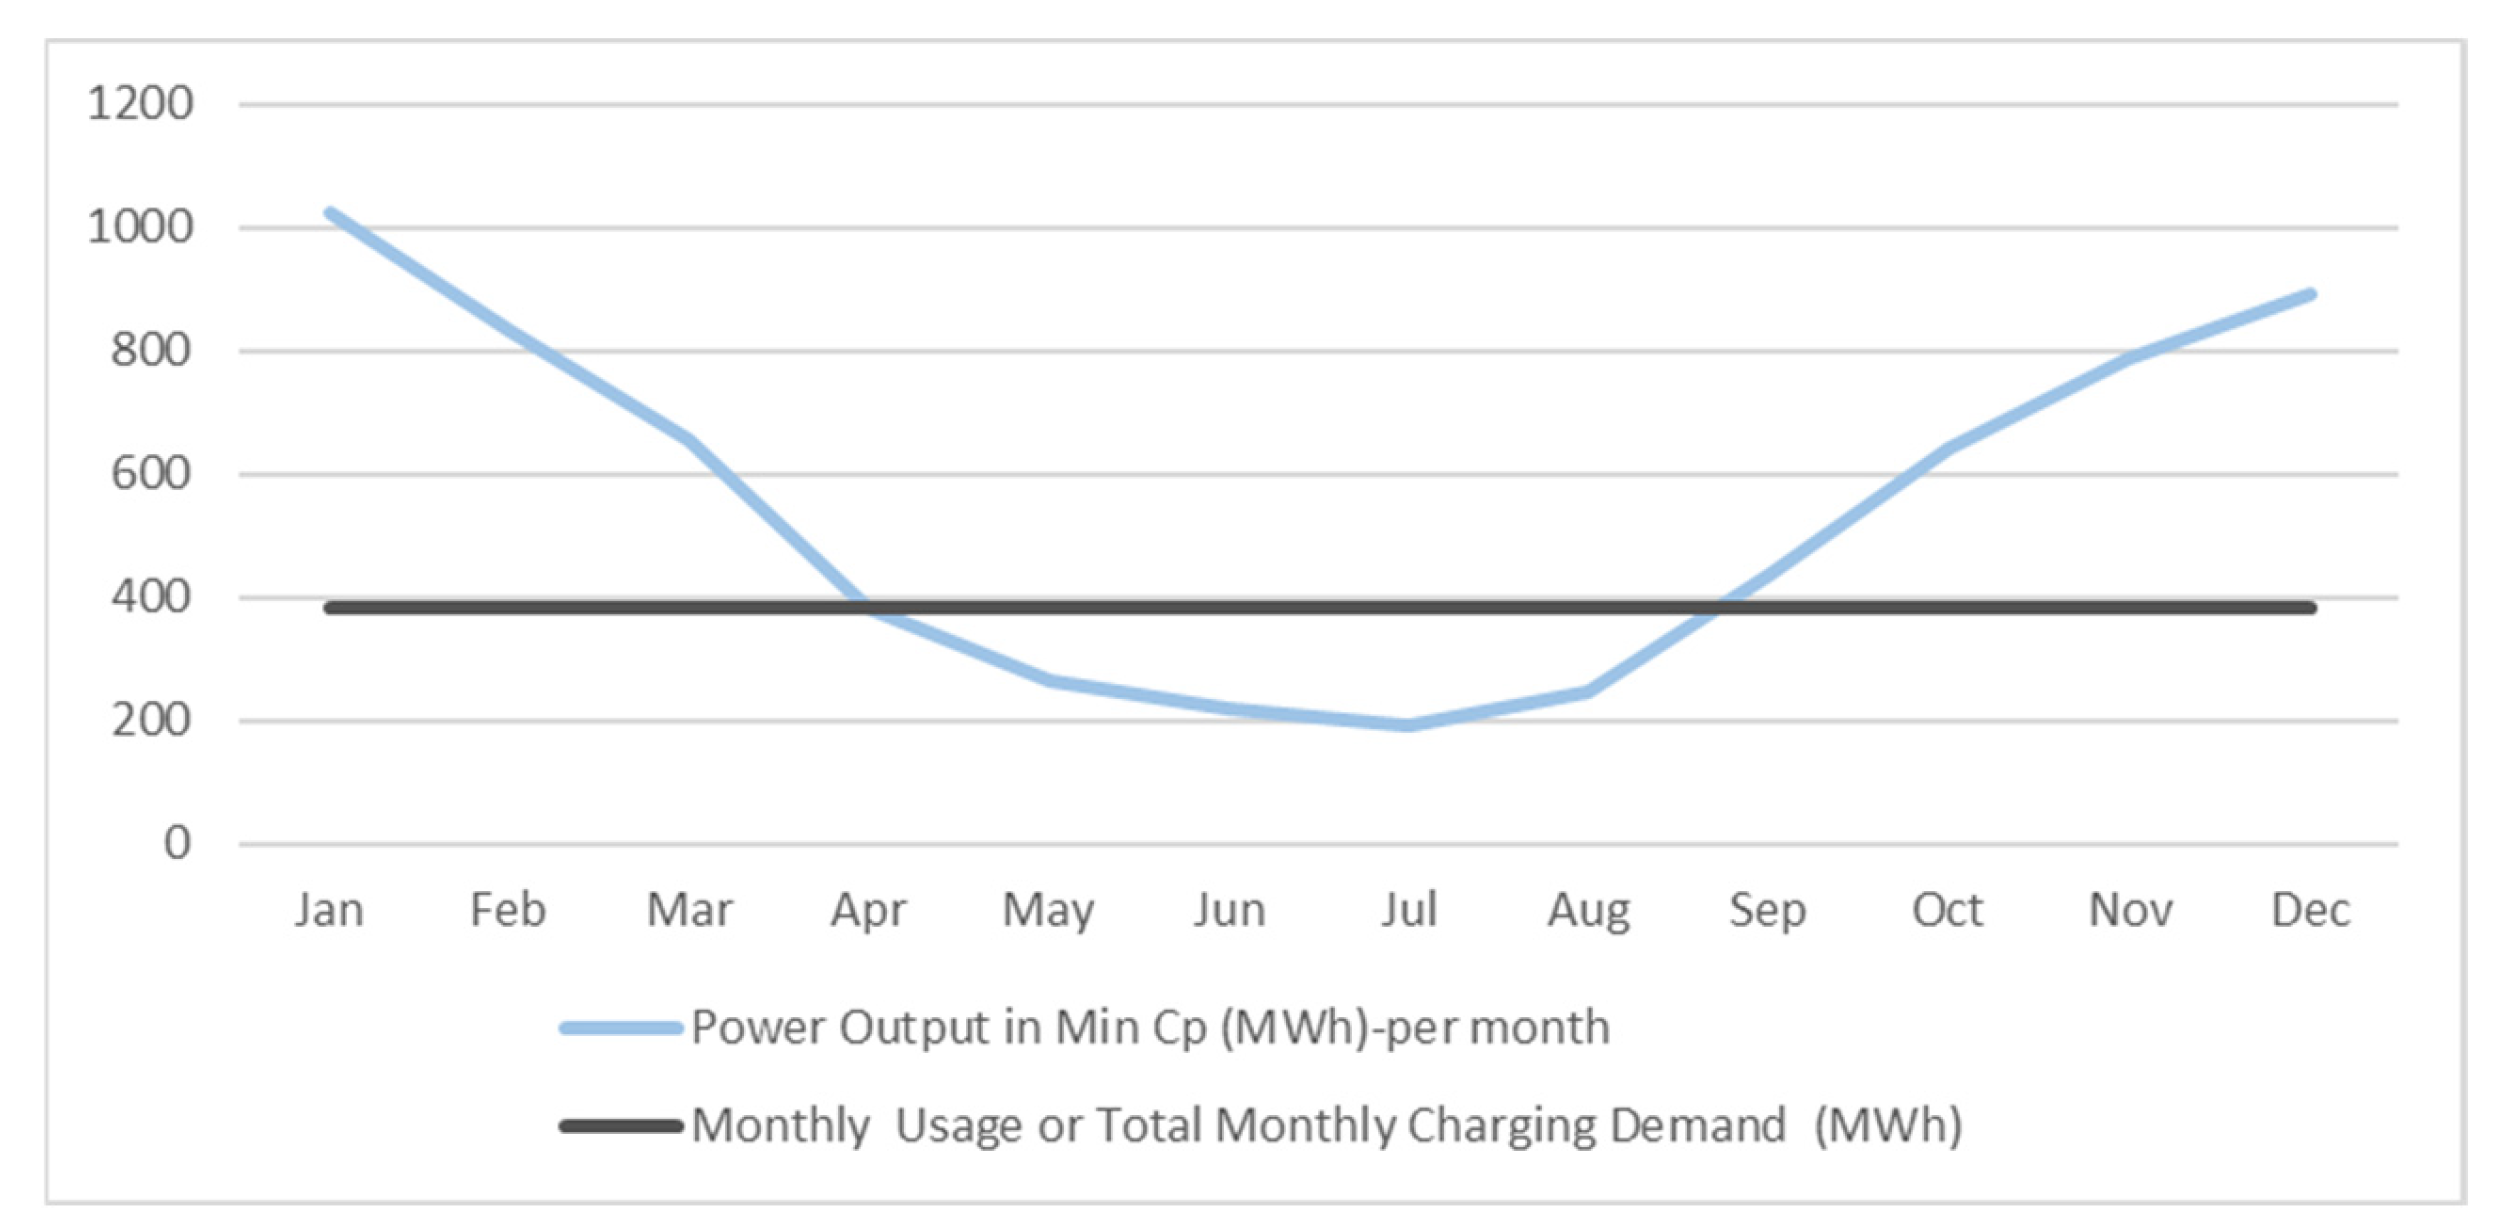
Table 4.
Mean Estimated Electricity Generation and Charging Demand (author’s own work based on data from wind power and charging demand calculation).
Table 4.
Mean Estimated Electricity Generation and Charging Demand (author’s own work based on data from wind power and charging demand calculation).
| Jan | Feb | Mar | Apr | May | Jun | Jul | Aug | Sep | Oct | Nov | Dec | Mean | |
|---|---|---|---|---|---|---|---|---|---|---|---|---|---|
| Power Output in Min Cp (MWh) | 1056.63 | 779.37 | 678.05 | 384.29 | 271.49 | 218.6 | 199.7 | 254.26 | 435.84 | 661.97 | 789.83 | 921.25 | 554.03 |
| Total Monthly Charging Demand (MWh) | 396.06 | 357.73 | 396.06 | 383.28 | 396.06 | 383.28 | 396.06 | 396.06 | 383.28 | 396.06 | 383.28 | 396.06 | 388.61 |
3.6. Number of Charging Point
Number of charging points has been calculated by using formula 5.
Table 5.
Charging point estimation according to common types of charger power (author’s own work based on data from charging demand calculation).
Table 5.
Charging point estimation according to common types of charger power (author’s own work based on data from charging demand calculation).
| Total Daily Charging Demand (kWh) | Charging Capacity per Station per Day (kWh) | Number of Charging Station |
|---|---|---|
| 12776.1 | 1440 | 8.87 ≈ 9 |
| 12776.1 | 2400 | 5.32 ≈ 6 |
| 12776.1 | 8400 | 1.52 ≈ 2 |
Charging Capacity per Station
After checking different types of charging station in the market in terms of charging power, ability to connect to different types of electric vehicles, charging speed, input and output power rate, Safety and Compliance, Future-Proofing, finally the “1 Gun DC EV Charging Station” model was selected to continue the design calculations (31).
The most common power levels for fast chargers are typically between 60 kW, 100kW and 350 kW and this station can supply different powers according to the charging capability of different vehicles, but considering that most electric cars use this power (due to safety issues and to prevent the increase in battery temperature), to calculate the power of 60 kW with the charging time is 1 hour and 60kW is indicative (32).
Charging Capacity per Station per day: charging power (Kw)× 24hr (according to 99% reliability and availability).
Table 6.
Charging Capacity per Station per day according to common types of charger power (author’s own work based on data from charging station catalogue).
Table 6.
Charging Capacity per Station per day according to common types of charger power (author’s own work based on data from charging station catalogue).
| Charging Power (Kw) | Daily Demand (hr) | Charging Capacity per Station per Day (kWh) |
|---|---|---|
| 60 | 24 | 1440 |
| 100 | 24 | 2400 |
| 350 | 24 | 8400 |
3.7. Number of Wind Turbine Calculation
In order to achieve more reliability in estimated energy generation to provide energy more than demand, the minimum electricity production (Power Output in Min Cp (MWh)) of each wind turbine that estimated in the calculations is used in formula 6.
Nwind Turbine = 388.61 / 554.03 = 0.7 ≈ one turbine will be needed
3.8. System Design and Integration
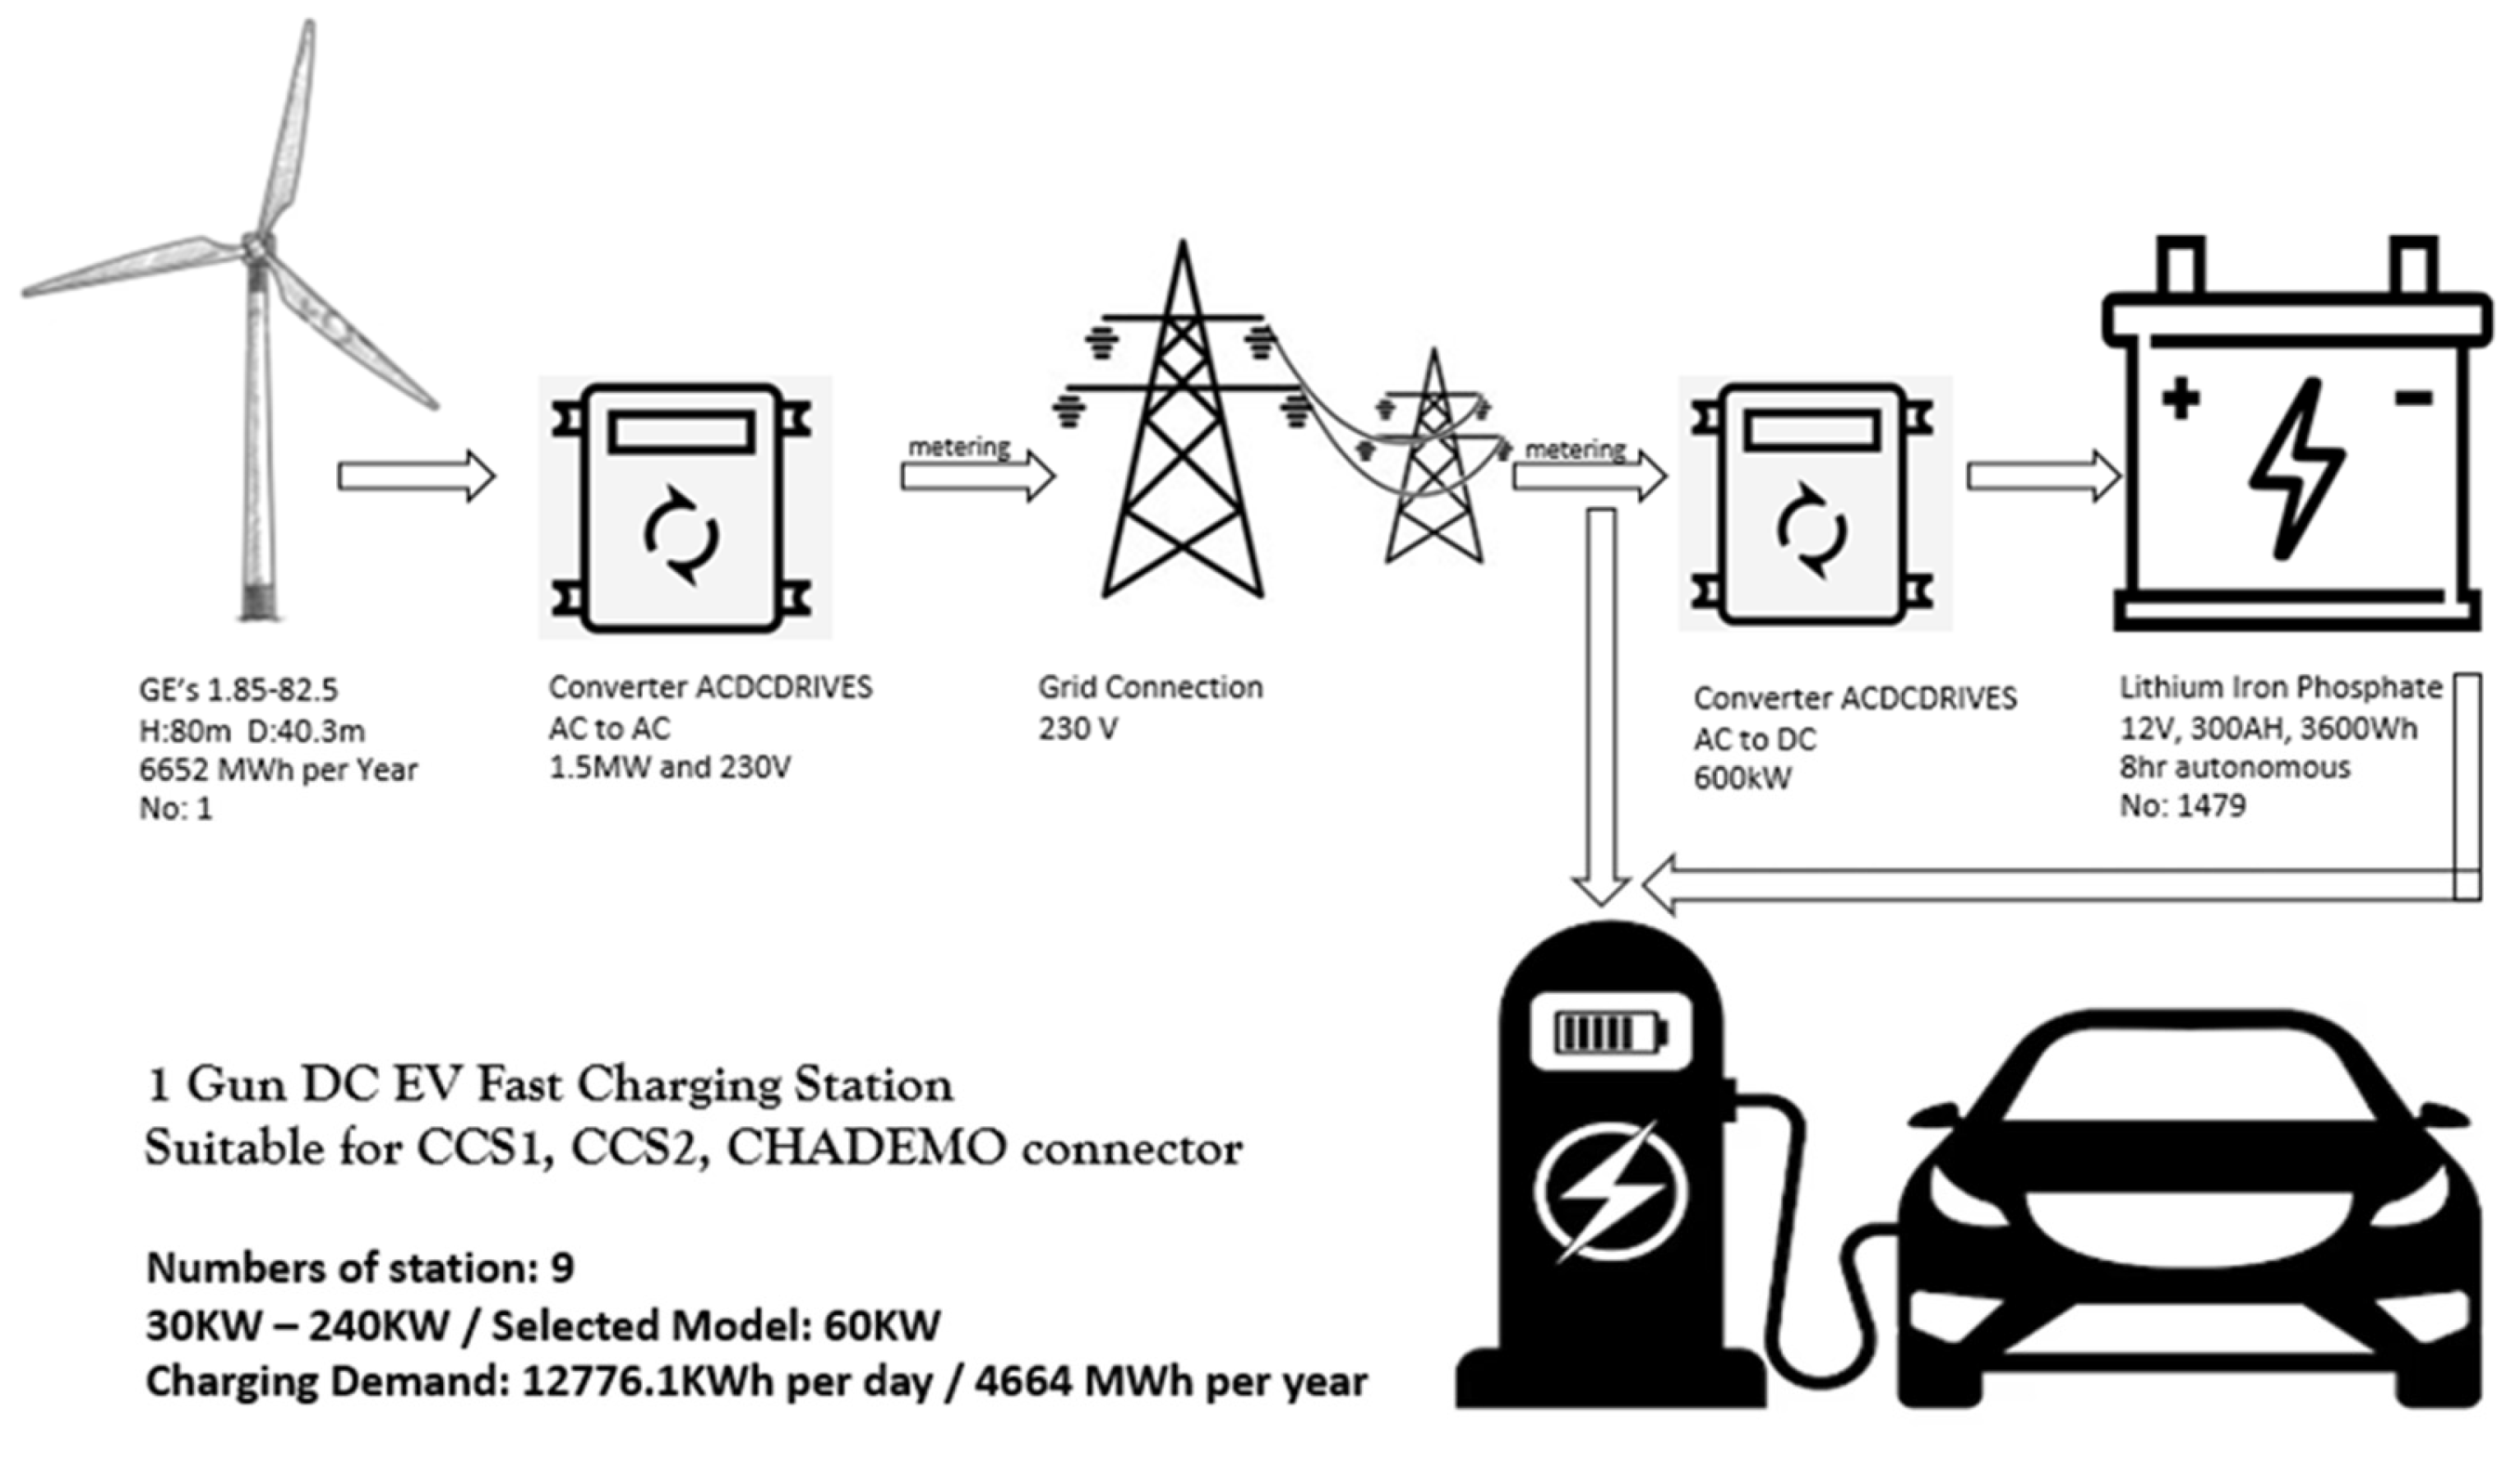
Based on the calculations, the designed wind turbine is projected to produce an average power output exceeding the required amount. As a result, the decision was made to connect all the generated energy to the grid system. Subsequently, the plan involves branching off from the grid to charge the EVs. Additionally a battery storage system has been calculated to provide the required energy for 8 hours in case of any issues with the grid connection system.
3.8.1. Battery Calculation
Among the various batteries, lithium-ion battery, due to specific characteristic was chosen for storage.
Battery Capacity for 8 hr: Daily Charging Demand / 3 = 12776.1kWh / 3 = 4258.7 kWh
Energy capacity of one lithium-Iron-Phosphate battery = 12V * 300 Ah = 3600 Wh
Number of batteries needed = Total energy required / Energy capacity of one battery
Number of batteries = (4,258,700 Wh / 0.8) / 3600 Wh ≈ 1479 batteries
DoD (Depth of Discharge): 0.8
Space required for all batteries for 8hr autonomous
Volume of one battery = Length × Width × Height
Volume of one battery = 0.522 m × 0.240 m × 0.219 m ≈ 0.02724 cubic meters
Total volume = Volume of one battery × Number of batteries
Total volume = 0.02724 cubic meters × 1183 ≈ 40.28 cubic meters
3.8.2. Inverter Calculation
To connect wind turbine-generated electricity to the grid, the grid's frequency and voltage before it can be connected should be synchronized. Maximum possible electricity generation is in January and is equal to 1056 kWh. Factors such as efficiency and safety margins should be accounted when selecting the inverter size. It's common to oversize the inverter slightly to ensure optimal performance and accommodate potential fluctuations in electricity generation with the rule of thumb being to oversize by 10%.
Converter AC to AC:
Oversized maximum electricity generation = 1056 kWh + (10% of 1056 kWh)
Oversized maximum electricity generation ≈ 1264 kWh
Converter AC to AC: 1.5MW and 230V
Inverter AC to DC:
Total capacity of the battery in kWh:
Total capacity = 4258,700 Wh / 1000 = 4258.7 kWh
The battery should support the demand is 8 hours,
Power = 4258.7 kWh / 8 hours ≈ 532.3375 kW
Adjusted power requirement for Inverter = Power × (1 + Oversizing factor 10%) = 532.3375 kW × (1 + 0.10) ≈ 600kW
So, with a 10% oversizing factor, 600 kW inverter needs to convert AC to DC electricity to store in backup battery for 8hr.
Figure 6.
Schematic form of all designed components and their connections (author’s own work based on data from wind power and charging demand calculation and designing component).
Figure 6.
Schematic form of all designed components and their connections (author’s own work based on data from wind power and charging demand calculation and designing component).
3.9. Calculation Check by RETScreen
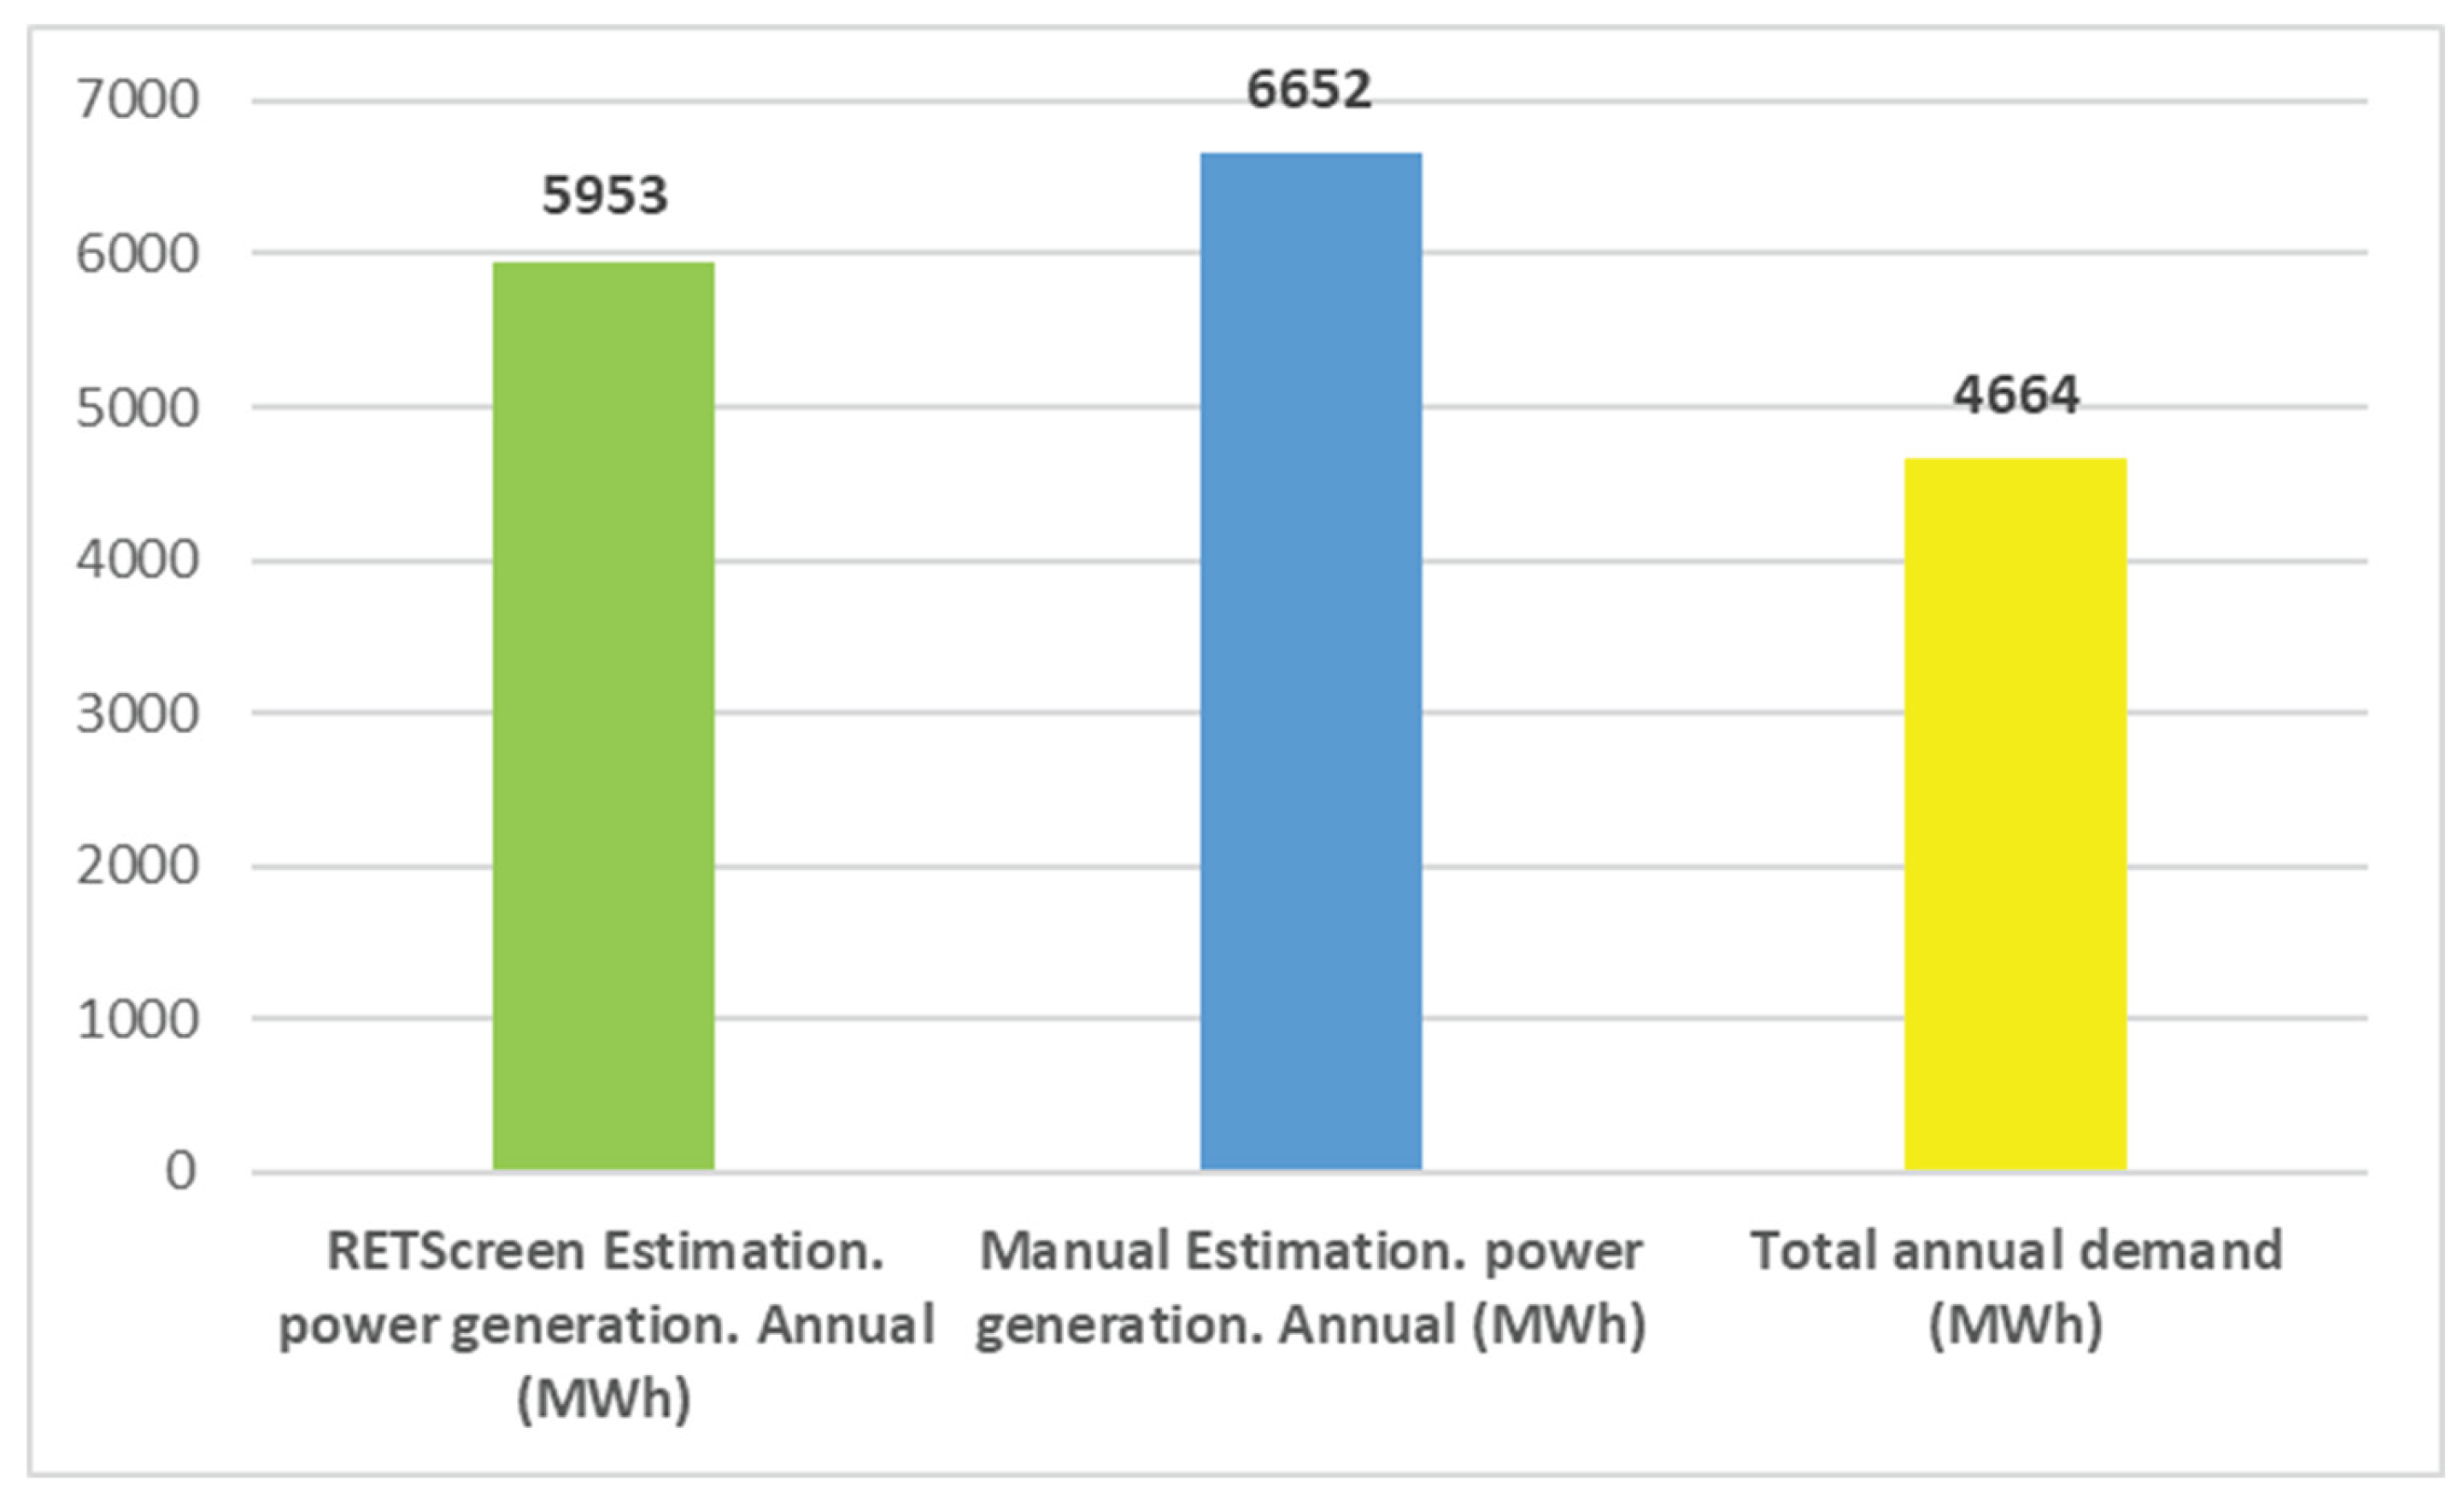
The findings derived from the computations conducted with RETScreen software affirm the accuracy of the calculations, demonstrating that the turbine possesses the capacity to generate electricity equivalent to 127% of the demand.
Figure 7.
Comparison between electricity demand and generation.
3.10. Carbon Saving
Annual Saving Carbon calculated by using formula 7. According to the latest UK Government Emissions factors were published on 7th June 2023 The generation emissions factor for grid electricity is 0.20707 kg CO2e per kWh (33).
Total annual carbon footprint by using grid electricity= 388.61 MWh × 12 months × 1000 × 0.20707 = 952,389.475 kg CO2e ≈ 952.5 Ton CO2e
Also, according to Wind Energy Technologies Office report in August 2023, wind energy produces around 11 grams of CO2 per kilowatt-hour (g CO2e/kWh) of electricity generated (34).
Total annual carbon footprint by using wind generated electricity = 383.28 MWh × 12 months × 1000 × 0.011 = 50,592.96 kg CO2e ≈ 50.6 Ton CO2e
Annual Saving Carbon = 952.5 Ton CO2e - 50.6 Ton CO2e = 901.9 Ton CO2e
4. Discussion
Globally, transmission losses typically fluctuate within a range of 5% to 10% (35). This variability underscores the importance of considering factors such as the proximity of renewable energy source power plants to charging stations. By situating these power sources in close proximity to charging infrastructure, the losses incurred during transmission can be minimized, thereby enhancing overall efficiency and sustainability within the electric vehicle charging network.
4.1. Location
While this study did not specifically aim to identify the optimal site for fast electric charging stations, certain preliminary criteria were taken into account when considering potential locations. These criteria included:
- Comparable wind speeds to other key cities in Scotland, as illustrated in Figure 2.
- Proximity to transit hubs and major transportation routes such as roads A90, A92, and B997, as depicted in Figure 3.
- Availability of areas with wind energy potential while maintaining non-ecological sensitivity to minimize environmental impact, as shown in Figure 3.
- Proximity to the city of Aberdeen, within a distance of 1 mile.
It's important to note that these features alone may not suffice to determine a suitable site. Typically, methods such as spatial analysis in ArcGIS, Analytic Hierarchy Process (AHP), or Bayesian analysis are employed to make informed decisions regarding the ideal location for designing electric fast charging stations.
The criteria and objectives involved in selecting suitable locations for electric fast charging stations exhibit considerable similarity across various studies, albeit employing diverse methodologies. Certain investigations focus on optimizing these stations by considering factors such as construction costs, access to renewable resources, expected capacity, economic viability, reliability, environmental impacts, and technical aspects of both construction and operation (36). Conversely, alternative studies emphasize proximity to transportation routes, urban centers, and communal spaces like parks, shopping centers, banks, and residential areas, particularly in terms of leveraging renewable energy potential. This emphasis arises from the recognition that electric vehicle charging often coincides with activities such as shopping, exercising, or working, allowing users to maximize their time efficiency (37). Moreover, some studies adopt a broader approach, prioritizing technical, environmental, economic, and social factors, each with their respective sub-criteria (38).
In 2021, Aberdeen city had 95,000 registered vehicles (27). This figure implies that electric vehicles constitute 1.21% of the total vehicle’s population. The current requirement for charging these electric vehicles (1.21%) stands at 9 charging stations and one wind turbine, as calculated in this study. According to the study's findings, if all vehicles were powered by wind-generated electricity and experienced a 17.6% growth by 2030, approximately 131 charging stations and 15 wind turbines would be needed by that time.
4.2. Wind Energy Assessment
Factors such as wind speed, turbine size and capacity, maintenance and service requirements, environmental considerations, and manufacturer reputation and support were taken into account when selecting the wind turbine and tower height. GE's 1.85-82.5 model wind turbine demonstrates satisfactory energy efficiency compared to other options. Factors such as blade radius, recommended height by the manufacturer, and unique design contribute to its suitability. Additionally, considering the roughness coefficient of the area, this option, along with its height, appears to be suitable. Furthermore, the alignment of the wind speed profile in the area with the power curve of this turbine is crucial. However, the question arises: is bigger necessarily better? Vladimirs (2019) addresses this query in their study and talks about the need to have precise wind speed measurements etc.
Vladimirs' research underscores the necessity of precise wind speed measurements at different heights for optimizing wind turbine tower height economically. It challenges the notion that larger turbines are universally superior, emphasizing the importance of understanding wind profile laws and power law coefficients (K) to inform turbine size decisions (39).
Moreover, when comparing wind velocities below 100 meters between terrain roughness class 2 and terrain roughness class 1, it has been noted that wind speeds are consistently lower in terrain roughness class 2 for a given height. In the case of a wind turbine located in terrain roughness class 2, one might contemplate the value of investing an extra 15,000 Sterling pounds (In 2011) to procure a 60-meter tower rather than a 50-meter tower. Research has revealed that this investment leads to approximately 2.9 percent higher wind capture, resulting in a calculated rise of 9 percent in wind energy output (40).
4.3. Charging Demand
In pursuit of answering the main question of whether a fast-charging station for electric cars can be sustained using wind energy in Scotland, this study strategically set the investigated variables at their lowest values in electricity production calculations and at their maximums in charging demand calculations as a worst case scenario. For instance, parameters such as the Cp coefficient for a wind turbine, the number of registered cars, and the energy required for traveling a mile in an electric vehicle were conservatively estimated. Nevertheless, this study has some limitations. for example, Variations in individuals' preferences for charging times could lead to increased station congestion during peak hours, while driving behaviors may influence energy consumption per unit distance. Additionally, urban traffic levels may impact car charging demand.
For example, Moon’s study (17) emphasizes the importance of precise estimation of electricity demand and understanding consumer charging behaviors to effectively plan infrastructure. Findings reveal diverse preferences for charging times and station types, highlighting the necessity for customized policies and infrastructure development. Identification of peak electricity demand periods underscores the significance of accounting for seasonal and hourly fluctuations in energy supply planning. Recommendations include adopting controlled charging approaches and leveraging consumer preference data for strategic, long-term infrastructure planning.
Another significant observation is that the average minimum wind speed per year in July surpasses the threshold required to initiate electricity generation according to the turbine power curve. This advantage ensures nearly year-round operation of the turbine, resulting in increased annual efficiency.
4.4. EVCS Energy Management
On one hand, uncertainties surrounding renewable energy sources necessitate large storage batteries for ensuring a stable power supply to Electric Vehicle Charging Stations (EVCS). On the other hand, the procurement, maintenance, and disposal of such sizable battery volumes entail significant environmental costs and drawbacks. Hence, the option of a central connection to the grid offers numerous advantages. Central Grid Connection involves injecting electricity generated from renewable sources into the grid system, followed by the utilization of stable grid electricity for EV charging.
While this study does not advocate for the off-grid option with batteries due to the impracticality of managing the large volume of batteries, other research endeavors have explored various alternatives using different criteria and perspectives. For instance, Omar’s investigation (41) delves into optimizing the design of Electric Vehicle Charging Stations (EVCS) to minimize lifecycle costs and environmental emissions. The study evaluates different energy sources, encompassing renewable technologies and diesel generation. Findings reveal that operating EVCS within city confines as smart energy hubs with diesel-solar PV-BESS supply options prove economically advantageous. Moreover, for long-distance travel, isolated EVCS along highways equipped with diesel-solar PV-BESS blends exhibit the lowest Net Present Cost (NPC) and reduced carbon footprint compared to diesel-based EVCS. While fully renewable supplied EVCS are preferred for their carbon neutrality, they entail higher NPC. Additionally, grid-connected EVCS in densely populated urban locales exhibits promise when leveraging both the grid and internal resources.
Furthermore, Md Abdul (42) advocates for grid-connected electric vehicle charging stations (EVCS) as a viable option for meeting power demand efficiently. Grid connection ensures reliable power supply, particularly during periods of low solar availability or high energy demand. By relying on the grid, EVCS can satisfy electric vehicle (EV) charging needs consistently, enhancing user satisfaction and reducing "range anxiety." However, grid reliance also poses challenges. Fluctuating energy costs and potential grid congestion during peak hours can lead to increased operational expenses for EVCS operators. Moreover, dependence on the grid exposes EVCS to the risk of power outages or disruptions, impacting service reliability and user convenience. Additionally, high levels of grid utilization may strain existing infrastructure and necessitate costly upgrades. Achieving a balance between grid connectivity and alternative energy sources is essential for optimizing EVCS performance and ensuring sustainable operation. Increasing battery capacities and wider charging availability may alleviate peak demand pressure on the grid, facilitating the integration of EVs. Conversely, higher charging power could exacerbate peak demand, posing challenges for grid management (32).
However, ensuring the reliable operation of Electric Vehicle Charging Stations (EVCS) necessitates the deployment of storage systems to furnish energy for charging vehicles during emergency scenarios such as grid fluctuations and failures. Consequently, a substantial storage system, as outlined in results, was incorporated into this system to fulfill this requirement. Battery Energy Storage (BES) systems are strategically placed at PV and WT locations to control power flow and enhance system performance (43).
4.5. Carbon Saving
The findings highlight the potential for significant reductions in the carbon footprint associated with transitioning to renewable energy sources for charging electric vehicles. By harnessing sustainable energy sources such as wind power, wind power supplied CS contribute to reducing greenhouse gas emissions and improving urban air quality. Additionally, advancements in battery technology within EVs facilitate the integration of renewable energy sources like wind power, allowing for energy storage and utilization at optimal times.
5. Conclusions
This study demonstrated that a single appropriately sized wind turbine can meet the demand of Aberdeen’s current EV fleet using fast charging stations. In conclusion, while the transition towards renewable energy-powered EV charging represents a pivotal step towards sustainable transportation, it is not devoid of challenges such as intermittency, battery storage and investments needed for infrastructure. Addressing these challenges requires a comprehensive and concerted effort to overcome technological, economic, regulatory, and logistical barriers. By embracing innovation, fostering collaboration, and prioritizing sustainability, stakeholders can pave the way for a future where EVs serve as a catalyst for renewable energy integration and environmental stewardship.
Funding
This research received no external funding.
Institutional Review Board Statement
No ethical approval required
Informed Consent Statement
Not applicable
Data Availability Statement
RETScreen model used for this study available upon request.
Conflicts of Interest
The authors declare no conflicts of interest.
References
- Ding X, Liu X. Renewable energy development and transportation infrastructure matters for green economic growth? Empirical evidence from China. Economic Analysis and Policy. 2023;79:634-46.
- DUKES. Digest of UK Energy Statistics (DUKES). In: Department for Energy Security and Net Zero and Department for Business EIS, editor. 2023 ed2023.
- Chen Q, Lai X, Gu H, Tang X, Gao F, Han X, et al. Investigating carbon footprint and carbon reduction potential using a cradle-to-cradle LCA approach on lithium-ion batteries for electric vehicles in China. Journal of Cleaner Production. 2022;369:133342.
- Over half of younger drivers likely to switch to electric in next decade [Internet]. Office for National Statistic. 2021. Available from: https://www.ons.gov.uk/economy/environmentalaccounts/articles/overhalfofyoungerdriverslikelytoswitchtoelectricinnextdecade/2021-10-25.
- Verma S, Srivastava S, Planning LU, Banerjee S. Electric Mobility on Roads, a Boon or a Bane in Case of India. 2023.
- Bera TK, Bohre AK, Ahmed I, Bhattacharya A, Yadav A, editors. Smart charging for electric vehicles (evs): a short review. 2022 IEEE Global Conference on Computing, Power and Communication Technologies (GlobConPT); 2022: IEEE.
- Faizal M, Feng S, Zureel M, Sinidol B, Wong D, Jian G. A review on challenges and opportunities of electric vehicles (evs). J Mech Eng Res Dev. 2019;42(4):130-7.
- Alkawsi G, Baashar Y, Abbas U D, Alkahtani AA, Tiong SK. Review of renewable energy-based charging infrastructure for electric vehicles. Applied Sciences. 2021;11(9):3847.
- Sayed K, Abo-Khalil AG, S. Alghamdi A. Optimum resilient operation and control DC microgrid based electric vehicles charging station powered by renewable energy sources. Energies. 2019;12(22):4240.
- Alldritt D, Hopwood D. Renewable energy in Scotland. renewable energy focus. 2010;11(3):28-33.
- Child M, Ilonen R, Vavilov M, Kolehmainen M, Breyer C. Scenarios for sustainable energy in Scotland. Wind Energy. 2019;22(5):666-84.
- EnergyVision, cartographer Energy Vision – onshore wind energy sensitivity map. UK: RCPB; 2023.
- Ninikas, K. Wind Turbine Technology (Basics and key calculations). [Lecture presentation]. In press 2023.
- de Juan A, Tameemi S. Wind Energy Analysis Wind Energy Modelling2013.
- Vehicles OfZE. Public Charge Point Regulations 2023 guidance. In: Transport Df, editor. UK: Office for Zero Emission Vehicles; 2023.
- Chen T, Zhang X-P, Wang J, Li J, Wu C, Hu M, et al. A review on electric vehicle charging infrastructure development in the UK. Journal of Modern Power Systems and Clean Energy. 2020;8(2):193-205.
- Moon H, Park SY, Jeong C, Lee J. Forecasting electricity demand of electric vehicles by analyzing consumers’ charging patterns. Transportation Research Part D: Transport and Environment. 2018;62:64-79.
- (CEDSC) CEDSC. RETScreen software online user manual. CANMET Energy Technology Center: Natural Resource Canada; 1997-2005. Available from: www.retscreen.net.
- Abdallah L, El-Shennawy T. Reducing carbon dioxide emissions from electricity sector using smart electric grid applications. Journal of Engineering. 2013;2013.
- Wang Y, Sun T. Life cycle assessment of CO2 emissions from wind power plants: Methodology and case studies. Renewable Energy. 2012;43:30-6.
- Shorabeh SN, Firozjaei HK, Firozjaei MK, Jelokhani-Niaraki M, Homaee M, Nematollahi O. The site selection of wind energy power plant using GIS-multi-criteria evaluation from economic perspectives. Renewable and Sustainable Energy Reviews. 2022;168:112778.
- Spark, W. Climate and Average Weather Year Round in Aberdeen UK: Weather Spark; 2024 [updated online. Available from: https://weatherspark.com/y/40096/Average-Weather-in-Aberdeen-United-Kingdom-Year-Round#google_vignette.
- Romanuke, VV. Wind turbine power curve exponential model with differentiable cut-in and cut-out parts. Research Bulletin of the National Technical University of Ukraine" Kyiv Politechnic Institute". 2018(2):33-43.
- water Gpa. GE's 1.85-82.5 Wind Turbine. In: work Ia, editor. 2024.
- Wiser R, Millstein D, Bolinger M, Jeong S, Mills A. The hidden value of large-rotor, tall-tower wind turbines in the United States. Wind Engineering. 2020;45:857 - 71.
- Dowdeswell A. Number of electric cars in Aberdeen rose by more than 50% last year. Radar. 2023.
- STEWART, K. ABERDEEN ELECTRIC VEHICLE FRAMEWORK 2020 TO 2030. Arcadis (UK) Limited: Arcadis; 2021.
- Zapmap. EV charging connector types: Zapmap; 2023 [Available from: https://www.zap-map.com/ev-guides/connector-types.
- ElectricVehicleDatabase. Energy consumption of full electric vehicles. In: Database EV, editor. 2023.
- SunPower. How Much Electricity Does an Electric Vehicle Use? 2023 [Available from: https://us.sunpower.com/solar-resources/how-much-electricity-does-an-electric-vehicle-use.
- Beny. 1 Gun DC EV Charging Station. In: LTD ZBNEC, editor.: Beny; 2024.
- Dixon J, Bell K. Electric vehicles: Battery capacity, charger power, access to charging and the impacts on distribution networks. ETransportation. 2020;4:100059.
- UK.GOV. UK Government Conversion Factors for greenhouse gas (GHG) reporting. UK: Department for Energy Security and Net Zero; 2023.
- Energy.Gov. How Wind Can Help Us Breathe Easier Office of ENERGY EFFICIENCY & RENEWABLE ENERGY: Wind Energy Technologies Office; 2023 [Available from: https://www.energy.gov/eere/wind/articles/how-wind-can-help-us-breathe-easier#:~:text=Wind%20energy%20produces%20around%2011,2%2FkWh%20for%20natural%20gas.
- Gupta, A. An anthropology of electricity from the global south. Cultural Anthropology. 2015;30(4):555-68.
- Ebrahimi J, Abedini M, Rezaei MM, Nasri M. Optimum design of a multi-form energy in the presence of electric vehicle charging station and renewable resources considering uncertainty. Sustainable Energy, Grids and Networks. 2020;23:100375.
- Csiszár, C. Demand calculation method for electric vehicle charging station locating and deployment. Periodica Polytechnica Civil Engineering. 2019;63(1):255-65.
- Hosseini S, Sarder M. Development of a Bayesian network model for optimal site selection of electric vehicle charging station. International Journal of Electrical Power & Energy Systems. 2019;105:110-22.
- Vladimirs V, Zakharoff, Andrey. The Dependence of the Optimal Size of a Wind Turbine Tower on Wind Profile in Height. Transport and Aerospace Engineering. 2019;7(1):58-65.
- Anderson E, Antkowiak M, Butt R, Davis J, Dean J, Hillesheim M, et al. Broad overview of energy efficiency and renewable energy opportunities for Department of Defense installations. 2011.
- Hafez O, Bhattacharya K. Optimal design of electric vehicle charging stations considering various energy resources. Renewable energy. 2017;107:576-89.
- Quddus MA, Kabli M, Marufuzzaman M. Modeling electric vehicle charging station expansion with an integration of renewable energy and Vehicle-to-Grid sources. Transportation Research Part E: Logistics and Transportation Review. 2019;128:251-79.
- Eid A, Mohammed O, El-Kishky H. Efficient operation of battery energy storage systems, electric-vehicle charging stations and renewable energy sources linked to distribution systems. Journal of Energy Storage. 2022;55:105644.
Figure 1.
Schematic research process flowchart (author’s own work).
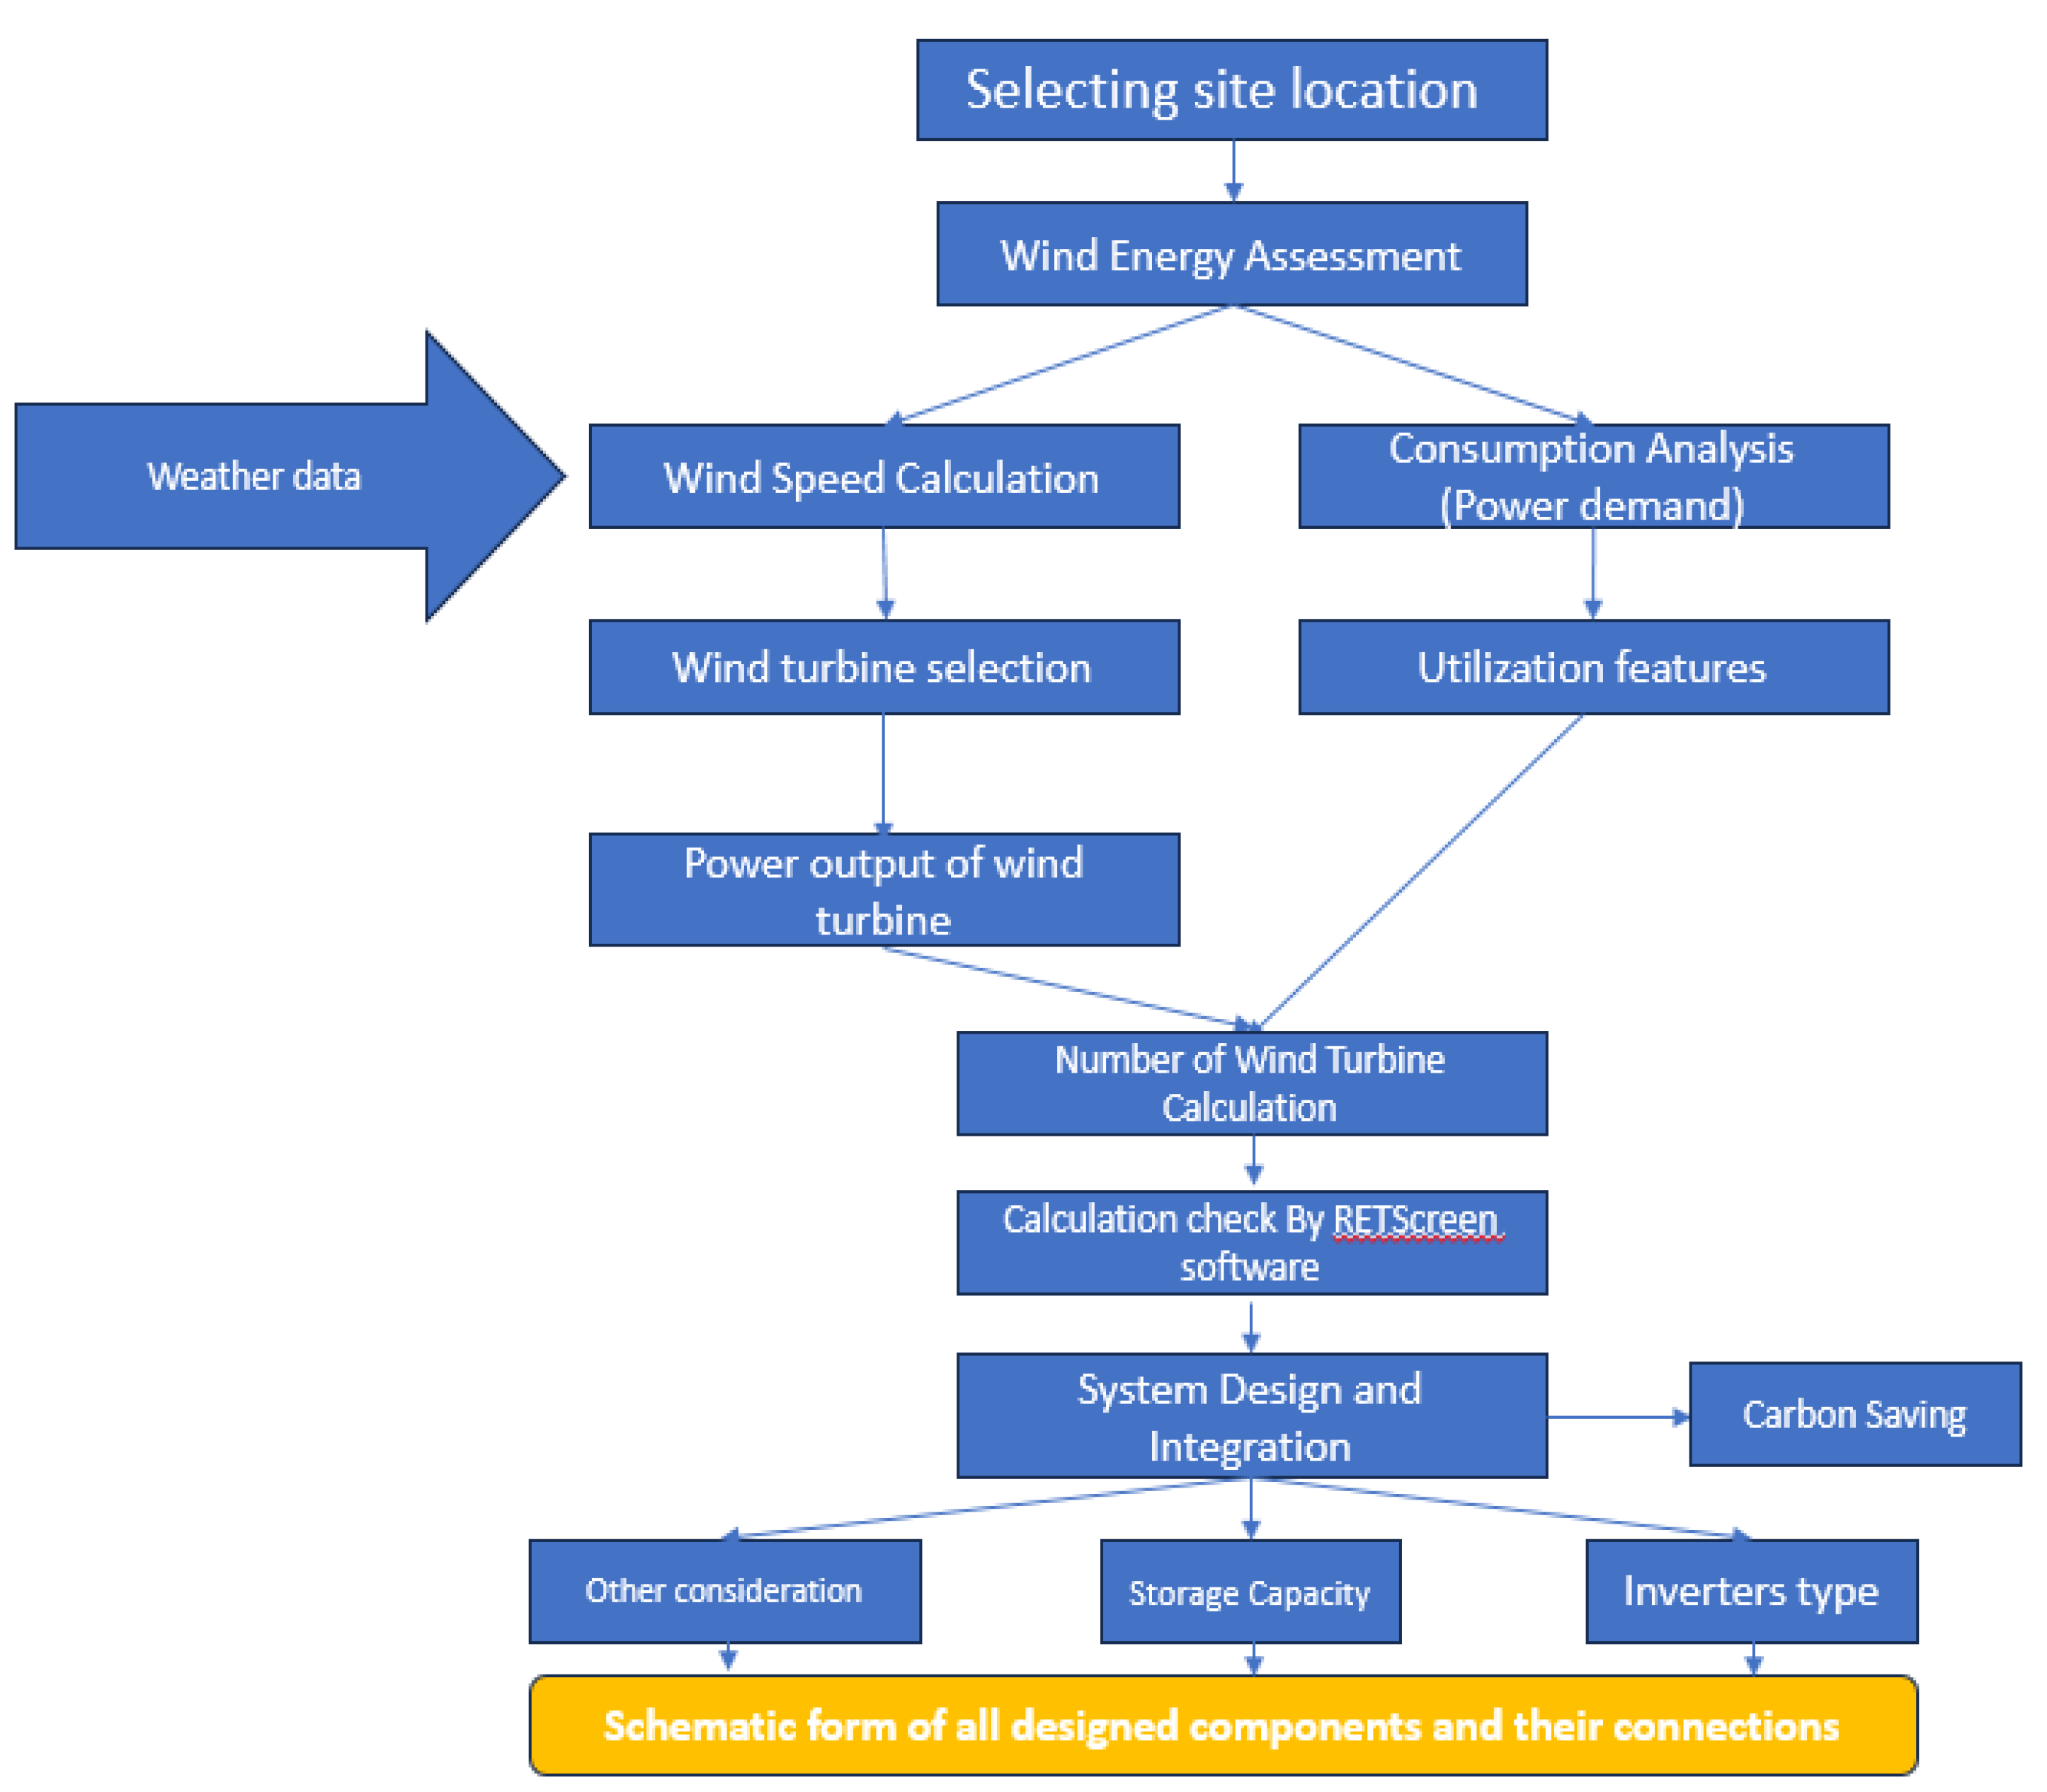
Table 1.
GE's 1.85 -82.5 wind turbine details (author’s own work based on data from wind turbine catalogue (24)).
Table 1.
GE's 1.85 -82.5 wind turbine details (author’s own work based on data from wind turbine catalogue (24)).
| Characteristics | Type of Values |
|---|---|
| Model | GE’s 1.85-82.5 |
| Number of blades | 3 |
| Recommended tower height | 80 m (flexible between 65 m up to 100 m) |
| Nominal Power Rate at 80 m height and 40.3 m blade diameter | 1.85 MW |
| Blade diameter | 40.3 m |
| Swept Area | 5102 m2 |
| Wind to Start | 2m/s |
| Rated Speed | 8.5 m/s average wind speed; 14% turbulence intensity |
| turbine's operational threshold | 22-25 m/s |
| Coefficient Potential (Cp) | 0.35 – 0.4 |
Table 2.
Power Output Calculation and Results (author’s own work based on data from wind power calculation).
Table 2.
Power Output Calculation and Results (author’s own work based on data from wind power calculation).
| Wind Speed (m/s)-10 meter above the ground in weather station | Wind Speed (m/s)-80 meter above the ground – logarithmic method | Power in the wind (Kw) | Maximum efficiency calculated by Albert Betz | Maximum power in wind turbine by Betz Law (kW) | Min Cp | Max Cp | Power Output in Min Cp (Kw) | Power Output in Max Cp (Kw) | Hrs of each month | Power Output in Min Cp (MWh)-per month | Power Output in Max Cp (MWh)-per month | |
|---|---|---|---|---|---|---|---|---|---|---|---|---|
| Jan | 8.08 | 11.73 | 4057.72 | 0.59 | 2406.23 | 0.35 | 0.40 | 1420.20 | 1623.09 | 744 | 1056.63 | 1207.57 |
| Feb | 7.56 | 10.97 | 3313.68 | 0.59 | 1965.01 | 0.35 | 0.40 | 1159.79 | 1325.47 | 672 | 779.37 | 890.71 |
| Mar | 6.97 | 10.12 | 2603.90 | 0.59 | 1544.11 | 0.35 | 0.40 | 911.37 | 1041.56 | 744 | 678.05 | 774.92 |
| Apr | 5.83 | 8.47 | 1524.97 | 0.59 | 904.31 | 0.35 | 0.40 | 533.74 | 609.99 | 720 | 384.29 | 439.19 |
| May | 5.14 | 7.46 | 1042.60 | 0.59 | 618.26 | 0.35 | 0.40 | 364.91 | 417.04 | 744 | 271.49 | 310.27 |
| Jun | 4.83 | 7.02 | 867.46 | 0.59 | 514.41 | 0.35 | 0.40 | 303.61 | 346.99 | 720 | 218.60 | 249.82 |
| Jul | 4.64 | 6.73 | 766.93 | 0.59 | 454.79 | 0.35 | 0.40 | 268.42 | 306.77 | 744 | 199.70 | 228.23 |
| Aug | 5.03 | 7.30 | 976.43 | 0.59 | 579.02 | 0.35 | 0.40 | 341.75 | 390.57 | 744 | 254.26 | 290.58 |
| Sep | 6.08 | 8.83 | 1729.56 | 0.59 | 1025.63 | 0.35 | 0.40 | 605.35 | 691.82 | 720 | 435.84 | 498.11 |
| Oct | 6.92 | 10.04 | 2542.15 | 0.59 | 1507.50 | 0.35 | 0.40 | 889.75 | 1016.86 | 744 | 661.97 | 756.54 |
| Nov | 7.42 | 10.77 | 3134.28 | 0.59 | 1858.63 | 0.35 | 0.40 | 1097.00 | 1253.71 | 720 | 789.83 | 902.67 |
| Dec | 7.72 | 11.21 | 3537.84 | 0.59 | 2097.94 | 0.35 | 0.40 | 1238.24 | 1415.14 | 744 | 921.25 | 1052.86 |
| Total Energy Output in a year | 6651.38 | 7601.52 | ||||||||||
Disclaimer/Publisher’s Note: The statements, opinions and data contained in all publications are solely those of the individual author(s) and contributor(s) and not of MDPI and/or the editor(s). MDPI and/or the editor(s) disclaim responsibility for any injury to people or property resulting from any ideas, methods, instructions or products referred to in the content. |
© 2025 by the authors. Licensee MDPI, Basel, Switzerland. This article is an open access article distributed under the terms and conditions of the Creative Commons Attribution (CC BY) license (http://creativecommons.org/licenses/by/4.0/).
Copyright: This open access article is published under a Creative Commons CC BY 4.0 license, which permit the free download, distribution, and reuse, provided that the author and preprint are cited in any reuse.


