Submitted:
22 May 2025
Posted:
22 May 2025
You are already at the latest version
Abstract
The electrochemical performances of Li-ion batteries based on LiFePO4(LFP) cathode supported by bio sourced activated carbon obtained from Millet Cob (MC) or Water Hyacinth (WH) were determined. The carbons were obtained by combustion prior to drying the raw materials of WH and MC, followed by steps of various chemical cleanings, were activated at the following different mass ratios of potassium hydroxide (KOH) and WH or MC respectively: KOH/WH 1:1, 2:1, and 5:1, and KOH/MC 1:1, 2:1, and 5:1.The physics properties (X-ray diffraction patterns, BET surface area, micropore and mesopore volume, conductivity, etc. ) and electrochemical performances (specific capacity, discharge at various current rates, electrochemical impedance measurement, etc.) were determined. The electrochemical performances of coin cells based on cathodes composed of 85% LiFePO4, 8% of these activated carbons, and 7% polyvinylidene fluoride (PVDF) as a binder, with lithium metal as the anode were studied. Cycling tests and the discharge at different current rates of these cells based on the LiFePO4/C cathodes supported by the various activated carbons were achieved. It was found that the coulombic efficiency, the specific capacity and the discharge at different current densities of these cells were interesting for Li-ion batteries applications. It was shown that their Coulombic efficiency was at least 99% and was very close to that of the cell based on LFP/commercial graphite cathode. The specific capacity of the cells was correlated to the KOH/WH et KOH/MC. Overall, the electrochemical performances of cells based on LFP/MC and LFP/WH were correlated to the physics properties of the activated carbons of MC and WH. Their performances were also compared to those of cells based on LFP/graphite. It was found that cells based on activated carbon obtained from WH exhibited better performances than those from MC. For a given current rate and the same number of cycles, the specific capacity of the cells based on activated carbons of WH is very close to that based on graphite.
Keywords:
LiFePO4
; lithium
; activated carbon
; water hyacinth
; millet cob
; porosity
; coin cells
; cycling performance
; specific capacity
; electrochemical impedance spectroscopy
1. Introduction
LiFePO4 has emerged as a cost-effective and promising positive electrode material for lithium-ion batteries, particularly suited for applications in electronics, telecommunications, transportation, and beyond. Since its introduction as a cathode [1], LiFePO4 has demonstrated numerous advantages, including a high theoretical capacity, exceptional longevity, an excellent stable discharge profile, the ability to handle high current rates, moderate or low cost, natural abundance of its constituent elements, excellent thermal and chemical stability and more environmental friendly utilisation than the other cathodes based materials [2,3]. Its thermal stability, attributed to its phospho-olivine structure, is rooted in a unique crystalline configuration: oxygen atoms form a hexagonal close-packed lattice, iron ions create zigzag chains of octahedra connected by phosphate (PO₄) groups, and Li⁺ ions occupy octahedral sites arranged in one-dimensional tunnels along the [010] axis [1,2,3,4]. The strong covalent bonds between oxygen and P⁵⁺ ions confer high structural stability, enhancing thermal resistance and ensuring reliable performance at elevated temperatures, a critical advantage for demanding applications. Additionally, It has been shown that [5] the combination of phosphorus and iron optimizes redox energy, generating a voltage of 3.4 V relative to Li/Li⁺, a key factor for stable electrochemical performance. The excellent reversibility of LiFePO4 is linked to the structural similarity between LiFePO4 and FePO4 [5]. During the phase transition between these two states during de-lithiation, changes in crystal parameters remain minimal, with a volume reduction of only 6.81% and a density increase of 2.59%, reducing structural stress during charge-discharge cycles [3]. Composed of naturally abundant elements such as iron, lithium, and phosphorus, LiFePO4 could reduce cathode costs by 10–50% of the total lithium-ion battery cost, enhancing its competitiveness for large-scale commercial applications [3,6].
Despite its many advantages, certain limitations hinder the widespread adoption of LiFePO4. Its low ionic diffusivity (∼10⁻¹⁴ cm²/s) and poor electronic conductivity (∼10⁻⁹ S/cm) limit its performance during rapid charge and discharge cycles. This low electronic conductivity was attributed to the bonding structure of iron atoms: FeO6 octahedra share vertices rather than edges or faces, increasing the distance between iron atoms and complicating electron transport [2,7]. Another limitation of this cathode materials is its low operating voltage (up to 3.4 V vs Li/Li⁺) compared to the other commercial cathodes which potentials are closer to 4 Volts vs Li/Li⁺. To address these drawbacks, various approaches have been developed, including particle size reduction [8,9,10], doping with metals [8,11,12], and coating LiFePO4 particles with carbon [8,13,14,15]. These methods improve electronic conductivity and overall performance, though they may incur additional costs. Issues are also related to long term stability of the dopant. Ongoing research aims to identify innovative and cost-effective solutions to optimize LiFePO4 performance and stability while controlling expenses.
On the particle size reduction, it has been noted [16] that nanomaterials exhibit excellent mechanical stress resistance, facilitating adaptation to volume changes during charge-discharge cycles while improving lithium-ion diffusion and electron transfer due to reduced diffusion distances. However, their high specific surface area makes them susceptible to undesirable side reactions, such as electrolyte degradation, which can affect chemical stability. Moreover, excessively small particle sizes may reduce electronic conductivity and lead to agglomeration, complicating processing and incorporation into composite materials [17,18,19]. Metal doping has proven effective in enhancing Li⁺ ion diffusion and cathode conductivity [19,20,21,22]. It has been shown that integrating super valent ions [19], such as Mg²⁺, Al³⁺, or Ti⁴⁺, can increase electronic conductivity by orders of magnitude by creating p- and n-type semiconducting regions. It has been shown that partial replacement of Fe²⁺ with Mn²⁺ improves conductivity, achieving a specific capacity exceeding 140 mAh/g with minimal performance loss over cycles [3,7]. Additionally, it has been confirmed that doping with precious metals like platinum and palladium significantly enhances electrochemical properties [12,20,21,22]. In contrary, it has been noted that aliovalent doping is poorly tolerated by the olivine structure of LiFePO4, as dopant ions are not always well-integrated into the crystal lattice, limiting their effectiveness in improving electronic conductivity [23,24]. To overcome the conductivity limitations of LiFePO4 cathodes, it has been suggested [25] to use conductive carbon-based materials as supports, promoting optimal lithium-ion flow and enhancing electrochemical performance. Several studies [16,26,27,28,29,30,31] have explored the application of carbon coatings at varying percentages to strengthen conductivity and optimize overall cathode performance.
This innovative study explores the use of bio sourced carbons derived from agricultural waste, such as millet cob and water hyacinth, to develop LiFePO4 cathodes for lithium batteries. These novel materials, applied in this context for the first time, are expected to provide new scientific insights into the relationship between the physicochemical properties and the electrochemical performance of LiFePO4 (LFP) cathodes enhanced with bio-derived carbon from millet cob and water hyacinth. This research will advance the understanding of how bio-sourced carbon additives influence the performance of LFP-based cathodes in lithium-ion batteries.
2. Materials and Methods
2.1. Materials, Electrodes, Li-Ion Battery Cell Elaboration and Fabrications
The millet cob and water hyacinth samples undergo chemical activation using potassium hydroxide (KOH) as an activating agent. The amount of KOH is carefully adjusted based on the KOH/biomass mass ratio, directly influencing the formation of micropores and mesopores, as well as the material’s conductivity. Three different concentrations were explored, 10% KOH (KOH/CM 1:1), 20% KOH (KOH/CM 2:1) and 50% KOH (KOH/CM 5:1). Therefore, the different samples of active carbon from millet cob are noted respectively KOH/MC 1:1, KOH/MC 2:1, KOH/MC 5:1, and those from water hyacinth KOH/WH 1:1, KOH/WH 2:1, KOH/WH 5:1.
The electrolyte, supplied by Sigma Aldrich, consisted of a 1M LiPF6 solution dissolved in an equimolar mixture of ethylene carbonate (EC), dimethyl carbonate (DMC), and ethyl methyl carbonate (EMC), ensuring high ionic conductivity and thermal stability for lithium-ion batteries. The separator used was a 25 µm-thick microporous polypropylene membrane (Celgard® 2400), cut into 1.90 cm discs to match the cell dimensions.
The electrodes were prepared using LiFePO4 powder (Sigma Aldrich) and lithium metal discs (MSE Supplies). A polymeric binder, polyvinylidene fluoride (PVDF), dissolved in dimethylacetamide (DMAC), was used to homogenize and apply the active LiFePO4/carbon (LiFePO4/C) mixture onto an aluminum current collector. The electrodes were assembled in a CR2032 coin cells, including casings, springs, spacers, and sealing gaskets, in an argon-filled glove box to prevent contamination from oxygen or moisture.
2.2. Methods
2.2.1. X-ray Diffraction (XRD)
The crystalline phase, the structure and the purity of the powders obtained after synthesis are determined by an X-ray diffractometer model D8 from the company Burker with a radiation source of the CuKα type, i.e., a wavelength of λ= 0.15406 nm and an energy source E = 8.04867 keV. The θ/2 geometry θis adopted with a sweep angular rate of 0.02°/s over a sweep range of 5 to 80° (2 θ) and a pitch of 0.02°.
2.2.2. Specific Surface Area Determination by the Brunauer-Emmett-Teller (BET) Method
The BET specific surface area (SBET), the porosity or pore size distribution (PSD) as well as the pore volume of the different samples were measured by the BET method. This analysis is performed using a Quantachrome AS1Win™ - Automated Gas Sorption Data analyzer. This equipment uses the data acquisition and calculation software called Acquisition and Reduction.
The LiFePO4 powder was degassed under dynamic vacuum (≤10⁻³ mbar) at 300°C for 3 hours to remove adsorbed contaminants, then weighed (791.50 mg) and loaded into the BSD-PM sample tube. The sample was cooled to 77.3 K (liquid N₂ temperature), and N₂ adsorption isotherms were measured versus applied pressure (P/P0 where P0 is the initial pressure, 1.0258 bar) for BET surface area analysis (P/P₀ = 0.05–0.30). After BET, the pressure was increased to near saturation (P/P₀ ≈ 0.99) and then decreased stepwise to record the desorption branch for BJH mesopore analysis (2–50 nm). Finally, ultra-low-pressure adsorption data (P/P₀ < 0.01) were collected for HK micropore (<2 nm) characterization
2.2.3. Scanning Electron Microscopy and Energy Dispersive X-ray Spectroscopy
Scanning electron microscopy (SEM) was employed to analyze the surface morphology and microstructure of activated carbon derived from millet cob and water hyacinth, including particle size and surface composition. The images were acquired using a JEOL JSM-7600F thermal field-emission SEM (FE-SEM), operating at an acceleration voltage of 15–30 kV and a probe current of 0.1 pA–200 nA. The system was equipped with an energy-dispersive X-ray spectroscopy (EDS) detector for elemental mapping and composition analysis. EDS, a qualitative analytical technique, was used to identify the elemental constituents of the synthesized samples [32,33,34].
2.2.4. Conductivity Measurement of the Activated Carbons
Electrical Conductivity Measurement is studied, using a four-point probe method with a Lucas Lab S-302 instrument, this test evaluated the electrical conductivity of the activated carbon, a key property for its use as an electrode material in batteries.
2.2.5. Electrochemical Characterisation
The electrochemical performance evaluation includes galvanostatic charge-discharge tests, cycling stability tests, and electrochemical impedance spectroscopy (EIS) to determine specific capacity, Coulombic efficiency, Peukert coefficient, cycling stability of the cathodes, and the diffusion coefficient of lithium ions. The results are analyzed to assess the impact of the activated carbon’s properties on cathode performance and are compared with those obtained using graphite to evaluate the advantages of bio sourced materials.
Electrochemical performances of the Li-ion coin cells based on the LFP cathode supported by MC or WH carbon were studied using a Princeton Applied Research 273A potentiostat, a Solartron Cell Test 1470 multichannel potentiostat from Scribner, and a Solartron 1255B frequency response analyzer from Scribner. The potentiostat 273A was used for the cyclic voltammetry study of the electrodes. The Solartron 1470 multichannel potentiostat was used for the charge discharge test of the samples. The Solartron 1255B analyser linked to the potentiostat 273A was used to determine the electrochemical impedance spectroscopy measurement.
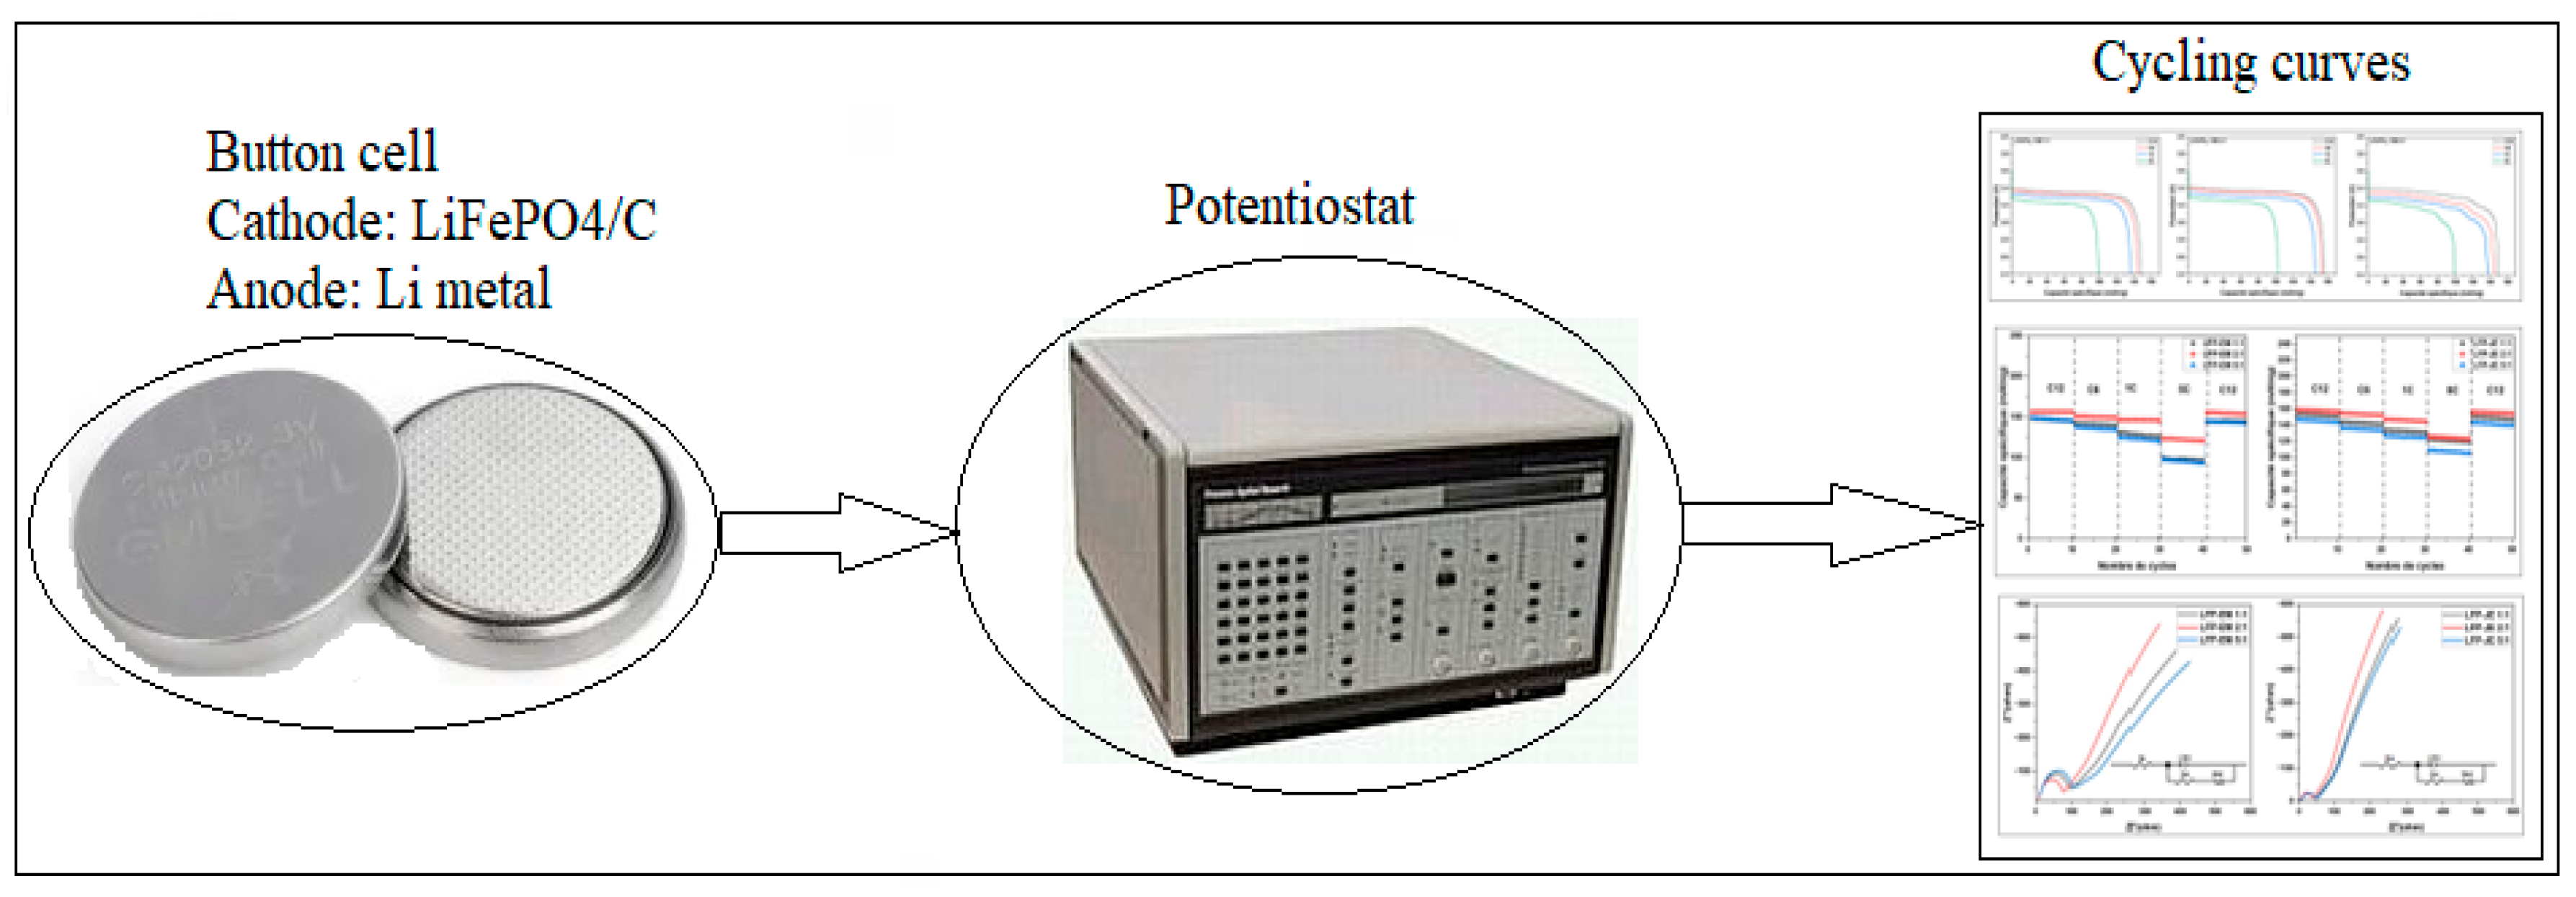
Figure 1.
Flowchart of button cell testing.
3. Results and Discussion
3.1. Morphological and Structural Characterization of Pure LiFePO4
Figure 2a shows the X-ray diffractogram (XRD) of LiFePO4 powder. For comparison the reference XRD of pure LFP according to reference card 01-090-1862 is indicated in Figure 2b [35]. All the position of the X-ray diffraction peaks of Figure 2a of LFP obtained in this work fit well those of the standard sample. Furthermore, the analysis of the XRD spectra show that the stable rich crystalline structure of LiFePO4 is obtained and confirms the presence of the triphylite phase. The sharp and well-defined peaks in the diffractogram indicates a high degree of crystallinity of the LiFePO4 sample. It is well established that obtaining a such structure is essential for the optimization of ionic conductivity and ensure reliable performance. High crystallinity facilitates also clear diffusion pathways for lithium ions, thereby improving efficiency during charge and discharge cycles.
SEM analysis reveals that the LiFePO4 particles exhibit a uniform spherical to ellipsoidal morphology, with particle sizes ranging from 100 to 500 nm (Figure 3). This narrow size distribution is advantageous for LFP cathode applications, as it provides a high surface-to-volume ratio, facilitating enhanced electrolyte-electrode interaction and promoting faster lithium-ion diffusion.
Moreover, the reduced particle size is expected to improve electrochemical reactivity by enhancing Li⁺ reduction (discharge) at the cathode/electrolyte interface, facilitating Li oxidation (charge) at the anode/electrolyte interface, thereby enabling rapid charge/discharge cycling.
However, SEM observations also indicate particle agglomeration, which may adversely affect cathode performance. These agglomerates can restrict electrical conductivity, increase lithium-ion diffusion path lengths, reduce overall electrochemical efficiency.
Figure 4 shows the variation of the adsorbed quantity (cm3/g) vs relative pressure P/P0 of nitrogen adsorption and desorption isotherms of LiFePO4.This appearance of the hysteresis indicates that mesopores and micropores are detected in the LiFePO4 powder. Accordingly, the LiFePO4 powder particles are formed with mesopores (pores width are higher than 2 nm) and with micropores (pores width are less than 2 nm) [36].
The specific surface area of the material was measured using the BET method, while pore size and distribution (PSD), in the case of mesopores, were analyzed using the Barrett Joyner and Halenda (BJH) method which is based on the following Kelvin equation (1) [37]. This equation provides a useful model for the transformation of adsorption data into a PSD. Accordingly, ri which is the radius of condensate with a meniscus of hemispherical form or the radius (rj) of the curvature of the adsorbent in nm, is given by:
Where σ is the liquid surface tension of the absorbate in N/cm
Vi is the molar volume of the liquid phase in ml/mol; Θ is the contact angle between the meniscus and the solid wall in radian; R is the ideal gas constant= 8.31 J/mol.K; T is the temperature in Kelvin (K); Pi is the applied pressure in atm; P0 is the reference pressure in atm; Pi/P0 is the partial pressure when pressure Pi is applied to the sample.
From this relation, the method established algorithms which help to estimate for each partial pressure Pi/P0: the pore anisotropy factor bi which equals to the ratio of pore length (Li) over the pore diameter (Di) (Li/Di) Li/Di is proposed, based on N2 adsorption-desorption isotherms. The approach used also the estimation of the pore surface area (Spi), the pore volume (Vpi), and the pore radius (ri) = Di/2 corresponding to each partial pressure Pi/P0) of adsorption isotherm. Plots of log (Spi 3/Vpi2) vs log ri provide lines whose slope at each partial pressure equals si.= αi – 1 where αi is constant for all pore diameters Di and is called the pore length parameter. This slope is correlated to the pore length (li) by this power law relation: li = kriαi-1 where k (in grammes) is the proportionality constant. Accordingly, the pore length parameter (α) is used for the pore length analysis.
However, there are other approaches that consider the fluid-solid interactions when the pores width is less than 2 nm. In this case the pores are called micropores and their filling takes place in the precapillary condensation range of physisorption isotherm. The Horvath-Kawazoe (HK) method is a novel technique for determining the micropore size distribution. The method was originally used to analyse nitrogen adsorption on molecular sieve carbons with slit shaped pores but has since been modified to account for cylindrical shaped pores as in the case of silica mesopores. The HK method is based on the general idea that the relative pressure required for the filling of micropores of a given shape and size, is directly related to the adsorbent-adsorbate interaction energy [38].
Based on the interaction energy between the gas molecule and the material surface, the following equation (2) has been developed to link the partial pressure variation to the dimension of the pores and other parameters [38].
Where:
K is the Avogadro number (K = 6,02x10²³); σ is the distance between a gas atom and the surface at zero interaction energy, l is the distance from the surface; Na is the number of atoms per unit area of surface, Aa is a constant; d = da +dA where da is the diameter of an adsorbent atom, and dA is the diameter of the adsorbate molecule. The distance from the surface should be larger than d.
The adsorption/desorption isotherm (Figure 4) reveals a mesoporosity character in LiFePO4, with a marked increase in adsorption at high relative pressure (p/p0 close to 1), suggesting the presence of mesopores tending toward macropores. The observed hysteresis indicates distinct adsorption and desorption processes, typical of cylindrical or slit-shaped pores and complex porous structures. The pore size distribution, obtained using the BJH method, highlights major peaks around 2 nm, 4 nm, 6 nm, and 42 nm, confirming the dominance of mesopores, which facilitate lithium-ion transport and enhance the material’s electrochemical performance.
The textural properties of LiFePO4 as a cathode material were characterized through comprehensive pore structure analysis using BJH and HK methods in conjunction with BET measurements (Figure 5 and Figure 6, Table 1). The quantitative data on specific surface area, pore volume distribution, and pore diameter profiles presented in Table 1 provide fundamental insights into the material’s effectiveness for lithium-ion battery applications, revealing important structure-property relationships that influence electrochemical performance.
The results reveal that the LiFePO4 powder exhibits a low specific surface area of 1.2012 m²/g and a limited total pore volume of 0.0014 cm³/g, with a predominance of mesopores (0.0009 cm³/g) and an average pore low diameter of 4.662 nm, but which is higher than 2 nm for micropore diameter. These characteristics of the predominance of the mesopores in LiFePO4 powder indicate restricted capacity for electrochemical reactions and ion diffusion. The addition of activated carbon as a support may compensate these limitations by increasing the specific surface area and porosity, thereby enhancing the contact between the cathode and the electrolyte and promoting improved lithium-ion diffusion.
These analyses provide a detailed assessment of the textural properties of LiFePO4, offering essential insights into its effectiveness as a cathode component in lithium-ion batteries. The combination of these characterization techniques helps establish a comprehensive understanding of the material’s structural and electrochemical properties, guiding further optimization for energy storage applications.
3.2. Chemical and Physical Characterisation of Activated Carbons from Millet Cob and Water Hyacinth
3.2.1. Pore Size, Pore Distribution and BET Surface Determination of Activated Carbons from Millet Cob and Water Hyacinth
3.2.1.1. Adsorption and Desorption Isotherms of Activated Carbon from Millet Cob and Water Hyacinth
Figure 7 displays the nitrogen adsorption-desorption isotherm diagrams for activated carbons derived from millet cob and water hyacinth. Each diagram distinctly highlights the unique pore structures of these activated carbons.
These diagrams vary according to the mass ratios KOH/MC 1:1, 2:1, and 5:1 used in carbon activation. For both millet cob and water hyacinth samples, it is observed that the maximum adsorbed gas content decreases with an increase in the KOH ratio.
The nitrogen adsorption/desorption isotherm curves of activated carbon from millet cob (KOH/MC 1:1, 2:1, and 5:1) and water hyacinth (KOH/WH 1:1, 2:1, and 5:1) correspond to type IV isotherms, each presenting a type H4 hysteresis loop, indicating a predominance of mesopores [39]. Overall, the isotherm curves can be divided into three zones:
First Zone (P/P0 < 0.2): The adsorption and desorption branches overlap, corresponding to monolayer adsorption, indicating a region filled with micropores [40].
Second Zone (0.2 < P/P0 < 0.5): The adsorption and desorption branches begin to separate, showing the presence of half-formed pores within the micropores [41,42].
Third Zone (P/P0 > 0.5): A clear separation between the adsorption and desorption branches is evident, indicating capillary condensation, which signifies the presence of open mesopores and macropores [41].
The existence of these three zones indicates the presence of macropores, mesopores and micropores in the samples. The following pore size analysis supports the three zones of the isotherm’s curves.
3.2.1.2. Pore Size Distribution
The pore size distribution that includes both micropores and mesopores. Micropores provide a high specific surface area and enhance lithium-ion adsorption capacity, while mesopores improve the diffusion of lithium ions within the cathode. Various methods are available in the literature for carbon pore size analysis, including BJH [41], HK [41], SF (Saito-Foley) [43], NLDFT(non-local density functional theory) [44] and MP(Micro-Pore) [45]. These methods offer valuable insights into the pore size of synthesized activated carbons [46]. The HK and SF methods are typically used to analyze micropore size, the BJH method for mesopore size, and the NLDFT method for simultaneously analyzing the sizes of micropores, mesopores, and macropores [44]. In this study, micropores are analyzed using the well-established HK method, and mesopores and macropores are analyzed using NLDFT method which is the powerful multi parameters’ analysis method of pore size and distribution.
3.2.1.2.1. Water Hyacinth (WH) Sample
The estimations of micropore size of WH samples activated at various KOH/WH ratios using the HK method are illustrated in Figure 9a–c. Meanwhile, using the NLDFT method, the analysis of meso- and macropores is depicted in Figure 10d–f.
In Figure 9a, the observed peak indicates that the micropore size is concentrated at 0.58 nm. Similarly, Figure 10d, based on the NLDFT model, shows similar results of HK model, with peaks at 0.5 nm. For Figure 9b,c of the HK model, weak peaks are identified at 1.8 nm and is assigned to the micropores filling. These results are consistent with the results of Figure 10e,f of the NLDFT model, where peaks are at 1.65 nm.
In Figure 9a, the observed peak indicates that the micropore size is at 0.58 nm. Similarly, Figure 10d, based on the NLDFT model, shows result in agreement with the HK model, with a peak observed at 0.5 nm. For Figure 9b,c of the HK model, weak peaks are identified at 1.8 nm, corresponding to the filling of micropores. These findings are consistent with the results of Figure 10e,f of the NLDFT model, where peaks are identified at 1.65 nm. Accordingly, the micropore diameter of KOH/WH 1:1 (0.58 nm) is at least 3 times less than those of KOH/WH 2:1 (1.8 nm) and KOH/WH 5:1(1.8 nm).
In Figure 10d, the KOH/WH 1:1 (Figure 10d) sample exhibits mesopore peaks at 2.15 nm, 5.1 nm, 23 nm, 35 nm, and 42 nm, while macropores appear at 58 nm, 75 nm, and 92 nm. In contrast, KOH/WH 2:1 (Figure 10e) shows a broader mesopore distribution with peaks at 2.15, 2.40, 2.83, 3.96, 10, 22, 28, and 47 nm, along with a single macropore peak at 63 nm. Similarly, KOH/WH 5:1 (Figure 10f) displays mesopores at 2.15, 2.55, 4.45, 5.82, 10.3, 16, 29, and 37 nm, with weak macropore signals at 51 nm and 67 nm. Overall, all samples have a higher concentration of mesopores than macropores. However, KOH/WH 2:1 and 5:1 show a greater number of mesopore peaks compared to KOH/WH 1:1, indicating a more complex and finely distributed mesoporous structure in these samples.
This could lead to firstly better accessibility to the electrolyte as a wider variety of mesopore sizes (up to a certain limit) could facilitate better ion diffusion in Li-ion batteries. Secondly, it may contribute to better surface utilization due to the good distribution of mesopores improving the charge storage capacity. Finally, it allows a reduction of the ion transport resistance due to the presence of several pore sizes which could optimize the electrolyte penetration, thus improving the flow capacity. In contrast, KOH/WH 1:1 has fewer but larger mesopores, which might favor bulk ion transport but could limit surface area efficiency. The weak macropore signals in all samples suggest that macropores play a minor role compared to mesopores in these activated carbons. These findings imply that tuning the KOH/WH ratio significantly influences pore structure, which may directly impact the electrochemical performance of Li-ion batteries.
3.2.1.2.2. Millet Cob (MC) sample
In Figure 11a, the observed peak corresponds to micropores with a size of approximately 0.64 nm. Similarly, the peak in the NLDFT model shown in Figure 12d is close to this value, measured at 0.51 nm. The HK model curves in Figure 11b,c also exhibit peaks around 0.64 nm, while the NLDFT model results in Figure 12e,f indicate micropore peaks at approximately 0.5 nm. In contrary to the WH samples, for the MC samples, the ratio KOH/MC has no effect on the micropore size.
The pore structure of Millet Cob carbons derived varies with the KOH/MC ratio. For KOH/MC 1:1 (Figure 12d), mesopore peaks appear at 2.28 nm, 3.96 nm, 16 nm, 24.5 nm, and 38 nm, with a weak macropore peak at 52 nm. KOH/MC 2:1 (Figure 12e) shows mesopores at 2.3 nm, 3.94 nm, 16.2 nm, 21.7 nm, 28.88 nm, 35.72 nm, and 42 nm, along with weak macropore contributions at 53.6 nm and 60.4 nm. KOH/MC 5:1 (Figure 12f, NLDFT model) exhibits mesopore peaks at 2.40 nm, 4.45 nm, 19.75 nm, 28.67 nm, and 38.52 nm, with macropores at 52 nm and 55 nm.
The micropore size distribution remains consistent across all samples, while mesopores are influenced by the KOH/MC ratio, with higher ratios leading to a broader range of mesopore sizes. In contrast, macropore size remains largely unaffected by the KOH/MC ratio, differing from KOH/WH samples, where all pore sizes depend on the activation ratio. This difference suggests distinct activation mechanisms: MC-based carbons retain stable macropores but adjustable mesopores due to their inherent structure, whereas WH-based carbons show ratio-dependent changes in all pores due to their less-ordered biomass precursor. These structural differences may impact Li-ion battery performance, with MC-derived carbons favoring balanced ion transport and stability, while WH-derived carbons offer tunable porosity but require careful optimization to prevent pore collapse.
3.2.1.3. BET Surface Area of Activated Carbons
Table 2 summarizes the BET surface area, total pore volume, micropore volume, mesopore volume, and average pore size for all samples. For both WH and MC derived carbons, increasing the KOH activation ratio results in two consistent trends: (1) a reduction in specific surface area and total pore volume, and (2) an increase in average pore diameter. This shift toward larger pores is driven primarily by a decline in micropore volume, suggesting that higher KOH ratios promote pore widening at the expense of microporosity.
The observed decrease in BET surface area for both MC- and WH-derived samples at higher KOH ratios can be attributed to two primary mechanisms: (i) excessive KOH content promotes the widening of existing pores during activation, leading to a reduction in micropore density and consequently lowering the overall surface area, (ii) residual KOH or potassium compounds formed during activation may partially obstruct pores, further contributing to the diminished surface area. These structural modifications, particularly the loss of microporosity and potential pore blockage could significantly influence the electrochemical performance of Li-ion batteries utilizing these activated carbons, as they may affect ion accessibility and charge storage capacity
3.2.2. SEM Characterisation of Activated Carbons from Millet Cob and Water Hyacinth
The SEM analysis of samples carbonized at 460°C (KOH/MC or KOH/WH 2:1) revealed non-uniform blocky structures with pore sizes of 2600 nm and 1600 nm, showing no evidence of mesopores or micropores. These SEM images are not presented here as they were deemed of limited scientific interest. This morphological characteristic results from incomplete carbonization, which is further supported by the low carbon content (30% wt/wt) measured in these samples (see Section 3.2.3). Due to these properties, these materials are unsuitable for Li-ion battery applications.
In contrast, SEM images of activated carbons synthesized at 700°C (Figure 13) demonstrate a uniform and regular porous morphology across all KOH/MC and KOH/WH mass ratios. This well-developed pore structure stems from the higher carbonization temperature, which ensures complete chemical activation and yields materials with high carbon content (minimum 85% wt/wt, see Section 3.2.3). At 700°C, the carbonization process effectively facilitates volatile gas release and pore formation within the carbon matrix while enhancing the chemical activation efficiency of KOH, ultimately producing distinct porous architectures for each sample.
Samples activated with low KOH concentration (KOH/MC or KOH/WH 1:1) display abundant small pores. This morphology arises from the moderate chemical reactivity of KOH at this ratio, which prevents excessive carbon wall erosion. Consequently, these materials exhibit a high density of fine pores, as illustrated in Figure 13a,d. Such pore structures are particularly valuable for applications demanding large specific surface areas, as they favor micropore formation and presence, which are required for optimizing adsorption capacity and ion storage performance in energy storage systems.
The samples with higher KOH ratios (KOH/MC or KOH/WH 2:1 and 5:1) develop larger pore sizes compared to the 1:1 ratio sample. Particularly noteworthy is the water hyacinth KOH/WH 2:1 sample, which exhibits a natural graphite-like layered structure where the interlayer spacing creates a porous network that could facilitate Li-ion diffusion. For both KOH/MC and KOH/WH at 5:1 ratio, the pore structure becomes more open and less dense (Figure 13c,f), suggesting that excessive KOH (5:1 ratio) leads to partial degradation of the porous framework, increasing pore size while reducing pore density and potentially decreasing the specific surface area. The enhanced chemical activation from increased KOH concentration effectively removes volatile components, with the 2:1 ratio appearing optimal for Li-ion battery applications. However, excessive KOH (5:1 ratio) causes structural degradation, producing fewer but larger pores that may compromise performance. These findings emphasize the important need to optimize both KOH/carbon ratio and carbonization temperature (700°C proving effective) to tailor porosity for specific Li-ion battery requirements, with the KOH/WH 2:1 sample calcined at 700°C demonstrating particularly promising pore characteristics for such applications.
3.2.3. Elemental Composition of Porous Carbons from MC and WH Using EDS
Table 3 shows the results of EDS analysis of KOH/Carbon=2:1 for an activation temperature of 460°C. Carbon content does not exceed 30%wt/wt indicating that a total carbonisation (transformation of organic matter to carbon) is not achieved. For both samples, higher % of oxygen and potassium than carbon is obtained. This supports an uncomplete carbonisation and high content of KOH residues.
The high content of oxygen in both samples is an indication of an incomplete decomposition of the biomass organic compounds in which oxygen is involved in functional groups. Such functional groups may enhance hydrophilicity of the material and chemical reactivity at its surface. High carbonisation temperature must be used to increase the carbon content and decrease the other elements including the KOH residues.
Table 4 highlights the EDS of activated carbon samples derived from various KOH/carbon ration for MC and WH, carbonized at activation temperature of 700°C. Carbon content of samples carbonised at 700°C is at least 70% wt/wt in comparison with sample carbonised at 460oC. The results demonstrate a progressive decrease in carbon content within the activated carbon samples as the ratio of KOH/MC or KOH/WH increases. For millet cob (MC), the carbon content decreases from 85,5% at a mass ratio KOH/MC 1:1 to 71% at mass ratios KOH/MC 2:1 and KOH/MC 5:1. Similarly, for water hyacinth, the carbon content declines from 80% (KOH/WH 1:1) to 70% (KOH/MC 2:1or KOH/WH 5:1). This reduction can be attributed to the high concentration of KOH, which reacts more aggressively with carbon at elevated ratios. Under these conditions, carbon is more likely to be converted into carbon dioxide (CO₂) or potassium carbonates (K₂CO₃) through the activation process. This gasification reaction reduces the carbon content in the final material, thereby lowering carbon content.
The observed increases in oxygen and potassium percentages with higher mixing ratios reflect the direct influence of the activating agent (KOH). At higher ratios of KOH/CM, more KOH is retained in the sample, either as unreacted potassium residues or as compounds such as potassium carbonates formed during thermal activation.
The increase in oxygen content, from 12% to 20% for millet cob and from 13% to 18% for water hyacinth, indicates an accumulation of oxygenated functional groups and oxygen-containing inorganic residues (e.g., carbonates). Similarly, potassium content rises significantly, from 2% to 8.3% for millet cob and from 2% to 8% for water hyacinth. This increase is likely due to the formation of potassium compounds such as K₂CO₃ and K₂O, which become embedded in the porous structure of the samples, particularly at higher KOH concentrations.
Increasing the KOH/MC or KOH/WH mass ratio enhances the activation effect on the production of the carbonaceous material, leading to the formation of larger pores and a more open structure. However, a high concentration of KOH during activation can result in the transformation of a portion of carbon into gaseous by-products. This process not only reduces the carbon content but also induces more potassium residues in the structure. The accumulation of oxygen further suggests the presence of residual oxygen-containing functional groups.
The carbon content is less than 30% wt/wt for KOH/MC or KOH/WH 2:1 carbonised at 460oC and cannot be used in Li-ion applications. High pure carbon content (at least 70%wt/wt) and optimised pore size and structure interesting for Li-ion applications are obtained for KOH/MC 2:1 or KOH/WH 2:1 carbonised at 700°C.
3.2.4. X-ray Diffraction Studies of Porous Carbons from Millet Cob and Water Hyacinth
Figure 14 shows the XRD analysis of activated KOH/MC 2:1 and KOH/WH 2:1 at 460°C. The patterns reveal crystalline structural features for both samples. However, the observed crystalline peaks do not align with the positions typically associated with carbonaceous phases such as graphite or amorphous carbon. These peaks are likely attributable to inorganic residues from the activating agent (KOH) or unreacted compounds present in the raw biomass that were not fully decomposed or reacted at this relatively low activation temperature.
The very low intensity of the peaks corresponding to the carbon patterns is an indication that the sharp peaks might be assigned to some dominant contaminants of the samples which exhibited patterns of ordered structures. This agrees of the content of the EDS analysis in Table 3 where 1.7% and 0.4% in weight of silicon is, respectively, detected in carbon from MC and from WH. The absence of sharp carbon peaks in the XRD patters for both samples might suggest that thermal decomposition and activation were incomplete at 460°C. This could account for the presence of residual inorganic contaminants or inorganic elements originating from the precursor materials and the activating agent (KOH). These residues may include metal oxides or salts from KOH, as well as other impurities introduced during the steps of sample preparations [47].The low carbon content obtained from EDS analysis for samples activated at 460°C supports its content of a high fraction of inorganics species.
Figure 15 illustrates the XRD patterns of activated carbon samples synthesized at 700°C for mass ratios KOH/CM 1:1, 2:1, and 5:1. The XRD patterns of 100% pure graphite by PDF reference 00-056-0159 is also shown.This high temperature activation enhances the combustion of the organic compounds and facilitates the formation of a more defined and structured carbon matrix.
The XRD patterns for millet cob-KOH-activated carbon samples with mass ratios of KOH/MC 1:1, 2:1, and 5:1 reveal two broad peaks: one more intense around 2θ = 26° and a weaker one at 2θ = 43°. The breadth of these peaks and the absence of sharp peaks confirm a predominantly amorphous structure, which are typical of activated carbon materials [48,49,50,51]. The broad peak at 2θ = 26° corresponds to the (002) diffraction plane, while the peak at 2θ = 43° corresponds to the (100) plane, generally observed in graphite [48,50,52,53,54]. EDS analysis shows carbon percentages of 80% for KOH/MC 1:1, 71% for KOH/MC 2:1, and 62% for KOH/MC 5:1, supporting the identification of amorphous carbon in these samples [28]. However, for mass ratio KOH/MC 1:1 and 2:1, small sharp peaks within the broader peaks suggest the presence of a minor crystalline phase mixed with the amorphous structure, likely due to impurities or inorganic residues.
The study of the three activated carbon samples derived from millet cob reveals a gradual decrease in the degree of crystallinity of the increase of amorphous structure as the concentration of KOH increases. The KOH/MC 1:1 sample exhibits a crystallinity rate of 12.7%, which decreases to 11.9% for KOH/MC 2:1 and further drops to 8.6% for KOH/MC 5:1, highlighting a significant reduction in structural order. This morphology, typical of chemically activated carbons, results from the action of KOH, which promotes the disorganization of crystalline structures while generating pores and defects. At high concentrations, KOH intensifies the erosion of graphitic planes, explaining the observed decline in crystallinity.
In contrast for millet cob, the curves of the XRD patterns of Figure 15 of water hyacinth activated carbon samples demonstrate pure crystalline behavior for mass ratio of KOH/WH 1:1, 2:1, and 5:1. Each sample exhibits a sharp peak at 2θ = 26°, corresponding to the (002) plane of graphite, as identified and indexed by PDF reference 00-056-0159 for 100% pure graphite. Additionally, a second sharp peak at 2θ = 43° corresponds to the (111) plane of carbon, indexed by PDF reference 00-060-0053 for pure carbon.
As shown, the X-ray diffraction peaks reveal a significant influence of KOH concentration on the crystallinity of activated carbon derived from water hyacinth. The first peak, located at 2θ = 26° and attributed to the graphitic phase, shows variable intensity depending on the KOH/WH ratio. The height of the peak intensity is smaller for the sample with KOH/WH 1:1 ratio than both those for the KOH/WH 2:1 ratio and for the KOH/WH 5:1 ratio, respectively. A similar trend is observed for the second peak at 2θ = 43°, confirming that crystallinity is optimized for the KOH/WH 2:1 ratio. The analysis of the degree of crystallinity evaluated by the XRD software support these observations, with the degree of crystallinity increasing from 40.5% (KOH/WH 1:1) to 51.8% (KOH/WH 2:1) and 50.6% (KOH/WH 5:1). These results also confirm that the excessive KOH concentration disrupts the structural order of the material.
Finally, the other sharp peaks detected in the XRD curves for mass ratios KOH/WH 1:1, 2:1, and 5:1 are mainly attributed to the presence of chemical elements or contaminants (such as K, Na, Fe, Cl) [47].. These elements, confirmed by EDS analysis, likely originate from incomplete rinsing during the activated carbon neutralization process. Their presence influences the diffraction at the corresponding angles, reflecting an imperfect removal of the by-products of chemical activation [47].
3.2.5. Electric Conductivity of Activated Carbons from Millet Cob and Water Hyacinth
The use of hydraulic press to manufacture carbon platelets from carbon powder indicates a variation in electrical conductivity depending on the applied pressure [55]. It is well known that factors such as morphology and pore distribution also have an impact on electrical conductivity [56,57]. Therefore, we use the same pressure of 600 kPa to manufacture platelets of the same mass for each activated carbon.
The results indicate zero electrical conductivity for millet cob and water hyacinth samples activated at 460°C, indicating a luck of enough carbonisation. However, for samples activated at 700°C, Table 5 shows that the electrical conductivity values are higher for carbon samples obtained from water hyacinth than those from millet cob.
For both millet cob and water hyacinth-based sample, the conductivity changes with the KOH ratios. The maximum conductivity in the case per case is obtained for the ratio 2:1, with a high value (1,47 10-2s.cm-1) for KOH/WH compared to that (8,4210-3s.cm-1) of KOH/MC. Additionally, the KOH/MC 1:1 and KOH/WH 1:1 sample exhibit higher conductivity compared to the KOH/MC 5:1 and KOH/WH 5:1 sample. These findings suggest that a high conductivity is obtained for the samples exhibiting the highest total pore volume(Table 5), as observed in the KOH/MC 2:1 and KOH/WH 2:1 sample. Conversely, the formation of larger pores in the KOH/MC 5:1 and KOH/WH 5:1 sample (Table 5) appears to hinder conductivity, likely due to a reduction in the density of conductive pathways within the material.
These results support the idea that the specific surface area might not be the relevant parameter to probe the electrical conductivity. In contrary, according to [58], the electrical resistivity of carbon materials rises significantly with an increase in specific surface area. However, an excessive increase in pore size (conversion of micropores into meso- and macropores) leads to a reduction in electrical conductivity [58,59]. This explains the low electrical conductivity of the KOH/MC 5:1 and KOH/WH 5:1 sample, where the higher KOH concentration intensified carbon activation, further enlarging the pore size. The authors in [58] attribute this phenomenon to the increased degree of activation.
Overall, water hyacinth samples exhibit higher electrical conductivity than millet cob samples. As shown in Figure 15, this can be attributed to high crystallinity of the carbon obtained from the water hyacinth as shown on the XRD patterns, whereas millet cob samples are predominantly amorphous. This hypothesis is supported by [60], which states that carbonaceous materials with a high degree of crystalline graphite structure possess superior electrical conductivity. Additionally, a mass ratio KOH/CM 2:1 appears to be optimal, as it provides many pores conducive to charge carriers and optimizes the quantity of the activated carbon. This promotes the superior electrical conductivity observed in the KOH/MC 2:1 and KOH/WH 2:1 sample.
3.3. Electrochemical Characterisation
3.3.1. Specific Capacity of Synthesized Activated Carbon
The specific capacity of the synthesized activated carbon was determined using carbon and lithium button cells, cycled at a rate of C24. This low rate of charge/discharge prevent side reactions with carbon and allows the determination of the specific capacity of carbon materials. In these cells, the cathode is the activated carbon, the anode is lithium metal, the electrolyte is a solution of Lithium hexafluorophosphate (LiPF6), and a microporous separator is placed between the electrodes to prevent short circuits while allowing the passage of charge carriers. Figure 16 illustrates the charge/discharge curves of lithium/carbon cells at a rate of C24 for the various activated carbon from MC and WH. In comparison, the charge/discharge curves for commercial graphite are shown in Figure 17. The intersection of the charge and discharge curves allow the determination of the specific capacity of each sample (Table 6).
The specific capacities of the various samples vary very slightly from the lowest value of 330 mAh/g for (c) KOH/MC 5:1 to the highest value of 339 mAh/g for (e) KOH/WH 2:1;
Even the best capacity is obtained with water hyacinth-based carbon, a significant variation of of the specific capacity is not observed from the two sources of carbons or various activation conditions. Considering the values of Table 6, those of the water hyacinth samples and those based on KOH/CM ratios. Samples of the mass ratio of KOH/CM 1:1 and 5:1 exhibited comparatively lower capacities, likely due to the pore structure. While micropores contribute significantly to the specific surface area, an abundance of very small pores. (less than 2 nm) can restrict lithium-ion penetration, creating diffusion obstacles. In contrast, a higher proportion of mesopores facilitates more extensive lithium-ion diffusion, enabling faster and more complete intercalation into the porous structure. The specific capacity of a carbon material is influenced by several factors, including pore size distribution and electrical conductivity. Mesopores strike an optimal balance by providing both a high surface area and accessibility, while sufficient electrical conductivity ensures efficient electron transfer.
3.3.2. Electrochemical Impedance Spectroscopy Study of Synthesized Activated Carbon
To evaluate the electrochemical performance of the synthesized activated carbons, electrochemical impedance spectroscopy (EIS) measurements were carried out using Li/C half-cells. The cathode consists of activated carbon deposited on an aluminum current collector, the anode is made of lithium metal, and the electrolyte is LiPF6. The frequency was swept from 100 000 Hz to 0.1 Hz with a rate mean square (RMS) amplitude of 5 mV The results were compared to those of a standard reference (Li/Graphite half-cell). The Solartron 1255B analyser linked to the potentiostat 273A was used to get the electrochemical impedance spectroscopy measurement. The obtained Nyquist plots with their equivalent circuits modeled using ZSimpWin software are shown in Figure 6 for millet cob (a,b,c) and water hyacinth (d,e,f) carbon.
Figure 18.
Nyquist diagram of EIS of millet cob (a,b,c) and water hyacinth (d,e,f) carbon.
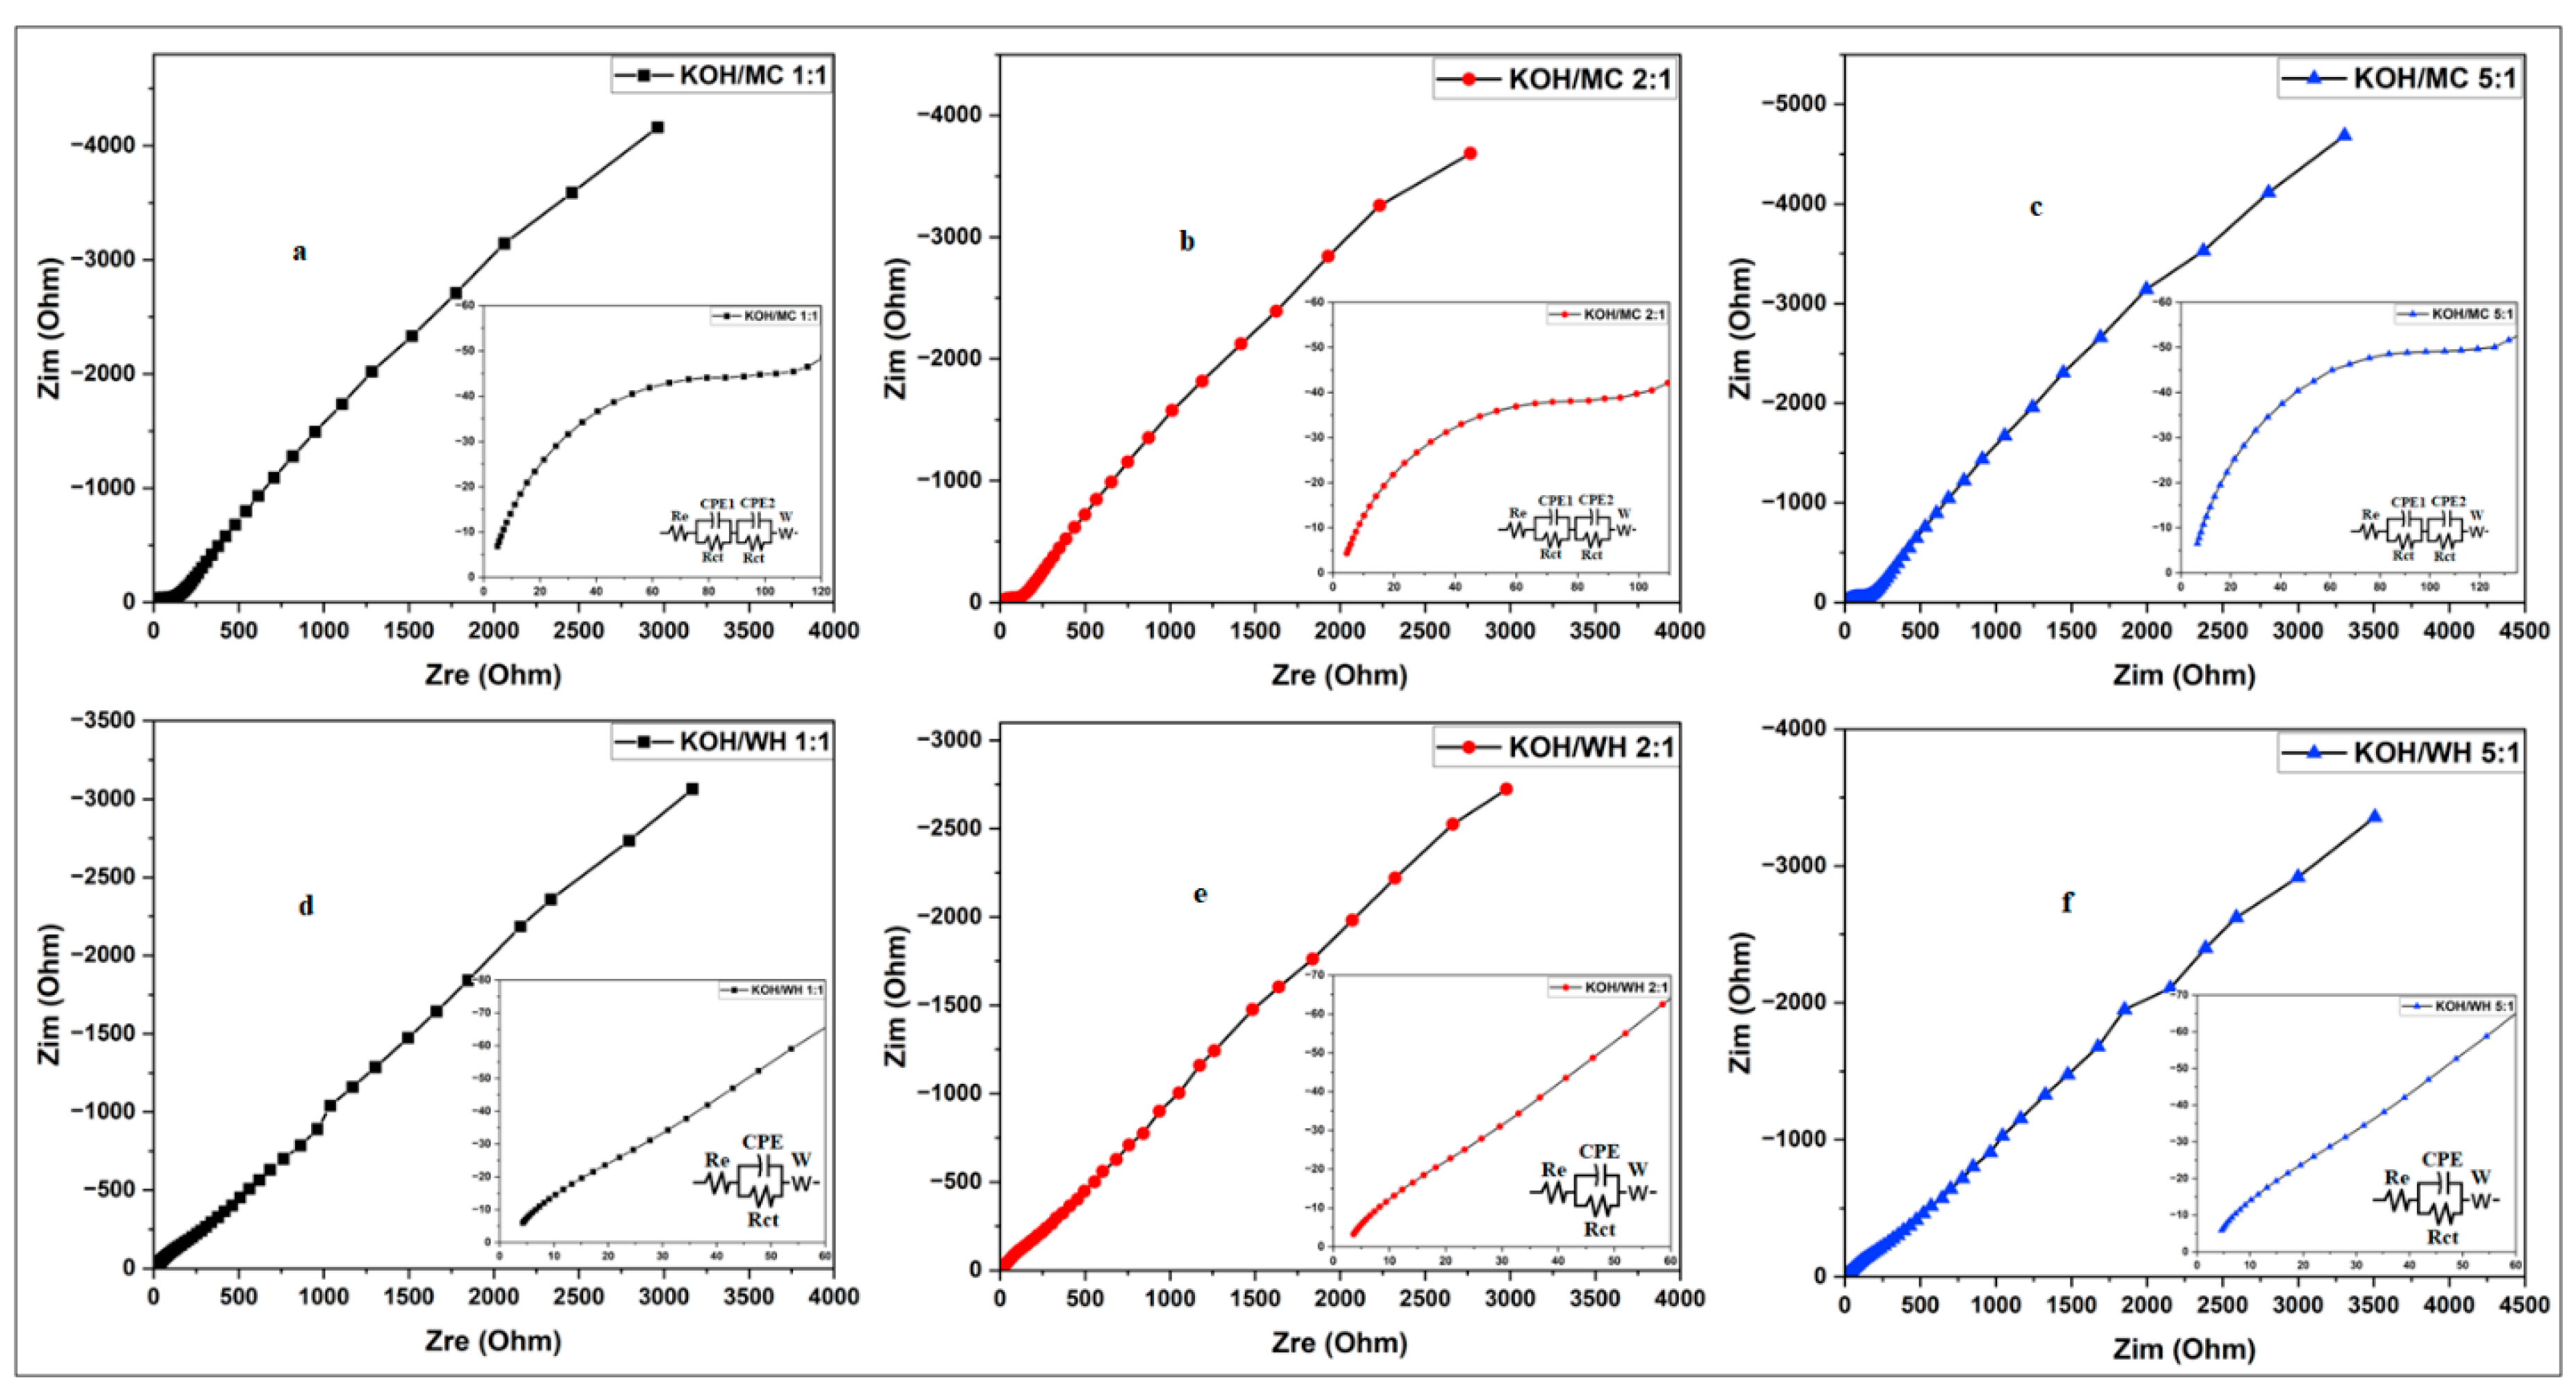
The KOH/CM 2:1 activated carbon samples (derived from millet cob and water hyacinth) exhibit the best performance, with a significantly lower charge transfer resistance (Rct) compared to other samples. The KOH/CM 1:1 sample rank next, while the KOH/CM 5:1 sample show the highest resistances, reflecting less favorable electrochemical properties.
These observations confirm previously established trends such as optimized crystalline structure, balanced micro- and mesoporosity, high electrical conductivity collectively explain the improved impedance parameters for the KOH/CM 2:1 sample.
3.3.3. Analysis of the Electrochemical Performance of the LiFePO4/C Cathode
3.3.3.1. Study of Coulombic Efficiency
Table 7 presents the Coulombic efficiency values for the first three cycles of LiFePO4/C, using activated carbon derived from millet cob (MC) and water hyacinth (WH). The results reveal a Coulombic efficiency of approximately 95% for the LFP/MC 1:1, 2:1, and 5:1 sample during the first charge cycle, with slightly better performance observed for LFP/MC 2:1. For the LFP/WH 1:1, 2:1, and 5:1 samples, the Coulombic efficiency reaches around 96%, with the LFP/WH 2:1 sample also showing slightly higher values.
The improvement of the coulombic efficient at second cycle is an indication of the formation of a SEI (Solid Electrolyte Interphase) at the electrode/electrolyte which is a thin layer which is formed on the surface of the anode during the initial charge and discharge cycles of lithium-ion batteries. It results from the reaction between lithium ions and the electrolyte [62]. During the first charge cycle, a portion of the lithium ions is consumed to form this layer, which explains why the capacity measured during the this first cycle is not representative of the capacity of the battery prior to subsequent cycles [63]. To study the formation of the SEI, which appears, mainly during the first cycle, and determine the Coulombic efficiency, the batteries were cycled at a current rate of C12 for three cycles.
Coulombic efficiency, which measures the ratio of charge recovered during discharge to the charge stored during charging, is a key indicator of battery reversibility. A high Coulombic efficiency reflects good reversibility, with minimal losses due to side reactions [64]. However, the formation of the SEI during the first cycle consumes some lithium ions, resulting in a lower initial Coulombic efficiency. Once the SEI stabilizes, subsequent cycles exhibit improved charge recovery, leading to higher efficiency and better system reversibility [63,64].
In reality, the thickness of the SEI layer increases with the long period of charge/discharge cycles. This seems to be related to the discharge of the electrolyte ions as Li ions at the carbon surface or/and the diffusion of the electrolyte at the carbon surface. Although the first cycle’s thickness of the SEI is the most important, the subsequent thickening, with time, of the layer with time enhances the consumption of the Li ions and the electrolyte components. This contributes in the decrease in cell conductivity, capacity and coulombic efficiency in a long term [65,66].
Further cycling is underway to tackle this effect of the number of cycles on the conductivity, coulombic efficiency and capacity of the cell based on these bio sources carbons based on MC and WH.
3.3.3.2. Study of the Discharge of LiFePO4/C at Different Current Rates
The charge and discharge performance of LiFePO4 cathodes supported by activated carbon derived from millet cob and water hyacinth was analyzed using coin cells, composed of LiFePO4/C cathodes and lithium metal anodes. These cells were tested at various current rates, including C12, C6, 1C, and 5C, to evaluate their electrochemical behavior under different conditions. The resulting discharge curves, presented in the corresponding figures, highlight the efficiency and reversible capacity of the cathodes as a function of cycling rate. Figure 19 presents the discharge curves of LiFePO4/C cathodes using activated carbon derived from millet cob, prepared with KOH/MC mass ratios of 1:1, 2:1, and 5:1. These curves exhibit a stable voltage plateau at approximately 3.4 V, corresponding to the redox reactions of the Fe³⁺/Fe²⁺ couple, which involve a biphasic mechanism between FePO4 and LiFePO4 [67].
Table 8 shows the variation of the specific capacity with the current rate for different activated carbon based on Millet.
The results indicate that the activated carbon derived from millet cob with a mass ratio of KOH/MC 2:1 exhibits the highest specific capacity and electrical conductivity, outperforming the KOH/MC 1:1 and KOH/MC 5:1 sample. This trend highlights the critical role of the KOH ratio during activation, directly influencing the electrochemical and conductive properties of the material.
The discharge curves in Figure 20 illustrate the electrochemical performance of LiFePO4/C cathodes utilizing activated carbon derived from water hyacinth for the KOH/WH 1:1, KOH/WH 2:1, and KOH/WH 5:1 sample. These curves display a stable voltage plateau around 3.4 V, reflecting the reversible redox mechanism of the Fe³⁺/Fe²⁺ couple between FePO4 and LiFePO4, like the behavior observed with carbon derived from millet cob.
The specific capacities of the LFP/WH 1:1, LFP/WH 2:1, and LFP/WH 5:1 sample, measured at different current rates, reveal optimal performance for the WH 2:1 sample, which exhibits the highest specific capacity. This superiority is attributed to its enhanced electrical conductivity and favorable porous structure, which facilitate lithium-ion diffusion and improve charge transfer.

Table 8.
Specific capacities (SC) of LiFePO4/C samples derived from water hyacinth.
| Current rate | SC (mAh/g) WE 1:1 | SC (mAh/g) WE 2:1 | SC (mAh/g) WE 5:1 | SC(mAh/g) |
| C12 | 158 | 163 | 153 | 167 |
| C6 | 155 | 160 | 149 | 163 |
| 1C | 151 | 157 | 145 | 161 |
| 5C | 108 | 110 | 106 | 120 |
These results confirm the preliminary electrical conductivity tests, which had already highlighted the superiority of the activated carbon with a KOH/WH ratio of 2:1. With its high conductivity and optimized porous structure, this sample demonstrates outstanding performance, particularly at high current rates where ion transport becomes more challenging. It stands out for its ability to maintain high efficiency even under fast charge and discharge conditions.
3.3.3.3. Cycling Performance of LiFePO4/C Sample
The performance of LiFePO4/C cathodes utilizing activated carbons derived from millet cob (MC) and water hyacinth (WH) was evaluated through discharge cycling tests at various current rates. The resulting curves, presented in Figure 21, provide a comparative analysis of the electrochemical behavior of both types of activated carbons.
The LiFePO4/C sample derived from millet cob (MC) and water hyacinth (WH) carbons exhibit a gradual decrease in specific capacity as the current rate increases, a typical behavior in lithium-ion batteries. For the MC samples, this capacity drop is more pronounced at higher current rates (1C and 5C), particularly for LFP/MC 1:1 and LFP/MC 5:1, due to kinetic limitations. The LFP/MC 2:1 sample stands out with superior performance across all current rates, benefiting from enhanced conductivity and efficient access to active sites. Similarly, among the WH samples, LFP/WH 2:1 delivers the best performance, achieving higher specific capacities than LFP/WH 1:1 and LFP/WH 5:1, even at elevated current rates. This enhanced performance is attributed to an optimized porous structure and superior electrical conductivity, which facilitate efficient lithium-ion and electron transport.
3.3.3.4. Electrochemical Impedance Spectroscopy (EIS) Analysis
The EIS analysis of LiFePO4 samples supported by carbon derived from millet cob (MC) and water hyacinth (WH) is illustrated through Nyquist plots, which depict the relationship between the real (Zre) and imaginary (Zim) components of impedance. These curves provide insights into charge transfer resistance (Rct) and lithium-ion diffusion properties. The three spectra of each of the LFP/MC and LFP/WH cathode samples show a similar trend with an absence of a well-defined semicircular loop, followed by an inclined straight line (Warburg), which reflects Li⁺ ion diffusion within the active material, a characteristic behavior of lithium battery electrodes [68].
Among the carbon-supported LiFePO4 samples derived from millet cob (LFP/MC), the sample prepared with a mass ratio KOH/MC 2:1 shows the smallest values of electrolyte resistance and charge transfer resistance. This suggests improved electronic conductivity, allowing more efficient transport of lithium ions. Conversely, the KOH/MC 5:1 sample exhibits the higher charge transfer resistance, while the KOH/MC 1:1 sample performs intermediately between these two extremes. Figure 22 depicts the Nyquist plot along with the equivalent circuits of the LiFePO4/C cathode (millet stem carbon), labeled as LFP/MC 1:1, LFP/MC 5:1, and LFP/MC 5:1.
Among the carbon-supported LiFePO4/C samples derived from water hyacinth (LFP/WH), electrochemical testing reveals that the sample prepared with a mass ratio of KOH/WH 2:1 displays the smallest values of resistance. This indicates too enhanced electronic conductivity and more efficient lithium-ion transport. As with the millet cob samples, the water hyacinth sample KOH/WH 5:1 exhibits increased charge transfer resistance, while the KOH/WH 1:1 sample demonstrates performance that falls between these two extremes.
Figure 23 also presents the Nyquist plot for the LFP samples using water hyacinth-derived activated carbon as a support.
The analysis of the influence of the KOH/Carbonous Materials mass ratio reveals that a ratio KOH/CM 2:1 represents the optimal compromise for electronic conductivity and lithium-ion mobility. An excess of KOH (KOH/CM 5:1 ratio) induces marked degradation of electrochemical properties, likely due to excessive structural alteration of the carbonaceous material. This morphological modification results in reduced interparticle connectivity and a significant increase in charge transfer resistance (Rct). Conversely, a ratio KOH/CM 1:1 generates pronounced microporosity, which hinders charge carrier mobility during charge-discharge cycles.
Comparative characterization of the LFP/WH and LFP/MC cathodes highlights the lower intrinsic impedance of the water hyacinth-based composite. This improvement in conductive properties over millet cob-derived carbon may arise from the distinct crystalline structure of the activated material. The carbon matrix derived from water hyacinth appears to enhance both the dispersion of LiFePO4 particles and the optimization of electron conduction pathways.
Analysis of electrochemical impedance spectroscopy (EIS) spectra via equivalent circuit modeling enables extraction of the Warburg coefficient using Equation (3) [69]. This approach clearly underscores differences in ionic diffusion kinetics between the two cathodic systems supported by millet cob and water hyacinth carbon samples. Equation (3) is given by [69]:
Zre = Re + Rct + σωω-1/2
Where: Zre is the real impedance, Re is the electrolyte resistance, Rct is the charge transfer resistance, ω is the angular frequency in the low-frequency range, and σω represents the slope of Zre curve as a function of ω-1/2.
To determine the slope of the Zre (ω-1/2) σω in Equation (1), we employed a systematic approach by plotting the linear relationship between the real impedance component (Zre) and the inverse square root of low-frequency angular frequencies (ω) for the LFP/EM and LFP/JE composites. This linear regression analysis provides a quantitative assessment of the materials’ electrochemical behavior, particularly their ionic diffusion dynamics. The resulting fitting lines, displayed in Figure 24, reveal distinct trends for each cathode system, highlighting the superior Warburg-type diffusion characteristics of the water hyacinth-derived carbon (LFP/WH) compared to the millet cob-based counterpart (LFP/MC).
Building on the linear correlations demonstrated in Figure 24, the lithium-ion diffusion coefficients (DLi) for the LFP/MC (millet cob-derived carbon) and LFP/WH (water hyacinth-derived carbon) composites were calculated using Equation (4) given by [69]:
Where: R = universal gas constant (8.314 J·mol⁻¹·K⁻¹), T = absolute temperature (298.5 K), A = electrode surface area (experimental parameter, m²), C is the molar concentration of lithium ions (mol·m⁻³), F = Faraday constant (96,500 C·mol⁻¹).
This methodology enables a rigorous evaluation of ionic mobility within the cathode materials, directly linking structural properties to electrochemical kinetic performance. The derived DLi values underscore the superior ion transport efficiency of the water hyacinth-based composite, consistent with its enhanced charge transfer dynamics observed in earlier analyses.
The key electrochemical parameters derived from electrochemical impedance spectroscopy (EIS) analysis, including ohmic resistance Re, charge transfer resistance Rct, and lithium-ion diffusion coefficient DLi, are systematically compared for the LFP/MC and LFP/WH cathodes in Table 6. This quantitative comparison provides essential insights into the interfacial kinetics and ionic transport efficiency of the two composite systems, corroborating their distinct electrochemical behaviors observed in earlier performance evaluations.
Table 9.
EIS-derived electrochemical parameters for LFP/EM and LFP/JE cathodes.
| Samples | Re (Ω) | Rct (Ω) | DLi (cm²/s) |
| LFP/MC 1:1 | 4.39 | 99.91 | 1.69x10⁻¹³ |
| LFP/ MC 2:1 | 2.74 | 95.87 | 1.84x10⁻¹³ |
| LFP/ MC 5:1 | 5.72 | 124.88 | 1.07x10⁻¹³ |
| LFP/WH 1:1 | 2.70 | 98.6 | 1.94x10⁻¹³ |
| LFP/ WH 2:1 | 2.49 | 91.12 | 2.28x10⁻¹³ |
| LFP/ WH 5:1 | 3.02 | 110.38 | 1.53x10⁻¹³ |
| LFP/graphite | 2.34 | 73.81 | 3.55x10⁻¹³ |
Comparative analysis reveals that the LFP/WH 2:1 composite exhibits the lowest ohmic resistance (Re = 2.49 Ω) and charge transfer resistance (Rct = 91.12 Ω) among all tested samples. This synergistic enhancement correlates with a superior lithium-ion diffusion coefficient (DLi = 2.28 × 10⁻¹³ cm² s⁻¹), surpassing values observed in other formulations. The marked improvement in ionic transport kinetics is attributed to the optimized carbon architecture of the LFP/WH 2:1 composite, which reduces effective ion diffusion pathways through hierarchical porosity, thereby enhancing ionic mobility. In contrast, the LFP/MC 5:1 sample (both MC- and WH-derived) display the lowest DLi values, a limitation likely arising from insufficient microporosity and the predominance of non-interconnected macropores, which impede efficient lithium-ion percolation.
The graphite used as a reference here, underwent electrochemical testing under the same conditions. The results indicate superior performance compared to the various synthesized activated carbons. However, the KOH/WH 2:1 sample exhibit performance close to that of graphite.
From the discharge curves, the LFP/Graphite cathode exhibits slightly higher specific capacities at different current rates compared to the LFP/WH 2:1 sample. The LFP/Graphite delivered capacities of 167 mAh/g at C12, 163 mAh/g at C6, 161 mAh/g at 1C, and 120 mAh/g at 5C. The electrochemical impedance spectroscopy (EIS) parameters of the LFP/Graphite cathode are recorded in the table below. The graphite exhibits lower electrolyte resistance and charge transfer resistance compared to the other synthesized activated carbons. Consequently, the LFP/Graphite cathode demonstrates a high diffusion coefficient, followed by the LFP/WH 2:1 cathode.
4. Comments on Main Results
The limited electrochemical performance of LiFePO4 cathode powder, attributed to its low electrical conductivity and restricted ionic diffusion, reduces battery efficiency. This study proposes overcoming these limitations by integrating an active carbon coating synthesized from renewable biomasses such as millet cob and water hyacinth. This strategy aims to enhance the electrical conductivity of the LiFePO4/C composite and optimize lithium-ion diffusion, thereby achieving improved electrochemical performance and enhanced energy efficiency.
Charge/discharge tests revealed that LiFePO4 cathodes supported by active carbon exhibit a specific capacity at C12 of 167 mAh/g for LFPO4/commercial graphite and #63 mAh/g for LFPO4/KOH/WH:2;1 which both are close to the theoretical capacity of LiFePO4 (170 mAh/g). The optimal performance is observed for samples activated at a KOH/carbon mass ratio of 2:1. This configuration combines suitable porosity for rapid lithium-ion diffusion and enhanced electronic conductivity due to the active carbon. The carbon derived from water hyacinth, with its crystalline structure, particularly facilitated better interconnection of conductive networks, enabling high-capacity retention even at varying current rates. Coulombic efficiency stabilized after the initial cycles, indicating the proper formation of the solid-electrolyte interphase (SEI) layer, which is essential for protecting the electrode and minimizing side reactions. The bio-based carbons used in this study, especially for the KOH/carbon 2:1 sample, show significant promise, with rapid SEI stabilization and high Coulombic efficiency from the second cycle onward, confirming their potential in LiFePO4/C systems.
The cycling performance of LiFePO4/C cathodes yielded attractive results, with specific capacity retention exceeding 96% of the initial value over multiple cycles for samples derived from millet cob and water hyacinth activated at a ratio of KOH/carbon 2:1. These results demonstrate that bio-based materials can serve as viable alternatives for lithium-ion batteries while offering economic and environmental benefits. The improved capacity retention is attributed to the active carbon, which increases the reactive surface area and optimizes electrical conductivity, thereby enhancing the cycling stability of the cathodes.
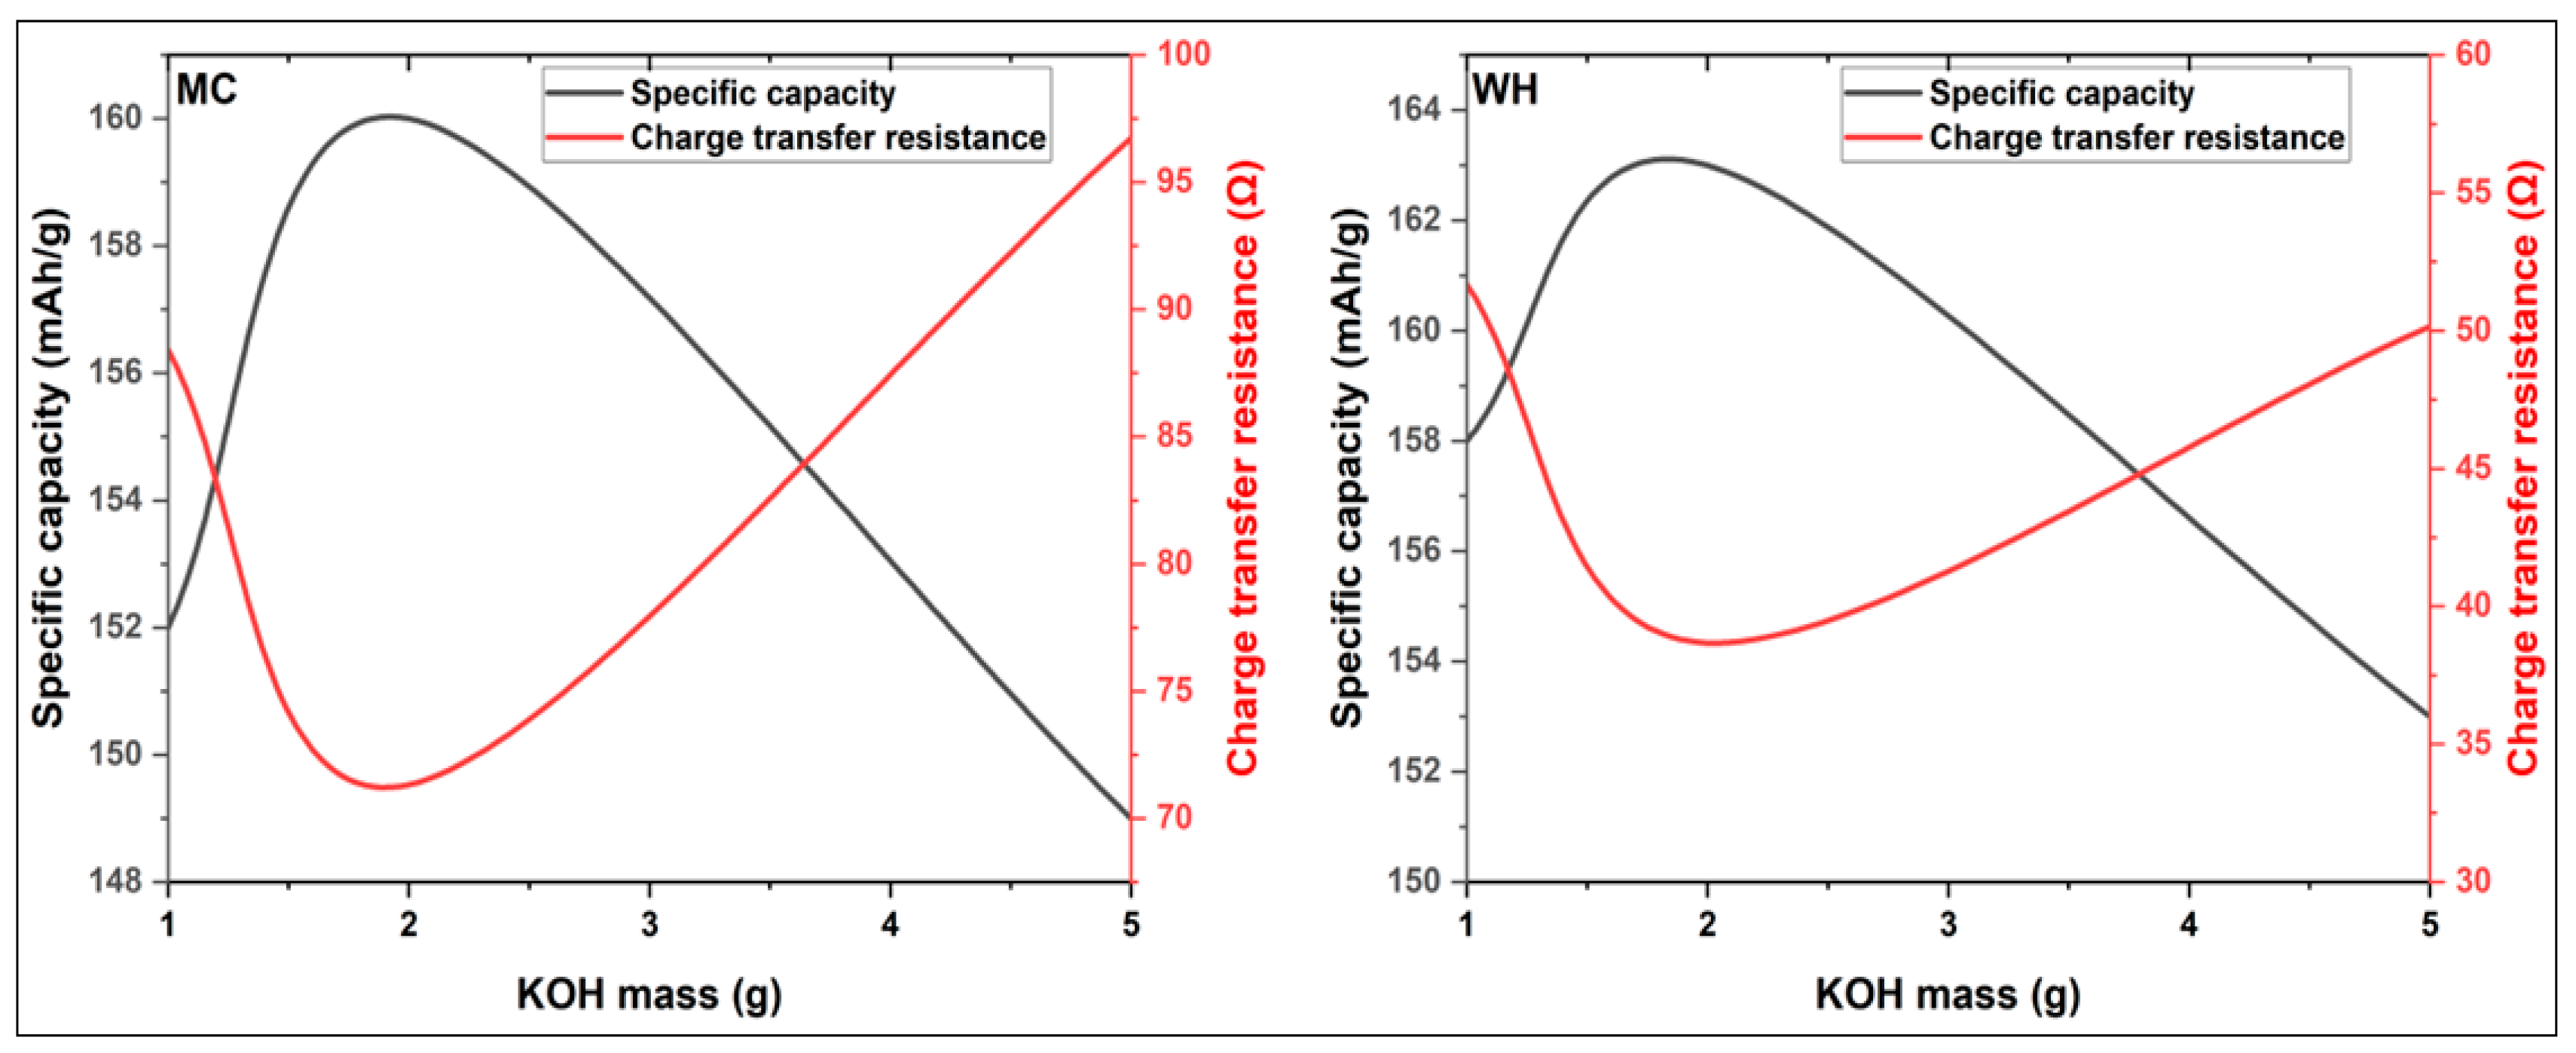
EIS analysis revealed relatively low charge transfer resistances for LiFePO4/C cathodes using activated carbon from millet cob and water hyacinth, with optimal performance observed for the KOH/MC 2:1 and KOH/WH 2:1 sample. Figure 10 below illustrates the evolution of specific capacity and charge transfer resistance as a function of the KOH mass used in the activation of the active carbon.
The KOH/WH 2:1 sample, characterized by the lowest resistance, stands out due to its well-ordered crystalline structure, which promotes excellent conductivity. Unlike a high specific surface area dominated by micropores, which limits lithium-ion accessibility, the presence of mesopores has proven essential for efficient ion transport. For instance, the KOH/MC 1:1 and KOH/WH 1:1 sample, despite their high specific surface areas, exhibit higher resistance compared to the KOH/MC 2:1 and KOH/WH 2:1 sample. This demonstrates that optimizing the pore structure is critical for performance. Both specific capacity and charge transfer resistance reach their peak performance at a KOH/carbon mass ratio of 2:1, owing to well-tailored porous structures. However, beyond this ratio, excessive pore widening leads to reduced specific capacities and increased resistances, compromising the electrochemical performance of the LiFePO4/C cathodes.
Figure 26.
Variation of the specific capacity and the charge transfer resistance as a function of KOH Mass.
Figure 26.
Variation of the specific capacity and the charge transfer resistance as a function of KOH Mass.
Electrochemical impedance spectroscopy analysis enabled precise determination of lithium-ion diffusion coefficients DLi for LFP/MC and LFP/WH cathodes. Notably, the LFP/WH 2:1 composite exhibited superior diffusion kinetics DLi ≈ 2.28 × 10⁻¹³ cm²/s, outperforming other formulations. Counterintuitively, the KOH/WH 2:1 activated carbon, despite its lower specific surface area compared to KOH/WH 1:1, demonstrated enhanced ionic mobility. This highlights that high DLi values are not exclusively governed by surface area but depend significantly on synergistic factors such as electrical conductivity of the carbon matrix, elemental composition influencing charge transfer pathways, and micro-/mesopore volume balance optimizing ion transport. Excessive micropore dominance (>80% pore volume) creates restricted diffusion pathways, significantly impeding charge carrier mobility and reducing DLi. In contrast, a hierarchical pore architecture (micro/mesopore ratio ≈ 1:1) facilitates rapid ion percolation through interconnected channels, as observed in the LFP/WH 2:1 cathode. This structural optimization enhances lithium-ion flux within the LiFePO4/C composite, confirming that balanced porosity—rather than maximal surface area—is pivotal for high-performance lithium-ion battery cathodes.
5. Conclusions
This study provided an in-depth evaluation of the performance of LiFePO4 cathodes supported by different activated carbons derived from millet cob.
and water hyacinth. Various analyses, including charge/discharge tests, cycling stability, and electrochemical impedance spectroscopy, revealed outstanding performance, particularly for samples activated with a mass ratio KOH/Carbon 2:1. The LFP/WH 2:1 sample achieved a specific capacity of 163 mAh/g at a C/12 current rate and retained 110 mAh/g at 5C, while the LFP/MC 2:1 sample exhibited comparable performance with 160 mAh/g at C/12 and 106 mAh/g at 5C. In terms of cycling stability, the LiFePO4/C cathodes demonstrated excellent capacity retention, even at high current rates (1C and 5C), with particularly strong performance for the LFP/MC 2:1 and LFP/WH 2:1 sample. EIS analysis revealed that LFP/WH samples exhibited lower charge transfer resistance and series resistance compared to LFP/MC samples, confirming the superior electrical conductivity of crystalline carbon from water hyacinth compared to the amorphous carbon from millet cob. This enhanced conductivity, combined with an optimized porous structure, explains the superior performance of cathodes utilizing water hyacinth-derived carbon.
Additionally, activated carbons with a moderate specific surface area, predominantly composed of mesopores with minimal micropores, demonstrated the best performance as cathode supports. This structure promotes efficient lithium-ion diffusion and reduces charge transfer resistance, ultimately optimizing overall electrochemical performance. These findings highlight the potential of bio-sourced carbons as viable alternatives to conventional materials, offering a balance between performance, sustainability, and cost-effectiveness, paving the way for more durable and economically viable Li-ion batteries.
Author Contributions
Zemane Anthelme: Data curation, all experimental data collections, Writing – original draft. Oumarou Savadogo: Conceptualization, Formal analysis, Supervision, Validation,Writing – review & editing.
Data Availability Statement
Data sets generated during the current study are available from the corresponding author on reasonable request.
Acknowledgments
We thank the National Science and Engineering Research Council of Canada (NSERC) (RGP20002705) for the financial
Conflicts of Interest
☒ The authors declare that they have no known competing financial interests or personal relationships that could have appeared to influence the work reported in this paper. ☒ The authors declare the following financial interests/personal relationships which may be considered as potential competing interests: Oumarou Savadogo reports administrative support was provided by Polytechnique Montreal. Oumarou Savadogo reports a relationship with Polytechnique Montreal that includes: employment. If there are other authors, they declare that they have no known competing financial interests or personal relationships that could have appeared to influence the work reported in this paper.
Abbreviations
| BET | Brunauer, Emmett, and Teller |
| BJH | Barrett, Joyner, and Halenda |
| C | Carbon, Current Rate |
| SC | Specific Capacitances |
| D | Diameter |
| DMAC | Dimethylacetamide |
| XRD | X-ray Diffraction |
| EIS | Electrochemical Impedance Spectroscopy |
| MC | Millet Cob |
| EDS | Energy Dispersive Spectroscopy |
| HCl | Hydrogen Chloride |
| HK | Horváth-Kawazoe |
| H₃PO4 | Phosphoric Acid |
| WH | Water Hyacinth |
| KOH | Potassium Hydroxide |
| LiFePO4 or LFP | Lithium Iron Phosphate |
| Li+ | Lithium Ion |
| LiPF6 | Lithium Hexafluorophosphate |
| CM | Carbonaceous Materials |
| SEM | Scanning Electron Microscopy |
| N2 | Nitrogen |
| NLDFT | Non-Local Density Functional Theory |
| PVDF | Polyvinylidene Fluoride |
| Rct | Charge Transfer Resistance |
| Re | Electrolyte Resistance |
References
- K. Padhi, K. S. Nanjundaswamy, and J. B. Goodenough, “Phospho-olivines as positive-electrode materials for rechargeable lithium batteries,” Journal of the electrochemical society, vol. 144, no. 4, p. 1188, 1997.
- S. Lee, I. Jang, H. a. Lim, V. Aravindan, H. Kim, and Y. Lee, “Preparation and electrochemical characterization of LiFePO4 nanoparticles with high rate capability by a sol–gel method,” Journal of Alloys and Compounds, vol. 491, no. 1-2, pp. 668-672, 2010. [CrossRef]
- Z. Li, D. Zhang, and F. Yang, “Developments of lithium-ion batteries and challenges of LiFePO4 as one promising cathode material,” Journal of materials science, vol. 44, no. 10, pp. 2435-2443, 2009. [CrossRef]
- D.-H. Kim and J. Kim, “Synthesis of LiFePO4 nanoparticles in polyol medium and their electrochemical properties,” Electrochemical and Solid-State Letters, vol. 9, no. 9, p. A439, 2006. [CrossRef]
- N. J. Yun, H.-W. Ha, K. H. Jeong, H.-Y. Park, and K. Kim, “Synthesis and electrochemical properties of olivine-type LiFePO4/C composite cathode material prepared from a poly (vinyl alcohol)-containing precursor,” Journal of Power Sources, vol. 160, no. 2, pp. 1361-1368, 2006.
- A. Ritchie and W. Howard, “Recent developments and likely advances in lithium-ion batteries,” Journal of Power Sources, vol. 162, no. 2, pp. 809-812, 2006. [CrossRef]
- T. Nakamura, Y. Miwa, M. Tabuchi, and Y. Yamada, “Structural and surface modifications of LiFePO4 olivine particles and their electrochemical properties,” Journal of the Electrochemical Society, vol. 153, no. 6, p. A1108, 2006. [CrossRef]
- Y. Guan et al., “LiFePO4/activated carbon/graphene composite with capacitive-battery characteristics for superior high-rate lithium-ion storage,” Electrochimica Acta, vol. 294, pp. 148-155, 2019. [CrossRef]
- H. Zhang, D. Liu, X. Qian, C. Zhao, and Y. Xu, “A novel nano structured LiFePO4/C composite as cathode for Li-ion batteries,” Journal of Power Sources, vol. 249, pp. 431-434, 2014. [CrossRef]
- H. Wang et al., “In-situ self-polymerization restriction to form core-shell LiFePO4/C nanocomposite with ultrafast rate capability for high-power Li-ion batteries,” Nano Energy, vol. 39, pp. 346-354, 2017. [CrossRef]
- J. Tu, K. Wu, H. Tang, H. Zhou, and S. Jiao, “Mg–Ti co-doping behavior of porous LiFePO 4 microspheres for high-rate lithium-ion batteries,” Journal of Materials Chemistry A, vol. 5, no. 32, pp. 17021-17028, 2017.
- M. Talebi-Esfandarani, “Synthesis, Characterization and Modification of LifeP04 by Doping with Platinum and Palladium for Lithium-Ion Batteries,” École Polytechnique de Montréal, 2013.
- Wang, W. Al Abdulla, D. Wang, and X. Zhao, “A three-dimensional porous LiFePO 4 cathode material modified with a nitrogen-doped graphene aerogel for high-power lithium ion batteries,” Energy & Environmental Science, vol. 8, no. 3, pp. 869-875, 2015. [CrossRef]
- Z. Jinli et al., “High-performance lithium iron phosphate with phosphorus-doped carbon layers for lithium ion batteries,” Journal of Materials Chemistry A, vol. 3, no. 5, pp. 2043-2049, 2015. [CrossRef]
- Y. Zhou et al., “Nitrogen-doped graphene guided formation of monodisperse microspheres of LiFePO 4 nanoplates as the positive electrode material of lithium-ion batteries,” Journal of Materials Chemistry A, vol. 4, no. 31, pp. 12065-12072, 2016. [CrossRef]
- Y. Wang, Y. Wang, E. Hosono, K. Wang, and H. Zhou, “The design of a LiFePO4/carbon nanocomposite with a core–shell structure and its synthesis by an in situ polymerization restriction method,” Angewandte Chemie International Edition, vol. 47, no. 39, pp. 7461-7465, 2008.
- H. Huang, S.-C. Yin, and L. s. Nazar, “Approaching theoretical capacity of LiFePO4 at room temperature at high rates,” Electrochemical and solid-state letters, vol. 4, no. 10, p. A170, 2001. [CrossRef]
- R. Shahid and S. Murugavel, “Synthesis and characterization of olivine phosphate cathode material with different particle sizes for rechargeable lithium-ion batteries,” Materials Chemistry and Physics, vol. 140, no. 2-3, pp. 659-664, 2013. [CrossRef]
- S.-Y. Chung, J. T. Bloking, and Y.-M. Chiang, “Electronically conductive phospho-olivines as lithium storage electrodes,” Nature materials, vol. 1, no. 2, pp. 123-128, 2002.
- M. Talebi-Esfandarani and O. Savadogo, “Effects of palladium doping on the structure and electrochemical properties of LiFePO4/C prepared using the sol-gel method,” J New Mater Electrochem Syst, vol. 17, no. 2, pp. 91-97, 2014.
- M. Talebi-Esfandarani and O. Savadogo, “Enhancement of electrochemical properties of platinum doped LiFePO4/C cathode material synthesized using hydrothermal method,” Solid State Ionics, vol. 261, pp. 81-86, 2014. [CrossRef]
- M. Talebi-Esfandarani and O. Savadogo, “Synthesis and characterization of Pt-doped LiFePO 4/C composites using the sol–gel method as the cathode material in lithium-ion batteries,” Journal of Applied Electrochemistry, vol. 44, pp. 555-562, 2014.
- N. Ravet, A. Abouimrane, and M. Armand, “On the electronic conductivity of phospho-olivines as lithium storage electrodes,” Nature Materials, vol. 2, no. 11, pp. 702-702, 2003. [CrossRef]
- M. Shi, R. Li, and Y. Liu, “In situ preparation of LiFePO4/C with unique copolymer carbon resource for superior performance lithium-ion batteries,” Journal of Alloys and Compounds, vol. 854, p. 157162, 2021.
- N. Ravet, S. Besner, M. Simoneau, A. Vallée, M. Armand, and J.-F. Magnan, “Electrode materials with high surface conductivity,” ed: Google Patents, 2005.
- Z. Chen and J. Dahn, “Reducing carbon in LiFePO4/C composite electrodes to maximize specific energy, volumetric energy, and tap density,” Journal of the Electrochemical Society, vol. 149, no. 9, p. A1184, 2002.
- R. Dominko et al., “Impact of the carbon coating thickness on the electrochemical performance of LiFePO4/C composites,” Journal of the Electrochemical Society, vol. 152, no. 3, p. A607, 2005.
- M. M. Doeff, J. D. Wilcox, R. Kostecki, and G. Lau, “Optimization of carbon coatings on LiFePO4,” Journal of power sources, vol. 163, no. 1, pp. 180-184, 2006. [CrossRef]
- M. M. Doeff, J. D. Wilcox, R. Yu, A. Aumentado, M. Marcinek, and R. Kostecki, “Impact of carbon structure and morphology on the electrochemical performance of LiFePO 4/C composites,” Journal of Solid State Electrochemistry, vol. 12, no. 7, pp. 995-1001, 2008.
- M. Talebi-Esfandarani and O. Savadogo, “Improvement of electrochemical and electrical properties of LiFePO 4 coated with citric acid,” Rare Metals, vol. 35, no. 4, pp. 303-308, 2016. [CrossRef]
- X. Zhi, G. Liang, L. Wang, X. Ou, L. Gao, and X. Jie, “Optimization of carbon coatings on LiFePO4: Carbonization temperature and carbon content,” Journal of Alloys and Compounds, vol. 503, no. 2, pp. 370-374, 2010. [CrossRef]
- E. Sohouli, K. Adib, B. Maddah, and M. Najafi, “Manganese dioxide/cobalt tungstate/ nitrogen-doped carbon nano-onions nanocomposite as new supercapacitor electrode,” Ceramics International, vol. 48, no. 1, pp. 295-303, 2022/01/01/ 2022. [CrossRef]
- E. Sohouli, K. Adib, B. Maddah, and M. Najafi, “Preparation of a supercapacitor electrode based on carbon nano-onions/manganese dioxide/iron oxide nanocomposite,” Journal of Energy Storage, vol. 52, p. 104987, 2022/08/25/ 2022. [CrossRef]
- M. A. Albo Hay Allah and H. A. Alshamsi, “Green synthesis of ZnO NPs using Pontederia crassipes leaf extract: characterization, their adsorption behavior and anti-cancer property,” Biomass Conversion and Biorefinery, vol. 14, no. 9, pp. 10487-10500, 2024/05/01 2024. [CrossRef]
- G. Wilson, S. Zilinskaite, S. Unka, R. Boston, and N. Reeves-McLaren, “Establishing operando diffraction capability through the study of Li-ion (de) intercalation in LiFePO4,” Energy Reports, vol. 6, pp. 174-179, 2020.
- J. Rouquerol, F. Rouquerol, P. Llewellyn, G. Maurin, and K. Sing, Adsorption by powders and porous solids: principles, methodology and applications. Academic press, 2013.
- E. P. Barrett, L. G. Joyner, and P. P. Halenda, “The determination of pore volume and area distributions in porous substances. I. Computations from nitrogen isotherms,” Journal of the American Chemical society, vol. 73, no. 1, pp. 373-380, 1951.
- G. Horváth and K. Kawazoe, “Method for the calculation of effective pore size distribution in molecular sieve carbon,” Journal of Chemical Engineering of Japan, vol. 16, no. 6, pp. 470-475, 1983. [CrossRef]
- K. S. Sing, “Reporting physisorption data for gas/solid systems with special reference to the determination of surface area and porosity (Recommendations 1984),” Pure and applied chemistry, vol. 57, no. 4, pp. 603-619, 1985.
- S. Yu, J. Bo, L. Fengli, and L. Jiegang, “Structure and fractal characteristic of micro-and meso-pores in low, middle-rank tectonic deformed coals by CO2 and N2 adsorption,” Microporous and Mesoporous Materials, vol. 253, pp. 191-202, 2017.
- W. Han et al., “Experimental analysis of the pore structure and fractal characteristics of different metamorphic coal based on mercury intrusion-nitrogen adsorption porosimetry,” Powder Technology, vol. 362, pp. 386-398, 2020. [CrossRef]
- J. Tang, L. Feng, Y. Li, J. Liu, and X. Liu, “Fractal and pore structure analysis of Shengli lignite during drying process,” Powder Technology, vol. 303, pp. 251-259, 2016. [CrossRef]
- A. Saito and H. Foley, “Curvature and parametric sensitivity in models for adsorption in micropores,” AIChE journal, vol. 37, no. 3, pp. 429-436, 1991. [CrossRef]
- P. I. Ravikovitch, G. L. Haller, and A. V. Neimark, “Density functional theory model for calculating pore size distributions: pore structure of nanoporous catalysts,” Advances in colloid and interface science, vol. 76, pp. 203-226, 1998. [CrossRef]
- R. S. Mikhail, S. Brunauer, and E. Bodor, “Investigations of a complete pore structure analysis: I. Analysis of micropores,” Journal of Colloid and Interface Science, vol. 26, no. 1, pp. 45-53, 1968.
- F. Rouquerol, J. Rouquerol, and K. Sing, “Assessment of mesoporosity,” Adsorption by powders and porous solids, pp. 191-217, 1999.
- N. A. Rahma, A. Kurniasari, Y. D. S. Pambudi, H. M. Bintang, A. Zulfia, and C. Hudaya, “Characteristics of Corncob-Originated Activated Carbon Using Two Different Chemical Agent,” in IOP Conference Series: Materials Science and Engineering, 2019, vol. 622, no. 1: IOP Publishing, p. 012030.
- S. Wang and G. Lu*, “A comprehensive study on carbon dioxide reforming of methane over Ni/γ-Al2O3 catalysts,” Industrial & engineering chemistry research, vol. 38, no. 7, pp. 2615-2625, 1999.
- S. R. Kamath and A. Proctor, “Silica gel from rice hull ash: preparation and characterization,” Cereal Chemistry, vol. 75, no. 4, pp. 484-487, 1998. [CrossRef]
- A. Omri and M. Benzina, “Characterization of activated carbon prepared from a new raw lignocellulosic material: Ziziphus spina-christi seeds,” Journal de la Société Chimique de Tunisie, vol. 14, pp. 175-183, 2012.
- S. Ahmed, M. Parvaz, R. Johari, and M. Rafat, “Studies on activated carbon derived from neem (azadirachta indica) bio-waste, and its application as supercapacitor electrode,” Materials Research Express, vol. 5, no. 4, p. 045601, 2018.
- Y. Chen et al., “Application studies of activated carbon derived from rice husks produced by chemical-thermal process—A review,” Advances in colloid and interface science, vol. 163, no. 1, pp. 39-52, 2011. [CrossRef]
- De and N. Karak, “A green and facile approach for the synthesis of water soluble fluorescent carbon dots from banana juice,” Rsc Advances, vol. 3, no. 22, pp. 8286-8290, 2013. [CrossRef]
- T. Qiu, J.-G. Yang, X.-J. Bai, and Y.-L. Wang, “The preparation of synthetic graphite materials with hierarchical pores from lignite by one-step impregnation and their characterization as dye absorbents,” RSC advances, vol. 9, no. 22, pp. 12737-12746, 2019. [CrossRef]
- A. Barroso-Bogeat, M. Alexandre-Franco, C. Fernández-González, J. Sánchez-González, and V. Gómez-Serrano, “Electrical conductivity of metal (hydr) oxide–activated carbon composites under compression. A comparison study,” Materials Chemistry and Physics, vol. 152, pp. 113-122, 2015.
- Celzard, J. Marêché, F. Payot, and G. Furdin, “Electrical conductivity of carbonaceous powders,” Carbon, vol. 40, no. 15, pp. 2801-2815, 2002. [CrossRef]
- T. Adinaveen, J. J. Vijaya, and L. J. Kennedy, “Comparative study of electrical conductivity on activated carbons prepared from various cellulose materials,” Arabian Journal for Science and Engineering, vol. 41, pp. 55-65, 2016. [CrossRef]
- S. Ryu, S. Kim, N. Gallego, and D. Edie, “Physical properties of silver-containing pitch-based activated carbon fibers,” Carbon, vol. 37, no. 10, pp. 1619-1625, 1999. [CrossRef]
- Z. Hashisho, M. J. Rood, S. Barot, and J. Bernhard, “Role of functional groups on the microwave attenuation and electric resistivity of activated carbon fiber cloth,” Carbon, vol. 47, no. 7, pp. 1814-1823, 2009. [CrossRef]
- Y. Huang, “Electrical and thermal properties of activated carbon fibers,” in Activated carbon fiber and textiles: Elsevier, 2017, pp. 181-192.
- J. R. Dahn, T. Zheng, Y. Liu, and J. Xue, “Mechanisms for lithium insertion in carbonaceous materials,” Science, vol. 270, no. 5236, pp. 590-593, 1995. [CrossRef]
- K. Ciosek Högström et al., “The influence of PMS-additive on the electrode/electrolyte interfaces in LiFePO4/graphite Li-ion batteries,” The Journal of Physical Chemistry C, vol. 117, no. 45, pp. 23476-23486, 2013.
- H. Ekström and G. Lindbergh, “A model for predicting capacity fade due to SEI formation in a commercial graphite/LiFePO4 cell,” Journal of The Electrochemical Society, vol. 162, no. 6, p. A1003, 2015. [CrossRef]
- F. Yang, X. Song, G. Dong, and K.-L. Tsui, “A coulombic efficiency-based model for prognostics and health estimation of lithium-ion batteries,” Energy, vol. 171, pp. 1173-1182, 2019. [CrossRef]
- J. B. Goodenough and K.-S. Park, “The Li-ion rechargeable battery: a perspective,” Journal of the American Chemical Society, vol. 135, no. 4, pp. 1167-1176, 2013. [CrossRef]
- J. B. Goodenough and Y. Kim, “Challenges for rechargeable Li batteries,” Chemistry of materials, vol. 22, no. 3, pp. 587-603, 2010.
- S. S. Prabaharan and M. S. Michael, Nanotechnology in Advanced Electrochemical Power Sources. CRC Press, 2014.
- L. Deleebeeck and S. Veltzé, “Electrochemical impedance spectroscopy study of commercial Li-ion phosphate batteries: a metrology perspective,” International Journal of Energy Research, vol. 44, no. 9, pp. 7158-7182, 2020. [CrossRef]
- Y. Cui, X. Zhao, and R. Guo, “Improved electrochemical performance of La0. 7Sr0. 3MnO3 and carbon co-coated LiFePO4 synthesized by freeze-drying process,” Electrochimica Acta, vol. 55, no. 3, pp. 922-926, 2010. [CrossRef]
Figure 2.
X-ray Diffractogram of present LiFePO4 (a) and the standard LFPO4 (b) [35].
Figure 2.
X-ray Diffractogram of present LiFePO4 (a) and the standard LFPO4 (b) [35].
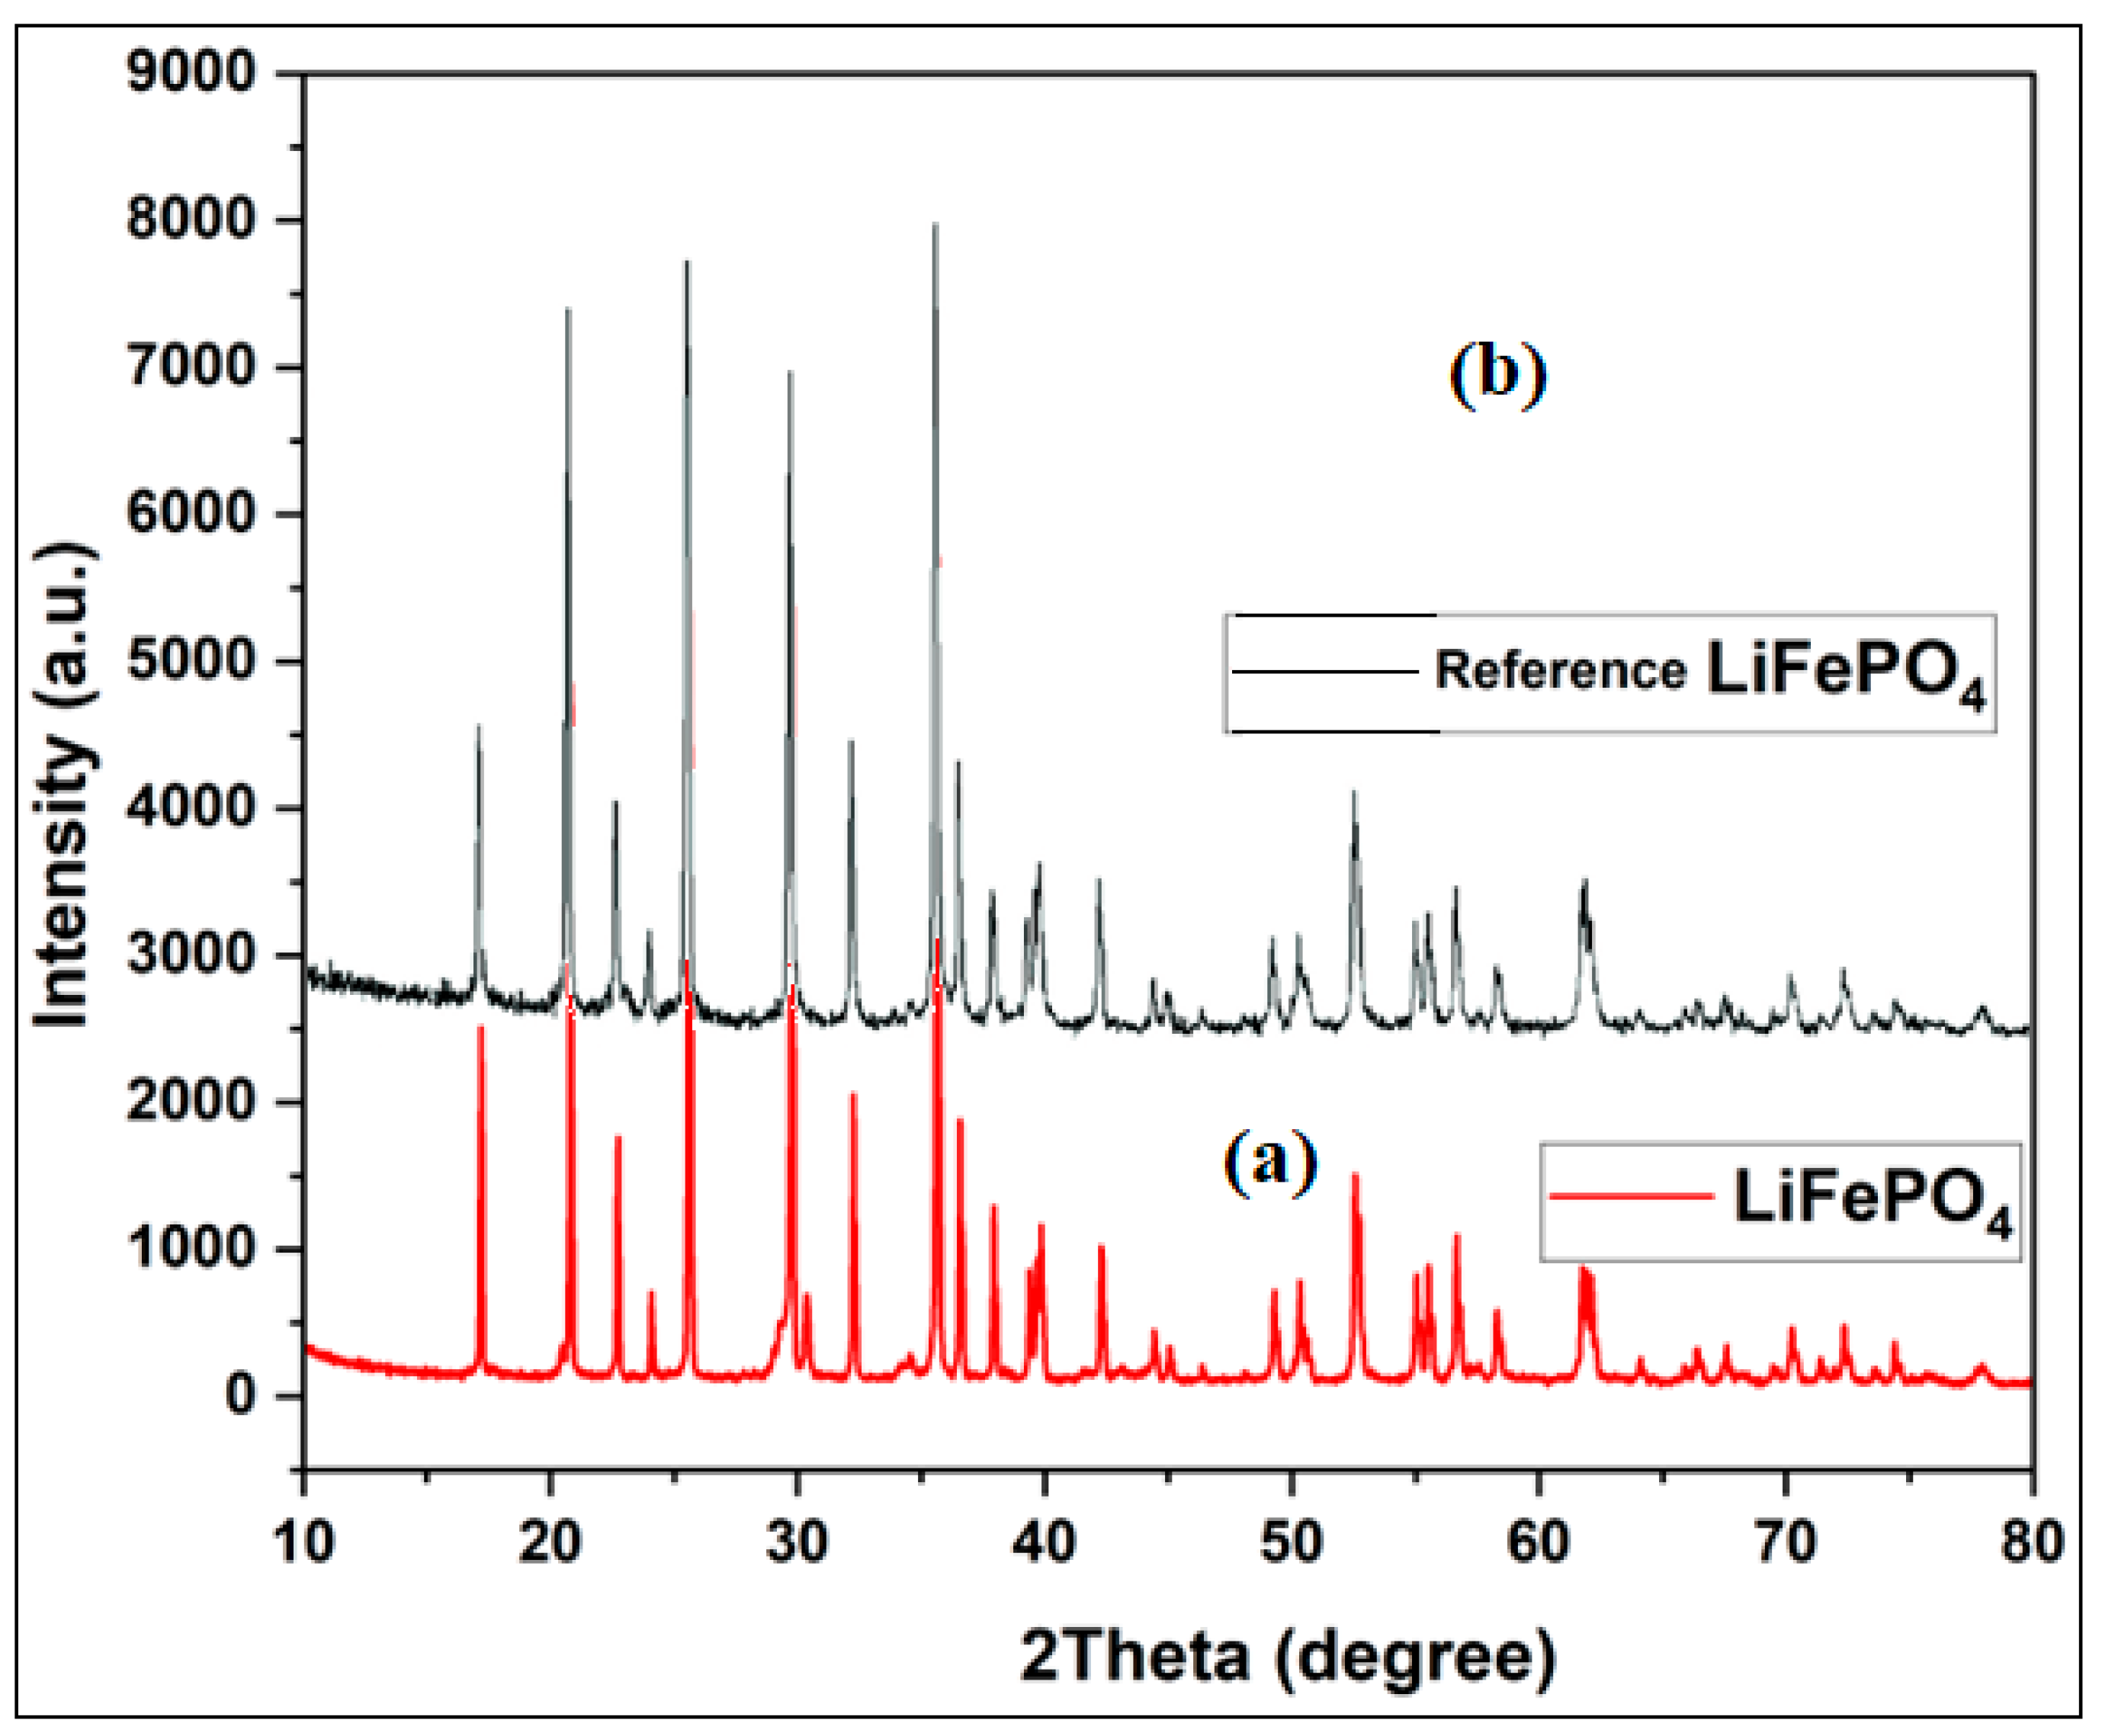
Figure 3.
SEM Image of the present LiFePO4 Powder: x5000.
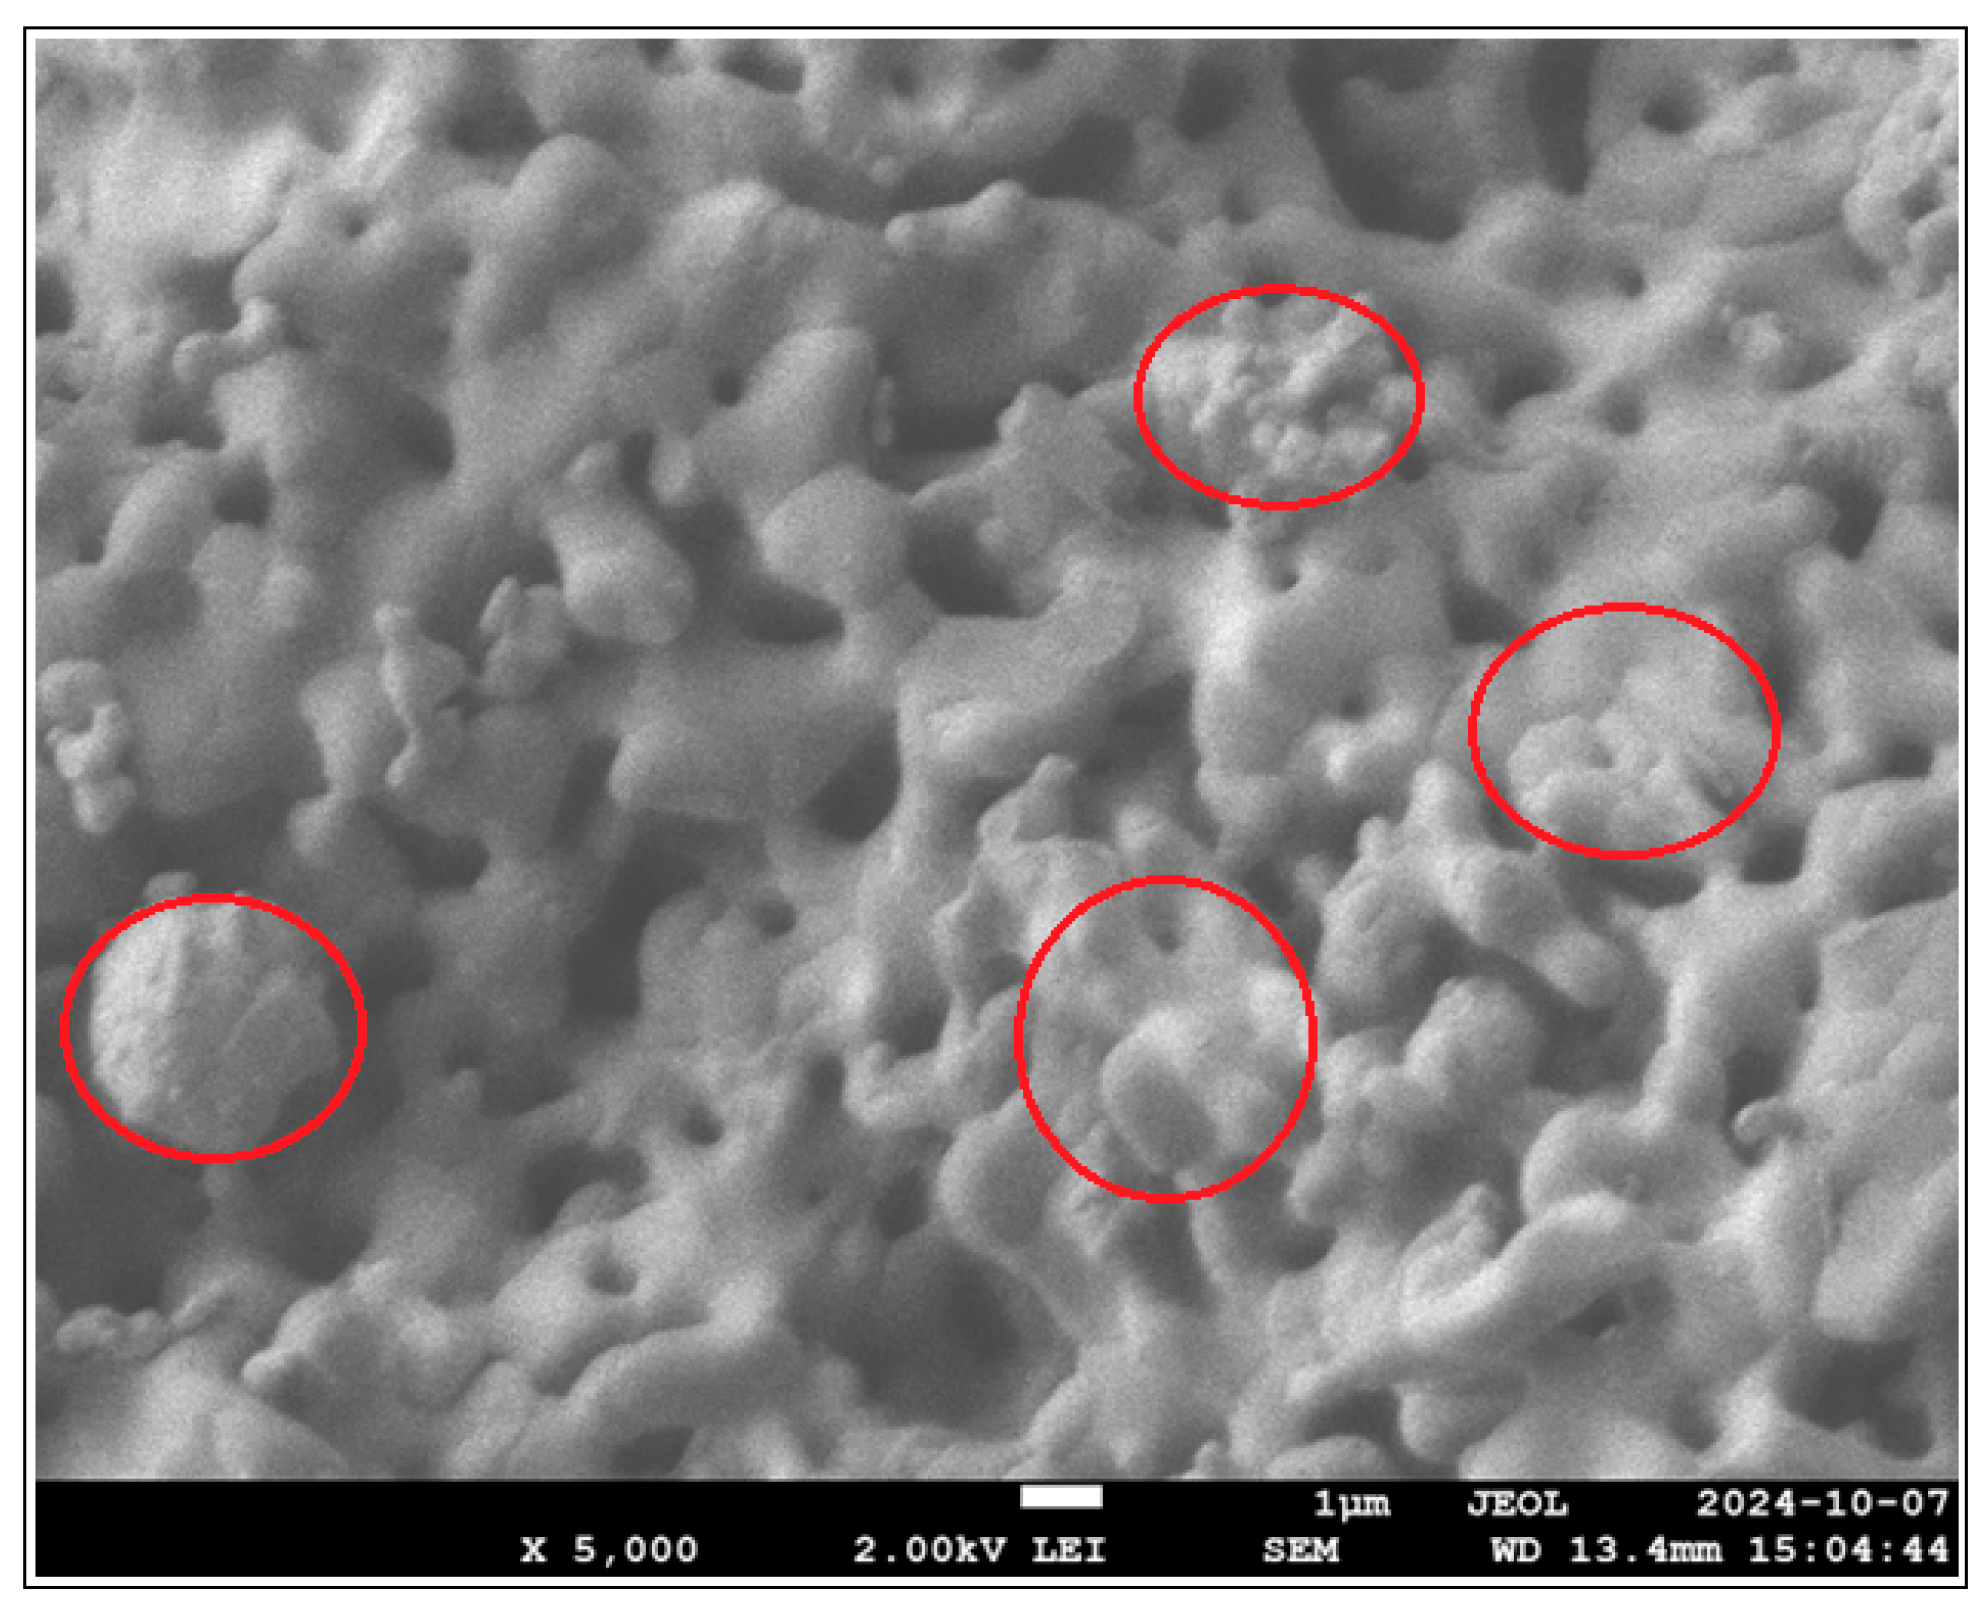
Figure 4.
Variation of the adsorbed quantity (cm3/g) vs relative pressure P/Po of nitrogen adsorption and desorption isotherms of LiFePO4.
Figure 4.
Variation of the adsorbed quantity (cm3/g) vs relative pressure P/Po of nitrogen adsorption and desorption isotherms of LiFePO4.
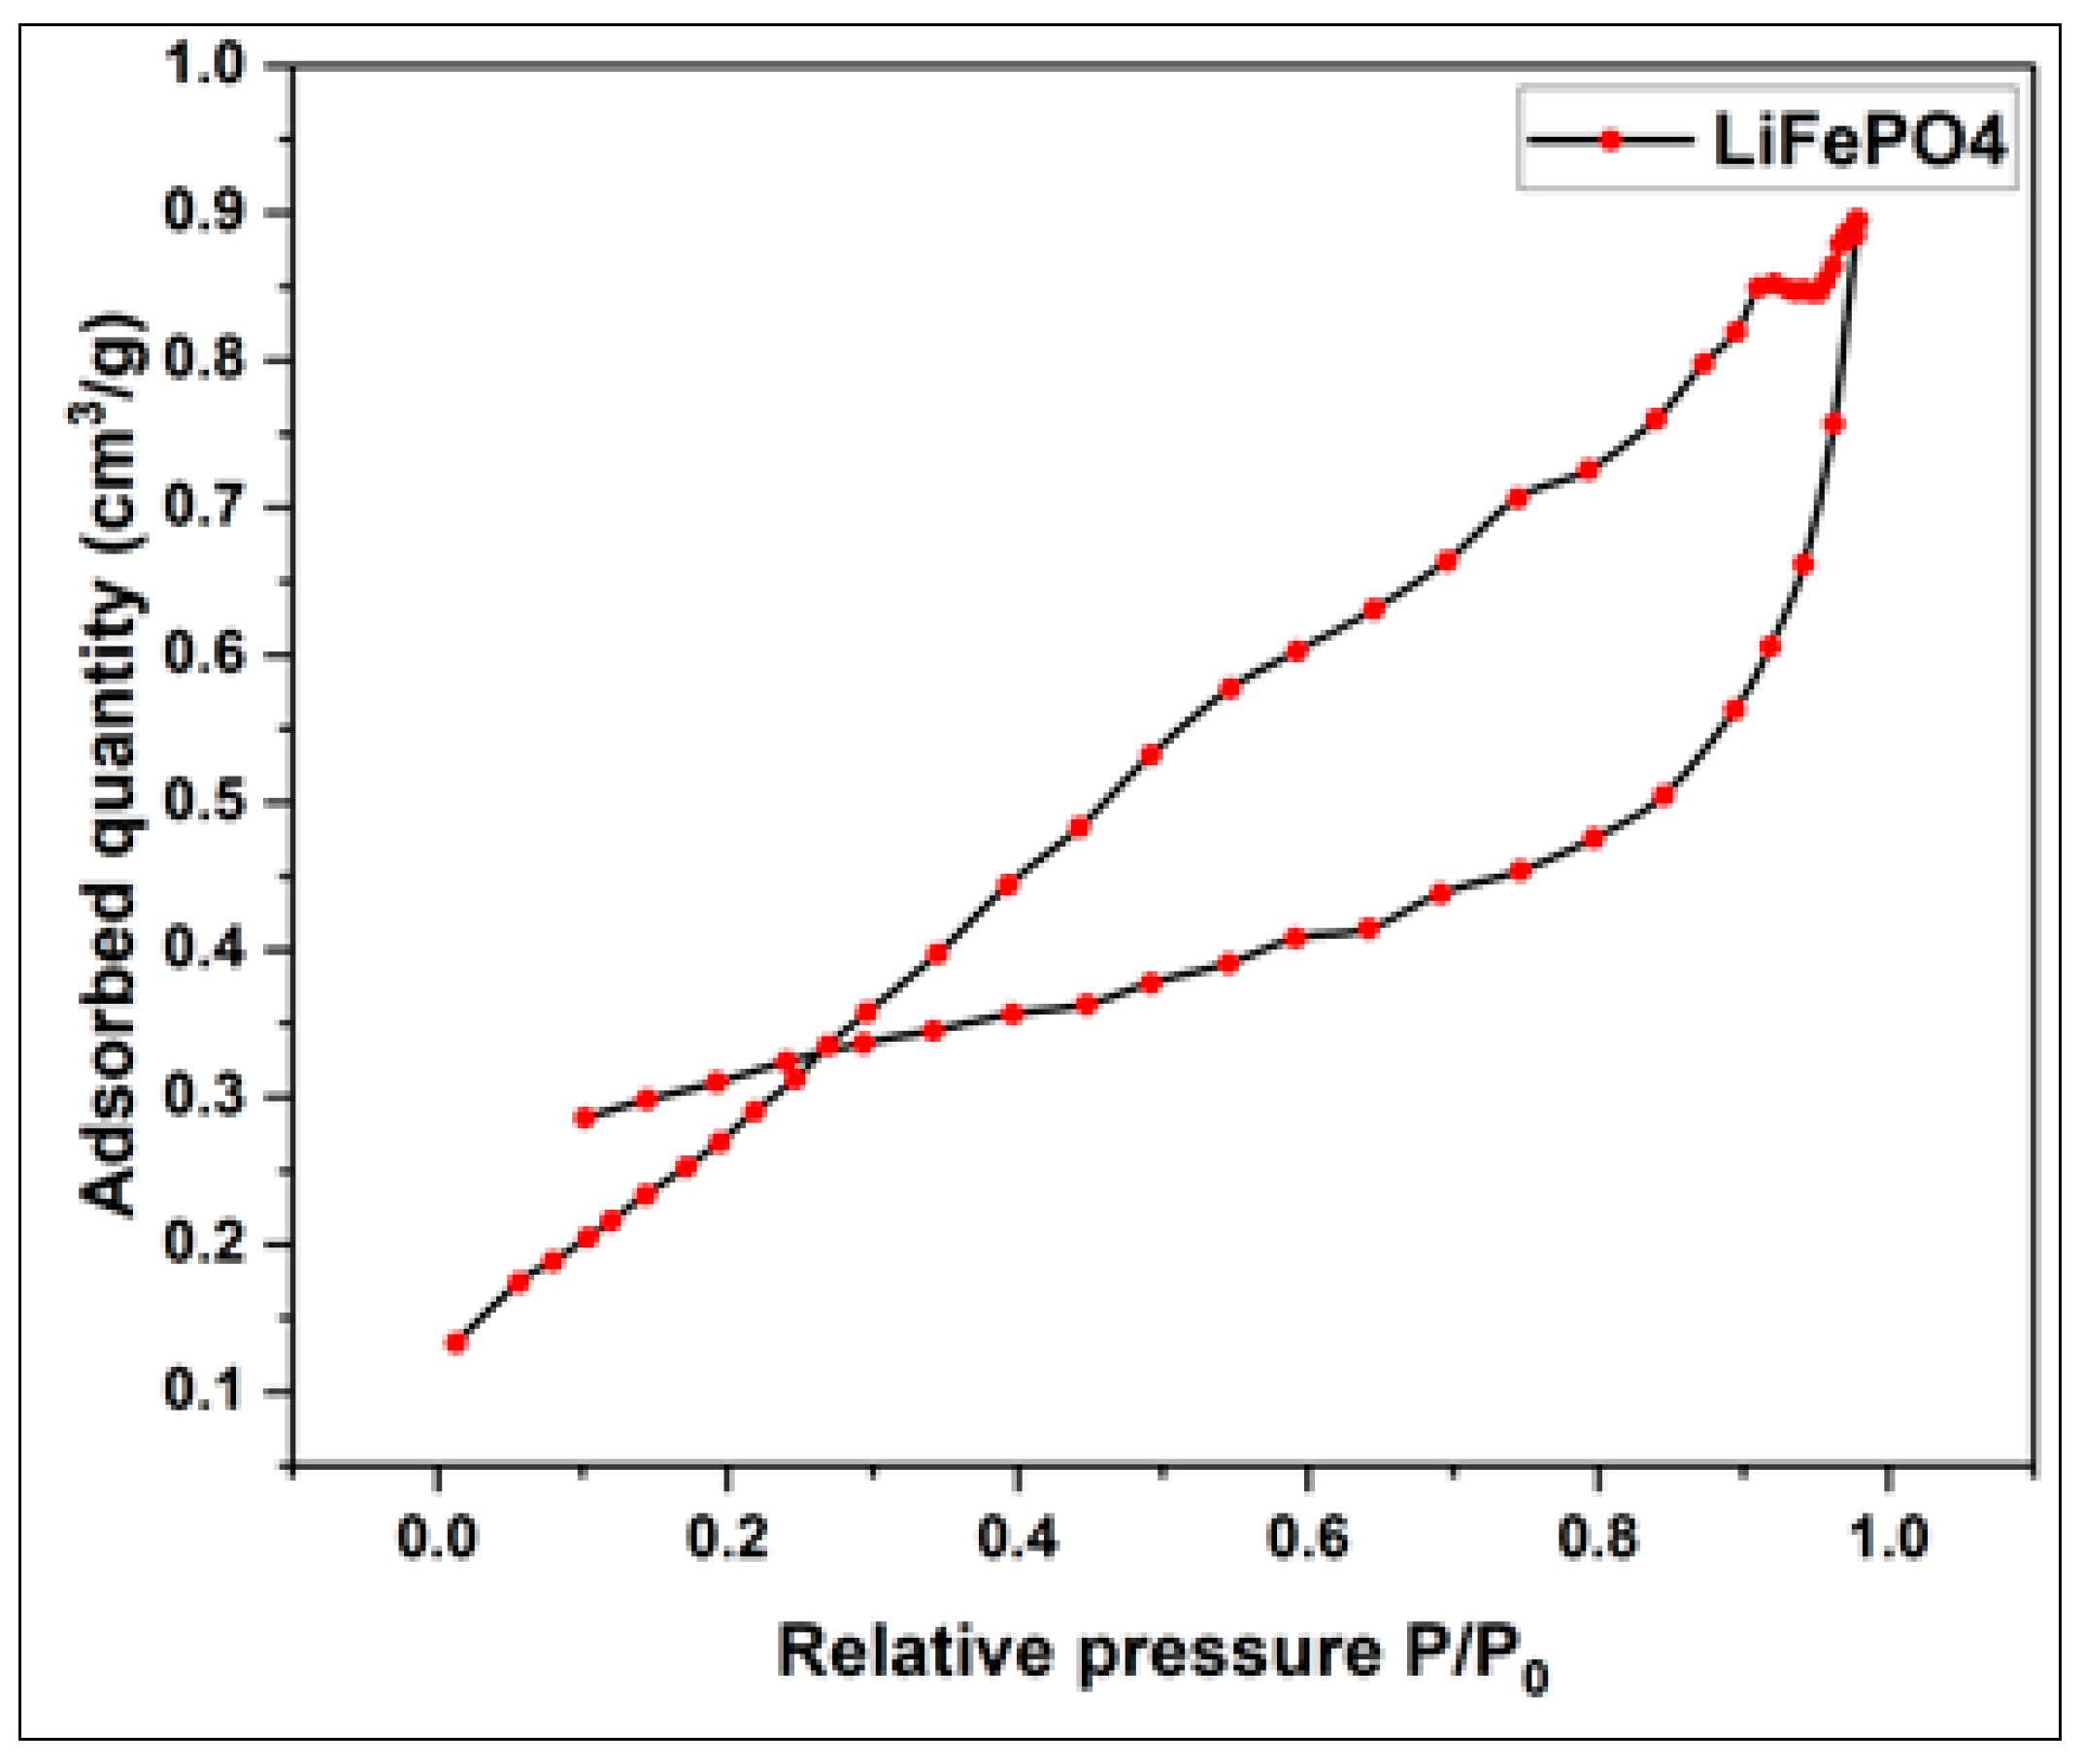
Figure 5.
Variation of the differential volume (cm3/g.nm) vs pore diameter of the pore size distribution of LiFePO4 using BJH method.
Figure 5.
Variation of the differential volume (cm3/g.nm) vs pore diameter of the pore size distribution of LiFePO4 using BJH method.
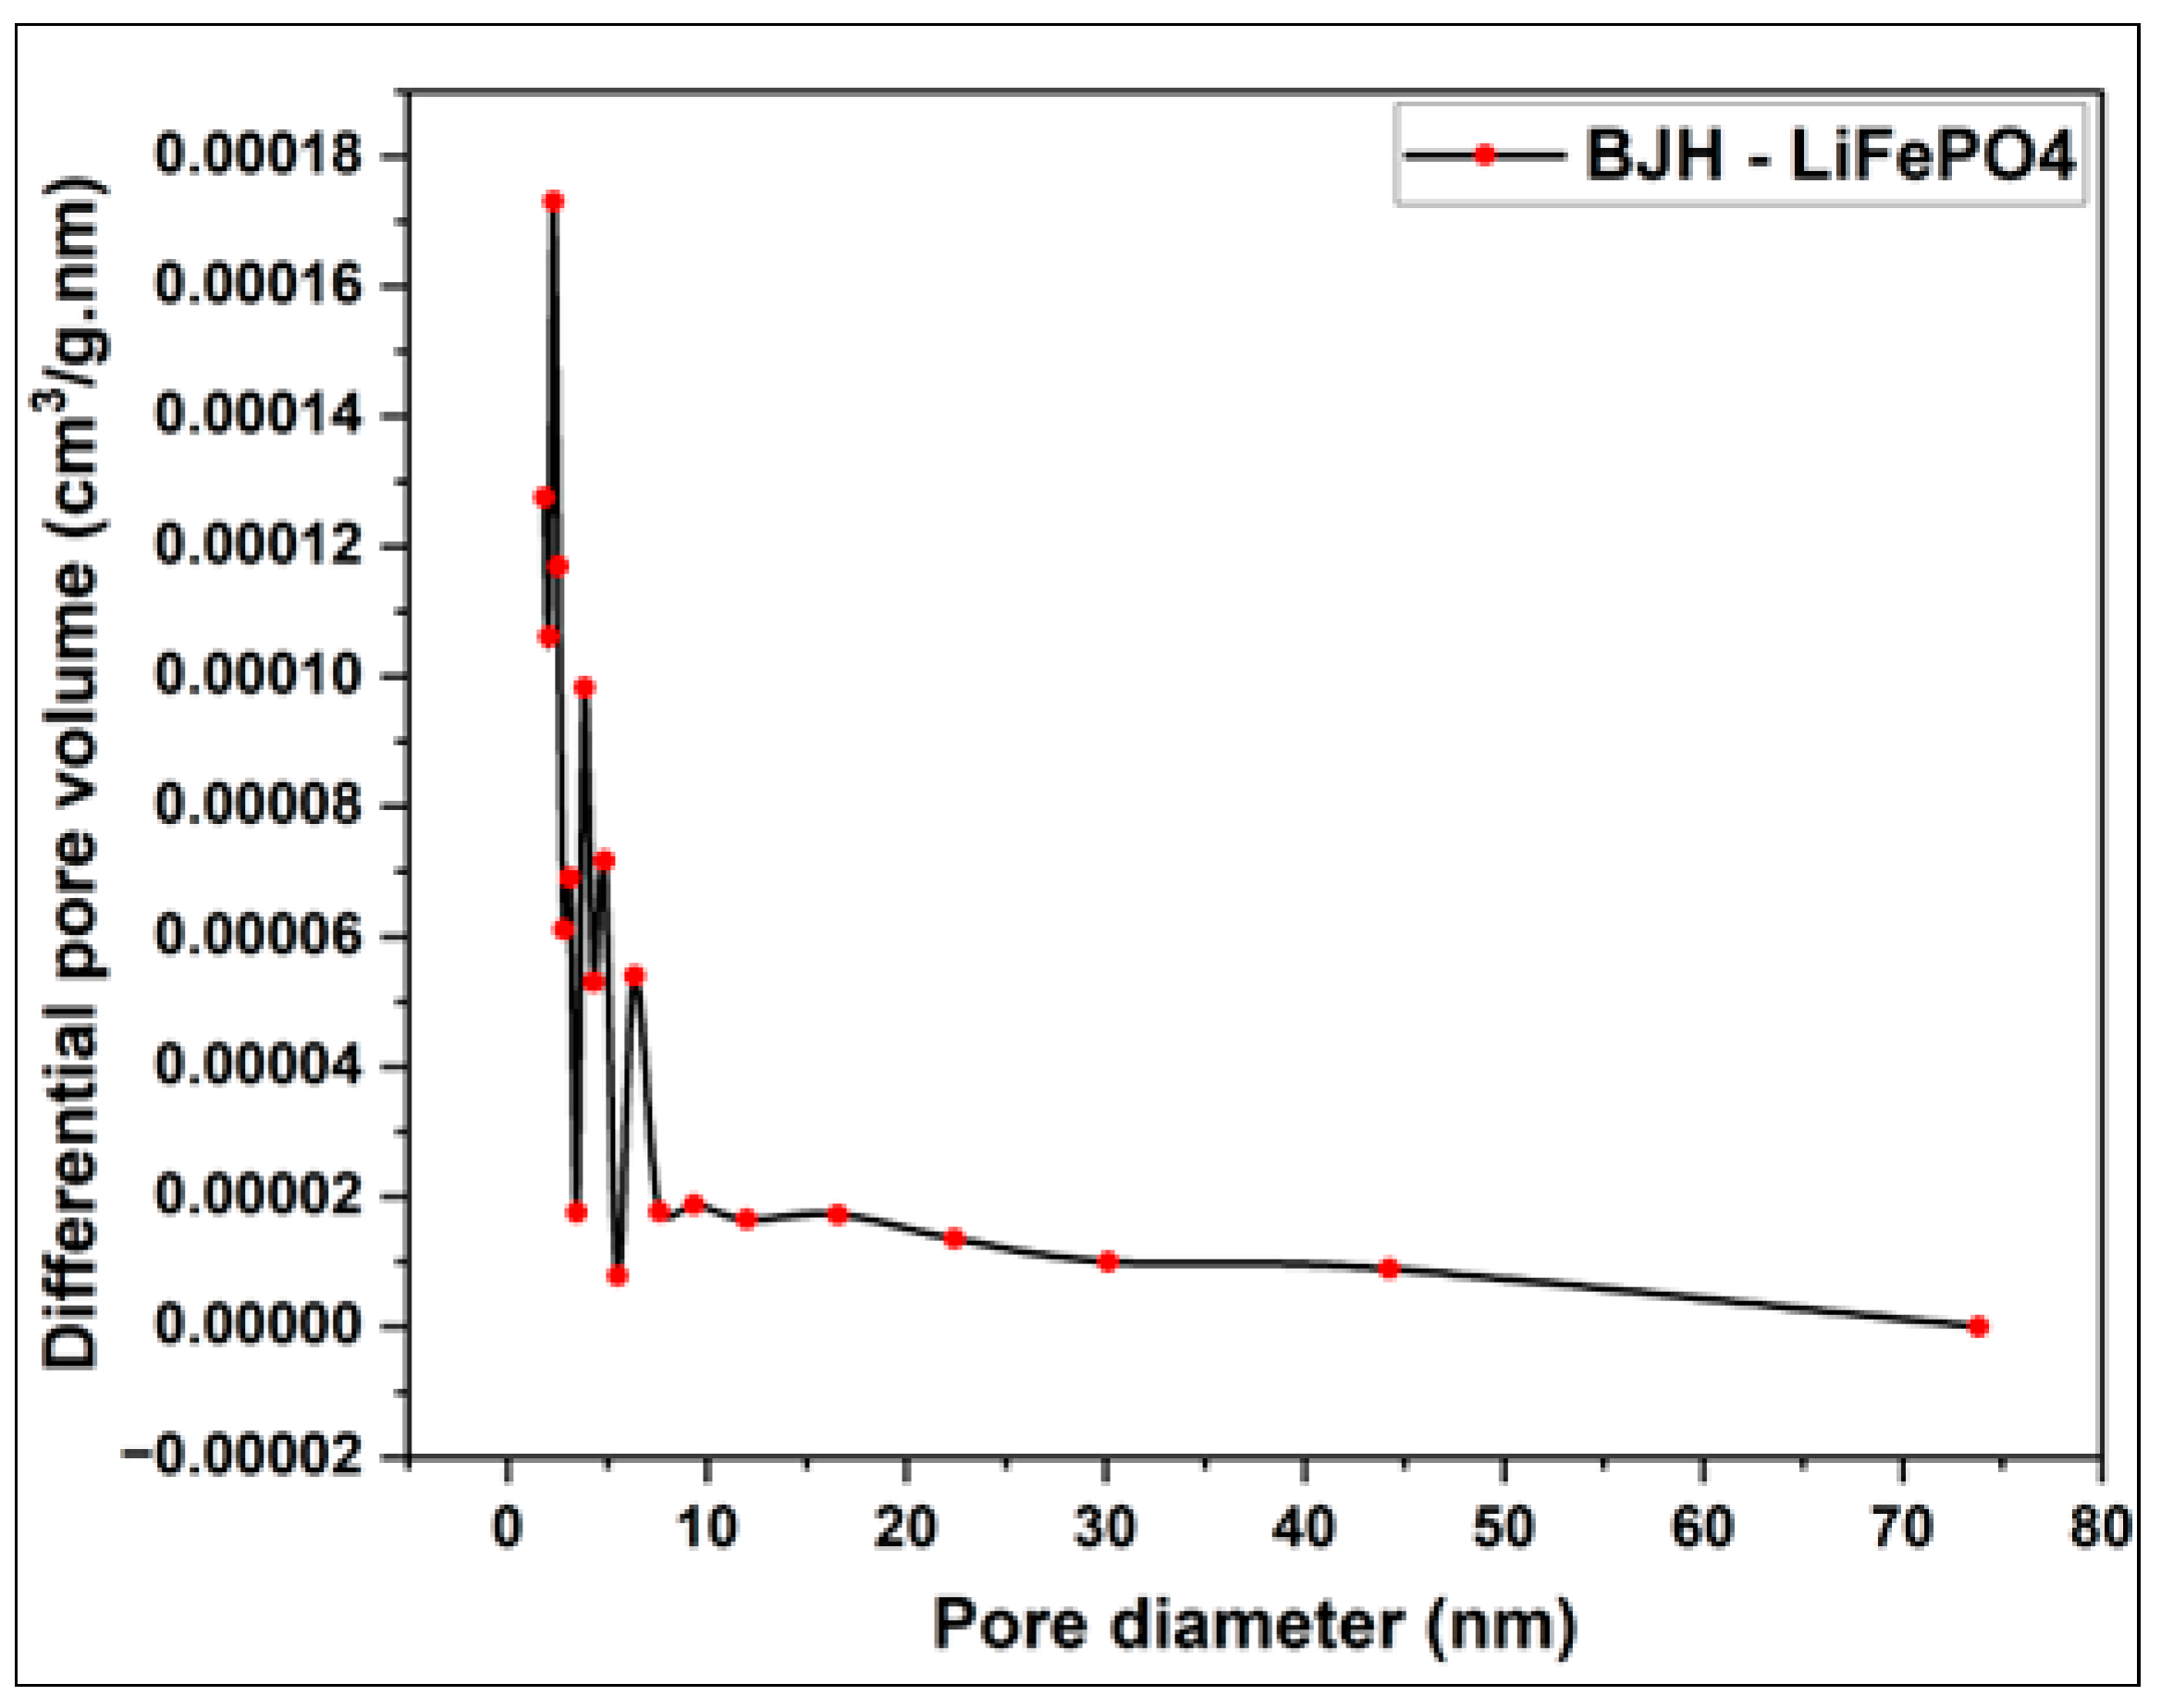
Figure 6.
Variation of the differential volume (cm3/g.nm) vs pore diameter of the pore size distribution of LiFePO4 using HK method.
Figure 6.
Variation of the differential volume (cm3/g.nm) vs pore diameter of the pore size distribution of LiFePO4 using HK method.
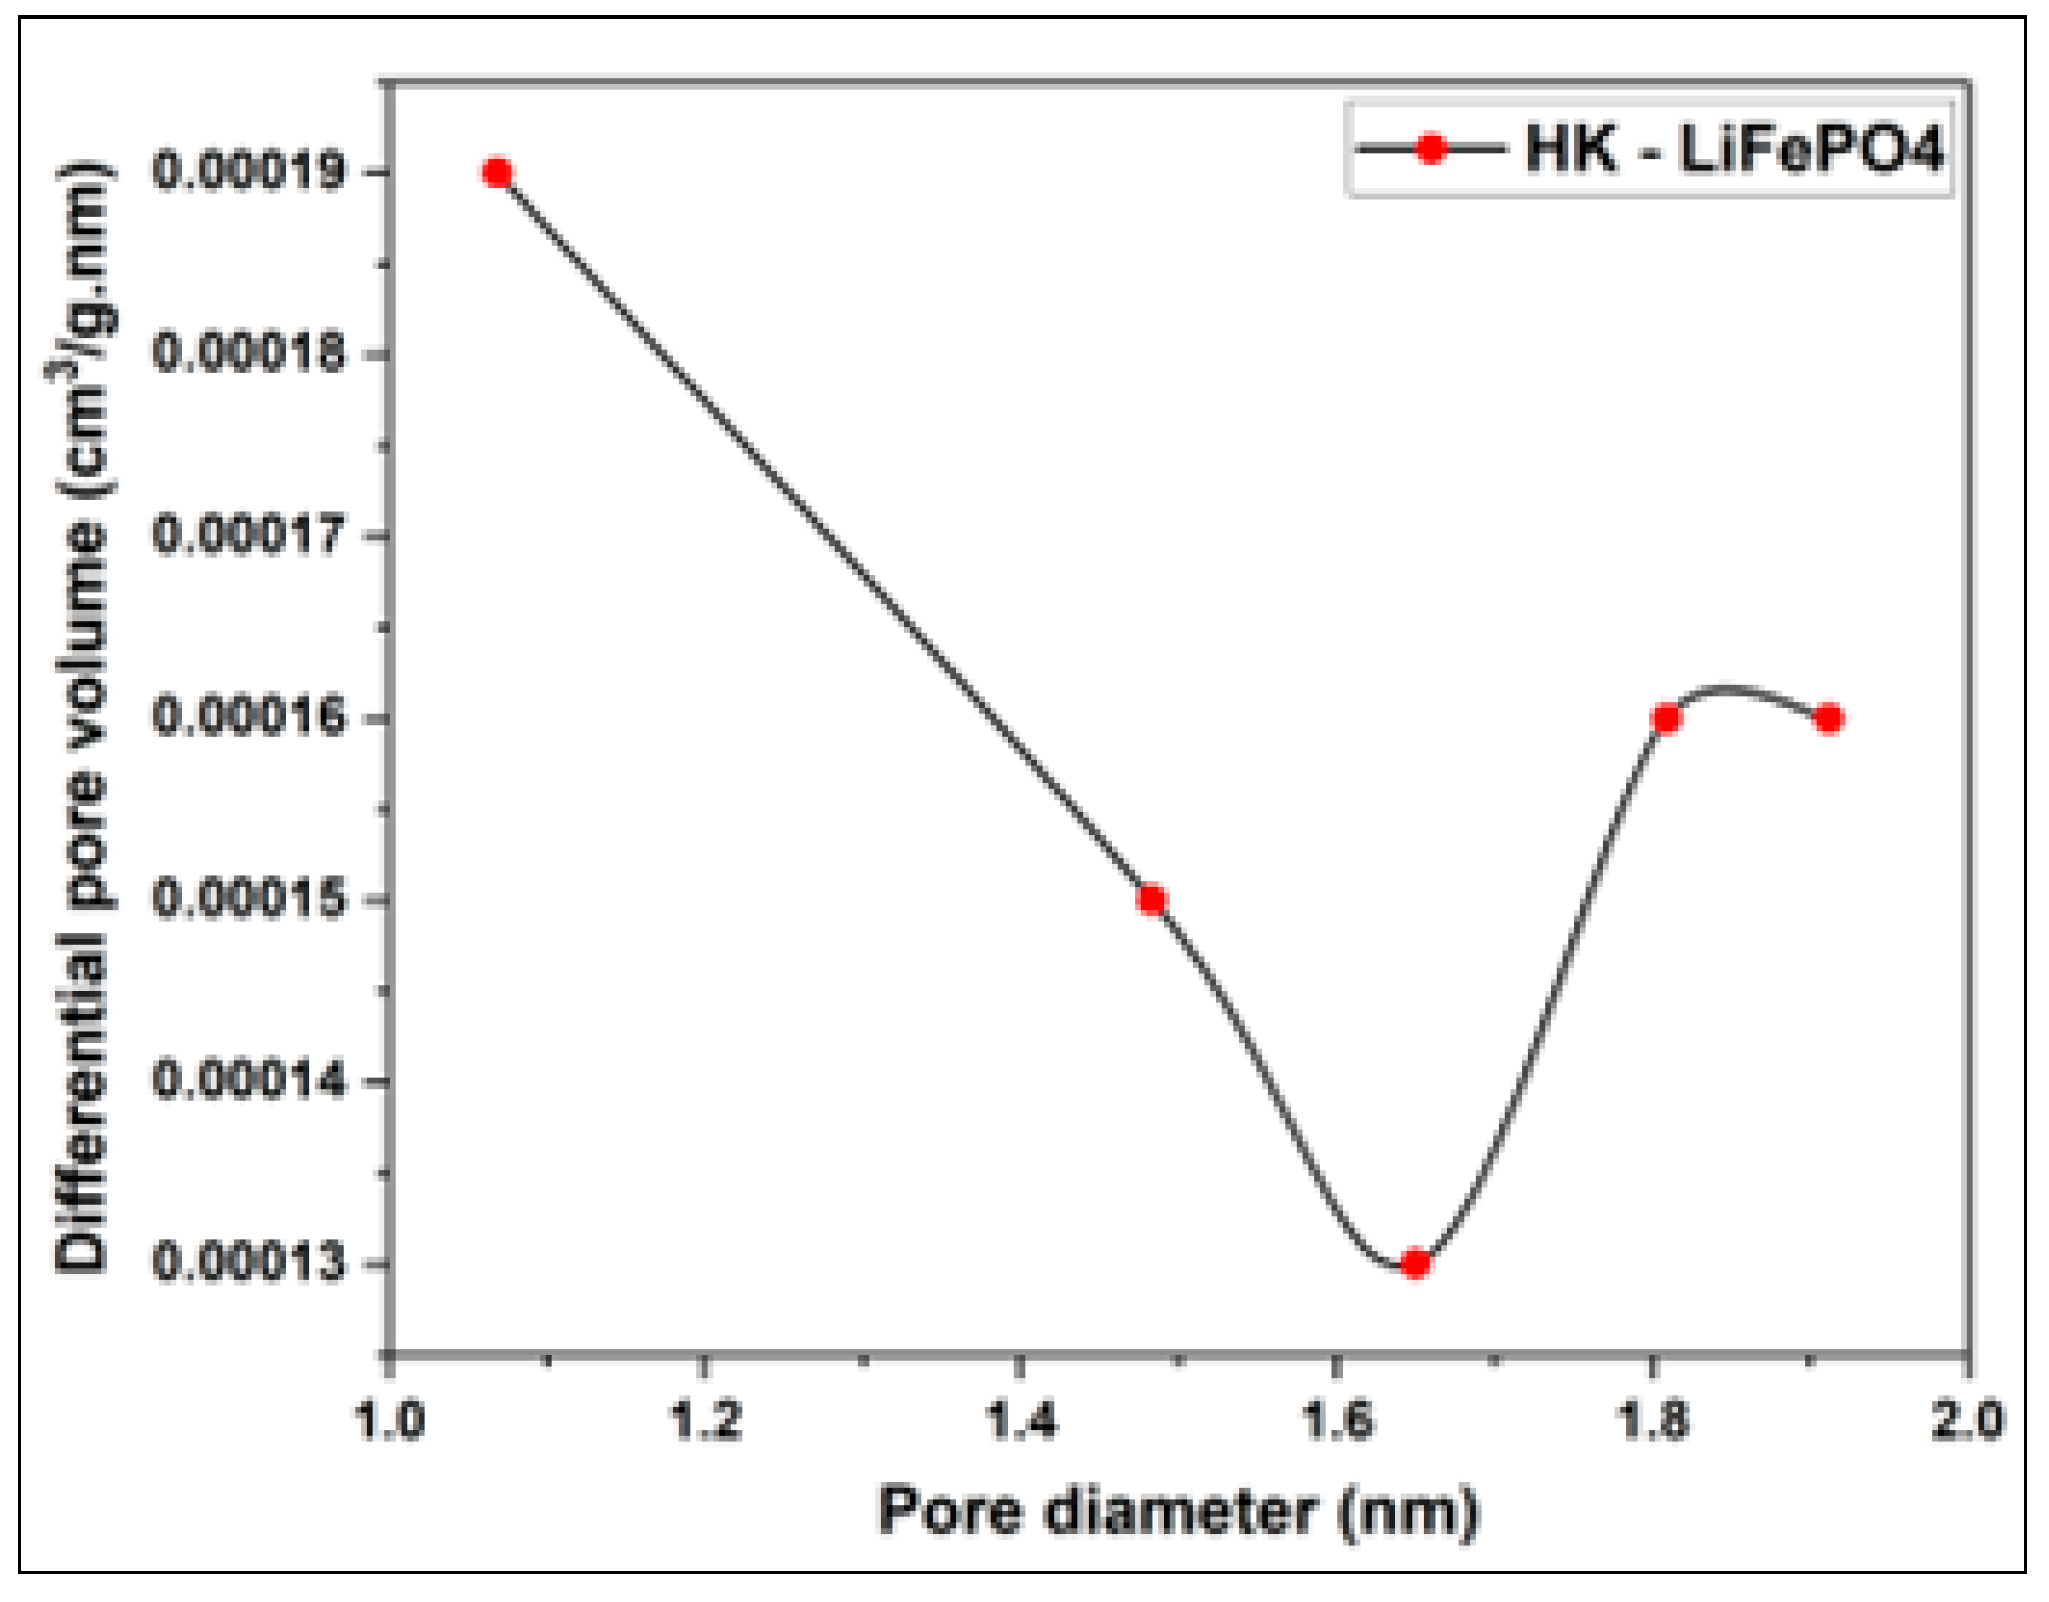
Figure 7.
Nitrogen adsorption and desorption isotherms of millet cob.
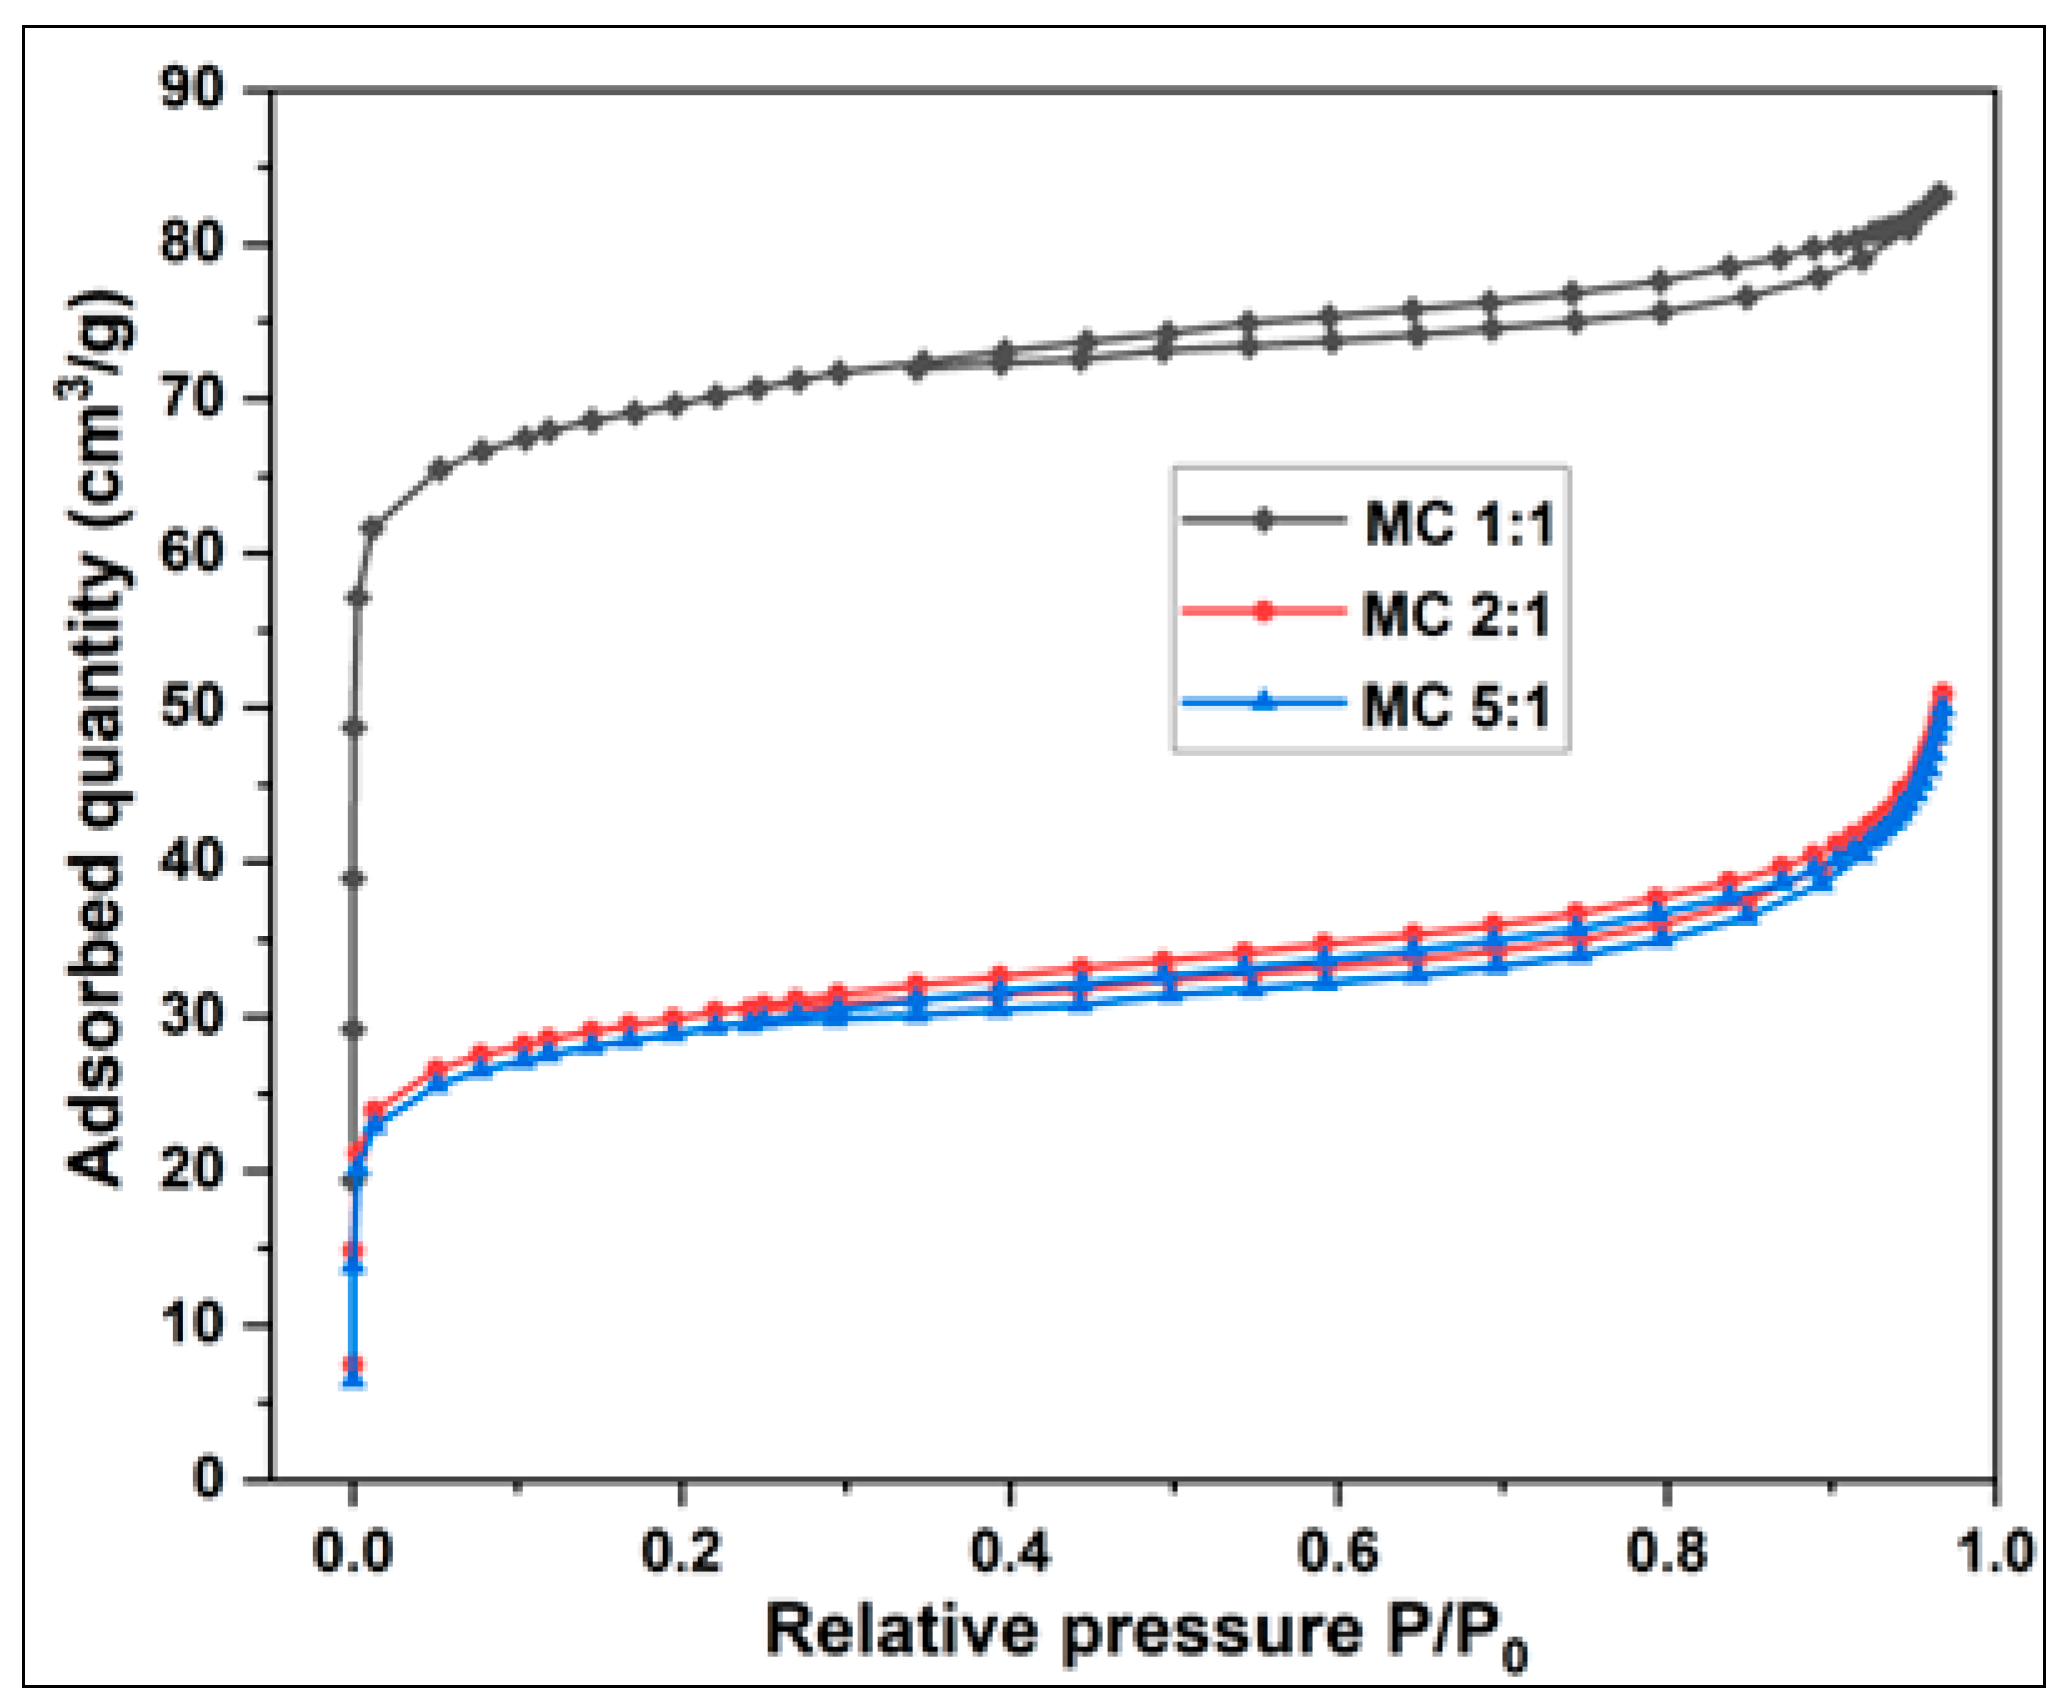
Figure 8.
Nitrogen adsorption and desorption isotherms of water hyacinth.
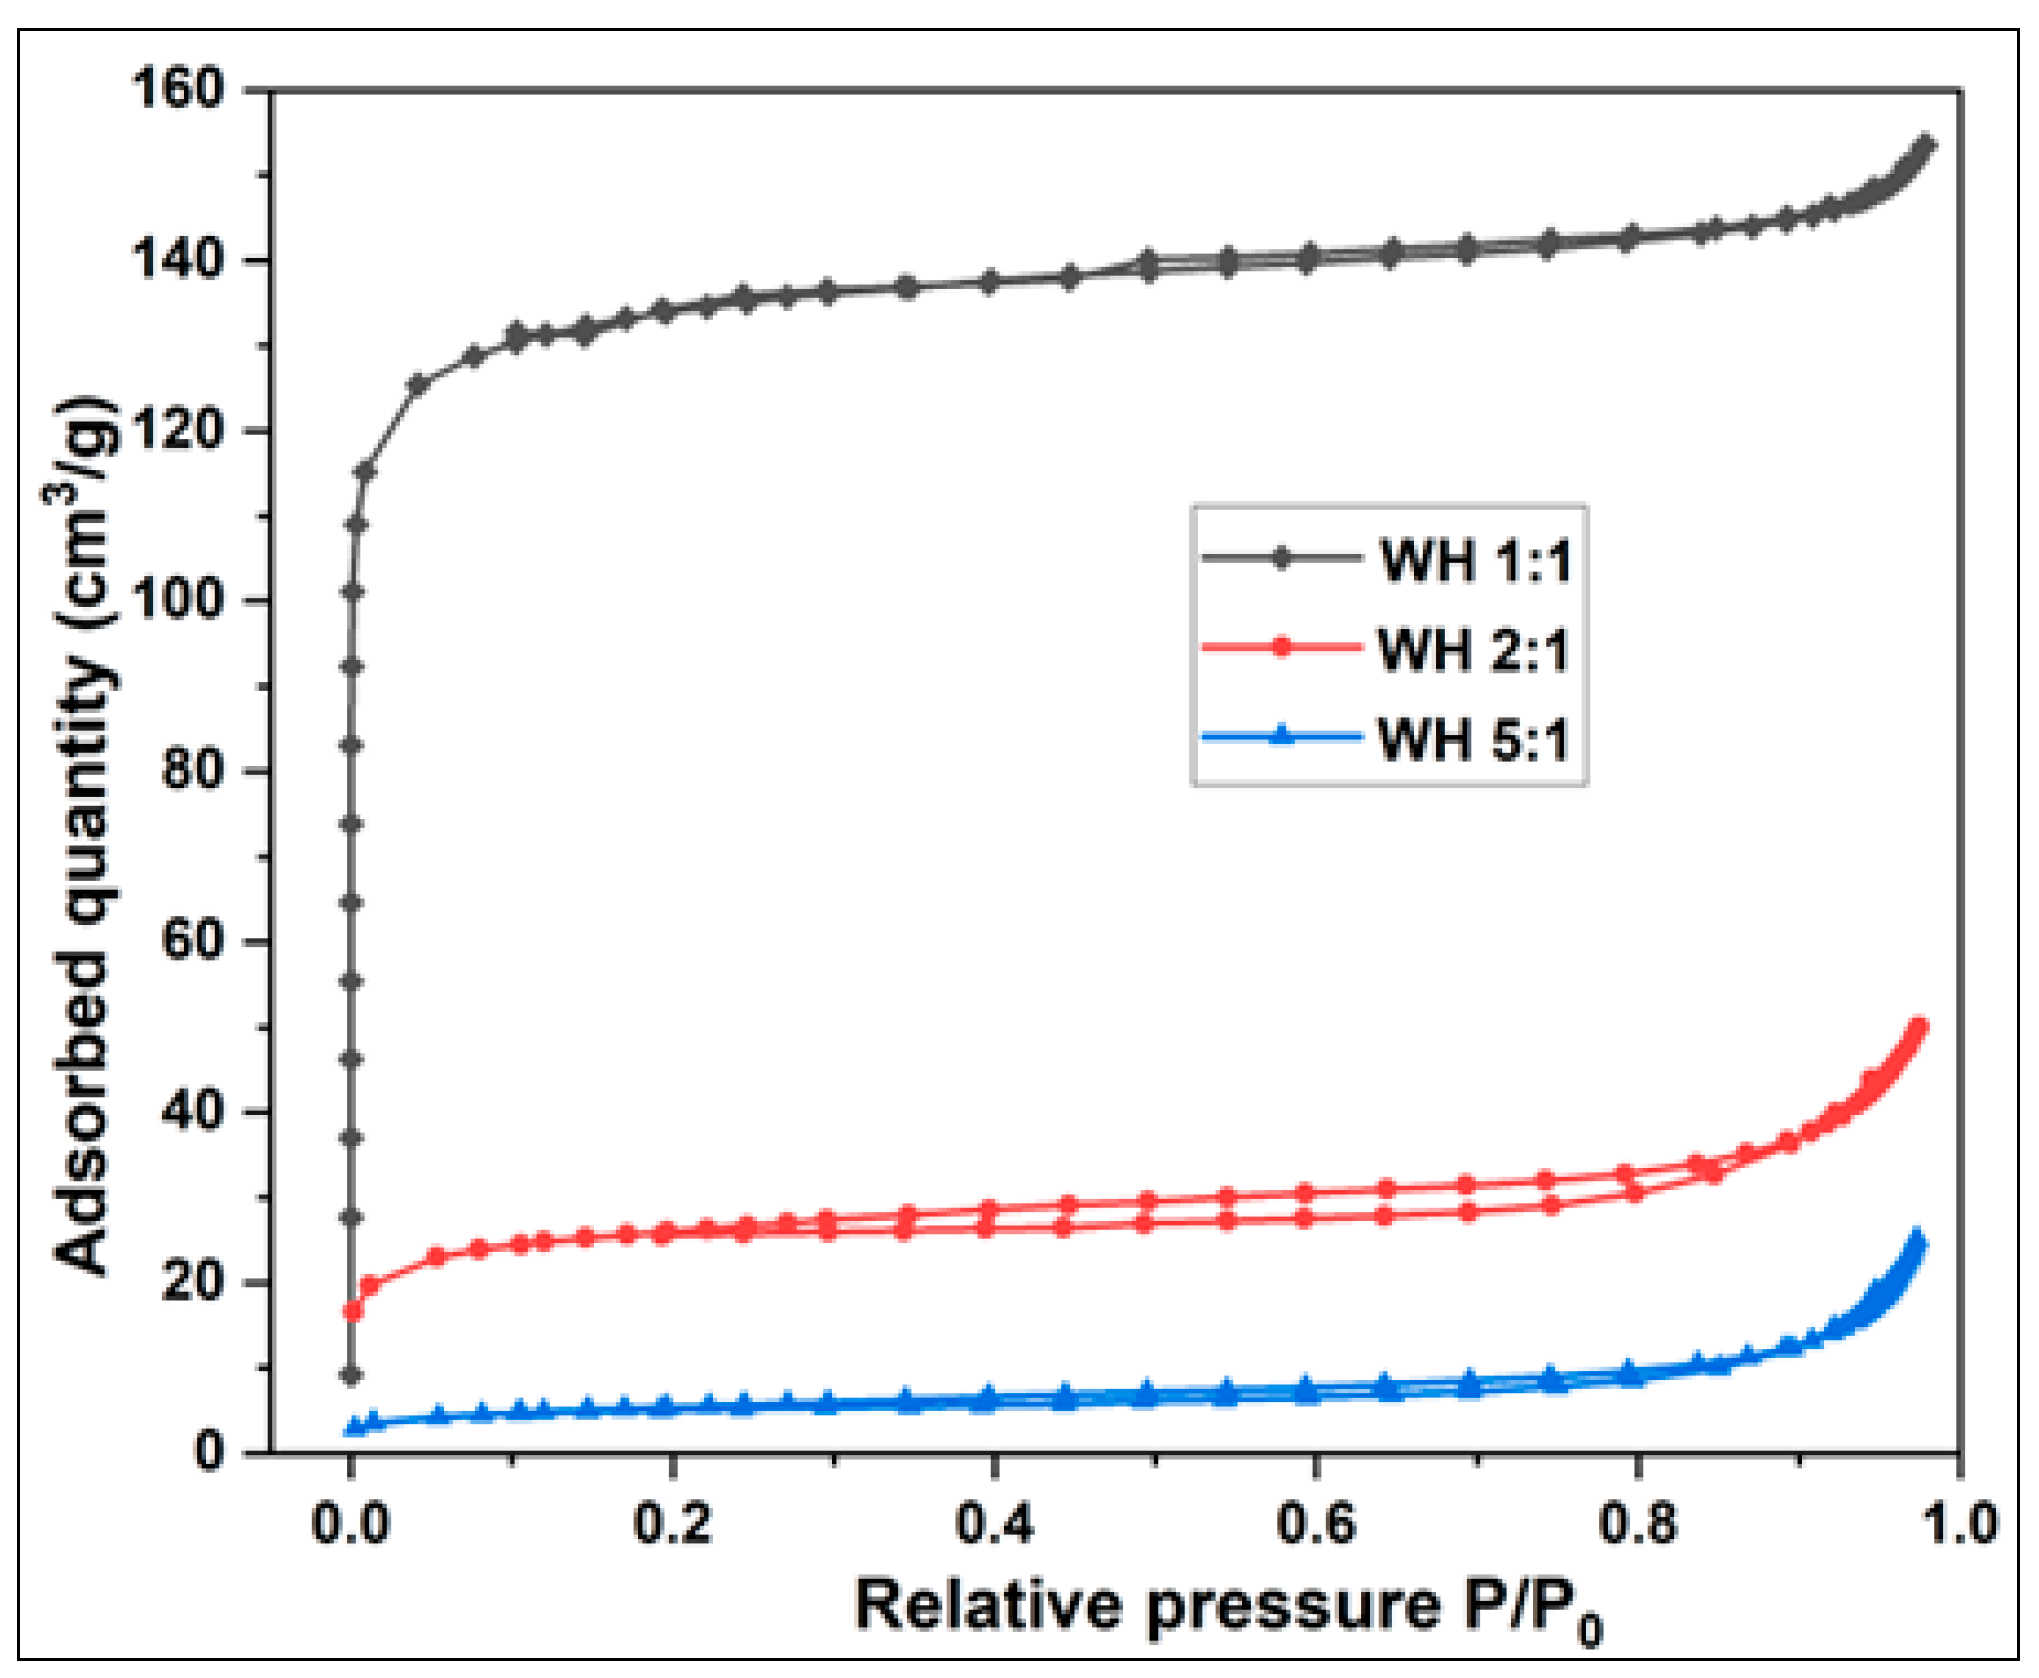
Figure 9.
WH pore size distribution using HK method: (a) KOH/WH 1:1 (b) KOH/WH 2:1 and (c) KOH/WH 5:1 at 700oC.
Figure 9.
WH pore size distribution using HK method: (a) KOH/WH 1:1 (b) KOH/WH 2:1 and (c) KOH/WH 5:1 at 700oC.
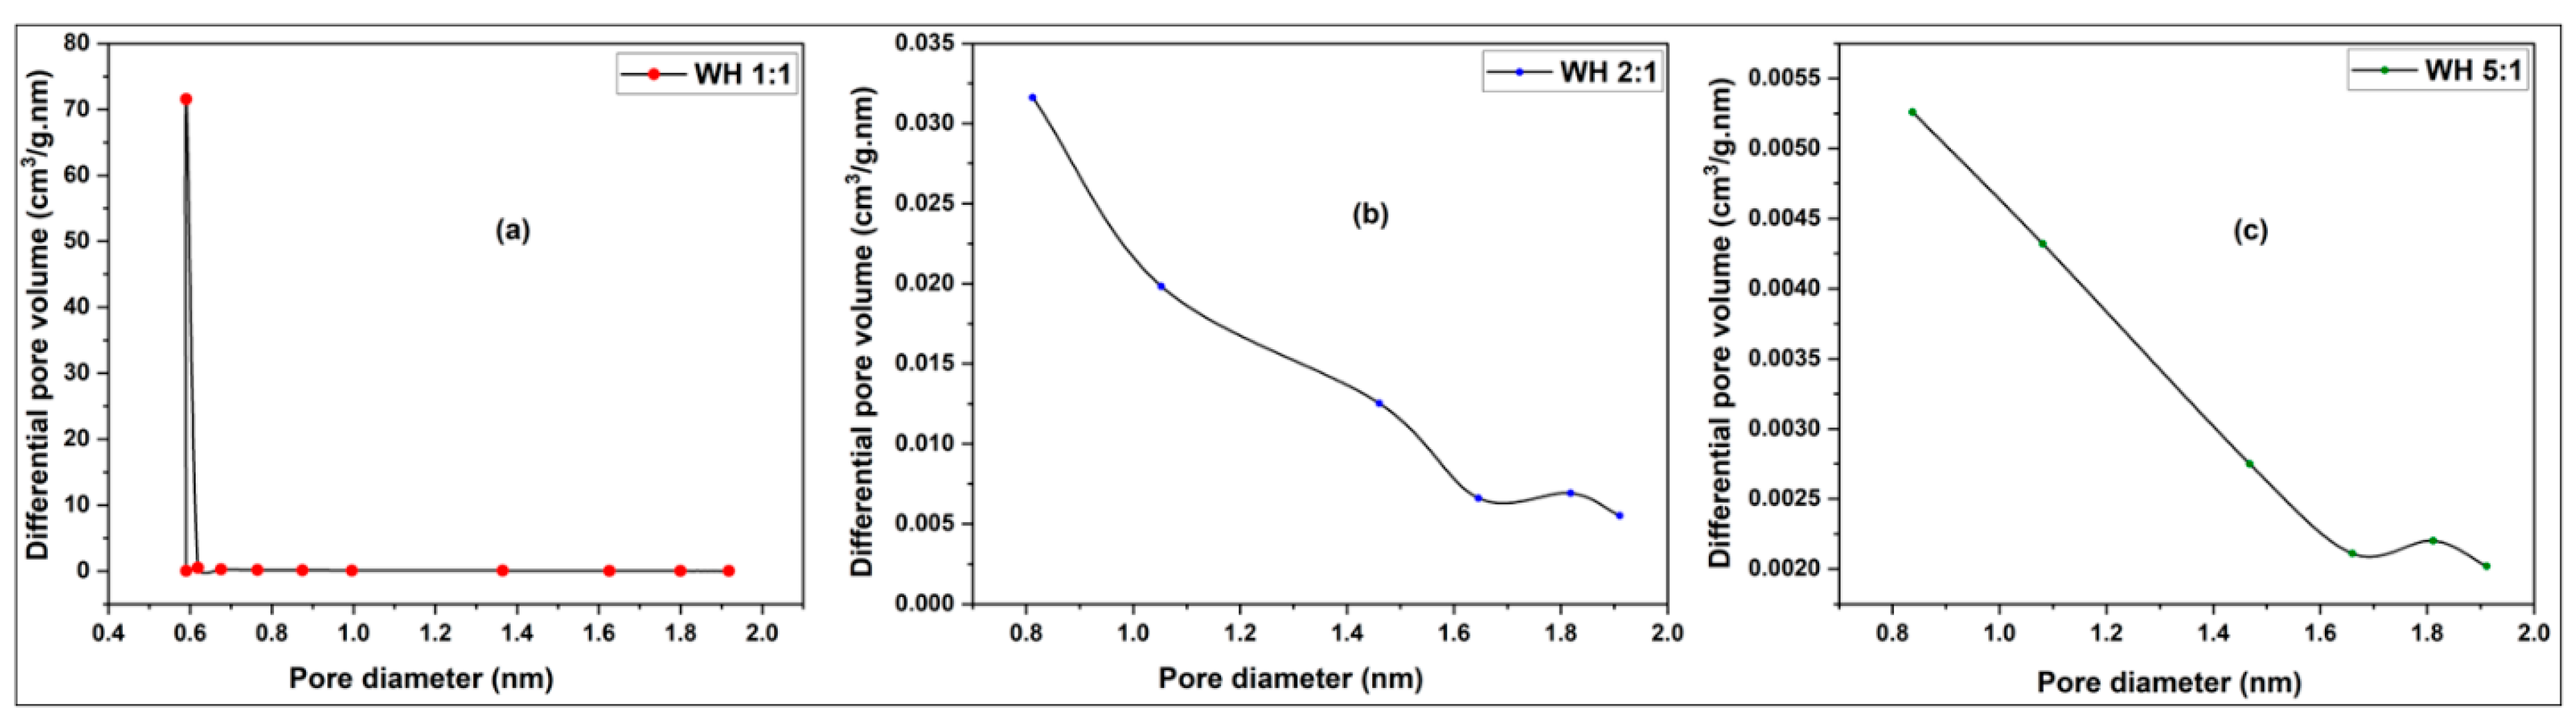
Figure 10.
WH pore size distribution using NLDFT method: (d) KOH/WH 1:1 (e) KOH/WH 2:1 and (f) KOH/WH 5:1 at 700oC.
Figure 10.
WH pore size distribution using NLDFT method: (d) KOH/WH 1:1 (e) KOH/WH 2:1 and (f) KOH/WH 5:1 at 700oC.
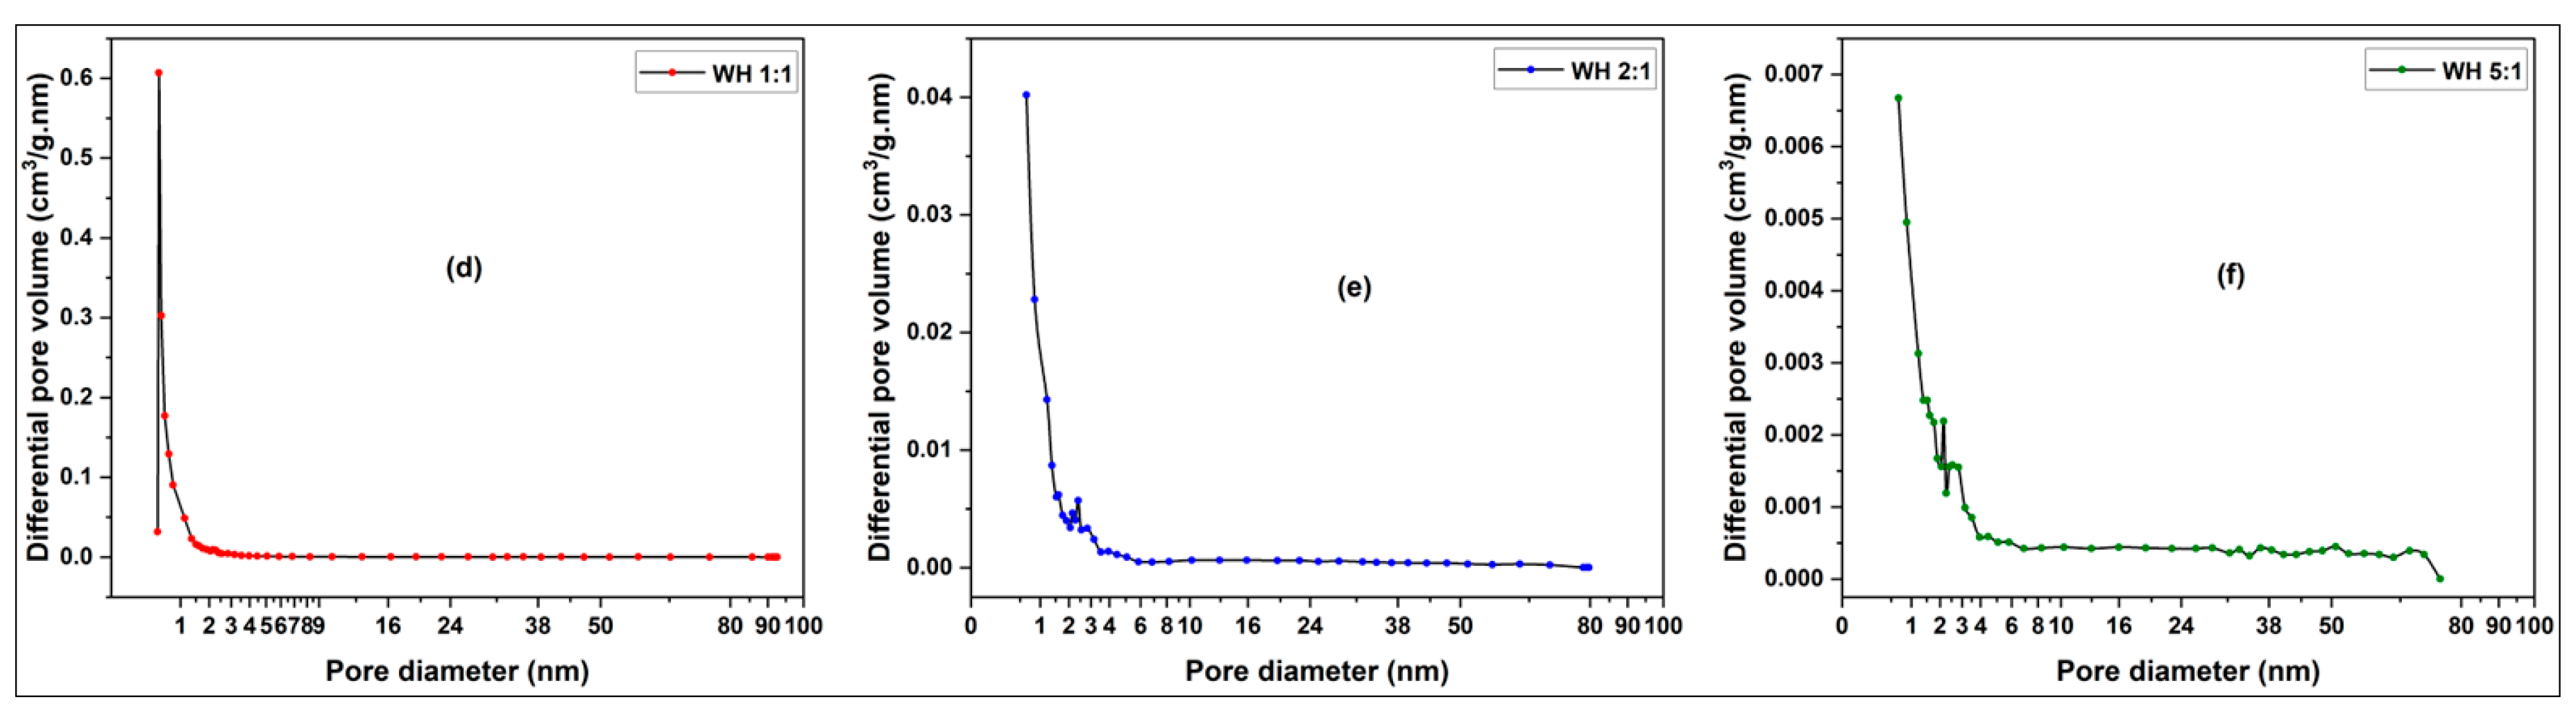
Figure 11.
MC pore size distribution using HK method: (a) KOH/MC 1:1 (b) KOH/MC 2:1 and (c) KOH/MC 5:1 at 700oC.
Figure 11.
MC pore size distribution using HK method: (a) KOH/MC 1:1 (b) KOH/MC 2:1 and (c) KOH/MC 5:1 at 700oC.
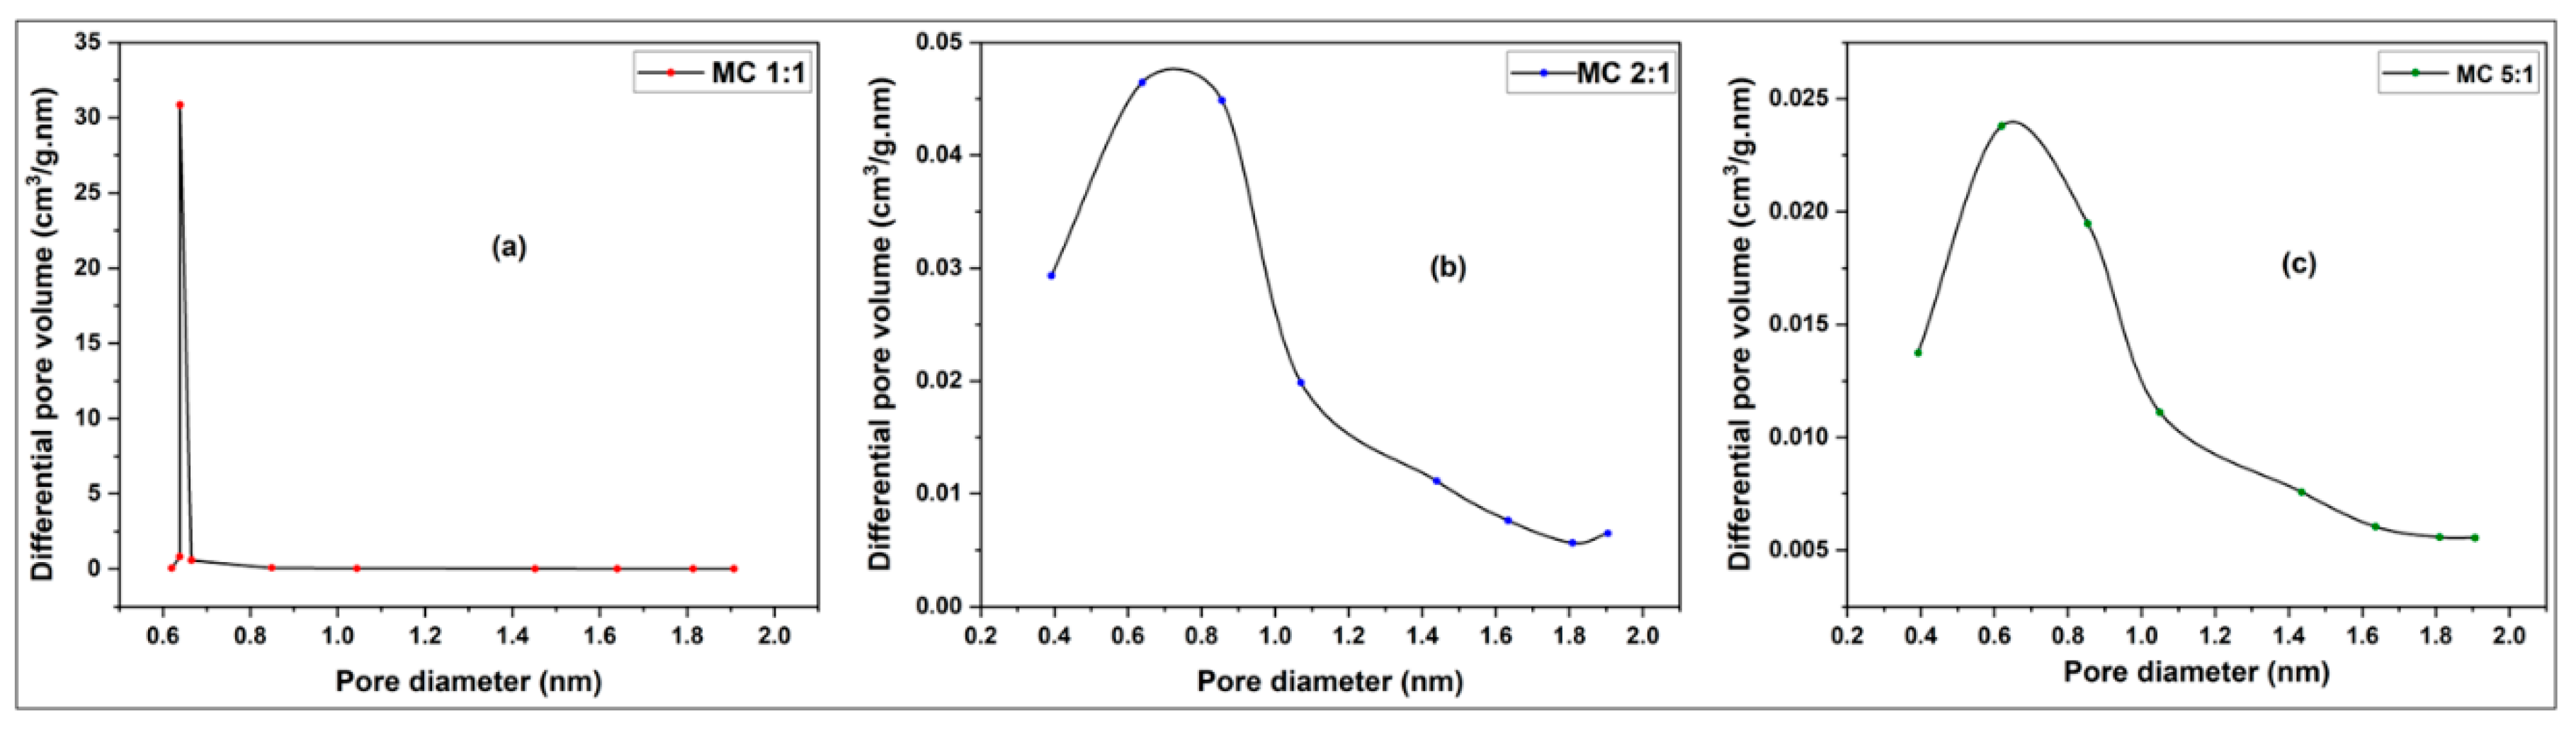
Figure 12.
MC pore size distribution using NLDFT method: (d) KOH/MC 1:1 (e) KOH/MC 2:1 and (f) KOH/MC 5.1 at 700oC.
Figure 12.
MC pore size distribution using NLDFT method: (d) KOH/MC 1:1 (e) KOH/MC 2:1 and (f) KOH/MC 5.1 at 700oC.
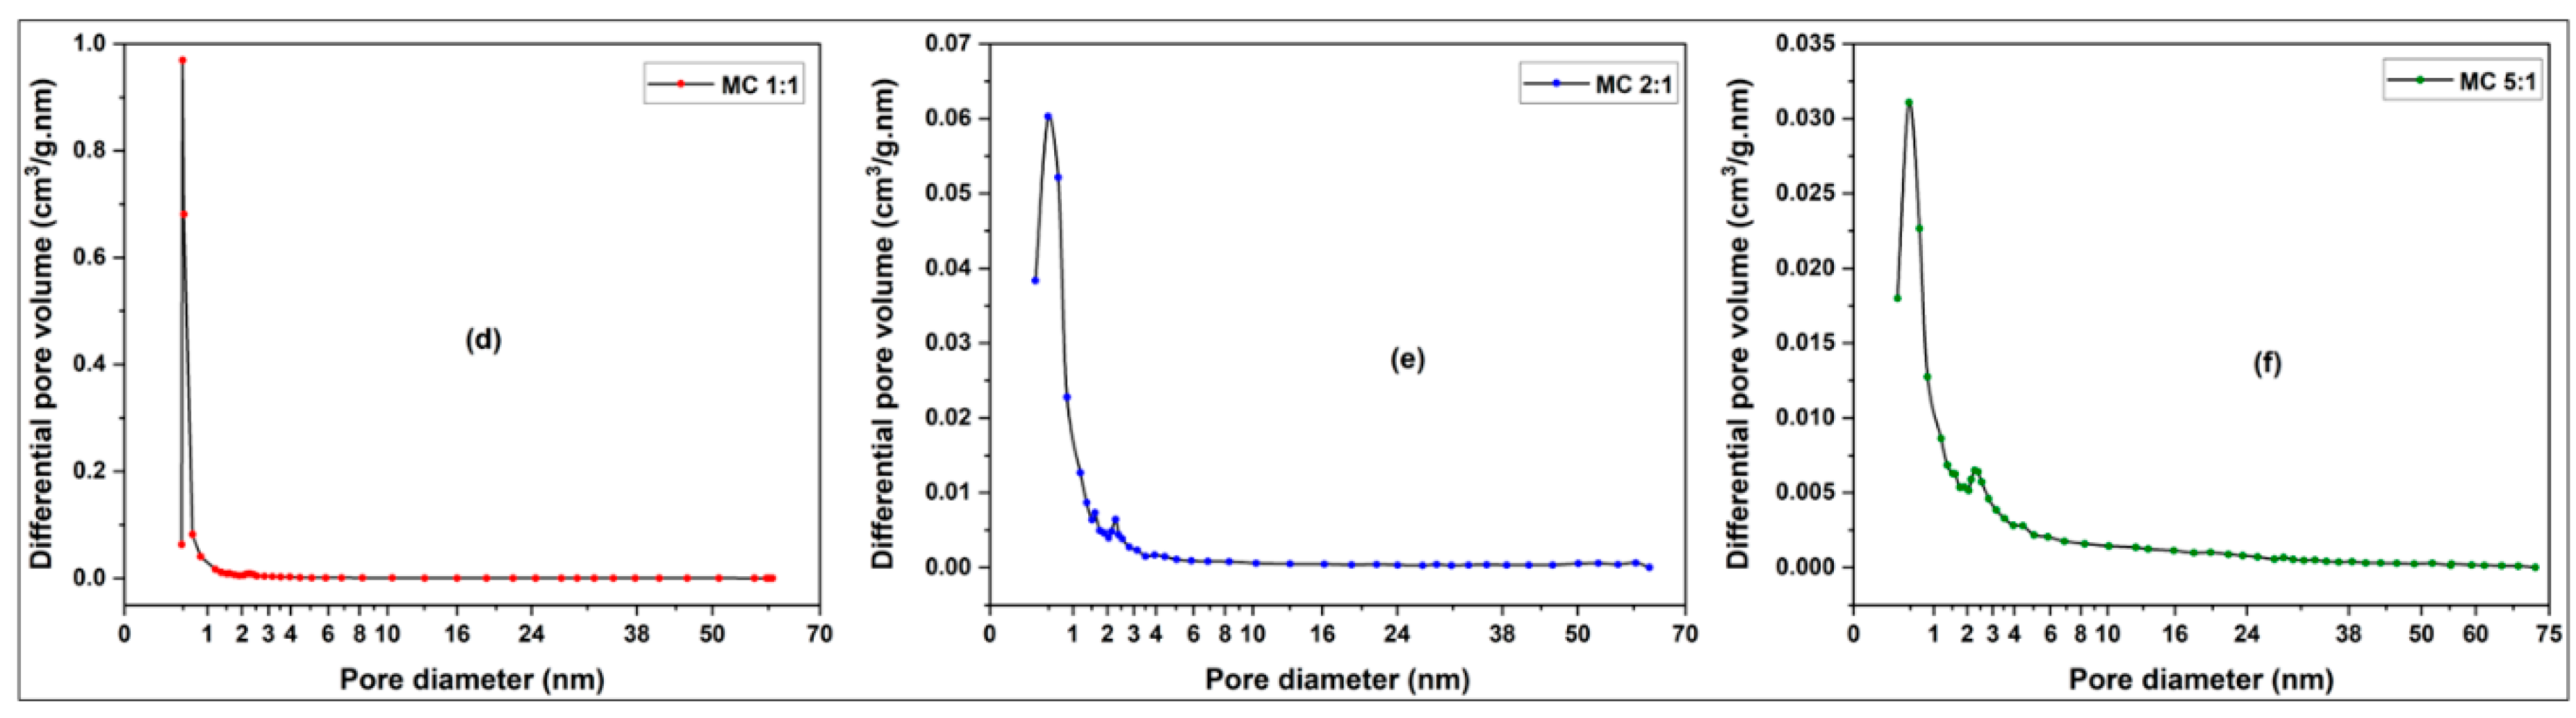
Figure 13.
SEM images of various activated carbon at 700°C: (a) KOH/MC 1:1; (b) KOH/MC 2:1; (c) KOH/MC 5:1; (d) KOH/WH 1:1; (e) KOH/WH 2:1; (e) KOH/WH 5:1.
Figure 13.
SEM images of various activated carbon at 700°C: (a) KOH/MC 1:1; (b) KOH/MC 2:1; (c) KOH/MC 5:1; (d) KOH/WH 1:1; (e) KOH/WH 2:1; (e) KOH/WH 5:1.
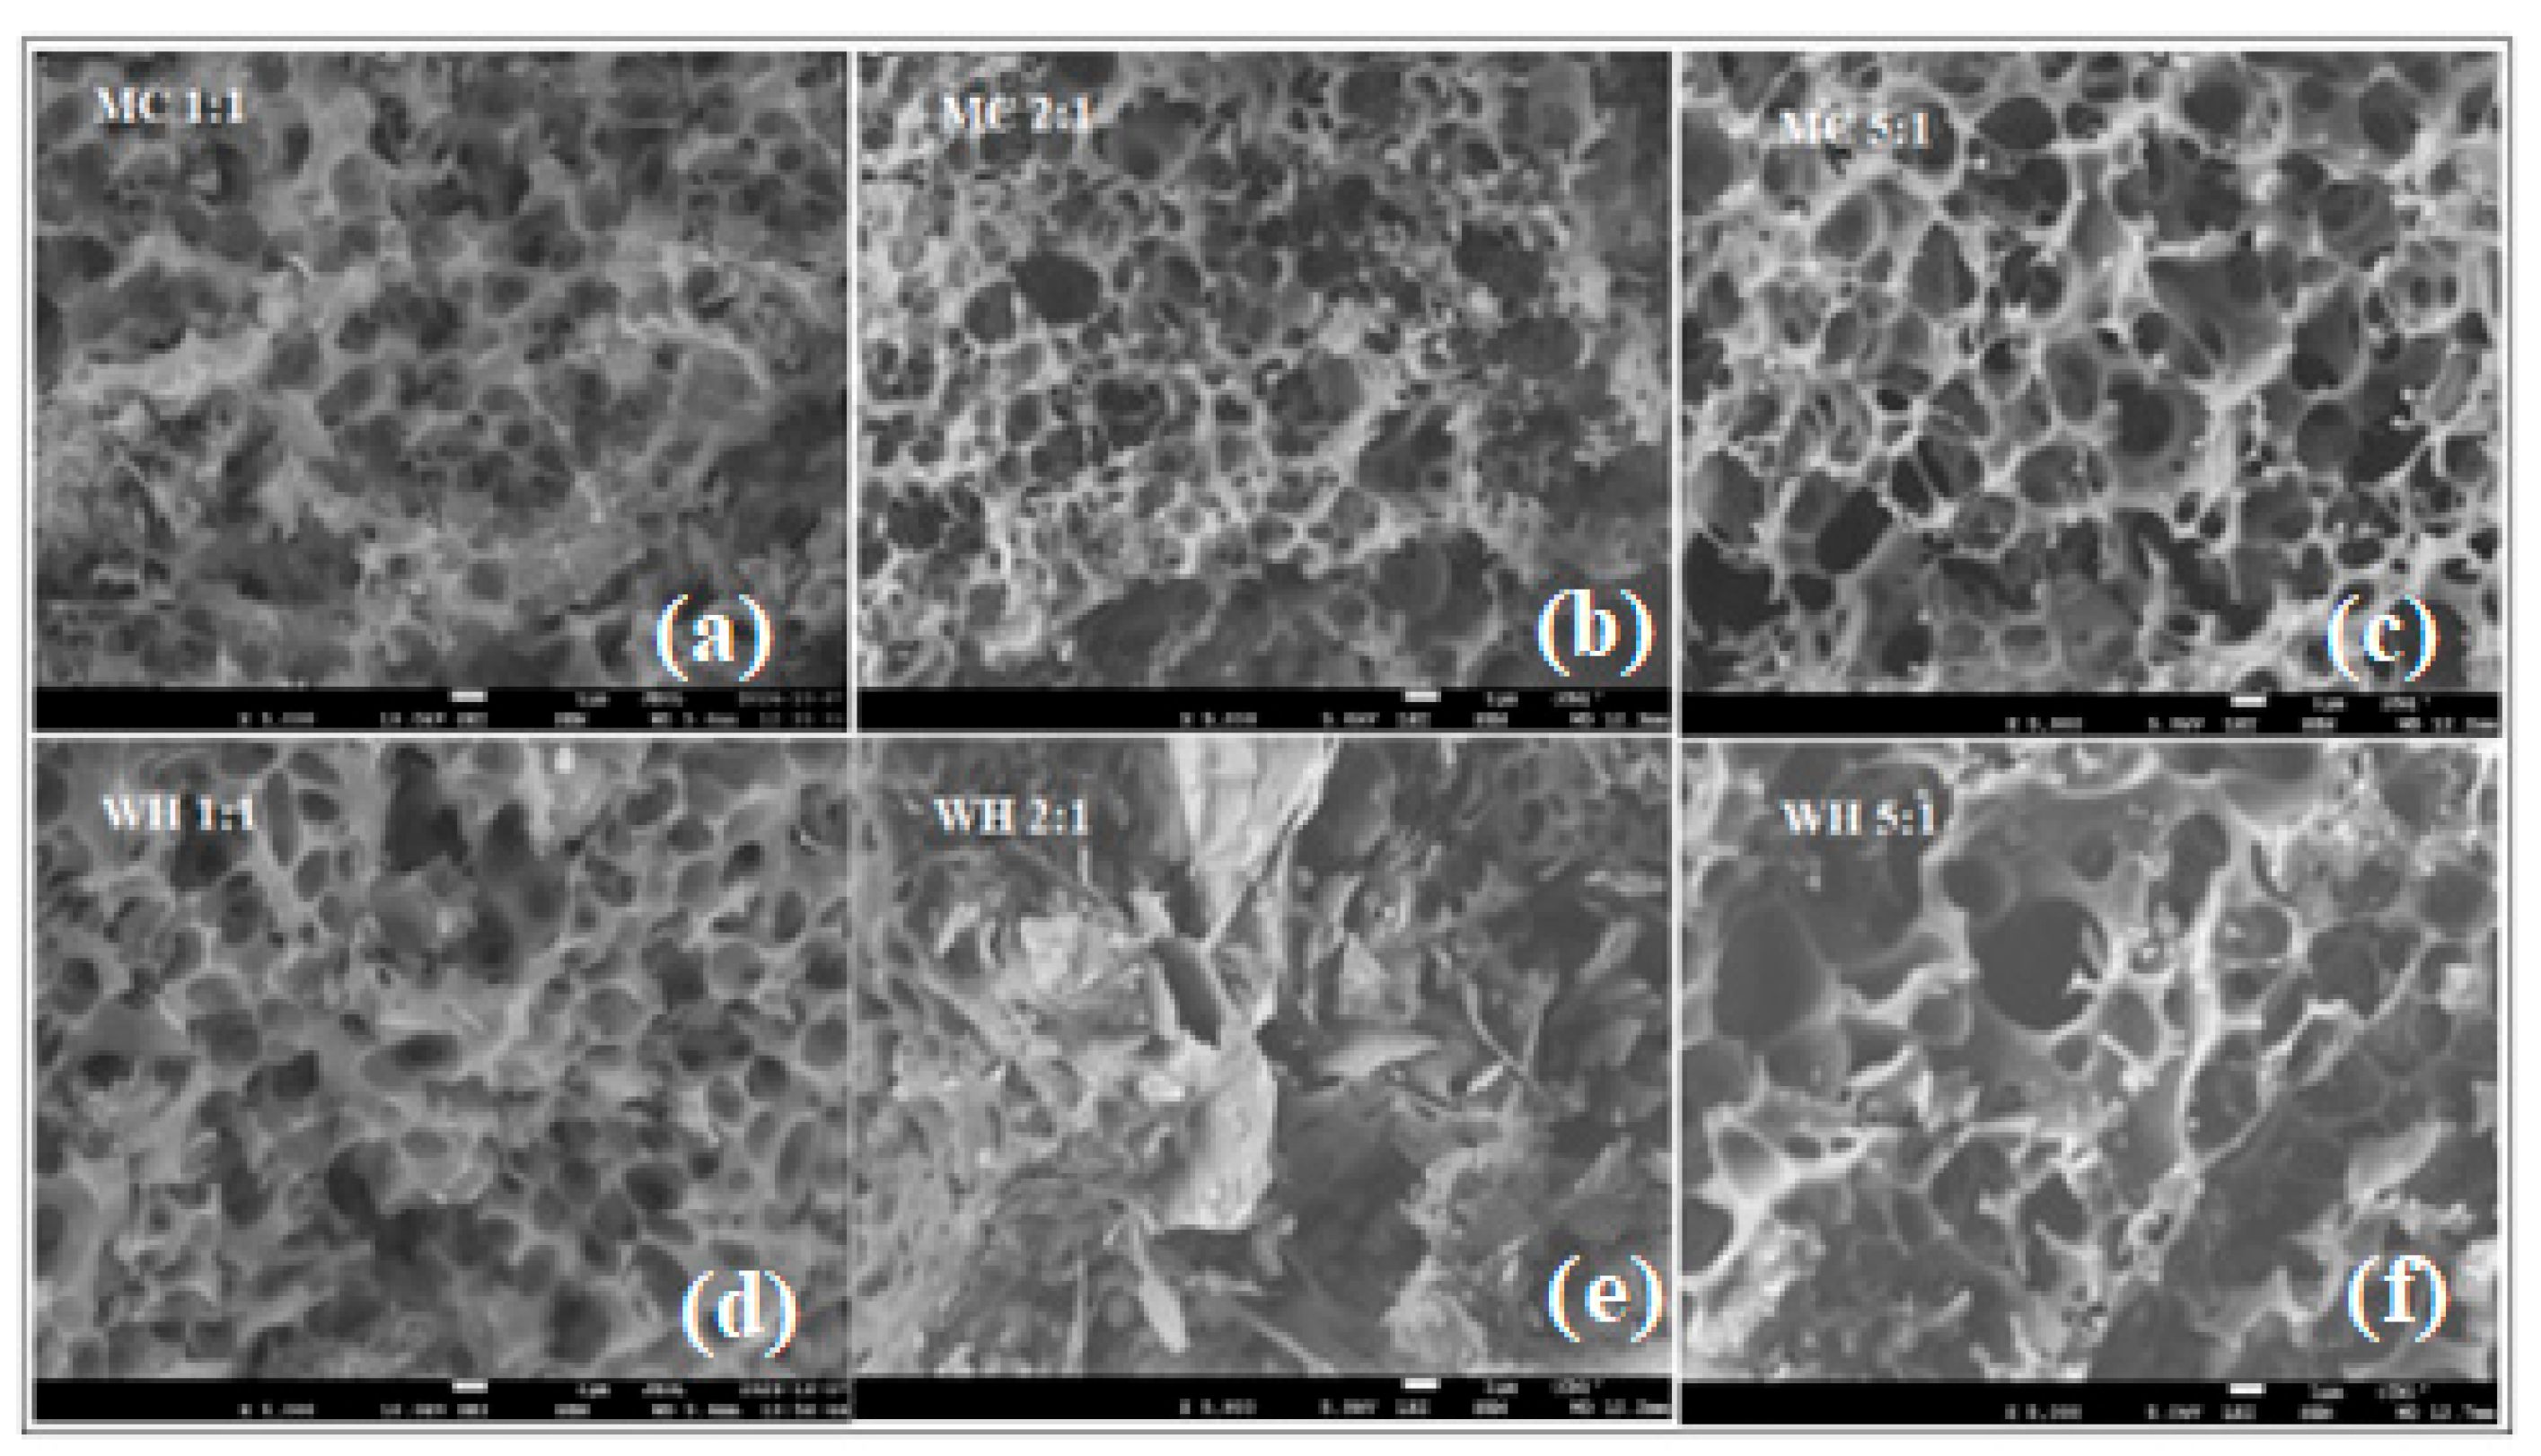
Figure 14.
XRD patterns at 460°C of activated carbon, MC and WH.
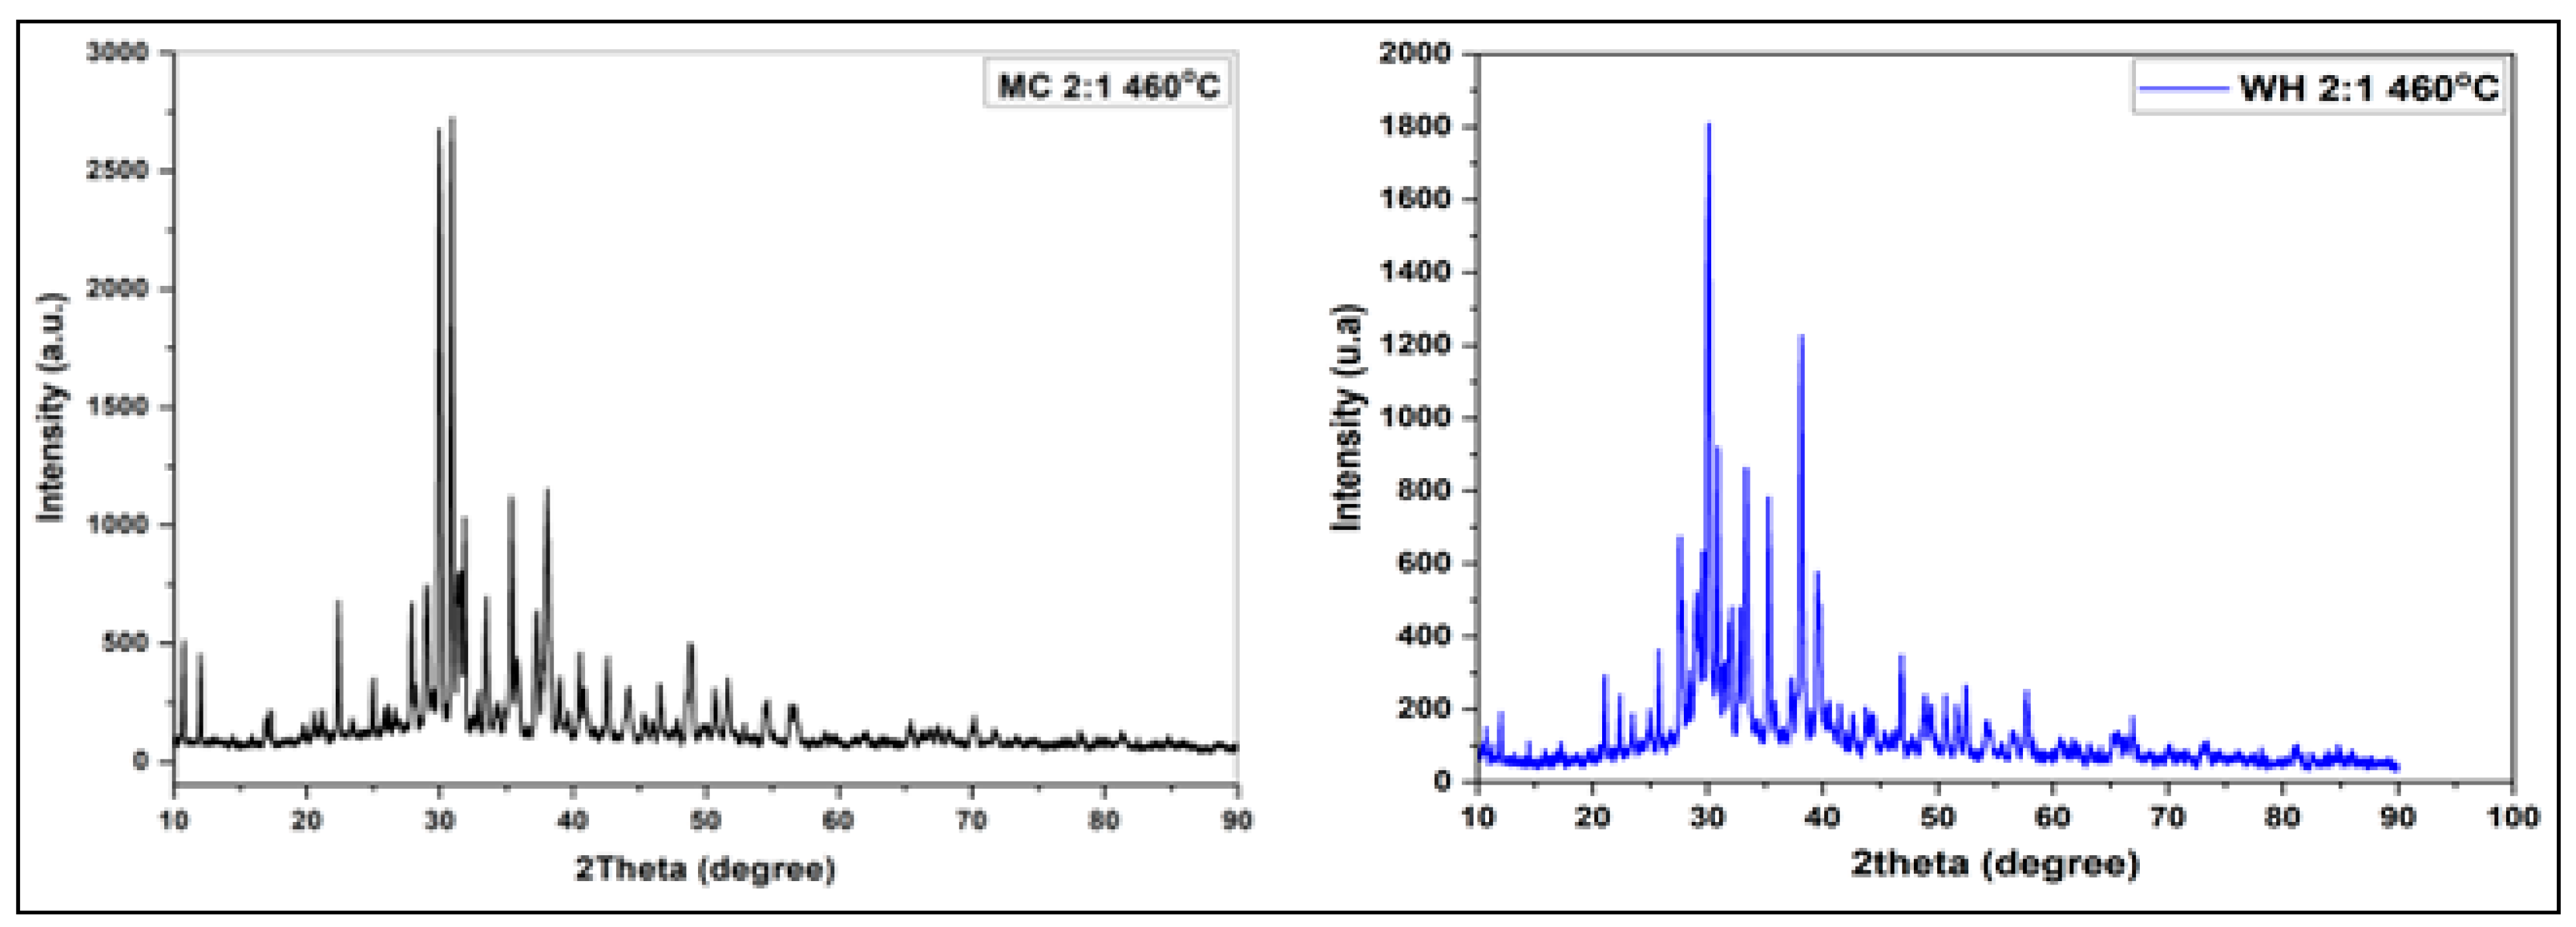
Figure 15.
Curves of the XRD patterns of activated carbon at 700oC from Millet Cob (MC): a) KOH/MC 1:1, b) KOH/MC 2:1, c) KOH/MC 5:1, d) pure graphite and from Water Hyacinth: e) KOH/WH 1:1, f) KOH/WH 2:1, g) KOH/WH 5:1, h) pure graphite.
Figure 15.
Curves of the XRD patterns of activated carbon at 700oC from Millet Cob (MC): a) KOH/MC 1:1, b) KOH/MC 2:1, c) KOH/MC 5:1, d) pure graphite and from Water Hyacinth: e) KOH/WH 1:1, f) KOH/WH 2:1, g) KOH/WH 5:1, h) pure graphite.
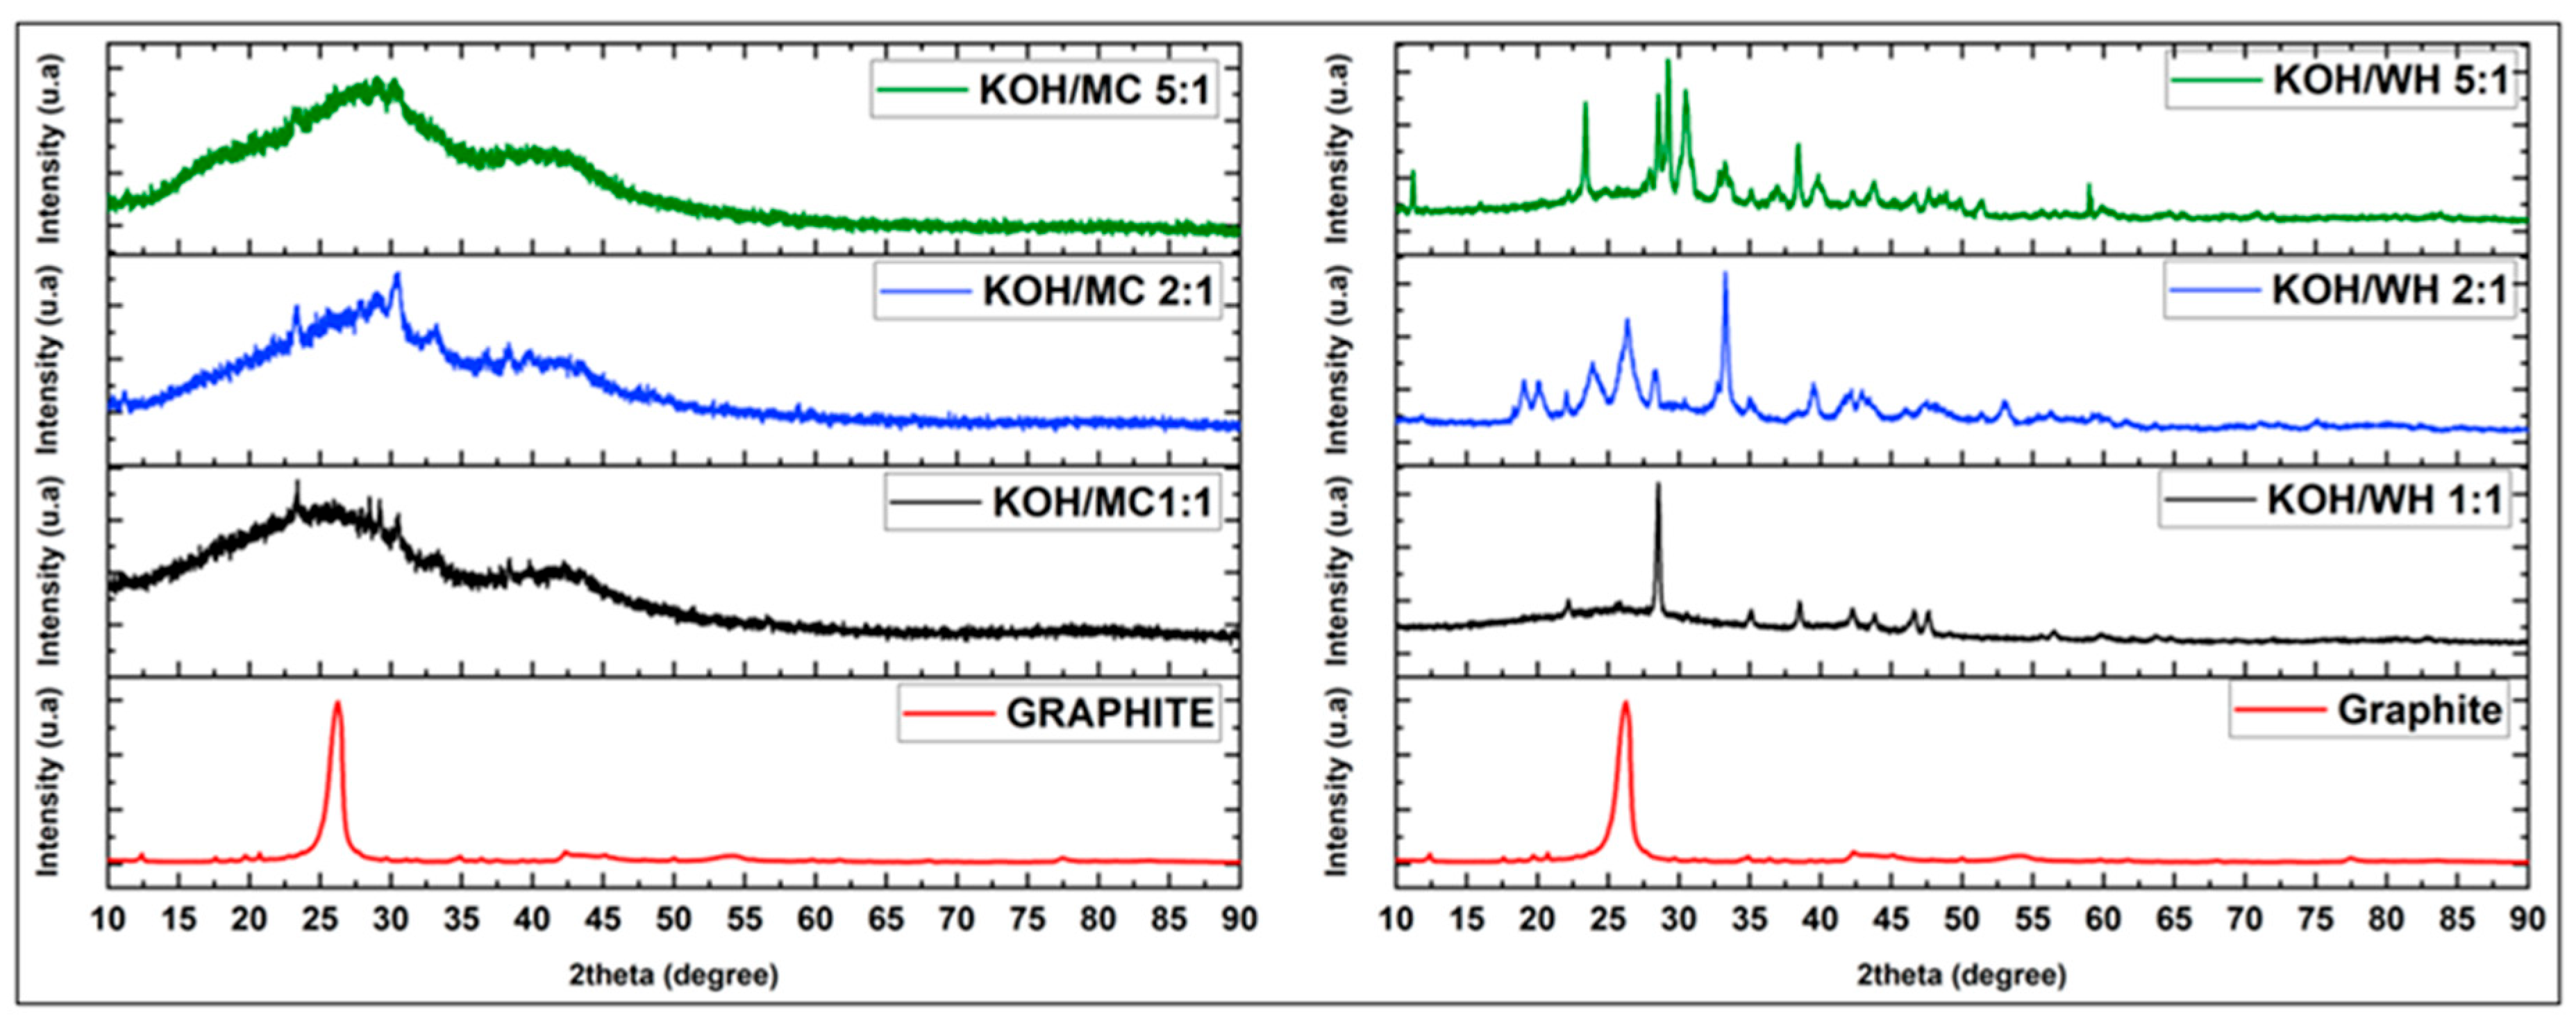
Figure 16.
Charge/discharge (Li/C) at C/24 KOH/MC 1:1, 2:1.5:1 and KOH/WH 1:1, 2:1, 5:1.
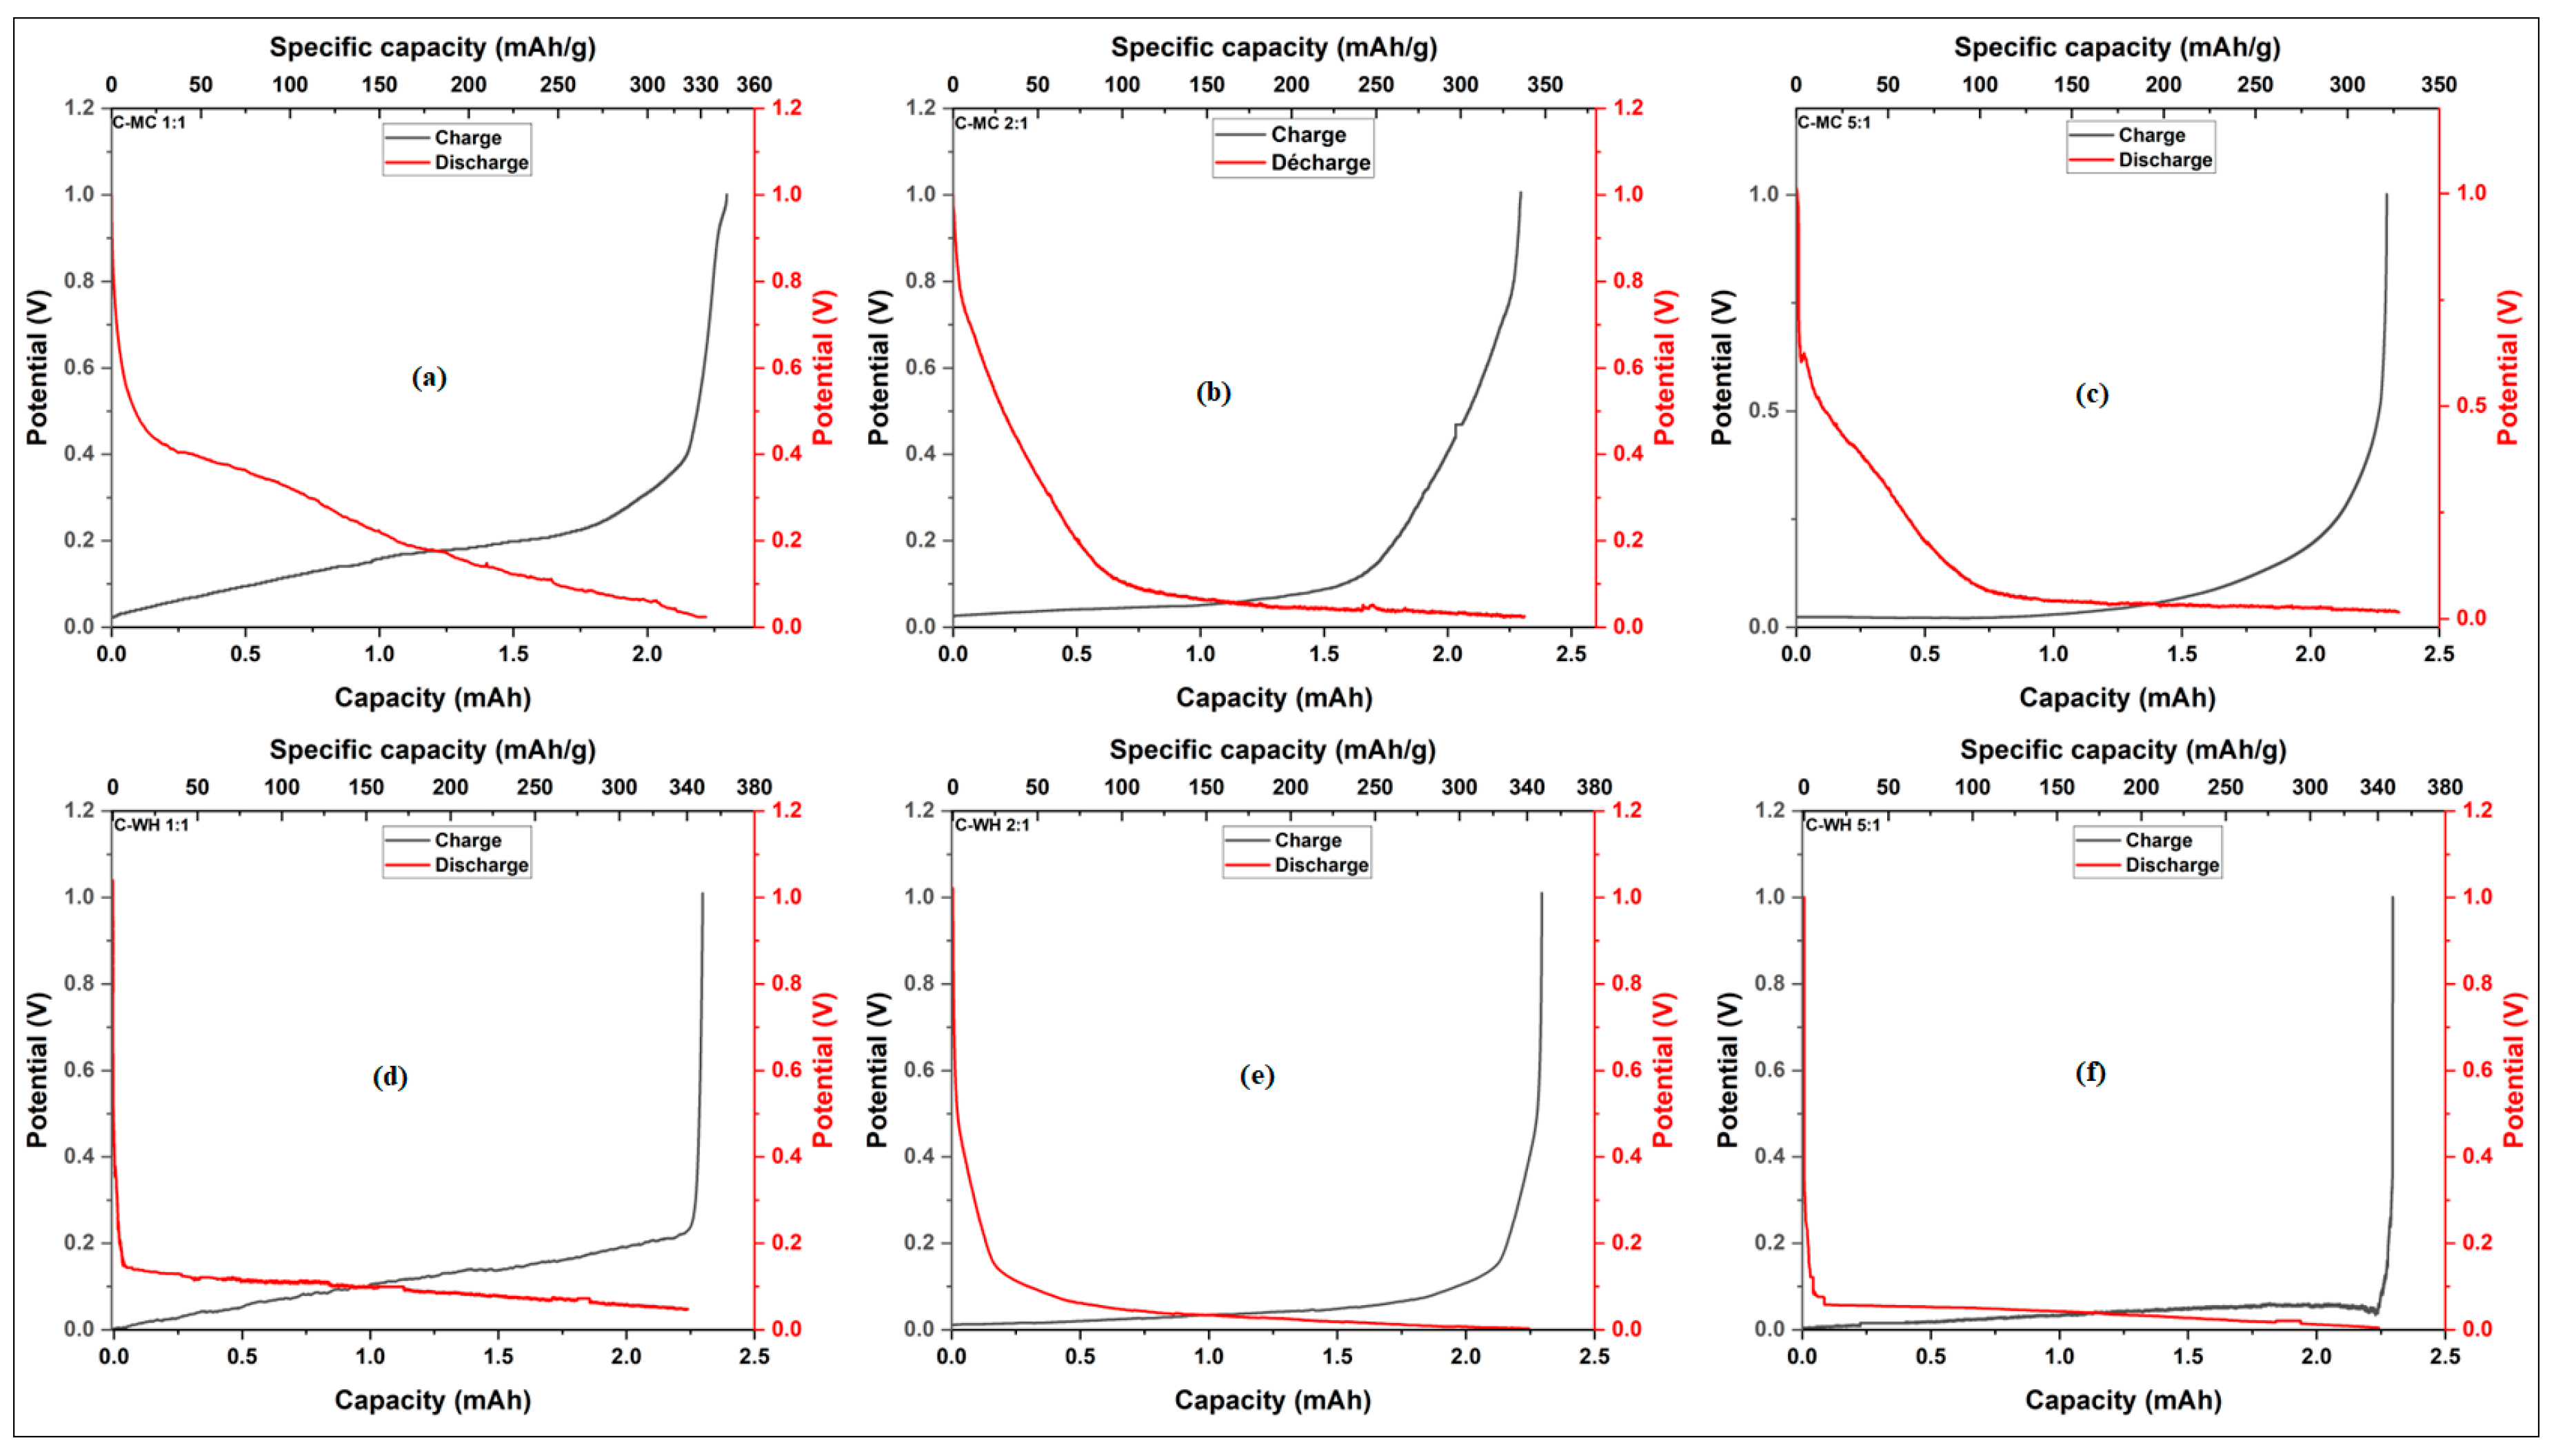
Figure 17.
Charge/discharge (Li/commercialGraphite) at C24.
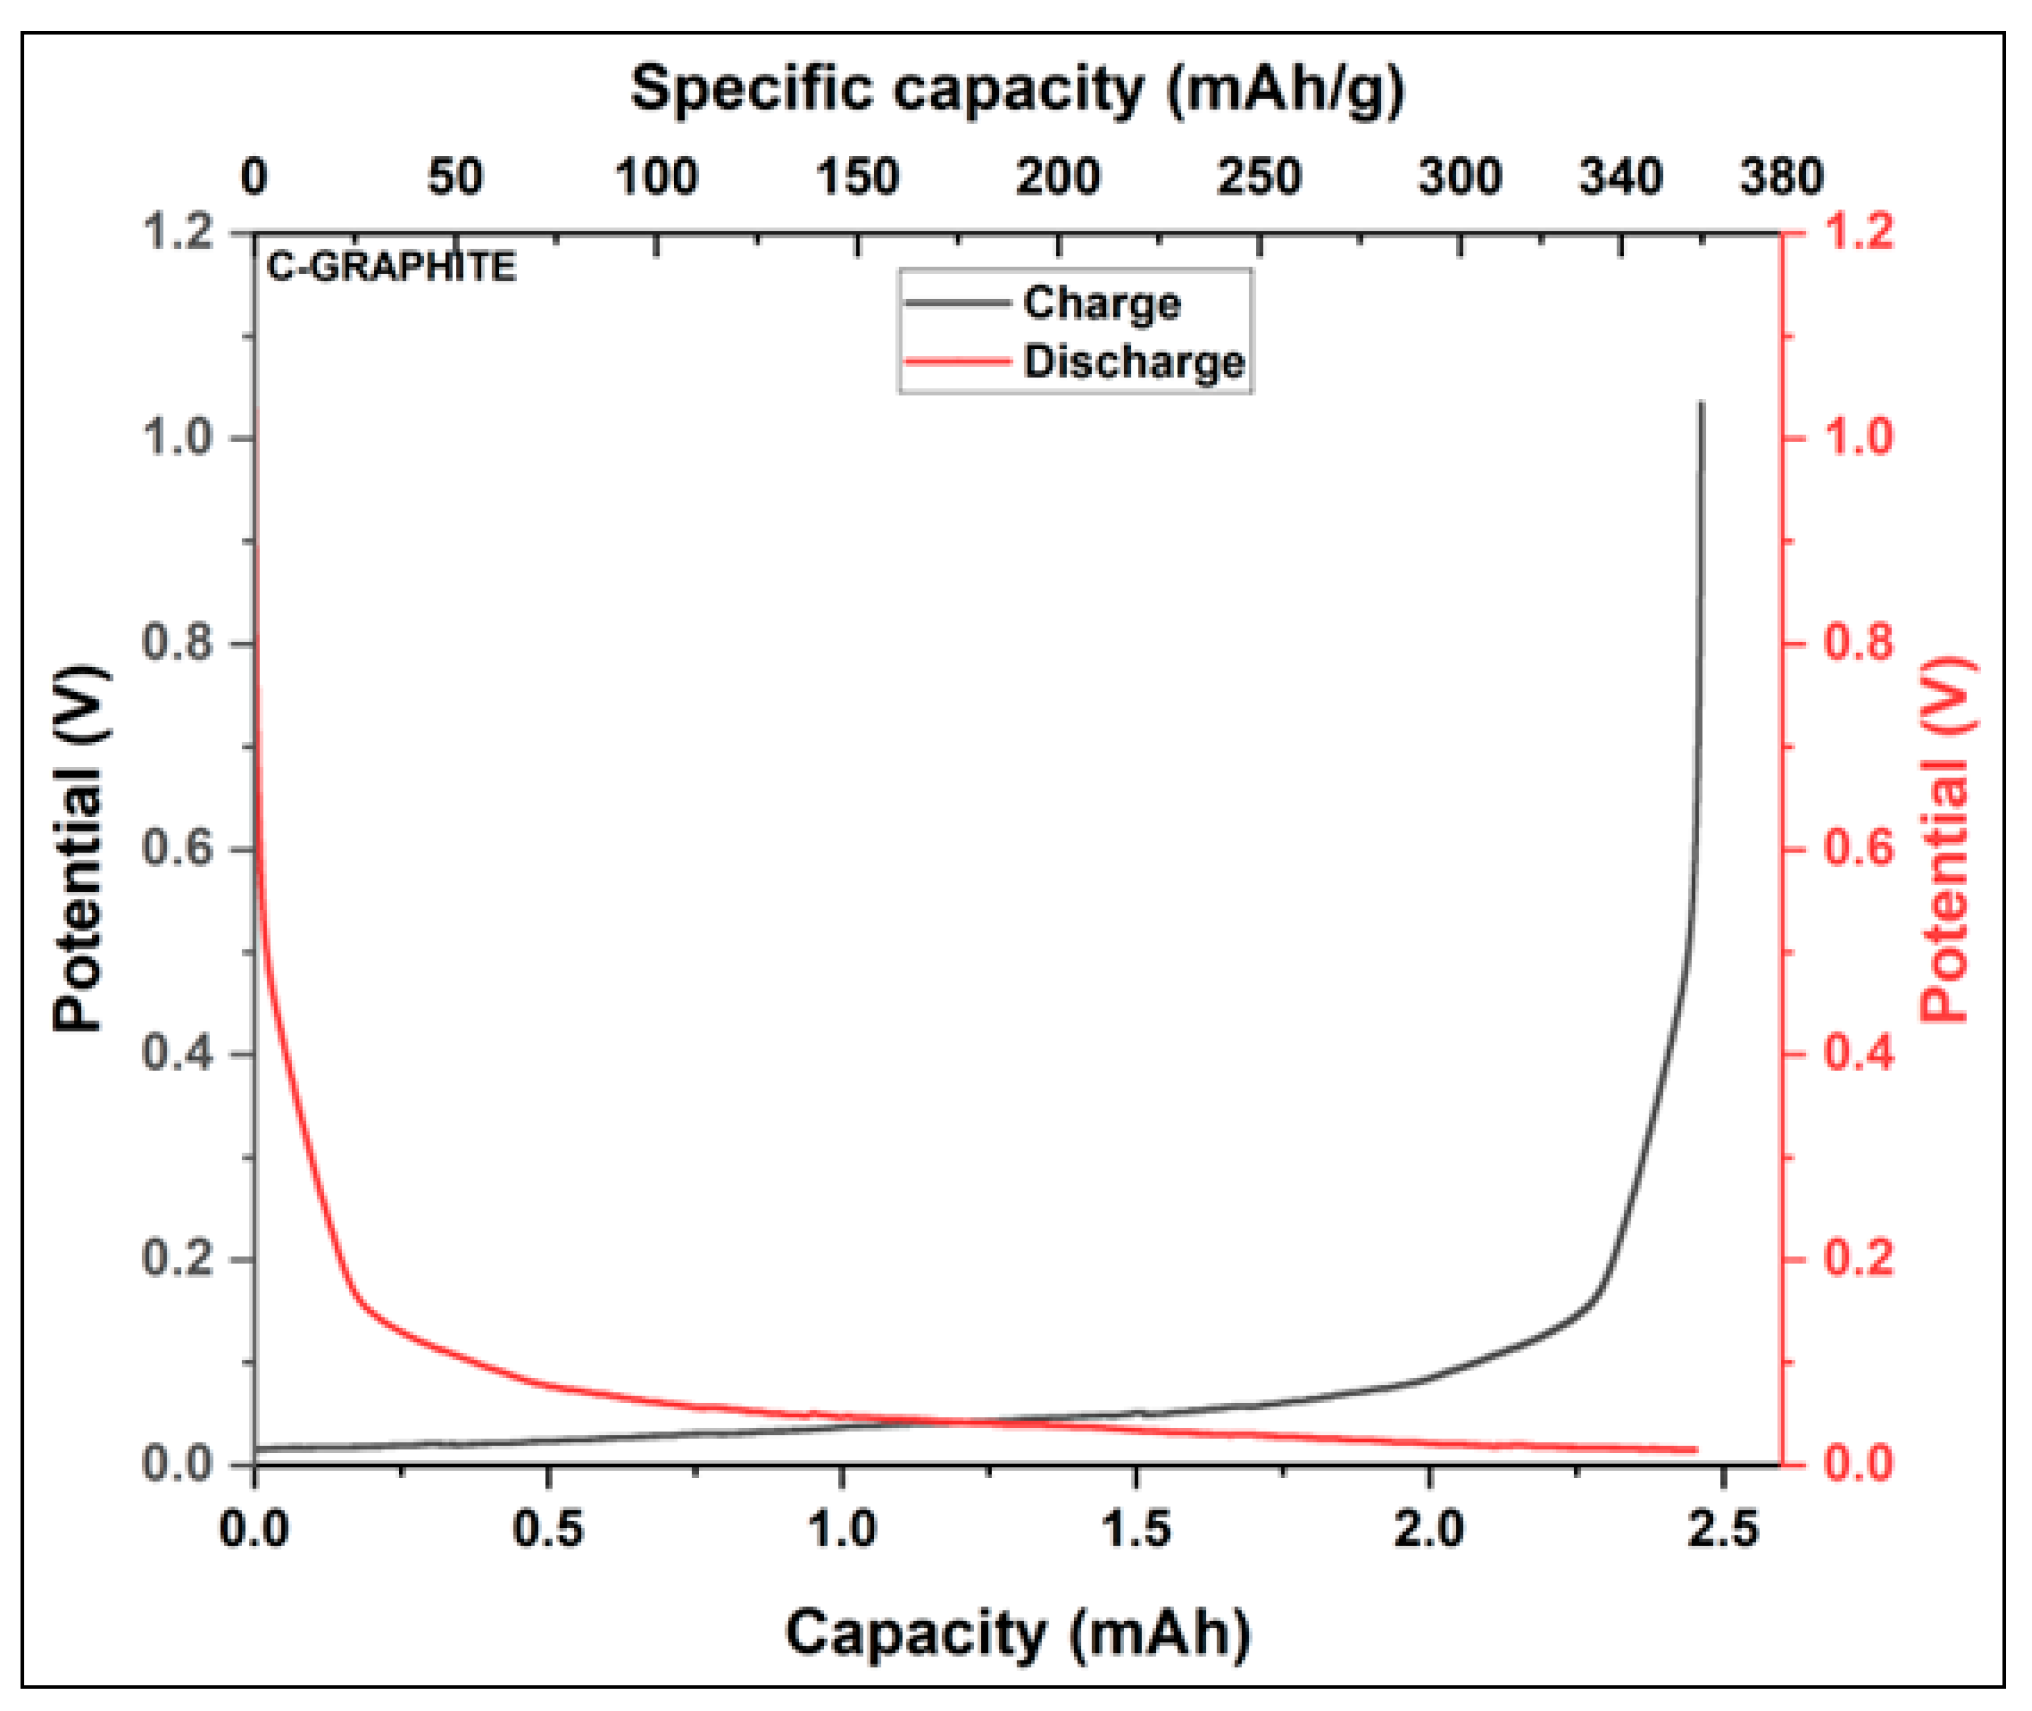
Figure 19.
Discharge curves at different current rates for LiFePO4/C samples from millet cob.
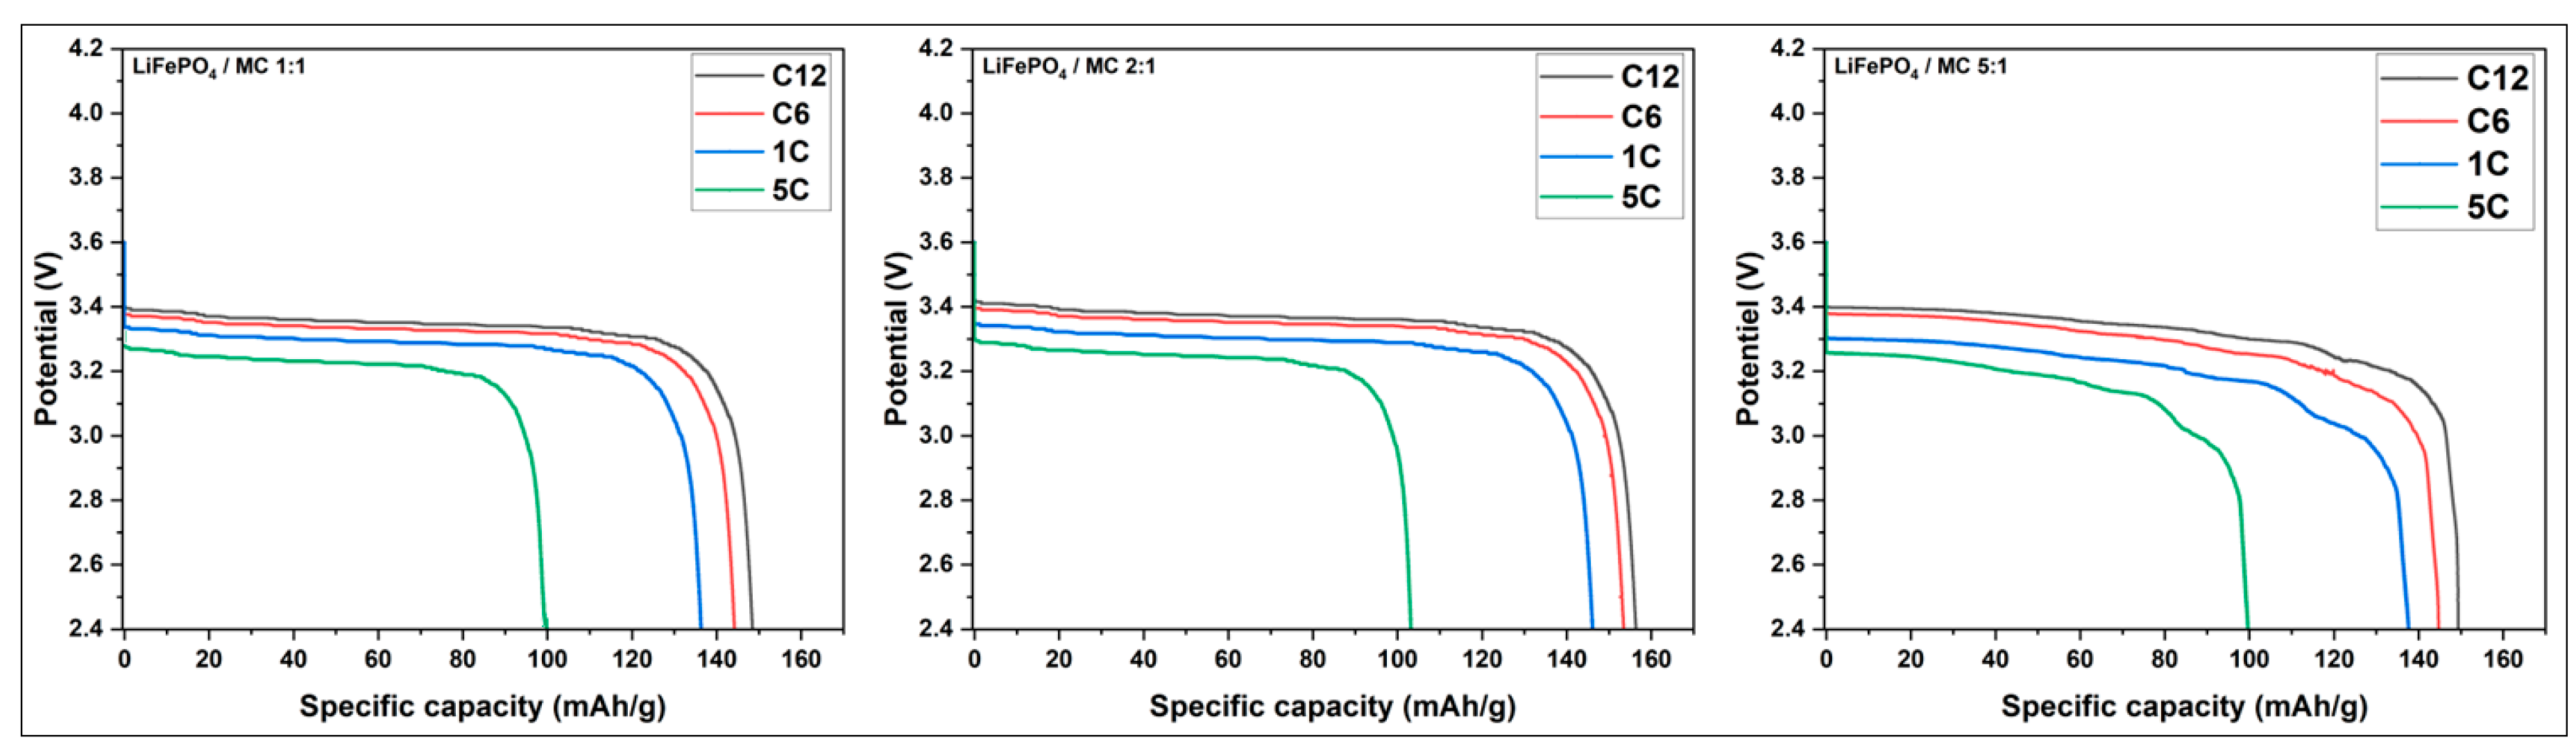
Figure 20.
Discharge curves at different current rates for LiFePO4/C samples (water hyacinth).
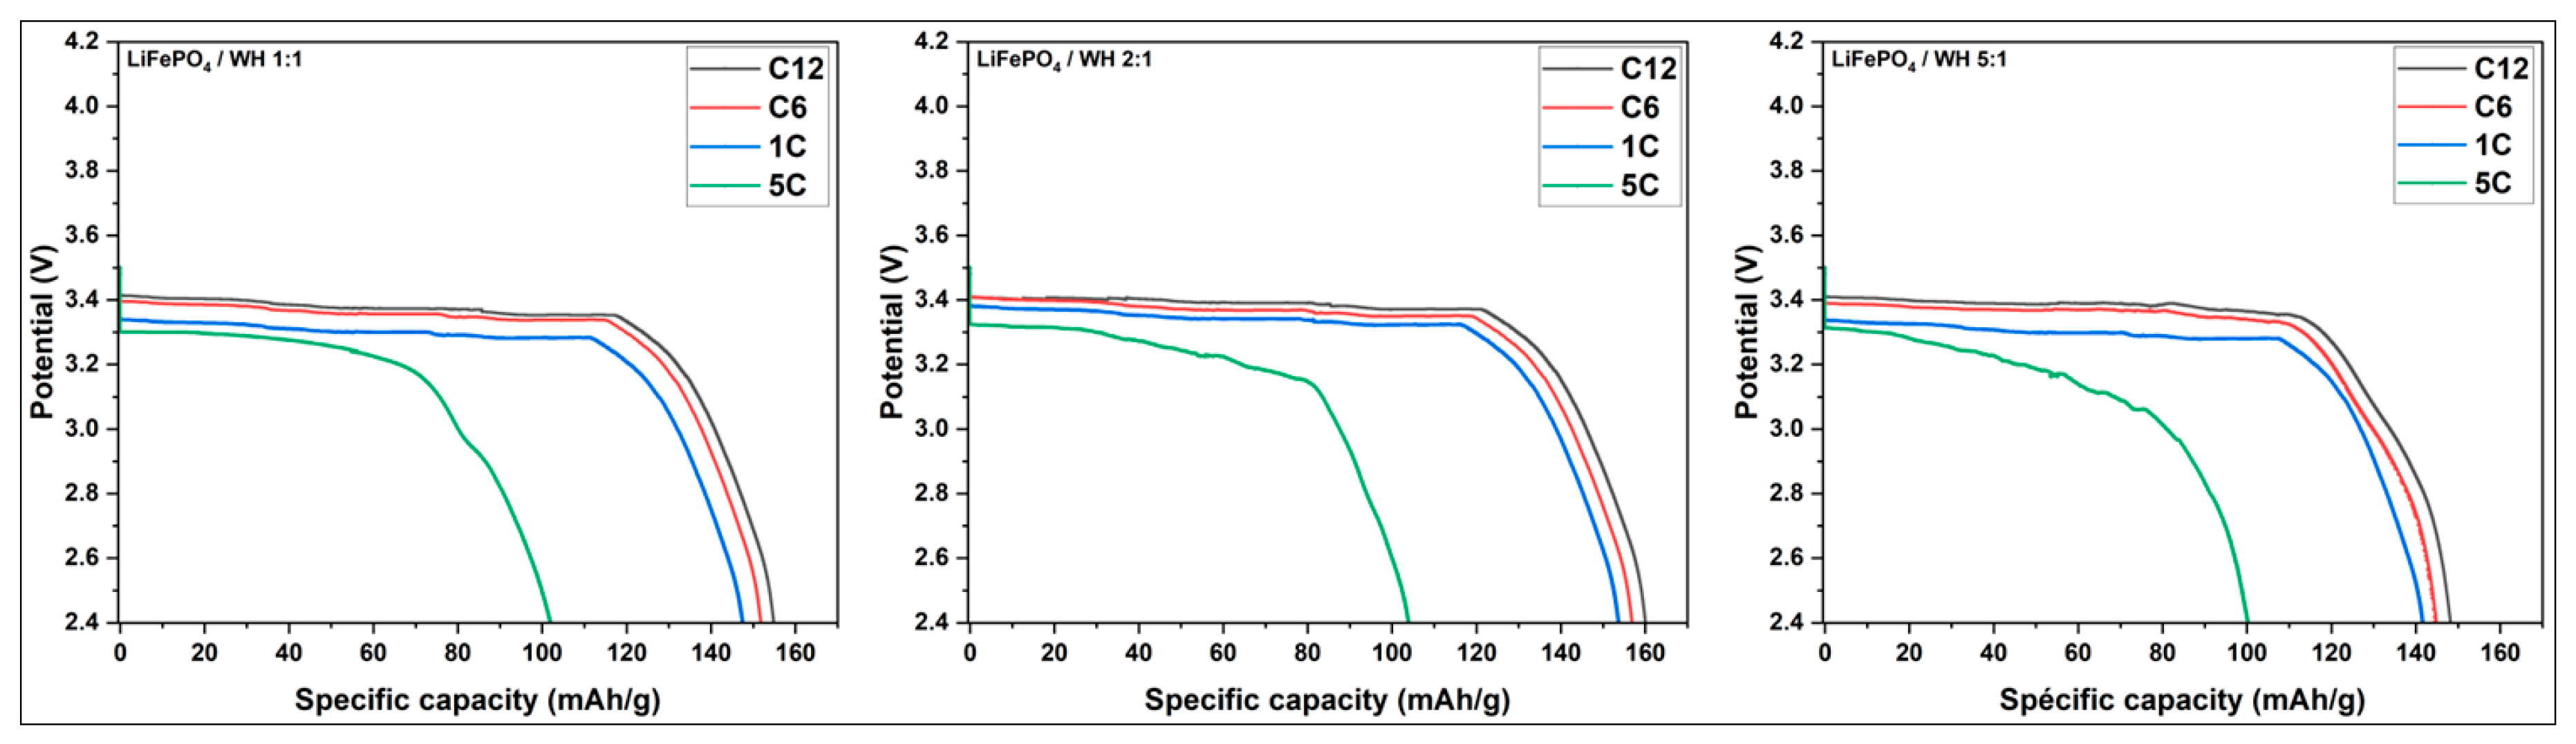
Figure 21.
Cycling discharge curves at different rates for LiFePO4/C samples.
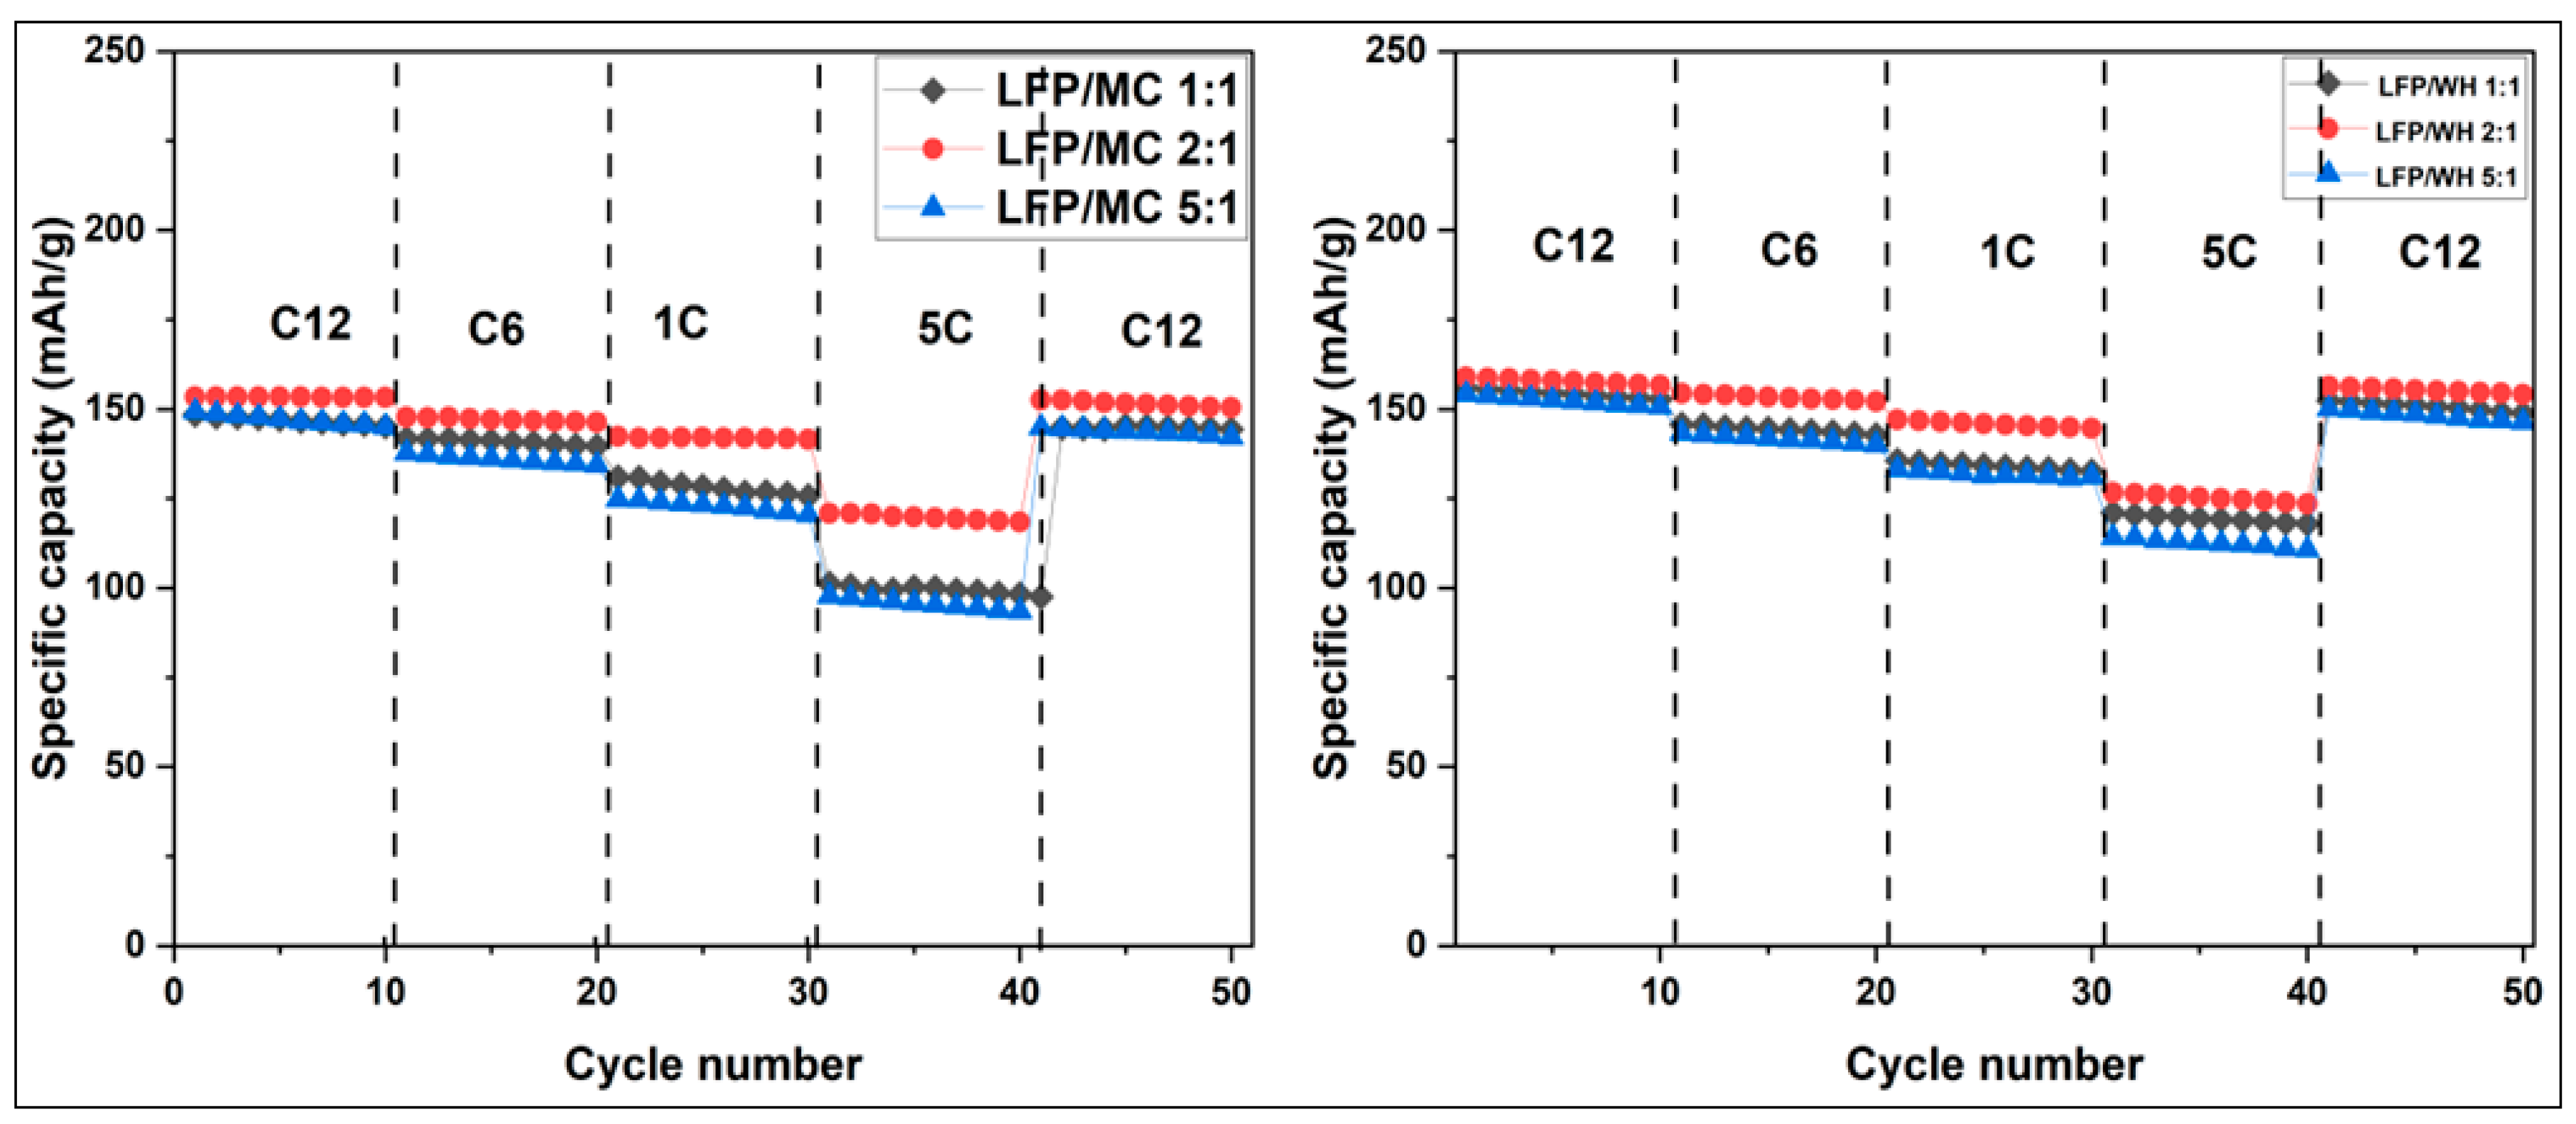
Figure 22.
Nyquist plot of EIS for LiFePO4/C (millet cob carbon).
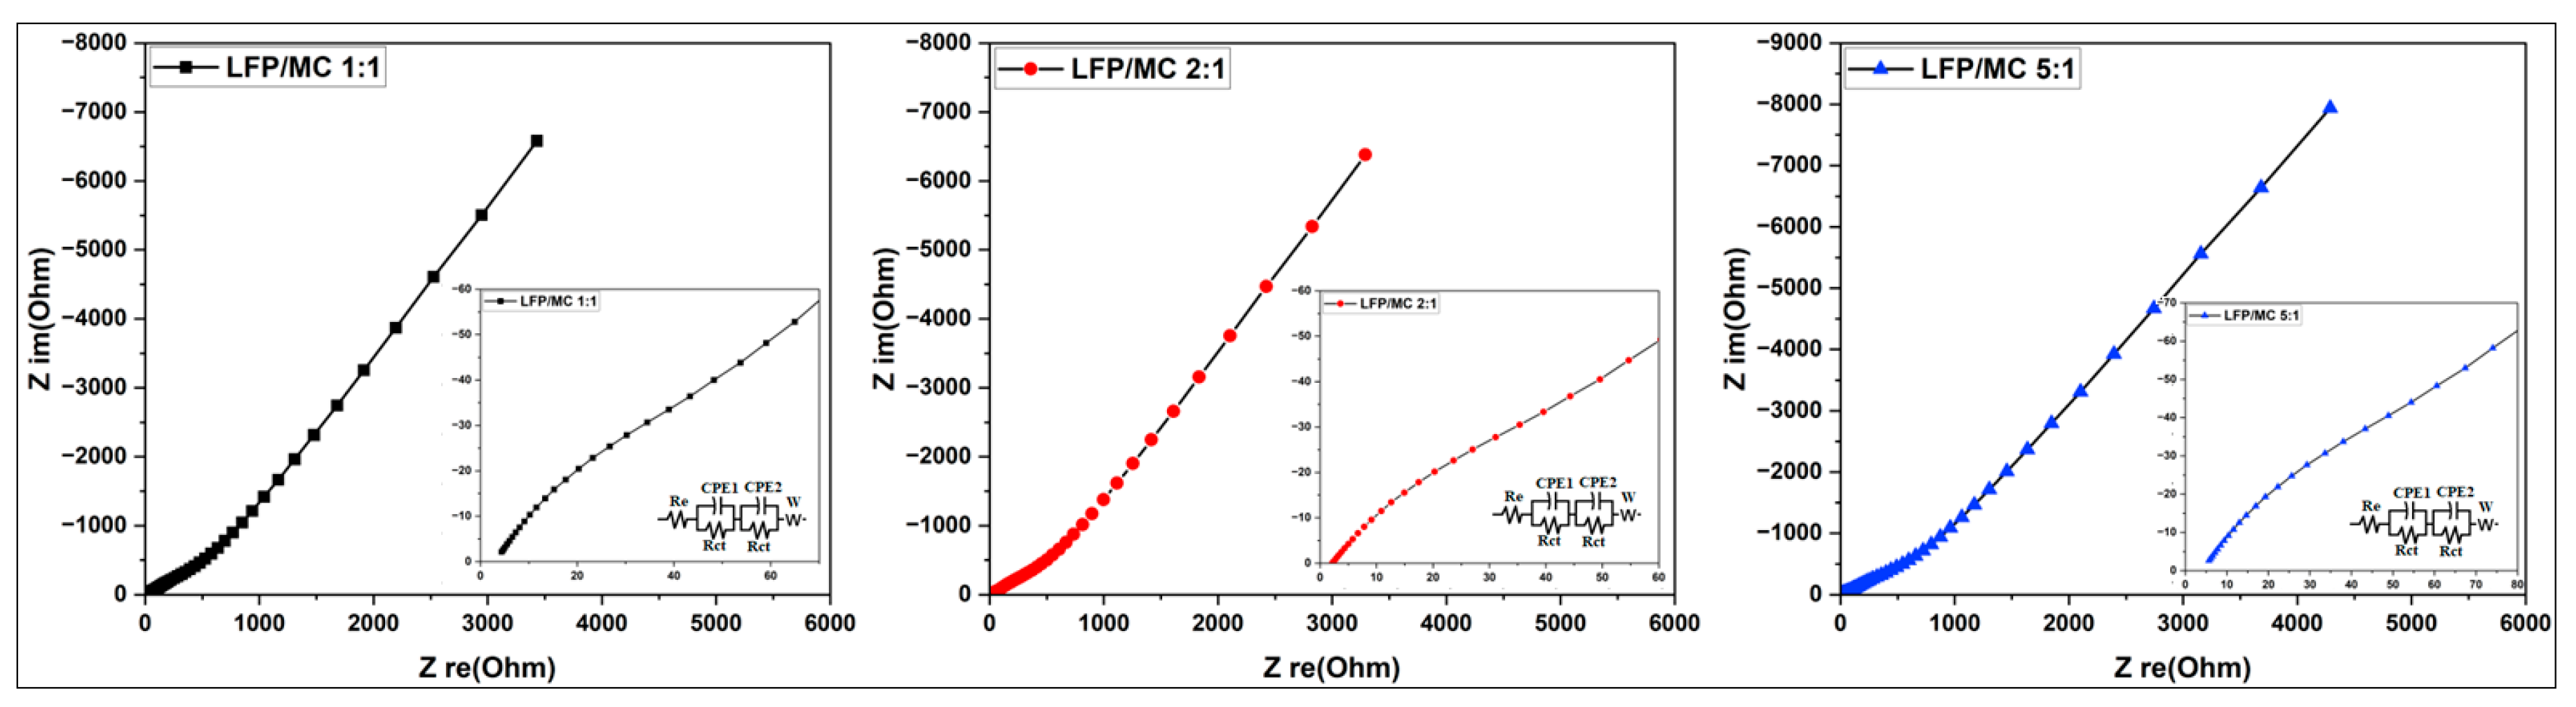
Figure 23.
Nyquist plot of EIS for LiFePO4/C (water hyacinth carbon).
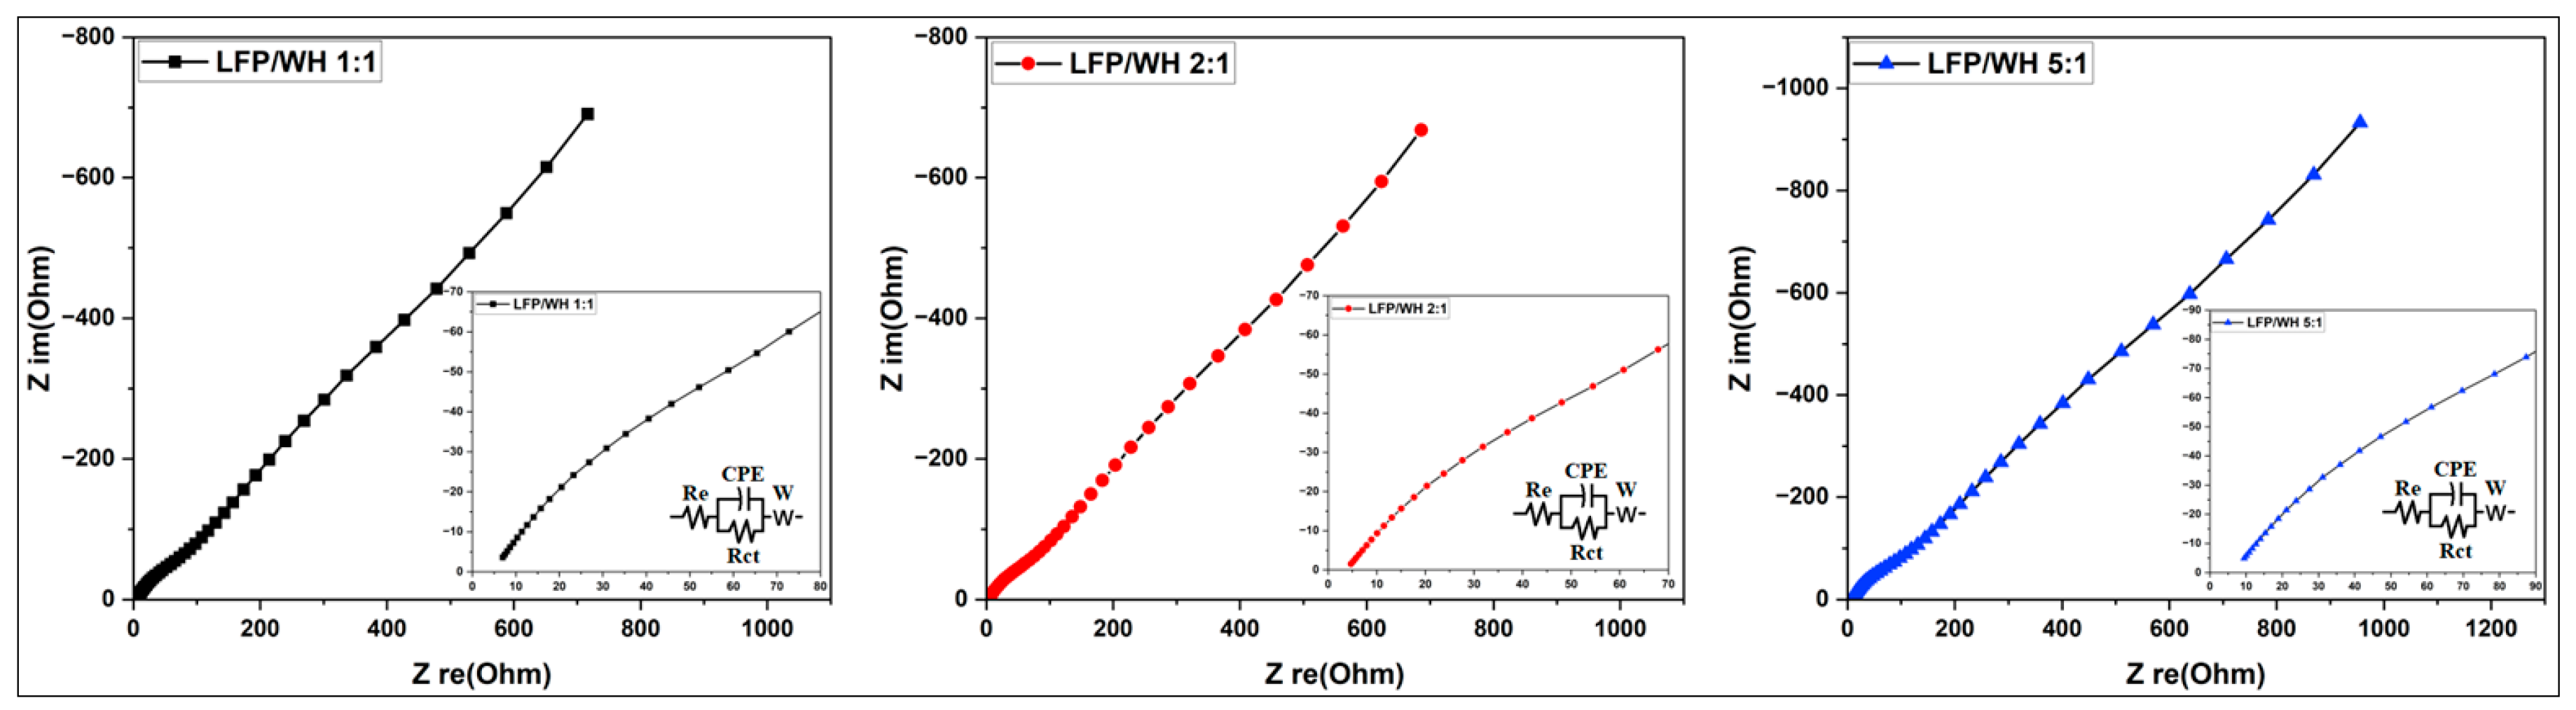
Figure 24.
Relationship between Zre and ω-1/2 at low frequencies of LiFePO4/C.
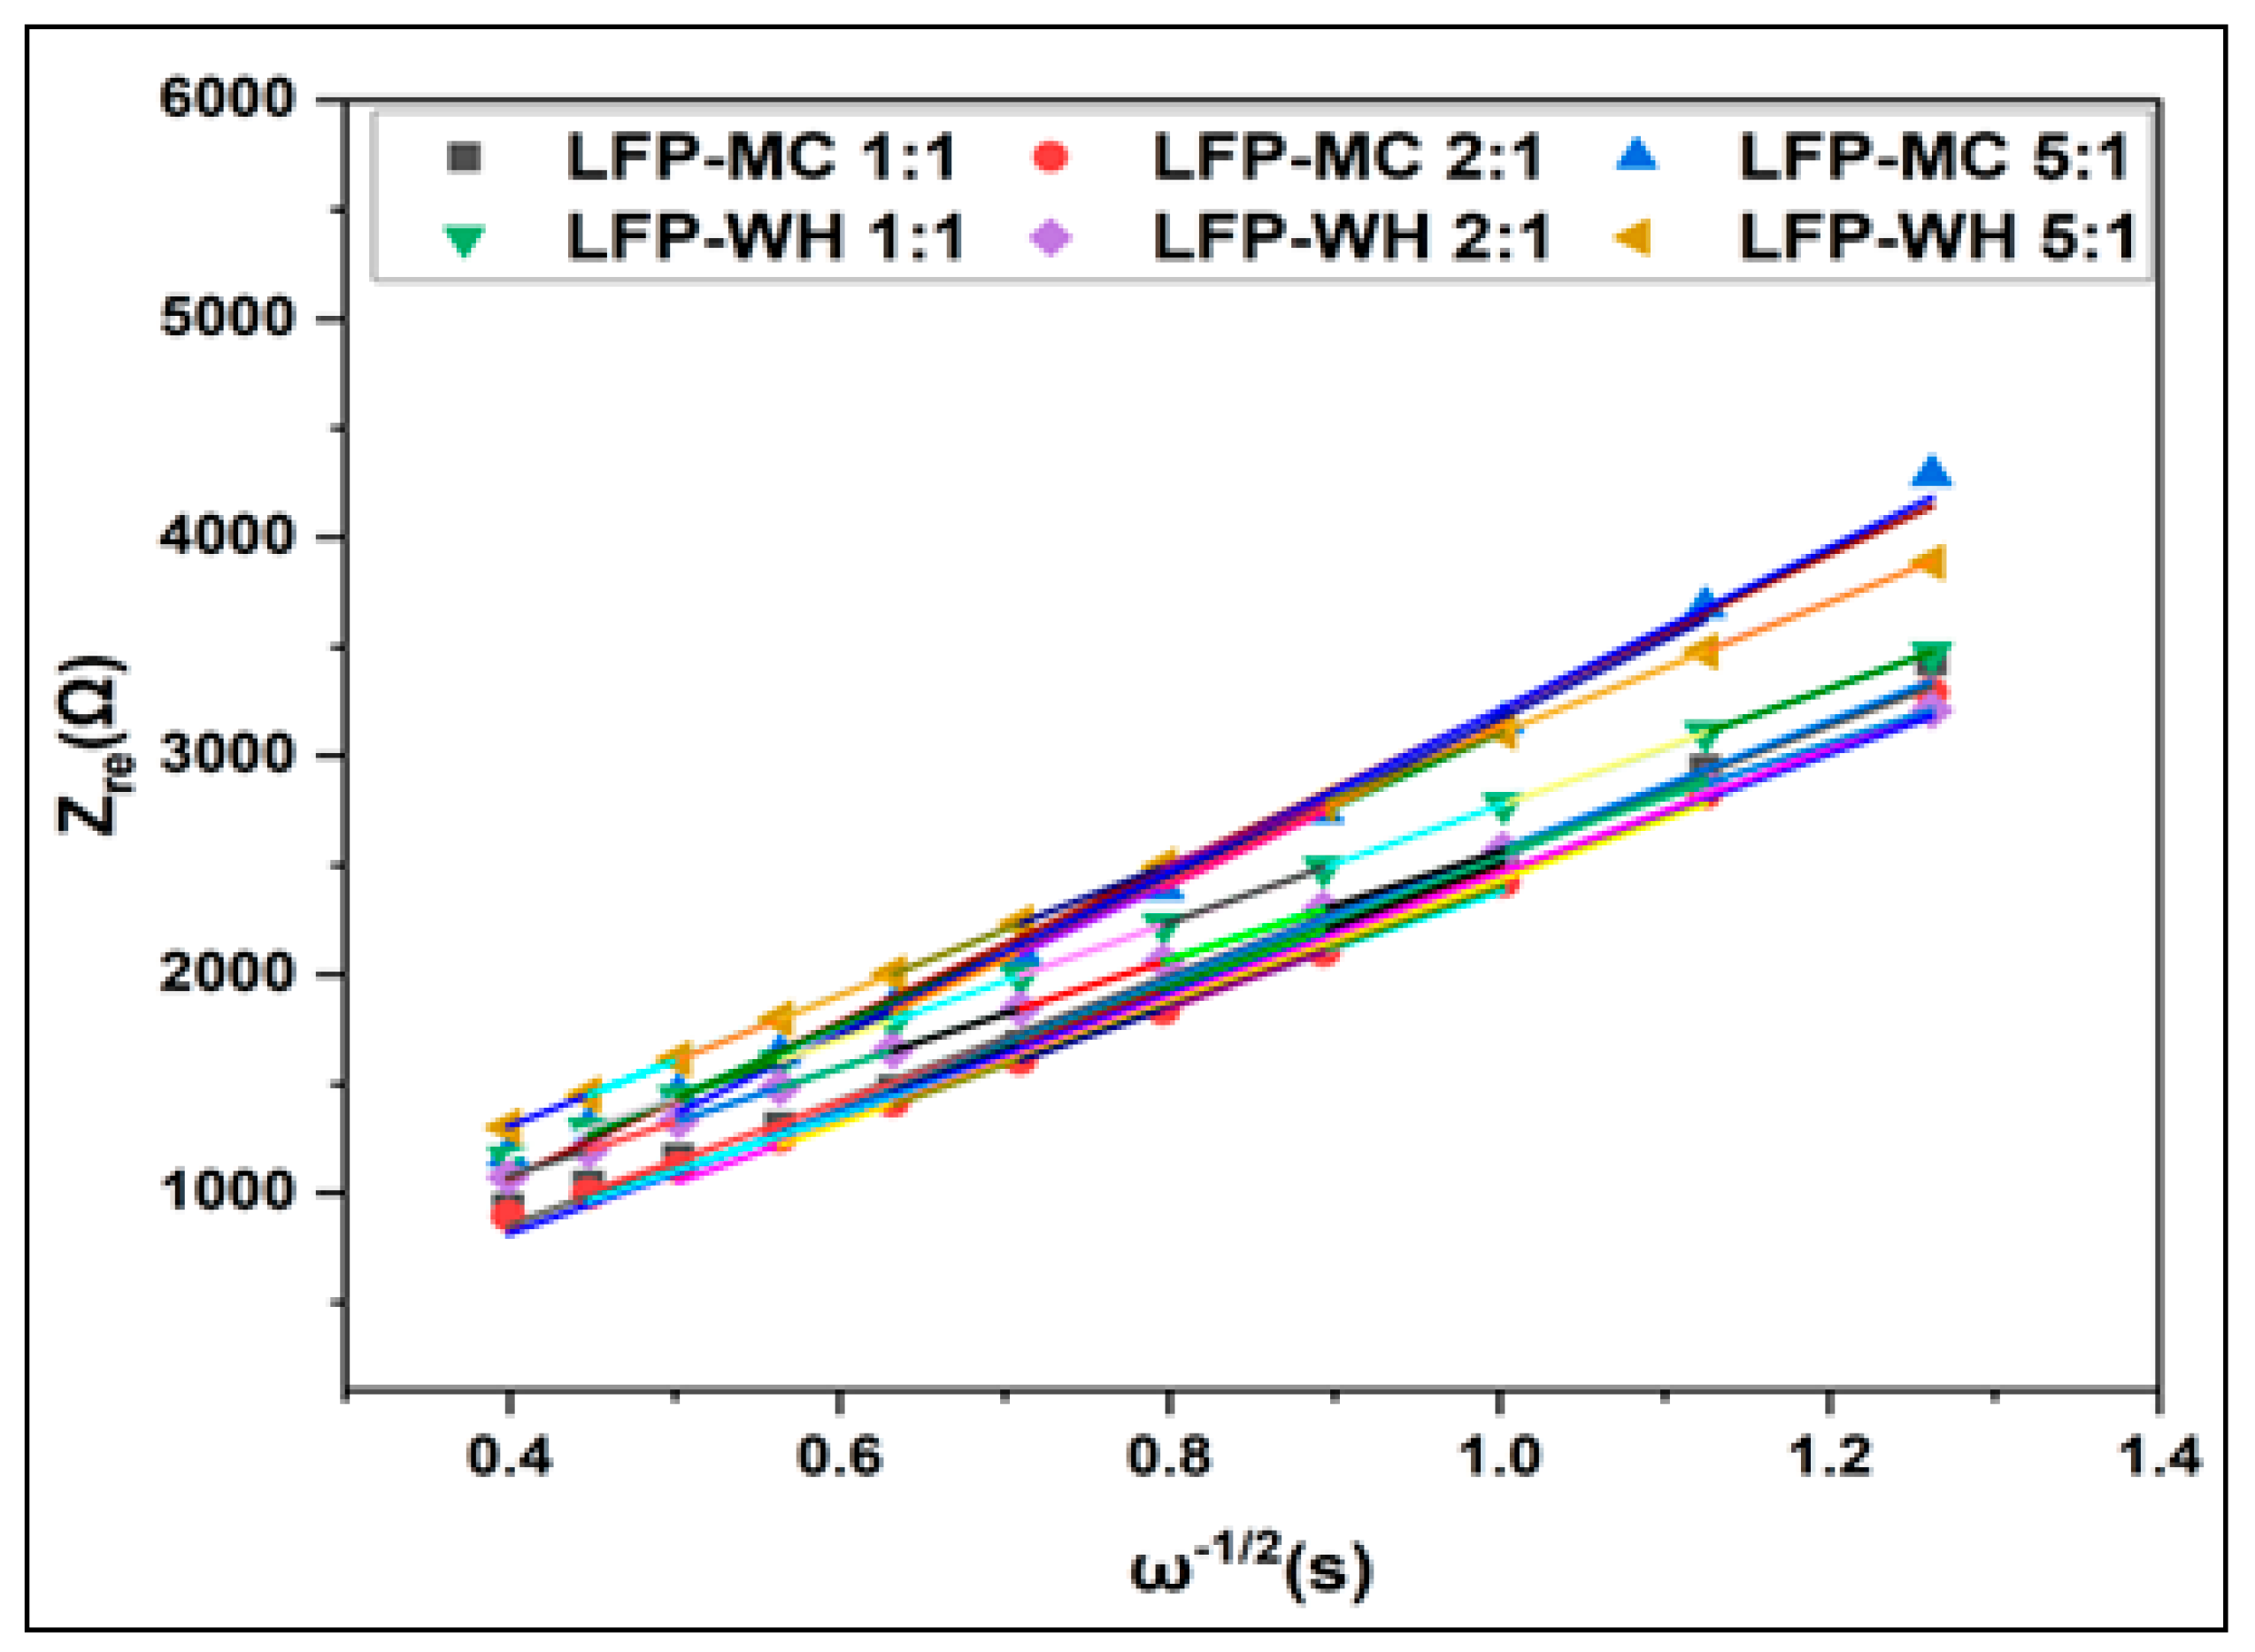
Figure 25.
Discharge curves (a), Nyquist plot (b), Zre (ω-1/2) (c) curves of LFP/Graphite.
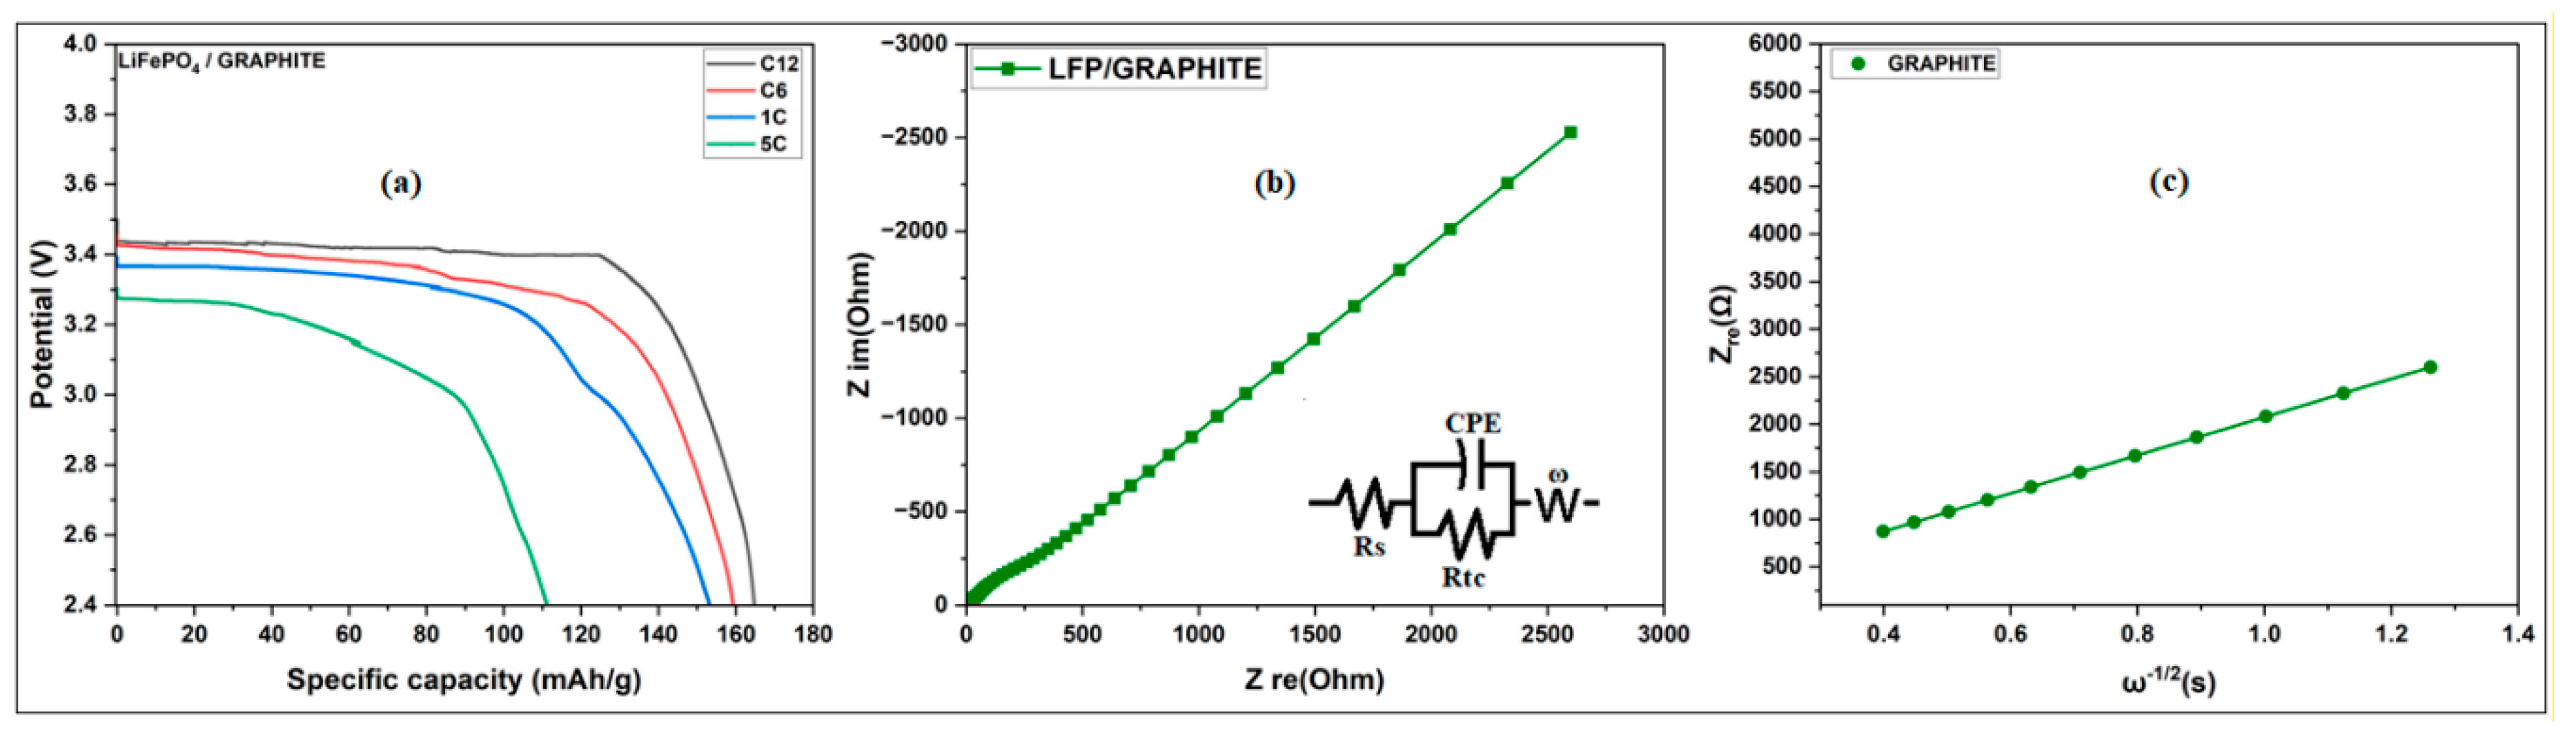
Table 1.
Specific surface area and pore characteristics of LiFePO4 powder.
| Sample | BET surface area (m2/g) | Total pore volume (cm3/g) | Vmicropore (cm3/g) | Vmesopore (cm3/g) | Average pore diameter (nm) |
| LiFePO4 | 1.2012 | 0.0014 | 0.0005 | 0.0009 | 4.6620 |
Table 2.
Surface properties of carbon samples.
| Sample | BET Surface area (m2/g) | Total pore volume (cm3/g) | Vmicropore (cm3/g) | V mesopore (cm3/g) | Average pore diameter (nm) |
| WH 1:1 | 413.03 | 0.2376 | 0.2031 | 0.0343 | 2.3001 |
| WH 2:1 | 83.17 | 0.0774 | 0.0391 | 0.0382 | 3.7181 |
| WH 5:1 | 18.53 | 0.0389 | 0.0075 | 0.0129 | 8.3790 |
| MC 1:1 | 216.34 | 0.1286 | 0.1043 | 0.0243 | 2.3778 |
| MC 2:1 | 95.75 | 0.0787 | 0.0469 | 0.0311 | 3.2878 |
| MC 5:1 | 57.79 | 0.0763 | 0.0280 | 0.0480 | 5.2819 |
Table 3.
Chemical composition of activated carbon from MC and WH at 460°C.
| Samples | KOH/CM | C (%) | O (%) | K (%) | Na (%) | Cl (%) | Al (%) | Si (%) | Mg (%) | P (%) |
| MC 460oC | 2 : 1 | 30 | 33 | 35 | - | - | 0.2 | 1.7 | 0.1 | - |
| WH 460oC | 2 : 1 | 26 | 41 | 30 | 0.3 | 1.4 | 0.1 | 0.4 | 0.3 | 0.1 |
Table 4.
Chemical Composition of Millet cob and Water Hyacinth Activated Carbon at 700°C.
| Samples | KOH/C | Chemical elements (% mass) | |||||||||||
| C | O | K | Na | Cl | Al | Si | Fe | Ca | Mg | S | P | ||
| Millet cob | 1 : 1 | 85.5 | 12 | 2 | - | 0.3 | - | 0.2 | - | - | |||
| 2 : 1 | 71.5 | 19 | 6 | 0.1 | 0.8 | 0.8 | 1.1 | 0.1 | 0.1 | 0.1 | 0.4 | - | |
| 5 : 1 | 71 | 20 | 8.3 | - | 0.1 | 0.2 | 0.3 | - | - | - | 0.1 | - | |
| Water hyacinth | 1 : 1 | 80 | 13 | 2 | - | 2 | 0.2 | 0.5 | 0.4 | 0.8 | 0.1 | 0.9 | 0.1 |
| 2 : 1 | 70 | 18 | 8 | 0.1 | 1.8 | 0.2 | 0.7 | 0.1 | 0.6 | 0.2 | 0.2 | 0.1 | |
| 5 : 1 | 70 | 18 | 8 | 0.1 | 2.4 | 0.1 | 0.4 | 0.2 | 0.2 | 0.1 | 0.5 | - | |
Table 5.
Evolution of electrical conductivity as a function of the mixing ratio of potassium hydroxide and activated carbon materials KOH/CM: CM= Carbon Materials.
Table 5.
Evolution of electrical conductivity as a function of the mixing ratio of potassium hydroxide and activated carbon materials KOH/CM: CM= Carbon Materials.
| Sample | Mixing ration (KOH/CM) | Electrical conductivity (S.cm-1) | Total pore volume (cm3/g) | Average pore diameter (nm) | |
| Millet cob | 1 : 1 | 6,74 10-3 | 0.2376 | 2.3001 | |
| 2 : 1 | 8,42 10-3 | 0.0774 | 3.7181 | ||
| 5 : 1 | 4,99 10-3 | 0.0389 | 8.3790 | ||
| Water hyacinth | 1 : 1 | 8,92 10-3 | 0.1286 | 2.3778 | |
| 2 : 1 | 1,47 10-2 | 0.0787 | 3.2878 | ||
| 5 : 1 | 6,40 10-3 | 0.0763 | 5.2819 |
Table 6.
Specific capacity (mAh/g) of the activated carbons based on Millet Cob (MC)and Water Hyacinth (WH)h obtained from different ratios of KOH/CM. where CM = carbon materials.
Table 6.
Specific capacity (mAh/g) of the activated carbons based on Millet Cob (MC)and Water Hyacinth (WH)h obtained from different ratios of KOH/CM. where CM = carbon materials.
| Mixing ratio (KOH/CM) | Mixing ratio (KOH/CM) | Mixing ratio (KOH/CM) | ||
| Sample | 1.1 | 2:1 | 5:1 | |
| Millet cob | 333 | 335 | 330 | |
| Water hyacinth | 336 | 339 | 332 |
Table 7.
Coulombic efficiency of the first three cycles of LiFePO4/C.
| Samples | Coulombic efficiency (%) +/- 1% | ||
| Cycle 1 | Cycle 2 | Cycle 3 | |
| LFP/MC 1:1 | 95.02 | 100 | 99.79 |
| LFP/MC 2:1 | 95.86 | 100 | 99.82 |
| LFP/MC 5:1 | 95.48 | 100 | 99.73 |
| LFP/WH 1:1 | 96.05 | 100 | 99.88 |
| LFP/WH 2:1 | 96.36 | 100 | 99.96 |
| LFP/WH 5:1 | 95.88 | 100 | 99.84 |
Table 8.
Specific capacities (Sc) of LiFePO4/C samples derived from millet cob.
| Current rate | SC (mAh/g) MC 1:1 | SC (mAh/g) MC 2:1 | SC (mAh/g) MC 5:1 |
| C12 | 152 | 160 | 149 |
| C6 | 148 | 157 | 145 |
| 1C | 140 | 150 | 138 |
| 5C | 102 | 106 | 100 |
Disclaimer/Publisher’s Note: The statements, opinions and data contained in all publications are solely those of the individual author(s) and contributor(s) and not of MDPI and/or the editor(s). MDPI and/or the editor(s) disclaim responsibility for any injury to people or property resulting from any ideas, methods, instructions or products referred to in the content. |
© 2025 by the authors. Licensee MDPI, Basel, Switzerland. This article is an open access article distributed under the terms and conditions of the Creative Commons Attribution (CC BY) license (http://creativecommons.org/licenses/by/4.0/).
Copyright: This open access article is published under a Creative Commons CC BY 4.0 license, which permit the free download, distribution, and reuse, provided that the author and preprint are cited in any reuse.


