Submitted:
21 May 2025
Posted:
22 May 2025
You are already at the latest version
Abstract
This research develops a mix design method for aggregates based on concrete workability, building upon the binary system model of paste and aggregate. The calculation model for aggregate packing density was refined by excluding particles smaller than 75μm and considering the inter-particle interactions among multiple aggregate size fractions. A method for calculating the specific surface area of the aggregate system, accounting for the particle size distribution within individual fractions and particle morphology based on the Cowley model, was established. This study proposes that the inter-particle spacing of aggregates is a crucial parameter for ensuring concrete workability. Consequently, an optimized aggregate proportioning method is presented, aiming to minimize paste volume while maintaining a fixed paste layer thickness around the aggregates.
Keywords:
Aggregate mix design
; Packing density
; Paste volume minimization
; Specific surface area
; Inter-particle spacing
1. Introduction
Concrete, a widely utilized construction material, holds a pivotal position in the global building industry due to its low cost, high workability, and excellent durability[1,2]. The paste-aggregate binary system model treats fresh concrete as a two-phase solid-liquid fluid system where aggregates are uniformly dispersed within the paste. Within this framework, the aggregate volume fraction and paste rheology are two critical parameters governing concrete workability. Compared to paste, aggregates offer the advantages of lower cost and superior volume stability. Appropriately increasing the aggregate volume fraction not only helps reduce concrete production costs and carbon emissions[3,4] but also significantly enhances its volume stability.
The performance parameters of the aggregate system exert a significant influence on concrete properties and are crucial factors to consider during concrete performance optimization. F. Mahaut[5] experimentally investigated the impact of aggregate volume fraction on the yield stress and thixotropy of concrete. L. G. Li[6] observed experimentally that increasing aggregate volume fraction leads to a decrease in concrete slump. S. A. Martini[7] found that the maximum size of coarse aggregates significantly affects the workability of self-consolidating concrete. K. A. Ostrowski [8] reported a notable influence of coarse aggregate particle morphology on the strength and flowability of self-consolidating concrete. R. Figmig[9] studied the effect of aggregate gradation on concrete workability. P. Goltermann[10] analyzed the impact of aggregate packing density on concrete workability, and J. Hu[11] systematically investigated the influence of aggregates on concrete flowability. Parameters such as the packing density, particle morphology, gradation, and maximum size of the aggregate system all play a vital role in determining the flowability and mechanical properties of concrete[12]. Due to the complex interplay of these numerous variables, identifying an ideal optimum solution during concrete performance control or aggregate system optimization often proves challenging. To meet workability requirements, it is frequently necessary to increase the paste volume fraction to compensate for deficiencies in the aggregate system, consequently leading to higher concrete production costs and carbon emissions[13].
In fresh concrete, a portion of the paste fills the voids between aggregate particles, while the remaining paste uniformly coats the aggregate surfaces, creating a certain inter-particle spacing that ensures concrete flowability[14]. Paste layer thickness, as a key parameter quantifying the influence of paste and aggregates on concrete performance, is widely employed in relevant research [15]. A. K. H. Kwan [16]proposed that water film thickness, paste layer thickness, and mortar layer thickness can all serve as design parameters for controlling the flowability of fresh concrete. J. H. Lee [17] successfully predicted the yield stress of concrete and mortar using the paste layer thickness theory. L. G. Li [6] summarized concrete mix design methods based on paste layer thickness.
This study builds upon the paste-aggregate binary volume theory model, simplifying the multiple parameters of aggregate volume into two key indicators: packing void ratio and specific surface area. The existing theoretical model is revised and expanded to quantify the influence of aggregate particle morphology and gradation on concrete performance[18]. With the flowability of fresh concrete as the primary control objective, an aggregate proportioning optimization method is proposed to determine the mix with the minimum paste volume while maintaining a consistent inter-particle spacing[19].
The production of ordinary concrete often involves the use of manufactured aggregates[20], inevitably introducing a certain amount of fine powder components. Despite their relatively low mass fraction, these fine particles possess a large specific surface area, significantly impacting concrete flowability[21]. To reasonably assess the role of fine powder in workability, the paste-aggregate binary system model classifies particles smaller than 75 μm into the paste system and those larger than 75 μm into the aggregate system[22]. Within this theoretical framework, the paste initially serves to fill the voids within the aggregate system, with the remaining portion coating the aggregate surfaces to maintain inter-particle spacing and thus provide the necessary flowability[23]. After excluding the influence of fine powder, the effective packing void ratio and specific surface area of the aggregate system become two crucial parameters determining the required paste volume[24].
2. Calculation of Aggregate Packing Void Ratio
2.1. Compressible Packing Model
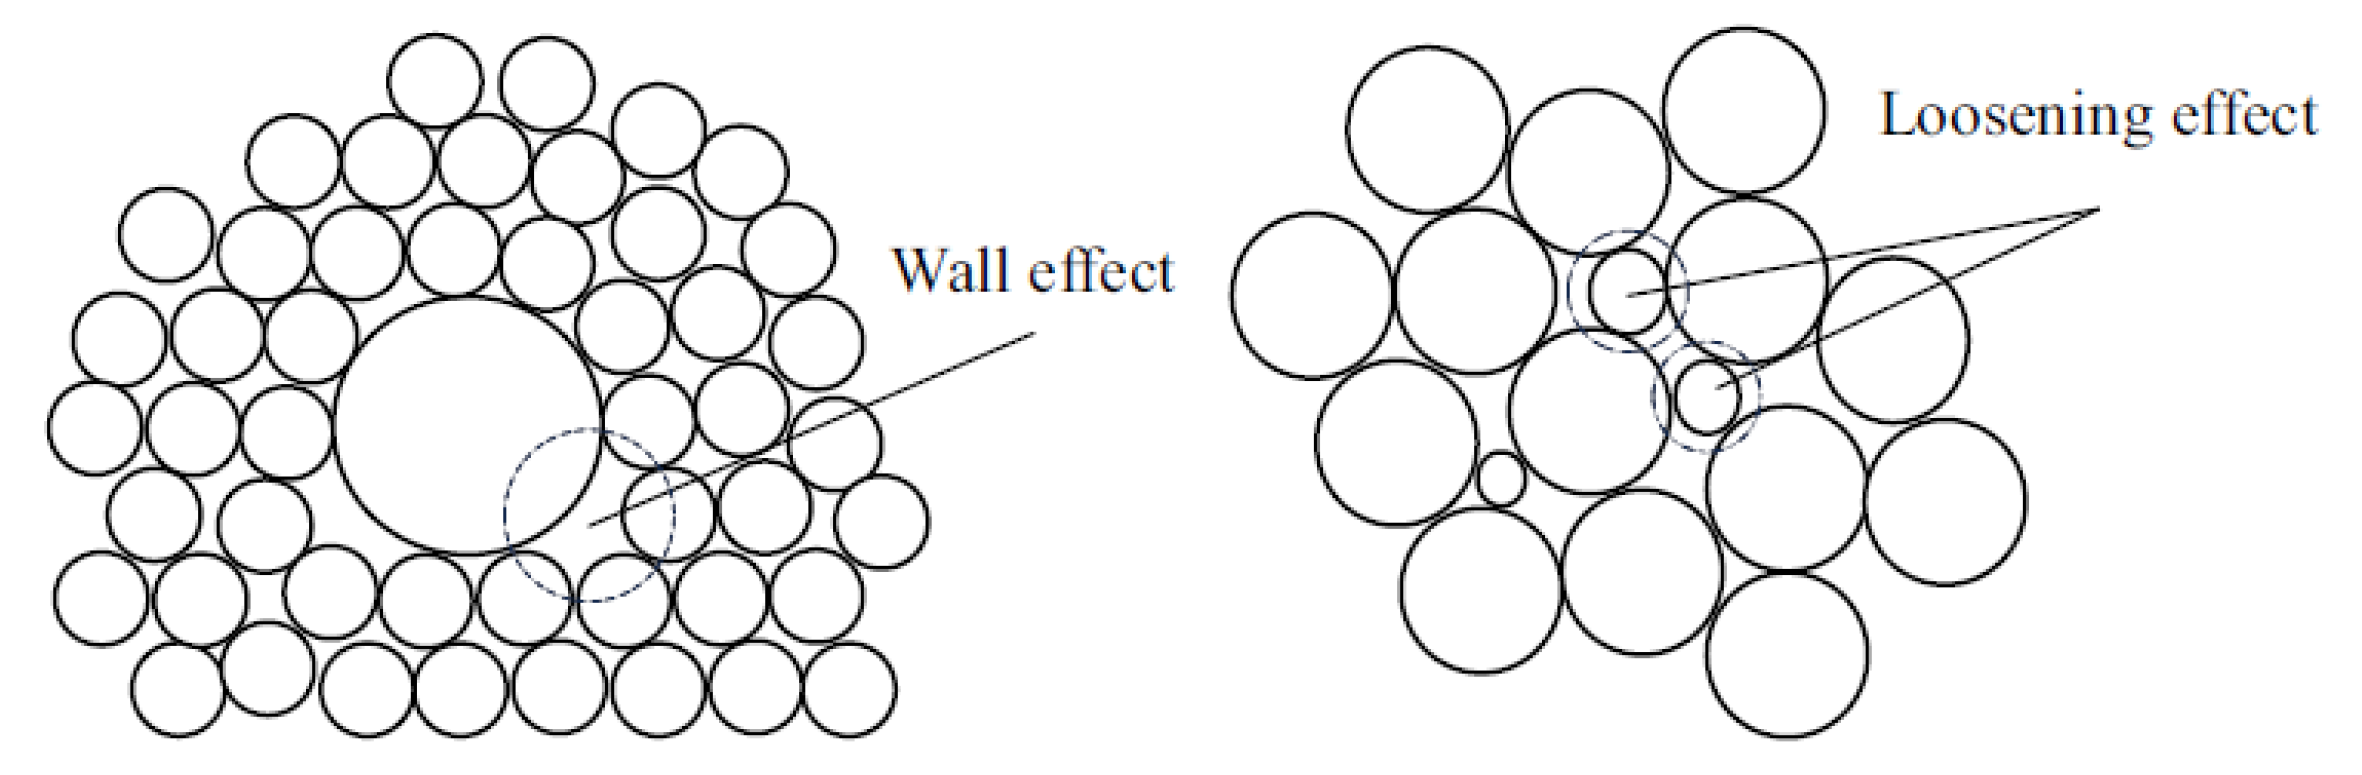
Aggregate gradation is a crucial factor influencing aggregate packing density [25]. While the gradation curve method aims to achieve the densest packing by optimizing aggregate particle size distribution, it does not allow for the direct calculation of void ratio or provide specific proportions of coarse and fine aggregates[9,26]. During aggregate packing, the interaction between coarse and fine particles is characterized by the “wall effect” and the “loosening effect.” Furthermore, under vibration, the “Brazil nut effect” can occur, leading to segregation[27]. However, in concrete, the viscous resistance of the paste mitigates the Brazil nut effect, resulting in particle packing and spatial distribution significantly different from that observed in dry, loose packing.
Figure 1.
Schematic diagram of loosening effect and wall attachment effect[28].
Figure 1.
Schematic diagram of loosening effect and wall attachment effect[28].
F. Larrard[29] proposed the Compressible Packing Model (CPM), which accounts for inter-particle interactions and enables the calculation of the void ratio in aggregate systems. When the mixture is dominated by the i-th particle size fraction, the packing density is defined as follows:
Where, and represent the packing density and volume percentage of the i-th particle size fraction, respectively. and are the loosening effect coefficient when coarse particles dominate and the wall effect coefficient when fine particles dominate, respectively.
Due to the complex sources of aggregates used in concrete mixtures, the loosening and wall effect parameters between different particle size fractions are difficult to determine. When a single particle size fraction of aggregate is loosely packed, the segregation caused by the “Brazil nut effect” is less pronounced due to the small size difference between coarse and fine particles, leading to more accurate packing density test results. To enhance the accuracy and practicality of the model, Equation (1), which originally considered 2 to 3 particle size fractions, was modified to incorporate a mixture of 11 particle size fractions. The interaction coefficients between each particle size fraction were then calculated according to Equations (2) and (3), and the results are summarized in Table 1
The aggregate particle packing process also influences the packing density. Different casting and molding methods result in varying packing density indices:
Where represents the actual packing density of the mixed aggregates, calculated using Equation (1). For a given compaction index K, there is a unique packing density, and the packing density of the mixed aggregates can be calculated by solving the equation. Since the packing density of aggregates is related to the workability of concrete, pumping is often employed for the construction of ordinary concrete. Based on the empirical findings summarized by F. Larrard, a constant value of 8 is typically adopted for the compaction index K[29].
2.2. Aggregate Packing Density Test
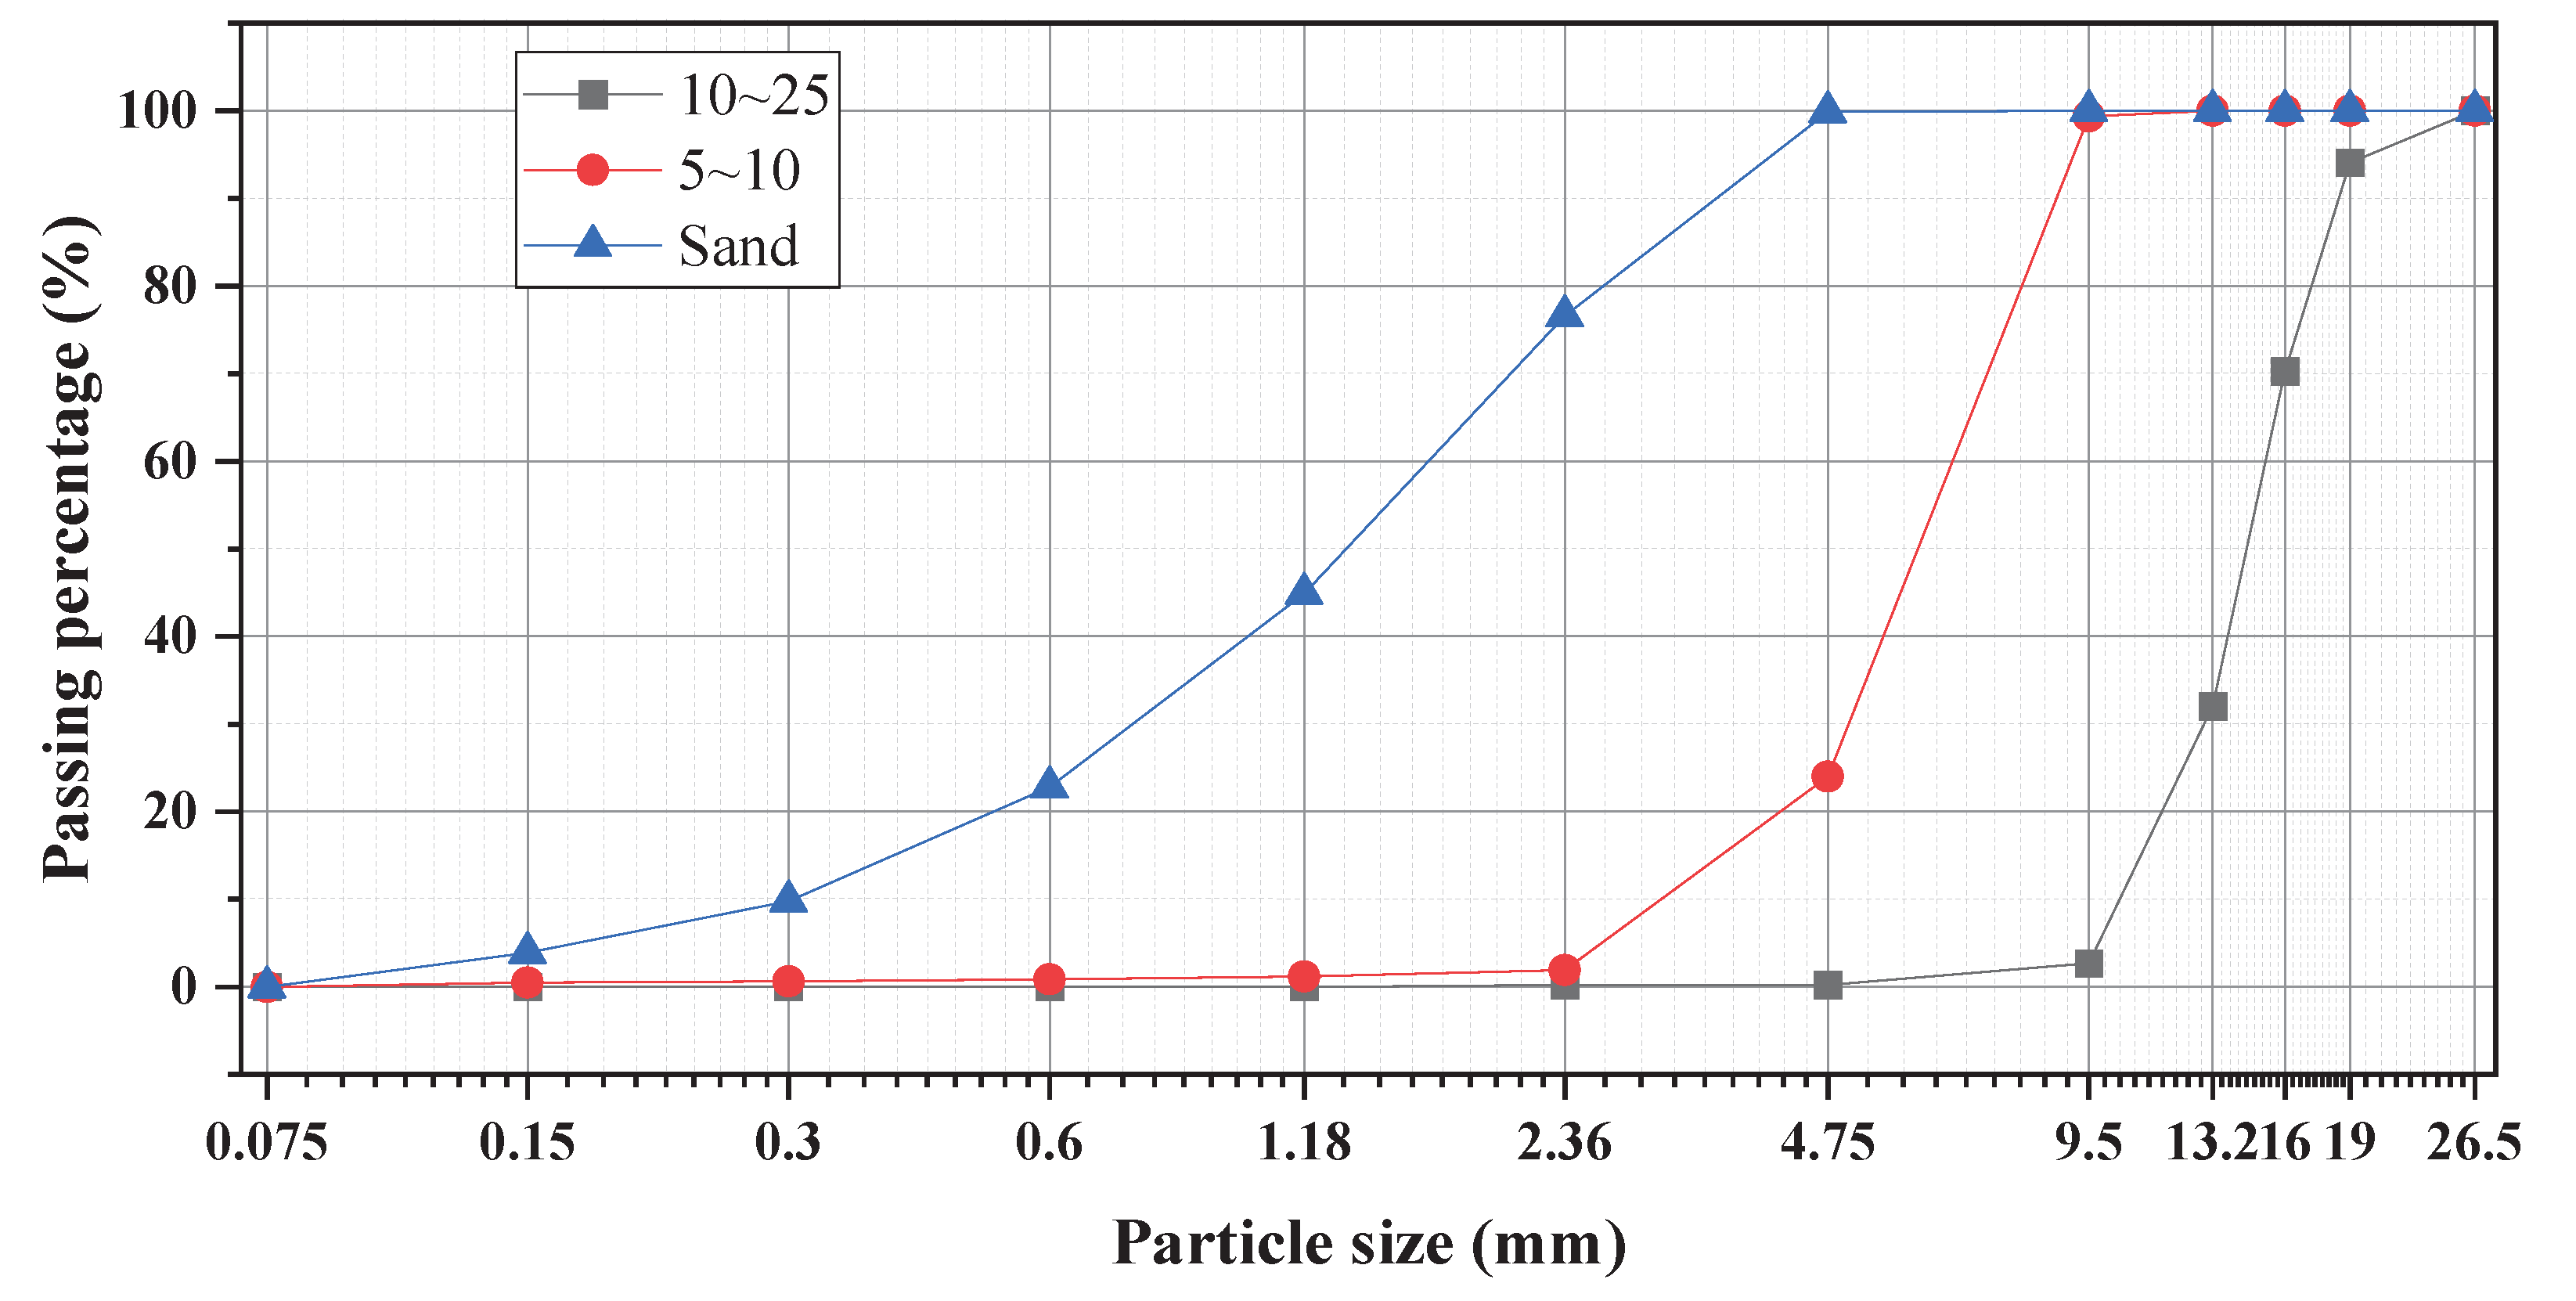
In this study, two fractions of coarse aggregates (5-10 mm and 10-25 mm) and manufactured sand were mixed in different proportions. The packing densities of these aggregate mixtures were tested to validate the accuracy of the model calculations. The particle size distribution of the three types of aggregates is shown in Figure 2.
Figure 2.
Aggregate gradation curves.
The packing density of the mixed aggregates was determined using the water displacement method. The viscous drag of water was utilized to minimize the Brazil nut effect during the packing process. A container with a volume of approximately 10 L was weighed when empty, and the weight was recorded as . The container was then filled with water and weighed again, with the weight recorded as . Aggregates mixed uniformly according to the predetermined proportions were added to the water-filled container until the aggregate surface was level with the container rim, and this weight was recorded as . The packing density of the aggregates was then calculated using the following equation:
The packing density was calculated based on the grading of the mixed aggregates using the modified CPM model. To minimize measurement errors in packing density caused by segregation, the coarse and fine aggregates were sieved and their packing densities for different particle sizes were tested separately. The packing densities of each particle size fraction are summarized in Table 2.

Table 2.
Bulk density of aggregates of each particle size.
| Mesh size /mm | Packing density /kg·m-3 | Stacking compactness |
| 26.5 | 1354 | 55.9% |
| 19 | 1397 | 57.7% |
| 16 | 1339 | 55.3% |
| 9.5 | 1355 | 56.0% |
| 4.75 | 1373 | 56.7% |
| 2.36 | 1535 | 62.0% |
| 1.18 | 1449 | 58.5% |
| 0.6 | 1450 | 58.6% |
| 0.3 | 1404 | 56.7% |
| 0.15 | 1404 | 56.7% |
| 0.075 | 1398 | 56.5% |
2.3. Packing Density Calculation Model Validation
The inter-particle interaction parameters mentioned above were adopted from Table 1 and incorporated into the CPM model. By only measuring the partial passing percentage of each particle size fraction in the mixture, the packing density of the mixed aggregates can be calculated. Three fractions of aggregates (coarse, medium, and fine) were designed and mixed in different proportions, and the packing densities of these mixtures were tested, as shown in Table 3.
Table 3.
Aggregate bulk density test.
| Col. | Coarse aggregate | Fine aggregate | Sand | Packing density test value /kg·m-3 | Calculated packing density | error |
| 1 | 100.0% | 0.0% | 0.0% | 1483 | 1449 | 2.3% |
| 2 | 0.0% | 100.0% | 0.0% | 1435 | 1436 | 0.1% |
| 3 | 50.0% | 50.0% | 0.0% | 1526 | 1573 | 3.0% |
| 4 | 75.0% | 25.0% | 0.0% | 1527 | 1549 | 1.4% |
| 5 | 62.5% | 37.5% | 0.0% | 1541 | 1578 | 2.4% |
| 6 | 31.3% | 68.8% | 0.0% | 1520 | 1527 | 0.5% |
| 7 | 0.0% | 47.1% | 52.9% | 1935 | 1925 | 0.5% |
| 8 | 0.0% | 53.9% | 46.2% | 1934 | 1889 | 2.4% |
| 9 | 0.0% | 77.0% | 23.0% | 1555 | 1653 | 6.3% |
| 10 | 45.0% | 11.0% | 44.0% | 2010 | 2015 | 0.3% |
| 11 | 44.0% | 11.2% | 44.8% | 2122 | 2018 | 4.9% |
| 12 | 43.0% | 11.4% | 45.6% | 2120 | 2020 | 4.7% |
| 13 | 41.0% | 11.8% | 47.2% | 2158 | 2022 | 6.3% |
| 14 | 39.0% | 12.2% | 48.8% | 2166 | 2023 | 6.6% |
| 15 | 43.0% | 17.1% | 39.9% | 2099 | 1991 | 5.2% |
| 16 | 0.0% | 0.0% | 100.0% | 1821 | 1850 | 1.6% |
The packing densities of the 16 groups of aggregates were calculated using the improved CPM model, and the calculated and experimental values are presented in Figure 3.
The packing density values calculated by the modified CPM model show a high degree of agreement with the experimental data, with a maximum error of 6.6% and a coefficient of determination (R2) of 0.90. This indicates that the developed packing density calculation model for aggregate particle systems has high reliability and can be directly used to calculate the packing density of aggregate particle mixtures.
3. Aggregate Surface Area Calculation Model
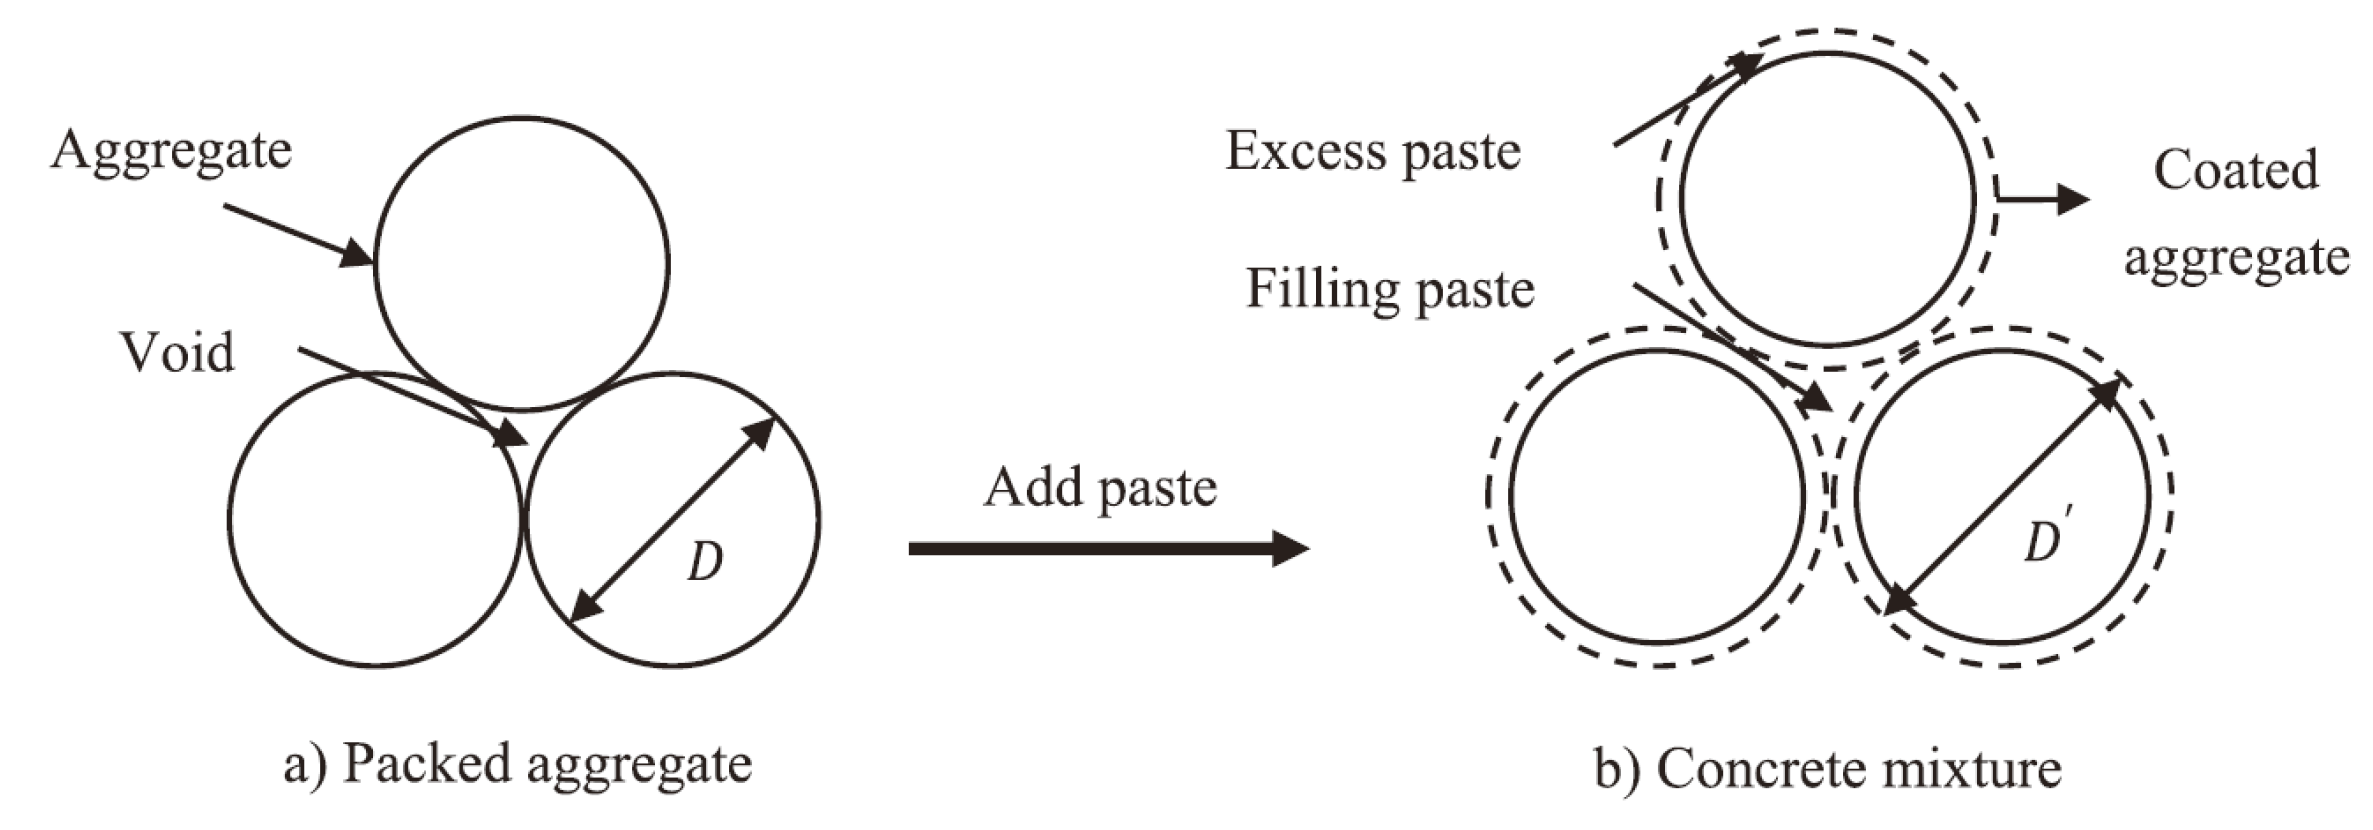
In concrete, after the paste fills the voids between aggregate particles, the excess paste coats the aggregate particles, maintaining a certain distance between them and consequently reducing the probability of inter-particle collisions, thereby improving the workability of the concrete. A larger aggregate surface area leads to a thinner layer of excess paste coating the aggregate surfaces and a smaller inter-particle spacing, which can affect both the workability and mechanical properties of the concrete. Many studies assume aggregate particles to be spherical for specific surface area calculations[30,31,32]:
Where is the specific surface area per unit volume, and is the diameter of the sphere. For particles within the same size fraction, the particle diameter is generally taken as the arithmetic mean of the upper and lower limits of the size range. The value of the sphere diameter d is related to the particle size distribution of the aggregates, which varies continuously from the maximum to the minimum particle size.
3.1. Effect of Particle Size Distribution
For the particle composition within any given size fraction, the difference in particle size is larger for particles closer to the upper limit of the size range than for those closer to the lower limit. The particle size distribution approximates a geometric progression. Assuming the common ratio of the geometric progression is , the particle size distribution within any size fraction can be simplified as:
The volume of a single spherical particle is given by:
The volume of a single particle size group:
The surface area of a single particle size group:
The specific surface area of a single particle size group:
Where is the ratio of successive sieve aperture sizes. According to current standards, Therefore, the specific surface area of a single part icle size fraction can be simplified as:
The number of natural aggregate particles n tends to infinity:
3.2. Effect of Particle Morphology
However, the specific surface area per unit volume of aggregate particles is not only related to particle grading but is also influenced by their morphological characteristics[8]. Natural aggregates exhibit a wide variety of geometric shapes, leading to some discrepancies when using a spherical model to calculate their specific surface area. According to stereological principles, any arbitrarily shaped aggregate can be enveloped by a projected stretched body, as illustrated in Figure 4.
Figure 4.
Schematic diagram of aggregate particle profile.

The most stable orientation of an aggregate particle is when its maximum projected area serves as the base. The minimum height of the stretched body is taken as the shorter side length of the bounding rectangle of the projection. When the aggregate particle is sectioned with planes parallel to the projection plane, the outermost layer has a cross-sectional area of 0, and the maximum cross-sectional area is less than or equal to the projected area. As shown in Figure 4, an aggregate particle can be simplified as being composed of two polygonal pyramids with the projection plane as their common base and a height of . Therefore, the volume of a single aggregate particle can be expressed as:
The area of the side of the cone on the bottom surface of the polygon:
where is the length of the busbar, assuming that the aggregate particles are placed stably on the plane with the of the major axis as the bottom and the of the minor axis as the high cone, then:
The aggregate specific surface area can be expressed as:
In the formula is the projection perimeter of the aggregate particles, the is the projection area of the aggregate particles, and the of the long axis and the minor axis of the aggregate particles four parameters can be obtained from the two-dimensional image of the aggregate through image analysis. Sphere surface area in diameter:
Particle shape correction factor:
Substitution (12) can be used to obtain a single-particle aggregate specific surface area calculation model considering particle morphology and particle distribution:
3.3. Validation of the Specific Surface Area Calculation Model
Aggregate particles with three size fractions (4.75-9.5 mm, 9.5-16 mm, and 16-19 mm) were photographed. The projected perimeter and area were measured using the image analysis software Image Pro Plus. The specific surface area of the aggregate particles was then calculated based on Equation (20) and compared with the data calculated assuming spherical particles.
Figure 5.
Image analysis of aggregate particles of different particle sizes.
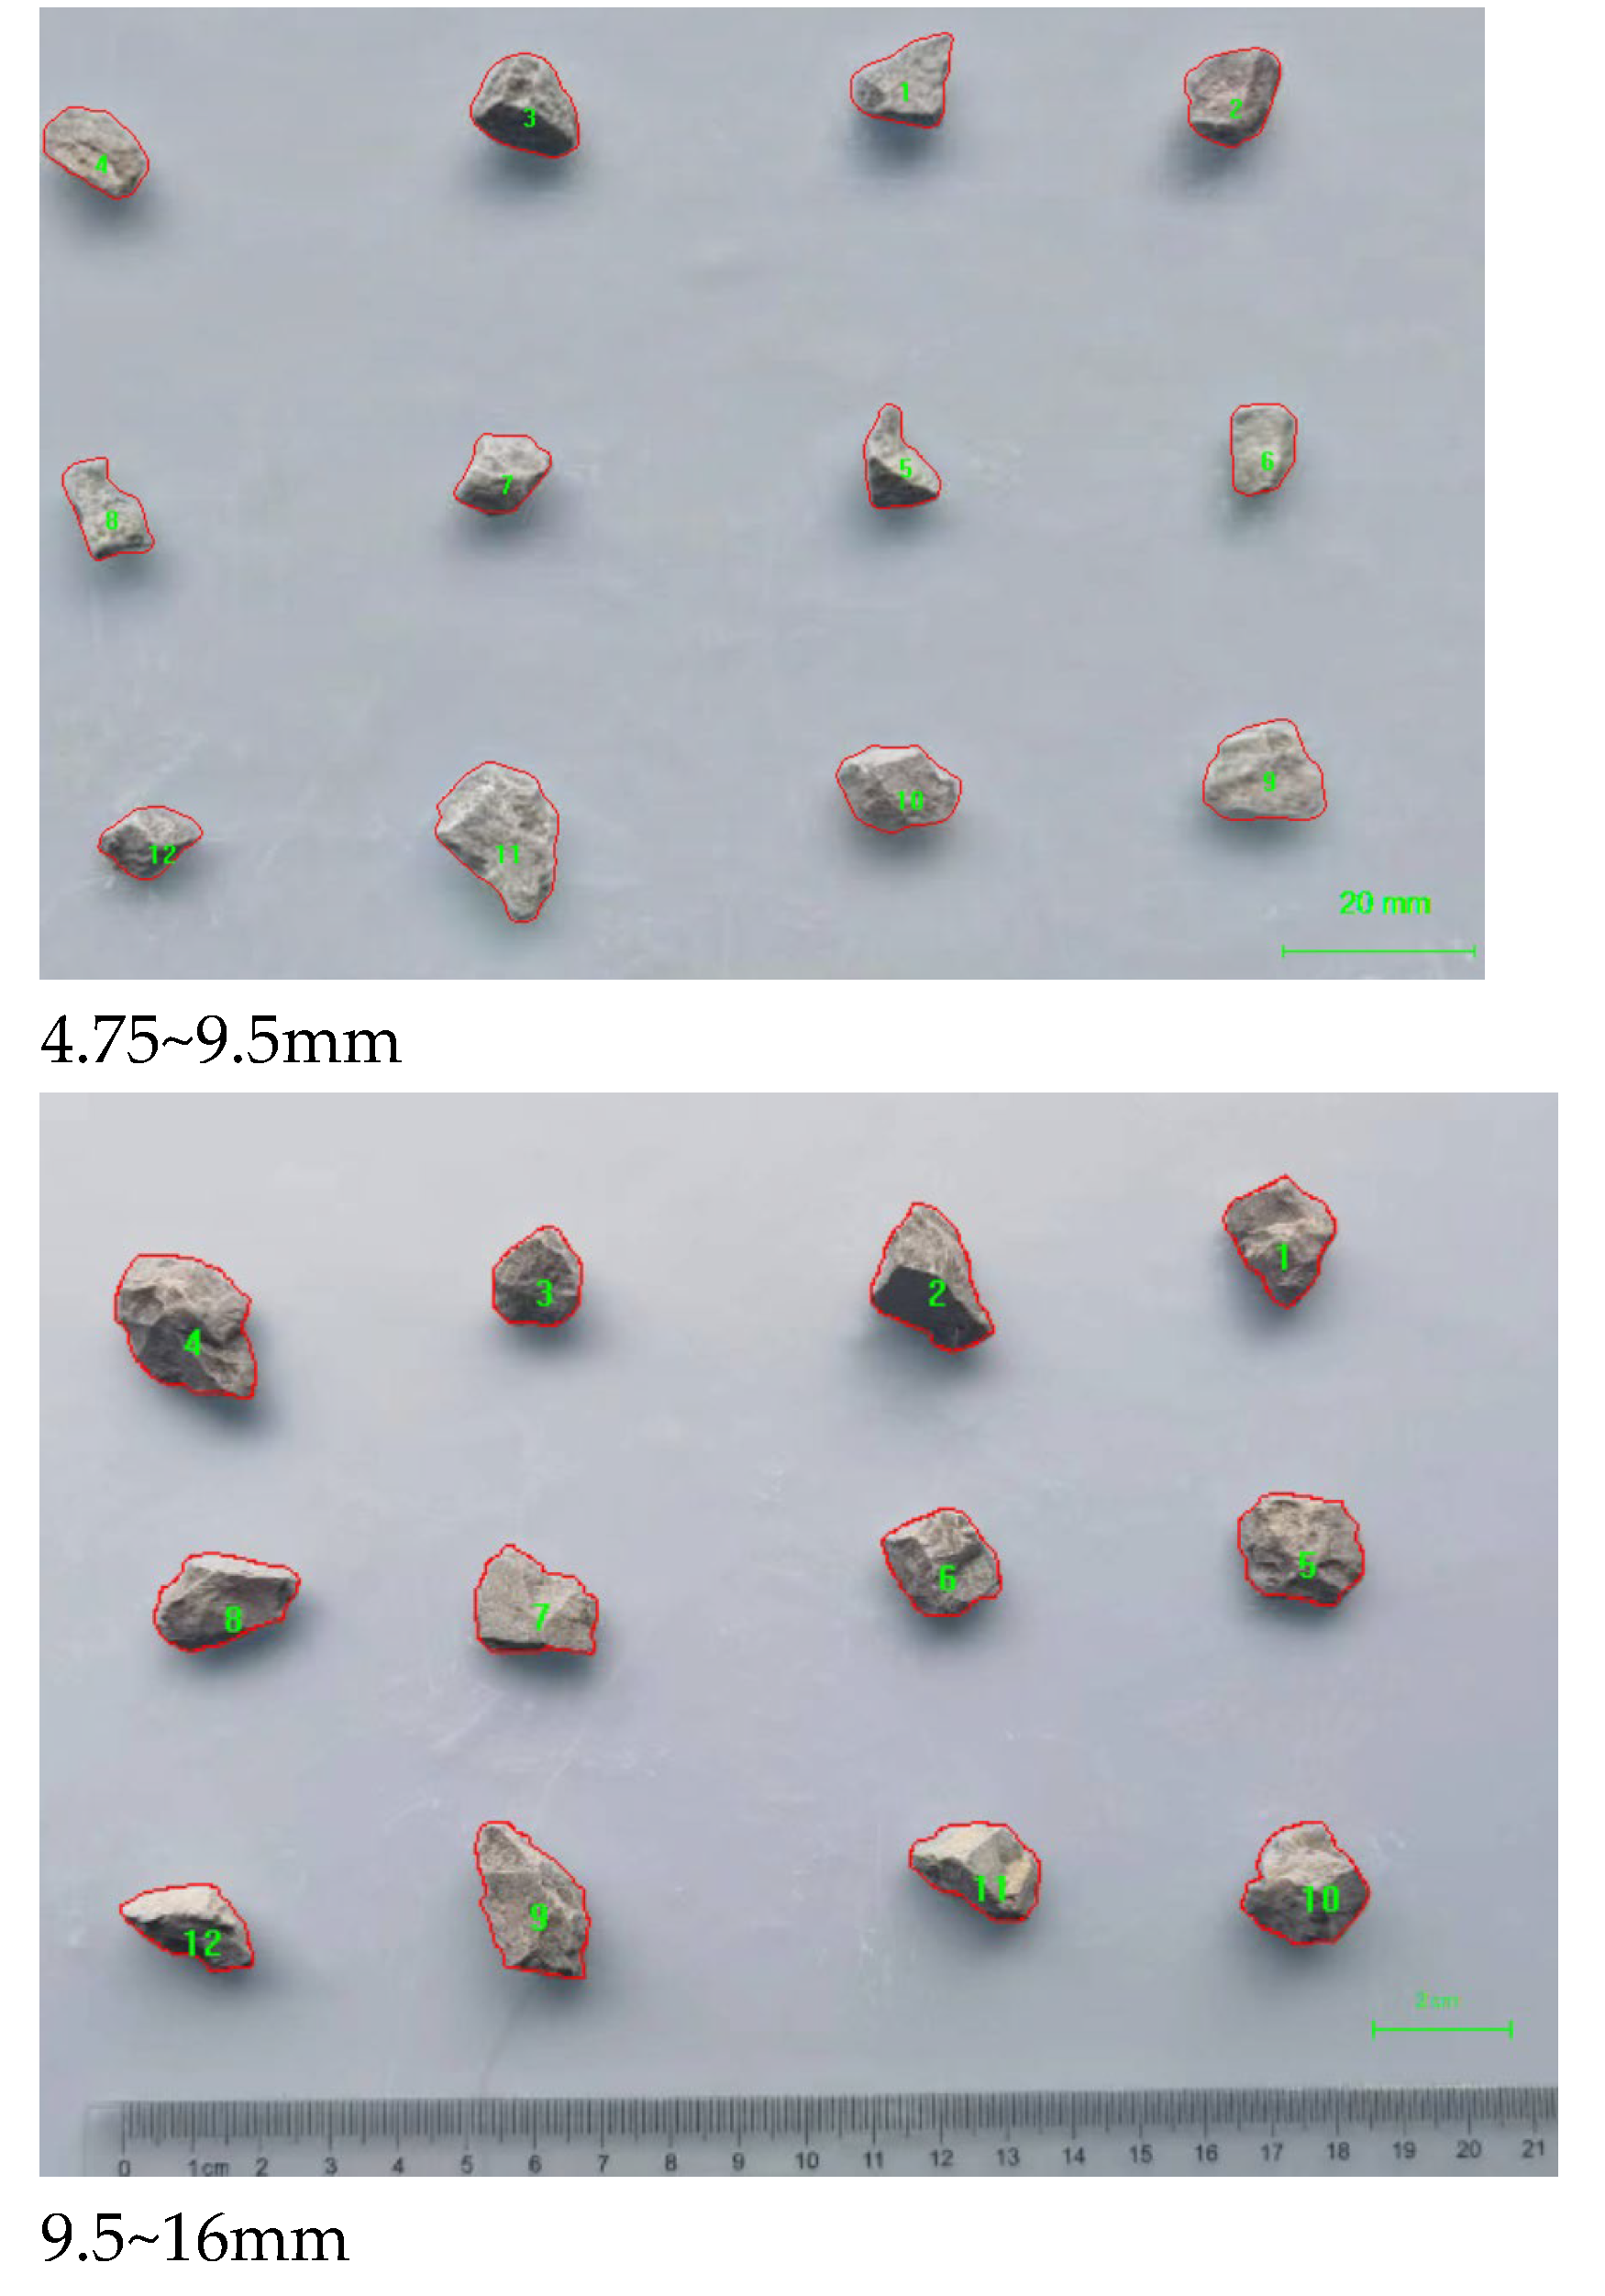
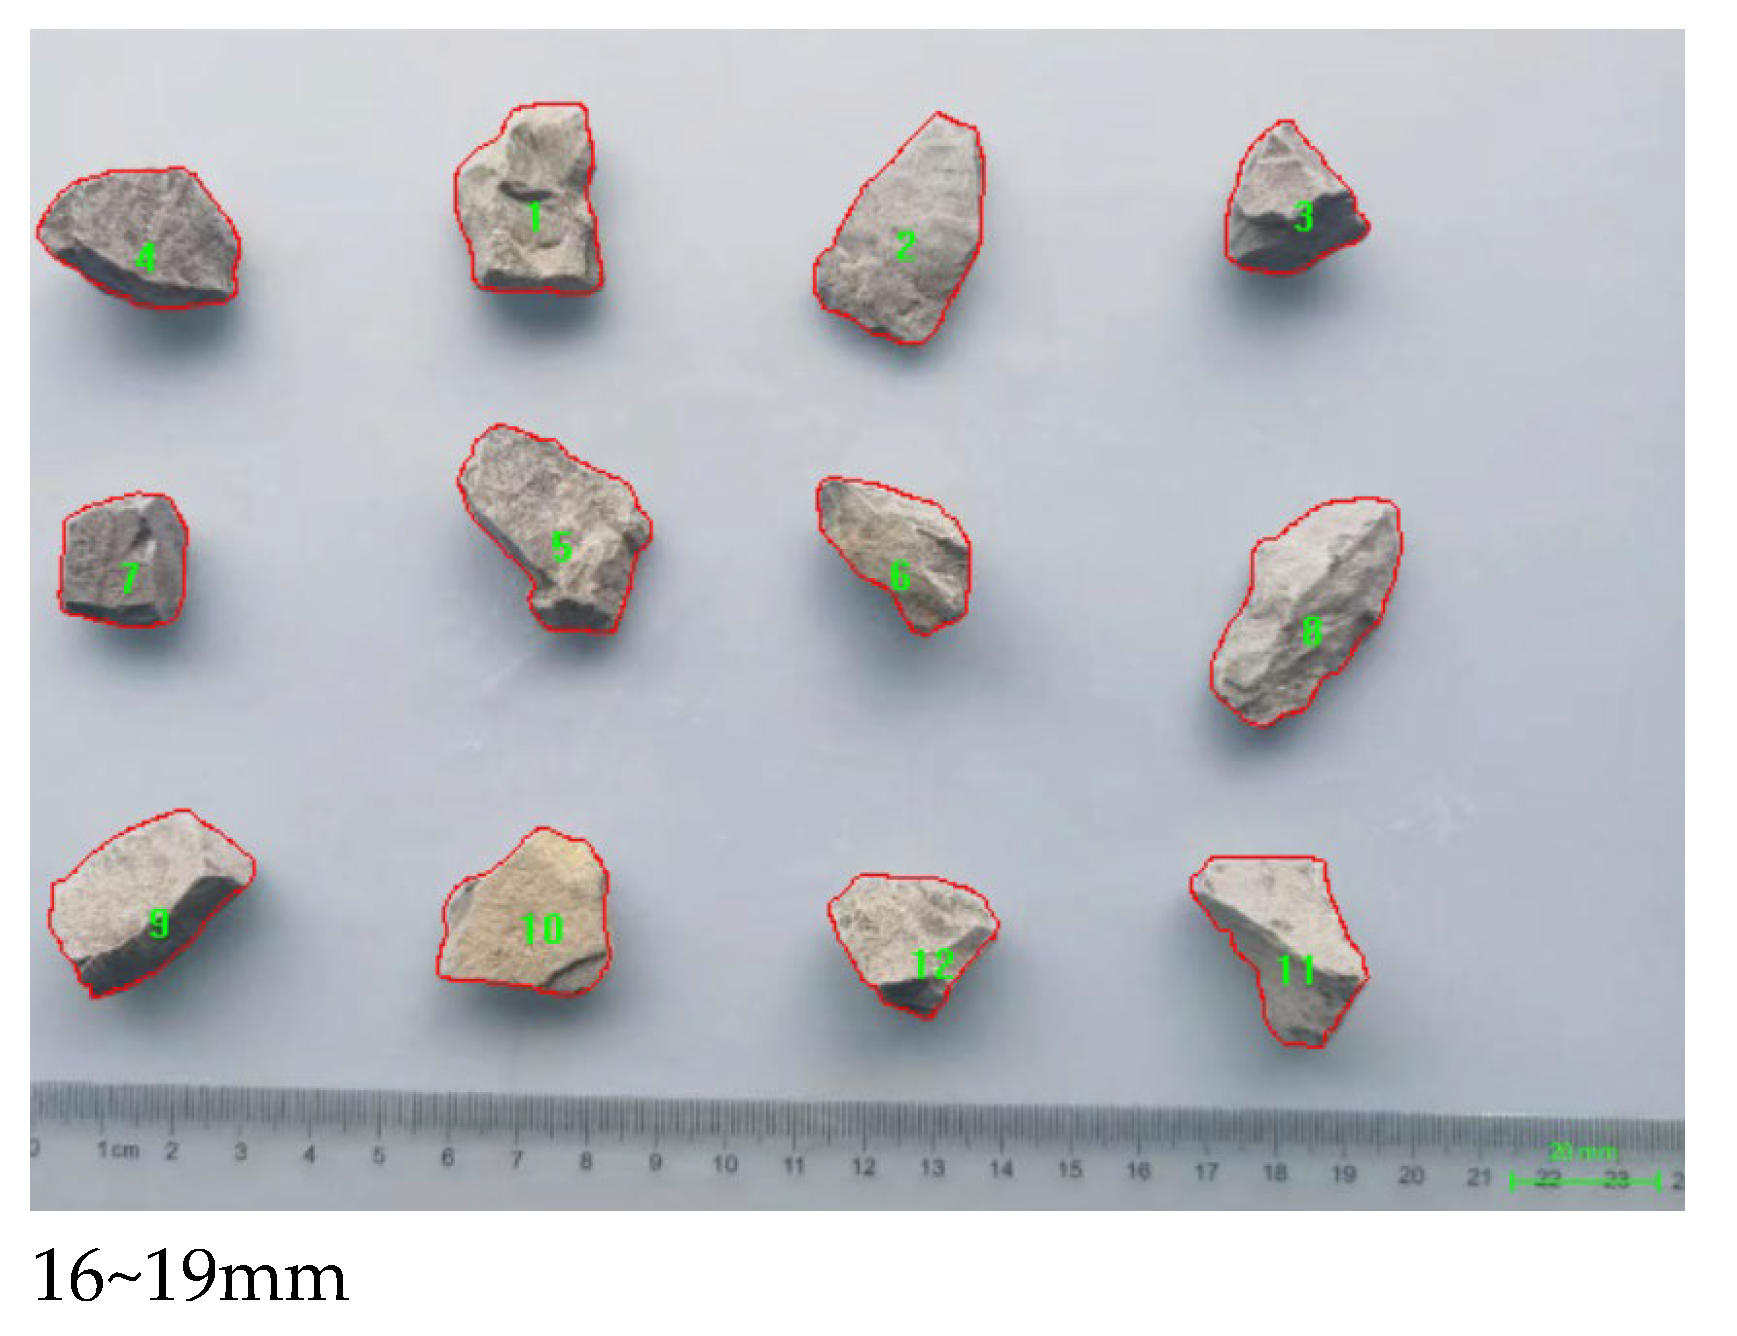
As shown in Figure 6, the specific surface area of the particles calculated using the image analysis method is slightly larger than that calculated based on the spherical assumption, and it more closely approximates the specific surface area of natural aggregate particles. The standard deviation of the calculated specific surface area varies for different particle size ranges. For ease of calculation, the average value of the specific surface area calculated for several particles within the same size range is used.
Based on this algorithm, image recognition can be used to rapidly calculate the specific surface area of a particle population, thereby effectively characterizing the particle morphology of aggregates. This quantified specific surface area data has significant applications in concrete mix design, enabling mix proportions to fully consider particle morphology characteristics. This approach addresses the limitations of past methods where particle morphology could not be quantified, and mix design heavily relied on empirical experience. The application prospects of this method are broad, not only improving the scientific basis and accuracy of concrete mix design but also providing new technical approaches for optimizing concrete performance.
4. Aggregate Ratio Optimization Method
4.1. Concrete Slurry Volume Calculation
Traditional densest packing theory suggests that a smaller void ratio in the aggregate packing leads to superior strength and economic efficiency of concrete. However, for highly workable concrete, a certain volume of paste is required to maintain the inter-particle spacing, ensuring adequate workability. Defining the volume of this paste as , we have:
Where is the volume fraction of aggregates in the concrete, %; and is the volume fraction of aggregates in the densest packing state, %.
As illustrated in Figure 7, assuming a uniform thickness of the paste layer coating the aggregate particle surfaces, half of the minimum inter-particle spacing is defined as the Surface area-based Paste Thickness (SPT)[15]:
Figure 7.
Schematic diagram of the spacing between the surplus slurry and aggregate[15].
Figure 7.
Schematic diagram of the spacing between the surplus slurry and aggregate[15].
The packing density and specific surface area of the aggregate particle system both vary with the particle size distribution and morphological characteristics of the aggregates. The surface area-based paste thickness (SPT) can indirectly reflect changes in three parameters of the aggregate particle system: packing void ratio, specific surface area, and aggregate volume fraction. When the SPT is fixed, the objective of optimizing the aggregate mix proportion should be to minimize the paste volume, rather than solely minimizing the void ratio. This can be expressed as:
For the aggregate system mixed according to these initial proportions, the partial passing percentage of each particle size fraction is calculated using Equation (25)
Where represents the partial passing percentage of the i-th particle size fraction in the n-th type of aggregate, and is the volume percentage of the n-th type of aggregate in the mixture. Table 4 lists the specific surface area per unit volume for each particle size fraction. The specific surface area of the aggregate system is calculated by weighted summation of the partial passing percentages using Equation (26).
Where is the specific surface area per unit volume of the i-th aggregate size fraction, and is the partial passing percentage of the i-th aggregate size fraction in the mixture.
4.2. Aggregate Gradation Optimization Based on GRC Method
For the sake of model description simplicity, the aggregate proportion is represented by the sand ratio (). Consequently, both the packing density () and the specific surface area per unit volume () of the mixed aggregates can be expressed as functions of the sand ratio. Thus, the objective function of the optimization model is defined as the minimization of the paste volume required per unit volume of concrete ():
- The constraints of the optimization model are as follows:
- The compaction index K is set to a constant value of 8 (K=8).
- The sand ratio (Sr) is constrained within the range of (0, 1).
- The packing density of the mixed aggregates (ϕmax) is a function of the sand ratio and is calculated based on the improved Compressible Packing Model (CPM) as detailed in Section 2.
- The specific surface area per unit volume of the mixed aggregates (Sv) is calculated according to Section 3.
- The surface area-based paste thickness (SPT) is a constant value determined based on the target concrete’s strength and workability requirements.
Figure 8.
Aggregate gradation optimization process based on GRC method.
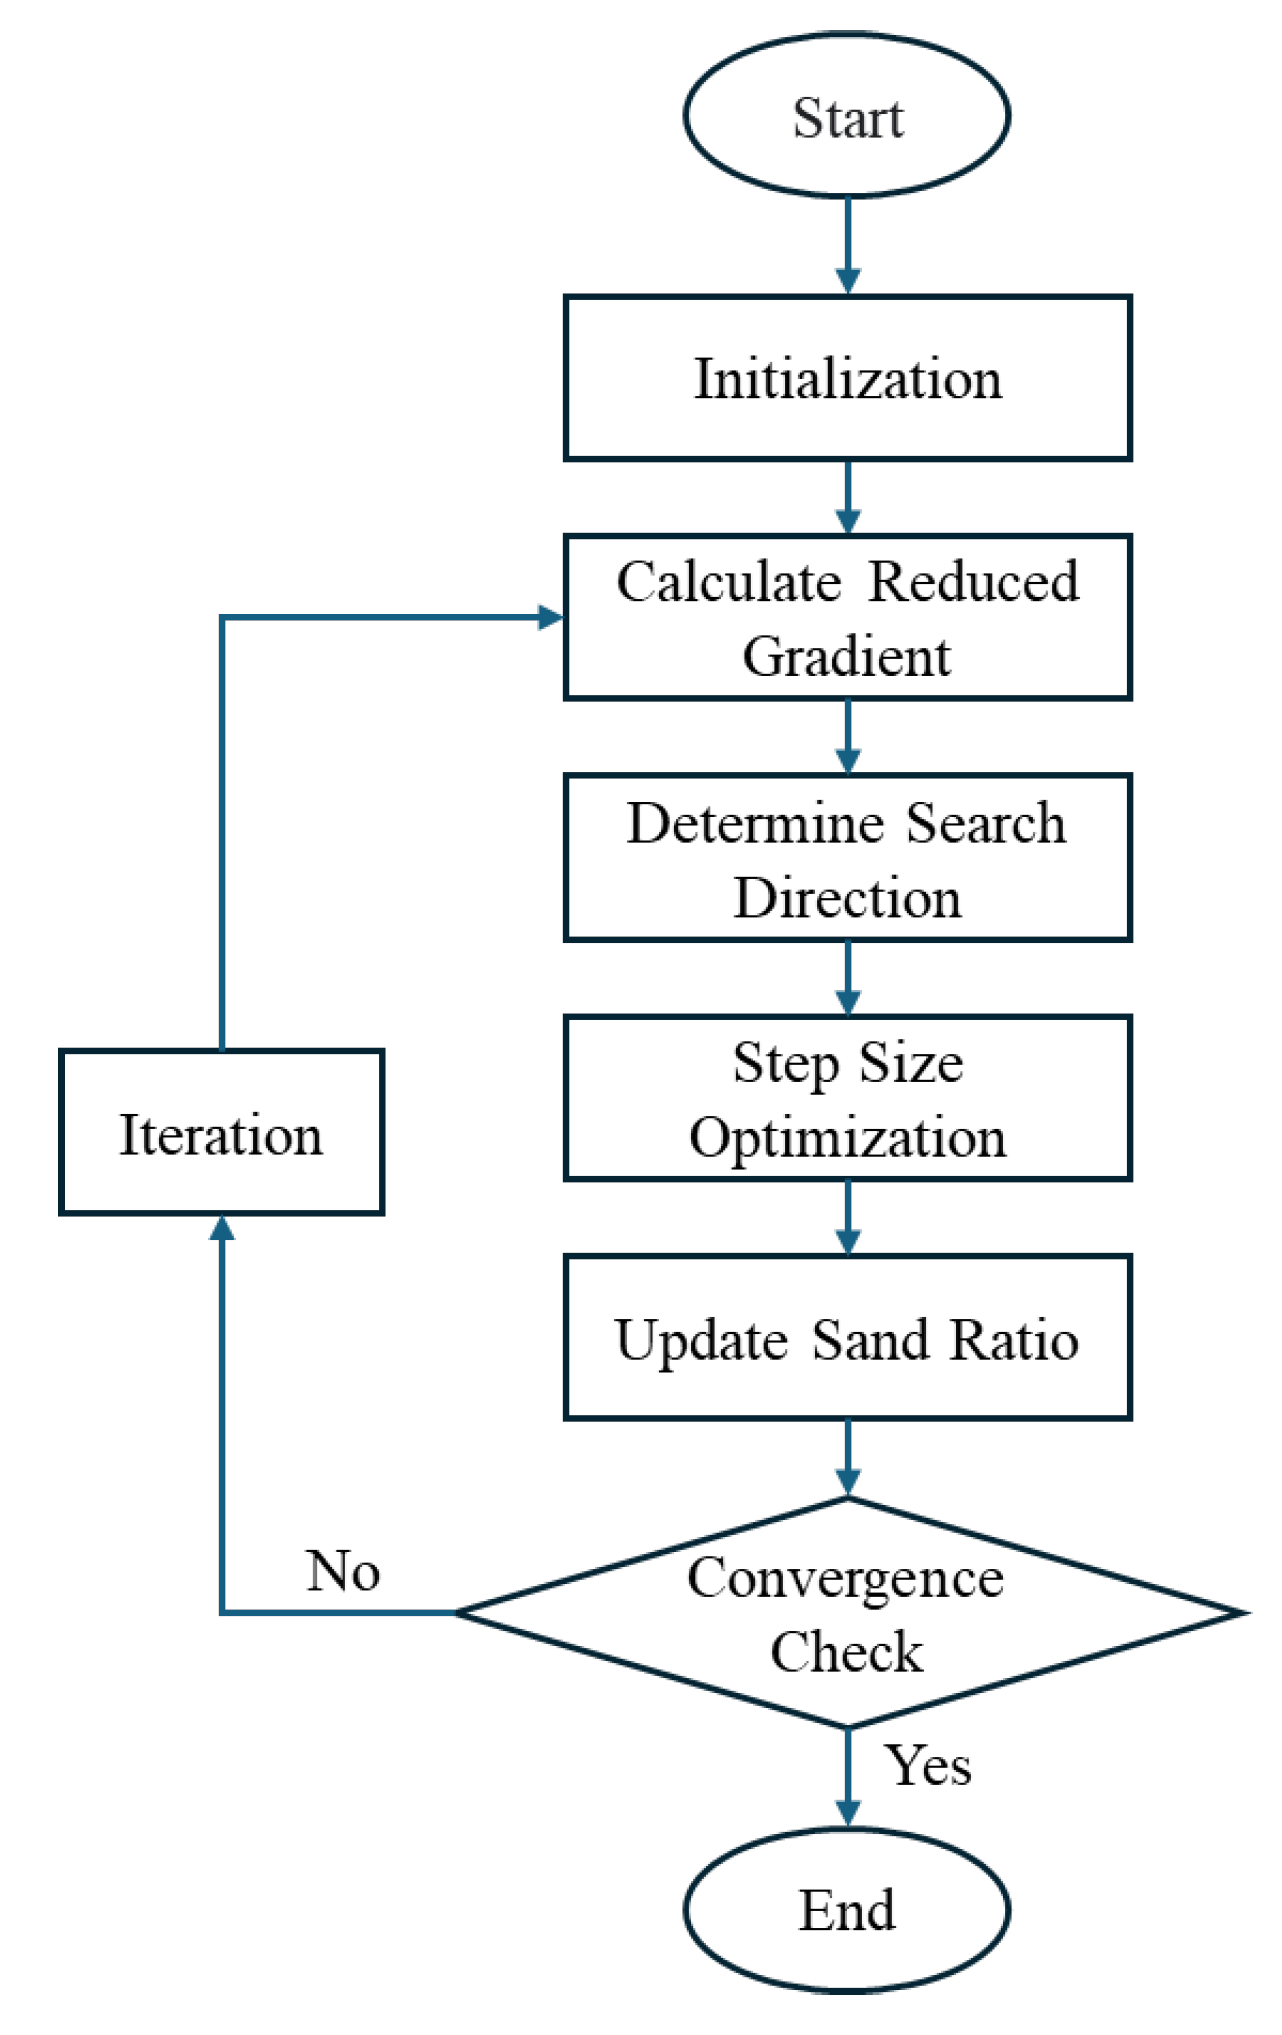
The Generalized Reduced Gradient (GRC) method is an iterative optimization technique employed to solve non-linear constrained optimization problems [33]. Its fundamental principle involves partitioning the optimization variables into basic and non-basic sets. The algorithm iteratively adjusts the values of the non-basic variables to progressively reduce the objective function while ensuring that all constraints are satisfied.
The optimization process commences with initialization, where a reasonable starting value () is assigned to the non-basic variable, the sand ratio (), serving as the initiation point for the iterative search. Subsequently, the reduced gradient of the objective function (paste volume, Vp) with respect to the sand ratio () is computed at the current sand ratio level. This step is crucial for accurately evaluating the rate of change of the paste volume with variations in the sand ratio, taking into full account the influence of aggregate proportion changes on both the packing density and specific surface area.
Based on the calculated reduced gradient, the search direction () is determined. Typically, the direction opposite to the gradient (the negative gradient direction) is selected to ensure a progressive reduction in the objective function value during the iterations. Furthermore, the selection of the search direction must also consider the practical range constraints of the sand ratio to avoid venturing outside the physically meaningful feasible region.
Next, a line search is performed along the determined search direction to identify the optimal step size (). Selecting an appropriate step size is paramount, as it needs to ensure a significant decrease in the paste volume upon updating the sand ratio, while maintaining the feasibility of the updated sand ratio value.
Utilizing the identified optimal step size, the non-basic variable, the sand ratio, is updated according to the formula: .
Following each iteration, a convergence check is conducted to assess whether the current optimization results meet the predefined stopping criteria. Common convergence criteria include the relative change in the objective function value or the sand ratio being smaller than a set tolerance threshold, or the attainment of a pre-specified maximum number of iterations.
If the convergence criteria are not met, the algorithm returns to the reduced gradient calculation step to proceed with the next iteration. Once the convergence criteria are satisfied, the optimization process terminates, and the algorithm outputs the optimal sand ratio () along with the corresponding minimum paste volume ().
5. Conclusions
This paper presents a mix design and optimization methodology for aggregate systems based on a binary paste-aggregate model, aiming to minimize paste usage while considering concrete workability. The study focuses on developing more accurate calculation methods for aggregate packing void ratio and specific surface area. Subsequently, the Generalized Reduced Gradient (GRC) method is employed to optimize the aggregate proportion with the objective of minimizing paste volume, thereby achieving the minimum paste content required to satisfy the inter-particle spacing of the aggregates.
- Considering the interactions between multi-sized particles significantly enhances the accuracy of aggregate packing models and mitigates the Brazil nut effect.
- The water displacement method is a more reliable approach for measuring aggregate packing density, effectively avoiding the Brazil nut effect.
- Quantifying intra-fraction particle size heterogeneity using the geometric progression method enables more accurate calculation of aggregate specific surface area.
- Quantifying aggregate shape using image analysis and incorporating shape coefficients allows for a more realistic calculation of aggregate specific surface area.
- The GRC numerical optimization method efficiently fits the optimal aggregate proportions to meet specific performance targets.
Building upon a binary paste-aggregate model, this research introduces an aggregate system proportioning design and optimization methodology aimed at minimizing paste usage while accounting for concrete workability, achieved through more precise characterization of aggregate packing and specific surface area, coupled with Generalized Reduced Gradient (GRC) optimization. This approach yields significant economic benefits by reducing cement consumption, promotes environmental sustainability through lower carbon emissions, and offers the potential for enhanced concrete performance. Future trends in this field will likely involve intelligent optimization driven by AI and big data, multi-scale and multi-objective optimization considering a broader range of performance indicators and environmental impacts, and the integration of automated experimentation for rapid model validation and refinement towards a holistic life-cycle design of concrete structures.
Author Contributions
Conceptualization, Lian Chunming. and Zhang Xiong.; methodology, Lian Chunming.; software, Lian Chunming.; validation, Han Lu., Wen Weijun. and Han Lifang.; formal analysis, Lian Chunming.; investigation, X.X.; resources, X.X.; data curation, X.X.; writing—original draft preparation, X.X.; writing—review and editing, X.X.; visualization, X.X.; supervision, X.X.; project administration, X.X.; funding acquisition, Y.Y. All authors have read and agreed to the published version of the manuscript.”
Funding
This research received no external funding.
Institutional Review Board Statement
Not applicable.
Informed Consent Statement
Not applicable.
Data Availability Statement
The original contributions presented in this study are included in the
article. Further inquiries can be directed to the corresponding author.
Conflicts of Interest
The authors declare no conflict of interest.
References
- Mehta, P. K.; Monteiro, P. J., Concrete microstructure, properties and materials. 2017.
- Kosmatka, S. H.; Wilson, M. L. In Design and Control of Concrete Mixtures, 16th Edition, 2016.
- Schneider, M., The cement industry on the way to a low-carbon future. Cem. Concr. Res. 2019, 124, 105792.
- Nazari, A.; Sanjayan, J., Handbook of Low Carbon Concrete. Joe Hayton: 2016.
- Mahaut, F.; Mokéddem, S.; Chateau, X.; Roussel, N.; Ovarlez, G., Effect of Coarse Particle Volume Fraction on the Yield Stress and Thixotropy of Cementitious Materials. Cem. Concr. Res. 2008, 38, 1276-1285.
- Li, L. G.; Kwan, A. K., Concrete mix design based on water film thickness and paste film thickness. Cement and Concrete Composites 2013, 39, 33-42.
- Martini, S. A.; Hassan, Z.; Khartabil, A., Flow Behavior of Self Consolidating Concrete Mixes with Various Maximum Size Aggregates. Key Engineering Materials 2019, 803, 233 - 238.
- Ostrowski, K. A. In The impact of coarse aggregate shape on the behavior of self-compacting high-performance concrete, 2018.
- Figmig, R.; Kovâ, M., The influence of aggregate gradation on the fresh and hardened concrete properties. IOP Conference Series: Materials ScienceEngineering 2019.
- Goltermann, P.; Johansen, V.; Palbøl, L., Packing of aggregates: An alternative tool to determine the optimal aggregate mix. #N/A 1997, 94, 435-443.
- Hu, J. In A study of effects of aggregate on concrete rheology, 2005.
- Rao, G. A.; Raghu Prasad, B. K., Influence of type of aggregate and surface roughness on the interface fracture properties. Mater. Struct. 2004, 37, (5), 328-334.
- Chu, S., Effect of paste volume on fresh and hardened properties of concrete. #N/A 2019.
- Ng, P. L.; Kwan, A. K. H.; Li, L. G., Packing and film thickness theories for the mix design of high-performance concrete. #N/A 2016, 17, 759-781.
- Shen, W.; Wu, M.; Zhang, B.; Xu, G.; Cai, J.; Xiong, X.; Zhao, D., Coarse aggregate effectiveness in concrete: Quantitative models study on paste thickness, mortar thickness and compressive strength. #N/A 2021, 289, 123171.
- Kwan, A. K. H.; Li, L. G., Combined effects of water film, paste film and mortar film thicknesses on fresh properties of concrete. #N/A 2014, 50, 598-608.
- Lee, J. H.; Kim, J. H.; Yoon, J. Y., Prediction of the yield stress of concrete considering the thickness of excess paste layer. #N/A 2018.
- Reinhardt, H. W.; Wüstholz, T., About the influence of the content and composition of the aggregates on the rheological behaviour of self-compacting concrete. Mater. Struct. 2006, 39, (7), 683-693.
- Kwan, A. K. H.; Ling, S. K., Lowering paste volume of SCC through aggregate proportioning to reduce carbon footprint. #N/A 2015, 93, 584-594.
- Shen, W.; Yang, Z.; Cao, L.; Cao, L.; Liu, Y.; Yang, H.; Lu, Z.; Bai, J., Characterization of manufactured sand: Particle shape, surface texture and behavior in concrete. #N/A 2016, 114, 595-601.
- Hou, H. In Influence of Machine-Made Sand Performance on Concrete, 2021.
- Bonifaz, E. A.; Baus, J.; Lantsoght, E. O. L., Modeling Concrete Material Structure: A Two-Phase Meso Finite Element Model. Journal of Multiscale Modelling 2017, 08, 1750004.
- Jimma, B. E.; Rangaraju, P. R., Film-forming ability of flowable cement pastes and its application in mixture proportioning of pervious concrete. #N/A 2014, 71, 273-282.
- Torres, A.; Hu, J.; Ramos, A. K., The effect of the cementitious paste thickness on the performance of pervious concrete. #N/A 2015, 95, 850-859.
- Shilstone, J. M., Concrete Mixture Optimization. Concrete international 1990, 12, 33-39.
- Jia, J.-Y.; Gu, X.-L., Effects of coarse aggregate surface morphology on aggregate-mortar interface strength and mechanical properties of concrete. #N/A 2021, 294, 123515.
- Stroeven, P.; He, H. In Brazil Nut Effect and CONCRETE: Entering Terra Incognita, 2012.
- Moghaddam, T. B.; Baaj, H., Application of compressible packing model for optimization of asphalt concrete mix design. #N/A 2018, 159, 530-539.
- Larrard, F., Concrete Mixture Proportioning: A Scientific Approach. 1999.
- Ghasemi, Y.; Emborg, M.; Cwirzen, A., Estimation of specific surface area of particles based on size distribution curve. #N/A 2018, 70, (10), 533-540.
- Xiao, L.; Jiang, D. In The study of pervious concrete mix proportion by the method of specific surface area of aggregate, 2017.
- Hong, L.; Gu, X.; Lin, F., Influence of aggregate surface roughness on mechanical properties of interface and concrete. #N/A 2014, 65, 338-349.
- Hasanudin, H.; Zubaydi, A.; Aryawan, W. D., Roll dynamic coefficients approach of decay test using the Generalized Reduced Gradient method (GRG). Journal of Applied Engineering Science 2023.
Figure 3.
Comparison of predicted and tested bulk density values.
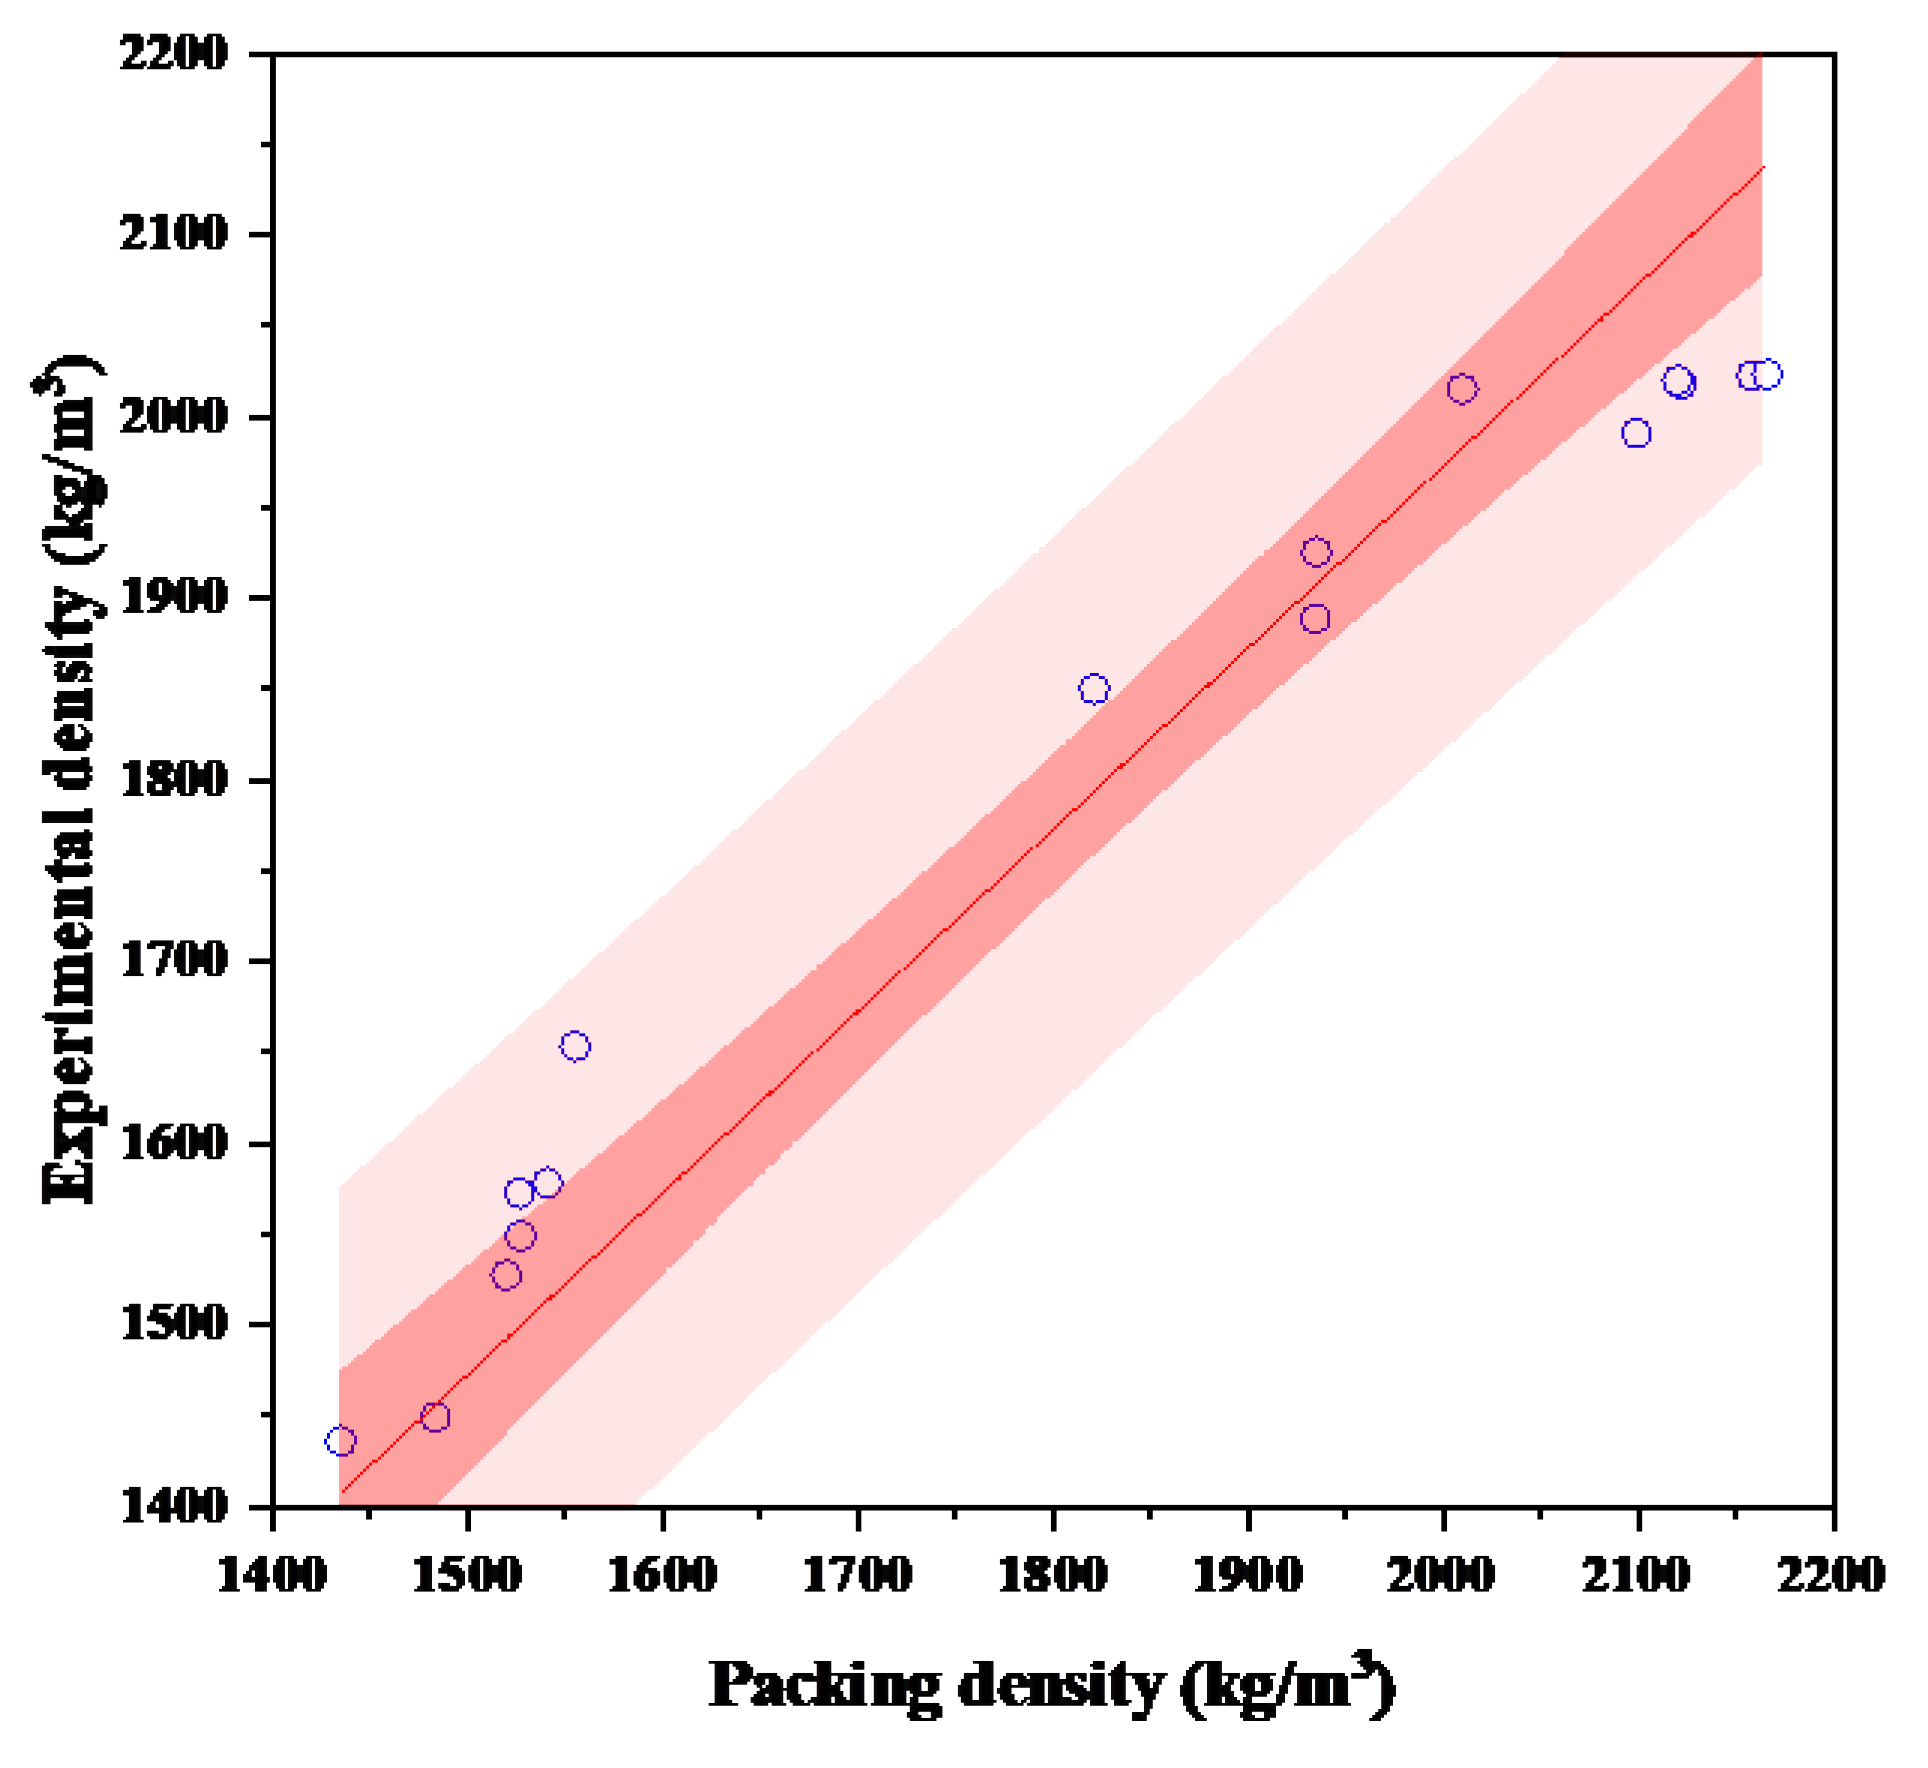
Figure 6.
Comparison of specific surface area values calculated by image analysis and spherical particle hypothesis.
Figure 6.
Comparison of specific surface area values calculated by image analysis and spherical particle hypothesis.
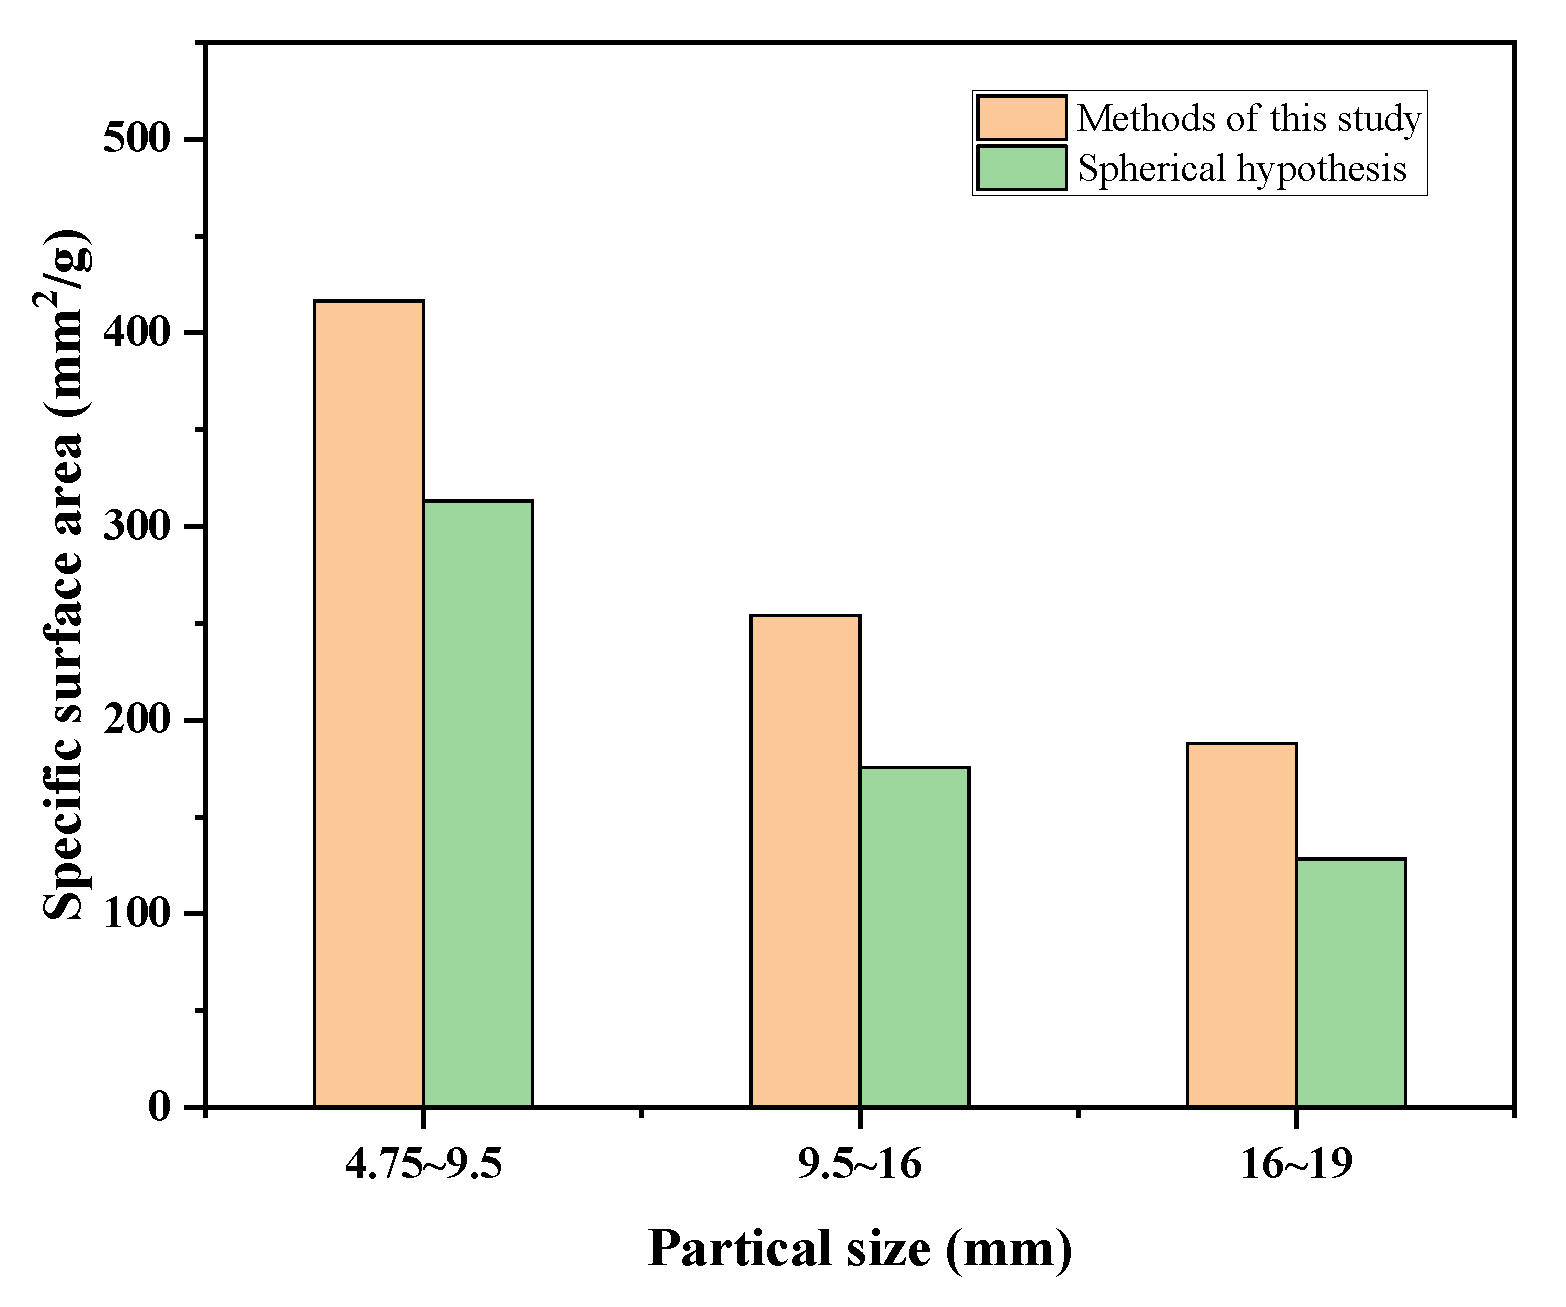
Table 1.
Interaction coefficient between fractions.
| 26.5 | 19 | 16 | 9.5 | 4.75 | 2.36 | 1.18 | 0.6 | 0.3 | 0.15 | 0.075 | i | |
| 26.5 | 1.000 | 0.849 | 0.751 | 0.486 | 0.256 | 0.131 | 0.066 | 0.034 | 0.017 | 0.008 | 0.004 | bij |
| 19 | 0.851 | 1.000 | 0.937 | 0.646 | 0.350 | 0.180 | 0.092 | 0.047 | 0.024 | 0.012 | 0.006 | bij |
| 16 | 0.782 | 0.921 | 1.000 | 0.741 | 0.410 | 0.213 | 0.109 | 0.056 | 0.028 | 0.014 | 0.007 | bij |
| 9.5 | 0.603 | 0.712 | 0.775 | 1.000 | 0.646 | 0.348 | 0.180 | 0.093 | 0.047 | 0.024 | 0.012 | bij |
| 4.75 | 0.427 | 0.504 | 0.549 | 0.712 | 1.000 | 0.643 | 0.348 | 0.183 | 0.093 | 0.047 | 0.024 | bij |
| 2.36 | 0.301 | 0.356 | 0.388 | 0.503 | 0.710 | 1.000 | 0.646 | 0.356 | 0.184 | 0.094 | 0.047 | bij |
| 1.18 | 0.213 | 0.252 | 0.274 | 0.356 | 0.503 | 0.712 | 1.000 | 0.655 | 0.356 | 0.184 | 0.094 | bij |
| 0.6 | 0.152 | 0.179 | 0.196 | 0.254 | 0.359 | 0.509 | 0.718 | 1.000 | 0.646 | 0.350 | 0.182 | bij |
| 0.3 | 0.107 | 0.127 | 0.138 | 0.179 | 0.254 | 0.360 | 0.509 | 0.712 | 1.000 | 0.646 | 0.350 | bij |
| 0.15 | 0.076 | 0.090 | 0.098 | 0.127 | 0.179 | 0.255 | 0.360 | 0.504 | 0.712 | 1.000 | 0.646 | bij |
| 0.075 | 0.054 | 0.063 | 0.069 | 0.090 | 0.127 | 0.180 | 0.255 | 0.357 | 0.504 | 0.712 | 1.000 | bij |
| j | aij | aij | aij | aij | aij | aij | aij | aij | aij | aij | aij |
Table 4.
Reference data for surface area and packing density of each particle size.
| Partical size /mm | 26.5 | 19 | 16 | 13.2 | 9.5 | 4.75 | 2.36 | 1.18 | 0.6 | 0.3 | 0.15 | 0.075 |
| Volumetric surface area /mm-1 | 0.16 | 0.23 | 0.27 | 0.33 | 0.45 | 0.91 | 1.83 | 3.66 | 7.20 | 14.40 | 28.80 | 57.60 |
| Stacking compactness /% | 56.3 | 58.1 | 55.7 | 55.9 | 56.4 | 57.1 | 62.6 | 59.1 | 59.1 | 57.3 | 57.2 | 57.0 |
Disclaimer/Publisher’s Note: The statements, opinions and data contained in all publications are solely those of the individual author(s) and contributor(s) and not of MDPI and/or the editor(s). MDPI and/or the editor(s) disclaim responsibility for any injury to people or property resulting from any ideas, methods, instructions or products referred to in the content. |
© 2025 by the authors. Licensee MDPI, Basel, Switzerland. This article is an open access article distributed under the terms and conditions of the Creative Commons Attribution (CC BY) license (http://creativecommons.org/licenses/by/4.0/).
Copyright: This open access article is published under a Creative Commons CC BY 4.0 license, which permit the free download, distribution, and reuse, provided that the author and preprint are cited in any reuse.


