Submitted:
21 May 2025
Posted:
22 May 2025
You are already at the latest version
Abstract
As urbanization accelerates, towns and cities worldwide face the challenge of planning nutrition security for their growing populations, in the context of their local food systems. Urban food systems in low- and middle-income countries are often complex, with large geospatial spread in the flow of foods. This complexity is compounded by the frequently informal nature of the markets and value chains governing flows, and the changing climate. Urban planners could benefit from tools to plan their nutrition security in such settings, but there is little research on such methods and tools.Our study proposes a novel approach, NutriShed, to map the origins and flows of key micronutrients, and illustrates its application in two Ghanaian cities: Takoradi and Assesewa. Nutrished involves objectively identifying vulnerabilities within nutrient supply chains and food systems infrastructure as a means to unravel the flow of food into and through cities. The NutriShed approach is guided by a framework designed to track the spatial flows of essential nutrients into and out of the study communities, focusing on nutrient gaps, regional production deficits, and food system vulnerabilities. The NutriShed approach is structured in several stages: Stage I identifies nutrient gaps using dietary surveys of vulnerable population sub-groups. In stage II, quantifies nutrient flows by surveying food markets, traders, and food transport systems. Stage III utilizes geospatial tools to map nutrient flows and assess food system infrastructure and climate vulnerabilities. Stage IV examines nutrient flow vulnerabilities in relation to road density, climate risks, and infrastructure usage. Stage V identifies nutrition-sensitive interventions using GIS techniques to propose strategies for enhancing nutrient supply and bolstering food system resilience. Throughout the process, it is important to engage with relevant stakeholders to ensure participation and uptake of findings for planning and implementation.
Keywords:
food security
; nutrition security
; micronutrients
; food systems
; NutriShed
; Methodology
; Ghana
Background
As rural-urban migration accelerates and the world becomes ever more urbanised, cities around the world need to be increasingly strategic about options for meeting the human development needs of their populations, in a sustainable fashion. The considerable focus on cities is reflected in initiatives such as, ‘Healthy Cities’, ‘Smart Cities’ and ‘One Planet Cities’ (Calzada et al 2023) which highlight the importance of aligning city-centered planning within emerging city development frameworks. Food systems are, inevitably, a key aspect of such strategic city planning processes; there is a need to provide equitable and sustainable nourishment opportunities to city populations within the context of increasing local production capacity, leading to smarter consumption.
A nutritionally secure city is one in which every resident (irrespective of their economic or social status) has the ability to sustainably meet their nutrition needs without jeopardizing the immediate and wider environmental integrity. Such conditions align with several Sustainable Development Goals (SDGs), namely the eradication of hunger and tackling of malnutrition (SDG 2), ensuring healthy lives and the promotion of well-being (SDG 3), sustainable and resilient cities (SDG 11), and the underlying universal value of ‘leaving no one behind’ (Sayed 2015). Critically, the achievement of nutrition security must be resilient to shocks that disrupt markets and the food systems that distribute food over time and space (including food systems trade, transport, and storage).
Disruptions in food value chains during the COVID-19 pandemic (Galanaski 2020) have heightened the need for community planners and the research community to become better prepared to manage food systems using evidence-informed approaches. Furthermore, with the anticipated exacerbations of climate change its impacts are expected to increase the likelihood of periodic crop failures (Caparas et al 2021). As a result, the need for policymakers to understand the origins, adaptability and resilience of their food sources is becoming ever more relevant.
The global food system is characterised by complex and often highly informal value chains, particularly across low- and middle-income countries (LMICs). These value chains typically begin in rural production zones, where smallholder farmers form the backbone of agricultural output, and extend into urban centres where the demand for diverse and nutrient-rich foods is growing rapidly due to urbanisation and shifting dietary preferences (Ridoutt et al 2019; Vos et al 2020; Barrett et al 2022). However, the growth in demand has not been matched by a commensurate transformation in the structure and functionality of urban food markets. In many parts of the Global South, urban food markets continue to operate as open-air venues, often in congested and unregulated environments. These informal markets play a crucial role in ensuring access to food for the majority of urban dwellers, especially the urban poor, but they also face persistent challenges related to hygiene, infrastructure, and governance. Food handling practices in these settings frequently fall short of basic sanitation and food safety standards, increasing the risk of contamination and foodborne illnesses (Kushitor et al 2022; Nijhawan et al 2023; Jaffee and Hanson 2024).
Transportation of food from rural to urban areas is frequently carried out through informal logistics systems, involving small-scale traders and middlemen who lack access to refrigerated vehicles or standardised storage facilities. As a result, perishable foods such as fruits, vegetables, dairy, meat, and fish suffer from high levels of spoilage and waste before they even reach consumers. The absence of cold chain infrastructure and the limited use of modern preservation techniques amplify food loss, reduce availability, and drive up the prices of nutrient-dense foods (Parfitt, Barthel and Macnaughton 2020; Ridoutt et al 2019). Moreover, informal market settings often lack regulatory oversight, and the coordination between actors across the value chain is weak or fragmented. This not only affects food quality and safety but also limits opportunities for upgrading these markets through innovation, investment, and policy reform. As a consequence, vulnerable populations face a double burden: poor nutritional outcomes due to limited access to affordable, high-quality food, and increased exposure to unsafe food environments.
In the West Africa region, particularly in Ghana where we conducted this study, a few studies have emerged examining how local food value chains connect to sub-optimal diets and malnutrition among urban consumers (Robinson 2013; Mockshell et al 2022). Despite this, it remains unclear what strategies, if any, urban planners are using to enhance access to nutrient-rich foods in Ghanaian cities, especially for the most socio-economically vulnerable populations. Among the available methodological frameworks for planning community nutrition security, food environment analysis is increasingly being used to understand the contexts within which people make consumption decisions, including the variety of local sources of food and their ‘objective’ (e.g., opening hours, prices, built and digital infrastructure) and ‘subjective’ characteristics’ (i.e., perceptions held by local consumers regarding the hygiene and affordability of food available) (Turner et al 2018; Ose-Kwasi 2021; Choudhury et al 2025). While this approach is valuable for examining the number and diversity of retail options available to consumers within a particular locality, food environment studies do not explore food supply issues, their origins, diversities, and stabilities which often operate beyond the consumers’ day-to-day activity space (Figure 1). Therefore, the effect of midstream processes such as food processing, storage, and transportation, on downstream food and nutrient availability, affordability and desirability, remain beyond the scope of food environment analysis.
Another approach, ‘value chains for nutrition,’ employs traditional value chain survey techniques to identify the people, organisations and processes which move and transform nutritionally important produce from ‘farm to fork’ (Hawkes & Ruel 2011; Allen & de Brauw 2018). However, value chain analysis (VCA) has a number of shortcomings for community-specific nutrition security planning (Figure 1). First, the traditional single commodity focus tends to make the approach less informative about the diversity of foods, pathways (e.g., transport routes), and processes contributing to key nutrient supplies. Second, VCA tends to start with the producer and then follows the value downstream, as opposed to starting with the consumer and the nutrients which matter to them. Third, VCA rarely explicitly accounts for space; yet, food systems are inherently linked to spatial patterns of transport, markets and infrastructure, with food flows influenced by both natural and social geographies.
Although relatively nascent in food systems and nutrition research to date, foodshed analysis emerged during the 1990s as an approach to link urban food consumption to local, national and international production regions (Kloppenburg et al 1996). Similar to the idea of a watershed, foodshed analysis depicts spatially explicit networks of source regions and consumption locations (i.e., network nodes), which are connected by transport routes and associated infrastructures (i.e., the network spokes). Recent studies have mapped empirical data to define the foodsheds of major cities in West (e.g., Karg et al 2016; Karg et al 2023) and East Africa (e.g., Hemerijckx et al 2023). A recent systematic review (Schreiber et al 2021) highlights a number of pressing research gaps, namely the often relatively rudimentary analyses of diets and nutrition, with studies tending to overlook the origins and seasonal flows of priority nutrients (including iron, Vitamin A) in favour of analyses of commercially important food items. To this end, the tendency of foodshed analysis to date to focus on single food items fails to capture the array of commodities which contribute to the nutritional security of a locality or community. These micronutrient deficiencies remain a critical public health concern, especially in low- and middle-income countries (LMICs), affecting billions of individuals and contributing significantly to the global burden of disease. Deficiencies in iron and vitamin A impair physical and cognitive development, reduce immune function, and increase morbidity and mortality, especially among women and children (Scott, 2020; Engidaw et al 2022; Fite et al 2022). The implications extend beyond individual health, undermining economic productivity and perpetuating cycles of poverty and underdevelopment. For example, iron deficiency alone is estimated to reduce national productivity levels by up to 20% in some LMICs due to its impact on cognitive and physical performance (WHO 2020). Addressing these deficiencies through targeted nutrition interventions is crucial for sustainable development and improved public health outcomes.
Therefore, in this study, we introduce a ‘Nutrished’ approach that maps and generates evidence on the origins and flows of nutrient-rich foods that supply key nutrients, illustrated with an application to selected cities in Ghana (Takoradi and Assesewa). This methodology involves identifying and assessing vulnerabilities in key nutrients, before tracking their inbound flows along their respective supply chains, from origin to destination. The method also incorporates spatially explicit data on the number and nature of priority food systems infrastructures, including markets, food processing, and (cold) storage, enabling appreciation of their role in nutrient flows. These infrastructures have so far been overlooked in the foodshed literature in favour of studying direct pathways between production and consumption zones (Karg et al 2016; Swiader et al 2018). The aim of this paper is to describe this novel approach with the aid of an application to two cities in Ghana. The detailed findings of the applications are forthcoming in subsequent publications elsewhere (e.g. Dake et al 2025; Cooper et al 2025).
The NutriShed Framework
The "Nutrished" framework (Figure 2) focuses on tracking spatially explicit nutrient flows into and out of study communities. Sequentially, it: (i) assesses the nutritional needs and priorities within the study communities, (ii) determines regional gaps in production, food markets, and infrastructure, (iii) identifies vulnerabilities in critical nutrient flows, and (iv) employs empirical spatial tools and systems modelling to devise strategies for enhancing nutrition security. The key stages of this approach are described in detail, below.
Stage 1: Identifying the Nutrient gaps
The NutriShed assessment framework begins with a nutrient gap analysis. We identified specific nutrient deficiencies and nutrition priorities across the study locations. We conducted a household-level dietary assessment survey including nutritionally vulnerable groups (women, children, and adolescents) in the two study communities. The dietary analysis enabled identification of the limiting nutrients in the diets of respondents. The women were aged 18 years or older and were selected because of their role in household food purchase, and cooking decisions; adolescents between ages 12 to 18 years, and children aged 2 to 5 years from selected households. Only one eligible woman, adolescent, or child was recruited per household for the dietary assessment.
For the dietary assessment survey, we adapted the interactive 24-hour recall method by Gibson and Ferguson (2008), administered using computer-assisted personal interviewing. A multiple-pass approach was employed in conducting the dietary recall interviews. In the first pass, the respondent listed all the foods and drinks (including drinking water) consumed during the preceding 24-hour period. In the second pass, the interviewer guided the respondent through each food item listed, in chronological order, probing for more detailed descriptions, including cooking methods and, where relevant, brand names. The third pass involved estimating portion sizes for the reported foods and drinks. In the fourth and final pass, the interviewer reviewed the recall to ensure that all items were accurately recorded. The types and quantities of food consumed were estimated using household measures, food models, volumetric cups, measuring spoons, and a photographic food atlas with weights.
Following the 24-hour dietary recall, a nutrient gap analysis was conducted by analyzing the dietary intake reported by participants. At the initial stage of analysis, dietary intake data were translated into nutrients and energy using a combination of the Food Recognition Assistance and Nudging Insight (FRANI) food database, the Research to Improve Infant Nutrition and Growth (RIING) food database, and a compilation of nutrients from the West Africa Food composition database. These databases contain nutrient data on indigenous foods typically consumed in Ghana. These food databases include nutrient content data for macro- and micro-nutrients like energy, carbohydrate, protein, fat, fibre, calcium, zinc, vitamin A, thiamin, riboflavin, niacin, vitamin B6, vitamin B12, folate, iron, pantothenic acid and vitamin C. Food ingredients used in preparing each meal were equated to the closest food code in the RIING database. The consumed quantities (portion sizes) captured in grams were then entered into the RIING database and the code that is the most accurate description of each reported meal was selected in the database. This selection automatically produces nutrient and energy values commensurate with each consumed portion size using MS Excel. This was followed by further analysis using the STATA statistical software (version 17). The estimated average requirement for each nutrient, appropriate for the respective age group and gender, was compared against the respondents' intake to evaluate adequacy. Intake of nutrients less than the Estimated Average Requirement (EAR) were identified as limiting nutrients in the participant groups' diets. In the next stage of the NutriShed framework, the target foods associated with supply of the priority nutrients were tracked to map their flow in and out of the study communities.
Stage II: Quantifying Nutrient Flows
The next step of the NutriShed approach focused on identifying and quantifying the flow of target foods (foods identified as having high content of priority nutrients) into our study communities. This process required surveys to collect primary data on (a) quantities of the different target foods being transported into our study sites (e.g., via road intercept surveys), (b) the range and characteristics of different food systems infrastructures located within the vicinity of our local communities (e.g., roads, food processing units and storage facilities), and (c) the conditions and characteristics of local markets for nutrient-dense foods receiving the inbound flows of our target foods within our study communities.
The first survey targeted food market actors including suppliers, commission agents, market managers, and market queens, operating at diverse locations: markets, lorry stations, food warehouses, and port facilities within the study communities. The aim of this survey was to collect data on the geographical origins, destinations, and sizes of food flows reaching the communities, as reported by local market actors. The surveys also gathered information on the number, capacities, and routes of traders, as well as the provenance, volumes, and types of nutrient-dense foods.
A second survey, focused on traders and market agents and targeted those transporting produce into the study communities using mobile-based survey techniques. These surveys were designed for rapid administration, taking only 5–10 minutes to collect data on the origins, destinations, and types of commodities flows as well as the quantity of food being transported.
A third survey, the road intercept survey, helped triangulate the first and second surveys. It tracked the movement of vehicles transporting food products in and out of major access roads. These surveys were conducted over a three-day period during each of the peak production seasons (July/August) and the lean season (February/March). Information collected from traders at the roadside included the sources and destinations of food loads, the overall weight, and the composition of commodities.
To support the triangulation of data, a spatial reference group was established at the study sites to help verify the sources, quantities, and seasonal variations of nutrient flows.
Stage III: Geospatial Toolkit
In stage II, the aim was to depict and characterise the Nutrisheds for both of our study sites (i.e., Takoradi and Asesewa) and across seasons (i.e., dry and wet seasons). Our analysis relied on previous literature on commodity specific Foodsheds (e.g., Karg et al 2016; Hemerijckx et al 2023; Karg et al 2023), first by considering the origins of multiple nutrient-foods rich in our four identified key limiting nutrients (i.e., iron, folic acid, calcium and Vitamin B12) - aggregated to the Nutrished level. We also focused on the characteristics of the Nutrished catchments with regards to the quantity and quality of food systems infrastructure (e.g., roads, population densities, storage and processing facilities), climate vulnerability, and variations across seasons (Figure 3).
Further, we collected multiple sources of open-access geospatial data (raster or vector formats) to understand the wider food systems enabling environment associated with our study regions and across Ghana, more broadly. These datasets included national level land cover and land use from the remote sensing derived MERIS GlobCover dataset, the locations of different national and regional roads via OpenStreetMap, population hexagons for the country at 400 metre resolution via Kontur Population (available via United Nations Office for the Coordination of Humanitarian Affairs (OCHA) services), and estimates of the climate risk and conflict risk as determined by the Climate-Conflict-Vulnerability Index (CCVI) of the German Federal Foreign Office (Table 1). These secondary datasets provide a canvas upon which to overlay the primary datasets from Stage II. This enabled analysis of road density, population density, and climate data in the study communities.
The primary data collected in Stage II required the digitisation of survey responses in order to be mapped. During the road intercept surveys, transporters were asked to provide the names of the production villages for each of the different items being transported, as well as the name of a nearby town to help triangulate the exact village (i.e., in case of multiple villages with the same name). The locations of production villages were then digitised in Microsoft Excel by exporting the latitudes and longitudes from Google Maps. Where villages were not present on Google Maps, we searched popular public mapping websites such as MapCarta, Latlong.net and Tageo. Where villages could not be located after the above two steps, we used the geo-coordinates of the nearby town associated with the production village that was provided during the intercept survey. Across both seasons and destinations, this process produced 770 records of food inflows (i.e., food item, quantities, transport modes etc) and 274 records of outflows.
These Excel datasets were then exported as Comma Separated Values (CSV) files readable as Delimited Text layers in the open access GIS software QGIS (v.3.28). From here, the Nutrisheds of each limiting nutrient were mapped using two of QGIS’s in-built geospatial processing functions, namely (i) ‘Join by lines (hub lines)’ - which provides straight line Euclidean geometry connections between source locations and destination locations (i.e., Asesewa and Takoradi), and (ii) the ‘Minimum bounded geography’ tool using ‘convex hull’ geometry - which creates a polygon representing the smallest region that encloses all of the source locations for a given limiting nutrient (e.g., iron) flowing towards our two study sites (i.e., Asesewa and Takoradi). Similar to a watershed, i.e., the topographic features which bound a river catchment, the convex hull here represents the catchment area bounding all sources of our limiting nutrients within the survey periods.
The previous steps mapped the flow of nutrients across space (i.e., from source to destination). We performed two further calculations to understand the spatial dimensions of the different Nutrisheds across seasons. First, the ‘Distance to nearest hub (Line to hub)’ tool calculates the Euclidean distance in kilometres between each source location and destination - estimating the minimum distances that each nutrient flow must travel to arrive at our study sites. This calculation generated information on how the cumulative quantities of nutrient supplies vary with distance from the study sites - thus depicting the dependency of Takoradi and Asesewa on local and/or distant food supplies. Second, to understand the orientation of the Nutrisheds, we used QGIS’s inbuilt trigonometric functions (i.e., ‘atan’ function) to calculate the directional bearing (i.e., 0-359°) of each Euclidean pathway between source and destination using the following equation in the QGIS field calculator:
Equation 1: AngleN, D, T = CASE WHEN ((yat(-1)-yat(0)) = 0 and (xat(-1) - xat(0)) >0) THEN 90 WHEN ((yat(-1)-yat(0)) = 0 and (xat(-1) - xat(0)) <0) THEN 270 ELSE (atan((xat(-1)-xat(0))/(yat(-1)-yat(0)))) * 180/pi() + (180 * (((yat(-1)-yat(0)) < 0) + (((xat(-1)-xat(0)) < 0 AND (yat(-1) - yat(0)) > 0)*2))) END.
Where N equals unique nutrient (i.e., iron, calcium, vitamin B12 and folic acid), D equals destination (i.e., Asesewa or Takoradi), T equals season (i.e., wet or dry), and yat and xat equal the latitude and longitude of the Euclidean pathways, respectively.
As a result of the above analyses, for each of the four limiting nutrients flowing into Asesewa and Takoradi, we are able to compare seasonal estimates of (i) the number of production sources and the associated catchment area, (ii) the variation in supply contributions against distance from Asesewa and Takoradi, and (iii) the directional dependency of nutrient inflows into our study sites.
Stage IV: Assessment of nutrient flow vulnerabilities
Stage IV of the Nutrished approach aims to provide insights for town and city planners into (a) the origins of the key limiting nutrients flowing into their communities, (b) the current usage of existing food system infrastructures (e.g., storage and processing facilities) within their communities, and (c) the potential vulnerability of the Nutrisheds to anthropogenic and/or climatic disruption. To this end, for each of the four Nutrisheds across the two study sites and two seasons, we quantify (i) all-weather road densities, (ii) climate risk, (iii) conflict risk, and (iv) the current congruence between the use of existing food system infrastructures and the needs of the limiting nutrient flows.
Unlike feeder road tracks that are vulnerable to being washed away during heavy rainfall events, all-weather roads provide relatively permanent and reliable transportation routes to connect producers with downstream consumers throughout the year (Rammelt and Leung 2017; Weatherspoon et al 2017). Therefore, as a proxy for the level of road connectivity between source locations and study communities, we calculated the density of all-weather roads within each Nutrished (km/1000 ㎢). As per OpenStreetMap data available via the online repository GeoFabrik, all-weather roads are considered as those labelled ‘primary’, ‘secondary’, or ‘tertiary’ classifications; as such, roads labelled as ‘track’, ‘residential’, ‘service’, ‘path’ and ‘bridleway’ are omitted from the analysis using the QGIS layer filter function. Lastly, road density was calculated by dividing the summed length (km) density of the three included road classifications within a particular Nutrished by the total area (㎢) of the Nutrished. Nutrisheds with comparatively low road densities are considered to be relatively vulnerable to poor connectivity, including a sparsity of alternative routes in case the primary route between source and destination is impassable (e.g., during a flood event).
Next, the climate and conflict risks of all Nutrisheds were quantified using georeferenced data from the Climate-Conflict-Vulnerability Index (CCVI) dataset of Mittermaier et al. (2025). Publicly available at 0.5° resolution, the CCVI integrates multiple global coverage datasets to quantify local climate and conflict risks across the entire globe. As detailed in Mittermaier et al (2025), the climate and conflict risks at any given point is a function of ‘climate/conflict exposure’ multiplied by ‘vulnerability’. ‘Climate exposure’ is a composite index of current (i.e. past three months) and accumulated (i.e. past 7 years) droughts, heatwaves, heavy precipitation, wildfires, floods and tropical cyclones, and the mean precipitation anomaly (past 30 years relative to 1951-1980 baseline), mean temperature change (past 30 years relative to 1850-1900 baseline), and relative sea level rise from 1993-2005. Next, ‘conflict exposure’ is a composite index of the intensity and persistence of (a) local conflict and (b) popular interest (i.e., protests and riots). Lastly, ‘vulnerability’ is a composite index constituting 14 indicators of socioeconomic (e.g., gender inequality, health vulnerability, economic deprivation), political (e.g., civil rights deprivation, ethnic marginalisation) and demographic (e.g., uprooted people, population growth) vulnerabilities. For our Nutrisheds, we use QGIS’s in-built ‘Distance to nearest hub (Line to hub)’ function to associate each production source with its nearest recorded data point for climate risk and conflict risk; in turn, for the catchment areas, the spatial ‘clip’ tool is used to subset the climate risk and conflict risk values located within the convex hull of each Nutrished catchment.
In addition to the nutrient flow data, we also analysed the geospatial data collected on the markets, storage and processing infrastructures for nutrients dense foods (NDFs) in Asesewa and Takoradi. In particular, we explored the number and type of different infrastructures (e.g., cold storages, regular storages, processing facilities, and collection centres), and documented the practices related to storage and/or processing nutrient-rich target food identified.
Stage V: Identify catchment level nutrition-sensitive strategies and interventions
Stage V employed Geographical Information Systems (GIS) techniques to examine the solution space of alternative interventions to boost nutrient supplies towards underserved study communities. The process involved analysing catchment area land-use and identifying potential for local production to bolster nutrient supply. We used spatial multi-criteria decision analysis to examine strategic locations for new markets or cold-storage facilities. This was followed by qualitative systems dynamic modelling to scope potential future (i.e., multi-decadal) trade-offs emerging from the solution space, including modelling the key feedback loops and system archetypes (Senge 1990) driving the distributions of nutrients, environmental impacts, and the participation of women and other underrepresented groups in NutriShed. A portfolio of strategies was then compiled for community stakeholder consideration.

Box 1.
Portfolio of identified strategies for improving food market system.
Strategies to Improve local production (Takoradi)
|
VI. Engaging with stakeholders/reference groups
Throughout the project, we engaged with relevant community- and national-level experts, decision-makers, and key actors (Reference Group). To ensure effective participatory planning, and buy-in, two types of meetings were held with the Reference Groups in Asesewa and Takoradi. Reference Group members were selected based on their expertise, and roles in health, agriculture and education in their respective districts and at the national level.
The first Reference Group meeting involved national-level experts, community leaders, NGO actors, and academics. This meeting presented the project plan and solicited their input to ensure implementation feasibility, and to identify all relevant stakeholders to involve. The second Reference Group meeting brought together supply chain actors including traders and retailers—to discuss the perceived benefits and trade-offs of the proposed study. Subsequently, a broader range of stakeholders including the Reference Group, from each city, were engaged during the dissemination of the preliminary findings. This convening generated conversations around local production of nutrient rich foods, transportation and barriers to healthy eating. Stakeholders further highlighted the strategies they consider critical to address barriers to access food from local markets (see box 2).
Box 2.
Strategies that were considered critical to address barriers to access food from local markets.
Box 2.
Strategies that were considered critical to address barriers to access food from local markets.
Takoradi:
|
Lessons learned
Pre-testing and thorough training played a pivotal role in the successful implementation of the NutriShed study. A mixed-format approach to training, incorporating both online and in-person sessions, was employed to ensure that all enumerators, including police officers, fully understood the survey tools and objectives. In Takoradi, enumerators practiced dietary interviews in a school setting under the supervision of both school authorities and a field supervisor, enabling enumerators to address potential data collection issues prior to field data collection.
Reconnaissance activities, including prior investigations on market days along trade routes, as well as a pretest conducted on the Sekondi–Accra Road, significantly contributed to the optimization of field data gathering strategies. Engaging market women leaders (also known as market queens in Ghana) in each of the cities provided insights into market schedules, helping to align the survey days with ‘specific market days’ for particular foods.
In Takoradi, the field team was organized into smaller units of 3-4 individuals, with the most experienced member assigned as the team leader for each division. These smaller teams proved to be highly effective, covering more ground, ensuring accountability, and facilitating quick responses to any issues that arose. The use of smaller, well-organized teams also helped to streamline task-sharing, reduce data collection time, and improve overall efficiency and accuracy.
The structure and communication within the team were further enhanced through the use of local enumerators, who were familiar with the language, local navigation, and community dynamics. This approach not only increased trust from community members but also contributed to more efficient training and improved data quality, as many enumerators had previous fieldwork experience. The enumerators' formal education, with the lowest qualification being senior high school certification and the highest being a first degree, further contributed to the quality of the data collected. Regular field presence and open communication channels with the field supervisor played a significant role in boosting team morale and ensuring the accuracy of the collected data.
The logistics of the survey were well-supported by the provision of essential tools and supplies. Enumerators were equipped with reflective vests, name tags, pens, and notepads, which enhanced professionalism and provided backup in the event of digital tool failures. Daily preparedness was also ensured through early morning phone calls to team leaders and police officers during intercept surveys, enabling the reassignment of roles in cases where team members were unavailable due to illness or other reasons. Incentives and allowances were provided to both enumerators and police officers throughout the data collection process, covering transport and communication expenses and ensuring smoother coordination between supervisors and fieldworkers. Additionally, respondents in the surveys were given incentives, such as books and pens, as compensation for their time and participation.
Engagement with the community and road users was an ongoing process throughout the survey. Repeated interactions with drivers, police officers, and market actors helped to build trust and foster voluntary compliance. Some informed community members, having been briefed by enumerators, took the initiative to explain the nature of the surveys to others, further increasing community participation and trust in the process. Health and safety measures were prioritized during the survey. The use of reflective vests improved visibility, particularly at checkpoints, while nose masks provided protection against dust and other airborne particles.
Appointment scheduling was another critical element in ensuring the success of the dietary surveys. Targeted scheduling with parents helped to avoid missed appointments, and conducting interviews after school hours and on weekends proved to be the most effective strategy. By scheduling appointments with both parents and children, the team ensured that dietary and backtrack surveys were conducted at convenient times, thereby maximizing efficiency and minimizing the risk of missed interviews. Given that school children had lessons from 8:00 am to 3:00 pm, it was crucial to schedule interviews outside of these hours to ensure successful data collection.
Key Challenges
One of the primary challenges encountered during the dietary surveys was availability of participants at home. Meeting adolescents at home for interviews was challenging because they spent much of the day in school. This issue was mitigated by arranging appointments after 3:00 pm and on weekends. Secondly, the estimation of food quantities was difficult for younger respondents; they were unable to accurately recall or describe the content of meals they had consumed, without adult supervision. We had to follow-up some of them in school to gather missing information. This approach was further challenged by the need for appropriate parental permissions to enable their wards to be accessed at school.
During the data collection period, ongoing road construction created significant disruptions to the intercept survey, particularly in Takoradi. Active roadworks led to certain roads being blocked on specific days. These unexpected changes in traffic patterns disrupted some planned data collection activities. In such situations, supervisors worked with enumerators and the local police to identify alternative stop points.
Language was a barrier to the identification of some indigenous foods. For example, waterleaf (Talinum Triangulare), known as bokoboko in Asesewa, is known as kotubete in Takoradi. The study team had to learn and adapt to the indigenous names of various foods in order to effectively communicate the prioritized foods during the intercept surveys.
During the intercept surveys, some drivers were hesitant to stop at police checkpoints and will speed off due to fear of potential challenges from being stopped by the policy. Additionally, the police officers' attention was divided between their normal duties and supporting the data collection efforts, which occasionally resulted in missed opportunities for data collection. Punctuality also posed a challenge, as delays from either police officers or enumerators sometimes hindered the timely commencement of early morning data collection.
Logistical constraints further complicated the intercept surveys. As stated previously, some roads were under construction or redirected, leading to unexpected traffic patterns and increased dust levels, which affected both the enumerators and the survey respondents. Moreover, some police checkpoints were situated at distances that were not ideal for intercept surveys, requiring the team to temporarily set up checkpoints in alternate locations. Lastly, there was a noted low police presence in Asesewa, which hindered the survey process. The involvement of Community Police Assistants (CPAs) was deemed necessary to address this issue, but their limited authority and lack of respect within the community reduced their effectiveness in supporting the survey activities.
These challenges were addressed through adaptive iterative problem-solving strategies, based on engagement with stakeholders. These strategies helped to mitigate the impact of the barriers and enabled the data collection activities to be completed.
Limitations
The current study gathered data at different times across the two studies. Dietary and market data were collected in Asesewa from July 31 to August 13, 2023; subsequently, data from Takoradi was collected from September 4 to 18, 2023. Additional data were collected subsequently in 2020 but this time, the data were collected around the same period, minimizing the potential for bias due to temporal differences in the data collection. Secondly, the intercept survey was based on data that cannot be compared across cities. This is because the road network, transportation system and the market locations were not similar across the cities. Similarly, the dietary behaviors and food types were not comparable across the two cities. Thus, the data has not been analysed to compare the two cities.
Conclusions
As cities grow, the need for sustainable food systems intensifies. It is crucial to prioritize nutrition security in urban areas, particularly in the face of deepening climate change, food supply disruptions, and socio-economic inequality. The Nutrished approach presented in this study offers a comprehensive method to assess and map nutrient flows within urban food systems, focusing on the availability, affordability, and distribution of key nutrients. Tracking these nutrient flows, identifying gaps, and evaluating the resilience of food systems enables policymakers and urban planners to develop targeted strategies to enhance nutrition security for vulnerable populations.
The NutriShed framework offers a valuable and timely contribution to urban nutrition planning, particularly in low- and middle-income settings where food systems are complex, informal, and increasingly vulnerable to climate change. By combining dietary surveys, market assessments, geospatial mapping, and infrastructure analysis, NutriShed provides a comprehensive method to trace the flow of essential nutrients into and through urban areas. Its strength lies in its ability to reveal nutrient gaps, pinpoint vulnerabilities in food supply chains, and guide targeted, nutrition-sensitive interventions. Applied in Ghanaian cities like Takoradi and Assesewa, the framework demonstrates its potential to inform practical solutions grounded in local data. For communities and initiatives such as Healthy Cities, NutriShed offers a pathway to embed nutrition considerations within urban planning and development agendas. It supports local authorities, planners, and civil society in making evidence-based decisions that strengthen food systems, enhance climate resilience, and promote equitable access to nutrition. Crucially, NutriShed emphasizes stakeholder engagement, ensuring that planning is participatory and responsive to the needs of vulnerable populations. As urbanization accelerates, frameworks like NutriShed will be essential for building sustainable cities that prioritize both health and food security at the systems level.
Authors contribution: Conceptualisation: BS, RA, GC, and RAr.Data Curation: FD, SA, GC, EKY, and BOO. Formal Analysis: SA, FD, EKY, BOO, and GC.Funding Acquisition: BS, RA, RAr, GC, SA, and FD.Investigation: FD, EKY, BOO, and RAr Methodology: BS, GC, RAr, FD, and RAProject Administration: RAr, CE, RA, and BS Supervision: RAr, FD, GC.Writing: RA, RAr, FD, GC and SAWriting - Review and editing: BS and All
Conflict of Interest Statement
We declare that there are no conflicts of interest.
Data Access Statement
This manuscript does not include primary data. Data generated from the project on which this paper is based will be published in our forthcoming papers.
Ethics Statement
As this manuscript aims to describe the NutriShed methods, ethical considerations related to the main project will be detailed in our forthcoming publications
Acknowledgement
We gratefully acknowledge the support of our funders (the Innovative Metrics and Methods for Nutrition and Agriculture (IMMANA), whose contributions made this research possible. We extend our sincere thanks to the local authorities, community leaders, market stakeholders, and other actors in Takoradi and Assesewa for their collaboration and invaluable insights throughout the study. We are particularly grateful to the study participants who generously shared their time, experiences, and knowledge. Their engagement was critical to the success of this work. We also acknowledge the contributions of the field research team and all those who supported data collection and analysis. This study would not have been possible without the collective efforts of all involved.
References
- Allen, S.; de Brauw, A. Nutrition sensitive value chains: theory, progress, and open questions. Glob Food Secur 2018, 16, 22–28. [Google Scholar] [CrossRef]
- Barrett, C.B.; Reardon, T.; Swinnen, J.; Zilberman, D. Agri-food Value Chain Revolutions in Low- and Middle-Income Countries. J. Econ. Lit. 2022, 60, 1316–1377. [Google Scholar] [CrossRef]
- Calzada, I.; Pérez-Batlle, M.; Batlle-Montserrat, J. People-Centered Smart Cities: An exploratory action research on the Cities’ Coalition for Digital Rights. J. Urban Aff. 2021, 45, 1537–1562. [Google Scholar] [CrossRef]
- Caparas, M.; Zobel, Z.; A Castanho, A.D.; Schwalm, C.R. Increasing risks of crop failure and water scarcity in global breadbaskets by 2030. Environ. Res. Lett. 2021, 16, 104013. [Google Scholar] [CrossRef]
- Choudhury, S.; Bi, A.Z.; Medina-Lara, A.; Morrish, N.; Veettil, P.C. The rural food environment and its association with diet, nutrition status, and health outcomes in low-income and middle-income countries (LMICs): a systematic review. BMC Public Heal. 2025, 25, 1–18. [Google Scholar] [CrossRef]
- Engidaw, M.T.; Eyayu, T.; Tiruneh, T. The effect of maternal anaemia on low birth weight among newborns in Northwest Ethiopia. Sci. Rep. 2022, 12, 1–8. [Google Scholar] [CrossRef]
- Fite, M.B.; Tura, A.K.; Yadeta, T.A.; Oljira, L.; Roba, K.T. Prevalence, predictors of low birth weight and its association with maternal iron status using serum ferritin concentration in rural Eastern Ethiopia: a prospective cohort study. BMC Nutr. 2022, 8, 1–10. [Google Scholar] [CrossRef]
- Galanakis, C.M. The Food Systems in the Era of the Coronavirus (COVID-19) Pandemic Crisis. Foods 2020, 9, 523. [Google Scholar] [CrossRef]
- Gibson, R. S., & Ferguson, E. L. (2008). An interactive 24-hour recall for assessing the adequacy of iron and zinc intakes in developing countries. HarvestPlus Technical Monograph Series, 8. International Food Policy Research Institute (IFPRI).
- Government of Ghana. Public Health Act (2012). available at https://www.moh.gov.gh/wp-content/uploads/2016/02/Public-Health-Act-851.pdf. accessed April 28, 2025.
- Hawkes, C.; Ruel, M.T. (2011). Value chains for nutrition - leveraging agriculture for improving Nutrition and health. 2020 Conference Brief 4. 11. avaible at https://cgspace.cgiar.org/items/7e87572c-e198-4db1-8429-2a580aa12635. Accessed April 28, 2025. 20 February.
- Hemerijckx, L.-M.; Nakyagaba, G.N.; Sseviiri, H.; Janusz, K.; Eichinger, M.; Lwasa, S.; May, J.; Verburg, P.H.; Van Rompaey, A. Mapping the consumer foodshed of the Kampala city region shows the importance of urban agriculture. npj Urban Sustain. 2023, 3, 1–10. [Google Scholar] [CrossRef]
- Henry Anim-Somuah, Spencer Henson, John Humphrey and Ewan Robinson (2013). Strengthening Agri-food value chain for nutrition: mapping value chain for nutrition for nutrient-dense foods in Ghana. Institute of Development Studies. Brief Supporting Evidence Report 2. 13. 20 March.
- Issa, I.M.; Munishi, E.J.; Mubarack, K. Challenges facing transportation of urban fruits and vegetables supply chain continuum in Dar es Salaam, Tanzania. Bus. Educ. J. 2022, 11, 1–13. [Google Scholar] [CrossRef]
- Jaffee, S.; Henson, S. (2024). Promoting Food Safety in the Informal Markets of Low-and Middle-Income Countries: The Need for a Rethink. Food Protection Trends, 44(5).
- Karg, H.; Akoto-Danso, E.K.; Amprako, L.; Drechsel, P.; Nyarko, G.; Lompo, D.J.-P.; Ndzerem, S.; Sidibé, S.; Hoschek, M.; Buerkert, A. A spatio-temporal dataset on food flows for four West African cities. Sci. Data 2023, 10, 1–14. [Google Scholar] [CrossRef] [PubMed]
- Karg, H.; Drechsel, P.; Akoto-Danso, E.K.; Glaser, R.; Nyarko, G.; Buerkert, A. Foodsheds and City Region Food Systems in Two West African Cities. Sustainability 2016, 8, 1175. [Google Scholar] [CrossRef]
- Karg, H.; Drechsel, P.; Akoto-Danso, E.K.; Glaser, R.; Nyarko, G.; Buerkert, A. Foodsheds and City Region Food Systems in Two West African Cities. Sustainability 2016, 8, 1175. [Google Scholar] [CrossRef]
- Kloppenburg, J.; Hendrickson, J.; Stevenson, G.W. Coming into the foodshed. Agriculture and human values 1996, 13, 33–42. [Google Scholar] [CrossRef]
- Kushitor, S.B.; Badu, M.; Kushitor, M.K.; Currie, P. “Working with little:” Access to market infrastructure and its effect on food handling and food safety among vegetable traders in an African city. Front. Sustain. Food Syst. 2022, 6. [Google Scholar] [CrossRef]
- Mittermaier, D.; Merschroth, S. ; Šedová,, B.; Auer, C.; Bohne, T.; Ferri, S.; Slouma, S.; Michelini, S.; Gottwick, V. (2025). The Climate Conflict Vulnerability Index (CCVI) - Technical Documentation v1.3. Available online at climate-conflict.org.
- Mockshell, J.; Ogutu, S.O.; Álvarez, D.; Asante-Addo, C.; Asante, F.A. How healthy and food secure is the urban food environment in Ghana? World Development Perspectives 2022, 26, 100427. [Google Scholar] [CrossRef]
- Nijhawan, A.; Budge, S.; Reddy, O.; Bartram, J.; Howard, G. Environmental hygiene in outdoor food markets in Africa: a scoping review. J. Water, Sanit. Hyg. Dev. 2023, 13, 276–288. [Google Scholar] [CrossRef]
- Osei-Kwasi, H.A.; Laar, A.; Zotor, F.; Pradeilles, R.; Aryeetey, R.; Green, M.; Griffiths, P.; Akparibo, R.; Wanjohi, M.N.; Rousham, E.; et al. The African urban food environment framework for creating healthy nutrition policy and interventions in urban Africa. PLOS ONE 2021, 16, e0249621. [Google Scholar] [CrossRef]
- Parfitt, J.; Barthel, M.; Macnaughton, S. Food waste within food supply chains: quantification and potential for change to 2050. Philos. Trans. R. Soc. B: Biol. Sci. 2010, 365, 3065–3081. [Google Scholar] [CrossRef]
- Rammelt, C.F.; Leung, M.W. Tracing the Causal Loops Through Local Perceptions of Rural Road Impacts in Ethiopia. World Dev. 2017, 95, 1–14. [Google Scholar] [CrossRef]
- Ridoutt, B.; Bogard, J.R.; Dizyee, K.; Lim-Camacho, L.; Kumar, S. Value Chains and Diet Quality: A Review of Impact Pathways and Intervention Strategies. Agriculture 2019, 9, 185. [Google Scholar] [CrossRef]
- Sayed, Z. Transforming our world: The 2030 agenda for sustainable development. Ethics & Critical Thinking Journal.
- Schreiber, K.; Hickey, G.M.; Metson, G.S.; E Robinson, B.; MacDonald, G.K. Quantifying the foodshed: a systematic review of urban food flow and local food self-sufficiency research. Environ. Res. Lett. 2020, 16, 023003. [Google Scholar] [CrossRef]
- Scott, J.A. The first 1000 days: A critical period of nutritional opportunity and vulnerability. Nutr. Diet. 2020, 77, 295–297. [Google Scholar] [CrossRef]
- Senge, P.M. (2006). The fifth discipline: The art and practice of the learning organization. Broadway Business.
- Świąder, M.; Szewrański, S.; Kazak, J.K. Foodshed as an Example of Preliminary Research for Conducting Environmental Carrying Capacity Analysis. Sustainability 2018, 10, 882. [Google Scholar] [CrossRef]
- Turner, C.; Aggarwal, A.; Walls, H.; Herforth, A.; Drewnowski, A.; Coates, J.; Kadiyala, S. Concepts and critical perspectives for food environment research: a global framework with implications for action in low-and middle-income countries. Global food security 2018, 18, 93–101. [Google Scholar] [CrossRef]
- Vos, Rob and Cattaneo, Andrea (2020). Smallholders and rural people: Making food system value chains inclusive. In 2020 Global Food Policy Report. Chapter 2, Pp. 14-27. Washington, DC: International Food Policy Research Institute (IFPRI). [CrossRef]
- Weatherspoon, D.D.; Steele-Adjognon, M.; Niyitanga, F.; Dushimumuremyi, J.P.; Naseem, A.; Oehmke, J. Food expenditure patterns, preferences, policy, and access of Rwandan households. Br. Food J. 2017, 119, 1202–1215. [Google Scholar] [CrossRef]
Figure 1.
Conceptual overview of the links between three existing food systems methodologies, their limitations with regards to community-specific nutrition planning, and the NutriShed approach. Key: ✓ strengths of existing approaches; + novel contributions of our NutriShed approach; → core facets and stages of the NutriShed approach.
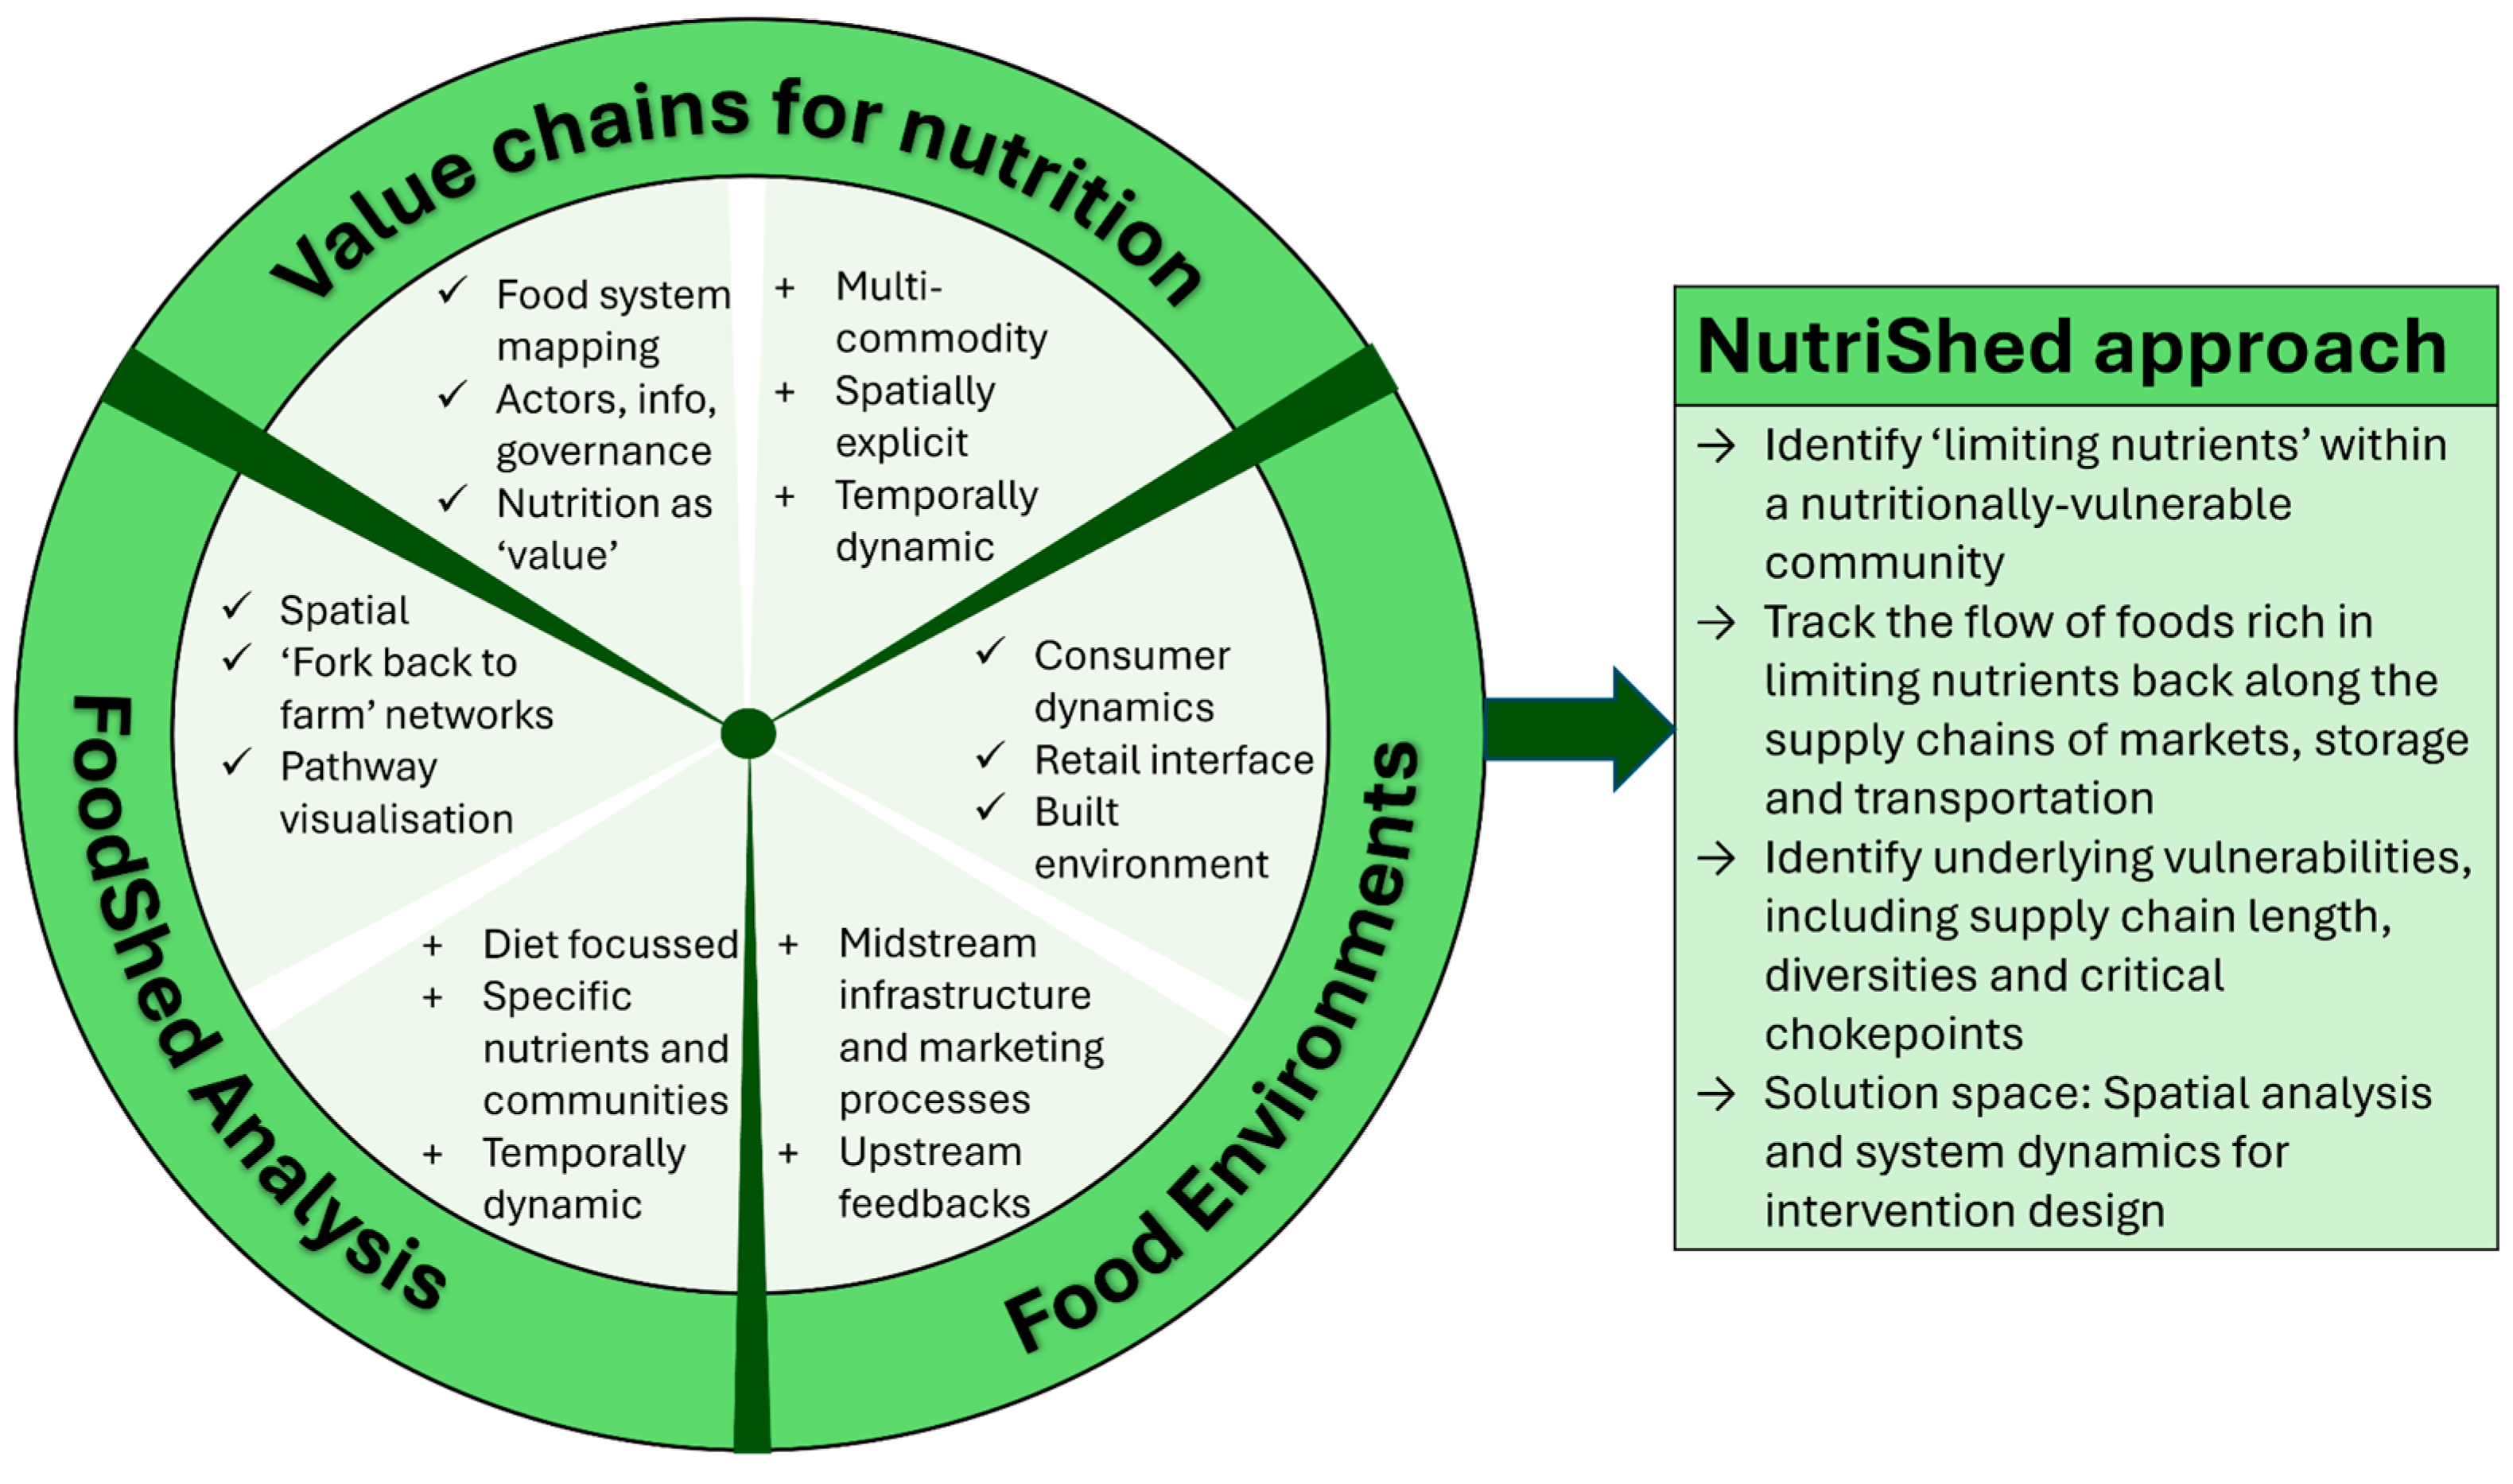
Figure 2.
Overview of the six sequential stages making up the NutriShed approach. Note: as described in text, the reference group of local experts from Stage 1 were consulted at strategic points throughout the project. * As explained in Stage 5 below, the system dynamics component is an optional step to help understand the feedback loops underpinning the flows of food across their NutriSheds over space and time.
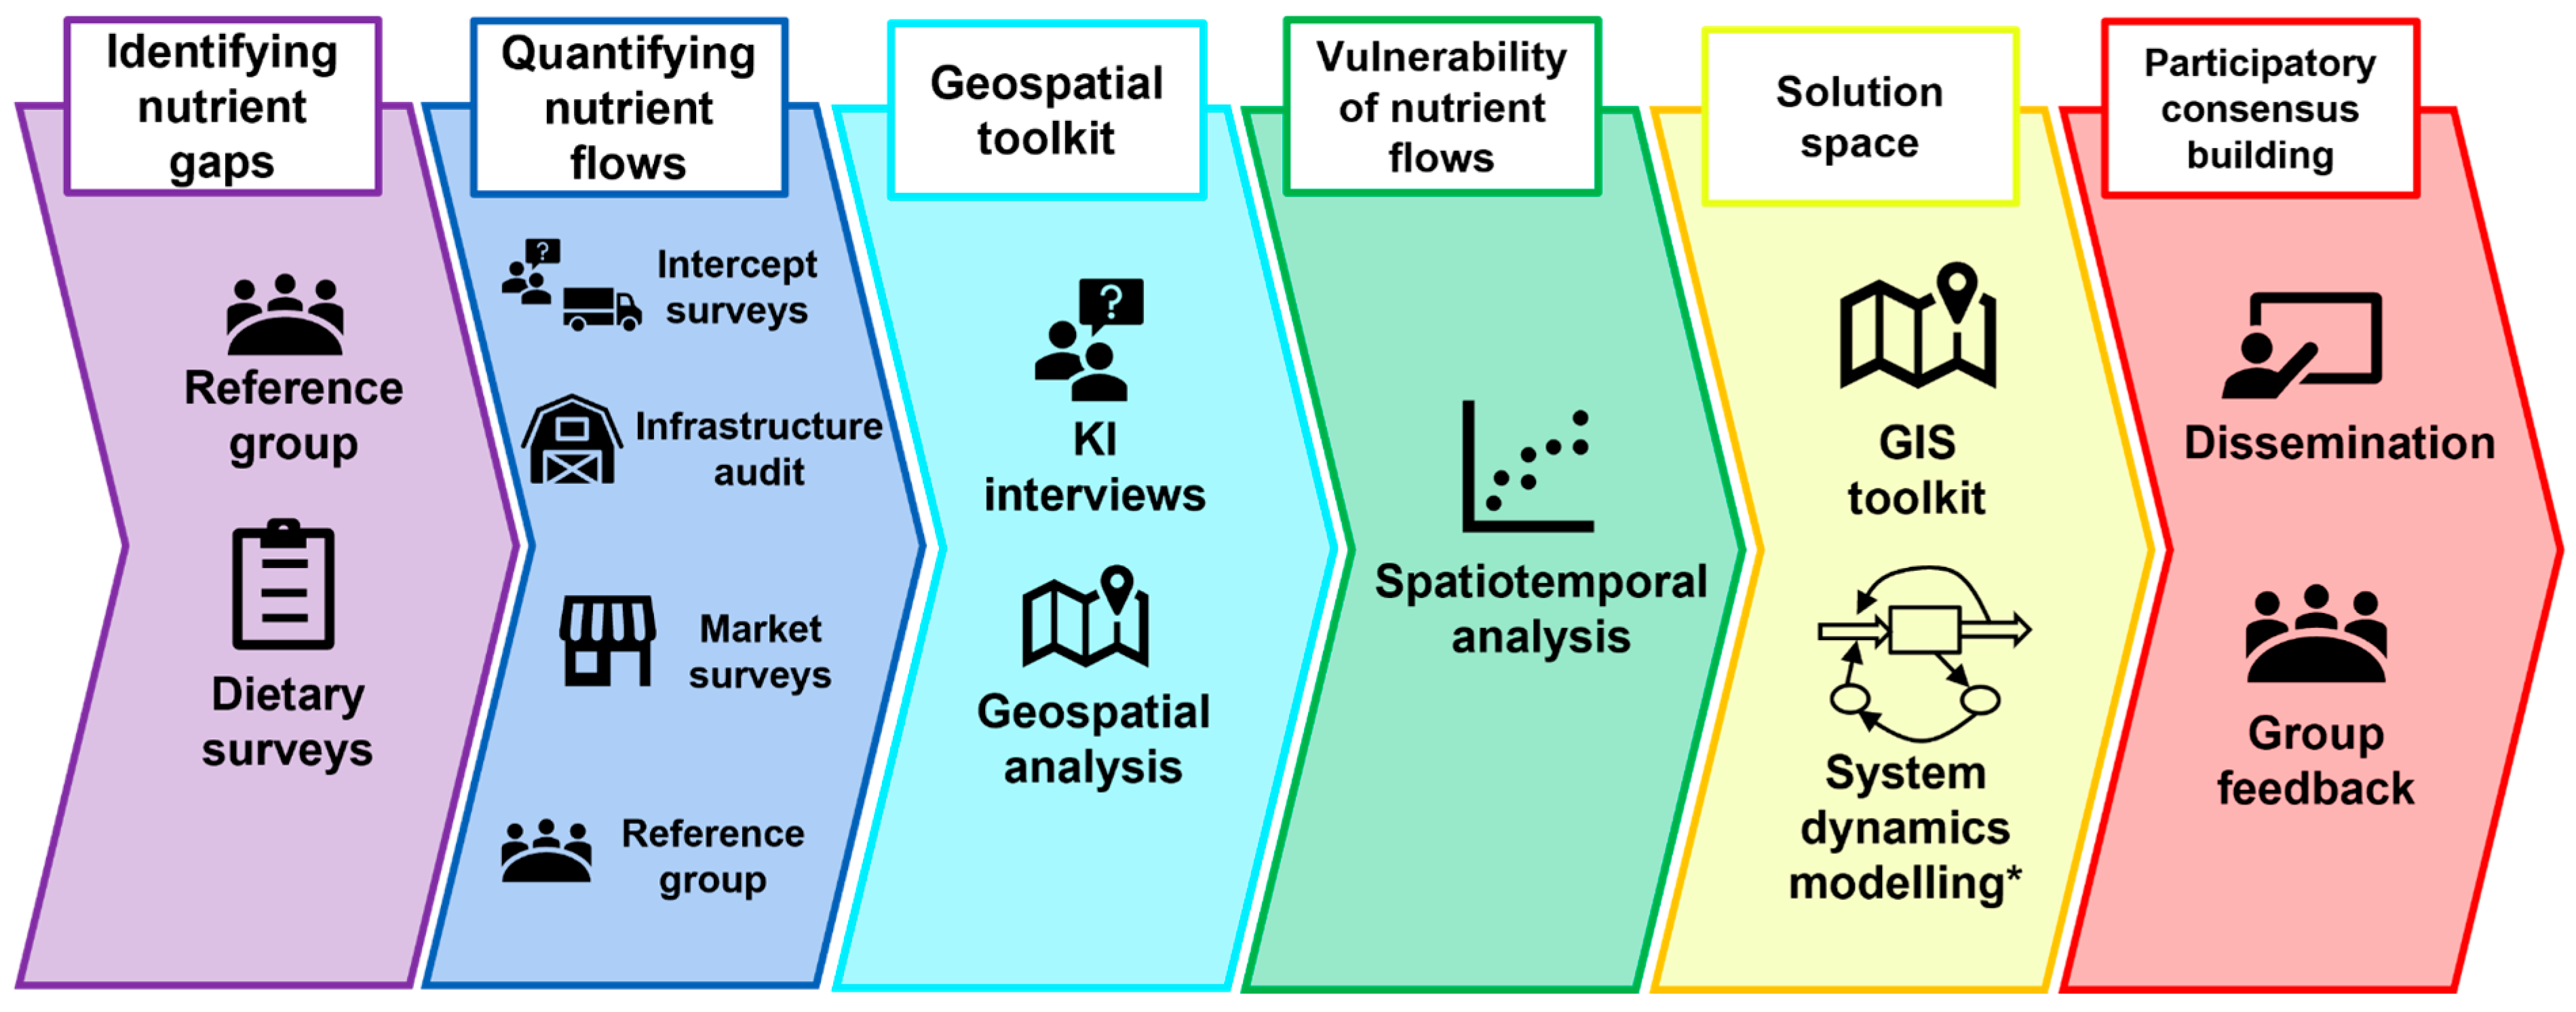
Figure 3.
Graphical illustration of the key geospatial analysis techniques used to map and characterise the Nutrisheds of our source nutrients flowing into Takoradi and Asesewa.
Figure 3.
Graphical illustration of the key geospatial analysis techniques used to map and characterise the Nutrisheds of our source nutrients flowing into Takoradi and Asesewa.
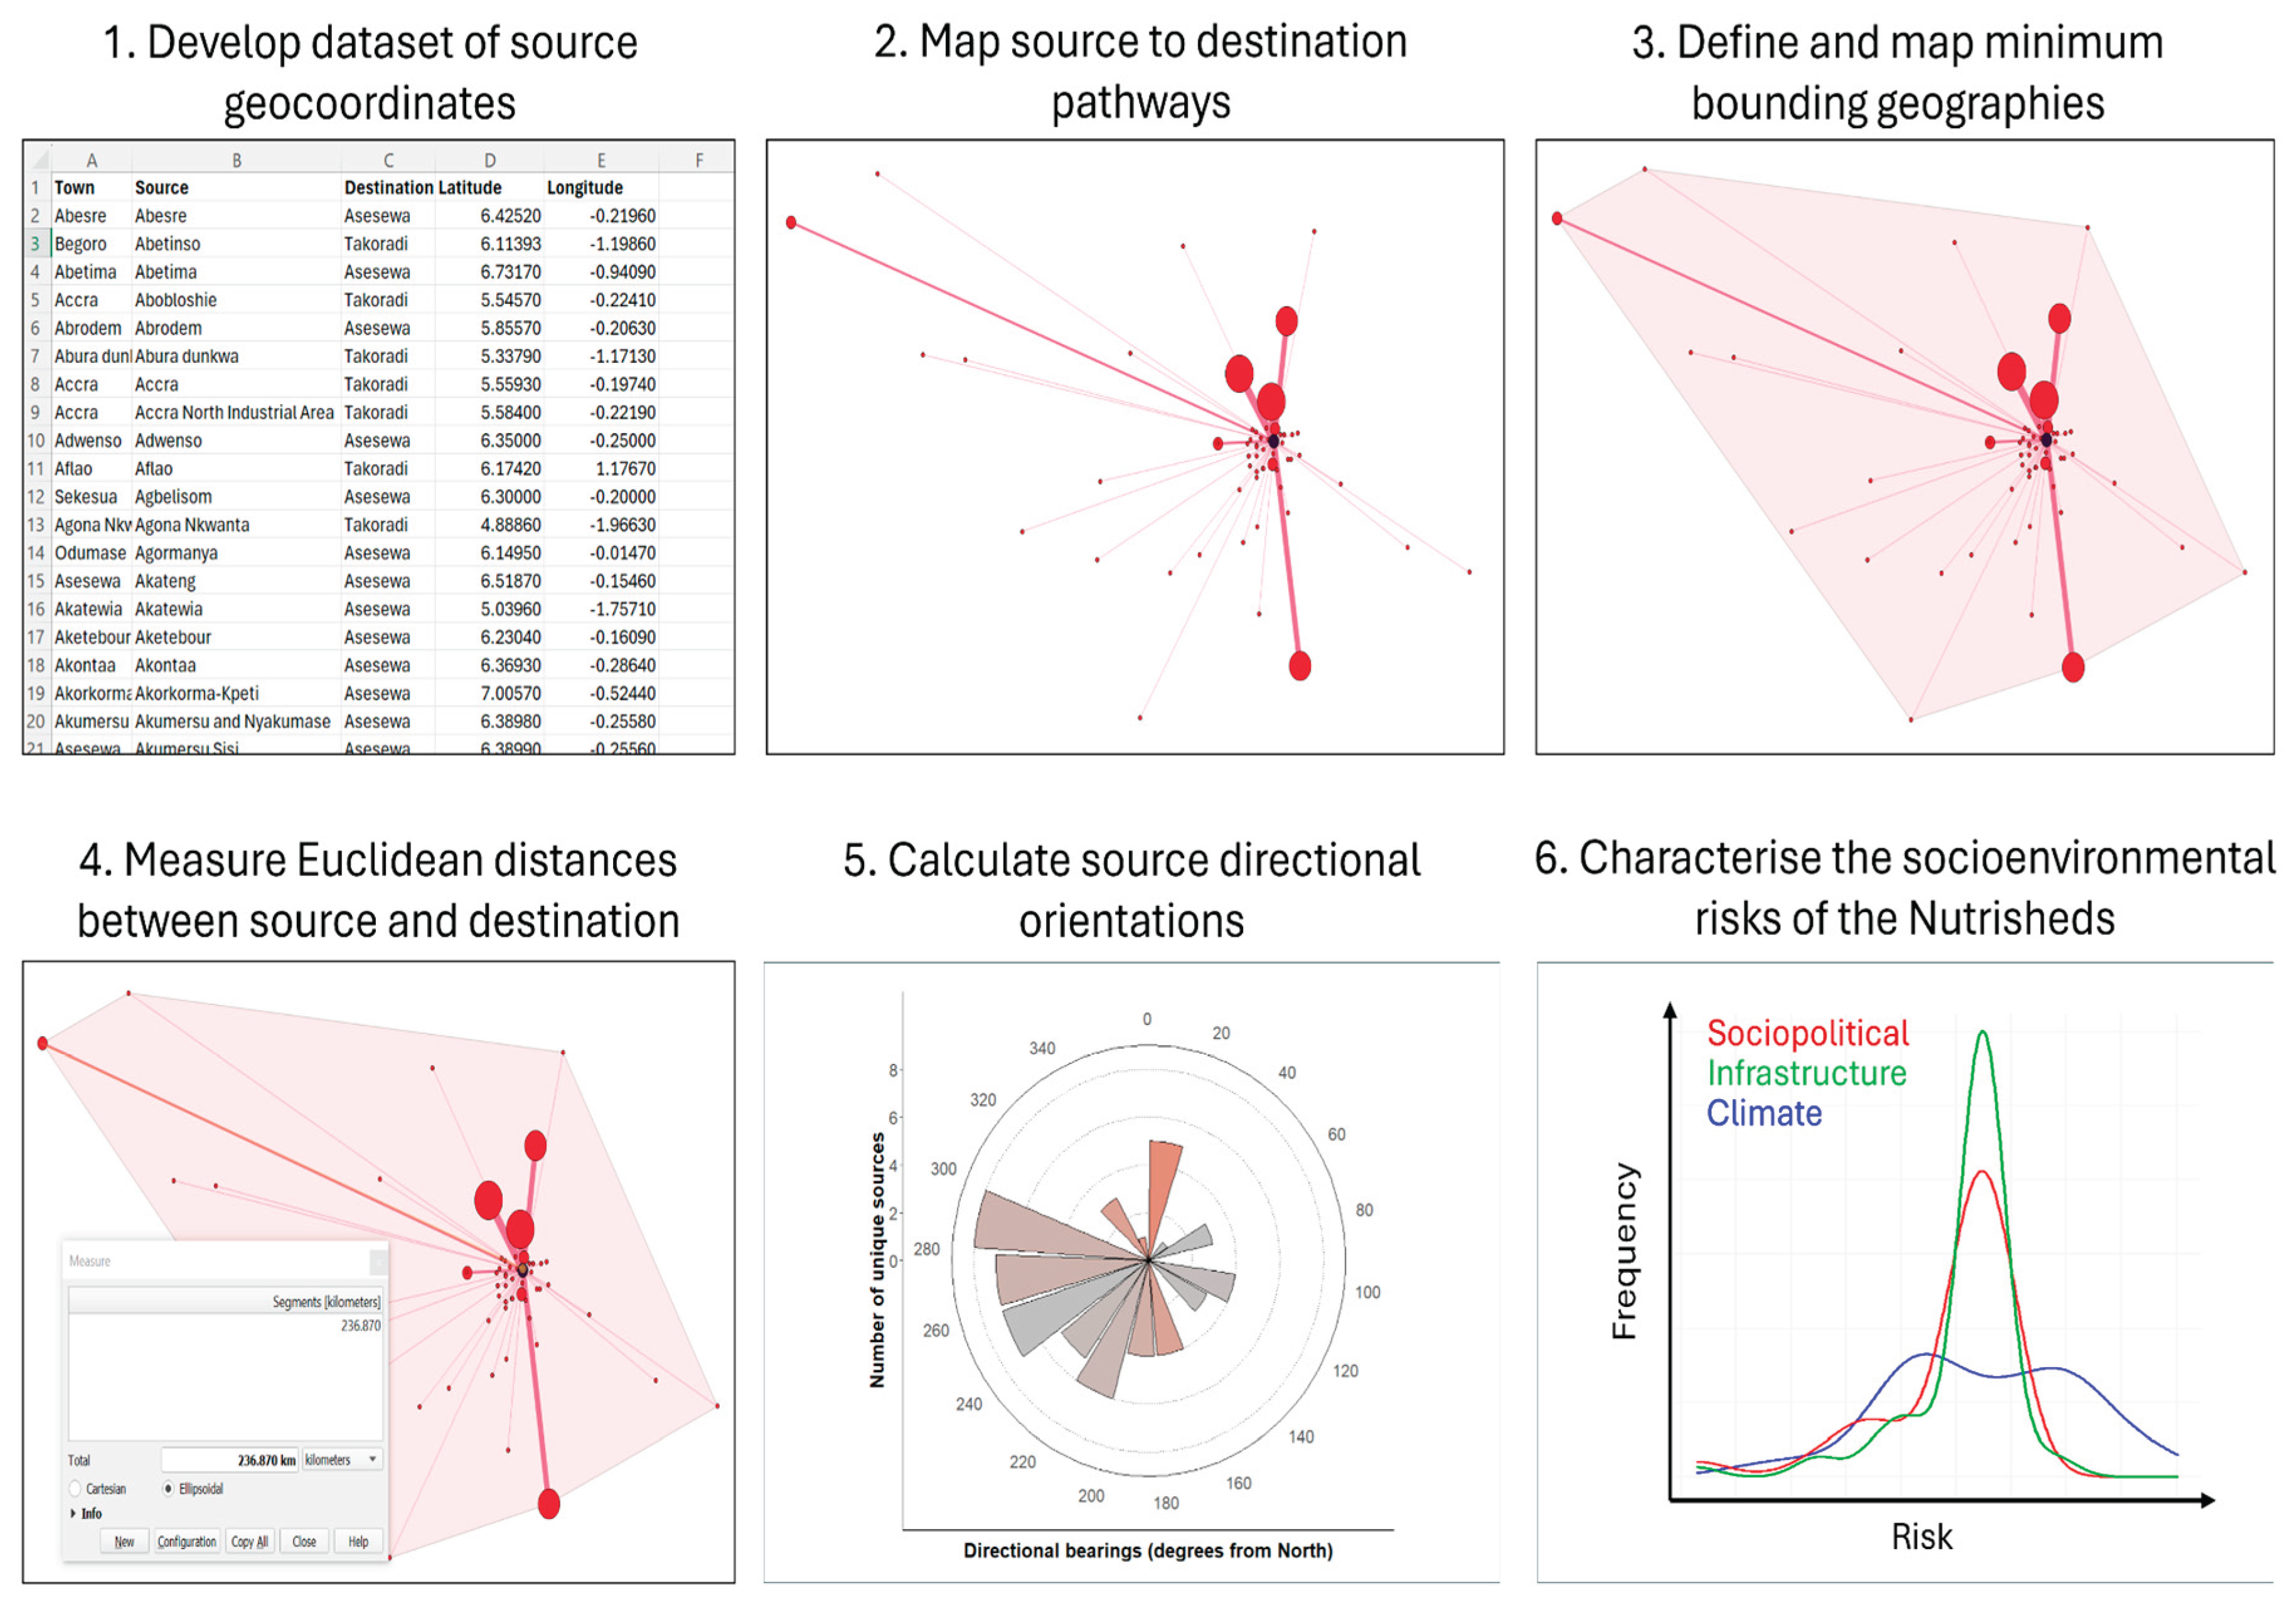
Table 1.
Description of the primary and secondary datasets forming part of the NutriShed approach.
| Dataset | Primary/ secondary | Coverage | Resolution | Source |
|---|---|---|---|---|
| Rapid food consumption surveys | Primary | Our study communities - Takoradi and Asesewa | Household level | Primary data collection |
| Food flow intercept surveys | Primary | Our study communities - Takoradi and Asesewa | Point data | Primary data collection |
| Food systems infrastructure (e.g., processing facilities, cold storages, collection centres) | Primary | Our study communities - Takoradi and Asesewa | Point data | Primary data collection |
| Market characteristics | Primary | Our study communities - Takoradi and Asesewa | Point data | Primary data collection |
| Globcover - land cover map for Ghana | Secondary | National | 300 metres | MERIS data via Amerigeoss repository |
| Ghana New 260 District administrative boundaries | Secondary | National | Not relevant | ArcGIS hub |
| Roads | Secondary | National | Point data | GeoFabrik OpenStreetMap portal |
| Population density | Secondary | National | 400 metres | Kontur population |
| Climate-Conflict-Vulnerability index | Secondary | Global | 0.5° or 55 km | CCVI online portal |
Disclaimer/Publisher’s Note: The statements, opinions and data contained in all publications are solely those of the individual author(s) and contributor(s) and not of MDPI and/or the editor(s). MDPI and/or the editor(s) disclaim responsibility for any injury to people or property resulting from any ideas, methods, instructions or products referred to in the content. |
© 2025 by the authors. Licensee MDPI, Basel, Switzerland. This article is an open access article distributed under the terms and conditions of the Creative Commons Attribution (CC BY) license (http://creativecommons.org/licenses/by/4.0/).
Copyright: This open access article is published under a Creative Commons CC BY 4.0 license, which permit the free download, distribution, and reuse, provided that the author and preprint are cited in any reuse.


