Submitted:
20 May 2025
Posted:
20 May 2025
You are already at the latest version
Abstract
Peri-implantitis is a common and biologically complex complication of dental implants, often diagnosed only after irreversible bone loss has occurred. This study aimed to develop a personalized risk assessment tool by integrating clinical, molecular, and microbial data. A total of 124 participants were stratified into peri-implantitis and healthy/mucositis groups. Clinical parameters, including clinical attachment loss (CAL), were measured, and biological samples were collected for active-matrix metalloproteinase-8 (aMMP-8) quantification, quantitative microbial profiling, and MMP-8 polymorphism genotyping. Multivariable logistic regression identified CAL, elevated aMMP-8 (>20 ng/mL), and Staphylococcus epidermidis load as independent predictors of peri-implantitis, yielding a highly accurate model (Area Under the Curve = 0.982, accuracy = 94.2%). Additionally, MMP-8 mRNA gene expression and aMMP-8 levels were significant predictors of bleeding on probing. Based on the regression model, a clinically applicable, point-based risk assessment tool was developed that integrates three key predictors—CAL, aMMP-8, and MMP-8 SNP (T allele, rs11532004). Weighted scoring enabled stratification into low-, moderate-, and high-risk categories, with scores ranging from 0 to 7. This system demonstrated strong alignment with clinical diagnosis and offers a personalized, screening approach to support early intervention in peri-implantitis. The findings highlight the diagnostic value of combining host-response biomarkers and microbial profiling in assessing peri-implant disease risk. This model advances precision dentistry by enabling early detection and personalized monitoring of peri-implantitis, supporting more targeted prevention and intervention strategies.
Keywords:
peri-implantitis
; aMMP-8
; risk assessment
; MMP-8 polymorphism
; Staphylococcus epidermidis
; peri-implant crevicular fluid
; predictive model
; clinical attachment loss
; microbial profiling
; personalized dentistry
1. Introduction
Background and Context
Dental implants have ameliorated prosthodontic care by providing stable, esthetic, and long-lasting solutions for tooth replacement. As implant utilization continues to rise—projected to reach 17% of the adult population in the United States by 2026 [1]—clinical focus has increasingly shifted from mere implant survival to addressing the possible biological complications that jeopardize their long-term success. Peri-implant diseases are classified into peri-implant mucositis—an inflammation confined to the soft tissues—and peri-implantitis, which involves both inflammation and marginal bone loss [2]. Peri-implantitis has emerged as a major clinical challenge, with meta-analytic data reporting prevalence rates of up to 22% for peri-implantitis and 43% for peri-implant mucositis [3,4]. If left undiagnosed or untreated, peri-implantitis can lead to progressive bone loss and eventual implant failure [4].
A systematic review by Hashim et al. (2018) reported that approximately one-third of patients with Bleeding on Probing (BoP) around implants were in fact diagnosed with peri-implantitis, underscoring both the prevalence and diagnostic limitations of traditional clinical markers of peri-implant disease [5]. Although clinical indices like probing depth (PD), BoP, and radiographic bone loss remain fundamental elements of diagnosis, they are retrospective in nature and often detect disease only after irreversible damage has occurred [6].
The pathogenesis of peri-implantitis is multifactorial, involving a dynamic interplay between microbial dysbiosis, host immune responses, and genetic susceptibility. Compared to periodontitis, peri-implant lesions are often larger and more destructive, characterized by dense infiltrates of plasma cells and neutrophils [7]. While consensus periodontal pathogens such as Porphyromonas gingivalis, Tannerella forsythia, and possibly Filifactor alocis are frequently identified in peri-implantitis sites, opportunistic bacterial species like Staphylococcus epidermidis—typically absent in periodontitis—also appear to participate into implant-associated infections [4,8,9,10].
At the molecular level, active-matrix metalloproteinase-8 (aMMP-8) has emerged as a sensitive biomarker for inflammatory tissue destruction [11,12]. Elevated aMMP-8 levels in peri-implant crevicular fluid (PICF) have been consistently reported in sites with peri-implantitis, and Point-of-Care tests such as ImplantSafe® provide real-time diagnostic capability with high sensitivity and specificity [11,12,13]. In addition, the −799C>T single nucleotide polymorphism (SNP) (also known as rs11532004) in the MMP-8 gene promoter region has been associated with increased gene expression and enzymatic activity, potentially accelerating collagen breakdown and bone loss in genetically susceptible individuals [14,15,16].
Despite advances in understanding disease mechanisms, current diagnostic protocols remain largely empirical, failing to predict disease onset or personalize risk stratification. Site-level risk factors such as implant depth ≥6 mm, poor plaque control Plaque Index ≥ 1.6), and a history of periodontitis are well-established [17], but these are seldom integrated into a clinically usable predictive model. Consequently, there is an urgent need for tools that can synthesize clinical, microbial, molecular, and genetic information into a unified, predictive framework.
Recent computational approaches, including machine learning models, have shown promise in predicting peri-implantitis risk by combining demographic and clinical data. For instance, Mameno et al. (2021) demonstrated 70% predictive accuracy using a random forest model incorporating plaque control rates, mucosal width, and implant function time [18]. However, few models incorporate molecular and genetic biomarkers—key domains for personalized diagnosis.
The integration of qPCR-based microbial profiling, aMMP-8 quantification, and genotyping of MMP-8 promoter polymorphisms may enable a more nuanced, individualized risk assessment. Elevated PICF aMMP-8 levels (>20 ng/mL) offer a noninvasive and immediate indicator of active inflammation, while SNP genotyping can identify individuals at elevated genetic risk before clinical signs appear. This study aims to develop and validate a personalized risk assessment model for peri-implantitis by combining these multidimensional parameters into a possibly clinically applicable diagnostic tool.
2. Materials and Methods
2.1. Study Design
This cross-sectional study was conducted at the Department of Periodontology and Implant Biology, Aristotle University of Thessaloniki, Greece. The Ethics Committee of the School of Dentistry granted ethical approval (approval number: 115/25-05-21), and the protocol was registered in ClinicalTrials.gov (ID: NCT05711407). All procedures complied with the ethical principles of the Declaration of Helsinki.
2.2. Participant Inclusion
Eligible participants were adults aged 18 years or older with at least one functional dental implant for at least 12 months. Based on clinical and radiographic criteria, participants were stratified into two diagnostic groups: peri-implantitis and healthy/mucositis. The peri-implantitis group included cases with probing depth (PD) ≥ 4 mm, radiographic evidence of bone loss, and clinical signs of inflammation (e.g., BoP or suppuration). In the absence of prior baseline data, peri-implantitis was defined as BoP and/or suppuration with PD ≥ 6 mm and bone loss ≥ 3 mm apical to the most coronal intraosseous portion of the implant [19]. The healthy/mucositis group included implants with PD < 4 mm, absence of bone loss, and no suppuration [20].
Participants were required to exhibit periodontal stability, defined as the absence of progressive clinical attachment or bone loss, and minimal BoP [21]. They also had to maintain systemic health and adhere to routine periodontal maintenance. Smoking status was recorded and categorized. Exclusion criteria included untreated periodontitis, systemic conditions such as diabetes or other immunomodulating diseases, history of bisphosphonate use, recent antibiotic intake, pregnancy, or breastfeeding.
2.3. Sample Size Calculation
Sample size determination was guided by the need to obtain/construct a robust multivariable predictive model while ensuring adequate power for the biological domains assessed. Initially, individual power analyses for microbial, genetic, and molecular targets indicated the need for 30–54 participants per group. For example, microbial quantification of P. gingivalis and F. alocis required 54 participants per group, while aMMP-8 and S. epidermidis quantifications required 30–32 participants. For the MMP-8 -799C>T polymorphism, a minimum of 45 participants per group was calculated based on odds ratios from prior studies [22].
However, to specifically validate a multivariable logistic regression model, we applied the events-per-variable (EPV) criterion, a recognized method in predictive modeling [23]. This rule recommends 10 events (i.e., peri-implantitis cases) per predictor to ensure model stability. Our final model retained three predictors, implying a minimum of 30 events. With 58 peri-implantitis cases among 124 participants, our EPV was 19.3, exceeding the conservative threshold of 10 and approaching the ideal range of 15–20 suggested for high-dimensional modeling [24].
2.3. Clinical Examination
Clinical assessments were conducted by a single calibrated examiner using a UNC-15 periodontal probe (Hu-Friedy®; Chicago, IL, USA). Measurements included probing depth (PD), clinical attachment level (CAL), bleeding on probing (BoP), and gingival recession (REC), recorded at six sites per implant. Intra-examiner reliability was confirmed with an intraclass correlation coefficient (ICC) of 0.93 (95% CI: 0.89–0.96).
2.4. Sample Collection
Biological samples were collected following a standardized protocol one week after clinical examination to avoid contamination and procedural interference. Peri-implant crevicular fluid (PICF) was obtained from mid-buccal sites using sterile PerioPaper® strips for the analysis of active MMP-8 levels and MMP-8 gene expression. Microbial samples were collected from the deepest peri-implant pockets using sterile paper points, while unstimulated saliva was obtained for genomic DNA extraction and SNP genotyping. All samples were collected between 8:00 and 10:00 a.m. following an 8-hour fasting and oral hygiene restriction and were immediately stored at −80 °C until analysis
2.5. Sample Analysis
2.5.1. aMMP-8 Quantification
PICF aMMP-8 levels were measured using the ImplantSafe® chairside test in conjunction with the accompanying ORALyzer® digital reader. Although the manufacturer recommends a diagnostic threshold of 20 ng/mL for aMMP-8 (ImplantSafe®), we identified 24 ng/mL as the optimal cut-off point in our cohort using ROC curve analysis and Youden’s Index, which provided the highest combined sensitivity and specificity. Therefore, the 24 ng/mL threshold was used in the development of the clinical risk scoring tool [25].
2.5.2. Microbial Profiling
Microbial DNA was extracted using the ZymoBIOMICS DNA Miniprep Kit®. qPCR assays targeted five species: P. gingivalis, F. alocis, S. epidermidis, S. aureus, and Candida albicans. DNA quantification was performed using SYBR Green or TaqMan chemistry on an Applied Biosystems thermal cycler.
2.5.3. Genetic Polymorphism Analysis
Genomic DNA extracted from saliva was used for PCR amplification of MMP-8 promoter polymorphisms (-799C/T, -381A/G, +17C/G). Sequencing was performed at an ISO/IEC 17025-certified lab. Genotype classification was verified with SnapGene® software.
2.5.4. MMP-8 Gene Expression
RNA was extracted from peri-implant crevicular fluid (PICF) using the Quick RNA Mini Prep Plus Kit® (Zymo Research, USA) and quantified with a NanoDrop spectrophotometer. Reverse transcription to cDNA was performed using the GoScript™ Reverse Transcription System (Promega, USA). Quantitative real-time PCR (qRT-PCR) was conducted using GoTaq® qPCR Master Mix (Promega, USA), with β-actin serving as the internal reference gene. Relative gene expression was calculated using the 2^−ΔCt method.
2.6. Statistical Analysis
All analyses were performed using IBM SPSS® Statistics v29.0. Descriptive statistics were computed. The Shapiro-Wilk test assessed normality. Non-parametric tests (Mann–Whitney U, Kruskal–Wallis) were used for non-normally distributed variables. Categorical data were analyzed using chi-square or Fisher’s exact test.
Spearman correlation coefficients were used to explore associations among microbial load, biomarker levels, and clinical parameters.
A multivariate binary logistic regression (forward LR method) was used to identify key predictors of peri-implantitis among 96 complete cases. The final model retained CAL (OR = 93.7, p < 0.001), aMMP-8 > 20 ng/mL (OR = 26.06, p = 0.006), and 45360 (B = 0.009, p = 0.010). Model fit was excellent (Nagelkerke R² = 0.867; Hosmer–Lemeshow p = 0.874; classification accuracy = 94.2%; AUC = 0.982).
A stepwise linear regression was used to predict BOP%. MMP-8 expression (β = 0.322, p = 0.003) and aMMP-8 levels (β = 0.213, p = 0.046) were significant predictors (Adjusted R² = 0.178; F(2,83) = 10.198, p < 0.001). No multicollinearity was detected (VIF < 1.14).
Missing data were handled by casewise deletion and multiple imputation. Statistical significance was set at p < 0.05.
To develop the personalized risk assessment tool for peri-implantitis, a multivariable binary logistic regression analysis was performed. The dependent variable was the clinical diagnosis of peri-implantitis (1 = presence, 0 = absence). Independent variables included mean probing depth (PD), mean clinical attachment loss (CAL), bleeding on probing (BoP), smoking status, levels of active-matrix metalloproteinase-8 (aMMP-8), MMP-8 gene expression, presence of the rs11532004 T allele (SNP), and quantitative DNA levels of S. epidermidis (later excluded due to lack of statistical contribution).
Variables were initially included in their continuous form to assess effect size and significance. After assessing model fit, multicollinearity, and variable significance, the final model retained three predictors: mean CAL, aMMP-8 levels, and the presence of the T allele. These were binarized using clinically meaningful thresholds (aMMP-8 > 24 ng/mL; CAL ≥ 3.5 mm; T allele: present vs absent). Based on the odds ratios (Exp(B)) of each variable, a weighted scoring system was created: 3 points for aMMP-8, 2 points for CAL, and 2 points for T allele presence.
Each patient received a composite score from 0 to 7. Patients were then categorized into three clinical risk levels: low (0–2), moderate (3–5), and high (6–7). To evaluate the association between the risk levels and actual peri-implantitis diagnosis, a cross-tabulation with Pearson’s chi-square test was conducted. Receiver operating characteristic (ROC) curve analysis was also performed using the total risk score as the test variable and clinical diagnosis as the state variable (positive state = peri-implantitis). Model discrimination was assessed by calculating the area under the curve (AUC)
3. Results
3.1. Demographic Characteristics
Among the 124 participants included in the study, statistical analysis revealed no significant differences between the peri-implantitis and healthy/mucositis groups in terms of age (p = 0.225), sex distribution (p = 0.270), or smoking status (p = 0.665). This demographic balance supports the internal validity of subsequent findings (Table 1).
3.2. Predictors of Peri-Implantitis
Among the eight factors examined , multivariable logistic regression (n = 86) identified three statistically significant and independent predictors of peri-implantitis: mean CAL (B = 4.540, OR = 93.70, p < 0.001), aMMP-8 >20 ng/mL (B = 3.260, OR = 26.06, p = 0.006), and S. epidermidis load (B = 0.009, p = 0.010). The model displayed excellent calibration (Hosmer–Lemeshow p = 0.874) and high predictive accuracy (Nagelkerke R² = 0.867, classification rate = 94.2%, sensitivity = 95.5%, specificity = 92.9%). The ROC analysis confirmed high discriminatory power (AUC = 0.982) (Table 2, Figure 2).
3.4. Predictors of Bleeding on Probing (BOP%)
Stepwise linear regression identified two significant predictors of BOP%: MMP-8 gene expression (β = 0.322, p = 0.003) and aMMP-8 >20 ng/mL (β = 0.213, p = 0.046). The model explained 17.8% of the variance in BOP% (Adjusted R² = 0.178), suggesting a moderate association between inflammatory biomarkers and bleeding severity. No collinearity was observed (VIF < 1.14), and model assumptions were satisfied (Table 3).
3.5. Personalized Risk Assessment Tool Development and Validation
A personalized, scoring tool was constructed based on the logistic regression outputs. Three binary predictors were used: CAL ≥ 3.5 mm, aMMP-8 > 24 ng/mL, and presence of the T allele (rs11532004). Points were assigned according to effect sizes: 3 for aMMP-8, 2 for CAL, and 2 for the T allele SNP, yielding a score range of 0–7.
Patients were classified into three risk groups:
- Low risk: 0–2 points
- Moderate risk: 3–5 points
- High risk: 6–7 points
Cross-tabulation showed strong alignment between predicted risk and diagnosis (χ² = 47.198, df = 2, p < 0.001): all high-risk individuals had peri-implantitis, while 87.8% of low-risk individuals were clinically healthy (Table 4). ROC curve analysis using the total score as the test variable yielded an AUC of 0.913, confirming the scoring system’s strong diagnostic performance.
4. Discussion
This study presents a predictive model for peri-implantitis that integrates clinical, genetic , and microbial data, providing a personalized diagnostic approach. Three independent predictors—elevated active MMP-8 levels, increased clinical attachment loss (CAL), and the load of Staphylococcus epidermidis in combination were identified as significant on the final model, which demonstrated high accuracy, sensitivity, and specificity (AUC = 0.982). These findings are aligned with existing literature and enhance the clinical utility of combining host-derived biomarkers with microbial profiling .
The inclusion of aMMP-8 in the final model reinforces its value as a real-time, non-invasive marker of tissue destruction. aMMP-8 has been widely validated in periodontal and peri-implant studies for its ability to reflect active inflammation and collagen degradation [12,26]. In this study, aMMP-8 remained a significant contributor in both the multivariable model for peri-implantitis and the linear regression model for bleeding on probing (BOP%), indicating its dual role in disease detection and inflammation monitoring. These results align with findings by Ramseier et al. (2024) and support the use of aMMP-8 as a diagnostic adjunct, especially in early or subclinical cases [27].
Clinical attachment level, a well-established clinical marker of disease severity, emerged as the most powerful predictor in our analysis. This is in accordance with the 2017 World Workshop classification system, which emphasizes CAL as a core diagnostic feature of peri-implantitis [28]. Interestingly, probing depth (PD) was not retained in the final model despite initial significance, likely due to its collinearity with CAL. This reinforces the notion that CAL, which captures historical tissue breakdown, offers a more stable measure than PD alone.
The identification of S. epidermidis as an independent predictor highlights a shift in our understanding of peri-implant microbiology. Traditionally viewed as a skin commensal or implant contaminant, S. epidermidis has recently been implicated in biofilm-related infection, indwelling medical devices and peri-implant disease[29,30]. Its detection in significant numbers in diseased sites and its participation in the regression model suggest a contributory pathogenic role, possibly via biofilm synergy or immune evasion mechanisms. This supports recent microbiome studies that distinguish peri-implantitis from periodontitis, emphasizing the unique ecology of peri-implant niches [31,32].
The final model excluded variables such as MMP-8 gene expression levels, the T allele of rs11532004, and smoking status. While these variables showed moderate associations in univariate analysis, they did not contribute independently in the multivariable context. This is a common outcome in regression modeling when the effects of certain variables are mediated through more proximal or biologically dominant markers. For instance, MMP-8 gene expression likely influences aMMP-8 protein levels, which directly reflect tissue destruction and inflammatory burden. Including both in the same model introduces redundancy, and stepwise selection tends to retain the variable with stronger predictive utility—here, aMMP-8. Similarly, the contribution of the T allele may be mediated through downstream molecular activity and thus lacks standalone significance when controlling for expression and protein levels. Smoking status, while biologically relevant, did not enhance the model’s discriminatory power, potentially due to its balanced distribution across groups or its indirect influence on microbial and inflammatory profiles, which were already accounted for in the model. This underscores the strength of multivariate modeling in isolating trully independent predictors and constructing clinically robust tools. Despite showing associations in univariate tests, these variables did not contribute independently in multivariable analysis, highlighting the strength of regression modeling in identifying clinically actionable predictors while avoiding overfitting. The resulting model achieved a classification accuracy of 94.2%, indicating its robustness for clinical application. In constructing the clinical scoring tool, we applied a higher aMMP-8 threshold (24 ng/mL) than the one used in the logistic regression model (20 ng/mL). While the 20 ng/mL cut-off reflects the manufacturer’s recommended threshold and was appropriate for initial binary classification in the multivariable model, ROC curve analysis in our dataset identified 24 ng/mL as the optimal value for clinical prediction. This was based on Youden’s Index, which balances sensitivity and specificity to maximize overall diagnostic accuracy. The application of the 24 ng/mL threshold in the scoring tool therefore reflects a data-driven calibration specific to our study population, enhancing its predictive validity in a real-world setting. This approach illustrates the value of internally validated cut-offs when translating statistical models into clinical decision tools.
A significant contribution of this study is the development of a personalized, point-based risk assessment tool. This tool assigns weighted scores to the three retained predictors—CAL, aMMP-8, and SNP presence—allowing stratification into low, moderate, and high-risk categories. The model’s high discriminatory ability (AUC = 0.913) and strong correlation with clinical diagnosis (χ² = 47.198, p < 0.001) suggest its potential as a practical tool. Similar in concept to systems like IDRA (Implant Disease Risk Assessment), which incorporate clinical and historical data for predicting implant disease risk , this model offers enhanced granularity through integration of molecular biomarkers and microbial profiling [33]. Unlike IDRA, which does not incorporate biochemical markers or genetic susceptibility factors, our tool represents a more biologically grounded and individualized approach, aligning with contemporary trends in precision dentistry.
Additionally, the BOP model confirmed the role of MMP-8 at both the gene and protein expression levels in mucosal inflammation. These findings are consistent with recent evidence indicating that aMMP-8 serves as a sensitive biomarker of early tissue inflammation and subclinical disease activity in peri-implant tissues with elevated levels preceding overt clinical signs and associated with progression from mucositis to peri-implantitis [11]. In the proposed model, MMP-8 mRNA expression and its corresponding protein levels accounted for 17.8% of the variability in BOP%, a key clinical parameter of soft tissue inflammation. This underscores the relevance of molecular activation in modulating clinical outcomes and supports the concept that peri-implant diseases represent a biological continuum, where mucosal inflammation, if left unresolved, may evolve into bone-destructive peri-implantitis. This understanding is supported by longitudinal studies indicating mucositis is a critical therapeutic window for preventing irreversible tissue loss [34,35].
This study has caveats that should be considered when interpreting the present findings. First, a cross-sectional design restricts establishing temporal or causal relationships between identified predictors and peri-implantitis progression. Longitudinal studies are necessary to validate the model's predictive value over time and monitor disease dynamics. Second, although the sample size was adequately powered for multivariable modeling, participants were recruited from a single academic center, potentially limiting the generalizability of the results to broader or more diverse populations. Third, the study focused on a specific set of biomarkers and microbial species; other relevant inflammatory mediators, genetic loci, or microbial taxa may also contribute to peri-implant disease risk and warrant future investigation. Future research should explore the integration of this tool into longitudinal digital health platforms and examine its utility in guiding personalized preventive or therapeutic interventions.
Overall, this study supports the value of integrated diagnostics in peri-implant care. By combining molecular, microbial, and clinical data, the model reflects the multifactorial nature of peri-implant disease and aligns with emerging strategies in personalized medicine. While cross-sectional, these findings establish a foundation for future longitudinal studies to assess temporal predictive validity and explore additional markers such as IL-1β, TNF-α, or metabolomic signatures. Integrating real-time biosensor data and AI-enhanced algorithms may further advance risk prediction and targeted prevention in implant dentistry.
In conclusion, the presented model offers a novel and clinically translatable approach to peri-implantitis risk assessment, promoting early intervention, improved patient outcomes, and precision-based dental care.
Author Contributions
Conceptualization, I.F. and D.S.; methodology, I.F. and L.B.; formal analysis, I.F.; investigation, I.F., L.B., and I.V.; resources, D.S.; data curation, I.F.; writing—original draft preparation, I.F.; writing—review and editing, D.S.; supervision, D.S.; project administration, D.S. All authors have read and agreed to the published version of the manuscript.
Funding
This research received no external funding.
Institutional Review Board Statement
The study was conducted in accordance with the Declaration of Helsinki and approved by the Ethics Committee of the School of Dentistry, Aristotle University of Thessaloniki (Approval No. 115/25-05-21).
Informed Consent Statement
Informed consent was obtained from all subjects involved in the study.
Data Availability Statement
The data supporting the findings of this study are available from the corresponding author upon reasonable request.
Conflicts of Interest
The authors declare no conflict of interest.
References
- H. W. Elani, J. R. Starr, J. D. Da Silva, and G. O. Gallucci, “Trends in Dental Implant Use in the U.S., 1999-2016, and Projections to 2026,” J Dent Res, vol. 97, no. 13, pp. 1424–1430, Dec. 2018, doi: 10.1177/0022034518792567.
- T. Berglundh et al., “Peri-implant diseases and conditions: Consensus report of workgroup 4 of the 2017 World Workshop on the Classification of Periodontal and Peri-Implant Diseases and Conditions,” J Periodontol, vol. 89, pp. S313–S318, Jun. 2018, doi: 10.1002/JPER.17-0739.
- J. Derks and C. Tomasi, “Peri-implant health and disease. A systematic review of current epidemiology,” Apr. 01, 2015. doi: 10.1111/jcpe.12334.
- T. Berglundh, A. Mombelli, F. Schwarz, and J. Derks, “Etiology, pathogenesis and treatment of peri-implantitis: A European perspective,” Periodontol 2000, 2024, doi: 10.1111/PRD.12549,.
- D. Hashim, N. Cionca, C. Combescure, and A. Mombelli, “The diagnosis of peri-implantitis: A systematic review on the predictive value of bleeding on probing,” Clin Oral Implants Res, vol. 29 Suppl 16, pp. 276–293, Oct. 2018, doi: 10.1111/CLR.13127.
- A. Ramanauskaite and G. Juodzbalys, “Diagnostic Principles of Peri-Implantitis: a Systematic Review and Guidelines for Peri-Implantitis Diagnosis Proposal,” J Oral Maxillofac Res, vol. 7, no. 3, p. e8, Sep. 2016, doi: 10.5037/JOMR.2016.7308.
- Carcuac and T. Berglundh, “Composition of human peri-implantitis and periodontitis lesions,” J Dent Res, vol. 93, no. 11, pp. 1083–1088, Nov. 2014, doi: 10.1177/0022034514551754.
- Fragkioudakis, G. Konstantopoulos, C. Kottaridi, A. E. Doufexi, and D. Sakellari, “Quantitative assessment of Candida albicans, Staphylococcus aureus and Staphylococcus epidermidis in peri-implant health and disease: correlation with clinical parameters,” J Med Microbiol, vol. 73, no. 11, 2024, doi: 10.1099/jmm.0.001933.
- S. M. Dabdoub, A. A. Tsigarida, and P. S. Kumar, “Patient-specific analysis of periodontal and peri-implant microbiomes,” J Dent Res, vol. 92, no. 12 Suppl, Dec. 2013, doi: 10.1177/0022034513504950.
- É. B. S. Carvalho, M. Romandini, S. Sadilina, A. C. P. Sant’Ana, and M. Sanz, “Microbiota associated with peri-implantitis—A systematic review with meta-analyses,” Nov. 01, 2023, John Wiley and Sons Inc. doi: 10.1111/clr.14153.
- V. Xanthopoulou, I. T. Räisänen, T. Sorsa, D. Tortopidis, and D. Sakellari, “Diagnostic value of aMMP-8 and azurocidin in peri-implant sulcular fluid as biomarkers of peri-implant health or disease,” Clin Exp Dent Res, vol. 10, no. 3, Jun. 2024, doi: 10.1002/cre2.883.
- A. Al-Majid, S. Alassiri, N. Rathnayake, T. Tervahartiala, D. R. Gieselmann, and T. Sorsa, “Matrix metalloproteinase-8 as an inflammatory and prevention biomarker in periodontal and peri-implant diseases,” 2018, Hindawi Limited. doi: 10.1155/2018/7891323.
- S. Alassiri et al., “The Ability of Quantitative, Specific, and Sensitive Point-of-Care/Chair-Side Oral Fluid Immunotests for aMMP-8 to Detect Periodontal and Peri-Implant Diseases,” 2018, Hindawi Limited. doi: 10.1155/2018/1306396.
- K. Murthykumar, S. Varghese, and J. V. Priyadharsini, “Association of MMP8 (-799C/T) (rs11225395) gene polymorphism and chronic periodontitis,” 2019.
- Y. H. Chou et al., “MMP-8-799 C>T genetic polymorphism is associated with the susceptibility to chronic and aggressive periodontitis in Taiwanese,” J Clin Periodontol, vol. 38, no. 12, pp. 1078–1084, Dec. 2011, doi: 10.1111/j.1600-051X.2011.01798.x.
- L. Izakovicova Holla, B. Hrdlickova, J. Vokurka, and A. Fassmann, “Matrix metalloproteinase 8 (MMP8) gene polymorphisms in chronic periodontitis,” Arch Oral Biol, vol. 57, no. 2, pp. 188–196, Feb. 2012, doi: 10.1016/j.archoralbio.2011.08.018.
- P. S. Kumar, S. M. Dabdoub, R. Hegde, N. Ranganathan, and A. Mariotti, “Site-level risk predictors of peri-implantitis: A retrospective analysis,” J Clin Periodontol, vol. 45, no. 5, pp. 597–604, May 2018, doi: 10.1111/jcpe.12892.
- T. Mameno et al., “Predictive modeling for peri-implantitis by using machine learning techniques,” Sci Rep, vol. 11, no. 1, Dec. 2021, doi: 10.1038/S41598-021-90642-4.
- F. Schwarz, J. Derks, A. Monje, and H. L. Wang, “Peri-implantitis,” J Clin Periodontol, vol. 45, pp. S246–S266, Jun. 2018, doi: 10.1111/jcpe.12954.
- S. Renvert, G. R. Persson, F. Q. Pirih, and P. M. Camargo, “Peri-implant health, peri-implant mucositis, and peri-implantitis: Case definitions and diagnostic considerations,” J Periodontol, vol. 89, pp. S304–S312, Jun. 2018, doi: 10.1002/JPER.17-0588.
- N. P. Lang and P. M. Bartold, “Periodontal health,” J Periodontol, vol. 89, pp. S9–S16, Jun. 2018, doi: 10.1002/JPER.16-0517.
- G. Emingil et al., “Matrix Metalloproteinase (MMP)-8 and Tissue Inhibitor of MMP-1 (TIMP-1) Gene Polymorphisms in Generalized Aggressive Periodontitis: Gingival Crevicular Fluid MMP-8 and TIMP-1 Levels and Outcome of Periodontal Therapy,” J Periodontol, vol. 85, no. 8, pp. 1070–1080, Aug. 2014, doi: 10.1902/jop.2013.130365.
- P. Peduzzi, J. Concato, E. Kemper, T. R. Holford, and A. R. Feinstem, “A simulation study of the number of events per variable in logistic regression analysis,” J Clin Epidemiol, vol. 49, no. 12, pp. 1373–1379, Dec. 1996, doi: 10.1016/S0895-4356(96)00236-3.
- R. D. Riley et al., “Calculating the sample size required for developing a clinical prediction model,” BMJ, vol. 368, Mar. 2020, doi: 10.1136/BMJ.M441.
- Fragkioudakis, L. Batas, I. Vouros, and D. Sakellari, “Diagnostic Accuracy of Active MMP-8 Point-of-Care Test in Peri-Implantitis,” Eur J Dent, 2024, doi: 10.1055/s-0044-1793843.
- T. Sorsa et al., “Analysis of matrix metalloproteinases, especially MMP-8, in gingival creviclular fluid, mouthrinse and saliva for monitoring periodontal diseases,” Periodontol 2000, vol. 70, no. 1, pp. 142–163, Feb. 2016, doi: 10.1111/PRD.12101.
- C. A. Ramseier, “Diagnostic measures for monitoring and follow-up in periodontology and implant dentistry,” Periodontol 2000, Jun. 2024, doi: 10.1111/PRD.12588.
- J. G. Caton et al., “A new classification scheme for periodontal and peri-implant diseases and conditions – Introduction and key changes from the 1999 classification,” Jun. 01, 2018, Wiley-Blackwell. doi: 10.1002/JPER.18-0157.
- G. N. Belibasakis and D. Manoil, “Microbial Community-Driven Etiopathogenesis of Peri-Implantitis,” Jan. 01, 2021, SAGE Publications Inc. doi: 10.1177/0022034520949851.
- M. Mccann et al., “Staphylococcus epidermidis device-related infections: pathogenesis and clinical management,” Journal of Pharmacy and Pharmacology, vol. 60, no. 12, pp. 1551–1571, Dec. 2008, doi: 10.1211/JPP.60.12.0001.
- G. Charalampakis, Å. Leonhardt, P. Rabe, and G. Dahlén, “Clinical and microbiological characteristics of peri-implantitis cases: A retrospective multicentre study,” Clin Oral Implants Res, vol. 23, no. 9, pp. 1045–1054, Sep. 2012, doi: 10.1111/j.1600-0501.2011.02258.x.
- G. Charalampakis and G. N. Belibasakis, “Microbiome of peri-implant infections: Lessons from conventional, molecular and metagenomic analyses,” Feb. 05, 2015, Landes Bioscience. doi: 10.4161/21505594.2014.980661.
- L. J. A. Heitz-Mayfield, F. Heitz, and N. P. Lang, “Implant Disease Risk Assessment IDRA-a tool for preventing peri-implant disease,” Clin Oral Implants Res, vol. 31, no. 4, pp. 397–403, Apr. 2020, doi: 10.1111/CLR.13585.
- J. Derks, D. Schaller, J. Håkansson, J. L. Wennström, C. Tomasi, and T. Berglundh, “Peri-implantitis - Onset and pattern of progression,” J Clin Periodontol, vol. 43, no. 4, pp. 383–388, Apr. 2016, doi: 10.1111/JCPE.12535.
- L. J. A. Heitz-Mayfield and G. E. Salvi, “Peri-implant mucositis,” J Clin Periodontol, vol. 45, pp. S237–S245, Jun. 2018, doi: 10.1111/JCPE.12953.
Figure 2.
ROC curve for the final peri-implantitis prediction model (AUC = 0.982).
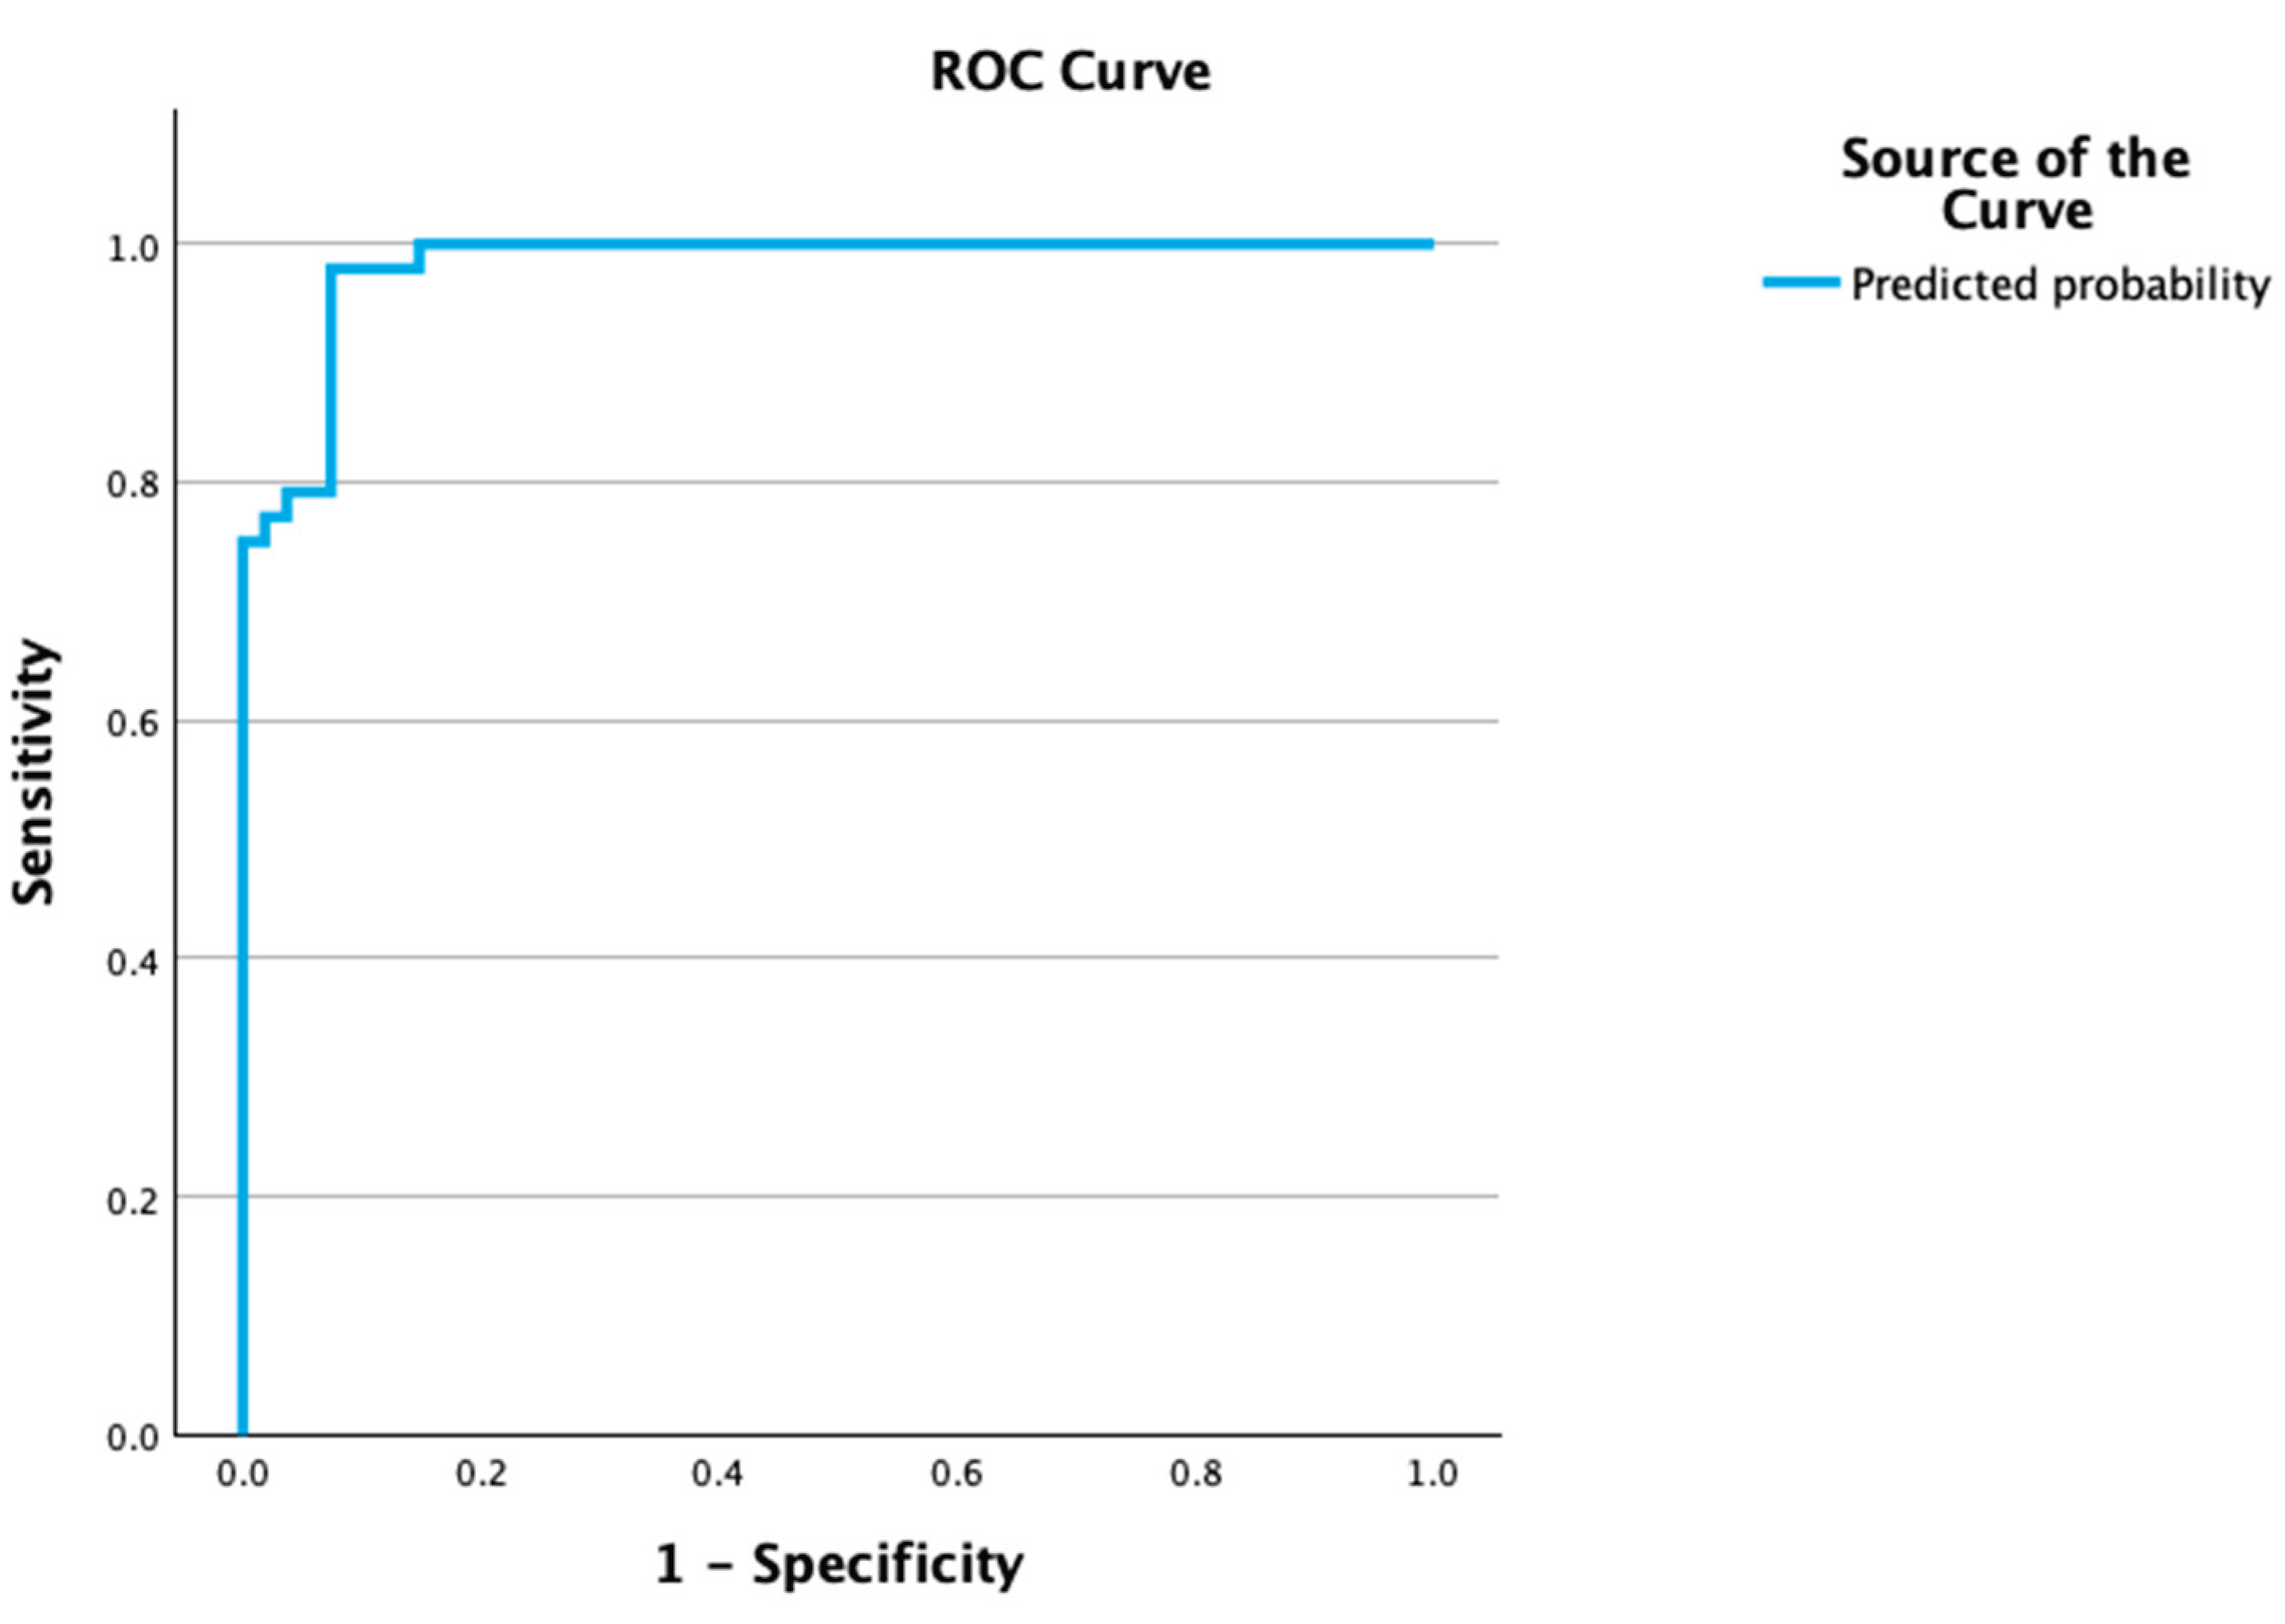

Table 1.
Demographic characteristics by disease status. Age is presented as mean ± SD; sex and smoking status as counts.
Table 1.
Demographic characteristics by disease status. Age is presented as mean ± SD; sex and smoking status as counts.
| Parameter | Peri-implantitis (n = 58) | Healthy/Mucositis (n = 66) | p-value |
| Age (Mean ± SD) | 60.73 ± 10.54 years | 58.22 ± 10.19 years | 0.225a |
| Sex | Male: 33, Female: 25 | Male: 31, Female: 35 | 0.270b |
| Smoking Status | No: 35, <10 cig/day: 9, >10 cig/day: 17 | No: 44, <10 cig/day: 10, >10 cig/day: 10 | 0.665b |
ᵃ Mann–Whitney U test. ᵇ Chi-square test. No significant differences were found (all p > 0.05).
Table 2.
Multivariable logistic regression model for peri-implantitis.
| Predictor | B | p-value | OR (95% CI) |
| aMMP-8 > 20 ng/mL | 3.260 | 0.006 | 26.06 |
| CAL (per mm) | 4.540 | <0.001 | 93.70 |
| S. epidermidis (copies) | 0.009 | 0.010 | — |
| B = regression coefficient, SE = standard error, OR = odds ratio, CI = confidence interval, CAL = clinical attachment level, aMMP-8 = active-matrix metalloproteinase-8, S. epidermidis = bacterial load by qPCR. All predictors were statistically significant (p < 0.05), indicating independent associations with peri-implantitis risk. OR for S. epidermidis calculated as exp(B); CI not shown due to unavailable SE | |||
Table 3.
Predictors of BOP% from linear regression analysis.
| Predictor | β | p-value |
| MMP-8 Gene Expression | 0.322 | 0.003 |
| aMMP-8 > 20 ng/mL | 0.213 | 0.046 |
β = standardized regression coefficient, p-values indicate statistical significance, MMP-8 = matrix metalloproteinase-8 gene expression, aMMP-8 = active MMP-8 in peri-implant crevicular fluid.
Table 4.
Clinical diagnosis by personalized risk category.
| Risk Category | n | Peri-Implantitis Cases (n) | % with Peri-Implantitis |
| Low (0–2 points) | 41 | 5 | 12.2% |
| Moderate (3–5 points) | 31 | 18 | 58.1% |
| High (6–7 points) | 23 | 23 | 100.0% |
Disclaimer/Publisher’s Note: The statements, opinions and data contained in all publications are solely those of the individual author(s) and contributor(s) and not of MDPI and/or the editor(s). MDPI and/or the editor(s) disclaim responsibility for any injury to people or property resulting from any ideas, methods, instructions or products referred to in the content. |
© 2025 by the authors. Licensee MDPI, Basel, Switzerland. This article is an open access article distributed under the terms and conditions of the Creative Commons Attribution (CC BY) license (http://creativecommons.org/licenses/by/4.0/).
Copyright: This open access article is published under a Creative Commons CC BY 4.0 license, which permit the free download, distribution, and reuse, provided that the author and preprint are cited in any reuse.


