Submitted:
19 May 2025
Posted:
19 May 2025
You are already at the latest version
Abstract
Background: Congenital heart disease (CHD) affects approximately 9 per 1,000 live births worldwide, with increasing prevalence due to improved survival. Today, over 90% of individuals with CHD reach adulthood, resulting in a growing population of adults with congenital heart disease (ACHD). Despite its clinical relevance, iron deficiency (ID) and anemia have been insufficiently studied in this group.
Objectives: To evaluate the prevalence and clinical impact of iron deficiency and anemia in ACHD, particularly their relationship with exercise capacity.
Methods: We retrospectively analyzed 310 ACHD patients at University Hospital Düsseldorf between January 2017 and January 2019. Iron status was assessed using serum ferritin, transferrin saturation (TSAT), and hemoglobin levels. Exercise capacity was measured by cardiopulmonary exercise testing (VO₂ max). Prevalence and clinical as-sociations were compared with those reported in heart failure populations, using ESC guideline criteria. Analyses were adjusted for age, sex, and defect complexity.
Results: ID was present in 59.0% (183/310). Anemia was observed in 4.2% (13/310), mostly microcytic (46%) or normocytic (38%). Reduced exercise capacity (VO₂ max < 80% pre-dicted) occurred in 16.5% (51/310), more frequently in complex CHD (31.3% vs. 11.3%, p < 0.001). ID was associated with a trend towards lower VO₂ max (21.3 vs. 23.5 mL/min/kg, p = 0.068), while anemia correlated with significantly reduced performance (19.8 ± 4.1 vs. 22.9 ± 6.3 mL/min/kg, p = 0.041).
Conclusion: Iron deficiency and anemia are frequent in ACHD and may impair func-tional capacity. These findings highlight the need for targeted screening and manage-ment strategies in this growing patient population.
Keywords:
ACHD
; Iron Deficiency
; Anemia
; VO₂ max
; Functional Capacity
1. Introduction
Congenital heart disease (CHD) affects approximately 9 per 1,000 live births globally, with prevalence increasing due to improved survival into adulthood [1,2,3]. Advancements in surgical techniques, medical therapy, and interventional cardiology have enabled more than 90% of CHD patients to survive into adulthood, resulting in a growing population of adults with congenital heart disease (ACHD) that now outnumbers the pediatric CHD population [4,5].
Despite these gains, ACHD patients remain vulnerable to long-term complications, including iron deficiency (ID) and anemia. While ID in chronic heart failure (HF) is a well-established contributor to reduced exercise capacity, increased symptom burden, and adverse outcomes—with current guidelines recommending intravenous iron replacement—the prevalence and clinical implications of ID and anemia in ACHD remain insufficiently defined [6,7,8]. Pathophysiologic mechanisms such as cyanotic physiology, chronic inflammation, erythropoietic dysregulation, and renal dysfunction may predispose ACHD patients to hematologic abnormalities that impair functional capacity and quality of life.
Evidence on the prevalence, phenotype, and clinical relevance of ID and anemia in ACHD is limited. Small-scale studies have suggested possible associations with impaired oxygen uptake and adverse outcomes, particularly in cyanotic individuals, but results have been inconsistent.
This study aimed to assess the prevalence of iron deficiency and anemia in a well-characterized ACHD cohort and to examine their association with objective measures of functional capacity. Our goal was to determine whether these potentially modifiable hematologic conditions contribute to impaired exercise performance. The results could guide future strategies for risk stratification and therapeutic management.
2. Materials and Methods
This study is a retrospective analysis of patients followed at the certified Adult Congenital Heart Disease (ACHD) outpatient clinic of the University Hospital Düsseldorf (UKD), accredited by the German Society of Cardiology. All patients attending the clinic between January 2017 and January 2019 were included, provided that complete documentation of their visit and relevant iron metabolism parameters was available.
The study received ethics approval from the Ethics Committee of Heinrich Heine University Düsseldorf (Reference 2019-375-RetroDEuA; approved January 30, 2019). All procedures conformed to ethical standards for retrospective analyses. No animal experiments were conducted or required.
To be eligible, patients had to have a confirmed diagnosis of congenital heart disease, regardless of surgical status. Inclusion required comprehensive clinical documentation, including blood counts and iron status parameters.
Extracted baseline variables included date of visit, age, sex, height, weight, and body mass index (BMI). Each patient was assigned a unique identifier to avoid duplication. Data were analyzed anonymously.
CHD lesions were classified per ESC guidelines into four categories: shunt lesions, left-sided obstruction, right-sided obstruction, and complex malformations. In cases with multiple anomalies, the lesion with the greatest hemodynamic impact was designated as the primary diagnosis. Patients with Eisenmenger physiology were classified as complex, regardless of origin. The systemic ventricle and presence of univentricular physiology were also recorded.
Documentation included prior surgical repair, cyanotic status, and Eisenmenger syndrome. Cyanosis was defined as SpO₂ ≤ 92% on room air or documented clinical hypoxemia.
Systolic ventricular function was categorized based on ejection fraction (EF): normal (≥55%), mildly reduced (45–54%), moderately reduced (30–44%), and severely reduced (<30%). Valve function was graded (mild/moderate/severe stenosis or regurgitation) per ESC echocardiographic criteria using Doppler-based parameters. MRI findings were prioritized for ventricular function; echocardiography was used primarily for valvular assessment.
The New York Heart Association (NYHA) functional class was assigned based on clinical records or estimated from reported exercise tolerance.
Additional symptoms—including dyspnea, fatigue, chest pain, lightheadedness, and headache—were extracted. Physical capacity was assessed via cardiopulmonary exercise testing (CPET), bicycle ergometry, or six-minute walk test (6MWT) based on clinical appropriateness. CPET included VO₂ max using breath-by-breath gas exchange on a cycle ergometer. Ergometry data included maximal metabolic equivalents (METs). The 6MWT was performed on a standardized 30-meter indoor track, recording total distance walked. Heart rate, SpO₂, and exertion ratings were documented when available.
Blood samples were routinely drawn at each visit, and laboratory results were recorded. In the first phase, patients were stratified into cyanotic and acyanotic groups, with comparative analyses focusing on iron deficiency, anemia, and functional capacity. The goal was to explore phenotypic differences and pathophysiological patterns between these subgroups.
In the second phase, patients were divided by anemia status, and the relationship with iron parameters and cyanotic/acyanotic phenotype was analyzed. This integrative approach aimed to explore how anemia and CHD morphology jointly influence functional outcomes.
Chronic kidney disease (CKD) was defined as eGFR <60 mL/min/1.73 m² on two occasions or per documented diagnosis.
Anemia was defined according to WHO and ESC guidelines: Hb <12 g/dL in women and <13 g/dL in men. Mean corpuscular volume (MCV) categorized anemia as microcytic (≤80 fL), normocytic (80–96 fL), or macrocytic (≥96 fL).
Iron deficiency (ID) was defined as:
- Serum ferritin <100 µg/L (absolute ID)
- Serum ferritin 100–299 µg/L with TSAT <20% (functional ID)
The soluble transferrin receptor (sTfR)/log ferritin ratio was additionally used where available.
Patients with both anemia and ID were classified as having iron deficiency anemia (IDA).
Comorbidities and medications were extracted from records. If not explicitly listed, comorbidities were assumed absent.
Statistical analysis:
The collected dataset was analyzed using IBM SPSS Statistics, Version 26, and included metric, ordinal, and nominal variables.
Metric variables were summarized as mean ± standard deviation (SD), while categorical variables were reported as absolute and relative frequencies.
To compare two groups, a series of statistical tests were applied based on data distribution and scale: Metric variables were tested for normal or log-normal distribution using the Shapiro–Wilk test. Depending on distribution, either independent samples t-tests (for normally distributed data) or Mann–Whitney U tests (for non-normally distributed data) were used for comparisons between two groups. For analyses involving more than two groups, one-way analysis of variance (ANOVA) was applied if the assumptions for parametric testing were met. Associations between categorical variables were assessed using the chi-square test or Fisher’s exact test when expected cell frequencies were ≤5. Correlations between variables were evaluated using Pearson’s correlation for normally distributed metric variables, and Spearman’s rank correlation in cases of ordinal data or when at least one metric variable was not normally distributed. All statistical tests were two-tailed, and a p-value of <0.05 was considered statistically significant.
3. Results
Between January 2017 and January 2019, 525 patient visits fulfilled the study inclusion criteria. Of these, 215 were excluded as repeat follow-up visits from patients already represented in the dataset, ensuring that only one visit per patient was included in the analysis. An additional 14 cases were excluded due to missing iron panel data (ferritin and transferrin saturation), resulting in a final cohort of 310 unique patients with complete iron status and exercise capacity data.
The cohort comprised 51.6% male and 48.4% female patients, with an age range of 17 to 77 years (mean age: 33 ± 13.3 years). The mean body mass index (BMI) was 25.1 ± 4.7 kg/m².
All major congenital heart defects listed by the Competence Network for Congenital Heart Disease were represented in the cohort (see Table A1). Additionally, less common defects were documented, including pulmonary vein anomalies, aortopathies, congenital mitral valve malformations, double-chambered right ventricles, Ebstein anomaly, and coronary artery anomalies. Due to the presence of multiple cardiac anomalies in some patients, the cumulative frequency of individual diagnoses may exceed 100%.
Patients were distributed across the four principal CHD categories defined by ESC guidelines: shunt lesions, left-sided malformations, right-sided malformations, and complex malformations, with sex distribution across categories presented in Table A2.
Among the study population, 202 patients (65.2%) had primarily acyanotic heart defects, and 108 patients (34.8%) were classified as cyanotic.
Baseline characteristics, including age, height, weight, and BMI, are summarized as means ± standard deviation. As not all patients had complete anthropometric data, the sample size (N) varied accordingly. BMI was calculated as weight in kilograms divided by height in meters squared (kg/m²).

Table A1.
baseline Demographics and clinical characteristics.
| Baseline characteristics | Men | Women | Total | |||
| N | N | N | ||||
| Age, y | 33 ± 11 | 160 | 33 ± 12 | 150 | 33 ± 12 | 310 |
| Height (cm) | 177 ± 8 | 159 | 165 ± 9 | 142 | 171 ± 11 | 301 |
| Weight (kg) | 81 ± 16 | 160 | 66 ± 14 | 140 | 74 ± 17 | 300 |
| BMI (kg/m2) | 25,8 ± 4,6 | 159 | 24,4 ± 5,0 | 141 | 25,1 ± 4,9 | 300 |
| Shunt lesions | - | 53 | - | 53 | - | 106 |
| Left-Sided Malformations | - | 63 | - | 58 | - | 121 |
| Right-sided Malformations | - | 66 | - | 88 | - | 154 |
| Complex Malformations | - | 81 | - | 63 | - | 144 |
Table A2.
Distribution of Congenital Heart Defects According to ESC Categories (N = 310).
| ESC Category | Diagnosis | Abbreviation | % | N |
| Shunt Lesions | Ventricular Septal Defect | VSD | 10.6 | 33 |
| Atrial Septal Defect | ASD | 10.3 | 32 | |
| Persistent Ductus Arteriosus | PDA | 7.4 | 23 | |
| Atrioventricular Septal Defect | AVSD | 7.4 | 23 | |
| Anomalous Pulmonary Venous Connection | APVC | 4.5 | 14 | |
| Subtotal | 40.2 | 125 | ||
| Left-sided Malformations | Aortic Isthmus Stenosis | CoA | 14.8 | 46 |
| Aortic Valve Stenosis | AS | 6.1 | 19 | |
| Supravalvular Aortic Stenosis | Suprav. AS | 0.3 | 1 | |
| Congenital Mitral Valve Defects | - | 2.3 | 7 | |
| Aortopathy | - | 4.5 | 14 | |
| Subtotal | 28.0 | 87 | ||
| Right-sided Malformations | Pulmonary Valve Stenosis | PS | 11.3 | 35 |
| Ebstein Anomaly | - | 2.6 | 8 | |
| Double-Chambered Right Ventricle | DCRV | 1.0 | 3 | |
| Coronary Anomalies | - | 1.3 | 4 | |
| Subtotal | 16.2 | 50 | ||
| Complex Malformations | Tetralogy of Fallot | TOF | 15.8 | 49 |
| Transposition of the Great Arteries | TGA | 10.0 | 31 | |
| Congenitally Corrected TGA | ccTGA | 1.9 | 6 | |
| Double Outlet Right Ventricle | DORV | 2.6 | 8 | |
| Truncus Arteriosus | TAC | 1.6 | 5 | |
| Hypoplastic Left Heart Syndrome | HLHS | 0.3 | 1 | |
| Pulmonary Atresia ± VSD | PA ± VSD | 1.6 | 5 | |
| Tricuspid Atresia | TrA | 1.9 | 6 | |
| Double Inlet Ventricle | DIV | 0.3 | 1 | |
| Subtotal | 36.0 | 112 |
Table A3.
Comorbidities of patients.
| Comorbidity | Percentage (%) | Total | SL (%) | LF (%) | RF (%) | CF (%) | p-value |
| Arterial Hypertension | 18,1 | 56 | 14,7 | 28,6 | 15,5 | 13,5 | 0.334891 |
| Pulmonary Hypertension | 5,2 | 16 | 6,7 | - | 2,4 | 12,2 | 0.010101 |
| Chronic Kidney Insufficiency | 1,6 | 5 | 1,3 | 1,3 | 2,4 | 2,7 | 1.000000 |
| Diabetes Mellitus | 1,3 | 4 | 4,0 | - | - | 1,4 | 0.333333 |
| Trisomy 21 | 4,8 | 15 | 10,7 | - | 3,6 | 5,4 | 0.060606 |
| Bronchial Asthma | 5,5 | 17 | 4,0 | 9,1 | 3,6 | 5,4 | 0.151515 |
| Chronic Obstructive Pulmonary Disease | 1,0 | 3 | 2,7 | - | - | 1,4 | 1.000000 |
| Migraine | 6,1 | 19 | 6,7 | 11,7 | 2,4 | 4,1 | 0.242424 |
| Chronic Inflammatory Bowel Disease | 0,3 | 1 | - | - | 1,2 | - | 1.000000 |
| Celiac Disease | 0,3 | 1 | - | 1,3 | - | - | 1.000000 |
| Gastritis, Esophagitis, Enteritis | 0,6 | 2 | - | 1,3 | - | 1,4 | 1.000000 |
| Reflux | 0,3 | 1 | - | 1,3 | - | - | 1.000000 |
| Polymenorrhea | 1,0 | 3 | - | - | 3,6 | - | 1.000000 |
| Depression | 4,8 | 15 | 12,0 | 2,6 | 1,2 | 4,1 | 0.151515 |
Table A4.
Medication of Patients.
| Medication | Percentage (%) | Total | SL (%) | LF (%) | RF (%) | CF (%) | p-value |
| Anticoagulant | 10,6 | 33 | 12,0 | 3,9 | 4,8 | 23,0 | 0.102 |
| Antiplatel Agent | 6,1 | 19 | 2,7 | 7,8 | 7,1 | 6,8 | 0.632 |
| Iron Supplement | 1,6 | 5 | 1,3 | - | 1,2 | 4,1 | 0.825 |
| ACE Inhibitor | 11,0 | 34 | 10,7 | 13,0 | 3,6 | 17,6 | 0.467 |
| AT1 Antagonist | 7,7 | 24 | 5,3 | 9,1 | 9,5 | 6,8 | 0.597 |
| Calcium Channel Blocker | 2,9 | 9 | 5,3 | 3,9 | 1,2 | 1,4 | 0.439 |
| Beta Blocker | 19,4 | 60 | 16,0 | 16,9 | 19,0 | 25,7 | 0.901 |
| Loop Diuretic | 5,2 | 16 | 4,0 | - | 6,0 | 10,8 | 0.762 |
| Thiazid Diuretic | 6,1 | 19 | 4,0 | 7,8 | 4,8 | 8,1 | 0.931 |
| Potassium-Sparing Diuretics | 2,9 | 9 | 1,3 | - | 2,4 | 8,1 | 0.448 |
| Proton Pump Inhibitor | 3,5 | 11 | 4,0 | 5,2 | 3,6 | 1,4 | 0.483 |
| Oral Contraceptive | 6,5 | 20 | 5,3 | 5,2 | 4,8 | 10,8 | 0.954 |
| NSAID | 1,3 | 4 | 1,3 | - | 3,6 | - | 0.852 |
Table A5.
Laboratory values of the patient collective.
| Men | Women | Total | ||||
| N | N | N | ||||
| Leukocytes (Thous/µL) | 6,89 ± 1,89 | 160 | 7,25 ± 2,03 | 150 | 7,06 ± 1,96 | 310 |
| Erythrocytes (Mill/µL) | 5,26 ± 0,50 | 159 | 4,70 ± 0,51 | 150 | 4,98 ± 0,58 | 309 |
| Hemoglobin (g/dL) | 15,7 ± 1,5 | 160 | 13,8 ± 1,7 | 150 | 14,8 ± 1,9 | 310 |
| Hematocrit (%) | 46,1 ± 4,8 | 160 | 41,4 ± 4,6 | 150 | 43,8 ± 5,3 | 310 |
| MCV (fL) | 87,5 ± 4,7 | 160 | 88,2 ± 5,7 | 150 | 87,8 ± 5,2 | 310 |
| MCHC (g/dL) | 34,1 ± 1,1 | 160 | 33,2 ± 1,2 | 150 | 33,7 ± 1,2 | 310 |
| Platelets (Thous/µL) | 224 ± 50 | 160 | 255 ± 67 | 150 | 239 ± 60 | 310 |
| Ferritin (µg/L) | 209 ± 279 | 160 | 58 ± 51 | 150 | 136 ± 216 | 310 |
| TSAT (%) | 29,7 ± 11,6 | 160 | 23,2 ± 11,6 | 150 | 26,6 ± 12,0 | 310 |
| Transferrin (mg/dL) | 249 ± 34 | 160 | 288 ± 52 | 150 | 268 ± 48 | 310 |
| sTfR (mg/L) | 1,30 ± 0,77 | 144 | 1,37 ± 0,62 | 144 | 1,34 ± 0,70 | 288 |
| Iron (µg/dL) | 102 ± 35 | 160 | 91 ± 44 | 150 | 97 ± 40 | 310 |
| Troponin (ng/L) | 5,16 ± 6,43 | 159 | 2,01 ± 5,33 | 150 | 3,63 ± 6,12 | 309 |
| NTproBNP (ng/L) | 146 ± 214 | 160 | 256 ± 516 | 150 | 200 ± 394 | 310 |
| Bilirubin (mg/dL) | 0,72 ± 0,47 | 156 | 0,56 ± 0,41 | 146 | 0,64 ± 0,45 | 302 |
| CRP (mg/dL) | 0,25 ± 0,76 | 159 | 0,30 ± 0,59 | 150 | 0,27 ± 0,68 | 309 |
| LDH (U/L) | 206 ± 52 | 160 | 204 ± 62 | 150 | 205 ± 57 | 310 |
| Creatinine (mg/dL) | 0,98 ± 0,16 | 160 | 0,78 ± 0,17 | 150 | 0,88 ± 0,19 | 310 |
| eGFR (mL/min) | 102 ± 16 | 158 | 102 ± 19 | 150 | 102 ± 17 | 308 |
| TSH (mU/L) | 2,47 ± 2,48 | 158 | 1,99 ± 1,15 | 149 | 2,24 ± 1,96 | 307 |
| INR | 1,14 ± 0,36 | 159 | 1,21 ± 0,49 | 150 | 1,17 ± 0,43 | 309 |
Figure B1.
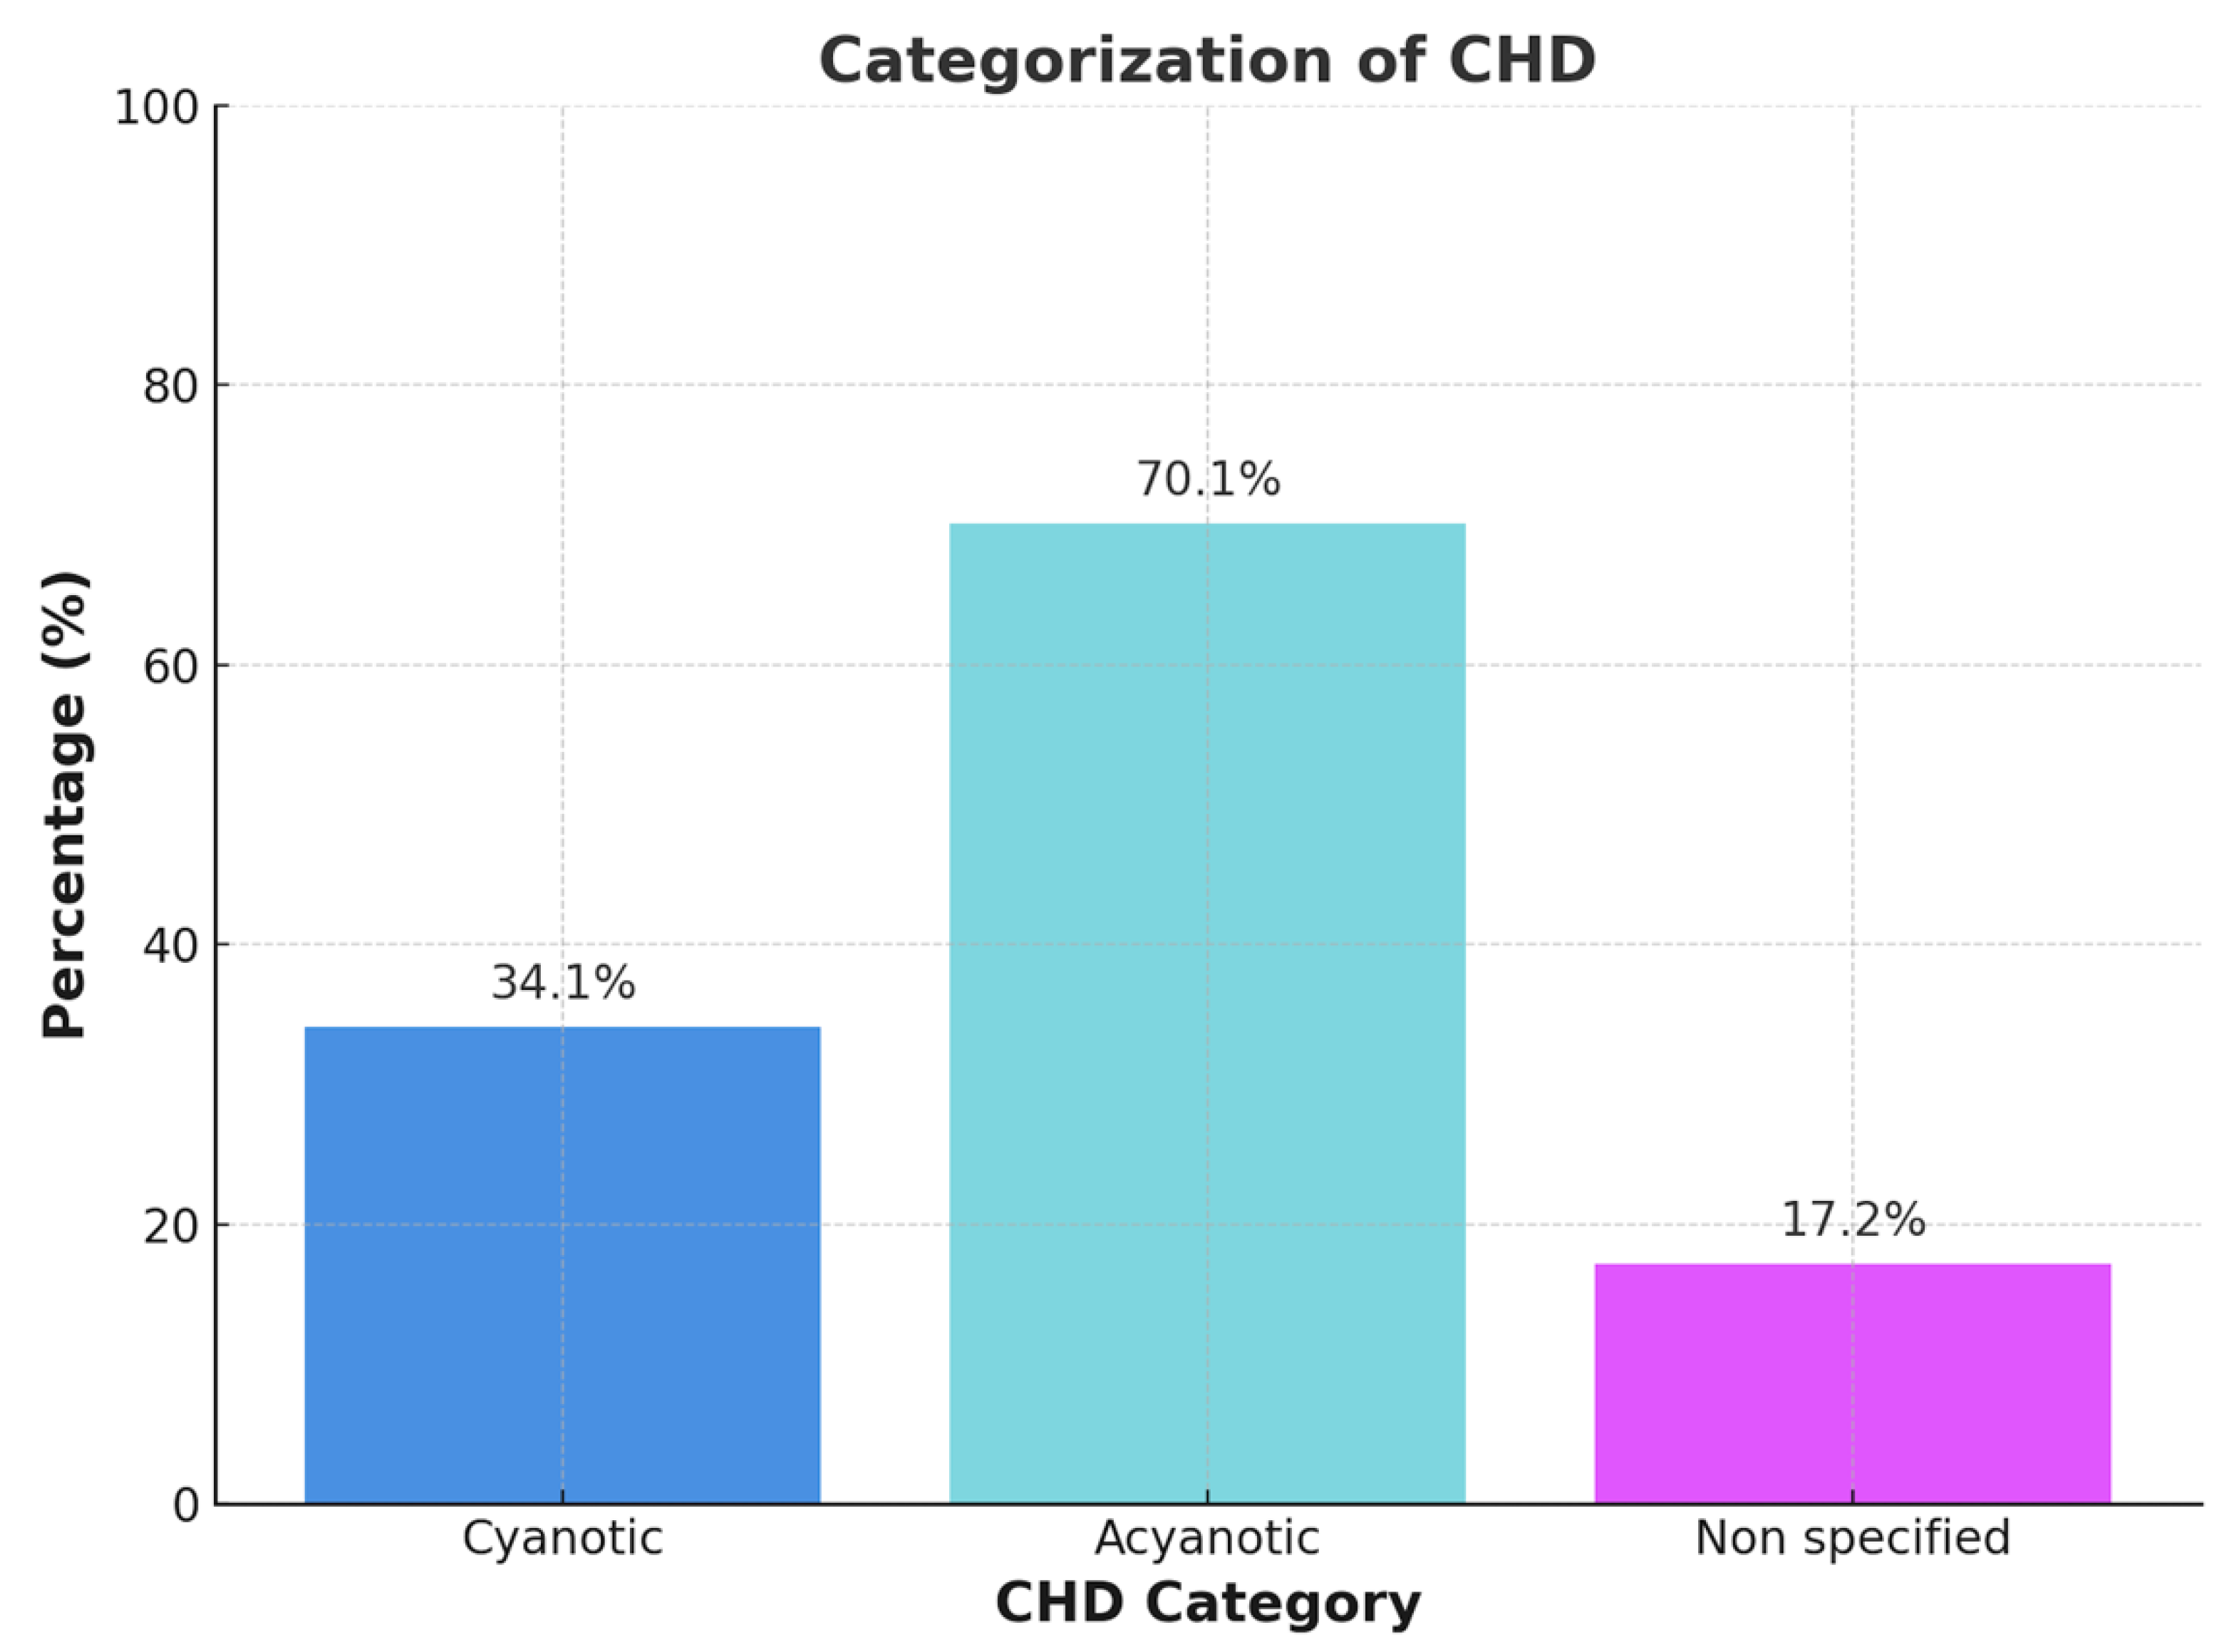
Categorization of Congenital Heart Disease in Cyanotic, acyanotic und non specified heart disease.
Figure B1.
Categorization of Congenital Heart Disease in Cyanotic, acyanotic und non specified heart disease.
In cases of historical cyanosis with subsequent surgical repair or when documentation was incomplete or ambiguous, patients were categorized as ‘not classified’. Each patient was assigned to only one phenotype category to ensure non-overlapping group comparisons.
The cyanotic vs. acyanotic classification was determined using a combination of resting SpO₂, anatomical and physiological features, and clinical documentation. In cases of uncertainty—such as patients with normalized oxygen saturation following repair or insufficient historical records—classification was deferred to the ‘not classified’ category.
Figure B2.
Anemia in ACHD.
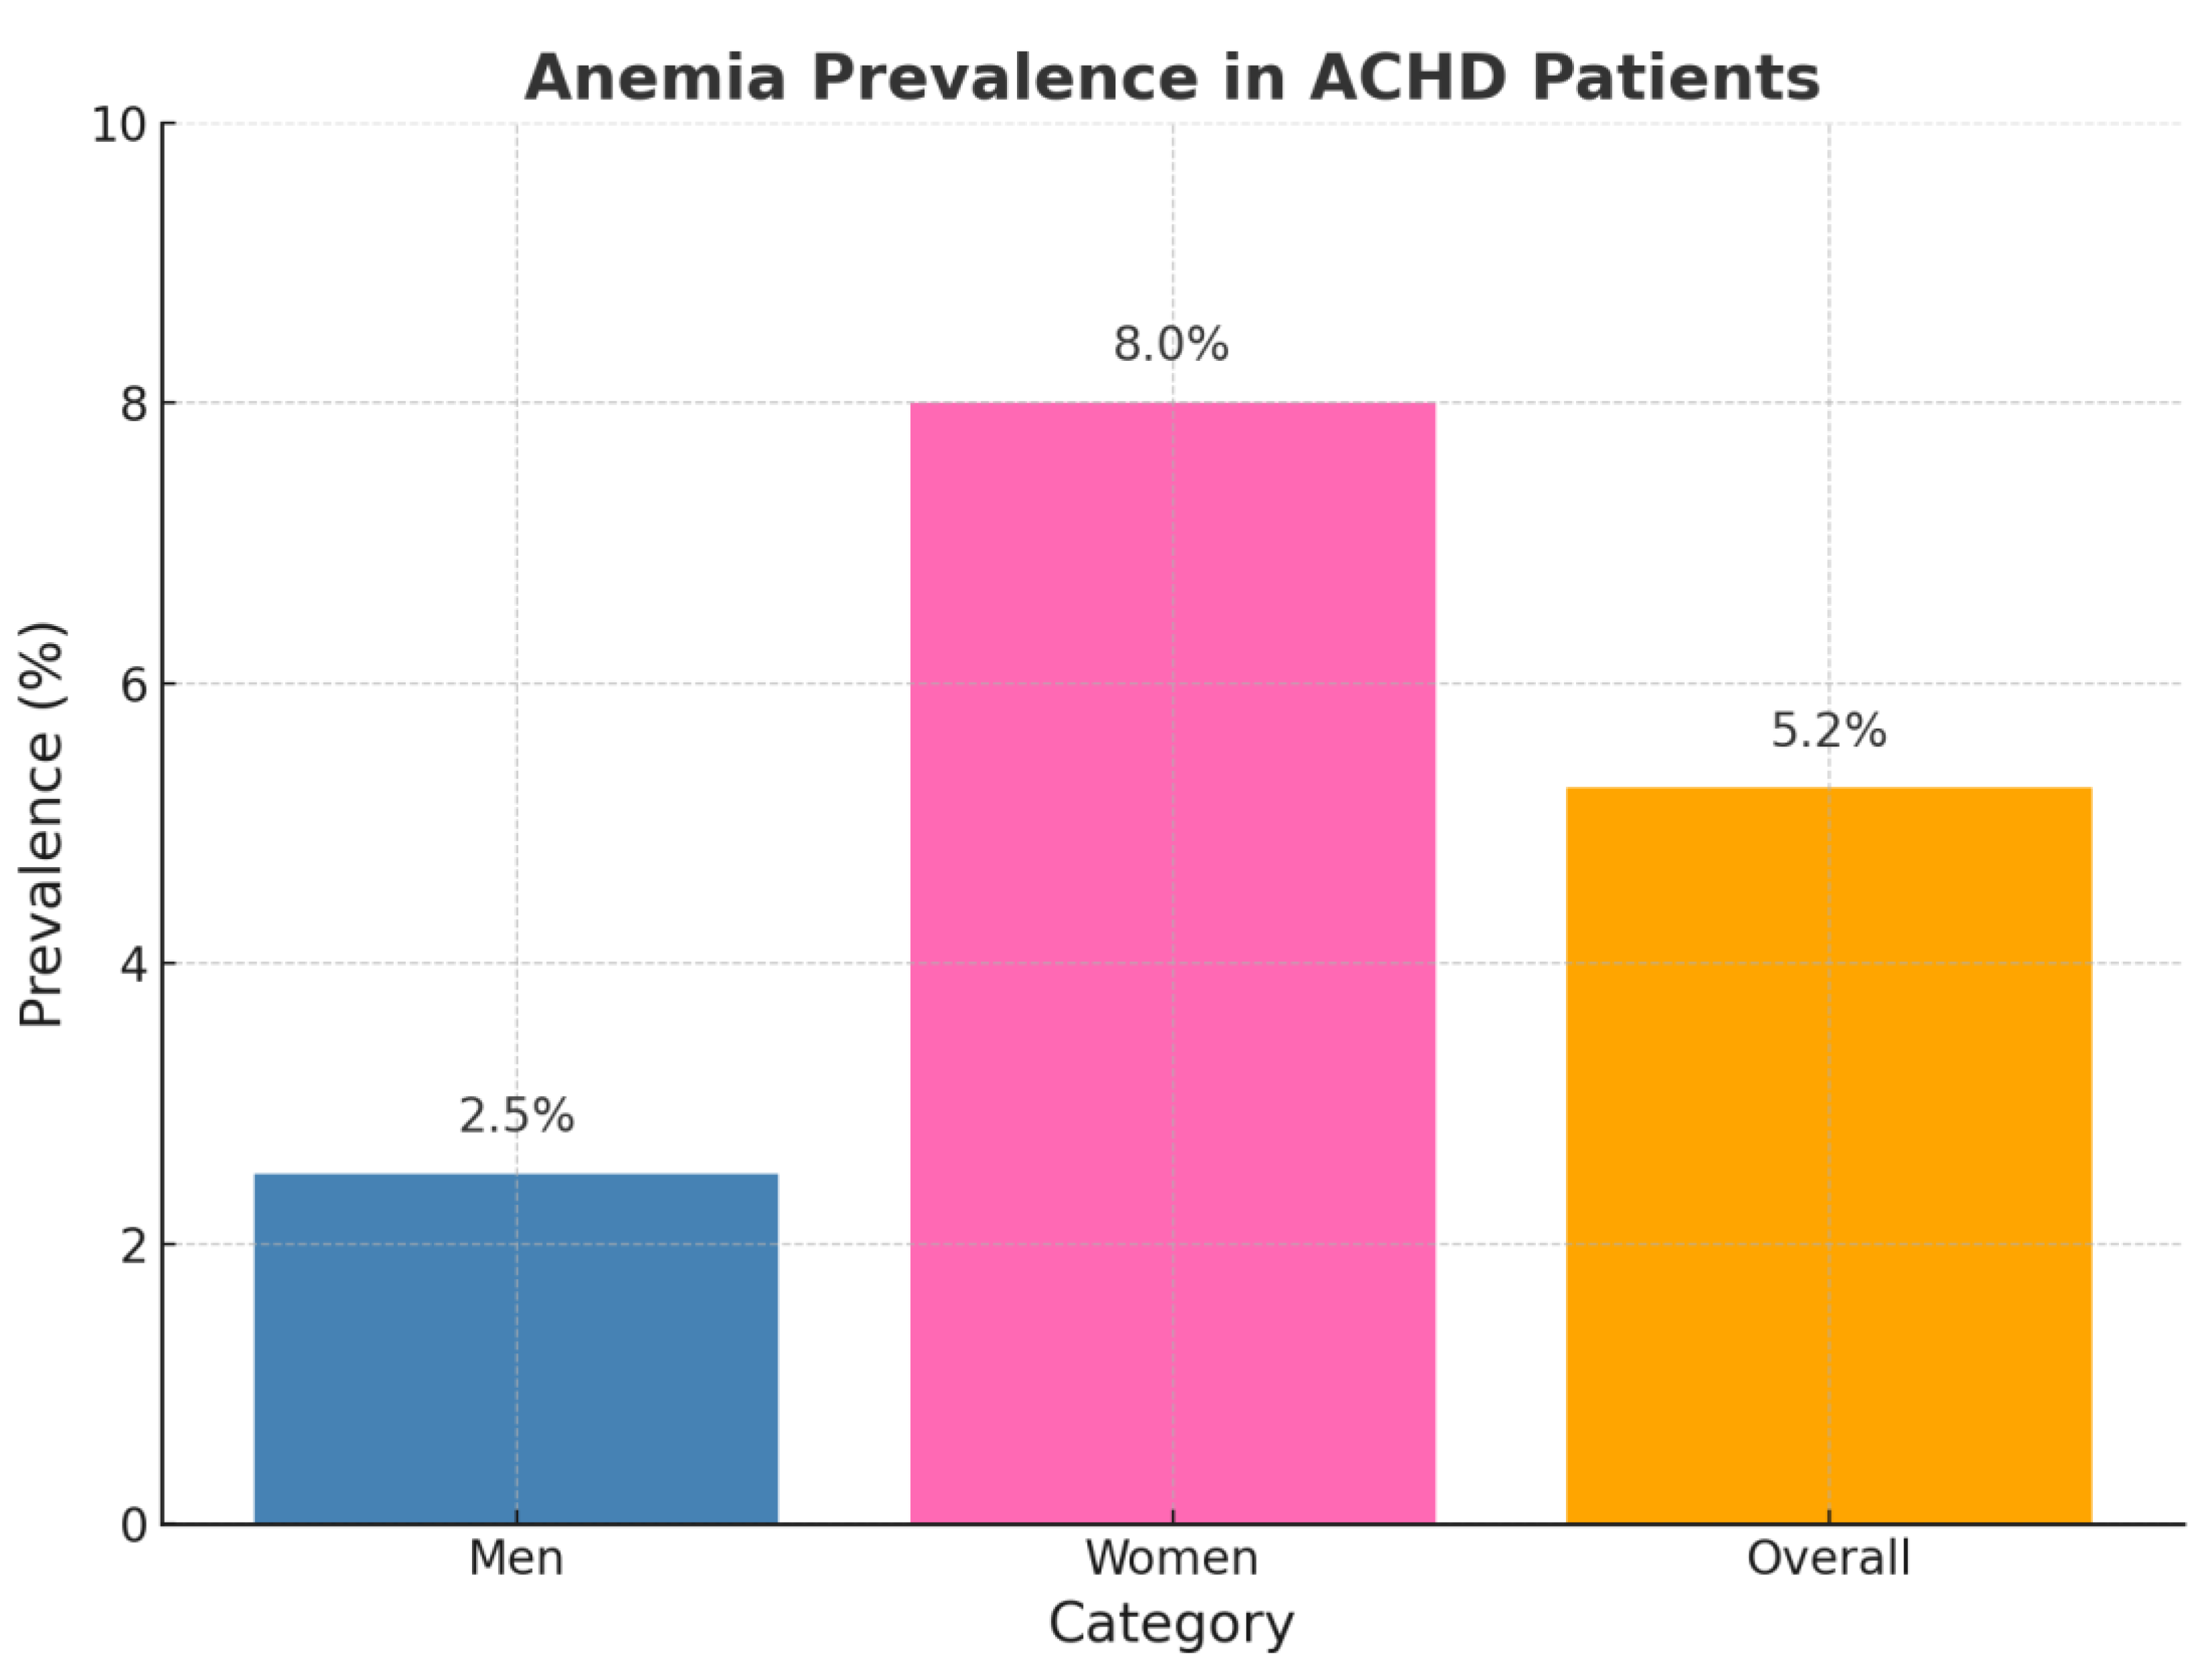
Anemia was identified in 13 patients (4.2%), including 4/160 males (2.5%) and 12/150 females (8.0%). Among these, 6 had microcytic and 7 had normocytic anemia. Anemic patients exhibited significantly impaired exercise tolerance, as reflected by increased dyspnea (p = 0.019), higher frequency of NYHA class > I (p = 0.045), and elevated NT-proBNP levels (651.2 ± 831.2 ng/L vs. 179.8 ± 353.0 ng/L, p = 0.010) compared to non-anemic individuals.
No significant associations were observed between anemia and age, sex, weight, CHD subtype, or systemic ventricular ejection fraction (EF). However, graphical analysis of spiroergometry data revealed a trend toward lower peak VO₂ in anemic patients, with one outlier demonstrating preserved exercise capacity. When excluding four patients with Eisenmenger syndrome—who had secondary erythrocytosis and were not classified as anemic—the association between anemia and peak VO₂ became statistically significant (p = 0.041).
Anemia was also significantly associated with the use of ACE inhibitors (p = 0.042), AT1 receptor antagonists (p = 0.012), beta-blockers (p = 0.023), and diuretics (p = 0.006). Additionally, chronic kidney disease was significantly more frequent in anemic patients (p = 0.022).
While no association with exercise metrics such as max VO₂ (p = 0.058) or METs in ergometry (p = 0.110) was initially found, a statistically significant relationship between anemia and max VO₂ emerged after exclusion of Eisenmenger patients.
Figure B3.
Distribution of maximal oxygen uptake per body weight depending on anemia.
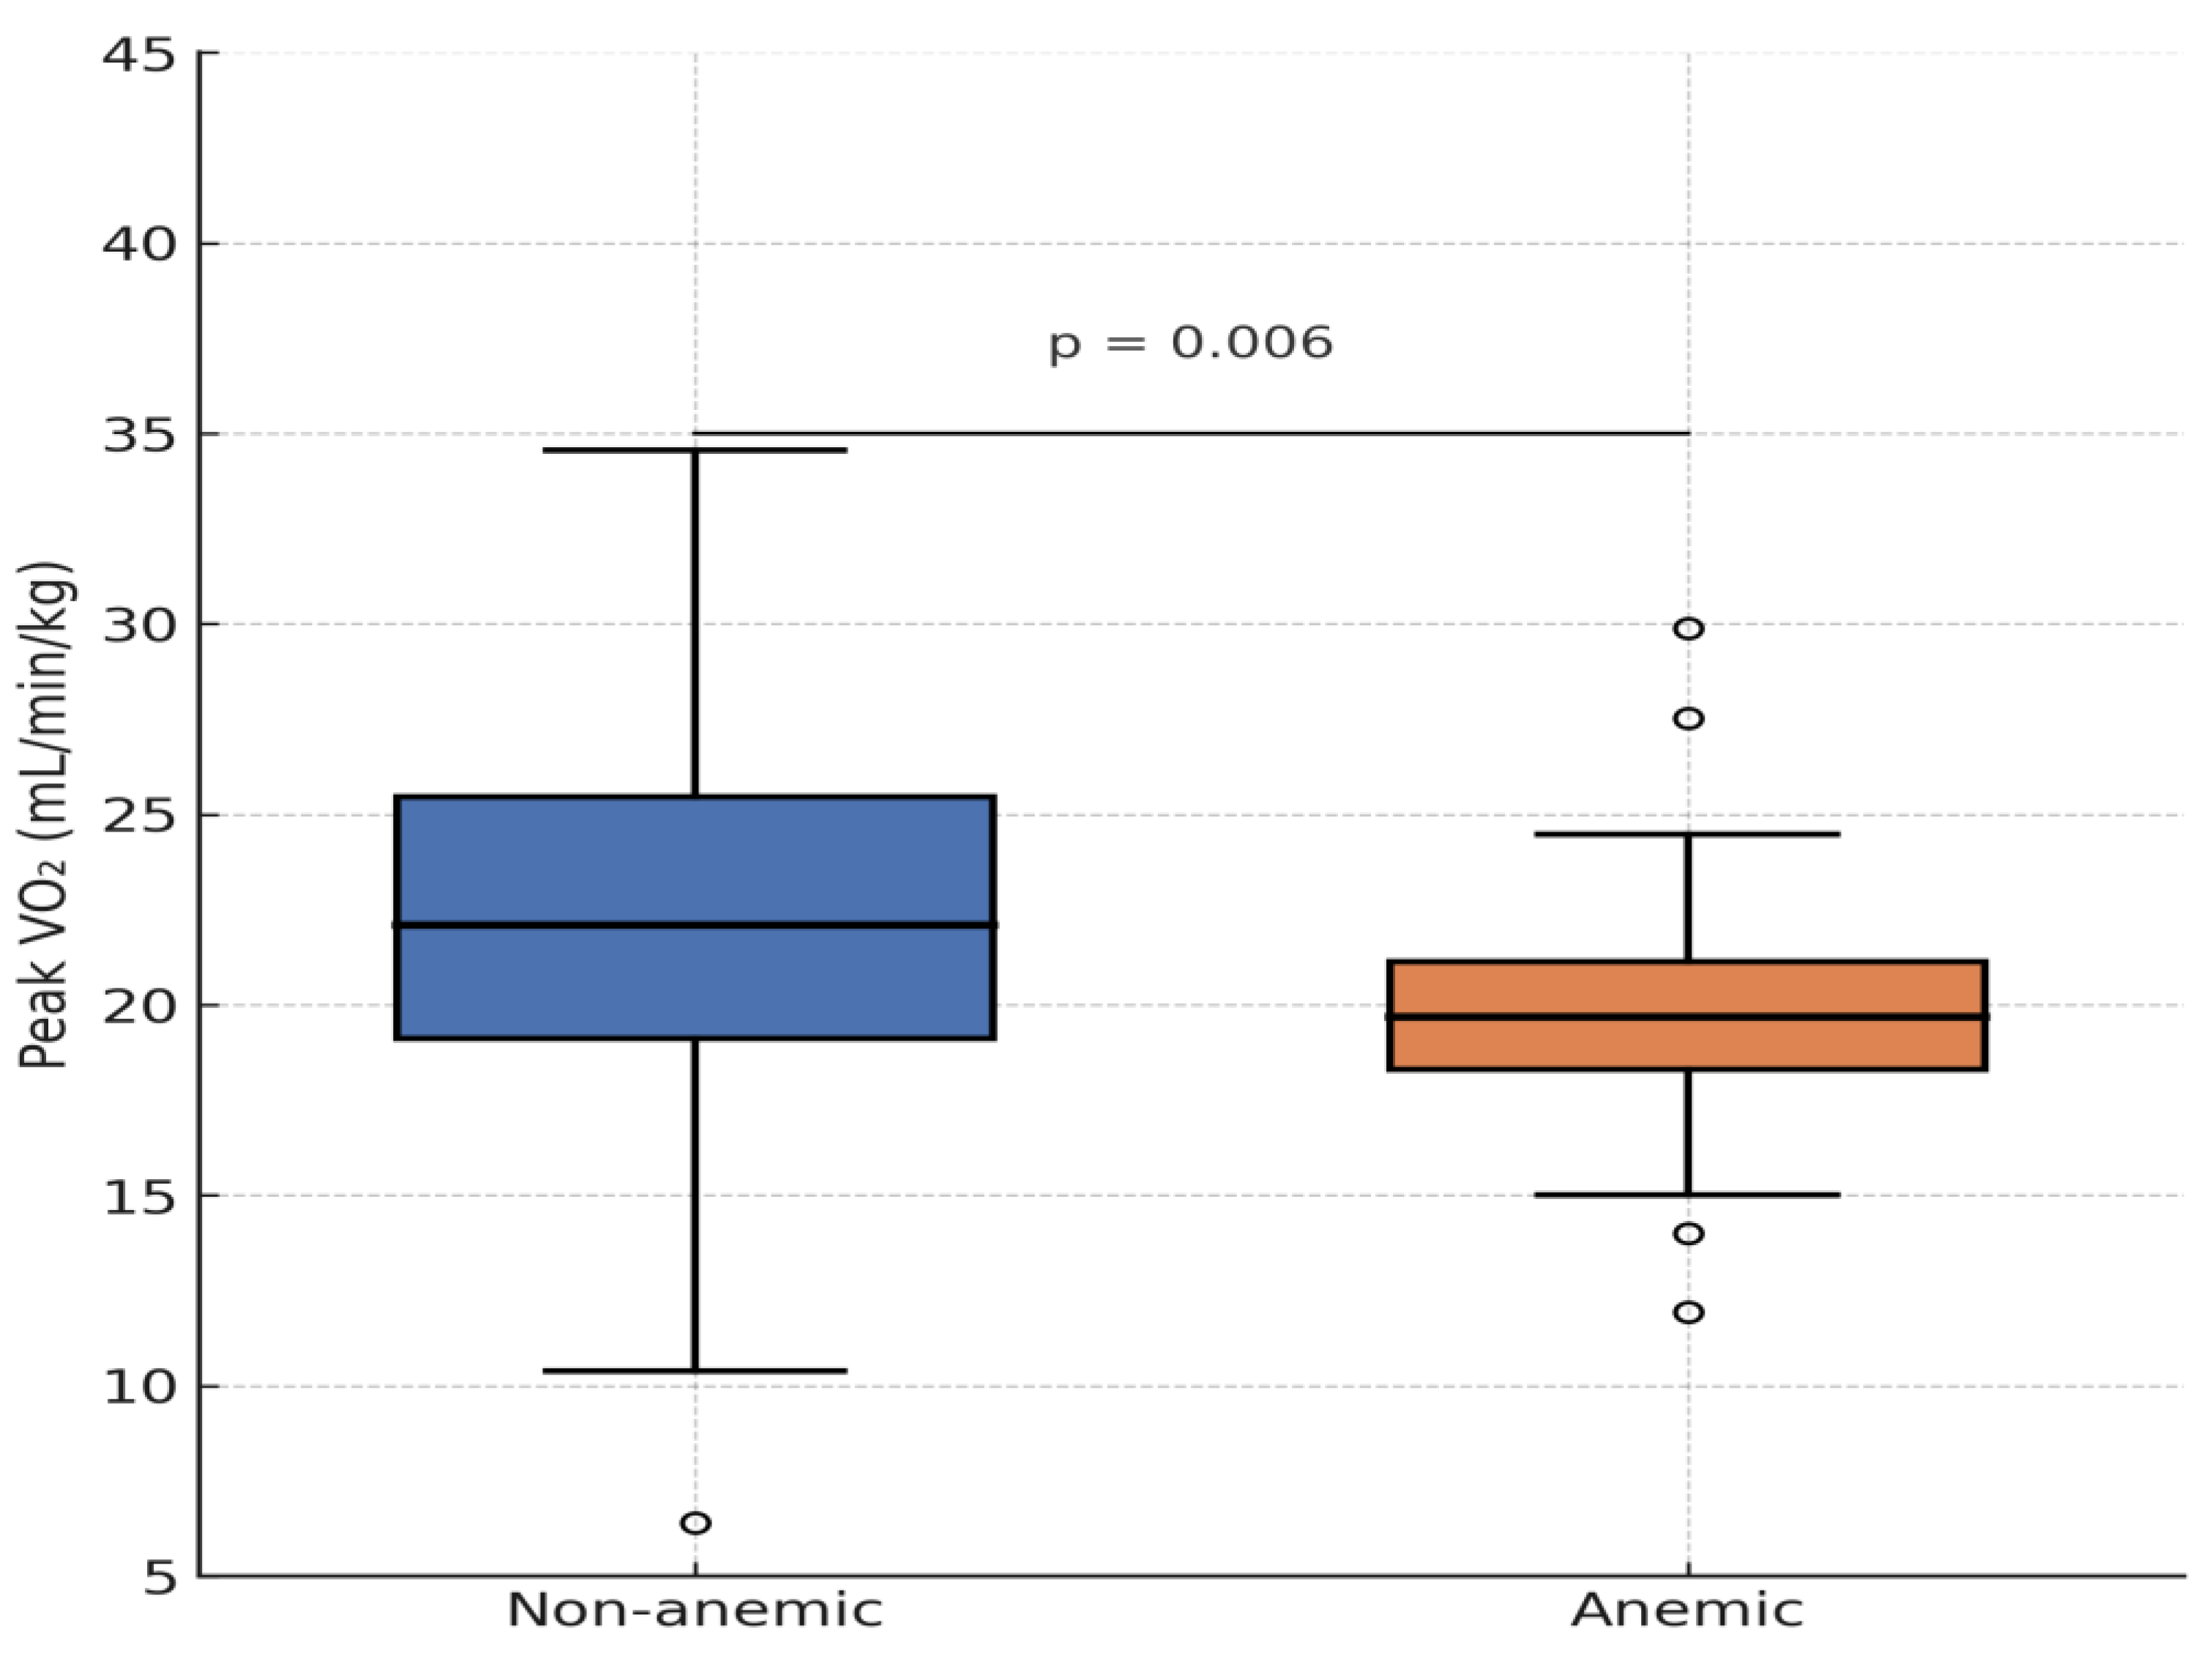
Patients with Eisenmenger syndrome and secondary erythrocytosis demonstrated poor functional performance, contributing to distortion of the correlation. After excluding these four patients, the association between Hb concentration and peak VO₂ became even stronger (r = 0.309, p < 0.001).
Patients with anemia achieved only 71 ± 12% of predicted VO₂ max, compared to 89 ± 15% in non-anemic patients (p = 0.041, after excluding Eisenmenger patients).
Figure B4.
Distribution of maximal oxygen uptake per body weight depending in hemoglobin level.
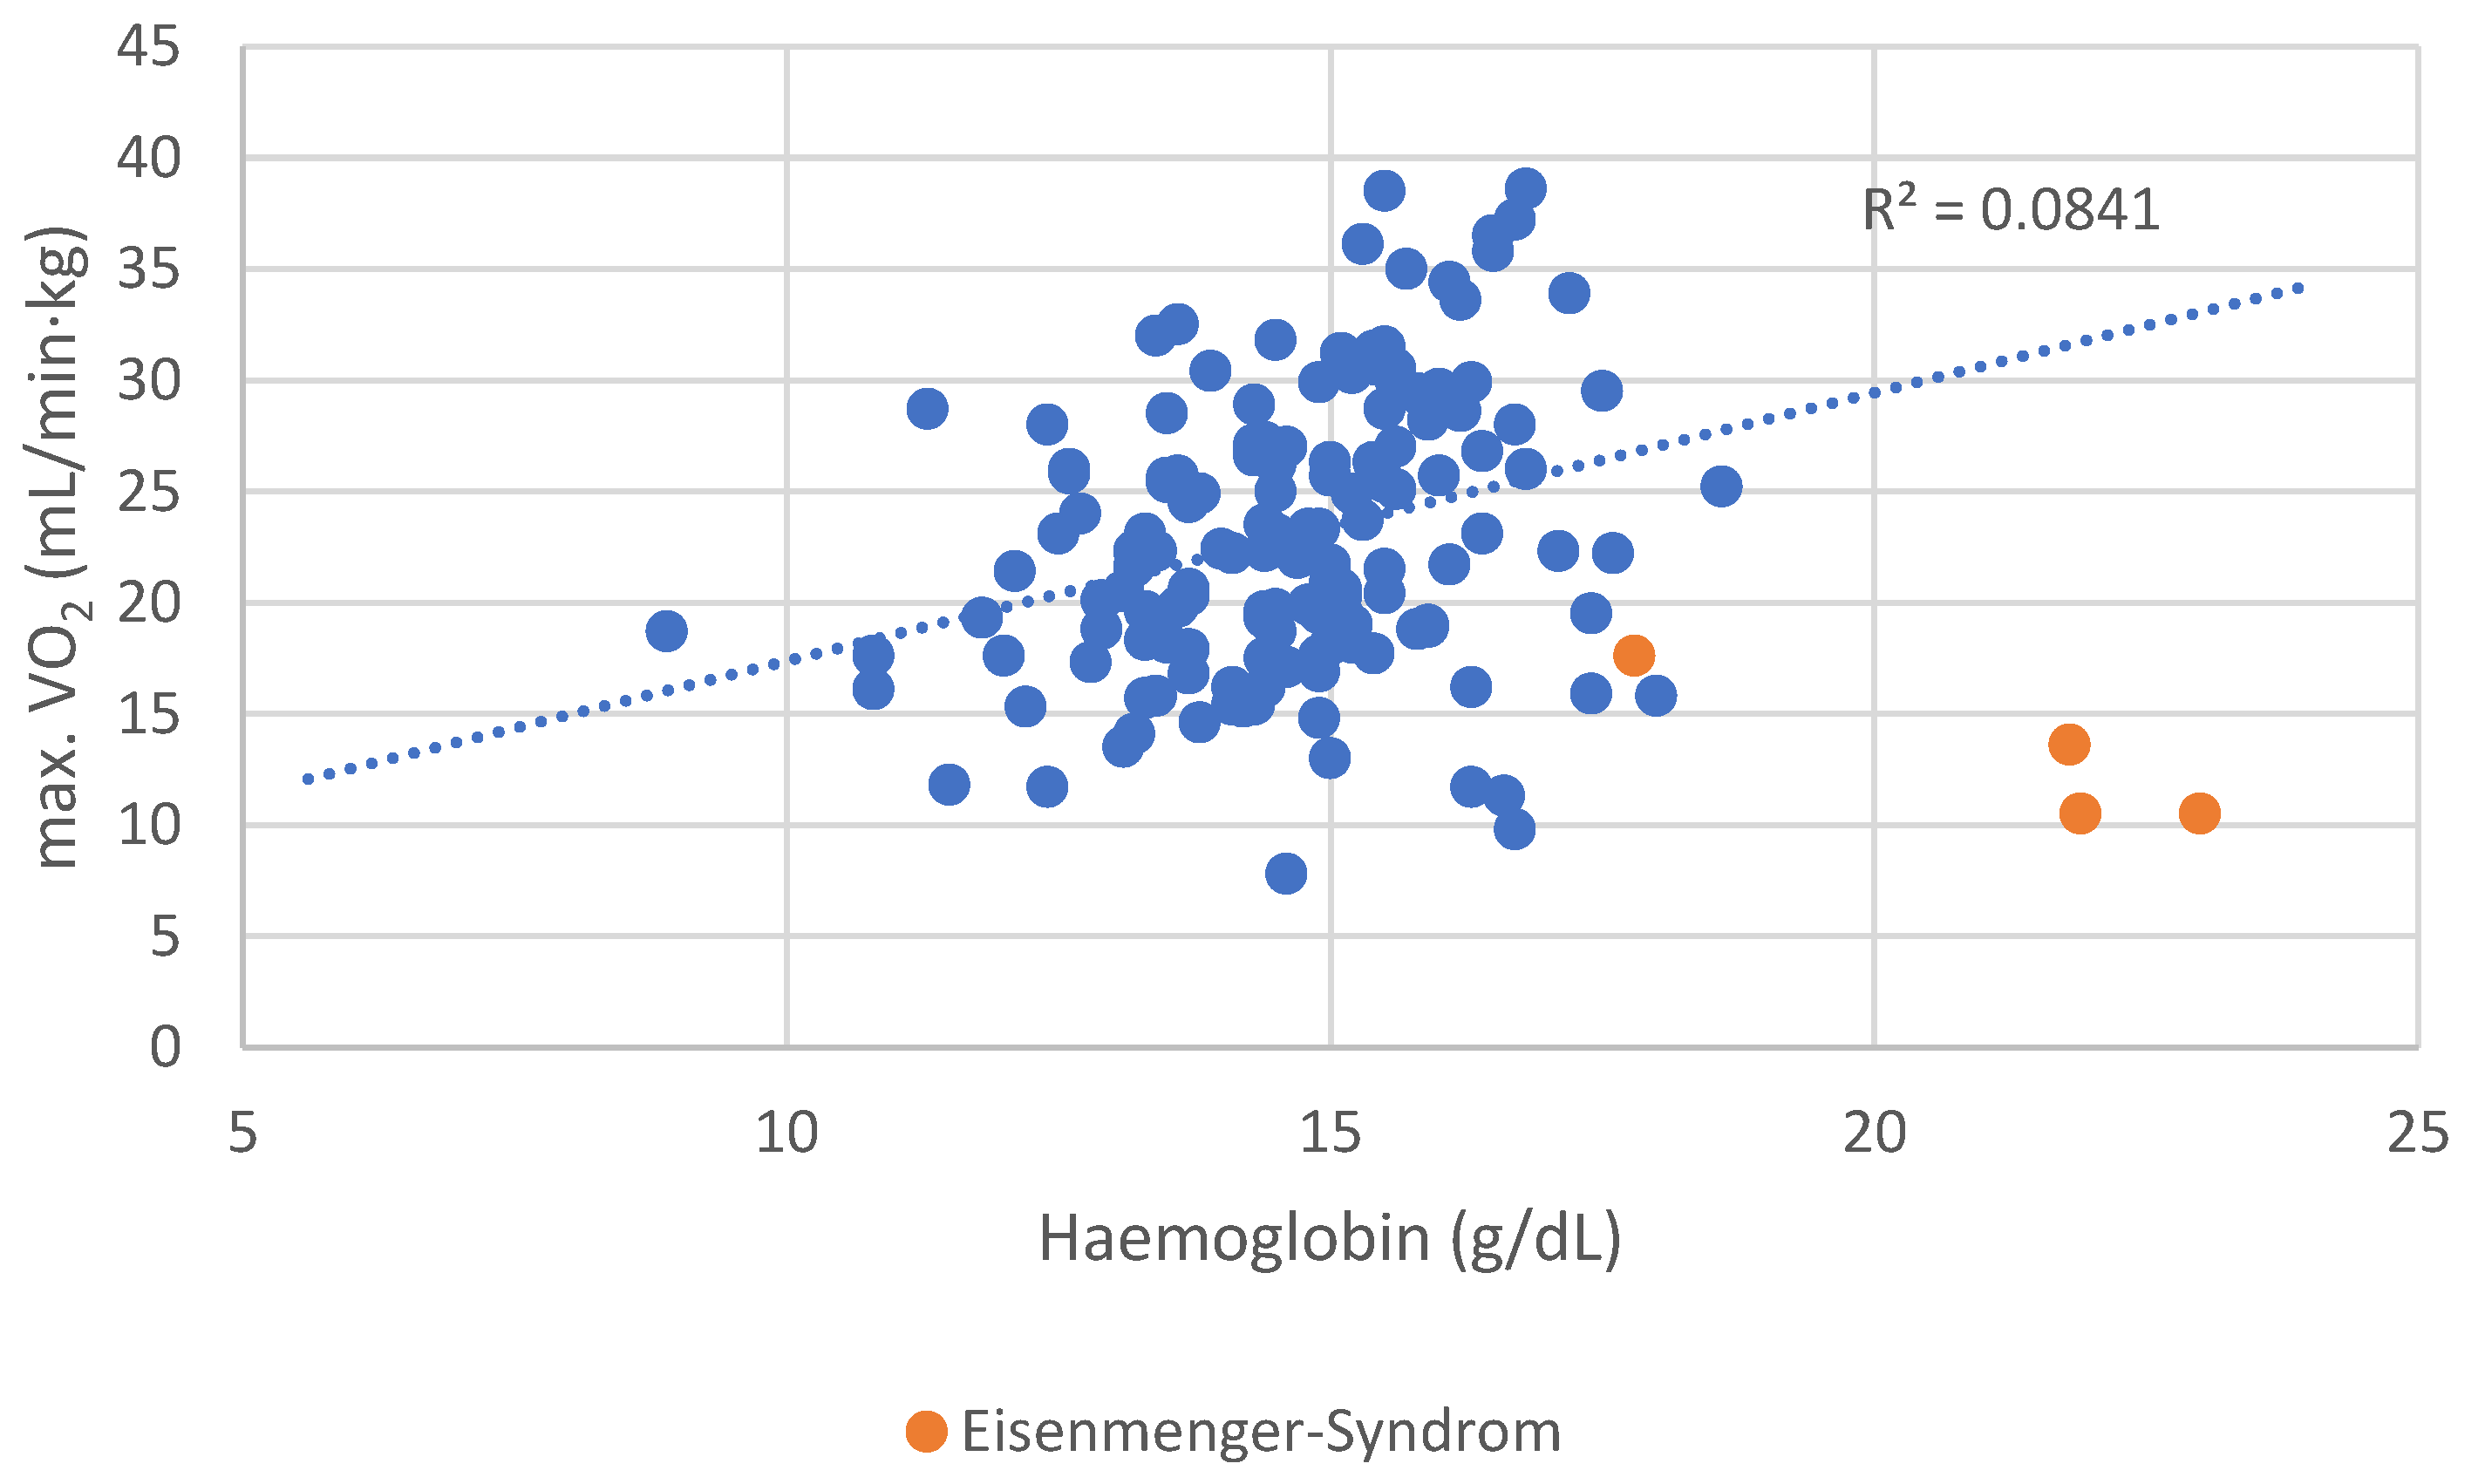
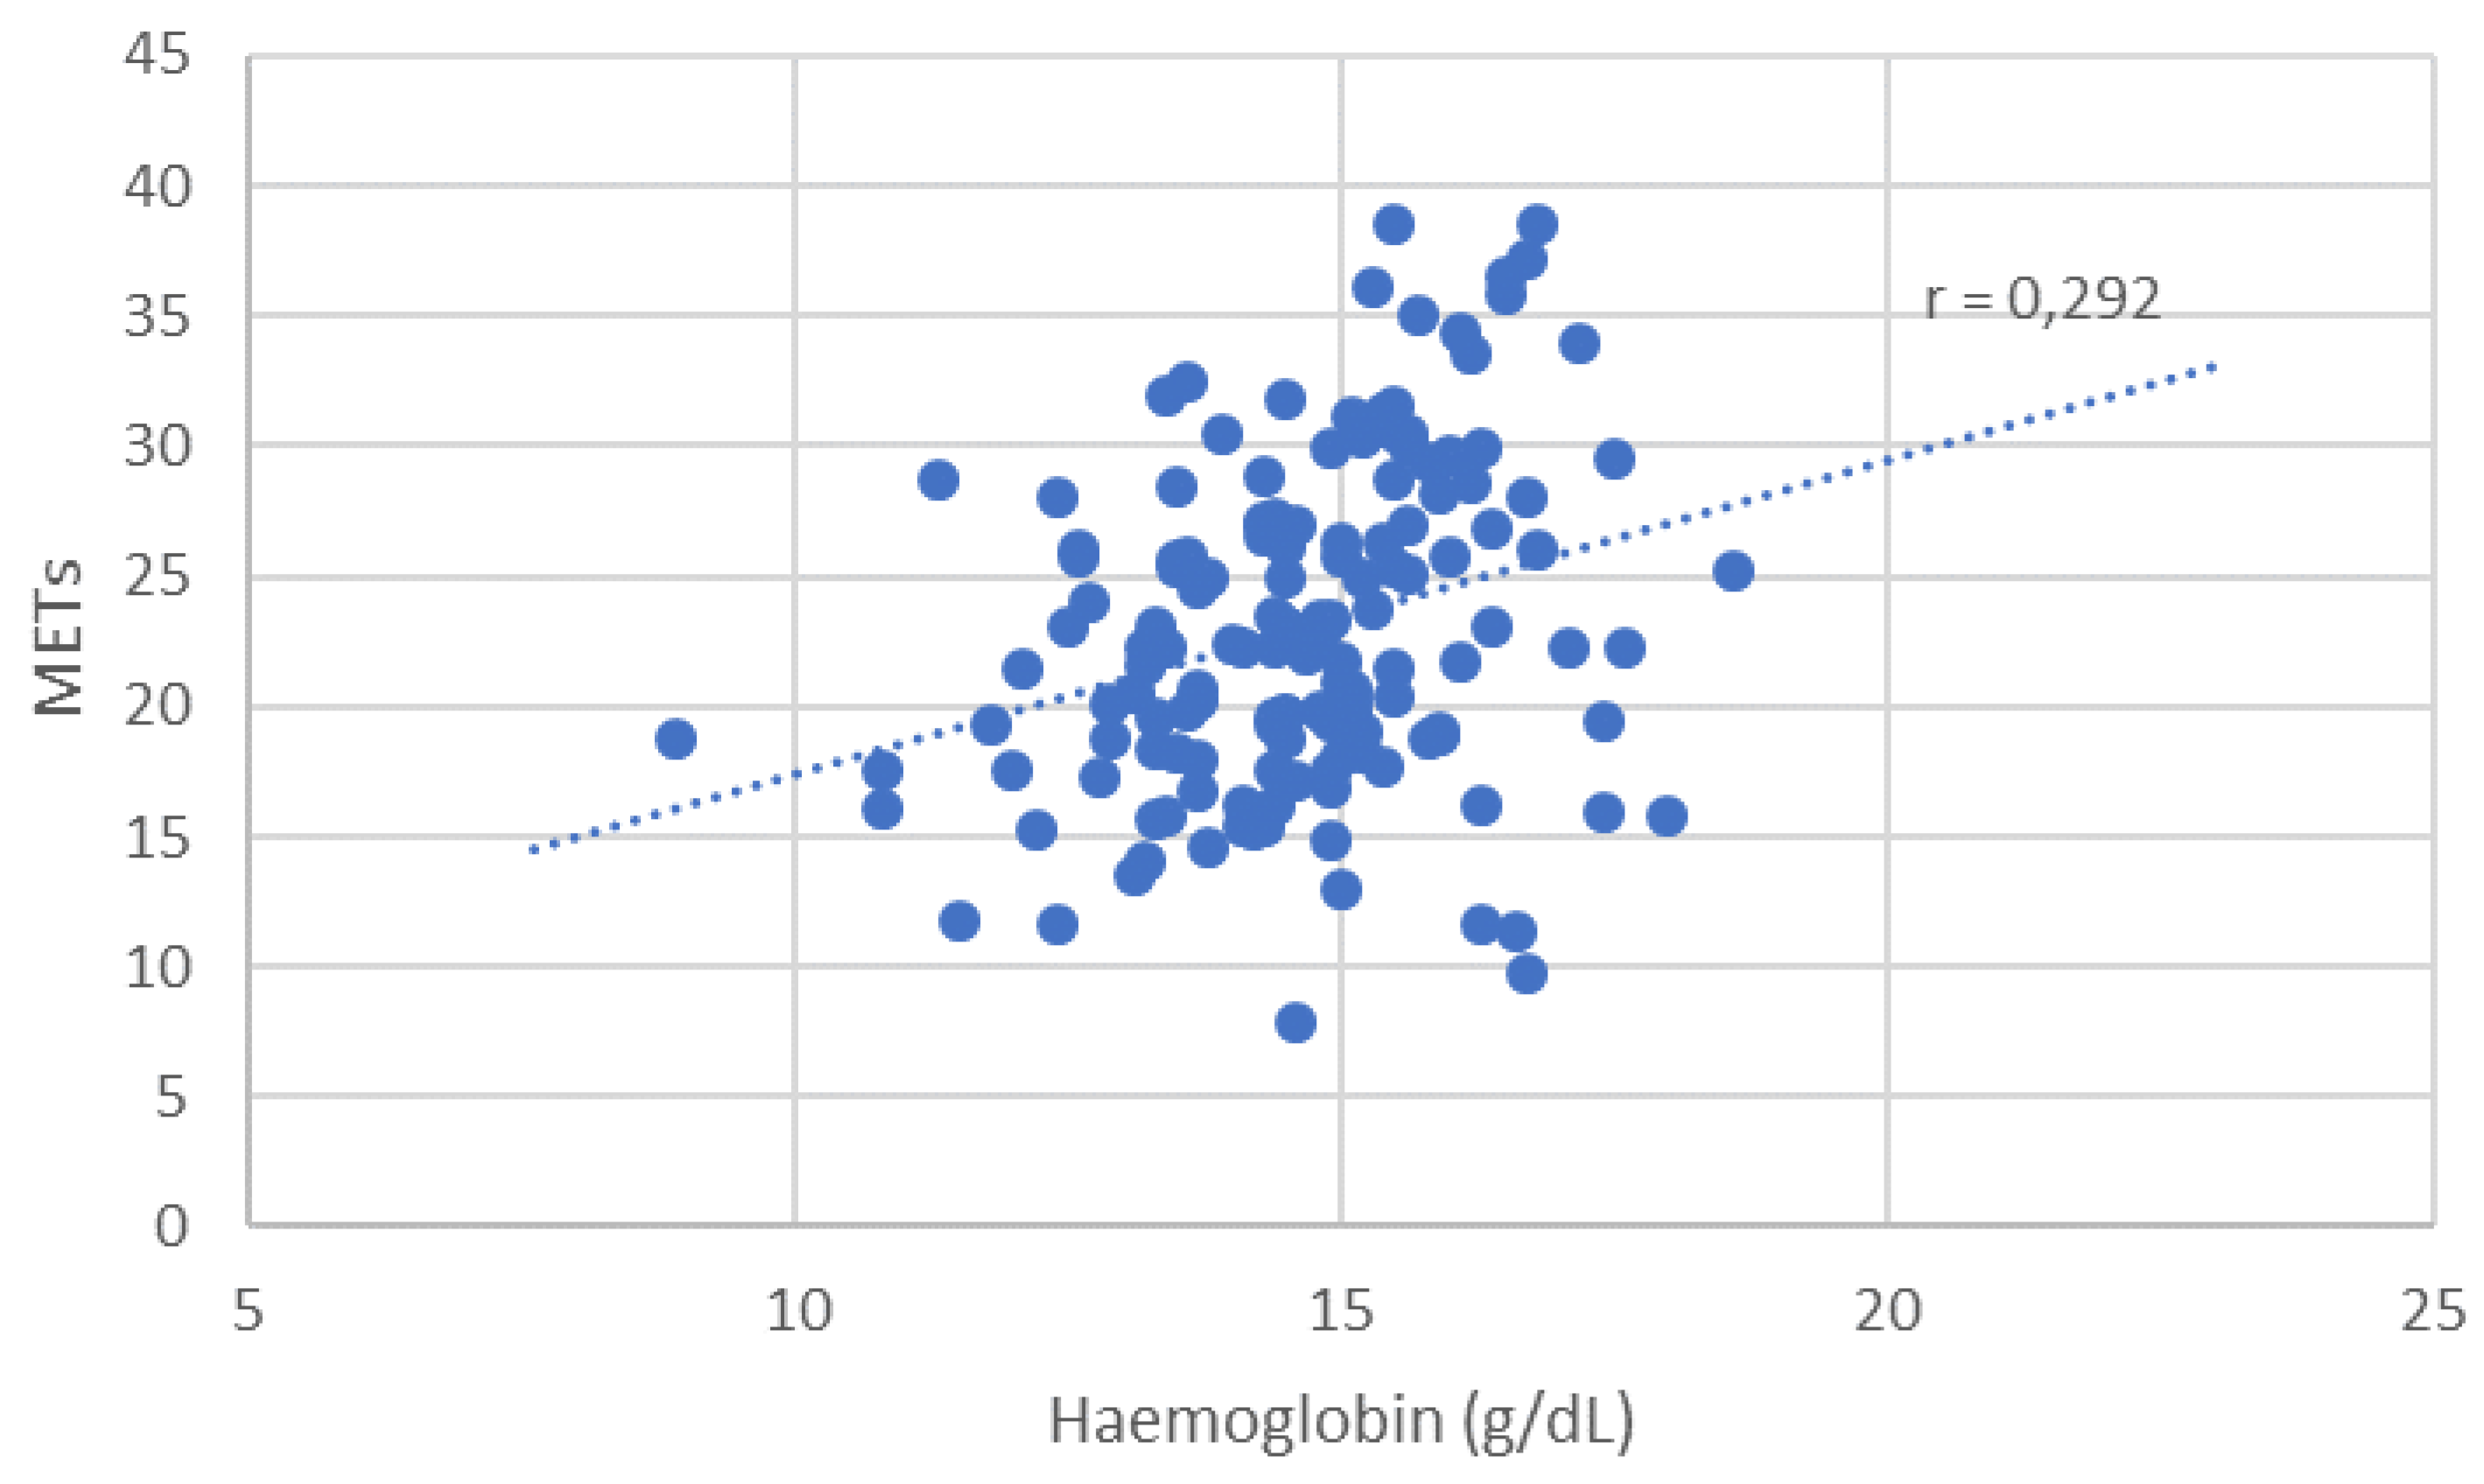
Figure B5.
Distribution of METs depending on haemoglobin level.
Most patients (83.5%) were classified as NYHA Class I, reporting no limitations in physical activity. Only 16.5% reported exercise intolerance (NYHA II–IV). The highest prevalence of NYHA class > I was observed in patients with complex congenital heart defects (26%), followed by shunt lesions (18%), right-sided defects (17%), and left-sided lesions (5%).
Symptomatically, 13.2% reported dyspnea, 6.5% dizziness, 4.2% chest pain, 2.9% headaches, and 2.6% fatigue.
Regarding systemic ventricular function, most patients had a normal ejection fraction (EF ≥ 55%). In 110 patients with available EF data, the mean EF was 59 ± 7% (range: 32–80%; median: 60%). Approximately 15% of the cohort had some degree of systolic dysfunction.
Sex-based differences were evident in exercise testing: males outperformed females in both spiroergometry (p < 0.001) and ergometry (p = 0.004).
In 154 patients undergoing CPET, VO₂ max ranged from 7.8 to 38.6 mL/min/kg (mean: 22.7 ± 6.4 mL/min/kg; median: 22.3 mL/min/kg). Patients with NYHA II–IV had significantly lower VO₂ max (16.7 ± 4.5 vs. 24.2 ± 6.0 mL/min/kg, p < 0.001).
In 97 patients who performed ergometry, METs ranged from 3.1 to 13.0 (mean: 7.7 ± 2.2, median: 7.8). NYHA II–IV patients achieved only 4.5 ± 0.6 METs, compared to 8.0 ± 2.0 METs in NYHA I patients (p < 0.001).
Seventeen patients completed a six-minute walk test (6MWT). Distances ranged from 123 to 538 meters (mean: 366 ± 113 m, median: 395 m). NYHA II–IV patients walked 359 m, while NYHA I patients walked 378 m—this difference was not statistically significant (p = 0.746). Seven of the 17 patients undergoing 6MWT had Eisenmenger syndrome.
Iron Deficiency (ID) and Associated Characteristics
Using the definition from Peyrin-Biroulet et al. (TSAT < 20%), patients with ID had lower body weight (70.5 ± 17.6 kg vs. 75.0 ± 16.8 kg, p = 0.011), were more often female (p < 0.001), and younger (p = 0.003). They also more frequently reported headaches (p = 0.021).
ID was associated with lower hemoglobin levels (14.1 ± 2.0 vs. 15.1 ± 1.8 g/dL, p < 0.001), higher prevalence of anemia (p = 0.014), and reduced mean corpuscular volume (86.3 ± 5.1 vs. 88.5 ± 5.1 fL, p < 0.001).
There were no significant associations between ID and METs (p = 0.364), 6MWT distance (p = 0.352), NYHA class (p = 0.544), NT-proBNP (p = 0.859), EF (p = 0.383), or clinical symptoms including angina (p = 0.762), dyspnea (p = 0.447), dizziness (p = 0.948), or fatigue (p = 0.697).
Eisenmenger syndrome was not significantly associated with ID (p = 0.725). No associations were observed between ID and ferritin (p = 0.329) or TSAT (p = 0.366) in Eisenmenger patients. However, these patients had significantly higher soluble transferrin receptor (sTfR) levels (p < 0.001).
Ferritin levels did not correlate with max. VO₂ (p = 0.572) or 6MWT distance (p = 0.440) but did correlate positively with METs in ergometry (r = 0.201, p = 0.048).
Anemia, Exercise Capacity, and Medication Use
Among the 13 anemic patients, trends toward increased dyspnea, elevated NT-proBNP, and higher NYHA class were noted, although these findings should be interpreted cautiously due to small sample size.
Anemic patients had significantly lower MCV (78.3 ± 11.2 vs. 88.2 ± 4.3 fL, p = 0.001), lower TSAT (16.2 ± 13.7% vs. 27.0 ± 11.8%, p = 0.003), and lower ferritin (102.7 ± 764.3 µg/L vs. 157.8 ± 154.7 µg/L, p = 0.030).
Anemia was significantly associated with chronic kidney disease (p = 0.022) and with the use of several cardiovascular medications:
- ACE inhibitors (p = 0.042)
- AT1 receptor antagonists (p = 0.012)
- Beta-blockers (p = 0.023)
- Diuretics (p = 0.006)
No significant associations were observed between anemia and age (p = 0.331), sex (p = 0.124), weight (p = 0.887), CHD lesion group (p = 0.428), or systemic ventricular EF (p = 0.864).
Apart from dyspnea, no other symptoms were significantly associated with anemia. No significant differences were seen in VO₂ max (p = 0.058) or METs (p = 0.110), although graphical comparison showed that anemic patients tended to perform worse. One outlier with excellent capacity was noted.
Patients with secondary erythrocytosis from Eisenmenger syndrome had poor functional status but were not classified as anemic. Excluding these individuals yielded a significant correlation between anemia and max. VO₂ (p = 0.041). Similarly, lower hemoglobin levels correlated significantly with reduced exercise capacity, both for max. VO₂ (r = 0.221, p = 0.006) and METs (r = 0.292, p = 0.004).
4. Discussion
This retrospective cohort study investigated the association between iron deficiency (ID), anemia, and exercise capacity in adults with congenital heart disease (ACHD). The primary objectives were to assess the prevalence of ID and anemia in this population and to evaluate their impact on physical performance.
The three key findings of this study are as follows:
1. Iron deficiency and anemia were prevalent in this ACHD cohort, affecting 59.0% (183/310) and 4.2% (13/310) of patients, respectively. A significant association was observed between iron deficiency and lower hemoglobin levels (13.7 ± 1.5 g/dL vs. 14.4 ± 1.4 g/dL in non-ID, p < 0.001), indicating a continuum from iron depletion to overt anemia.
2. Anemia in ACHD patients was significantly associated with reduced exercise capacity (peak VO₂: 19.8 ± 4.1 vs. 22.9 ± 6.3 mL/min/kg, p = 0.041), increased dyspnea (NYHA II–III: 69.2% vs. 33.1%, p = 0.011), and elevated NT-proBNP levels (median 538 ng/L vs. 215 ng/L, p = 0.028).
3. No significant association was found between anemia and demographic characteristics such as age (p = 0.389), sex (p = 0.668), or underlying congenital heart defect subtype (p = 0.955).
Patient collective
The sex distribution in our cohort (51.6% male) reflects patterns seen in other large ACHD registries. For example, the CONgenital CORvitia registry (CONCOR) in the Netherlands reported a 50.2% male distribution [12], while similar proportions were noted by Dimopoulos et al. (49.6% male) and Rodríguez-Hernández et al. (56% male) [2,3].
The mean patient age was 33 years, consistent with prior ACHD studies, where median ages typically ranged between 30 and 36.5 years. In contrast, heart failure cohorts from Jankowska et al. and van Haehling et al. featured older populations with mean ages of 55 and 69 years, respectively, and marked male predominance (88% and 75%) [4].
By exploring the relationship between anemia and functional capacity across ACHD patients, we aimed to identify clinically relevant correlations that may guide risk stratification and management strategies. These findings highlight an under-recognized but potentially modifiable comorbidity in this growing patient population.
Our results emphasize the importance of further prospective studies to better understand the pathophysiology, prognostic implications, and therapeutic potential of anemia and iron deficiency in ACHD. Addressing this knowledge gap may ultimately contribute to improved outcomes and personalized care for adults living with congenital heart disease.
Iron deficiency
According to the definition of iron deficiency (ID) in heart failure proposed by Anker et al. [1], 34% of male and 85% of female ACHD patients in our cohort met the criteria for ID. In contrast, the definition used by Peyrin-Biroulet et al. in their review on ACHD [10] differentiates between functional and absolute iron deficiency, yielding a different distribution: 17% of males and 43% of females were classified as iron deficient, corresponding to an overall prevalence of 29%.
Regardless of the diagnostic criteria used, a significantly higher proportion of female patients were affected by iron deficiency (ID) compared to males (p < 0.001). This finding aligns with prior expectations and may be partly explained by the relatively young age of the cohort, as women of reproductive age have increased iron requirements, particularly due to menstrual blood loss. Furthermore, patients with ID were significantly younger than those without (p = 0.003), supporting the hypothesis of menstruation-related iron depletion. A similar sex-based pattern was reported by Jankowska et al., who found that female sex was an independent predictor of ID, even among postmenopausal women [1].
As expected, ID was associated with impaired erythropoiesis in our cohort. Patients with ID had significantly lower hemoglobin concentrations (p < 0.001) and reduced mean corpuscular volume (MCV) (p < 0.001), consistent with impaired iron availability. In addition, the prevalence of anemia was significantly higher among patients with ID than in those without (p = 0.014).
According to the definition of iron deficiency proposed by Anker et al. [1], we did not observe a significant association between iron deficiency and NYHA functional class in our ACHD cohort (p = 0.390). This contrasts with earlier findings in chronic heart failure populations, where iron deficiency has been shown to correlate with symptom severity. The discrepancy may reflect differences in age, underlying pathophysiology, or disease perception in ACHD patients compared to older heart failure populations. No significant correlation was found between the type of congenital heart defect and the presence of iron deficiency, reinforcing the notion that ID is influenced more by systemic and demographic factors than by anatomical subtype.
To differentiate our findings from the study by Baumgartner et al. [1], several key distinctions should be emphasized. While their cohort comprised 538 ACHD patients, detailed information regarding age distribution and clinical complexity was not available. Therefore, direct comparisons are limited. Nonetheless, our focused assessment of anemia and iron deficiency may offer complementary insights into this subgroup. Importantly, our study specifically focuses on the interplay between anemia, iron deficiency, and objectively measured exercise capacity, offering granular insight into how hematologic disturbances affect functional outcomes in ACHD. This targeted investigation sets our study apart and provides a novel contribution to the field, beyond the broader scope of previous registry-based analyses.
Prevalence Comparisons
Anemia in Adults with Congenital Heart Disease:
Anemia was present in 4.2% of ACHD patients (8.0% of females, 2.5% of males), with microcytic morphology in 46% and normocytic in 54% of cases. Approximately two-thirds of anemic patients also had iron deficiency, suggesting ID as the predominant cause. A strong association between low MCV and anemia (p < 0.001) supports this link and aligns with findings from Rodríguez-Hernández et al. and Dimopoulos et al [1,2].
Anemic patients were more likely to exhibit NYHA functional class > I (p = 0.045), elevated NT-proBNP levels (651 ± 831 ng/L vs. 180 ± 353 ng/L, p = 0.010), reduced transferrin saturation (TSAT) (p = 0.003), and lower ferritin levels (p = 0.030) compared to non-anemic counterparts. Additionally, they had higher usage of ACE inhibitors, AT1 antagonists, and beta-blockers, suggesting that patients with greater clinical severity are more susceptible to anemia. Conversely, anemia itself may contribute to symptom burden, as evidenced by its association with dyspnea and reduced exercise capacity in this cohort.
Prevalence Comparisons
Functional Capacity in Adults with Congenital Heart Disease (ACHD):
While studies in chronic heart failure (HF) populations have demonstrated a significant association between iron deficiency (ID) and maximal oxygen consumption (VO₂ max) [1], no such correlation was observed in our ACHD cohort (p = 0.741). However, a modest but significant association was identified between serum ferritin levels and METs achieved during ergometry (r = 0.201, p = 0.048).
While no association with exercise metrics such as max VO₂ (p = 0.058) or METs in ergometry (p = 0.110) was initially found, a statistically significant relationship between anemia and max VO₂ emerged after exclusion of Eisenmenger patients.
A more robust and clinically relevant correlation was observed between hemoglobin (Hb) concentration and exercise performance. Hb levels showed a significant positive correlation with both VO₂ max (r = 0.221, p = 0.006) and METs achieved during ergometry (r = 0.292, p = 0.004), suggesting that even subclinical reductions in hemoglobin may impact functional capacity in ACHD patients. These results underline the physiological importance of hemoglobin in determining aerobic performance and support its potential role as a simple but powerful marker in clinical risk assessment.
As expected, NYHA functional class was strongly associated with exercise capacity. Patients with NYHA class > I had significantly reduced performance across all modalities (p < 0.001), with an average VO₂ max of 16.7 ± 4.5 mL/min·kg and METs of 4.5 ± 0.6, compared to 24.2 ± 6.0 mL/min·kg and 8.0 ± 2.0, respectively, in NYHA class I patients.
Finally, NT-proBNP levels correlated negatively with exercise capacity, confirming its value as a functional biomarker. This association was significant for both:
- Spiroergometry VO₂ max: r = –0.507, p < 0.001
- Ergometry METs: r = –0.341, p = 0.001
Comparison of Prevalence
Although routine iron status screening and intravenous iron supplementation are recommended in chronic HF management, our findings do not support direct extrapolation of these guidelines to the ACHD population. Instead, hemoglobin concentration and the presence of anemia—rather than isolated iron deficiency—may serve as more reliable indicators of impaired exercise capacity in ACHD.
These data highlight the importance of individualized management strategies in ACHD and caution against the blanket application of heart failure treatment protocols to this distinct population.
Limitations
A limitation of this study is its retrospective design, which precluded the possibility of post hoc data supplementation to improve completeness or consistency.
Moreover, this was a single-center study, which may affect generalizability. Future prospective, multicenter studies involving larger cohorts are needed to validate these findings and ensure broader applicability to the diverse ACHD population.
5. Conclusions
The prevalence of iron deficiency (59.0%) and anemia (4.2%) in adults with congenital heart disease (ACHD) was in line with prior reports. While no significant association was observed between ID and exercise capacity, reduced hemoglobin levels — particularly in anemic patients — were consistently associated with impaired functional performance when patients with Eisenmenger syndrome were excluded. In contrast, lower hemoglobin levels were significantly associated with impaired functional performance, suggesting that hemoglobin may be a more reliable marker of reduced exercise capacity than ID alone in this population.
These findings highlight the importance of systematic evaluation of iron status and hemoglobin concentration in ACHD patients, particularly in those reporting functional limitations. They also underscore the need for prospective studies to investigate whether iron supplementation or anemia-targeted therapies could improve exercise tolerance and clinical outcomes in this growing patient group.
Letter of Transmittal
1. All authors have participated in the work and have reviewed and agree with the content of the article.
2. None of the article contents are under consideration for publication in any other journal or have been published in any journal.
3. No portion of the text has been copied from other material in the literature (unless in quotation marks, with citation).
4. I am aware that it is the author's responsibility to obtain permission for any figures or tables reproduced from any prior publications, and to cover fully any costs involved. Such permission must be obtained prior to final acceptance.
5. I realize this is an open access journal that requires the payment of a fee on the part of the authors and/or their institution to cover publication costs.
Author Contributions
Made substantial contributions to conception and design of the study, data acquisition and analysis, data interpretation and drafting: R. Phinicarides, I.E. Reuter, G. Wolff, A. Karathanos, F. Pillekamp, H. Heidari, M. Masyuk, M. Kelm, T. Zeus, K. Klein.
Funding
This research received no external funding.
Institutional Review Board Statement
The study was approved by the local ethics committee (Heinrich-Heine University Düsseldorf, 2019-375-RetroDEuA, approved January 30, 2019) and performed in accordance with the Declaration of Helsinki. Informed consent to participate in the study was obtained from all participants.
Informed Consent Statement
Informed consent was obtained from all subjects involved in the study.
Data Availability Statement
All data are included in the manuscript.
Acknowledgments
During the preparation of this manuscript, the authors used IBM SPSS Statistics (Version 26) for statistical analysis. Metric, ordinal, and nominal variables were analyzed using appropriate statistical tests based on data distribution and scale. Continuous variables were summarized as mean ± standard deviation, while categorical data were reported as frequencies. Group comparisons were performed using t-tests, Mann–Whitney U tests, or ANOVA as appropriate, and categorical associations were assessed with chi-square or Fisher’s exact tests. Correlation analyses employed Pearson’s or Spearman’s methods. All statistical tests were two-tailed with a significance threshold of p < 0.05. The authors have reviewed and edited all outputs and take full responsibility for the content of this publication.
Conflicts of Interest
The authors declare no conflicts of interest.
Abbreviations
The following abbreviations are used in this manuscript:
| ACHD | Adults with Congenital Heart Disease |
| ACE | Angiotensin Converting Enzyme Inhibitor |
| APVC | Anomalous Pulmonary Venous Connection |
| AS | Aortic Valve Stenosis |
| ASD | Atrial Septal Defect |
| AT1 | Angiotensin II Type 1 Receptor Antagonist |
| AVSD | Atrioventricular Septal Defect |
| ccTGA | Congenitally Corrected Transposition of the Great Arteries |
| CHD | Congenital Heart Disease |
| CKD | Chronic Kidney Disease |
| CoA | Aortic Isthmus Stenosis |
| CPET | Cardiopulmonary Exercise Testing |
| CRP | C Reactive Protein |
| DCRV | Double Chambered Right Ventricle |
| DIV | Double Inlet Ventricle |
| DORV | Double Outlet Right Ventricle |
| EF | Ejection Fraction |
| eGFR | Estimated Glomerular Filtration Rate |
| ESC | European Society of Cardiology |
| Hb | Hemoglobin |
| HF | Heart Failure |
| HLHS | Hypoplastic Left Heart Syndrome |
| ID | Iron Deficiency |
| IDA | Iron Deficiency Anemia |
| INR | International Normalized Ratio |
| ISACHD | International Society for Adult Congenital Heart Disease |
| LDH | Lactate Dehydrogenase |
| MCV | Mean Corpuscular Volume |
| MCHC | Mean Corpuscular Hemoglobin Concentration |
| METs | Metabolic Equivalents |
| NSAID | Nonsteroidal Anti Inflammatory Drug |
| NTproBNP | N Terminal pro B Type Natriuretic Peptide |
| NYHA | New York Heart Association |
| PDA | Persistent Ductus Arteriosus |
| PA VSD | Pulmonary Atresia with or without Ventricular Septal Defect |
| PS | Pulmonary Valve Stenosis |
| sTfR | Soluble Transferrin Receptor |
| SpO2 | Peripheral Capillary Oxygen Saturation |
| Suprav AS | Supravalvular Aortic Stenosis |
| TAC | Truncus Arteriosus |
| TGA | Transposition of the Great Arteries |
| TOF | Tetralogy of Fallot |
| TrA | Tricuspid Atresia |
| TSAT | Transferrin Saturation |
| TSH | Thyroid Stimulating Hormone |
| VSD | Ventricular Septal Defect |
| 6MWT | Six Minute Walk Test |
Appendix A
Tables
Table A1.
baseline Demographics and clinical characteristics.
| Baseline characteristics | Men | Women | Total | |||
| N | N | N | ||||
| Age, y | 33 ± 11 | 160 | 33 ± 12 | 150 | 33 ± 12 | 310 |
| Height (cm) | 177 ± 8 | 159 | 165 ± 9 | 142 | 171 ± 11 | 301 |
| Weight (kg) | 81 ± 16 | 160 | 66 ± 14 | 140 | 74 ± 17 | 300 |
| BMI (kg/m2) | 25,8 ± 4,6 | 159 | 24,4 ± 5,0 | 141 | 25,1 ± 4,9 | 300 |
| Shunt lesions | - | 53 | - | 53 | - | 106 |
| Left-Sided Malformations | - | 63 | - | 58 | - | 121 |
| Right-sided Malformations | - | 66 | - | 88 | - | 154 |
| Complex Malformations | - | 81 | - | 63 | - | 144 |
Table A2.
Distribution of Congenital Heart Defects According to ESC Categories (N = 310).
| ESC Category | Diagnosis | Abbreviation | % | N |
| Shunt Lesions | Ventricular Septal Defect | VSD | 10.6 | 33 |
| Atrial Septal Defect | ASD | 10.3 | 32 | |
| Persistent Ductus Arteriosus | PDA | 7.4 | 23 | |
| Atrioventricular Septal Defect | AVSD | 7.4 | 23 | |
| Anomalous Pulmonary Venous Connection | APVC | 4.5 | 14 | |
| Subtotal | 40.2 | 125 | ||
| Left-sided Malformations | Aortic Isthmus Stenosis | CoA | 14.8 | 46 |
| Aortic Valve Stenosis | AS | 6.1 | 19 | |
| Supravalvular Aortic Stenosis | Suprav. AS | 0.3 | 1 | |
| Congenital Mitral Valve Defects | - | 2.3 | 7 | |
| Aortopathy | - | 4.5 | 14 | |
| Subtotal | 28.0 | 87 | ||
| Right-sided Malformations | Pulmonary Valve Stenosis | PS | 11.3 | 35 |
| Ebstein Anomaly | - | 2.6 | 8 | |
| Double-Chambered Right Ventricle | DCRV | 1.0 | 3 | |
| Coronary Anomalies | - | 1.3 | 4 | |
| Subtotal | 16.2 | 50 | ||
| Complex Malformations | Tetralogy of Fallot | TOF | 15.8 | 49 |
| Transposition of the Great Arteries | TGA | 10.0 | 31 | |
| Congenitally Corrected TGA | ccTGA | 1.9 | 6 | |
| Double Outlet Right Ventricle | DORV | 2.6 | 8 | |
| Truncus Arteriosus | TAC | 1.6 | 5 | |
| Hypoplastic Left Heart Syndrome | HLHS | 0.3 | 1 | |
| Pulmonary Atresia ± VSD | PA ± VSD | 1.6 | 5 | |
| Tricuspid Atresia | TrA | 1.9 | 6 | |
| Double Inlet Ventricle | DIV | 0.3 | 1 | |
| Subtotal | 36.0 | 112 |
For each patient, a single principal congenital heart defect was defined, based on the lesion most relevant to the patient’s clinical status and long-term prognosis. In cases with multiple anomalies, the dominant lesion—for example, Ebstein anomaly rather than secundum atrial septal defect (ASD)—was selected as the principal diagnosis. This classification approach was applied in Table 2 to avoid duplication and to reflect a clinically meaningful categorization.
Note: Frequencies may exceed 100% in descriptive analyses, as many patients had more than one congenital defect documented in the full dataset.
Table A3.
Comorbidities of patients.
| Comorbidity | Percentage (%) | Total | SL (%) | LF (%) | RF (%) | CF (%) | p-value |
| Arterial Hypertension | 18,1 | 56 | 14,7 | 28,6 | 15,5 | 13,5 | 0.334891 |
| Pulmonary Hypertension | 5,2 | 16 | 6,7 | - | 2,4 | 12,2 | 0.010101 |
| Chronic Kidney Insufficiency | 1,6 | 5 | 1,3 | 1,3 | 2,4 | 2,7 | 1.000000 |
| Diabetes Mellitus | 1,3 | 4 | 4,0 | - | - | 1,4 | 0.333333 |
| Trisomy 21 | 4,8 | 15 | 10,7 | - | 3,6 | 5,4 | 0.060606 |
| Bronchial Asthma | 5,5 | 17 | 4,0 | 9,1 | 3,6 | 5,4 | 0.151515 |
| Chronic Obstructive Pulmonary Disease | 1,0 | 3 | 2,7 | - | - | 1,4 | 1.000000 |
| Migraine | 6,1 | 19 | 6,7 | 11,7 | 2,4 | 4,1 | 0.242424 |
| Chronic Inflammatory Bowel Disease | 0,3 | 1 | - | - | 1,2 | - | 1.000000 |
| Celiac Disease | 0,3 | 1 | - | 1,3 | - | - | 1.000000 |
| Gastritis, Esophagitis, Enteritis | 0,6 | 2 | - | 1,3 | - | 1,4 | 1.000000 |
| Reflux | 0,3 | 1 | - | 1,3 | - | - | 1.000000 |
| Polymenorrhea | 1,0 | 3 | - | - | 3,6 | - | 1.000000 |
| Depression | 4,8 | 15 | 12,0 | 2,6 | 1,2 | 4,1 | 0.151515 |
Total percentage and number (N) of patients with the recorded comorbidities in a collective size of n=310. SL: Shunt lesions; LF: Left-Sided Malformations; RF: Right-sided Malformations; CF: Complex Malformations.
Table A4.
Medication of Patients.
| Medication | Percentage (%) | Total | SL (%) | LF (%) | RF (%) | CF (%) | p-value |
| Anticoagulant | 10,6 | 33 | 12,0 | 3,9 | 4,8 | 23,0 | 0.102 |
| Antiplatel Agent | 6,1 | 19 | 2,7 | 7,8 | 7,1 | 6,8 | 0.632 |
| Iron Supplement | 1,6 | 5 | 1,3 | - | 1,2 | 4,1 | 0.825 |
| ACE Inhibitor | 11,0 | 34 | 10,7 | 13,0 | 3,6 | 17,6 | 0.467 |
| AT1 Antagonist | 7,7 | 24 | 5,3 | 9,1 | 9,5 | 6,8 | 0.597 |
| Calcium Channel Blocker | 2,9 | 9 | 5,3 | 3,9 | 1,2 | 1,4 | 0.439 |
| Beta Blocker | 19,4 | 60 | 16,0 | 16,9 | 19,0 | 25,7 | 0.901 |
| Loop Diuretic | 5,2 | 16 | 4,0 | - | 6,0 | 10,8 | 0.762 |
| Thiazid Diuretic | 6,1 | 19 | 4,0 | 7,8 | 4,8 | 8,1 | 0.931 |
| Potassium-Sparing Diuretics | 2,9 | 9 | 1,3 | - | 2,4 | 8,1 | 0.448 |
| Proton Pump Inhibitor | 3,5 | 11 | 4,0 | 5,2 | 3,6 | 1,4 | 0.483 |
| Oral Contraceptive | 6,5 | 20 | 5,3 | 5,2 | 4,8 | 10,8 | 0.954 |
| NSAID | 1,3 | 4 | 1,3 | - | 3,6 | - | 0.852 |
Total percentage and number (N) of patients taking selected medications in a collective size of n=310. ACE, Angiotensin-converting enzyme; AT1, Angiotensin 1; NSAID, Nonsteroidal anti-inflammatory drug.
Table A5.
Laboratory values of the patient collective.
| Men | Women | Total | ||||
| N | N | N | ||||
| Leukocytes (Thous/µL) | 6,89 ± 1,89 | 160 | 7,25 ± 2,03 | 150 | 7,06 ± 1,96 | 310 |
| Erythrocytes (Mill/µL) | 5,26 ± 0,50 | 159 | 4,70 ± 0,51 | 150 | 4,98 ± 0,58 | 309 |
| Hemoglobin (g/dL) | 15,7 ± 1,5 | 160 | 13,8 ± 1,7 | 150 | 14,8 ± 1,9 | 310 |
| Hematocrit (%) | 46,1 ± 4,8 | 160 | 41,4 ± 4,6 | 150 | 43,8 ± 5,3 | 310 |
| MCV (fL) | 87,5 ± 4,7 | 160 | 88,2 ± 5,7 | 150 | 87,8 ± 5,2 | 310 |
| MCHC (g/dL) | 34,1 ± 1,1 | 160 | 33,2 ± 1,2 | 150 | 33,7 ± 1,2 | 310 |
| Platelets (Thous/µL) | 224 ± 50 | 160 | 255 ± 67 | 150 | 239 ± 60 | 310 |
| Ferritin (µg/L) | 209 ± 279 | 160 | 58 ± 51 | 150 | 136 ± 216 | 310 |
| TSAT (%) | 29,7 ± 11,6 | 160 | 23,2 ± 11,6 | 150 | 26,6 ± 12,0 | 310 |
| Transferrin (mg/dL) | 249 ± 34 | 160 | 288 ± 52 | 150 | 268 ± 48 | 310 |
| sTfR (mg/L) | 1,30 ± 0,77 | 144 | 1,37 ± 0,62 | 144 | 1,34 ± 0,70 | 288 |
| Iron (µg/dL) | 102 ± 35 | 160 | 91 ± 44 | 150 | 97 ± 40 | 310 |
| Troponin (ng/L) | 5,16 ± 6,43 | 159 | 2,01 ± 5,33 | 150 | 3,63 ± 6,12 | 309 |
| NTproBNP (ng/L) | 146 ± 214 | 160 | 256 ± 516 | 150 | 200 ± 394 | 310 |
| Bilirubin (mg/dL) | 0,72 ± 0,47 | 156 | 0,56 ± 0,41 | 146 | 0,64 ± 0,45 | 302 |
| CRP (mg/dL) | 0,25 ± 0,76 | 159 | 0,30 ± 0,59 | 150 | 0,27 ± 0,68 | 309 |
| LDH (U/L) | 206 ± 52 | 160 | 204 ± 62 | 150 | 205 ± 57 | 310 |
| Creatinine (mg/dL) | 0,98 ± 0,16 | 160 | 0,78 ± 0,17 | 150 | 0,88 ± 0,19 | 310 |
| eGFR (mL/min) | 102 ± 16 | 158 | 102 ± 19 | 150 | 102 ± 17 | 308 |
| TSH (mU/L) | 2,47 ± 2,48 | 158 | 1,99 ± 1,15 | 149 | 2,24 ± 1,96 | 307 |
| INR | 1,14 ± 0,36 | 159 | 1,21 ± 0,49 | 150 | 1,17 ± 0,43 | 309 |
The values are presented as mean (x̅) ± standard deviation (σ). As not all patients had complete laboratory datasets, the sample size (N) varies across variables. Abbreviations: MCV, mean corpuscular volume; MCHC, mean corpuscular hemoglobin concentration; TSAT, transferrin saturation; sTfR, soluble transferrin receptor; NT-proBNP, N-terminal pro B-type natriuretic peptide; CRP, C-reactive protein; LDH, lactate dehydrogenase; eGFR, estimated glomerular filtration rate; TSH, thyroid-stimulating hormone; INR, international normalized ratio.
Appendix B
Figures
Figure B1.
Categorization of Congenital Heart Disease in Cyanotic, acyanotic und non specified heart disease.
Figure B1.
Categorization of Congenital Heart Disease in Cyanotic, acyanotic und non specified heart disease.
Distribution of CHD phenotypes in the study population was as follows: cyanotic CHD: 34.1%, acyanotic CHD: 70.1%, and not classified: 17.2%. Patients were assigned to either the cyanotic or acyanotic group based on resting oxygen saturation (SpO₂), documented presence of right-to-left shunting, and prior clinical or diagnostic classification.
In cases of historical cyanosis with subsequent surgical repair or when documentation was incomplete or ambiguous, patients were categorized as ‘not classified’. Each patient was assigned to only one phenotype category to ensure non-overlapping group comparisons.
The cyanotic vs. acyanotic classification was determined using a combination of resting SpO₂, anatomical and physiological features, and clinical documentation. In cases of uncertainty—such as patients with normalized oxygen saturation following repair or insufficient historical records—classification was deferred to the ‘not classified’ category.
Figure B2.
Anemia in ACHD.
In our cohort of 310 ACHD patients, iron deficiency was more prevalent among those with anemia, as indicated by significantly lower transferrin saturation (TSAT) (16.2 ± 13.7% vs. 27.0 ± 11.8%, p = 0.003) and lower ferritin levels (102.7 ± 764.3 µg/L vs. 157.8 ± 154.7 µg/L, p = 0.030) compared to non-anemic patients.
Figure B3.
Distribution of maximal oxygen uptake per body weight depending on anemia.
This association was also evident with hemoglobin (Hb) concentration, which correlated significantly with reduced exercise capacity. Lower Hb levels were associated with both reduced peak VO₂ during spiroergometry (r = 0.221, p = 0.006) and lower METs during ergometry (r = 0.292, p = 0.004).
Figure B4.
Distribution of maximal oxygen uptake per body weight depending in hemoglobin level.
Scatter plot of VO₂ max vs. hemoglobin level in ACHD patients. Categories of CHD (e.g., shunt, complex, obstructive) are not differentiated visually due to high inter-group variability and confounding. All patients are included to show the overall correlation trend (r = 0.309, p < 0.001 after excluding Eisenmenger syndrome).
Figure B5.
Distribution of METs depending on haemoglobin level.
A scatter plot of METs versus hemoglobin level was generated; CHD anatomical categories were not visualized to avoid misinterpretation due to underlying pathophysiologic heterogeneity.
References
- Van Der Linde, D., et al., Birth prevalence of congenital heart disease worldwide: a systematic review and meta-analysis. Journal of the American College of Cardiology, 2011. 58(21): p. 2241-2247.
- Liu, Y.; Chen, S.; Zühlke, L.; Black, G.C.; Choy, M.-K.; Li, N.; Keavney, B.D. Global birth prevalence of congenital heart defects 1970–2017: updated systematic review and meta-analysis of 260 studies. Int J Epidemiol. 2019, 48, 455–463.
- Lytzen, R.; Vejlstrup, N.; Bjerre, J.; Petersen, O.B.; Leenskjold, S.; Dodd, J.K.; Jørgensen, F.S.; Søndergaard, L. Live-Born Major Congenital Heart Disease in Denmark. JAMA Cardiol. 2018, 3, 829–837. [CrossRef]
- Moons, P.; Bovijn, L.; Budts, W.; Belmans, A.; Gewillig, M. Temporal Trends in Survival to Adulthood Among Patients Born With Congenital Heart Disease From 1970 to 1992 in Belgium. Circulation 2010, 122, 2264–2272. [CrossRef]
- Marelli, A.J.; Ionescu-Ittu, R.; Mackie, A.S.; Guo, L.; Dendukuri, N.; Kaouache, M. Lifetime Prevalence of Congenital Heart Disease in the General Population From 2000 to 2010. Circulation 2014, 130, 749–756. [CrossRef]
- Karathanos, A.; Simon, I.; Brockmeyer, M.; Lin, Y.; Parco, C.; Krieger, T.; Schulze, V.; Hellhammer, K.; Kelm, M.; Zeus, T.; et al. Iron status, anemia and functional capacity in adults with congenital heart disease: a single center analysis. Eur. Hear. J. 2020, 41. [CrossRef]
- Baumgartner, H., et al., 2020 ESC Guidelines for the management of adult congenital heart disease: The Task Force for the management of adult congenital heart disease of the European Society of Cardiology (ESC). Endorsed by: Association for European Paediatric and Congenital Cardiology (AEPC), International Society for Adult Congenital Heart Disease (ISACHD). European Heart Journal, 2020. 42(6): p. 563-645.
- Abraham, D.; Baral, R.; Bingham, R.; Head, C.; Lewis, C.; Freeman, L.J. 74 Multisystem manifestations of cyanotic adult congenital heart disease: review of prevalence and current practice on the norpap database. Heart 2017, 103, A55–A56. [CrossRef]
- Hoppe, U.C., et al., [Guidelines for therapy of chronic heart failure]. Z Kardiol, 2005. 94(8): p. 488-509.
- McDonagh, T.A., et al., 2021 ESC Guidelines for the diagnosis and treatment of acute and chronic heart failure. Eur Heart J, 2021. 42(36): p. 3599-3726.
- Peyrin-Biroulet, L.; Williet, N.; Cacoub, P. Guidelines on the diagnosis and treatment of iron deficiency across indications: a systematic review. Am. J. Clin. Nutr. 2015, 102, 1585–1594. [CrossRef]
- Anker, S.D.; Comin Colet, J.; Filippatos, G.; Willenheimer, R.; Dickstein, K.; Drexler, H.; Lüscher, T.F.; Bart, B.; Banasiak, W.; Niegowska, J.; et al. Ferric Carboxymaltose in Patients with Heart Failure and Iron Deficiency. N. Engl. J. Med. 2009, 361, 2436–2448. [CrossRef]
- Dimopoulos, K.; Diller, G.-P.; Giannakoulas, G.; Petraco, R.; Chamaidi, A.; Karaoli, E.; Mullen, M.; Swan, L.; Piepoli, M.F.; Poole-Wilson, P.A.; et al. Anemia in Adults With Congenital Heart Disease Relates to Adverse Outcome. Circ. 2009, 54, 2093–2100. [CrossRef]
- Rodríguez-Hernández, J.L.; Rodríguez-González, F.; Martínez-Quintana, E. Anemia in Adolescents and Young Adult Patients With Congenital Heart Disease. J. Pediatr. Hematol. 2018, 40, 620–624. [CrossRef]
- von Haehling, S., et al., Prevalence and clinical impact of iron deficiency and anaemia among outpatients with chronic heart failure: The PrEP Registry. Clin Res Cardiol, 2017. 106(6): p. 436-443.
- Jankowska, E.A.; Rozentryt, P.; Witkowska, A.; Nowak, J.; Hartmann, O.; Ponikowska, B.; Borodulin-Nadzieja, L.; Banasiak, W.; Polonski, L.; Filippatos, G.; et al. Iron deficiency: an ominous sign in patients with systolic chronic heart failure. Eur. Hear. J. 2010, 31, 1872–1880. [CrossRef]
- Diller, G.P., et al., Exercise intolerance in adult congenital heart disease: comparative severity, correlates, and prognostic implication. Circulation, 2005. 112(6): p. 828-35.
- Ebner, N.; Jankowska, E.A.; Ponikowski, P.; Lainscak, M.; Elsner, S.; Sliziuk, V.; Steinbeck, L.; Kube, J.; Bekfani, T.; Scherbakov, N.; et al. The impact of iron deficiency and anaemia on exercise capacity and outcomes in patients with chronic heart failure. Results from the Studies Investigating Co-morbidities Aggravating Heart Failure. Int. J. Cardiol. 2016, 205, 6–12. [CrossRef]
- Jankowska, E.A.; von Haehling, S.; Anker, S.D.; Macdougall, I.C.; Ponikowski, P. Iron deficiency and heart failure: diagnostic dilemmas and therapeutic perspectives. Eur. Hear. J. 2012, 34, 816–829. [CrossRef]
Disclaimer/Publisher’s Note: The statements, opinions and data contained in all publications are solely those of the individual author(s) and contributor(s) and not of MDPI and/or the editor(s). MDPI and/or the editor(s) disclaim responsibility for any injury to people or property resulting from any ideas, methods, instructions or products referred to in the content. |
© 2025 by the authors. Licensee MDPI, Basel, Switzerland. This article is an open access article distributed under the terms and conditions of the Creative Commons Attribution (CC BY) license (http://creativecommons.org/licenses/by/4.0/).
Copyright: This open access article is published under a Creative Commons CC BY 4.0 license, which permit the free download, distribution, and reuse, provided that the author and preprint are cited in any reuse.


