
Submitted:
18 May 2025
Posted:
19 May 2025
You are already at the latest version
Abstract
To improve quality of life globally and ensure sustainable transportation, increasing pedestrian and bicycle use is essential. While many studies address the physical and environmental aspects of sustainable transportation, the social dimension—especially in bicycle use—is often overlooked. Without considering this, planning efforts may fail to boost bicycle adoption. University students' awareness of sustainable transportation plays a key role in sustainable urban development. This study aims to examine how students' awareness affects the development of sustainable transportation.
Amasya University was selected to assess the awareness levels of undergraduate students from various academic levels. Attitude analysis was used to explore social structure differences such as education, income, cultural values, and habits to enhance awareness. Field observations and surveys were conducted to measure awareness regarding the social aspects of sustainable transportation.
Both measurable and non-measurable factors related to social sustainability were evaluated, employing a mixed-methods approach. This study is significant for offering solutions to raise awareness among university students, thereby supporting sustainable transportation and urban development.
Keywords:
Sustainable Transportation Planning
; Social Sustainability
; Bicycle Transport
; Level of Awareness
; Attitude Analysis
; Amasya
1. Introduction
Transportation systems constitute one of the most important means of meeting the urban needs of people from the past to the present [1]. Vuchic (1981) describes transportation as “one of the main forces in the formation, shaping and development of human settlements, which are the product of complex connections in the historical process” [2].
With the increasing population in cities and the growth of the boundaries of cities, the increasing demand for access to urban functions causes the demands of individuals to be met within the scope of sustainability and the issue of sustainable transportation to come to the agenda [3,4,5,6]. Black (2003) defines sustainable transportation as “meeting today's transportation and mobility needs while ensuring that future generations are met without compromising these opportunities” [7]. In the declaration presented by the OECD at the Vancouver Conference, sustainable transportation is defined as “a type of transportation that does not endanger the health of individuals in society and ecosystems, uses renewable energy resources that provide people's mobility needs to a lesser extent than their renewal percentage, and uses non-renewable energy resources to a lesser extent than the rate of development of renewable resources that are replaced” [8]. The World Bank has addressed sustainable transportation under three main headings: economic, environmental and social sustainability, as shown in Figure 1.1. In addition, at the OECD Vancouver Conference in Canada in 1996, the sub-targets of the components determined to have a sustainable transportation structure were determined (Figure 1.1) [9].
Economic, environmental and social dimensions should be considered as a whole when discussing sustainable transportation. Increasing the quality of urban life and sustainable development are the basis of the three components of sustainable transportation [2,11].
In order to increase the quality of life in our cities on a global scale and to ensure sustainable transportation, the use of non-motorized transportation vehicles in transportation should be increased [12,13,14].
The social dimension of sustainability, which is one of the driving forces in achieving sustainable urban development, envisages the development of public transportation systems and non-motorized transportation modes (pedestrian and bicycle) in order to reduce the use of private vehicles in travel habits by giving priority to people [15,16,17,18]. In this direction, the main objective in sustainable transportation planning is to make distances easily accessible through various transportation options, especially non-motorized forms of transportation (pedestrian, bicycle) and public transportation options [6,19,20,21].
In this context; bicycle is one of the most effective modes of transportation in providing sustainable transportation. The bicycle, which does not use any fuel and engine, does not have a negative impact on the environment and is considered as one of the sustainable transportation modes since it does not create noise and air pollution [22,23]. Although many infrastructure investments have been made for bicycle transportation in our cities in order to ensure sustainable transportation, the lack of increase in bicycle use requires that bicycle transportation should be addressed with the social dimension of sustainability [24]. Since the preference of bicycle transportation is related to the social structure of societies, bicycle transportation should be examined in the context of social sustainability principles in order to ensure sustainable transportation in cities [25,26,27].
Therefore, the aim of the study is to reveal the effects of the awareness levels of students studying at universities on the development of sustainable transportation.
1.1. The Effect of Vocational Education on the Level of Awareness in the Development of Sustainable Transportation
One of the most important points of a quality life is for the individual to understand his/her expectations from life, to discover how he/she can realize himself/herself, to be aware of his/her competencies and skills, and to be aware of how he/she can manage them [28]. This process is to open the doors to the level of consciousness, that is, social awareness. The level of consciousness refers to the reactions that a person gives carefully and clearly in the events they encounter in their current life [29]. This level is shaped by the family, school, etc. education received from past to present.
In the study examining the effects of the level of consciousness on sustainable transportation, the issue addressed constitutes an important focus in the sense that users can recognize themselves and express what kind of living space and transportation preferences they need through emotions [30]. In this way, users express what kind of transportation system they want to provide transportation in their life process, their goals and objectives with the trainings and experiences they have received. One of the areas where individuals show their social awareness in the best way is the sustainable transportation system. The choices made within the sustainable transportation system are realized with the education and experience of individuals towards this system.
Vocational education as well as family education is important in shaping the behaviors and attitudes of individuals who live their lives with the awareness of being a useful person to the society [31]. Attitude is “a state of emotional and mental readiness that is formed as a result of experiences and experiences and has a directive or dynamic influencing power on the behavior of the individual towards all objects and situations to which it is related” [28].
As a result of the researches, universities should keep up with the developments in technology and science in the developing and growing modern world of that society, give direction to the society and educate future generations as people of science and culture who catch up with the age in this changing conjuncture, who look from the same perspective [32]. Therefore, in this process, the place and importance of universities, which seek the truth in education, produce science and inject it into society, among social institutions can be clearly seen. For this reason; it is seen that university students, especially in cities with low population, shape both the social structure, economic structure and built environment of the city [33]. Today, while the positive and negative aspects of campus areas located in different parts of cities are discussed in many areas, the most important point that should not be forgotten is that the level of awareness gained by students studying in campus areas, which have the characteristics of a small city, against sustainable transportation constitutes the most important step of social development and sustainable urban development [34].
While universities set an example in the social and cultural structure of the society with the individuals they educate, they constitute a living laboratory model with their constructive and practical teaching style in the education system. They have the duty to raise a society that develops itself by following the industrial and technological developments of the time, leads the society by using new and modern practices and systems in the field of sustainability in its units, is sensitive to the environment and reduces environmental pollution and is aware of sustainability [35].
Universities have duties such as research, development, access to knowledge and dissemination of this knowledge and experience to the society and setting an example to the society [36,37]. Therefore, the application of sustainability criteria in university campus life causes the university to gain value in terms of social culture and to provide future-oriented investments with great returns in terms of economic and environmental development [38].
Especially university students play a major role in changing the traditional habits of the society and increasing the level of awareness towards sustainable transportation. For this reason, the study seeks to answer the questions of to what extent the vocational education of university students affects their level of awareness on the development of sustainable transportation, their level of satisfaction with the transportation facilities offered by their city, and what their expectations are.
2. Purpose and Methodology of the Study
Students studying at different faculties of universities may change their preferences in the choice of transportation mode and their attitudes towards sustainable transportation with the education and experiences they receive. Bicycle transportation, which is one of the driving forces in providing a sustainable transportation system, is influenced by social factors such as the education, awareness level and sense of responsibility towards the society [39]. In particular, many factors such as equality, accessibility, integrated planning, individual responsibility, health and safety, cultural values and habits, cultural values and habits, which are among the social dimension indicators of sustainable transportation, can be effective in developing the level of awareness towards bicycle use and preferring bicycle transportation.
For this reason, the aim of the study is to examine the level of awareness of university students from different cities, who come from different cities and different professions, towards sustainable transportation and to reveal to what extent the vocational education received contributes to the development of the level of awareness towards bicycle transportation. In this context, the level of awareness of university students towards sustainable transportation was examined. In the study; it is aimed to plan the bicycle within the scope of social dimension indicators of sustainable transportation in order to ensure livable, healthy and sustainable urban development and to put forward suggestions for increasing bicycle use by improving the level of awareness in bicycle use.
In evaluating the level of awareness of university students towards sustainable transportation and bicycle transportation, measurable, concrete indicators as well as intangible values that cannot be measured but can be perceived should be considered. Therefore, this research is also important in terms of ensuring sustainable urban development by improving the awareness levels of university students towards bicycle transportation.
The main source of information of this study is based on the literature research on the relationship between university education level and the level of awareness of sustainable transportation in achieving sustainable urban development and the data obtained from the analysis of the sample area.
In the study, Amasya University Faculties of Education, Architecture, Engineering and Theology in the city of Amasya were selected as the sample area. In sample area selection;
- The fact that the number of students studying at the Faculty of Education of Amasya University (1845 people) is close to the total number of students in the Faculties of Architecture (409 people), Engineering (411 people) and Theology (412 people), therefore; it is possible to ensure homogeneous distribution among students in the survey application,
- The fact that the Faculty of Education is located close to the city center and that the faculty is located outside the main campus of Amasya University, thus enabling the students studying in faculties located in different areas of the city to determine the level of awareness of sustainable transportation (Figure 2.1).
The study focuses on increasing bicycle use by improving the level of awareness, which is one of the social dimension indicators of sustainable transportation in ensuring urban development. In the study; attitude analysis was used to obtain information about the attitudes and behaviors of individuals, to predict and control behaviors. Attitude analysis can provide information about individuals' attitudes and behaviors, predict and control behaviors. Scaling of attitudes and behaviors is quite difficult since individuals generally do not give clear/accurate answers to questions about their behaviors and attitudes. Therefore, attitude analysis is important in terms of quantifying non-numerical data in social structure [40].
Since cycling trips evolve in line with the desires of users and cycling is a flexible mode of transportation, it contains relative data. Therefore, the study is based on a mixed methodology combining qualitative and quantitative methods.
It is impossible in terms of time, money and labor to make an application by addressing the whole mass in order to examine the level of awareness towards sustainable transportation. For this reason, it was deemed appropriate to select a sample that can symbolize the mass from the mass. In the study, first of all, the sample size was determined and then, in order to determine the level of awareness of university students in the sample area against sustainable transportation, the grouped stratified sample selection method, which is important in terms of representing the general structure of university students, was used.
As shown in Figure 2.2, the sampling method in which each unit of the population belongs to only one stratum and is divided into subgroups in such a way that the intra-stratum variation is as small as possible and the inter-stratum variation is as large as possible so that no mass unit is left uncovered, and the sample is drawn from each stratum separately and independently of each other is called stratified sampling [41].
In analyzes related to social structure, it is appropriate to select a sample that expresses the entire population. For this reason, the confidence level was taken as 95% and the tolerance amount as 0.05 in determining the sample size [42]. Therefore, the number of students studying at Amasya University, Education, Engineering, Architecture and Theology faculties was accepted as 3,000 and it was decided to apply the questionnaire to 300 people.
The main purpose of the survey research was to determine the effectiveness of the vocational education received by the students studying at Amasya University on the level of awareness of bicycle use. In this context, it was tried to determine the social influences and awareness levels of the surveyed university students that affect whether they use bicycles in urban transportation or not. For this reason, in order to obtain homogeneous data in the survey study, a total of 300 questionnaires were distributed homogeneously to bicycle users and non-users. The number of questionnaires to be applied to the strata was distributed proportionally to the stratum sizes. The number of students studying at the faculties of Education, Engineering, Architecture and Theology at Amasya University was taken into account in the stratum sizes (Table 2.1).
Table 2.2 shows the number of questionnaires applied according to the groups of the selected strata in Amasya University. Random sample selection method was used in the surveys to be conducted in each group.
In general, social sustainability principles (equality, accessibility, health and safety, integrated planning, individual responsibility, cultural values and habits) were taken into consideration in the preparation of the questions of the questionnaire form in order to determine the effects of awareness level on cycling. In this context, the study was guided by;
- Fundamental problem:
What is the effect of the level of education of university students on their level of awareness towards the development of bicycle transportation?
- Auxiliary problems:
- ∘
- Do socio-economic and demographic characteristics such as gender, income status have an effect on the level of awareness towards bicycle transportation?
- ∘
- Do the location choices of faculties have an effect on bicycle transportation?
- ∘
- Does the existence of bicycle roads have an effect on bicycle transportation?
- ∘
- Does the existence of an awareness level regarding social health have an effect on bicycle transportation?
- ∘
- Does the existence of transfer opportunities by bicycle have an effect on bicycle transportation?
- ∘
- Does the knowledge that bicycle transportation has positive contributions to the country's economy have an effect on bicycle use?
- ∘
- Do safety concerns have an effect on bicycle transportation?
- ∘
- Does the purpose of travel have an effect on bicycle transportation?
The questionnaire was evaluated by applying it to the selected masses and strata. SPSS 22.0 program frequency analysis and chi-square test were used in the evaluation of the questionnaires and the reliability rate was accepted as 0.05. In the study, the chi-square test was preferred because (a) it is based on whether the difference between observed frequencies and expected frequencies is statistically significant and (b) it is used to test two independent qualitative criteria.
3. Research Findings
In this study, the city of Amasya was selected as the sample area. The topographical features of Amasya have determined and limited the city's expansion over the centuries. Amasya province is located in the south of the Canik Mountains in the central part of Northern Anatolia, between (34° 57' 06“ - 36° 31' 53”) Eastern Longitude and (41° 04' 54“ - 40° 16' 16”) Northern Latitude [43].
Within this region, Amasya province is located west of the confluence of the Yeşilırmak/Iris and the Tersakan river that irrigates the Merzifon plain. Amasya is a city on the Black Sea border, surrounded by Samsun, Tokat, Çorum and Yozgat (Figure 3.1) [44].
According to 2024 data, it is known that university students in cities with a small population (342,378 people) such as Amasya shape both the social structure, economic structure and built environment of the city [45, 46]. As seen in Figure 3.2, it is understood that bicycle use in the city of Amasya is limited to the riverside and does not address the city in general.
3.1. Observations Made in the Field
According to the findings obtained from the observations made in the area, it is seen that bicycle lanes are mostly located along the riverside. It was also observed that the bicycle cannot serve the entire city because it is not integrated with other modes of transportation. The spatial relationship of the bicycle paths planned only by the river with the faculties of education, architecture, engineering and theology could not be established. As a result of the observations made, it was determined that bicycle parking spaces are only available in a certain area and are insufficient in the city (Figure 3.3 and Figure 3.4).
In addition, it was determined that the existing bicycle lanes do not provide pedestrian-bicycle circulation due to their lack of continuity (Figure 3.5), and that many bicycle lanes do not have any color, pavement, etc. to distinguish them from the vehicular road (Figure 3.6).
3.2. Survey Findings
The main purpose of this part of the study is to reveal the effects of the social dimension principles of sustainable transportation on cycling. In this context, the factors in the social dimension that affect the preference of the surveyed people for cycling in urban transportation and their degree of influence were observed.
Regarding the general demographic characteristics of the respondents, 63.4% of the respondents were women and 36.6% were men (Table 3.1).
When the private vehicle status of the surveyed students was analyzed, it was observed that 91.6% of them did not own a private vehicle (Table 3.2).
In the survey, Turkish Statistical Institute (TurkStat) data were taken into consideration in the income grouping. It is seen that 33,4% of the students participating in the survey are in the medium income group, 28,3% in the medium-low income group (17.00.-25.000 TL) and 33,4% in the medium-high income group (33.001-41.000 TL). While the percentage of students with low income is 6.6%, the percentage of students with high income is 8.3%.
- Evaluation of the social dimension of sustainable transportation according to the equality parameter
In the comparative analysis carried out to determine the effects of gender status on cycling, it was seen that gender status and cycling status were related (p=0.001). As seen in Table 3.3, 40.0% of the bicycle users are male and 60.0% are female (Table 3.4).
In the comparative analysis between income status and bicycle use, there is a significant relationship since p= 0.000. As a result of the findings obtained to determine the effects of income status on bicycle use; it was seen that 6.6% of the bicycle users had an income less than minimum wage, 28.3% had an income of 17,000-25,000 TL, 33.4% had an income of 25,000-33,000 TL, 23.4% had an income of 33,001-41,000 TL and 8.3% had an income of 41,000 TL and above (Table 3.5).
- Evaluation of the social dimension of sustainable transportation according to the accessibility parameter
In the comparative analysis of the distance of bicycle use and the faculty of education, a significant relationship emerges as p=0.001. It is seen that 44.6% of the students who use bicycles have a travel distance of less than 3 km, 28.0% of them have a travel distance of 3.01-6 km, 16.0% of them have a travel distance of 6.01-9 km, 8% of them have a travel distance of 9.01-12 km and 3.3% of them have a travel distance of more than 12 km. Since cycling relies on physical strength, it is seen that cycling is less preferred for long distances (Table 3.6).
In the comparative analysis of the level of participation in the problems related to accessibility in bicycle trips, it is seen that 65% of the bicycle users in the Faculty of Architecture and Engineering agree with the problem of the lack of bicycle paths accessing the center, while this rate is 50% among the students in the Faculty of Education and 56.4% among the students in the Faculty of Theology (Table 3.7). However, in the comparative analysis of the participation in the problems related to accessibility in the journeys made by bicycle (lack of bicycle roads / lanes, lack of continuity of the existing roads, distance to the destination) and the faculties of education, no significant relationship was found since p>0.05 and was not evaluated.
In the comparative analysis conducted to determine the participation status of the subjects who do not use bicycles due to accessibility problems; 51.1% of the subjects studying at the Faculty of Education, 53.3% of the subjects studying at the Faculty of Architecture, 60.0% of the subjects studying at the Faculty of Engineering, and 28% of the subjects studying at the Faculty of Theology did not use bicycles due to the long travel distances (Table 3.8).
It was determined that 36.7% of the subjects studying at the Faculty of Education, 66.6% of the subjects studying at the Faculty of Architecture, 30.0% of the subjects studying at the Faculty of Engineering, and 20% of the subjects studying at the Faculty of Theology did not use bicycles due to the lack of bicycle paths and lanes and the lack of continuity of the existing roads (Table 3.7).
It was determined that 38.9% of the respondents from the Faculty of Education, 60% of the respondents from the Faculty of Architecture, 35.0% of the respondents from the Faculty of Engineering, and 20% of the respondents from the Faculty of Theology did not use bicycles due to the lack of a bicycle path providing access to the center (Table 3.8).
- Evaluation of the social dimension of sustainable transportation according to the health and safety parameter
In the evaluation of the analysis made to determine the effects of the health and safety parameter related to the social dimension of sustainable transportation on the use of bicycles; it is seen that 77.3% of the subjects prefer bicycle transportation because it provides the opportunity to do sports (Table 3.9). Therefore, it has been determined that the level of awareness of bicycle users towards their personal health is high.
In the comparative analysis conducted to determine the participation of bicycle users in health and safety problems, a significant relationship was found and taken into consideration (p=0.000). It is seen that 37.7% of those studying at the Faculty of Education, 72.0% of those studying at the Faculty of Architecture, 13.0% of those studying at the Faculty of Engineering, and 53.3% of those studying at the Faculty of Theology have problems with pedestrians using the bicycle path (Table 3.10).
A significant relationship was found in the comparative analysis of the participation status of the subjects who use bicycles to the problems they experience (p=0.000); 45.5% of those studying at the Faculty of Education, 72.0% of those studying at the Faculty of Architecture, 55.0% of those studying at the Faculty of Engineering, and 60.0% of those studying at the Faculty of Theology had problems due to the negative attitudes of pedestrians towards cyclists (Table 3.10).
In the comparative analysis for the evaluation of the effects of negative behaviors of vehicle drivers on bicycle use, a significant relationship was found (p=0.000) and it was determined that 38.8% of those studying at the Faculty of Education, 64.0% of those studying at the Faculty of Architecture, 62.4% of those studying at the Faculty of Engineering, and 75.0% of those studying at the Faculty of Theology had problems (Table 3.10).
- Evaluation of the social dimension of sustainable transportation according to the integrated planning parameter
In the evaluation of the findings obtained for determining the integration between transportation modes in line with integrated planning principles; it is seen that only 17.3% of the subjects who use bicycles prefer bicycles for connecting trips (Table 3.11).
In the comparative analysis conducted to determine the type of transportation preferred by the subjects who transfer while using bicycles, a significant relationship was found since p= 0.001. As a result of the analysis, it is seen that 69.3% of the subjects prefer bus/minibus, 30.7% prefer automobile, and 50.0% prefer other modes of transportation (Table 3.12).
The highest proportion of those who transfer is the students studying at the Faculty of Architecture with 28.0%. Students studying at the Faculty of Education do not need to transfer because they are at the faculty closest to the center. In the Faculty of Theology, this rate is 0.0% (Table 3.13).
- Evaluation of the social dimension of sustainable transportation according to the individual responsibility parameter
In the comparative analysis conducted to determine the effects of individual responsibility and awareness level on bicycle use, a significant relationship emerged since p=0.002. As a result of the analysis, it is seen that 52.6% of the subjects use bicycles because it is economical, 46.0% because it is an environmentally friendly means of transportation, and 36.0% because the travel distance is short (Table 3.14).
In the comparative analysis of the reason for preferring bicycles because of their economic value and the faculties of education, a significant relationship was found with p=0.000. It is seen that 50.0% of those studying at the Faculty of Education, 60.0% of those studying at the Faculty of Architecture, 70.0% of those studying at the Faculty of Engineering, and 33.3% of those studying at the Faculty of Theology prefer cycling because it is economical (Table 3.15.
In the comparative analysis of the reason for preferring cycling as an environmentally friendly mode of transportation and the faculties of education, a significant relationship was found with p=0.001. It was determined that 61.1% of those studying at the Faculty of Education, 80.0% of those studying at the Faculty of Architecture, 50.0% of those studying at the Faculty of Engineering, and 46.7% of those studying at the Faculty of Theology preferred cycling because it is environmentally friendly (Table 3.15).
Due to the short travel time, 60.0% of those studying at the Faculty of Education, 60.0% of those studying at the Faculty of Architecture, 45.0% of those studying at the Faculty of Engineering, and 40.0% of those studying at the Faculty of Theology prefer cycling (p=0.002, Table 3.15).
- Evaluation of the social dimension of sustainable transportation according to the cultural values and habits parameter
In the evaluation of the findings obtained to determine the effects of cultural values and habits on bicycle use; 30.0% of the bicycle users have been using bicycles for 0-5 years, 26.6% for 6-10 years, 23.3% for 11-15 years, 15.3% for 16-20 years, and 4.6% for 21 years or more (Table 3.16).
As a result of the comparative analysis of the subjects who use bicycles and the Faculty of education, it was determined that 72.2% of the students studying at the Faculty of Education, 68.0% of the students studying at the Faculty of Architecture, 50.0% of the students studying at the Faculty of Engineering, and 26.6% of the students studying at the Faculty of Theology frequently use bicycles to engage in socio-cultural activities (Table 3.17). In the evaluation of the comparative analysis carried out; since p>0.05 in the comparison of the use of bicycles to go to the workplace, shopping and school/education facility with the faculty of education, no significant relationship emerged and was not evaluated.
In the evaluation of the findings on the extent to which cycling habits are affected by climatic conditions, it was found that the most intensive cycling was observed on hot and sunny days (Table 3.18). Therefore, it is seen that climatic conditions are a very important factor for bicycle transportation.
In the comparative analysis conducted to determine the effect of cultural values and habits on cycling, a significant relationship was found (p= 0.000). It was determined that 80.0% of those who stated that they did not use bicycles due to social pressure were studying at the Faculty of Theology, while 75.0% of those studying at the Faculty of Engineering were undecided about this situation. 46.6% of those who stated that they did not use bicycles due to adverse climatic conditions were studying at the Faculty of Architecture (Table 3.19).
In the evaluation of the findings obtained to determine the transportation mode habits preferred by the subjects who do not use bicycles to meet their access demands; it was determined that the subjects frequently preferred public transportation and pedestrian trips (Table 3.20).
In the comparative analysis of social pressure and cultural values and gender status of the subjects who do not use bicycles; it was found that the rate of not using bicycles due to social pressure was higher among males than females. It was observed that male respondents did not prefer to use bicycles due to reasons such as being humiliated and looked down upon by the society (Table 3.21).
In the comparative analysis of the subjects who do not use bicycles because they do not know how to ride a bicycle, do not have a bicycle, do not like to ride a bicycle with the faculty of education, no significant relationship was found and not taken into consideration since p>0.05.
4. Evaluation and Discussion
As a result of the evaluation of the analyzes conducted to determine the level of awareness of university students towards sustainable transportation; it was determined that among the students of Amasya University, female students prefer bicycles more than male students to meet their transportation demands. Therefore; it shows that the level of awareness of female students towards sustainable transportation types is higher than male students. In addition, it has been determined that individuals who use bicycles mostly have middle and low income status and that there is inequality between income status and bicycle use. In the evaluation of the analyzes, it is seen that there is an inverse proportion between income status and the development of awareness level towards sustainable transportation.
In the evaluation of the analysis carried out in line with the accessibility principles of the social dimension of sustainable transportation; it was determined that the students studying at the Faculty of Education mostly use bicycles at distances less than 3 km. The fact that the campus where the Faculty of Education is located is located close to the city center increases the rate of bicycle use in short distances. However, in the general evaluation, the rate of bicycle use at distances longer than 9 km is quite low. At distances of 6.01-9 km, which is the middle distance for bicycle trips, the rate of bicycle use by students of the faculties of Architecture, Engineering and Theology is high. This shows that even in the periphery of the city center, the high rate of bicycle use in medium distances shows that the students in the mentioned faculties have a high level of awareness about accessibility. Individuals who use bicycles have a high rate of participation in problems related to accessibility (lack of bicycle paths, lack of integrated and continuous bicycle paths, lack of access to the city center by bicycle).
Individuals who do not use bicycles mostly stated that they do not use bicycles due to accessibility problems (lack of bicycle lanes, continuity of existing bicycle lanes, lack of access to the city center by bicycle). However, especially students studying at the Faculty of Architecture have much higher rates of participation in accessibility problems than students at other faculties. The fact that courses on sustainability are included in the curriculum of the Faculty of Architecture, Department of Urban and Regional Planning and Department of Landscape Architecture shows that students in these faculties have a high level of awareness of sustainable transportation.
In the evaluation of the analyses made in line with the principles of integrated transportation planning; it has been determined that there is no planning approach for cycling in Amasya city and the rate of transferring by bicycle is generally low. However, the highest proportion of the subjects who prefer bicycles in their transfer journeys is composed of students studying at the Faculty of Architecture. The majority of the subjects who prefer bicycles for their transfer journeys prefer public public transportation vehicles for their transfer journeys. Since the Faculty of Architecture is located on the campus on the periphery of the city center, accessibility is low, and the education received by the students in the mentioned faculty contributes positively to the level of awareness of sustainable transportation, the preference rate of bicycles in transfer journeys is high.
As a result of the evaluation of the analyses, it was found that most of the subjects who use bicycles stated that they prefer cycling because it is an environmentally friendly and economical mode of transportation. Therefore; in general, university students have a high level of awareness towards sustainable transportation. However, in the comparative analysis of the preference of students studying in different faculties at Amasya University for cycling, it was observed that most of the students studying in the Faculties of Architecture and Engineering prefer cycling because it is an environmentally friendly mode of transportation, while students studying in the Faculties of Architecture and Education prefer cycling because it is an environmentally friendly mode of transportation. Therefore, the level of responsibility and awareness of the students of the Faculty of Architecture towards society and nature is quite high.
In the analysis of the cycling situation according to the cultural values and habits principle of sustainable transportation; it was determined that the subjects who use bicycles mostly use bicycles in a short period of time (0-5 years). This shows that the habits in bicycle use develop during the education process.
For the subjects who do not use bicycles, the rate of not preferring to use bicycles due to social pressure (fear of being shamed) is highest in the Faculties of Education and Theology. This shows that students studying in the Faculties of Architecture and Engineering have a high level of social responsibility and awareness rather than social pressure.
In the evaluation of cycling habits according to climatic conditions; it was determined that the rate of not using bicycles is quite high in snowy and foggy weather conditions, while there is an increase in the rate of cycling in hot weather conditions.
In the evaluation of the analysis made to determine the purposes of bicycle use according to the faculties where the students receive education, it was determined that students studying in the Faculties of Architecture and Education prefer bicycles for socio-cultural purposes. The fact that the courses on social issues are included in the curricula of the mentioned Faculties, it has been determined that the level of awareness of the students studying in these Faculties is high despite the use of bicycles for socio-cultural purposes.
Among the subjects who do not use bicycles, it was found that the rate of not using bicycles due to social pressure was higher among males than females. It was observed that male subjects did not prefer to use bicycles due to reasons such as loss of prestige and humiliation by the society. Therefore, it has been determined that men are more exposed to social pressure in cycling, while women have a higher level of awareness that social benefit is more important than social pressure.
5. Conclusions and Recommendations
As a result of the general evaluation of the analyzes made within the scope of the study; it has been determined that students studying at the Faculties of Architecture and Education have problems with accessibility and holistic planning, while students studying at the Faculties of Theology and Engineering have problems with cultural values and habits and equality principles. In addition, the individual responsibilities of the students of the Faculty of Architecture and Education, which are among the social dimension principles of sustainable transportation, are higher than other faculties. For this reason, it was determined that the inclusion of social and sustainability-related courses in the curricula of the departments is related to the high level of awareness of the students studying in the faculties of Architecture and Education and that the education received at the university is related to the level of awareness of sustainable transportation.
As a result of the evaluation of the findings obtained within the scope of the study, it was determined that there is a relationship between the education received at the university level and the level of awareness towards sustainable transportation. Therefore, an increase in the rate of bicycle use can be achieved by improving the level of awareness of the subjects by eliminating the problems related to the social dimension of sustainable transportation.
In order to eliminate inequalities in cycling and increase the use of bicycles, education programs to raise awareness on the benefits of cycling for the individual and society, and social activities and campaigns for cycling should be organized. In this context;
- Educational programs explaining the advantages of cycling for individuals and society should be included in the curricula of each department in faculties.
- The participation of all individuals and non-governmental organizations in the bicycle festivals to be organized in faculties should be ensured regardless of gender discrimination.
- In order to encourage students in faculties to use bicycles, incentive reward programs should be implemented for those who use bicycles, and the justification should be given as ensuring social development by improving the level of awareness against transportation.
- In order to eliminate the misconception that "cycling is a mode of transportation for low-income people", the participation of people in the upper income group of the city and well-known public figures in continuous cycling festivals and campaigns should be ensured.
To increase bicycle transportation by reducing accessibility problems;
- Continuity should be ensured on existing bicycle paths.
- Bicycle paths should be constructed to provide safe access from the university area to the city center by bicycle.
- An increase in bicycle use can be achieved by making the necessary arrangements for the principle of health and safety in bicycle transportation. For this reason;
- The safety concerns of bicycle users should be eliminated by raising awareness of other drivers in urban transportation towards bicycle transportation.
- Necessary lighting should be provided on bicycle paths, especially at night, to ensure social security.
- Educational programs should be organized in faculties to explain the positive contributions of cycling to individual physical and psychological health and healthy urban formation while providing access in urban areas.
In order to ensure an increase in bicycle use through integrated transportation planning;
- A transit pricing policy should be applied to those who transfer to public transportation with their bicycles.
- For those who transfer to public transportation vehicles with their bicycles, physical arrangements should be made to carry bicycles inside and/or outside public transportation vehicles.
- Ensure integration between land use and transportation plans and consider pedestrian and bicycle access distances in the location selection of public spaces.
- In order to encourage the use of bicycles for short-distance journeys, bicycle parking areas should be built especially in educational facilities and accessibility to these areas should be provided by bicycle paths.
- Institutional integration between the university administration and local governments should be ensured to ensure the construction of safe bicycle paths, especially within the campus.
- Bicycles should be included in smart transportation systems and this situation should be announced to the public to increase the level of awareness.
- In order to ensure the social cohesion of the students in the faculties of the university and to raise awareness against the society, projects to provide access to the common areas and faculties of the students in the campus by bicycle should be supported.
In order to raise the level of awareness within the scope of individual responsibility principles of sustainable transportation;
- Courses on sustainability should be added to the curricula of departments in faculties. Sustainable transportation should be included in the content of the courses added to the curricula.
- Seminars should be organized at universities to explain that sustainable urban development can be achieved by using bicycles for sports and socio-cultural purposes as well as for meeting access demands.
- Increasing the level of awareness and individual responsibility towards the society should be ensured by increasing social activities for cycling.
To improve the cultural values and habits of university students in favor of cycling;
- Seminars should be organized in universities to explain the importance of bicycle transportation for social development rather than the social perspective.
- In order to change the perception that cycling is a type of transportation that can be used by low-income individuals, bicycle festivals organized jointly by individuals in the university administration, academic staff and students should be organized.
In order to make cycling widespread throughout the city and to ensure sustainable urban development, it is necessary to raise the awareness of the young generation (university students), who shape our cities and our future, in favor of cycling, to increase their support for cycling-friendly campaigns and to ensure their participation in decisions on cycling. In order to ensure sustainable transportation and sustainable urban development by improving bicycle transportation, in addition to physical plans, the level of awareness of social sustainability principles should be raised with the support of public participation.
References
- Newman, K. (1999). Sustainability and Cities Overcoming Automobile Dependence. Washington: Island Press.
- Vuchic, V. (1981). Urban Public Transportation; Systems And Technology,. Transportatiın Research Board Of The National Academies, 560.
- Schwela, D. and Zali, O. 1999, Urban Traffic Pollution, F & FN Spon, London, UK.
- Aysan, M. (1996). Environment Sensitive Urban Transportation. Switzerland: Europen Regional Science Association 36. European Congress.
- Shepherd, S. 1998, Towards The Sustainable City: The Impact Of Land Use-Transport Interactions. A Comparison Of The Impact Of The Initial And Final Coefficients On Location Choice On Transport Straregies And Land Use Scenarios, Working Paper 516, University Of Leeds, İngiltere.
- Özuysal, M., Tanyel, S., & Şengöz, B. (2003). Erişebilirlik Yönetiminin Ulaşım Planlama Politikası Olarak Değerlendirilmesi. TMMOB Ulaştıma Politikaları Kongresi Bildiriler Kitabı. Ankara.
- Black, W. R. (2003). Sustainable Transport And Potantial Mobility, Transportation. Newyork: A Geopraphical Analysis.
- OECD, (1996), Environmental Criteria for Sustainable Transport, OECD Environmental Directorate’s Task Force in Transport, 136.
- OECD, (1996). Towards Sustainable Transportation, The Vancouver Conference, Canada.
- Eryiğit, S. (2012). Sürdürülebilir Ulaşımın Sosyal Boyutunda Bisikletin Yeri (Unpublished Doctoral Thesis). Konya: Selçuk Üniversitesi, Fen Bilimleri Enstitüsü, Şehir ve Bölge Planlama Anabilim Dalı.
- Lien, J. (2011). Integrating Strategic Environmental Assessment Into Transport Planning. Avustralya: Griffith University Environment, Science, Engineering And Technology Group.
- Ünal,C. B. 2004, Kentsel Yaşam Kalitesi Ölçütleri İle İstanbul Analizi Ve Toplam Kentsel Yaşam Kalitesi Yönetim Yaklaşımı, Mimar Sinan Üniversitesi Fen Bilimleri Enstitüsü, Doktora Tezi, İstanbul.
- Babalık, S. E. (2006). Kentsel Sorunların Çözümünde Ulaşım Politikaları, Ulaşım Sorunlarının Çözümünde Kent Planlama Politikaları. Ankara’da Uygulanan Ulaşım Politikaları Ve Kente Etkileri Sempozyumu Bildirileri, 5870.
- Çalık, S. 2008, Avrupa Birliği Ulaştırma Politikası ve Türkiye’nin Uyumu, Dokuz Eylül Üniversitesi, Sosyal Bilimler Enstitüsü, İzmir.
- Hansen, W.J. (1959) How Accessibility Shapes Land Use. Journal of the American Planning Association, 25, 73-76. [CrossRef]
- Engwicht D. (1993). Reclaiming our cities and towns: better living with less traffic. Philadelphia: New Society Publishing.
- Talay (Tazebay), H. İ. 1997, Sürdürülebilirlik Kavramı Ve Uygulaması Üzerine Bir Araştırma: Şanlıurfa Örneği, Ankara Üniversitesi Fen Bilimleri Enstitüsü, Doktora Tezi, Ankara.
- Kaplan, H. (2009). Yerel Yönetim Ulaşım Karar ve Uygulamalarında Çevre Duyarlı Ulaşım Tür ve Düzenlemelerinin Yeri-1. Yapı Dünyası Dergisi, 19-25.
- Barter, P. 2000, Taking Steps: A Community Action Guide To People Centred, Equitable And Sustainable Transport, Sustainable Transport Action Network For Asia and the Pacific (the SUSTRAN Network),1-3.
- Üstündağ, K. (2002). İnsan Merkezli Bütünleşik Kentsel Ulaşım Planlama Modeli. İstanbul: Mimar Sinan Üniversitesi Fen Bilimleri Enstitüsü.
- Yalınız, P. (2006). Kentsel Ulaştırmada Otomobil Kullanıcılarının Toplu Taşımaya Yönlendirilmesi: Çevresel Etkileri İçeren Analiz Ve Planlama. Eskişehir: Osmangazi Üniversitesi Fen Bilimleri Enstitüsü, Doktora Tezi.
- Bilickstein, S. G. (2008). Critical Mass: Bicycling Towards A Mora Sustainable City. Worcester ABD: Clark University.
- Öncü, E.1990, Toplutaşımın Tamamlayıcısı Olarak Bisiklet, Şehir Plancıları Odası Planlama Dergisi, 90\1-2, Ankara.
- Haughton, G., & Hunter, C. (1994). Sustainable Cities. London: Regional Policy And Development Series 7, Jessica Kingsley Publications.
- Çahantimur, A. ve Yıldız, H. 2008, Sürdürülebilir Kentsel Gelişmeye Sosyokültürel Bir Yaklaşım: Bursa Örneği, İTÜ Dergisi/A, Mimarlık, Planlama Tasarım, Cilt:7, Sayı:2, Sf: 3-13.
- Blowers, A. (1997). Environmental Policy: Ecological Modernisation Or The Risk Society? Urban Studies, Vol: 34, No:5-6, Sf: 845-871.
- Jeon, C. M. (2007). Incorporating Sustainablility Into Transportation Planning And Definitions, Performance Measures And Evaluation. Atlanta: Georgia Institute Of Technology.
- İnceoğlu, M. 2011, Tutum Algı İletişim, Siyasal Kitabevi, Ankara.
- Cebeci, Ö. F., Çakılcıoğlu, M. 2002, Kültürel Sürdürülebilirlik, 10. Ulusal Bölge Bilimi/Bölge Planlama Kongresi , İstanbul.
- Dissart, J. 2000, Quality Of Life In The Planning Literature, Journal Of Planning Literature, 135-161.
- Zorlu, F. (2008). Planlamada Belirsizlik Sorunu: Ulaşım Planlamasında Yolculuk Talebi,. Megaron YTÜ Mimarlık Fakültesi e-dergisi, Cilt:3, Sayı:1.
- Birinci, M. (2014). Üniversitelerde Stratejik Yönetim Uygulamalarının Performansa Etkileri: Devlet ve Vakıf Üniversitelerinin Karşılaştırmalı Analizi. Yükseköğretim Dergisi, 4(3), 135-147.
- Pfarrer , M., & Devers ve diğ., C. (2019). Sociocognitive Perspectives in Strategic Management. Academy of Management Review, 44 (4), 767-774.
- Omuse, G., Kihara, P., & Munga , J. (2018). Determinants of strategic plan ımplementation in public universities: A Case Of Selected Public Universities in Nairobi County Kenya. International Academic Journal of Human Resource and Business Administration, 3(2) 452-477.
- Sonetti, G., Lombardi, P., & Chelleri, L. (2016). True Green and Sustainable University Campuses? Toward a Clusters Approach. Sustainability, 8(8), 1-23. [CrossRef]
- Özdemir, Y., Kayapınar Kaya, S., & Turhan, E. (2020). ,A Scale to Measure Sustainable Campus Services in Higher Education: Sustainable Service Quality, Journal of Cleaner Production, 245. [CrossRef]
- Dagiliüte, R., Liobikiene, G., Minelgaite, A., 2018. Sustainability at universities: student’ perceptions from green and non-green universities, Journal of Cleaner Production, 181, 473-482.
- Kalaycı, E., "Sosyal Hizmet Perspektifi ile Sürdürülebilir Kalkınmayı Düşünmek: Yeşil Kampüsler Örneği," In Yeşil Kampüs , Ankara: Hacettepe Üniversitesi Yayınları, 2020, pp.127-147.
- Walsh, M.P. 2000, Transportation And The Environment In China, China Environment Series, Washington, DC.
- Tavşancıl, E. 2010, Tutumların Ölçülmesi ve SPSS ile Veri Analizi, Ankara: Nobel Yayın Dağıtım.
- Yıldırım, A. Ve Şimşek, H. 2005, Sosyal Bilimlerde Nitel Araştırma Yöntemleri, (5. Baskı), Seçkin Yayınevi, Ankara.
- Çıngı, H. 2007, Örnekleme Kuramı, Bizim Büro Basımevi Yayın Dağ. Tic. Ltd. Şirketi, 3. Baskı, Ankara.
- URL 1. http://www.amasya.gov.tr/cografi-konum. Access Date: 14.03.2025.
- URL 2. https://atlas.harita.gov.tr/#8/40.654/35.833. Access Date: 12.01.2025.
- Herala, N. 2003, Regulating Traffic With Land Use Planning, Sustainable Devolopment; May 2003, Volume:11, Issue: 2, Pages: 91-102.
- URL 2. https://data.tuik.gov.tr/Bulten/Index?p=Adrese-Dayali-Nufus-Kayit-Sistemi-Sonuclari-2024-53783. (Access Date: 14.03.2025).
Figure 1.1.
Conceptual scheme of sustainable transportation [10].
Figure 1.1.
Conceptual scheme of sustainable transportation [10].
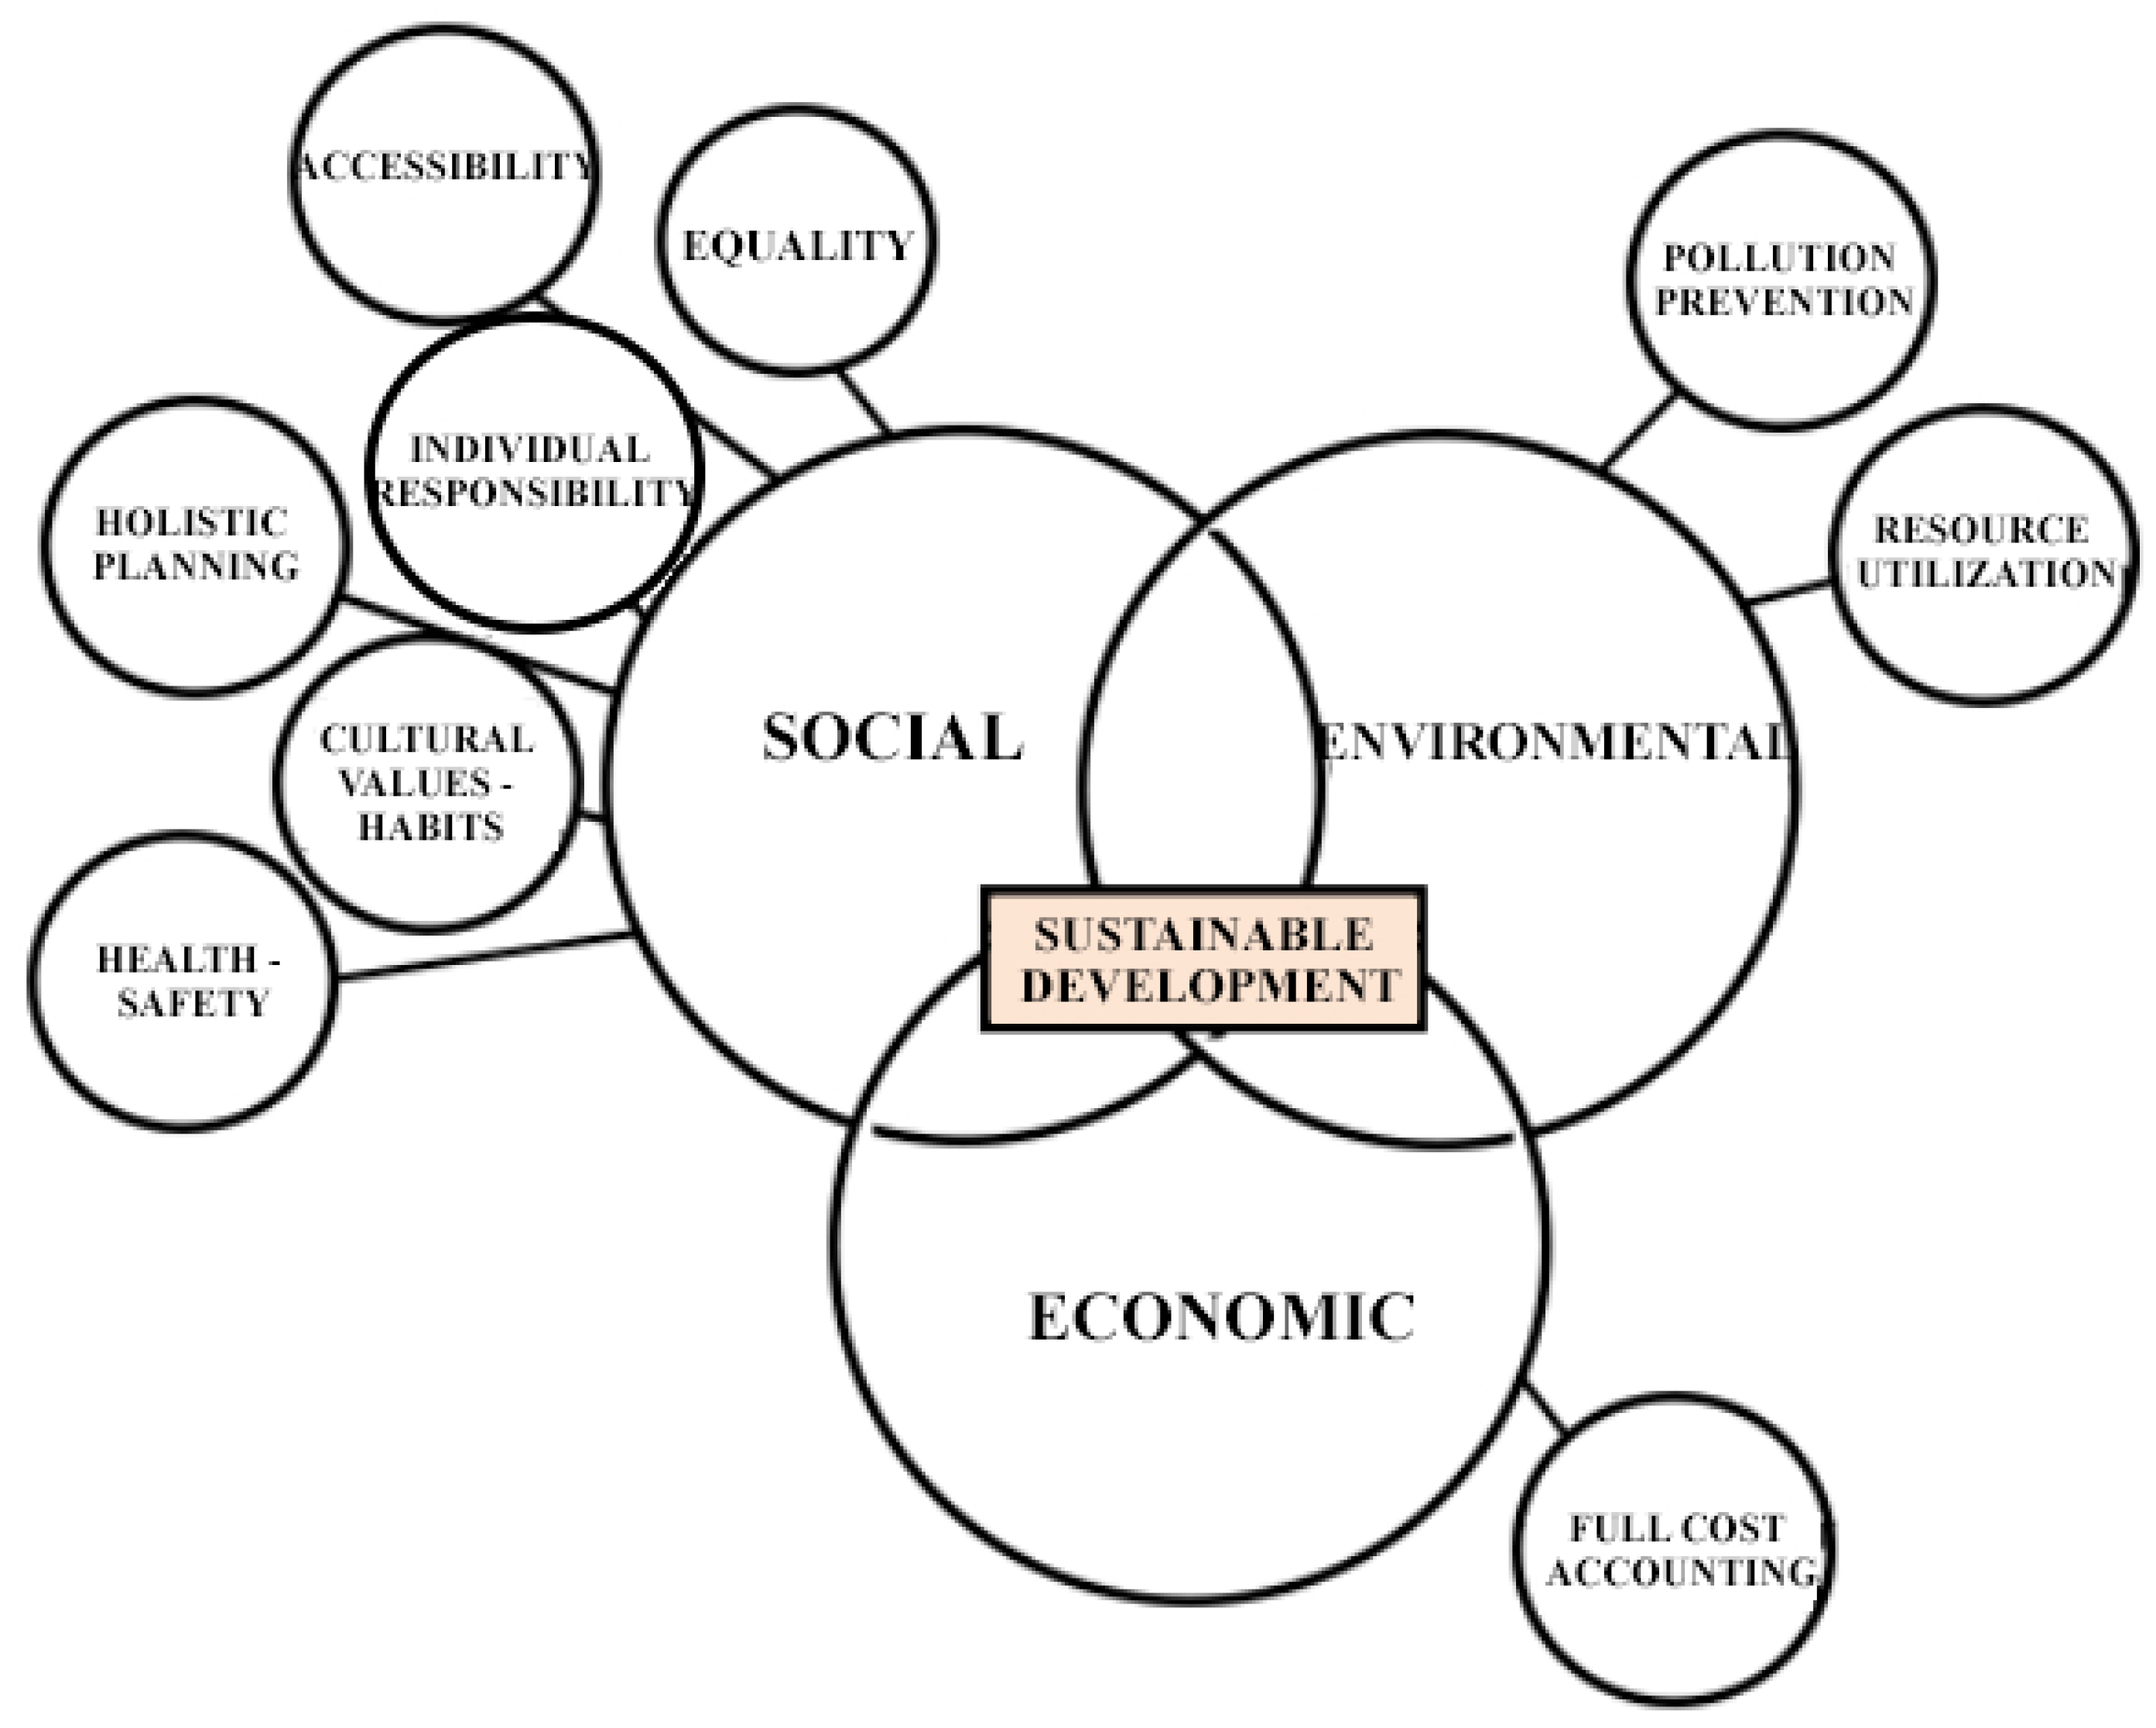
Figure 2.1.
Location of faculties within the city.
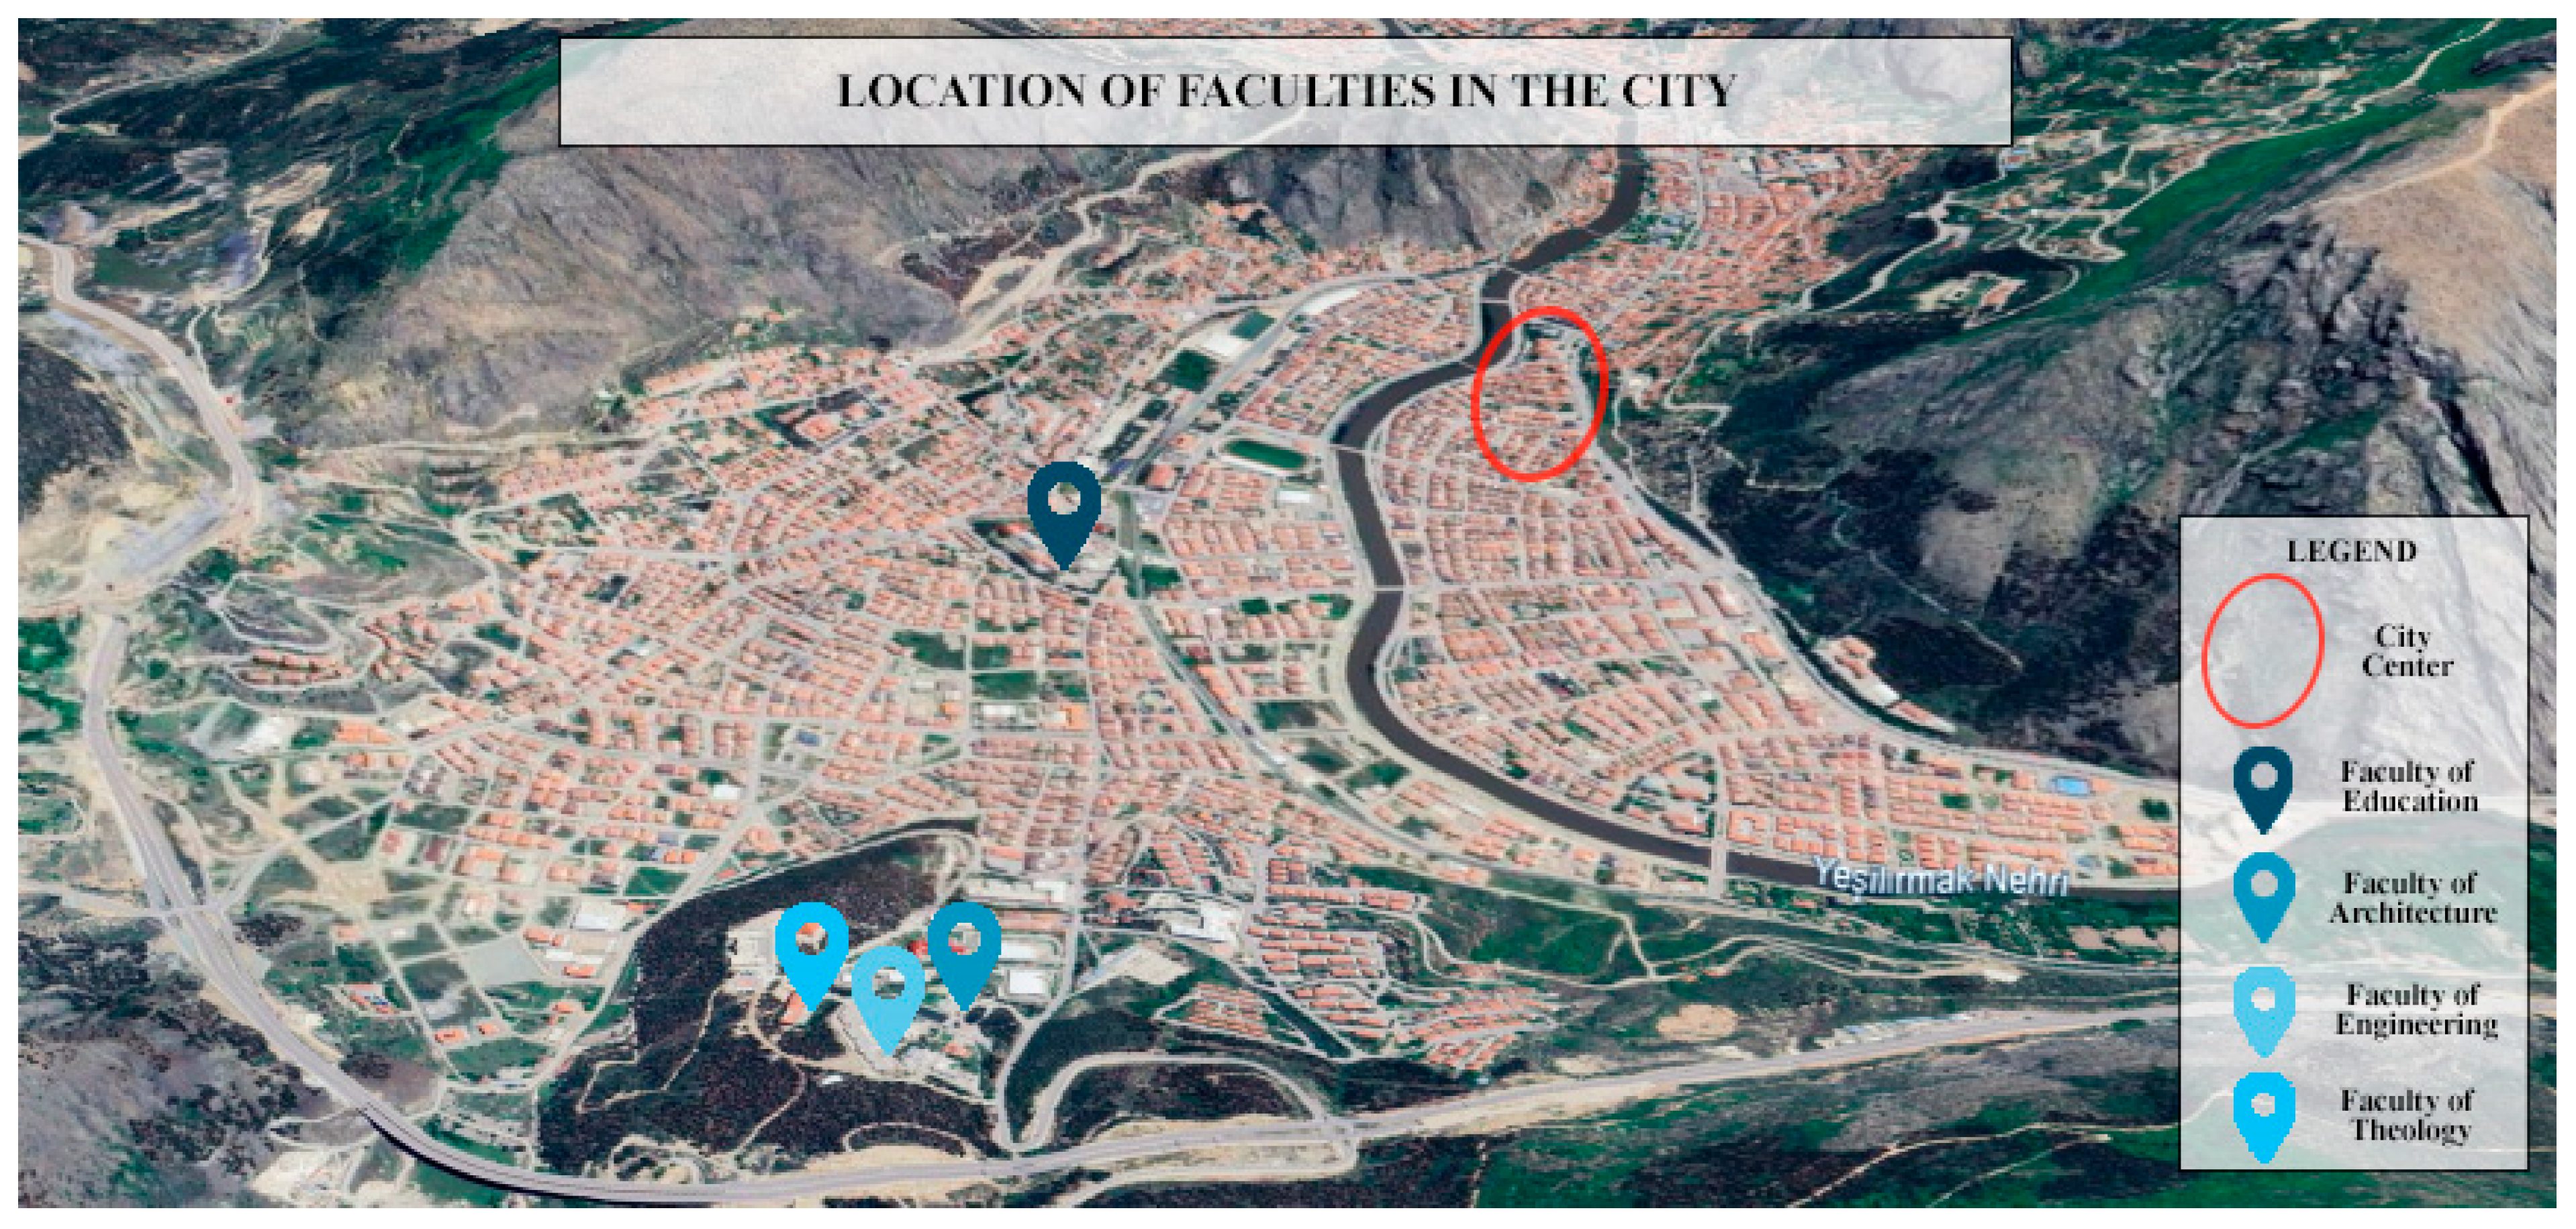
Figure 2.2.
Mass, stratum and homogeneous groups selected in the sample area.
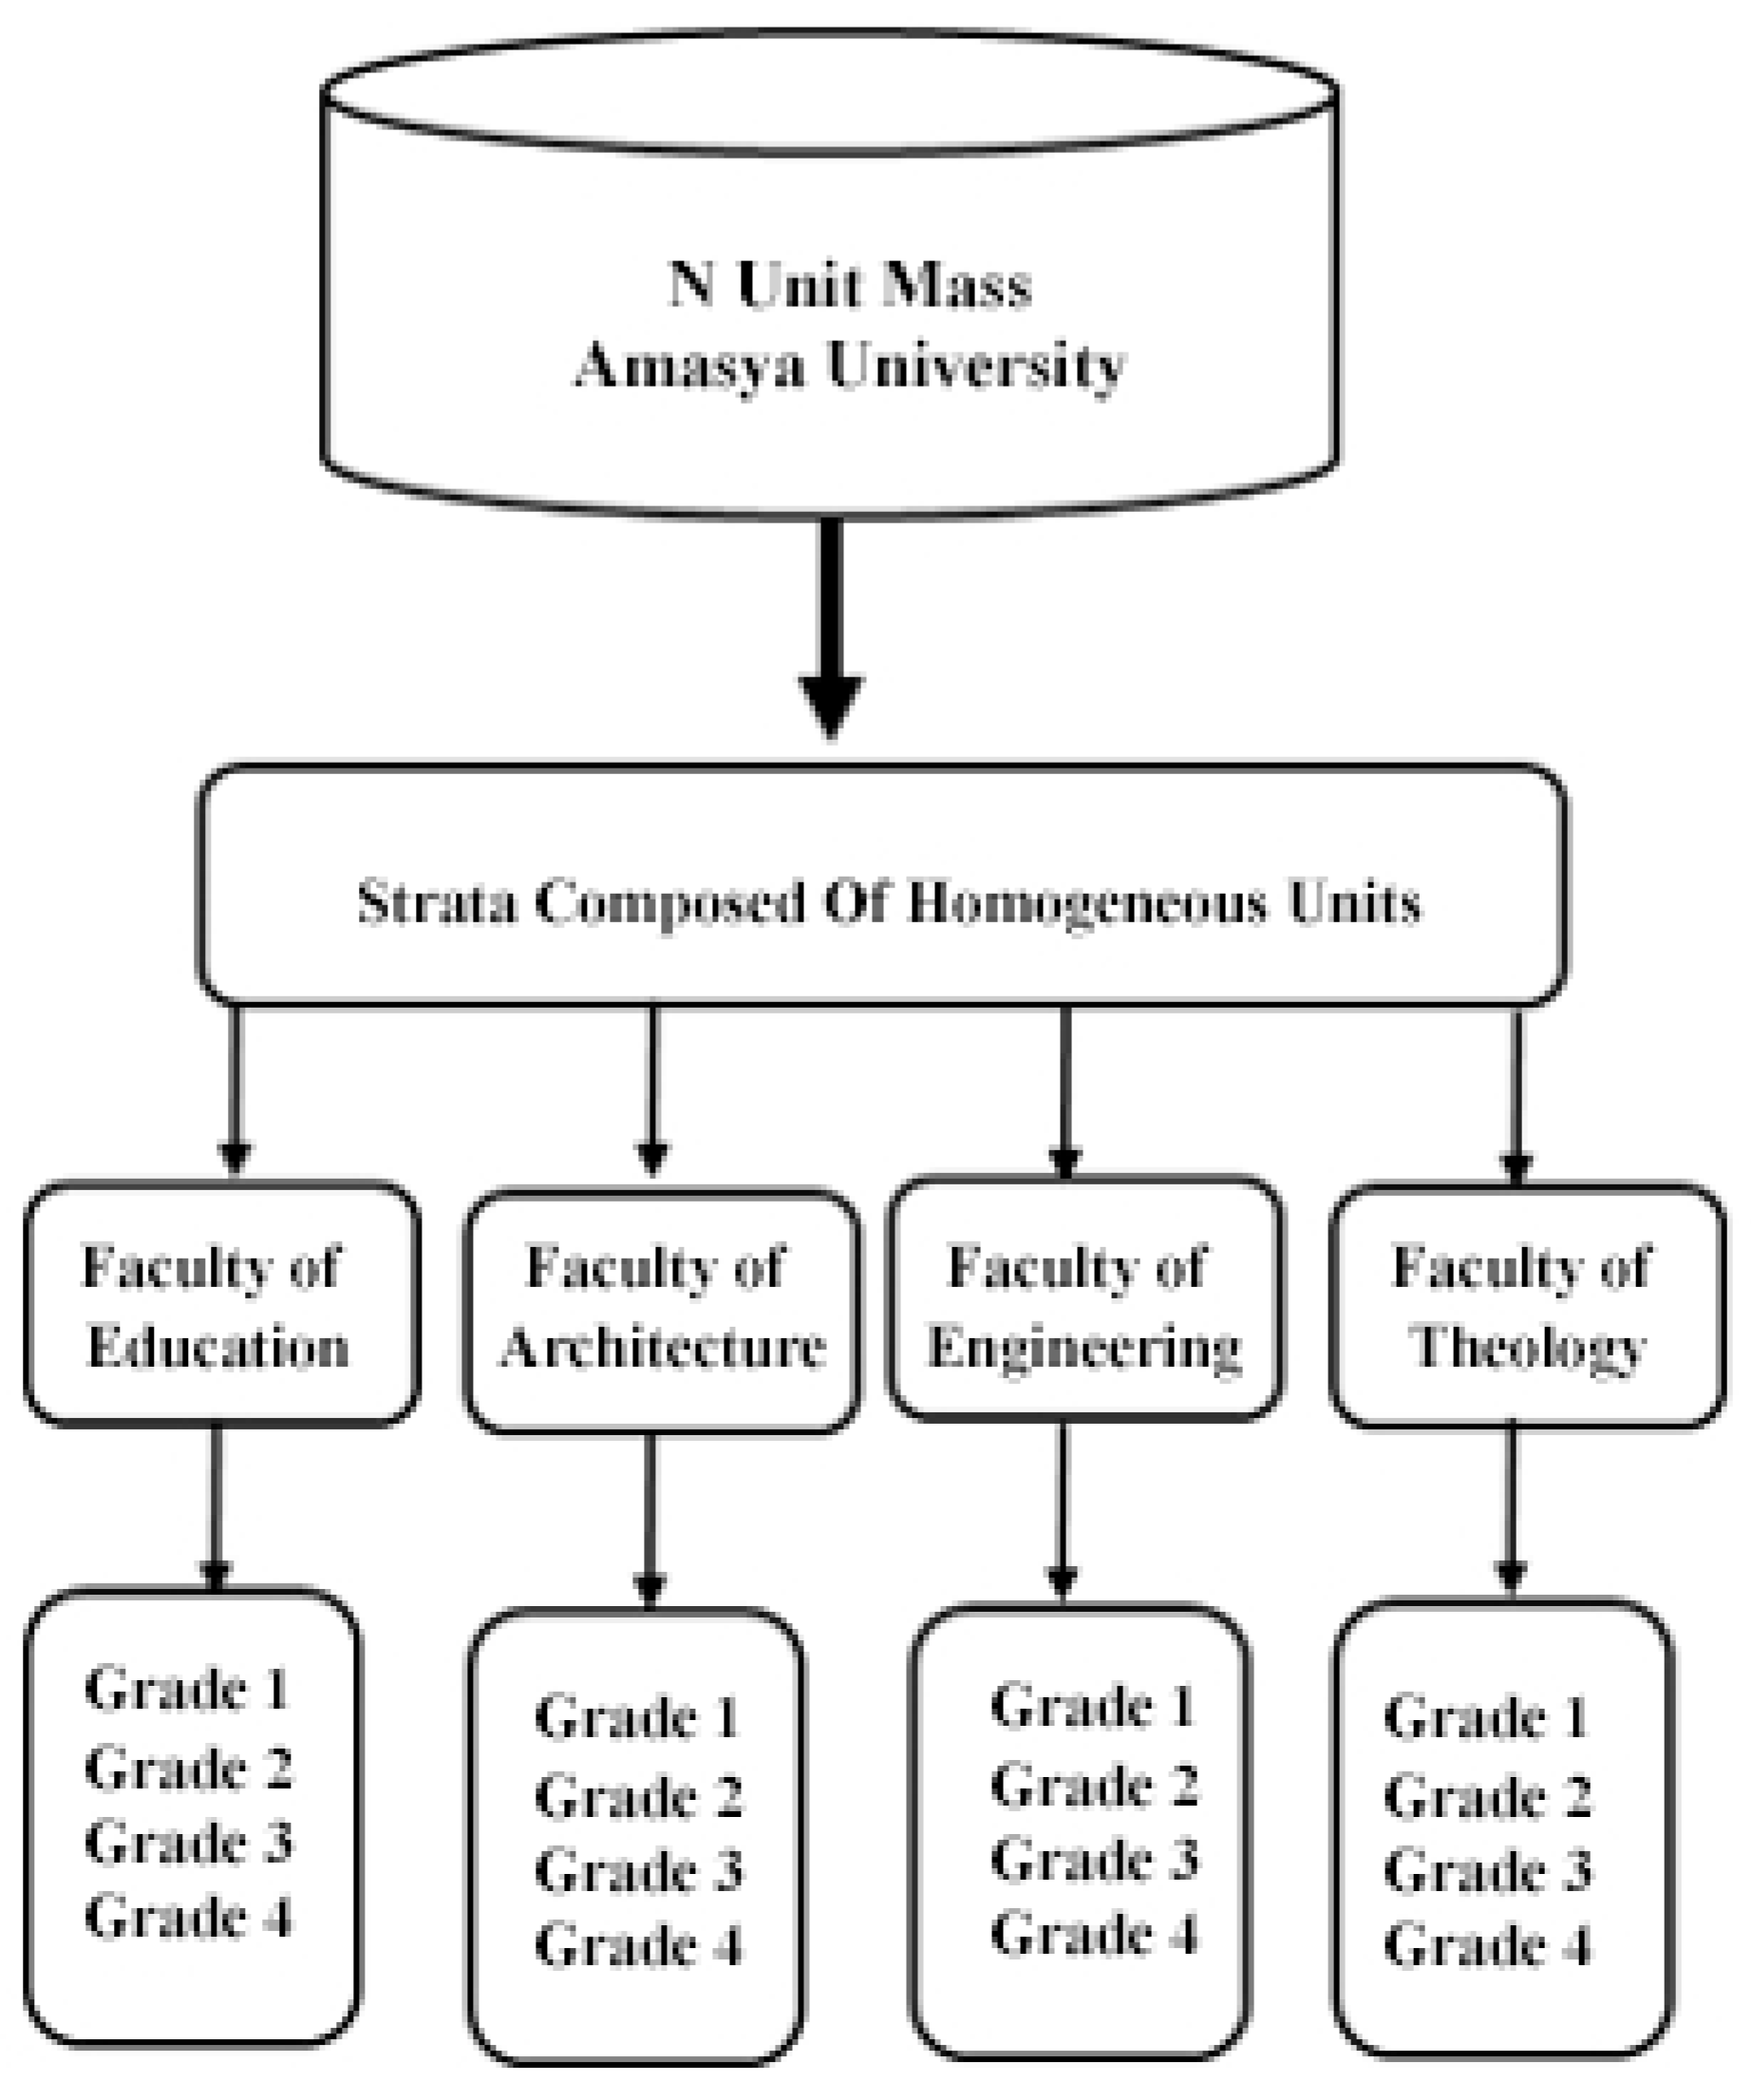
Figure 3.1.
Map of Amasya province [44].
Figure 3.1.
Map of Amasya province [44].
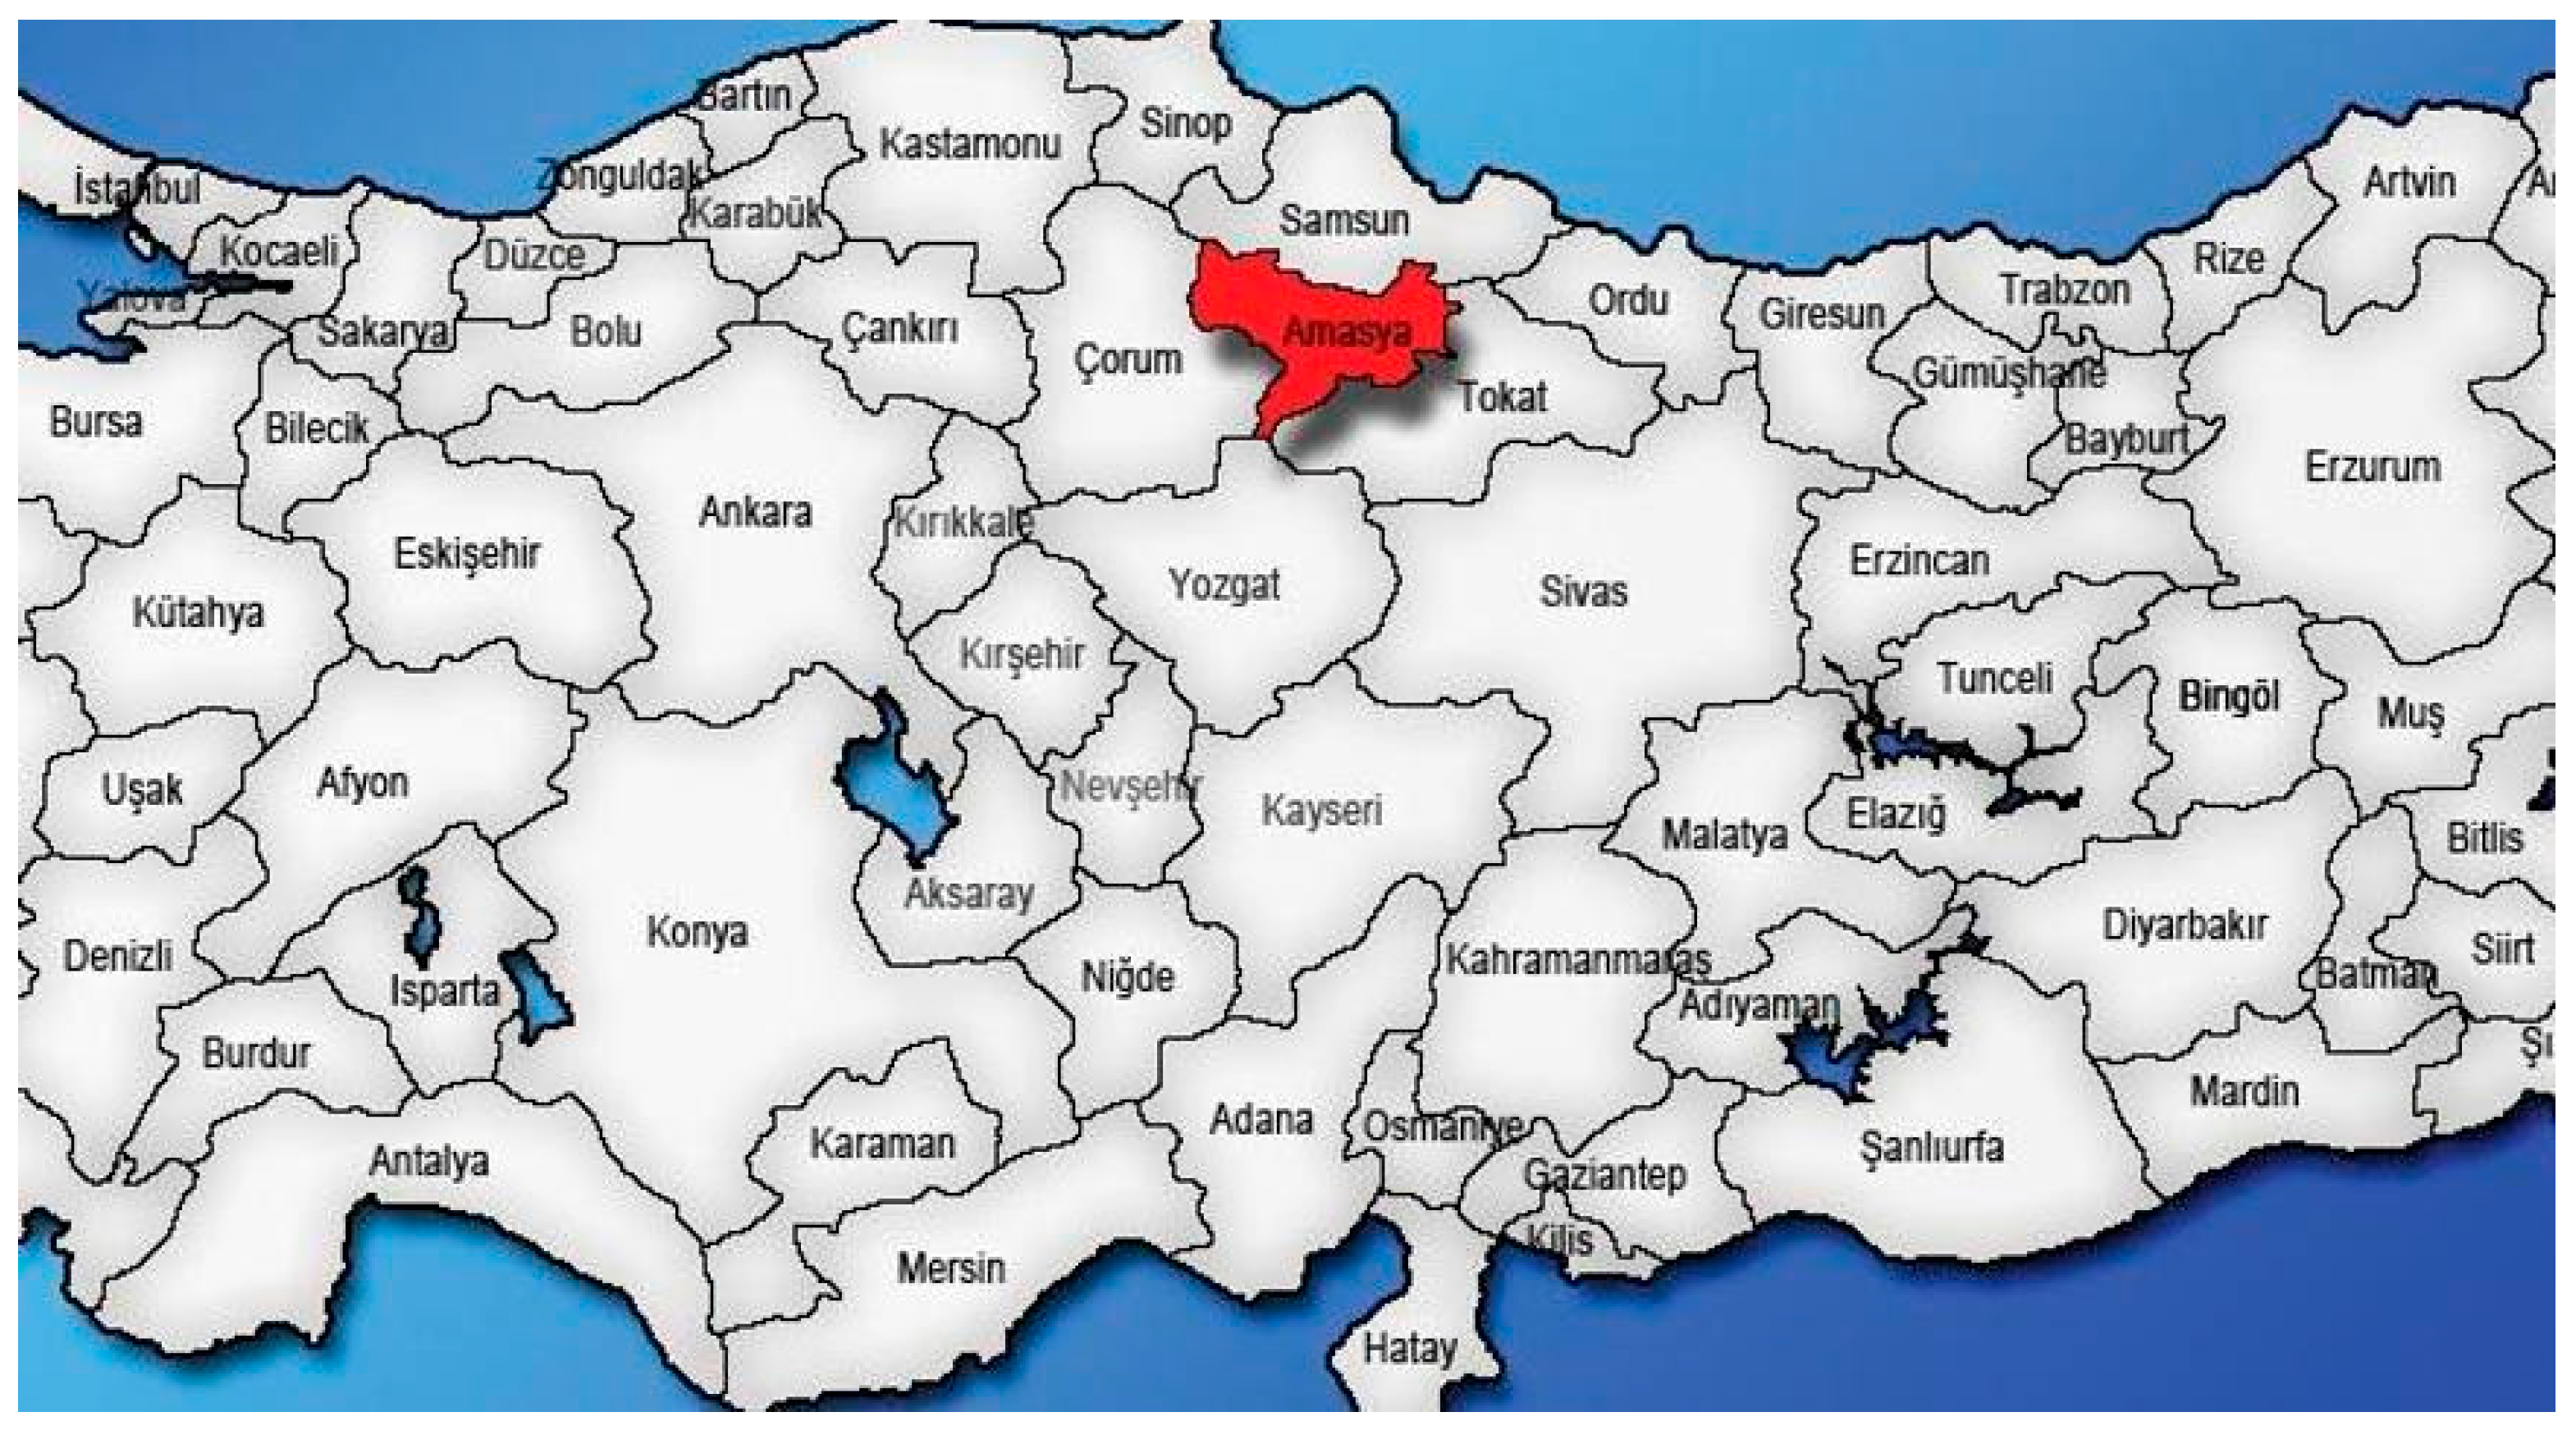
Figure 3.2.
Place of Bicycle in Urban Transportation.

Figure 3.3.
Urban bicycle parking spaces.
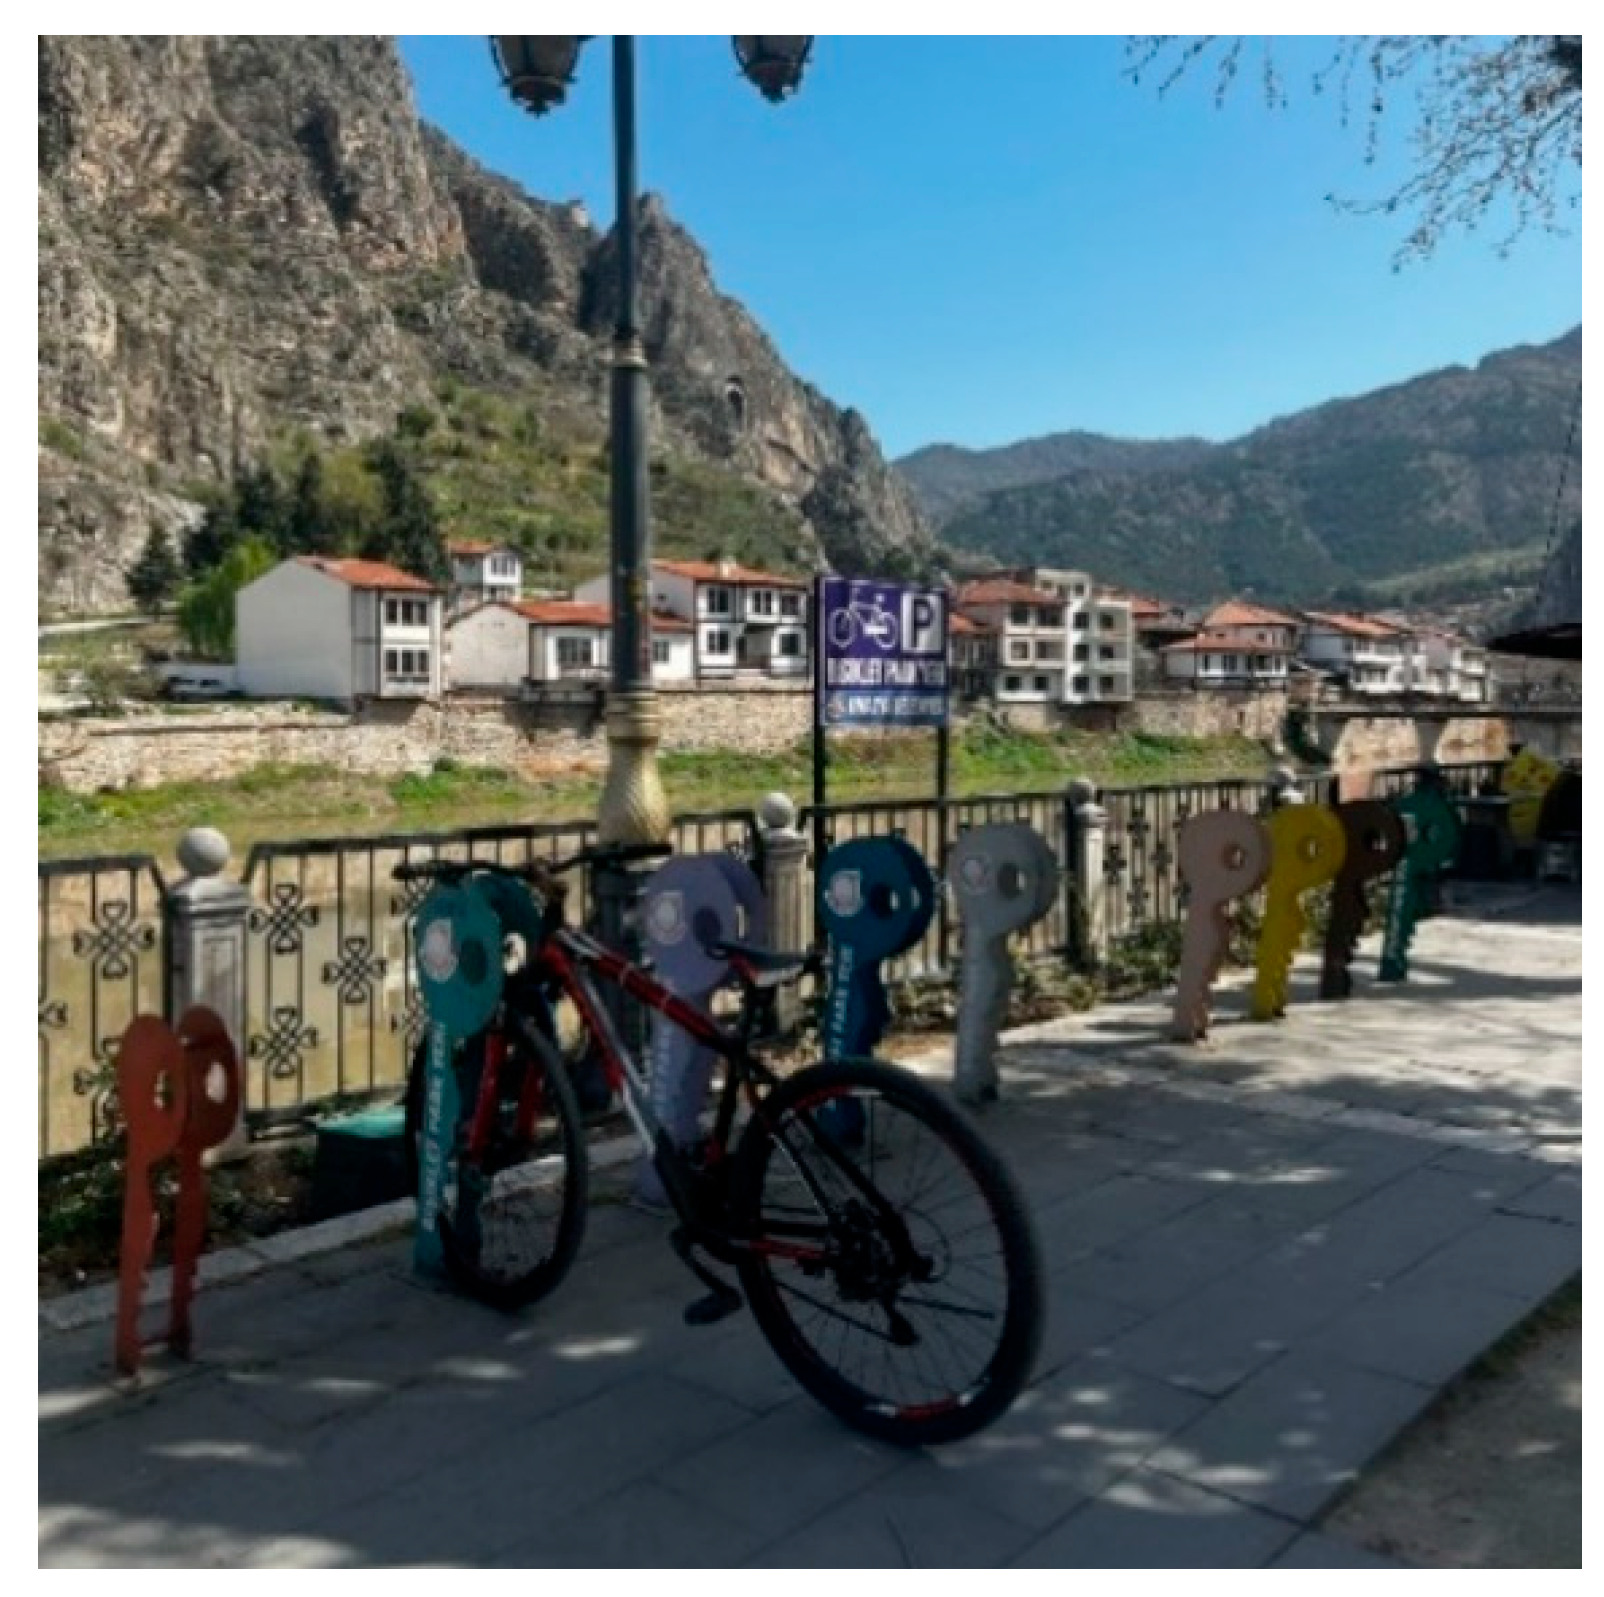
Figure 3.4.
Urban bicycle parking spaces.
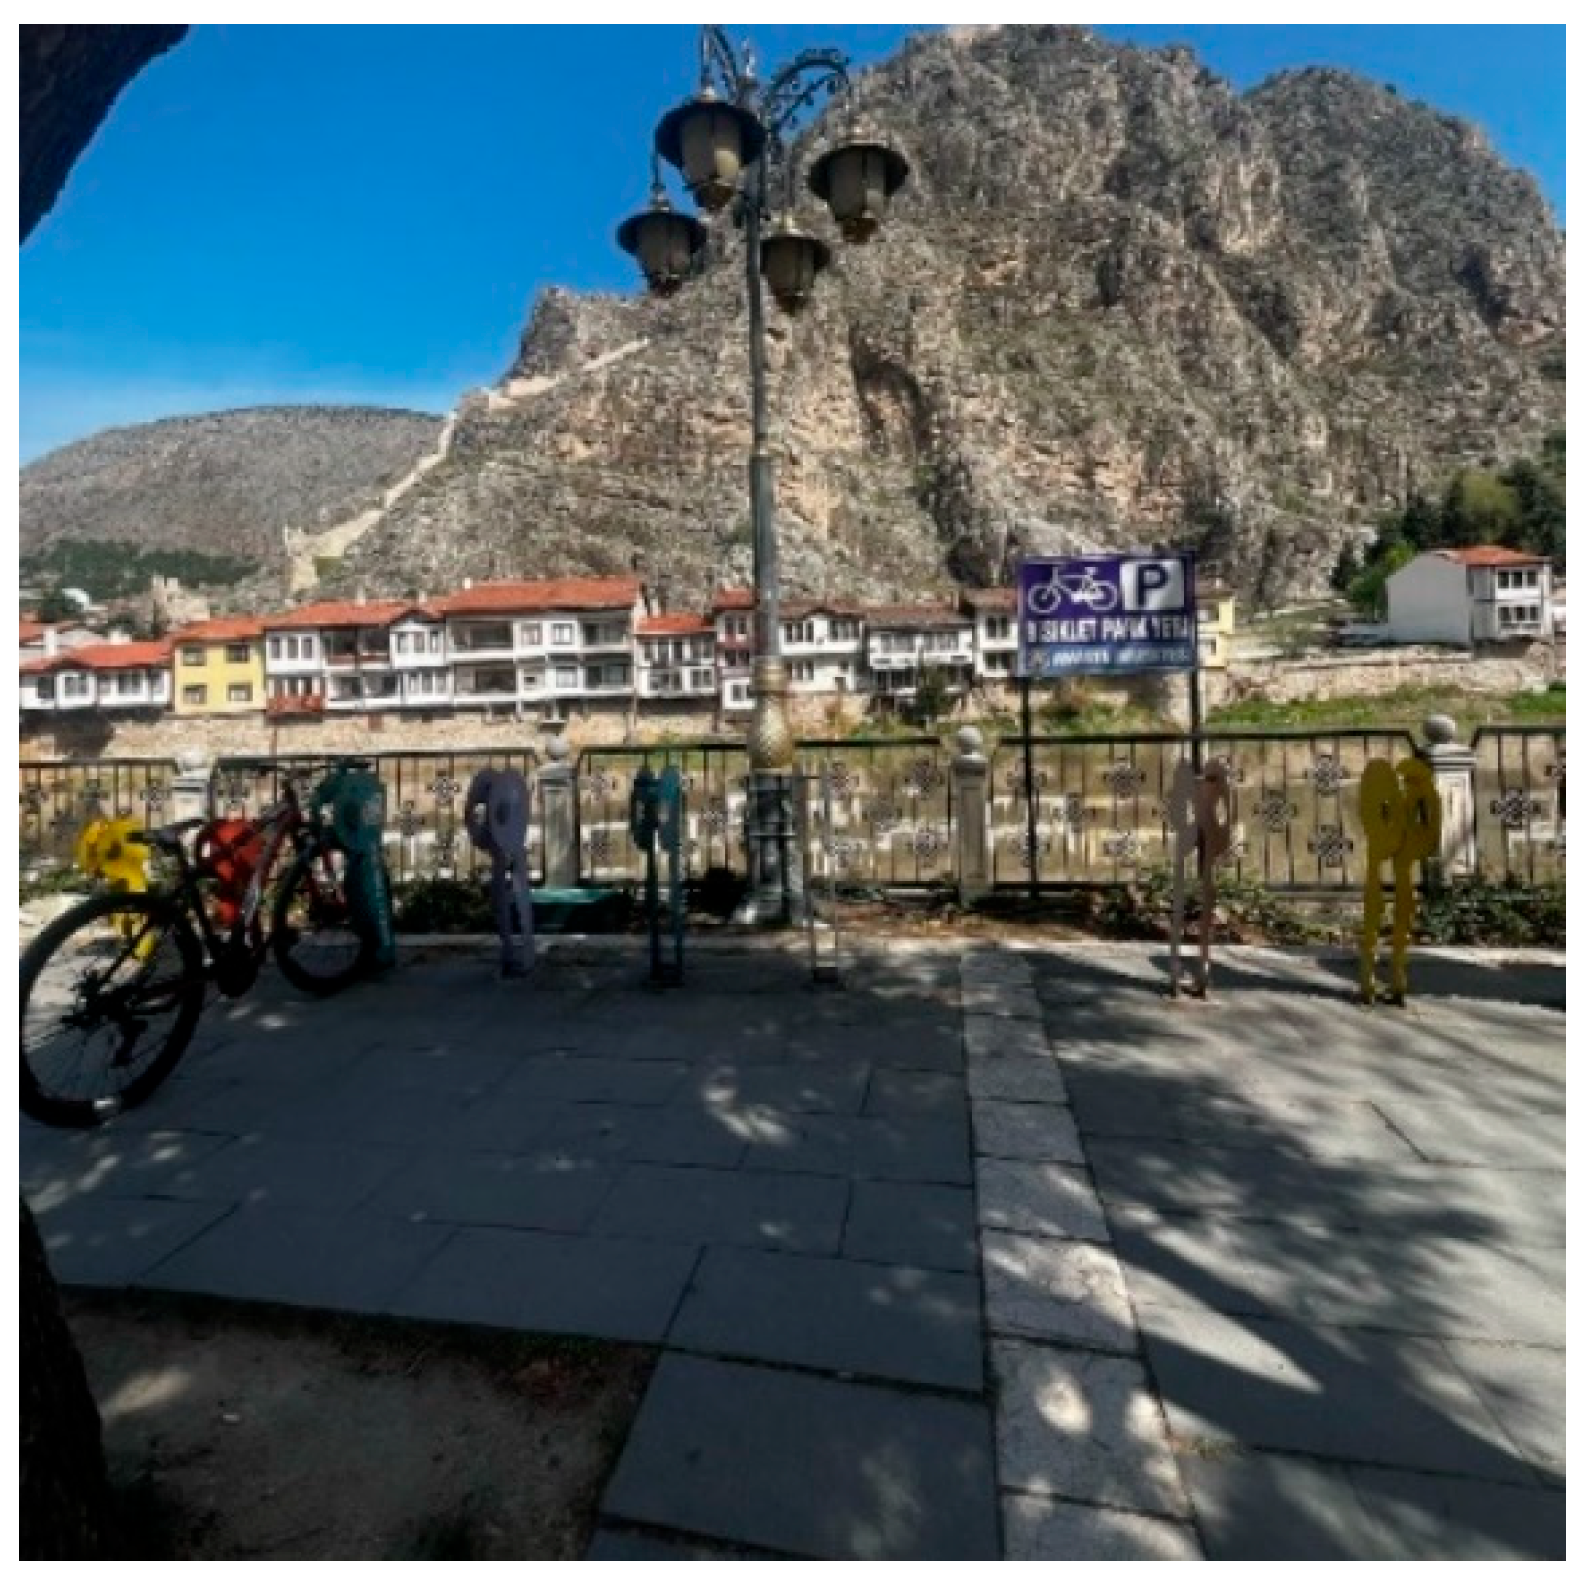
Figure 3.5.
Discontinuous bicycle lanes.
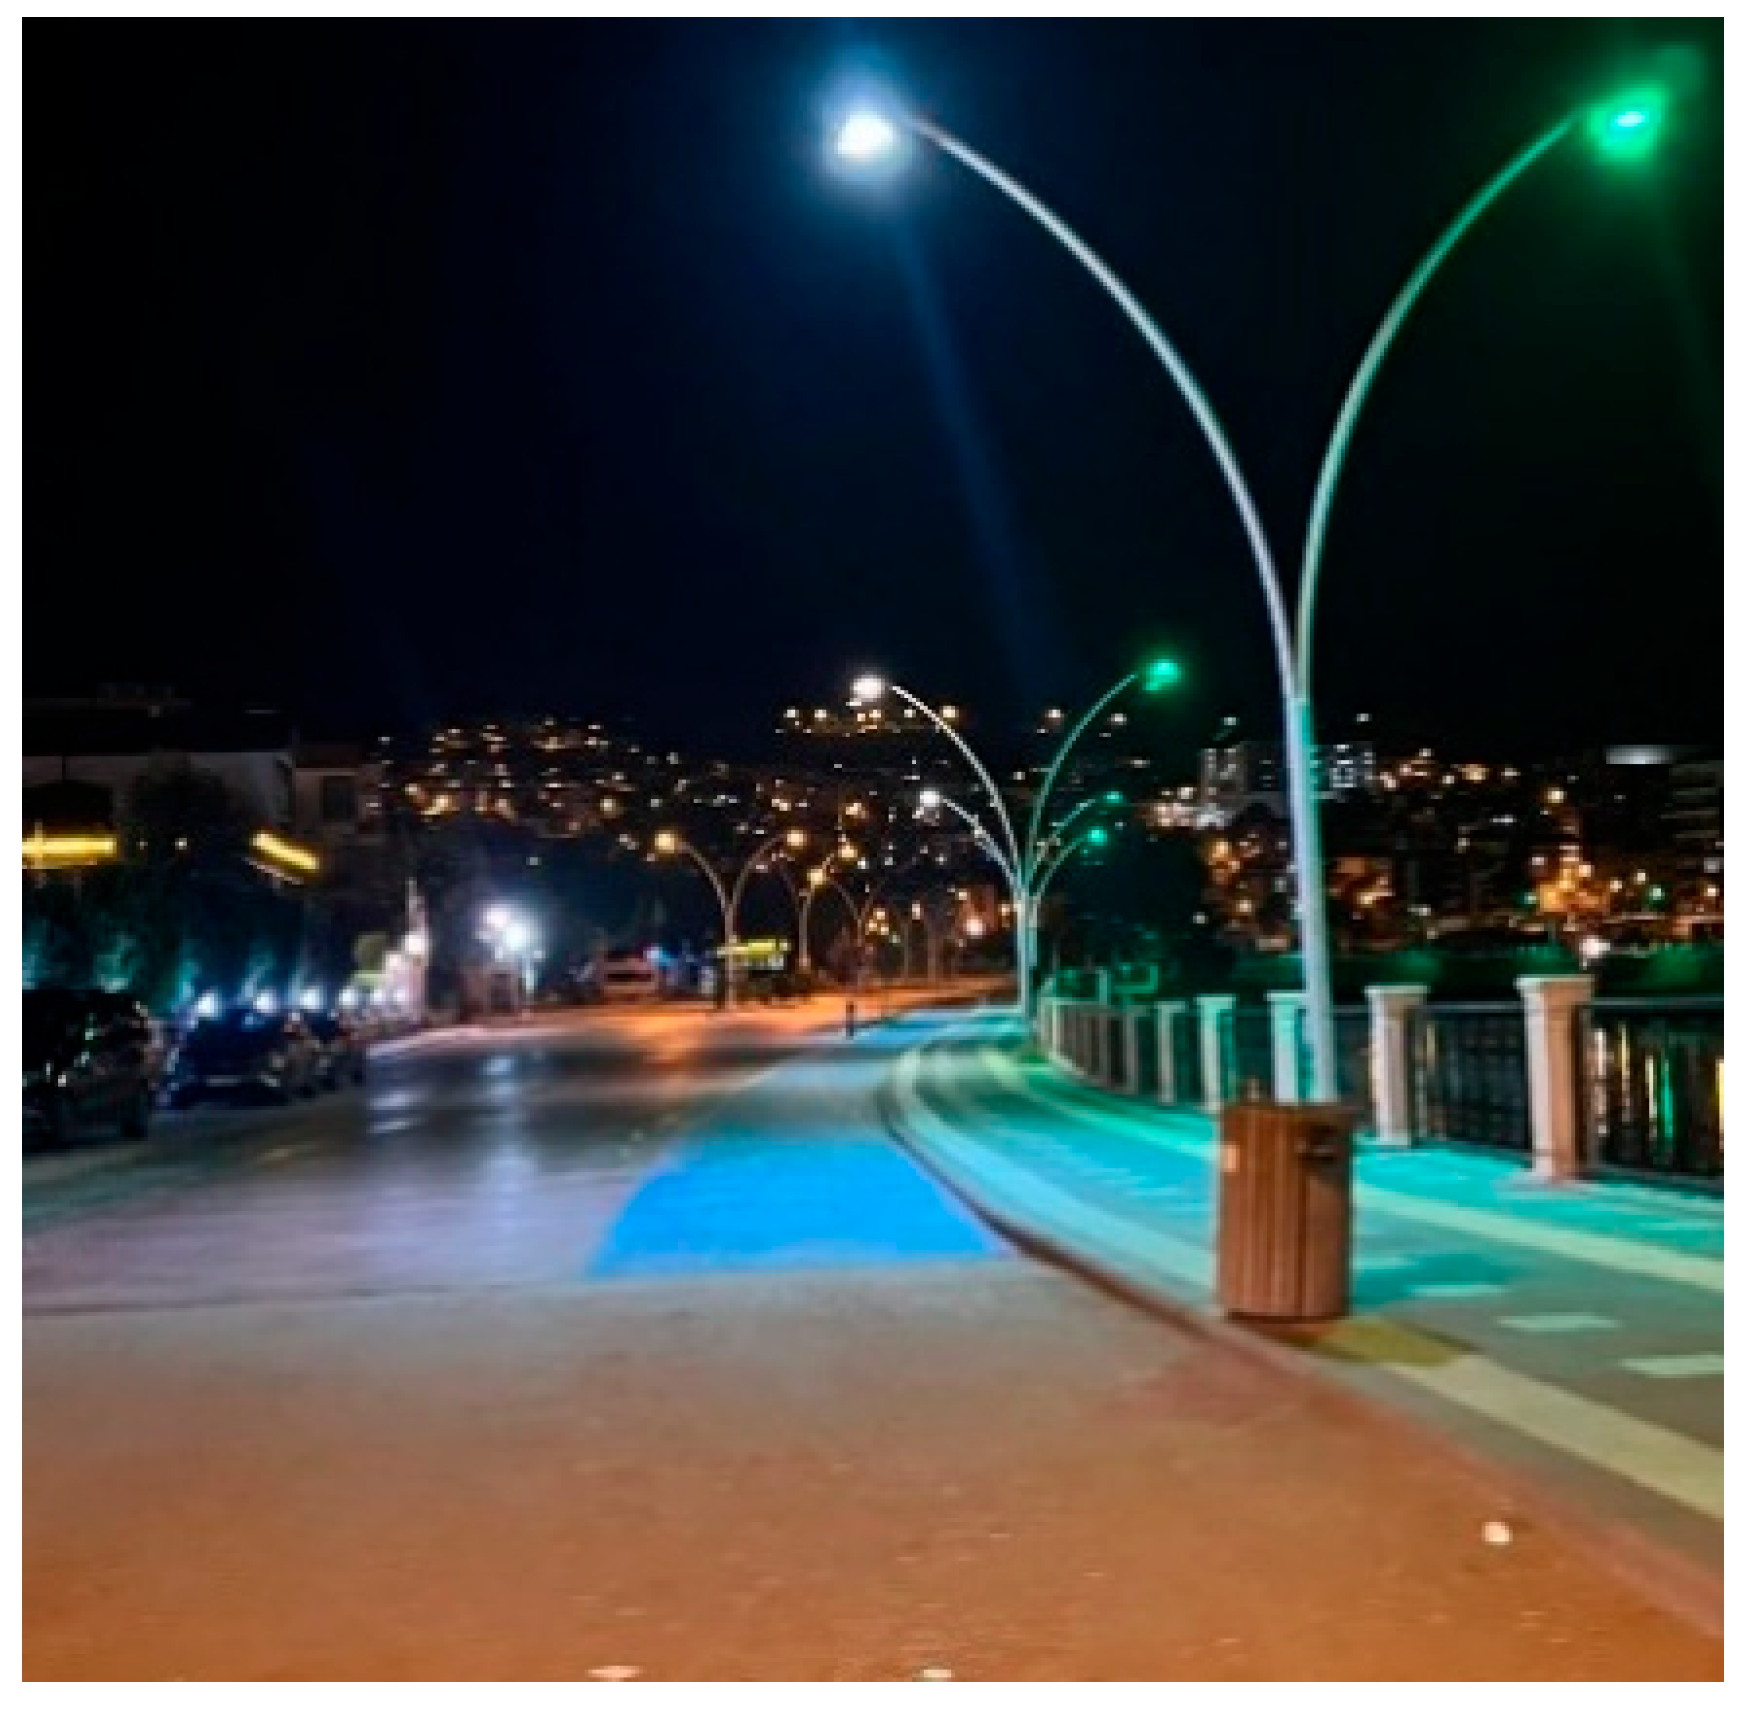
Figure 3.6.
Bicycle lanes that cannot be separated from the roadway by factors such as color, pavement, etc.
Figure 3.6.
Bicycle lanes that cannot be separated from the roadway by factors such as color, pavement, etc.
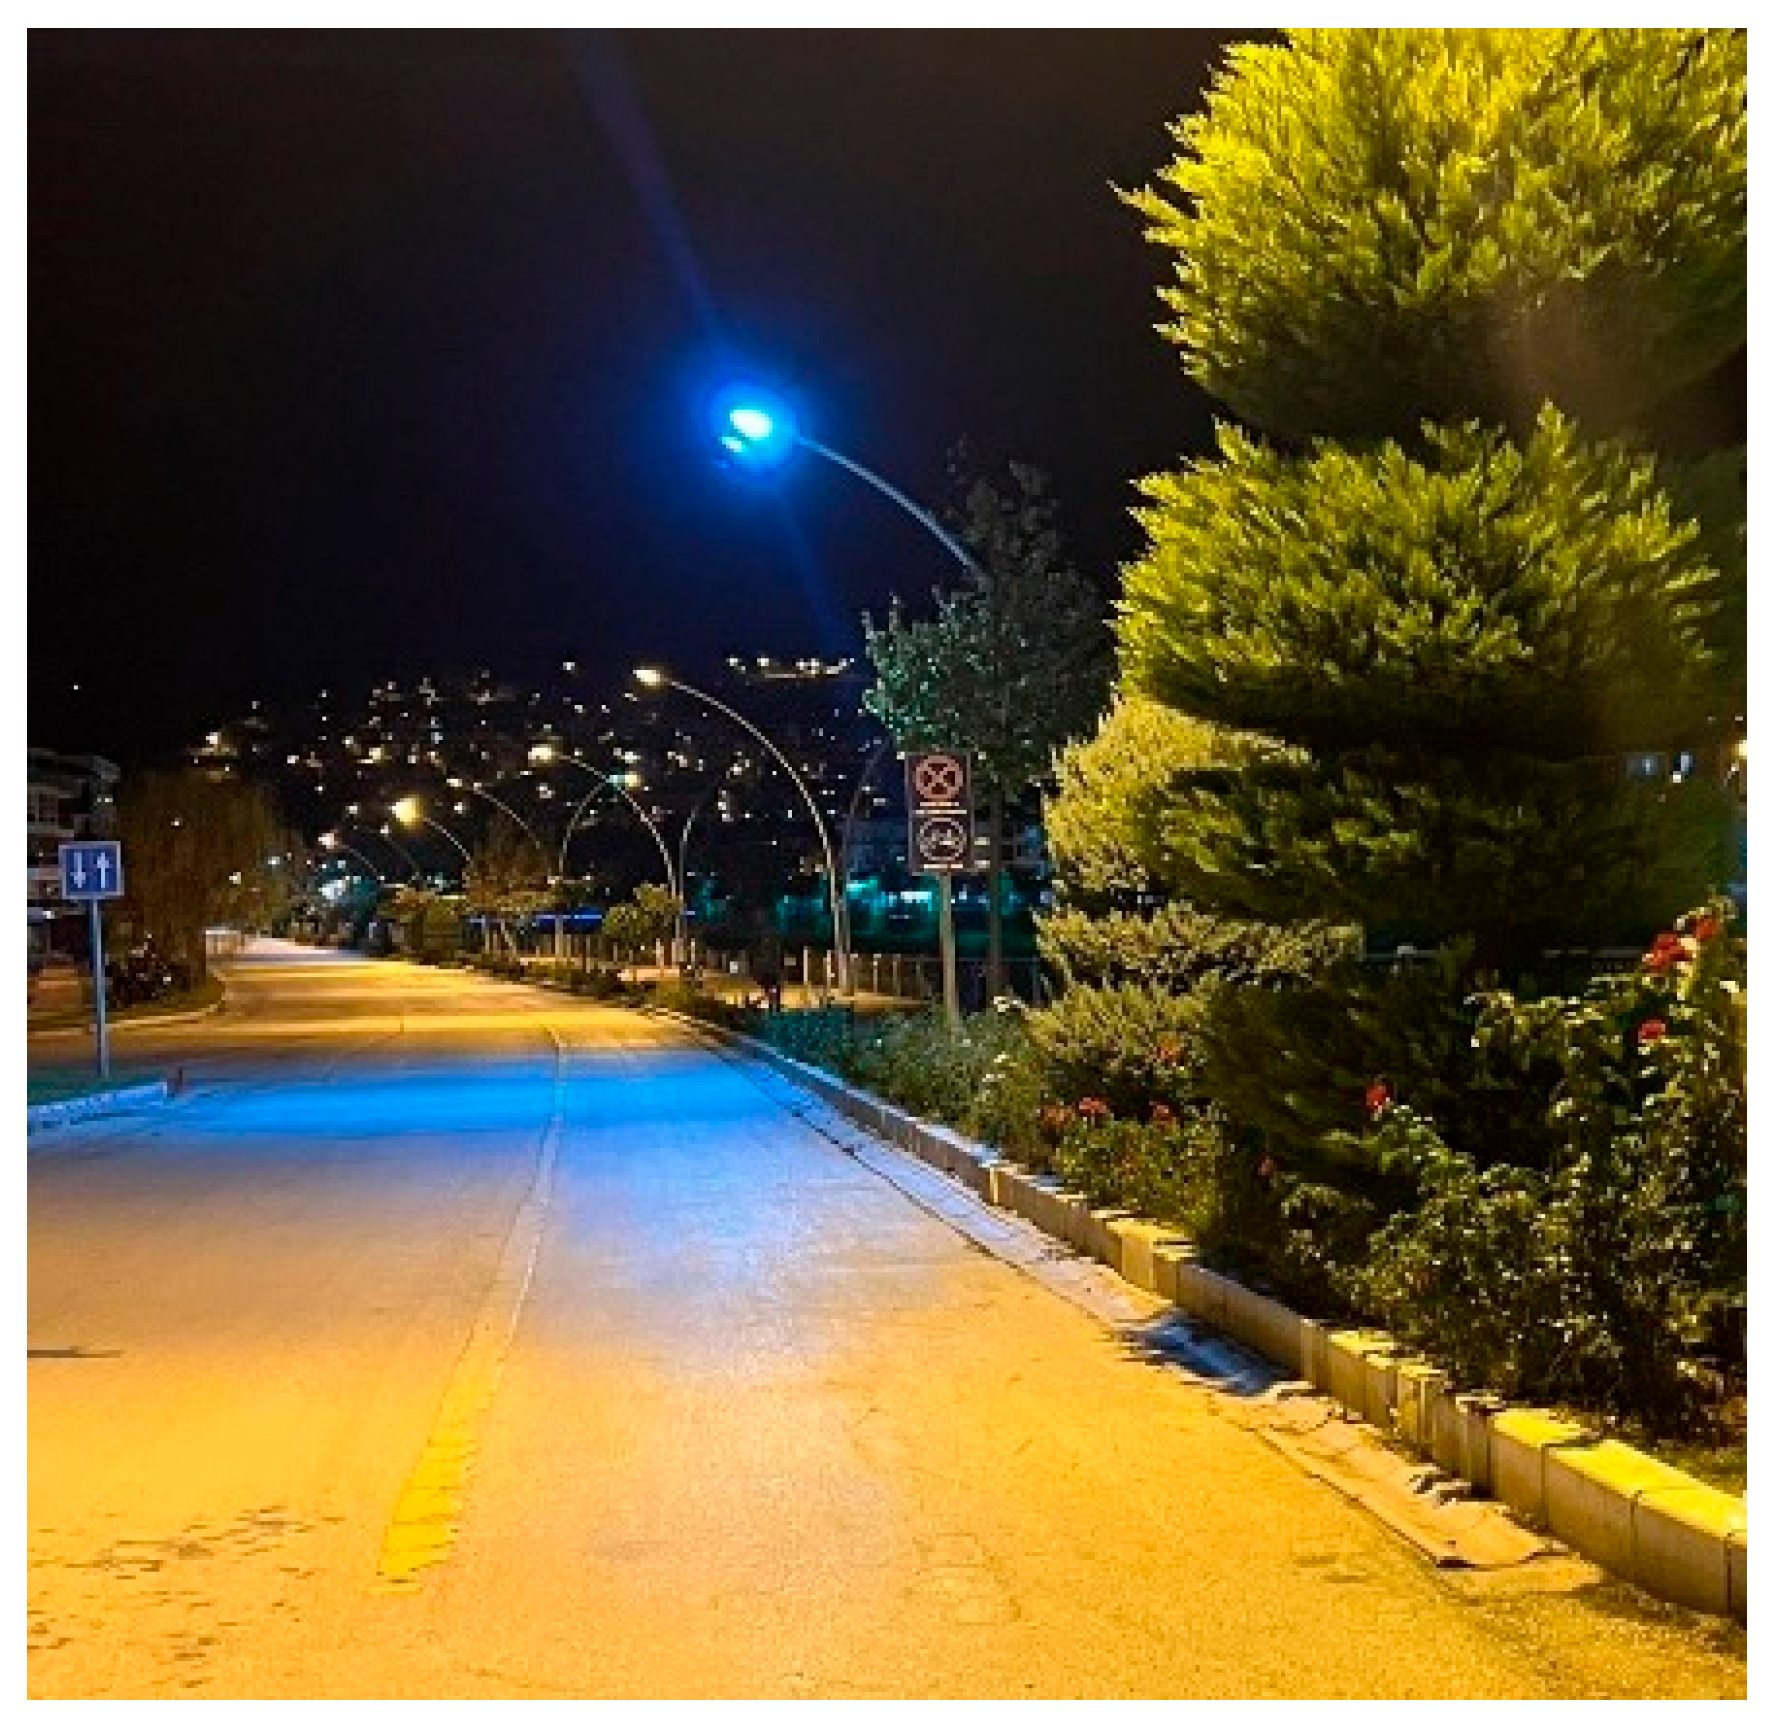

Table 2.1.
Number of questionnaires distributed in proportion to stratum sizes.
| Layer | Number of Subjects | Layer Weight | Stratum Sample Size |
|---|---|---|---|
| Nk | Wk=Nk/N | nk=Wk*N | |
| Faculty of Education | 1845 | W1=1845/3077 | n1=0,5996*300=180 |
| Faculty of Engineering | 411 | W2=411/3077 | n2=0,1336*300=40 |
| Faculty of Architecture | 409 | W3=409/3077 | n2=0,1329*300=40 |
| Faculty of Theology | 412 | W4=412/3077 | n2=0,1339*300=40 |
| Total | N=3077 | 1 | 300 |
Table 2.2.
Number of questionnaires administered according to the strata and groups selected in the sample area.
Table 2.2.
Number of questionnaires administered according to the strata and groups selected in the sample area.
| Groups | Sub Groups | Faculty Of Educatıon | Faculty Of Archıtecture | Faculty Of Engıneerıng | Faculty Of Theology | Total | ||||||||||
|---|---|---|---|---|---|---|---|---|---|---|---|---|---|---|---|---|
| Preschool Education | English Language Teaching | Classroom Teaching | Guidance and Psychological Counseling | Social Studies Teacher Education | Turkish Language Teaching | Elementary Mathematics Teaching | Science Teaching | Urban and Regional Planning | Urban Design and Landscape Architecture | Computer Engineering | Electrical and Electronics Engineering | Mechanical Engineering | ||||
| Class of Study | Grade 1 | 6 | 6 | 6 | 6 | 6 | 5 | 5 | 5 | 5 | 5 | 4 | 3 | 3 | 10 | 75 |
| Grade 2 | 6 | 6 | 6 | 6 | 6 | 5 | 5 | 5 | 5 | 5 | 4 | 3 | 3 | 10 | 75 | |
| Grade 3 | 6 | 6 | 6 | 6 | 6 | 5 | 5 | 5 | 5 | 5 | 4 | 3 | 3 | 10 | 75 | |
| Grade 4 | 6 | 6 | 6 | 6 | 6 | 5 | 5 | 5 | 5 | 5 | 4 | 3 | 3 | 10 | 75 | |
| Total | 180 | 40 | 40 | 40 | 300 | |||||||||||
Table 3.1.
Gender status of the respondents.
| What is your gender? | |||||
| Woman | Men | Total | |||
| Percent | Number | Percent | Number | Percent | Number |
| %63,4 | 190 | %36,6 | 110 | 100% | 300 |
Table 3.2.
Private vehicle ownership of the respondents.
| Do you have a private car? | |||||
| Yes | No | Total | |||
| Percent | Number | Percent | Number | Percent | Number |
| %8,4 | 25 | %91,6 | 275 | 100% | 300 |
Table 3.3.
Analysis of income status of the respondents.
| What is your income? | |||||||||||
| Less than 17.000 TL (Low) | 17.001-25.000 TL.(Medium-Low) | 25,001-33,000 TL (Medium) | 33,001-41,000 TL (Medium-High) | 41.001 TL.+ (High) | Total | ||||||
| Percent | Number | Percent | Number | Percent | Number | Percent | Number | Percent | Number | Percent | Number |
| %6,6 | 20 | %28,3 | 85 | %33,4 | 100 | 23,40% | 70 | %8,3 | 25 | 100% | 300 |
Table 3.4.
Effects of gender status on cycling.
| Values | Do you use a bicycle? | ||||||
| Yes | No | Total | P | ||||
| Percent | Number | Percent | Number | Percent | Number |
0,001 |
|
| Woman | %60,0 | 87 | %68,7 | 103 | %63,4 | 190 | |
| Men | %40,0 | 63 | %31,3 | 47 | %36,6 | 110 | |
| Total | 100,0% | 150 | 100,0% | 150 | 100,0% | 300 | |
Table 3.5.
The effect of income status on bicycle use.
| Values | Do you use a bicycle? | ||||||
| Yes | No | Total | P | ||||
| Percent | Number | Percent | Number | Percent | Number |
0,000 |
|
| Less than 17.000 | %8,6 | 13 | %4,6 | 7 | %6,6 | 20 | |
| 17.001.-25.000 | %34,0 | 51 | %22,6 | 34 | %28,3 | 85 | |
| 25.001-33.000 | %30,6 | 46 | %36,0 | 54 | %33,4 | 100 | |
| 33.001-41.000 | %22,6 | 34 | %24,0 | 36 | %23,4 | 70 | |
| 41.001+ | %7,3 | 11 | %9,3 | 14 | %8,3 | 25 | |
| Total | 100,0% | 150 | 100,0% | 150 | 100,0% | 300 | |
Table 3.6.
Distance traveled by bicycle according to faculty of study.
| What is the distance of your cycling journey? | |||||||||||||
| Faculties | Less than 3 km. | 3,01-6 km | 6,01-9 km | 9,01-12 km | 12,01 km.+ | Total | P | ||||||
| % | Number | % | Number | % | Number | % | Number | % | Number | % | Number | ||
| Education | %51,1 | 46 | %35,5 | 32 | %7,7 | 7 | %5,5 | 5 | %0,0 | 0 | 100,0% | 90 | 0,001 |
| Architecture | %40,0 | 10 | %32,0 | 8 | %20,0 | 5 | %8,0 | 2 | %0,0 | 0 | 100,0% | 25 | |
| Engineering | %45,0 | 9 | %30,0 | 6 | %15,0 | 3 | %10 | 2 | %0,0 | 0 | 100,0% | 20 | |
| Theology | %33,3 | 6 | %33,3 | 5 | %26,6 | 4 | %0 | 0 | %0,0 | 0 | 100,0% | 15 | |
| Total | %47,3 | 71 | %34,0 | 51 | %11,3 | 17 | %6,0 | 9 | %0,0 | 0 | 100,0% | 150 | |
Table 3.7.
Problems related to accessibility in bicycle use according to faculty of study.
| What is your level of participation in problems related to access while cycling? | ||||||||||
| Faculties | I agree | Undecided | Disagree | Total | P | |||||
| % | Number | % | Number | % | Number | % | Number | 0,011 | ||
| Lack of a bicycle path accessing the center | Education | %50,0 | 45 | %17,7 | 16 | %32,2 | 29 | 100,0% | 90 | |
| Architecture | %64,0 | 16 | %12,0 | 3 | %24,0 | 6 | 100,0% | 25 | ||
| Engineering | %65,0 | 13 | %15 | 3 | %20 | 4 | 100,0% | 20 | ||
| Theology | %53,3 | 8 | %13,3 | 2 | %33,3 | 5 | 100,0% | 15 | ||
| Total | %54,6 | 82 | %16,0 | 24 | %29,3 | 44 | 100,0% | 150 | ||
Table 3.8.
Comparative analysis of agreement with accessibility-related reasons for not using bicycles according to the faculty of study.
Table 3.8.
Comparative analysis of agreement with accessibility-related reasons for not using bicycles according to the faculty of study.
| What are the access-related reasons for not cycling? | ||||||||||
| Values | I agree | Undecided | Disagree | Total | P | |||||
| % | Number | % | Number | % | Number | % | Number | |||
| Since my destinations are far away | Education | %51,1 | 46 | %18,9 | 17 | %30,0 | 27 | %100,0 | 90 | 0,000 |
| Architecture | %53,3 | 8 | %20,0 | 3 | %26,6 | 4 | %100,0 | 15 | ||
| Engineering | %60,0 | 12 | %15,0 | 3 | %25,0 | 5 | %100,0 | 20 | ||
| Theology | %28,0 | 7 | %8,0 | 2 | %64,0 | 16 | %100,0 | 25 | ||
| Total | %48,7 | 73 | %16,7 | 25 | %34,6 | 52 | %100,0 | 150 | ||
| Lack of bicycle lanes, lanes and continuity of existing roads | Education | %36,7 | 33 | %30,0 | 27 | %33,3 | 30 | %100,0 | 90 | 0,000 |
| Architecture | %66,6 | 10 | %13,3 | 2 | %20,0 | 3 | %100,0 | 15 | ||
| Engineering | %30,0 | 6 | %25,0 | 5 | %45,0 | 9 | %100,0 | 20 | ||
| Theology | %20,0 | 5 | %32,0 | 8 | %48,0 | 12 | %100,0 | 25 | ||
| Total | %36,0 | 54 | %28,0 | 42 | %36,0 | 54 | %100,0 | 150 | ||
| Lack of a bicycle path accessing the city center | Education | %38,9 | 35 | %30,0 | 27 | %31,1 | 28 | %100,0 | 90 | 0,001 |
| Architecture | %60,0 | 9 | %20,0 | 3 | %20,0 | 3 | %100,0 | 15 | ||
| Engineering | %35,0 | 7 | %35,0 | 7 | %30,0 | 6 | %100,0 | 20 | ||
| Theology | %20,0 | 5 | %20 | 5 | %60,0 | 15 | %100,0 | 25 | ||
| Total | %37,3 | 56 | %28,0 | 42 | %34,7 | 52 | %100,0 | 150 | ||
Table 3.9.
Level of agreement with health-related reasons for preferring cycling.
| What are your views on the health and safety aspects of cycling? | ||||||||
| Values | I agree | Undecided | Disagree | Total | ||||
| % | Number | % | Number | % | Number | % | Number | |
| I use a bicycle because I can do sports | %77,4 | 116 | %12,0 | 18 | %10,6 | 16 | %100,0 | 150 |
Table 3.10.
Participation in health and safety problems encountered while cycling according to the faculty of study.
Table 3.10.
Participation in health and safety problems encountered while cycling according to the faculty of study.
| What are the health and safety related problems you experience while cycling? | ||||||||||
| Values | I agree | Undecided | Disagree | Total | P | |||||
| % | Number | % | Number | % | Number | % | Number | |||
| Pedestrians using bicycle lanes | Education | %37,7 | 34 | %27,7 | 25 | %34,4 | 31 | %100,0 | 90 | 0,000 |
| Architecture | %72,0 | 18 | %24,0 | 6 | %4,0 | 1 | %100,0 | 25 | ||
| Engineering | %65,0 | 13 | %20,0 | 4 | %15,0 | 3 | %100,0 | 20 | ||
| Theology | %53,4 | 8 | %40,0 | 6 | %6,6 | 1 | %100,0 | 15 | ||
| Total | %48,6 | 73 | %27,3 | 41 | %24,0 | 36 | %100,0 | 150 | ||
| Negative behavior of pedestrians towards cyclists | Education | %45,5 | 41 | %32,2 | 29 | %22,2 | 20 | %100,0 | 90 | 0,000 |
| Architecture | %72,0 | 18 | %16,0 | 4 | %12 | 3 | %100,0 | 25 | ||
| Engineering | %55,0 | 11 | %25,0 | 5 | %20,0 | 4 | %100,0 | 20 | ||
| Theology | %60,0 | 9 | %20,0 | 3 | %20,0 | 3 | %100,0 | 15 | ||
| Total | %52,6 | 79 | %27,3 | 41 | %20,0 | 30 | %100,0 | 150 | ||
| Negative behavior of vehicle drivers | Education | %38,8 | 35 | %32,2 | 29 | %28,8 | 26 | %100,0 | 90 | 0,000 |
| Architecture | %64,0 | 16 | %24 | 6 | %12 | 3 | %100,0 | 25 | ||
| Engineering | %75,0 | 15 | %15,0 | 3 | %10,0 | 2 | %100,0 | 20 | ||
| Theology | %53,4 | 8 | %33,3 | 5 | %13,3 | 2 | %100,0 | 15 | ||
| Total | %49,3 | 74 | %28,7 | 43 | %30,0 | 33 | %100,0 | 150 | ||
Table 3.11.
Transit status of bicycle users during their journeys.
| Do you transfer when cycling? | |||||
| Yes | No | Total | |||
| % | Number | % | Number | % | Number |
| %17,3 | 26 | %82,7 | 124 | %100,0 | 150 |
Table 3.12.
Type of transportation preferred by bicycle users for connecting trips.
| When you cycle, how often do you use which mode of transportation for your connecting journeys? | |||||||||
| Values | Frequently | Sometimes | Never | Total | P | ||||
| % | Number | % | Number | % | Number | % | Number |
0,001 |
|
| Bus/Minibus | %69,3 | 18 | %15,3 | 4 | %15,3 | 4 | %100,0 | 26 | |
| Special Vehicle | %30,7 | 8 | %38,4 | 10 | %34,6 | 9 | %100,0 | 26 | |
| Other | %50,0 | 13 | %30,7 | 8 | %19,2 | 5 | %100,0 | 26 | |
Table 3.13.
Analysis of transferring while cycling according to the faculty of education.
| Do you transfer when cycling? | |||||||
| Faculties | Yes | No | Total | P | |||
| % | Number | % | Number | % | Number | ||
| Education | %17,7 | 16 | %82,2 | 74 | %100,0 | 90 | 0,000 |
| Architecture | %28,0 | 7 | %72,0 | 18 | %100,0 | 25 | |
| Engineering | %15,0 | 3 | %85,0 | 17 | %100,0 | 20 | |
| Theology | %0,0 | 0 | %100,0 | 15 | %100,0 | 15 | |
| Total | %17,3 | 26 | %82,6 | 124 | %100,0 | 150 | |
Table 3.14.
Analysis of the individual responsibility influencing the preference for cycling.
| What are your views on individual responsibility in choosing to use bicycles? | |||||||||
| Values | I agree | Undecided | Disagree | Total | P | ||||
| % | Number | % | Number | % | Number | % | Number | 0,002 | |
| Because it is economical | %52,6 | 79 | %16,6 | 25 | %30,6 | 46 | %100,0 | 150 | |
| Because it is environmentally friendly | %46,0 | 69 | %20,6 | 31 | %33,3 | 50 | %100,0 | 150 | |
| Since my journey was short | %36,0 | 54 | %15,0 | 18 | %52,0 | 78 | %100,0 | 150 | |
Table 3.15.
Analysis of the preference for cycling according to the faculty of study.
| What are your views on individual responsibility in choosing to use bicycles? | ||||||||||
| Faculties | I agree | Undecided | Disagree | Total | P | |||||
| % | Number | % | Number | % | Number | % | Number | |||
| Because it is economical | Education | %50,0 | 45 | %11,1 | 10 | %38,9 | 35 | %100,0 | 90 | 0,000 |
| Architecture | %60,0 | 15 | %20,0 | 5 | %20,0 | 5 | %100,0 | 25 | ||
| Engineering | %70,0 | 14 | %10,0 | 2 | %20,0 | 4 | %100,0 | 20 | ||
| Theology | %33,3 | 5 | %33,3 | 5 | %33,3 | 5 | %100,0 | 15 | ||
| Total | %52,6 | 79 | %16,6 | 25 | %30,8 | 46 | %100,0 | 150 | ||
| Because it is environmentally friendly | Education | %61,1 | 55 | %18,9 | 17 | %20,0 | 18 | %100,0 | 90 | 0,001 |
| Architecture | %80,0 | 20 | %20,0 | 5 | %0,0 | 0 | %100,0 | 25 | ||
| Engineering | %50,0 | 10 | %30,0 | 6 | %20,0 | 4 | %100,0 | 20 | ||
| Theology | %46,7 | 7 | %20,0 | 3 | %13,3 | 2 | %100,0 | 15 | ||
| Total | %46,0 | 69 | %20,7 | 31 | %33,3 | 50 | %100,0 | 150 | ||
| Since my journey was short | Education | %60,0 | 54 | %16,6 | 15 | %23,4 | 21 | %100,0 | 90 | 0,002 |
| Architecture | %60,0 | 15 | %20,0 | 5 | %20,0 | 5 | %100,0 | 25 | ||
| Engineering | %45,0 | 9 | %15,0 | 3 | %40,0 | 8 | %100,0 | 20 | ||
| Theology | %40,0 | 6 | %20,0 | 3 | %40,0 | 6 | %100,0 | 15 | ||
| Total | %36,0 | 54 | %12,0 | 18 | %52,0 | 78 | %100,0 | 150 | ||
Table 3.16.
Duration of bicycle use table.
| How long have you been cycling? | ||||||||||||
| Values | 0-5 years | 6-10 years | 11-15 years | 16-20 years | 21 years and above | Total | ||||||
| % | Number | % | Number | % | Number | % | Number | % | Number | % | Number | |
| %30,0 | 45 | %26,6 | 40 | %23,3 | 35 | %15,3 | 23 | %4,6 | 7 | %100 | 150 | |
Table 3.17.
The status of bicycle trip purposes according to the faculty of study.
| For what purpose do you use bicycles? | ||||||||||
| Faculties | Frequently | Sometimes | Never | Total | P | |||||
| % | Number | % | Number | % | Number | % | Number | |||
| Socio-cultural | Education | %72,2 | 65 | %16,7 | 15 | %11,1 | 10 | %100,0 | 90 | 0,000 |
| Architecture | %68,0 | 17 | %20,0 | 5 | %20,0 | 3 | %100,0 | 25 | ||
| Engineering | %50,0 | 10 | %25,0 | 5 | %25,0 | 5 | %100,0 | 20 | ||
| Theology | %26,6 | 4 | %33,4 | 5 | %40,0 | 6 | %100,0 | 15 | ||
| Total | %64,0 | 96 | %20,0 | 30 | %16,0 | 24 | %100,0 | 150 | ||
| Other | Education | %43,3 | 39 | %23,3 | 21 | %33,3 | 30 | %100,0 | 90 | 0,000 |
| Architecture | %60,0 | 15 | %24,0 | 6 | %16,0 | 4 | %100,0 | 25 | ||
| Engineering | %50,0 | 10 | %25,0 | 5 | %25,0 | 5 | %100,0 | 20 | ||
| Theology | %40,0 | 6 | %26,6 | 4 | %33,4 | 5 | %100,0 | 15 | ||
| Total | %46,6 | 70 | %24,0 | 36 | %29,3 | 44 | %100,0 | 150 | ||
Table 3.18.
Bicycle use according to climatic conditions.
| How often do you use bicycles according to climatic conditions? | ||||||||
| Values | I use | I am undecided | I do not use | Total | ||||
| % | Number | % | Number | % | Number | % | Number | |
| Rainy days | %28,0 | 42 | %34,6 | 52 | %37,3 | 56 | %100,0 | 150 |
| On cold days | %34,6 | 52 | %28,0 | 42 | %37,3 | 56 | %100,0 | 150 |
| Snowy days | %6,0 | 9 | %14,0 | 21 | %80,0 | 120 | %100,0 | 150 |
| Foggy days | %5,3 | 8 | %10,0 | 15 | %84,6 | 127 | %100,0 | 150 |
| Sunny days | %90,0 | 135 | %6,6 | 10 | %3,3 | 5 | %100,0 | 150 |
Table 3.19.
The situation of the reasons related to cultural values and habits that are effective in not using bicycles according to the faculty of study.
Table 3.19.
The situation of the reasons related to cultural values and habits that are effective in not using bicycles according to the faculty of study.
| What are the reasons for not using bicycles related to cultural values and habits? | ||||||||||
| Values | Faculties | I agree | Undecided | Disagree | Total | P | ||||
| % | Number | % | Number | % | Number | % | Number | |||
| In case of public shame (social pressure) | Education | %43,3 | 39 | %22,2 | 20 | %34,4 | 31 | %100,0 | 90 | 0,000 |
| Architecture | %20,0 | 3 | %46,6 | 7 | %33,3 | 5 | %100,0 | 15 | ||
| Engineering | %10,0 | 2 | %75,0 | 15 | %15,0 | 3 | %100,0 | 20 | ||
| Theology | %80,0 | 20 | %8,0 | 2 | %12,0 | 3 | %100,0 | 25 | ||
| Total | %42,6 | 64 | %29,3 | 44 | %28,0 | 42 | %100,0 | 150 | ||
| Due to unfavorable climatic conditions | Education | %38,8 | 35 | %22,2 | 20 | %38,8 | 35 | %100,0 | 90 | 0,001 |
| Architecture | %46,6 | 7 | %20,0 | 3 | %33,3 | 5 | %100,0 | 15 | ||
| Engineering | %40,0 | 8 | %35,0 | 7 | %25,0 | 5 | %100,0 | 20 | ||
| Theology | %32,0 | 8 | %32,0 | 8 | %36,0 | 9 | %100,0 | 25 | ||
| Total | %38,6 | 58 | %25,3 | 38 | %36,0 | 54 | %100,0 | 150 | ||
Table 3.20.
Type of transportation preferred by non-cyclists for their daily trips.
| What is the type of transportation you use for your daily journeys and how often do you use it? | ||||||||
| Values | Frequently | Sometimes | Very Rare | Total | ||||
| % | Number | % | Number | % | Number | % | Number | |
| Pedestrian | %48,6 | 73 | %34,6 | 52 | %16,6 | 25 | %100,0 | 150 |
| Automobile | %4,6 | 7 | %18,0 | 27 | %77,3 | 116 | %100,0 | 150 |
| Bus/minibus | %57,3 | 86 | %36,0 | 54 | %9,3 | 14 | %100,0 | 150 |
| Other | %22,0 | 33 | %30,0 | 45 | %48,0 | 72 | %100,0 | 150 |
Table 3.21.
Reasons related to cultural values and habits that are effective in not using bicycles by gender.
Table 3.21.
Reasons related to cultural values and habits that are effective in not using bicycles by gender.
| What are the reasons for not using bicycles related to cultural values and habits? | ||||||||||
| Values | Cinsiyet | I agree | Undecided | Disagree | Total | P | ||||
| % | Number | % | Number | % | Number | % | Number | |||
| I don't know how to ride a bike | Woman | %37,8 | 39 | %4,8 | 5 | %57,2 | 59 | %100,0 | 103 | 0,002 |
| Man | %21,2 | 10 | %4,2 | 2 | %74,4 | 35 | %100,0 | 47 | ||
| Total | %32,6 | 49 | %4,6 | 7 | %62,6 | 94 | %100,0 | 150 | ||
| I don't have a bicycle | Woman | %23,3 | 24 | %0,0 | 0 | %76,6 | 79 | %100,0 | 103 | 0,001 |
| Man | %21,2 | 10 | %0,0 | 0 | %78,7 | 37 | %100,0 | 47 | ||
| Total | %22,6 | 34 | %0,0 | 0 | %78,6 | 118 | %100,0 | 150 | ||
| In case of public shame (social pressure) | Woman | %55,3 | 57 | %9,7 | 10 | %40,7 | 42 | %100,0 | 103 | 0,000 |
| Man | %78,7 | 37 | %4,8 | 5 | %4,8 | 5 | %100,0 | 47 | ||
| Total | %62,7 | 94 | %10,0 | 15 | %31,3 | 47 | %100,0 | 150 | ||
Disclaimer/Publisher’s Note: The statements, opinions and data contained in all publications are solely those of the individual author(s) and contributor(s) and not of MDPI and/or the editor(s). MDPI and/or the editor(s) disclaim responsibility for any injury to people or property resulting from any ideas, methods, instructions or products referred to in the content. |
© 2025 by the authors. Licensee MDPI, Basel, Switzerland. This article is an open access article distributed under the terms and conditions of the Creative Commons Attribution (CC BY) license (http://creativecommons.org/licenses/by/4.0/).
Copyright: This open access article is published under a Creative Commons CC BY 4.0 license, which permit the free download, distribution, and reuse, provided that the author and preprint are cited in any reuse.


