
Submitted:
23 May 2025
Posted:
23 May 2025
You are already at the latest version
Abstract
The article is devoted to the issues of signal detection in a radio communication system. As a rule, such tasks are solved in two ways – adaptive and nonparametric. The adaptive method is to adjust the structure and parameters of the detection system in accordance with the parameters of signals and noise. Nonparametric methods are used when it is necessary to ensure that the system is insensitive to changes in the properties of signals and noise, in particular in the absence of a priori information about the probabilistic properties of the measured signals and noise. Nonparametric methods of signal detection are based on the use of nonparametric methods of statistical hypothesis testing theory. Nonparametric methods are effectively used in radio electronic systems due to the need to stabilize the frequency of false alarms with unknown noise properties. The invariant properties of nonparametric procedures are based on the independence of the statistical properties of nonparametric functions from the statistical properties of the measured signals. One of the most effective nonparametric methods is the use of ranks, which are formed as a result of ranking the input samples of the measured signal either in ascending or descending order. Ranks have many useful properties for practice and are the most suitable for the purposes of forming various statistical hypotheses. The article is devoted to the criterion of post-detector rank signal processing based on minimizing the RMS error of measuring the situation parameter. The article considers the noise immunity of this criterion in comparison with optimal rank detection methods based on the Neumann -Pearson criterion.
Keywords:
Signal detection
; nonparametric methods
; ranks
; statistical hypotheses
; Neumann-Pearson criterion
1. Introduction
The task of detecting signals in radio engineering systems is, as a rule, to measure the informative parameters of the signal and resolve the signal against the background of noise. In this case, the structure of the input information can be represented by Figure 1, where the following designations are adopted: – signal sensor, – input signal amplifier, – analog-to-digital converter, – computing system, - input signal, - external noise distorting the signal, – additional noise introduced by the equipment during the conversion.
External noise , which distorts the input signal, can be eliminated based on statistical differences between the noise and a mixture of the input signal and noise .
Currently, quite a lot of work is devoted to the issues of signal detection against the background of noise. For example, an adaptive signal detection and carrier frequency offset (CFO) estimation method based on a virtual array is proposed in this [1]. This is a data-aided method that utilizes a training sequence composed of three segments of sub-training sequences with different symbols. This method first uses spatial spectrum estimation to obtain the coarse frequency estimations of interference signals and CFO from virtual array signals constructed from the first two sub-training sequences. Then, beamforming is conducted accordingly on the virtual array signals constructed from the third sub-training sequence to suppress the in-band interferences and protrude the expected signal. Finally, improved performance of signal detection and CFO estimation is obtained with the beamformed signals. In [2], to solve the problem of reducing the noise level of radio signals, a radio communication signal denoising method based on the relativistic average generative adversarial networks (RaGAN) is proposed. This method combines the bidirectional long short-term memory (Bi-LSTM) model, which is good at processing time-series data with RaGAN, and uses the weighted loss function to construct a noise reduction model suitable for radio communication signals, which realizes the end-to-end denoising of radio signals. There are papers dealing with noise abatement in a narrow subject area. Thus, the work [3] is devoted to the study of interference detection in the wireless communication system of railway transport. In this paper, the fourth-order cyclic cumulant (FOCC) of signals with different modulation modes is analyzed for the narrow-band wireless communications system of rail transit. Based on the analysis results, an adjacent-frequency interference detection algorithm is proposed according to the FOCC of the received signal within the predetermined cyclic frequency range. To detect interference with the same carrier frequency, a same frequency interference detection algorithm using the relationship between the FOCC and the received power is proposed. For example, work [4] considers the detection of underwater acoustic signals against the background of non-stationary sea noise. This article discusses a new effective approach to the problem of signal detection against background noise based on a nonlinear residual functional called the neuron-like criterion function (NCF). A detailed comparison of the NCF-based technique and the conventional correlation criterion function (CCF)-based matched-signal detection is performed. approach to the problem of detecting a signal against a background of noise. It is also possible to pay attention to the work [5], which considers an adaptive feedback-controlled signal detection scheme for diffusion-based molecular communication systems. This paper proposes a simple and practical method that enables receiver nanomachines to automatically estimate signal detection times according to the measured molecular concentrations and weighted feedback errors.
In contrast to the listed works, this article is devoted to nonparametric methods of signal detection, the use of which is advisable when the statistical parameters of noise are a priori unknown [6,7,8].
Nonparametric signal detection methods in radio communication systems were first used to minimize the likelihood of accepting a false hypothesis about the presence of a signal in the receiving path. In this regard, in the literature, nonparametric methods are understood to be methods of minimizing the level of false alarms in the absence of a priori information about the statistical characteristics of noise.
The insensitivity (invariance) of nonparametric procedures to the statistical properties of noise is achieved by converting the observed sample data to quantities whose statistical properties are known in advance and do not depend on the probabilistic characteristics of the observed data. For example, in radio reception technology, to combat the level instability of noise [9,10,11], the conversion of the input signal into the so-called sign function is widely used. The essence of the sign function is to convert the signal samples observed at the input of the radio receiver into a sequence of zeros and ones, depending on the sign of the conversion, the appearance of which is equally likely if only the distribution of the input samples is symmetrical with respect to the restriction level.
The procedure for ranking input samples has the broadest invariant properties, which converts them into a sequence of integers - ranks depending on the relative position of this sample in the ranked series of the entire observed population. Ranks have many properties useful for practice, and the theory of rank procedures is most deeply developed compared to nonparametric methods of other classes and is best prepared for practical implementation.
There are a number of fundamental monographs and reference books in the field of rank signal processing [12], the bibliography of journal articles [13] has hundreds of titles. The methods of rank detection of signals are divided into pre-detector and post-detector [14]. Post-detector detectors are much simpler in terms of technical implementation. However, the disadvantage of the post-detector ranking method is the small volume of ranked samples, which reduces the noise immunity of detection compared to optimal methods. Therefore, consideration of the issues of noise immunity of post-vector rank information processing is an urgent task.
2. Method
The detection task allows us to interpret the data at the input of the detection system as a random array of sample data with certain statistical properties. The randomness of the array is due to the very physical nature of the observed quantities (electromagnetic field strength, sound pressure, light flux), the effects of extraneous random noise, as well as measurement errors or transformations of physical quantities, noise from receiving and amplifying devices, etc. Based on a priori information about the properties of the array of sample values of in situations of absence and presence of a signal, the null and alternative statistical hypotheses are formulated, respectively, i.e. some assumptions about the form of probability distributions of .
Depending on the degree of concretization of these assumptions and the accepted quality criterion, statistics , i.e. some functionality from the input data, and a threshold constant (threshold) are selected [15]. The decision is made by comparing the value of obtained for this particular implementation of the array with the threshold of . If ≥ , then a decision is made in favor of an alternative hypothesis, about the presence of a signal, in the opposite case, in favor of the null hypothesis, i.e. about the absence of a signal. Thus, the detection system must contain a statistics calculator and a threshold device.
The result of the detection system can generally be interpreted as an estimate of of some formal parameter , equal to 0 in the absence of a signal, and equal to 1 in its presence [16]. Due to the presence of random noise measured value of does not always coincide with the true value of , but only with some probability, which, when =1 and =1 is called the probability of correct detection , and when =1 and = 0, the probability of false alarm . The parameters and fully characterize the performance of the detection system, which is the higher the smaller and more . They usually strive to organize the decision–making procedure in such a way that the value of does not exceed the pre-agreed standard level , and the value of is possibly the maximum (the so-called Neumann-Pearson criterion [17]). The values of and depend on the type of statistics . The possibility of optimal choice of is determined by the completeness and reliability of a priori information about the properties of the distributions of the array of sample values of . Depending on the level of detail of this information, various statistical processing methods are used – optimal, adaptive, and nonparametric.
Nonparametric methods [18,19] are used when the functional type of the input data distribution is unknown, and only the most general differences between the situations of presence and absence of a signal are specified.
Almost all nonparametric detection systems contain devices as a component element that perform some invariant transformation of an array of sample values . The result of the transformation is a new array , the distribution of the elements of which, in the absence of a signal ( = 0), is exactly known. The transformation makes it possible to reduce the problem of detecting a signal against the background of noise with an unknown distribution to the problem of testing a simple hypothesis regarding the distribution of the array. Accordingly, the synthesis of nonparametric detection systems is performed in two steps: on the first, the type of invariant transformation is chosen, on the second, the method of processing the transformed data. The simplest and well-known example of such a transformation is the sign statistics [20]
If the symmetry hypothesis is correct, then it is not difficult to verify that the appearance of ones and zeros at the output of the limiter (1) is equally likely, i.e.
Therefore, transformation (1) translates an array with an arbitrary distribution symmetric relative to the zero level into a new array with a uniform distribution regardless of the specific type of the initial distribution. If the symmetry of the distribution is violated when a signal appears, then the detection problem can be formulated as a test of a null hypothesis (2) against an alternative hypothesis.
The optimal solution to this problem is the sign criterion [21,22,23], which prescribes the summation of the signs of the sample elements.
and comparing the accumulated value with the threshold. Statistics (3) represents the number of successes in a series of n independent experiments, i.e. it obeys a binomial distribution, and in the absence of a signal, the probability of success is 1/2, and in the presence of a signal, it is more than 1/2. Thus, statistic (3) satisfies the two above requirements: at , its distribution is precisely known and unchanged, whatever the initial symmetric distribution , and at , the distribution of statistic (3) is sensitive to the presence of a signal.
If the initial sample is ordered by magnitude, then a so-called variation series is formed, in which is the smallest element of the sample; is the second largest element; is the - th largest element; is the maximum element, while
The random variable is called the - th ordinal statistic and its invariant property is that as the sample size increases, the value converges in probability to the quantile of the level regardless of the type of distribution of the initial sample [24,25].
The rank of the -th element , an array of sample values , is the ordinal number of this element in the variation series, i.e.
Formally, the rank calculation procedure can be represented as
The set of ranks { of all the elements of the sample forms a certain permutation of integers from 1 to . According to the hypothesis of randomness, all such permutations are equally probable. Therefore, regardless of the specific distribution law of the initial sample , the joint distribution of ranks { is uniform:
According to the classical theory of signal detection [26], the array of sample values must be supplemented with an array . In the theory of radiolocation, sample values of are usually referred to as a signal sample containing information about the signal. The sample is called a reference or noise sample and coincides in its properties with the sample in the absence of a signal.
In this regard, the first stage of synthesis of rank detectors is reduced to the organization of arrays and . Usually, the elements of sample arrays are voltage samples at the output of signal sensors, followed by sampling with a certain interval . The set of discrete samples formed in this way forms the set , which is the initial one for the formation of all sample arrays. From the set , it is necessary to select a signal sample , which is formed for each resolution cell according to the informative parameters of the signal. In accordance with the principles of radiolocation, a resolution cell is an area in the signal parameter space, the center of which corresponds to the settings of a given detection channel, and the dimensions along the coordinate axes correspond to the dimensions of the uncertainty zones according to the corresponding parameters [27]. Array , like array , is formed from elements of the set , however, unlike , array can include elements related to different resolution cells.
Then, instead of expression (6), we obtain the following definition of ranks
Obviously, with such a rank determination, any change in the distribution of sample compared to sample leads to a deviation in the distribution of ranks from a uniform one.
The structure of post-detector rank processing can be conventionally represented in the form of the following blocks (Figure 2): - is a preprocessing unit, - is a sampling unit, - is a ranking unit, - is a ranking statistics calculation unit, - is a threshold device; - is a random array of sample data, - is an array of ranks obtained after random ordering an array of sample data, - is some rank statistics.
The S (sampling unit) provides the preparation of the initial data for rank processing: signal samples and reference samples , related to the checked resolution cell based on the informative parameters of the received signal. The source material for the formation of samples and is the sequence of samples at the output of the signal preprocessing unit . The sample includes samples with numbers , where is a set containing elements and corresponding to the numbers of the signal samples of the resolution cell. The sample includes samples with numbers , where is a set containing m elements and corresponding to the numbers of the reference samples of the resolution cell and the signal sample.
The type of a particular ranking algorithm depends on the relationship between the sets and or the equivalent relationship between the sets and . Therefore, in post-detector rank detectors , since ranking without reference samples is unacceptable.
The choice of the composition of the reference sample is determined by a priori information about the properties of noise. We will not describe the principles of selecting reference samples here, as they are described in detail in textbooks on radiolocation. Note that for any methods of forming a reference sample, the condition of statistical uniformity of its elements must be fulfilled [28,29]. Due to the limited quasi-uniformity intervals of noise, the volumes of reference samples are usually small and lie within [E], which causes difficulties in setting low false alarm levels . These difficulties are caused by the discrete nature of the ranks, which, in turn, leads to the discreteness of rank statistics. Therefore, the threshold level with which the rank statistics are compared to make a decision about the presence of a signal cannot take arbitrary values, but is limited from above by the maximum value of the rank statistics. The maximum threshold value corresponds to the minimum achievable non-zero false alarm level . You can write it down
Therefore, the lower the required false alarm level, the higher the values of and .
3. Theories
The problem of signal detection can be formulated as a test of two hypotheses: a null hypothesis that the distribution of ranks is uniform, and an alternative hypothesis about a violation of the uniformity of the distribution of ranks when a signal appears. With this formulation of the problem, further processing can be performed based on the well-known Neumann-Pearson criterion. Processing according to this criterion is reduced to calculating the likelihood ratio of the ranks to test the hypothesis against the alternative hypothesis :
where ) is the probability distribution of the ranks.
Rank independence allows us to write the following expression
Since any monotone likelihood ratio function has optimal properties, then prolog expression (11), we obtain
where
Optimal signal detection can also be performed based on other quality criteria. The choice of criterion depends on the possibility of performing specific calculations and the ease of use of optimal detection results. In contrast to the classical Neumann-Pearson criterion, which consists in maximizing the probability of correct detection of at a fixed false alarm level , we can use the criterion for minimizing the RMS error of measuring the situation parameter, which we will call the – criterion.:
where is the symbol of mathematical expectation.
The function can be calculated in advance and stored in a long-term storage device (ROM). Then the optimal rank processing is reduced to extracting the value from the ROM at address and accumulating these values for all .
First of all, it is necessary to specify the class of processing algorithms within which we will search for the optimal one. For the reasons mentioned above, algorithms similar in structure to algorithm (12), but not tied to a specific ranking method, are a suitable class [30]. The type of nonlinear transformation in these algorithms is found using the – criterion. To do this, we represent the function by an l - th degree polynomial in R:
where is a one–dimensional moment of the ranks of the - th order.
Then the problem is reduced to optimizing the coefficient matrix by minimizing the functional
which is obtained from expression (14) after substituting statistics (12) with the function of the form (15) instead of . Varying this functional by and assuming the events and to be equally probable, we obtain a system of linear algebraic equations with respect to the coefficients :
or after statistical averaging, we get
where ( is the two–dimensional moment of the ranks.
In the solution of the given system, we do not need to provide an a priori unknown signal-to-noise ratio. It is difficult to get pregnant, it is a preposition, it is a sign of the weak. This is how it is allowed to apply and to use the criterion of Neumann-Pearson. In this case, the system (14) has the form:
If the signal sample is statistically homogeneous, then the moments of the ranks do not depend on the reference number. Then the coefficients are independent of and the system of equations (25) is significantly simplified:
Thus, rank processing according to the - criterion consists in calculating the moments of ranks from the first to the - th order, calculating the coefficients of the systems of equations (16) or (17) and solving these equations relative to . Based on the values of . found, the function table (15) is calculated, which is then used in rank processing.
4. Simulation Studies
The use of rank processing algorithms often encounters difficulties due to either purely technical reasons (the inability to perform calculations, the cumbersomeness of the results obtained), or reasons of a fundamental nature, for example, the dependence of the structure of optimal processing algorithms on an a priori unknown signal-to-noise ratio. Any attempts to overcome these difficulties are associated with the need to move away from strict optimality and, consequently, with some loss of detection efficiency.
An exhaustive characteristic of the detector's effectiveness is the relationship linking the probability of correct detection , the false alarm level , and the signal-to-noise ratio . However, it is usually not possible to obtain accurate mathematical expressions for the probabilities and α of rank detectors due to the non-linearity of the ranking procedure and subsequent rank processing. Therefore, approximate methods for determining and are used: Gaussian approximation and statistical modeling.
The first method is based on the central limit theorem, according to which, for large sample sizes, the distribution of many rank statistics can be approximated by a normal law. In this case, the relationship between the probabilities of correct detection and false alarm is described by a simple relation
where and are the mathematical expectation and variance of the rank statistics in the situation ; is the Laplace integral, the function is the inverse function of .
However, not all rank statistics (for example, optimal rank statistics or a rank code detector) are asymptotically normal. In addition, the sample sizes used in ranked detection systems are usually small. Therefore, the Gaussian approximation of their distributions turns out to be too rough. It should also be noted that calculating even the first two moments of rank statistics is in many cases a difficult and not always solvable task. Therefore, additional simplifying assumptions are often resorted to, in particular, the signal is considered weak [31,32].
The statistical modeling method is free from these disadvantages [33]. However, it is very time-consuming when estimating low false alarm levels. Therefore, we can propose an algorithm for calculating the probabilities and , which ensures high computational accuracy with sample sizes typical of rank detectors. The algorithm is based on the well-known formulas for and :
where the summation is carried out for all rank implementations for which the value of the studied statistic exceeds the threshold level , i.e. for the critical region of the studied rank decision rule.
It follows from formulas (19) and (20) that calculations can be organized as an enumeration of all possible values of ranks . At each point in the space of rank values, the value of the rank statistic should be calculated and compared with the threshold. If Если , then it is necessary to calculate the probability of the occurrence of this realization in situations and and include it in the sums (19) and (20). Otherwise, you should move on to the next point, and so on. The total number of iterations is , which can be very large for real values of and .
The number of iterations can be reduced if the statistics and the distribution of ranks are invariant to permutations of arguments. Then it is enough to limit ourselves to bypassing the range of rank values in which
The reduction of the values being viewed is easy to account for if the probabilities are multiplied by the number of equivalent points in the entire space of rank values equal to As a result, instead of viewing points, it is enough to limit ourselves to traversing (m+n)/n points. The traversal order is also important, which is advisable to start from the point and then move in such an order that the rank codes decrease. For example, with n = 2 and = 3, the traversal order will be as follows: {33, 32, 31, 30, 22, 21, 20, 11, 10, 00}. This traversal procedure allows for the minimum number of steps to select all points related to the critical area of the studied decisive rule and stop the traversal long before the final point . The practice of calculations shows [34,35] that for the vast majority of rank statistics, the enumeration of possible rank implementations can be stopped if, at the next exit to the main diagonal, where , the statistic value is below the threshold. In this case, all further points in the above order of traversal either do not fall into the critical region, or their contribution is very insignificant. As a result, the number of iterated rank implementations is reduced by several orders of magnitude, which reduces computational costs.
Let's analyze the effectiveness of the – detection criterion.
The dependence of the probability of correct detection on the signal-to-noise ratio for various degrees of the polynomial for the Rayleigh distribution is shown in Figure 3: 1 - , 2 - ; .
The dependence of the probability of correct detection on the signal-to-noise ratio for the various degrees of the polynomial for the Gaussian distribution are shown in Figure 4: 1 - , 2 - ; .
To evaluate the effectiveness of the –detection criterion, we will use such an important characteristic of signal detection as the threshold signal–to-noise ratio - the minimum ratio at which the signal is still detected with a given probability against the background of noise causing a "false alarm". Let us introduce the concept of losses in the threshold signal-to-noise ratio [36] in comparison with optimal detection
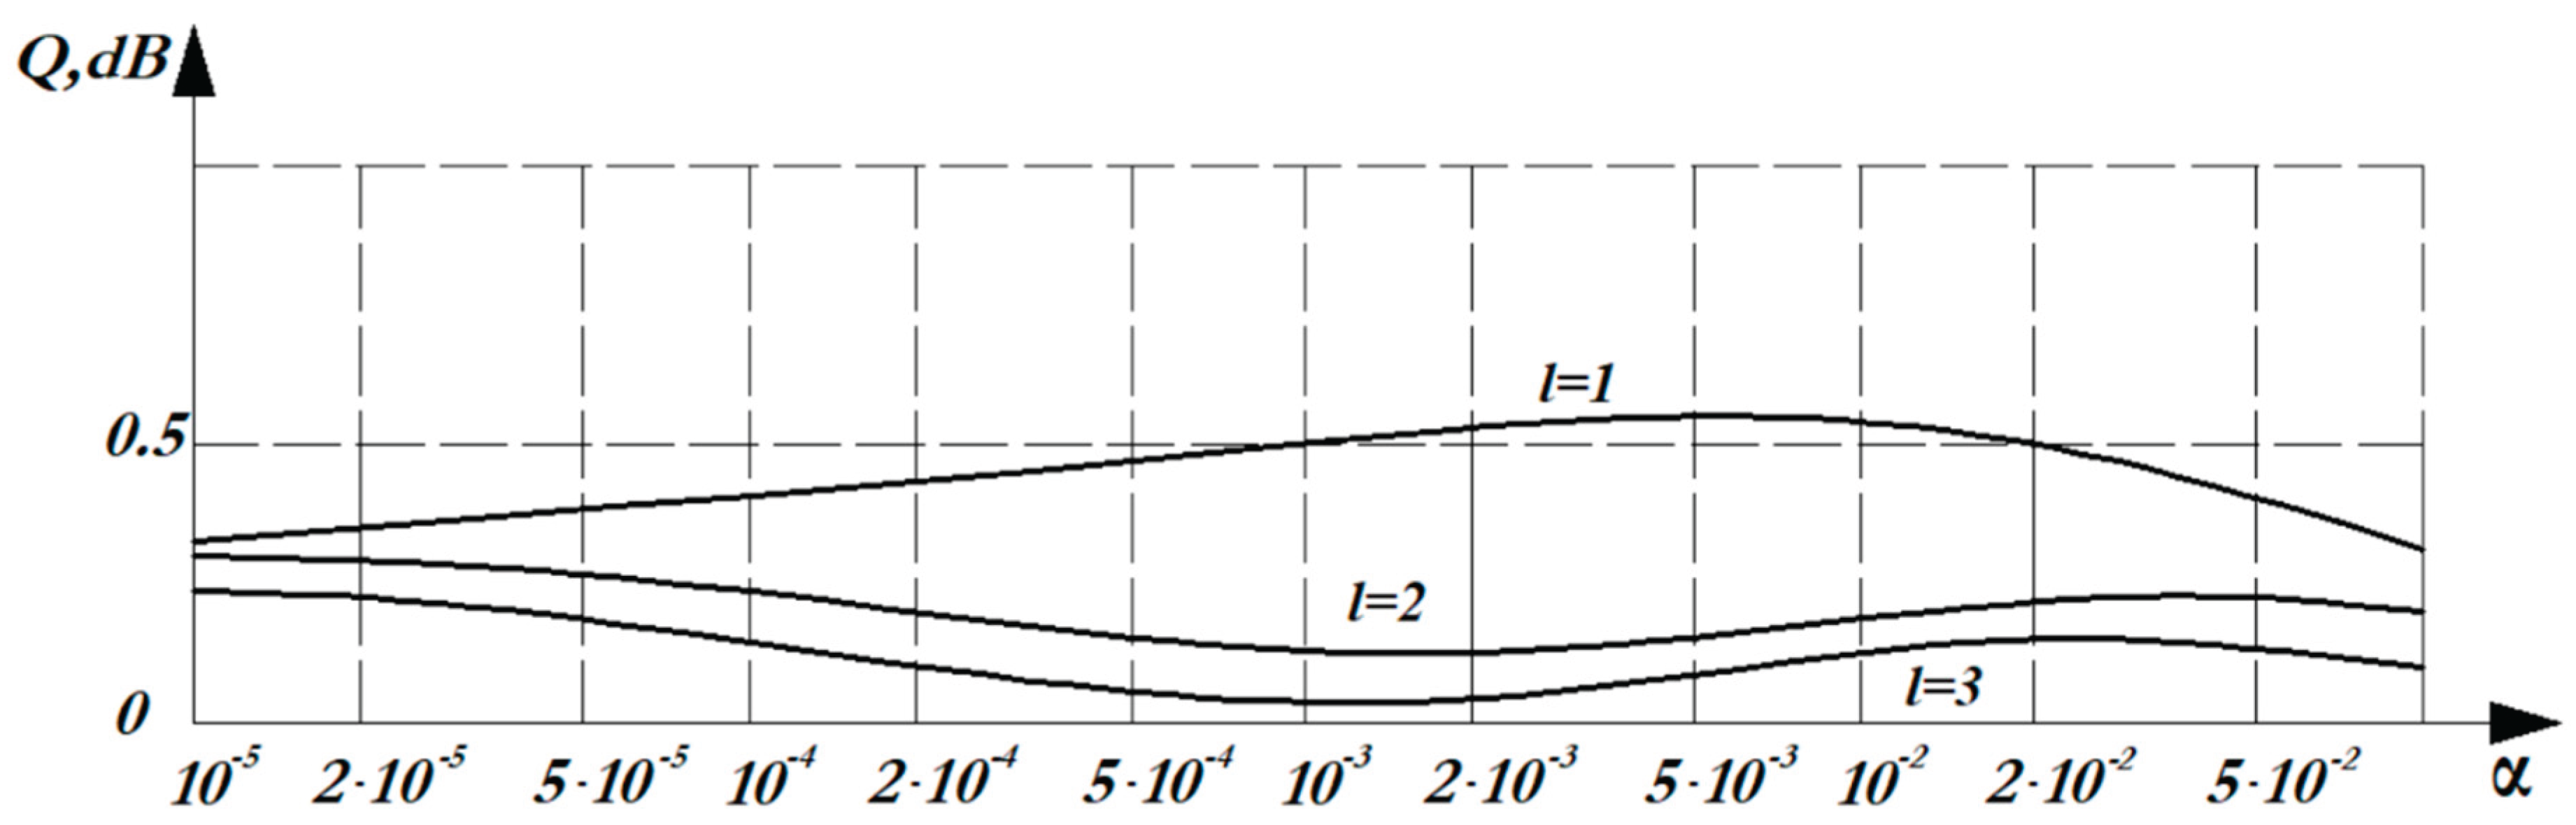
where is the threshold signal-to-noise ratio, providing a given probability of detecting at some fixed probability of false alarm , for optimal detection; is the threshold signal-to-noise ratio, providing a given probability of detecting at some fixed probability of false alarm , for detection by the – criterion. Figure 5 shows the dependence of losses in the signal–to-noise threshold ratio on the probability of a false alarm of the - detection criterion compared with the optimal detection for the Gaussian distribution. Threshold losses are calculated for various degrees of the polynomial and for . Figure 6 and Figure 7 show a similar relationship for the Rayleigh distribution and the Rayleigh-Rice distribution.
5. Discussion
From the graphs shown in Figure 5, Figure 6 and Figure 7, it can be seen that with an increase in the degree of the polynomial , the difference in the noise immunity of the – criterion and the optimal criterion decreases: for the Rayleigh distribution at =1, the loss is 4dB. However, with an increase in the degree of the polynomial (=3), there are practically no losses. The lowest losses are observed for the normal distribution and the Rayleigh-Rice distribution, for which losses at =1 do not exceed 0.5 dB. In general, taking into account the results obtained, =3 can be recommended, since the identity of the – criterion and the optimal criterion is observed. Thus, the – criterion of nonparametric detection has high noise immunity with relative simplicity of implementation.
To detect signals in radio engineering systems in the absence of a priori information about the probabilistic characteristics of noise, the use of rank detection methods is a fairly effective way.
For optimal signal detection, instead of the traditional Neumann-Pearson criterion, it is possible to use the criterion of minimizing the RMS error of measuring the situation parameter. The choice of this criterion is due to the need to take into account the lack of a priori information about the measured mixture of signal and noise, as well as the convenience of the technical implementation, which minimizes the computational costs of the rank detector.
The results obtained indicate that for a rank detector, the probability of correctly detecting signals with a normal noise probability distribution is almost twice as high as with other distributions.
Author Contributions
Conceptualization, Y.B.-B. and M.A.; methodology, Y.B.-B. and M.A.; software, B.M. and Z.K.; validation, Y.B.-B., S.M. and S.G.; formal analysis, Z.K. and S.K.; investigation, Y.B.-B. and B.M.; writing—original draft preparation, S.M. and S.K.; writing—review and editing, Y.B.-B., S.G. and T.A.; visualization, M.A. and T.A.; supervision, Y.B.-B. All authors have read and agreed to the published version of the manuscript.
Funding
This research received no external funding.
Institutional Review Board Statement
Not applicable.
Informed Consent Statement
Not applicable.
Data Availability Statement
Not applicable.
Acknowledgments
The team of authors of the article expresses sincere gratitude to the scientists and specialists of the chairs “Radio-electronic systems and devices”, “Information systems and telecommunications” of N. Bauman Moscow State Technical University, whose consultations and advices were taken into account when performing scientific research.
Conflicts of Interest
The authors declare no conflict of interest.
Abbreviations
The following abbreviations are used in this manuscript:
| CFO | carrier frequency offset |
| RaGAN | relativistic average generative adversarial networks |
| Bi-LSTM | bidirectional long short-term memory |
| FOCC | fourth-order cyclic cumulant |
| NCF | neuron-like criterion function |
| CCF | correlation criterion function |
| SU | sampling unit |
| PU | preprocessing unit |
| RU | ranking unit |
| RSCU | ranking statistics calculation unit |
| TD | threshold device |
| ROM | storage device |
References
- Cao, X.; Ma, H.; Zhang, H.; Jin, J. Virtual Array-Based Signal Detection and Carrier Frequency Offset Estimation in a Multistatic Collaborative Passive Detection System. Remote Sens. 2024, 16, 3152. [CrossRef]
- Peng, L.; Fang, S.; Fan, Y.; Wang, M.; Ma, Z. A Method of Noise Reduction for Radio Communication Signal Based on RaGAN. Sensors 2023, 23, 475. [CrossRef]
- Wang, P.; Yao, J.; Pu, Y.; Zhang, S.; Wen, L. Study of Interference Detection of Rail Transit Wireless Communication System Based on Fourth-Order Cyclic Cumulant. Sensors 2023, 23, 8291. [CrossRef]
- Khobotov, A.G.; Kalinina, V.I.; Khil’ko, A.I.; Malekhanov, A.I. Underwater Acoustic Signal Detection against the Background of Non-Stationary Sea Noise. J. Mar. Sci. Eng. 2024, 12, 1540. [CrossRef]
- Byun, H. Feedback-Controlled Adaptive Signal Detection Scheme for Diffusion-Based Molecular Communication Systems. Appl. Sci. 2023, 13, 2171. [CrossRef]
- Bakulev, P.A. Radar systems. Textbook for universities; Radio engineering: Moscow, Russia, 2004; 46 p. (In Russian).
- Bakuta, P.A. Theory of signal detection; Radio and communications: Moscow, Russia, 1984; 439 p. (In Russian).
- Shirman, Ya.D. Theoretical foundations of radar; Soviet Radio: Moscow, Russia, 1970; 560 p. (In Russian).
- Velikanova, E.P.; Rogozhnikov, E.V. Review of methods for combating passive noise in radar systems. Izvestiya MSTU "MAMI": Moscow, Russia, 2014, vol. 4; P. 29-37. (In Russian).
- Voroshilin, E.P.; Mironov, M. V.; Voroshilina, E.P. Ground target position estimation in passive location. [Electronic resource]. – Access mode: http://ieeexplore.ieee.org/xpl/login.jsp?tp=&arnumber=5540604&url= http%3A%2F%2Fieeexplore.ieee.org%2Fxpls%2Fabs_all.jsp%3Farnumber%3D5540604.
- Mironov, M. V.; Voroshilin, E.P.; Denisov, V. P. Experimental estimation of the time of arrival measurement accuracy increasing along the propagation path at the cost of multi-channel processing. [Electronic resource]. – Access mode: http://ieeexplore.ieee.org/xpl/login.jsp?tp=&arnumber=6053658&url= http%3A%2F%2Fieeexplore.ieee.org%2Fxpls%2Fabs_all.jsp%3Farnumber%3D6053658.
- Gaek, Ya.; Shidak, Z. The theory of rank criteria. Nauka Publ: Moscow, Russia,1971; 376 p. (In Russian).
- Kassam S.A. A bibliography on nonparametric detection. – IEEE Trans., 1980, Vol. IT-26, № 5. – P. 592-602.
- Kuzmin, C.Z. Digital radar. KVITS Publishing House: Kiev, Ukraine, 2000; 428 p. (In Russian).
- Bulyakulov, R.R. The adaptive threshold device. Processing of the 2014 IEEE North West Russia Section Young Researches in Electrical and Electronic Engineering Conference. P.165-169. [CrossRef]
- Peshkov, I.V. Radar. The training manual. I.A. Bunin Yelets State University: Yelets, Russia, 2018; 44 p. (In Russian).
- Leman, E. Verification of statistical hypotheses. Nauka Publ: Moscow, Russia, 1979; 408 p. (In Russian).
- Tarasenko, F.P. Nonparametric statistics. Tomsk University Press: Tomsk, Russia, 1976; 294 p. (In Russian).
- Yesmagambetov B.-B.S. Determination of the Characteristics of Non-Stationary Random.
- Processes by Non-Parametric Methods of Decision Theory. Computation 2023, Volume 11, Issue 11, 219, Basel, November 2023. [CrossRef]
- Grigoriev, F. N.; Kuznetsov, N. A. Detection and evaluation of parameters of evoked potentials. Analysis and synthesis of control systems. Volume 15, No. 4, 2015. P. 389-401. (In Russian).
- Lemeshko, B. Yu.; Veretelnikova, I. V. Criteria for testing hypotheses about randomness and lack of trend. SIC INFRA–M: Moscow, Russia, 2021; 221 p. (In Russian).
- Levin, B.R. Theoretical foundations of statistical radio engineering. Radio and Communications: Moscow, Russia, 1989; 653 p. (In Russian).
- Sosulin, Yu.G. Theoretical foundations of radar and radio navigation. A textbook for universities. Radio and Communications: Moscow, Russia, 1992; 304 p. (In Russian).
- Rohling, Hermann. Ordered statistic CFAR technique – an overview. Radar Symposium (IRS), 7-9 Sept. 2011. P. 631 – 638.
- Yesmagambetov, B.-B.S. Statistical Data Processing in Radio Telemetry Systems; Bulletin of N. Bauman Moscow State Technical University: Moscow, Russia, 2015; P. 13–21. (In Russian).
- Peshkov, I.V. Radar. The training manual. Yelets State University named after I.A. Bunin: Yelets, Russia, 2018; 44 p. (In Russian).
- Berdyshev, V. P.; Garin, E. N.; Fomin, A. N; Tyapkin, V. N.; Fateev, Yu. L.; Lyutikov, I. V.; Bogdanov, A.V.; Kordyukov. R. Y. Radar systems [Electronic resource]. Textbook. Siberian Federal University: Krasnoyarsk, Russia, 2012; 400 p. (In Russian).
- Goshin, G.G. Microwave devices and antennas. The training manual. Tomsk State University of Control Systems and Radio Electronics: Tomsk, Russia, 2012; 160 p. (In Russian).
- Balanis, K.A. Introduction to smart antennas. Technosphere RIC CJSC: Moscow, Russia, 2012; 212 p. (In Russian).
- F. X. Hofele, An innovative CFAR algorithm. In Proc. CIE Int. Conf. Radar, 2001, P. 329–333.
- Bakuta, P.A.; Bolshakov, I.A.; Gerasimov, B.M. Questions of the statistical theory of radar.: Sovetskoe Radio: Moscow, Russia, 1964; 1080 p. (In Russian).
- Harkevich, A.A. Fundamentals of radio engineering. Fizmatlit: Moscow, Russia, 2007; 512 p. (In Russian).
- Bykov, V.V. Digital modeling in statistical radio engineering. Sovetskoe Radio: Moscow, Russia, 1971; 326 p. (In Russian).
- Long Cai, Xiaochuan Ma, Qi Xu, Bin Li, Shiwei Ren. Performance Analysis of Some New CFAR Detectors under Clutter. Journal of Computers, Vol 6, No 6 (2011), 1278-1285, Jun 2011 . [CrossRef]
- Amir Zaimbashi, Mohammad Reza Akhavan Saraf, Hamid MirMohamad-Sadeghi. Binary and Fuzzy Distributed CFAR Detectors. Proceedings of the 5th European Radar Conference, October 2008. P. 384-387.
- Richards, M. A. Fundamentals of radar signal processing. McGraw-Hill: New York, 2014; 656 p.
Figure 1.
The structure of the input information.
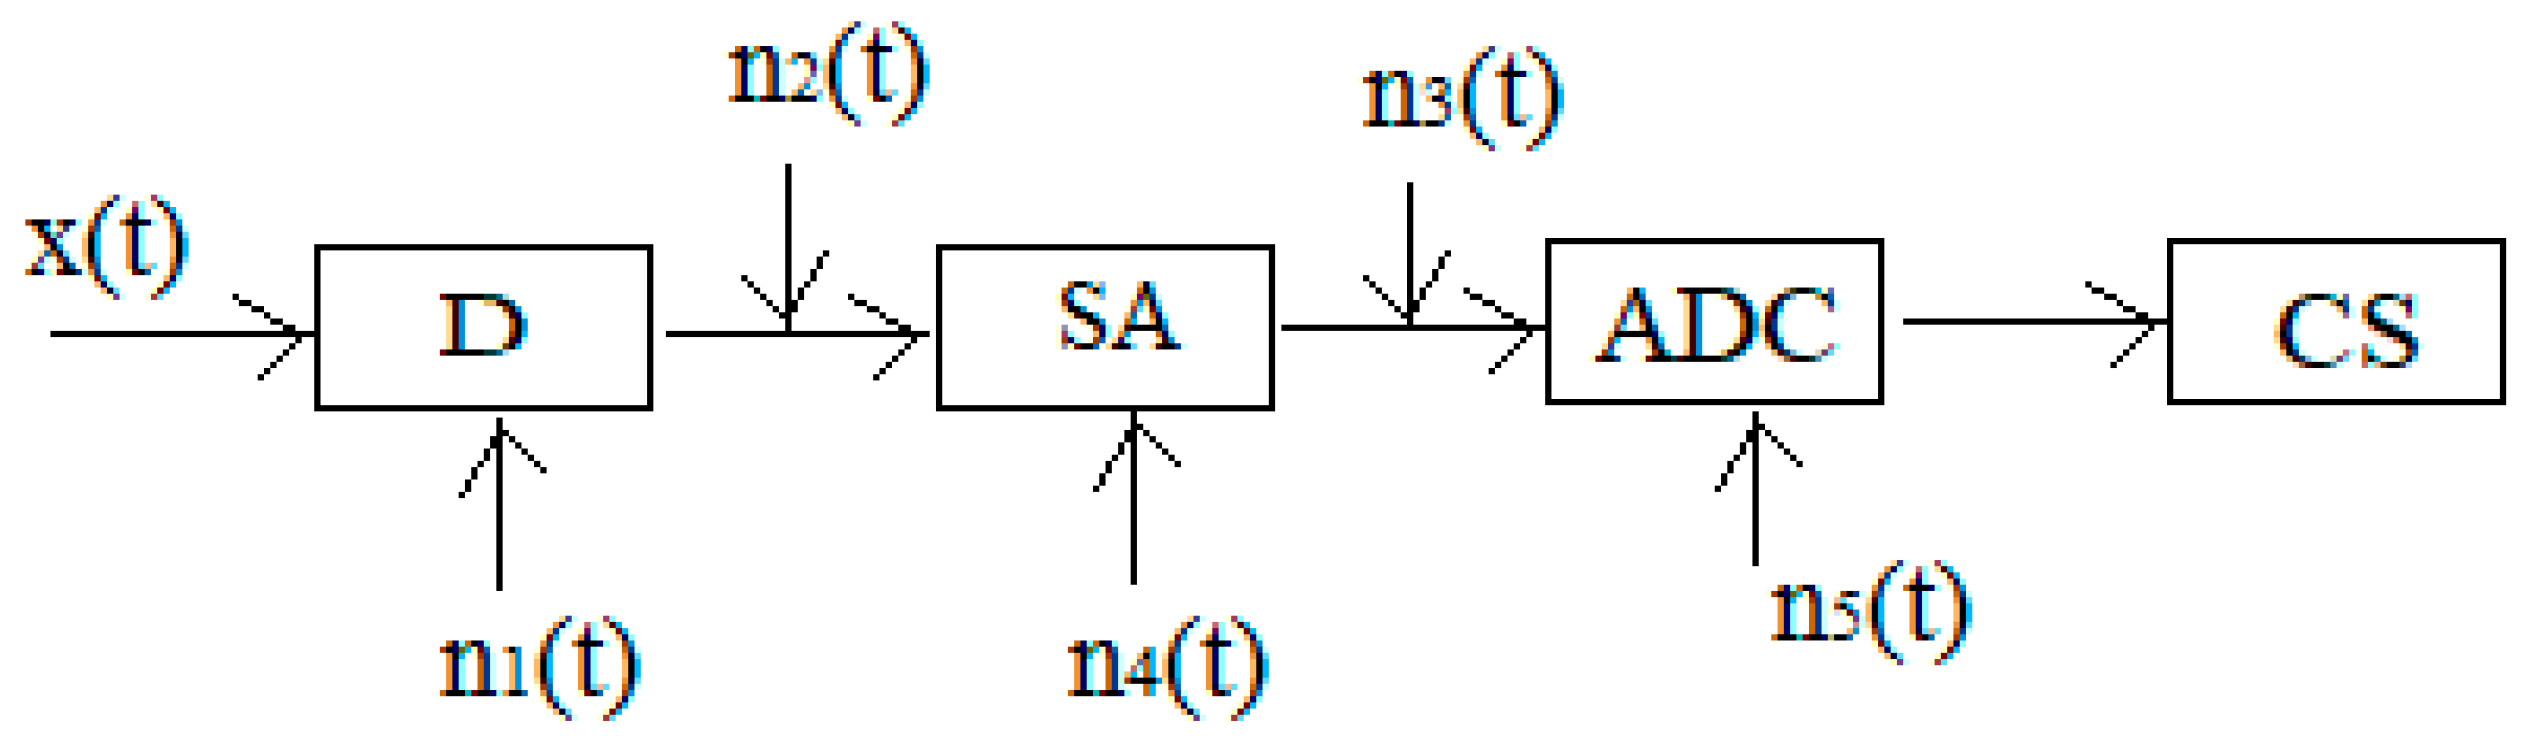
Figure 2.
The structure of rank processing.

Figure 3.
Dependences of the probability of correct detection on the signal-to-noise ratio for various degrees of the polynomial l for a Gaussian distribution.
Figure 3.
Dependences of the probability of correct detection on the signal-to-noise ratio for various degrees of the polynomial l for a Gaussian distribution.

Figure 4.
Dependences of the probability of correct detection on the signal-to-noise ratio for various degrees of the polynomial l for the Rayleigh distribution.
Figure 4.
Dependences of the probability of correct detection on the signal-to-noise ratio for various degrees of the polynomial l for the Rayleigh distribution.
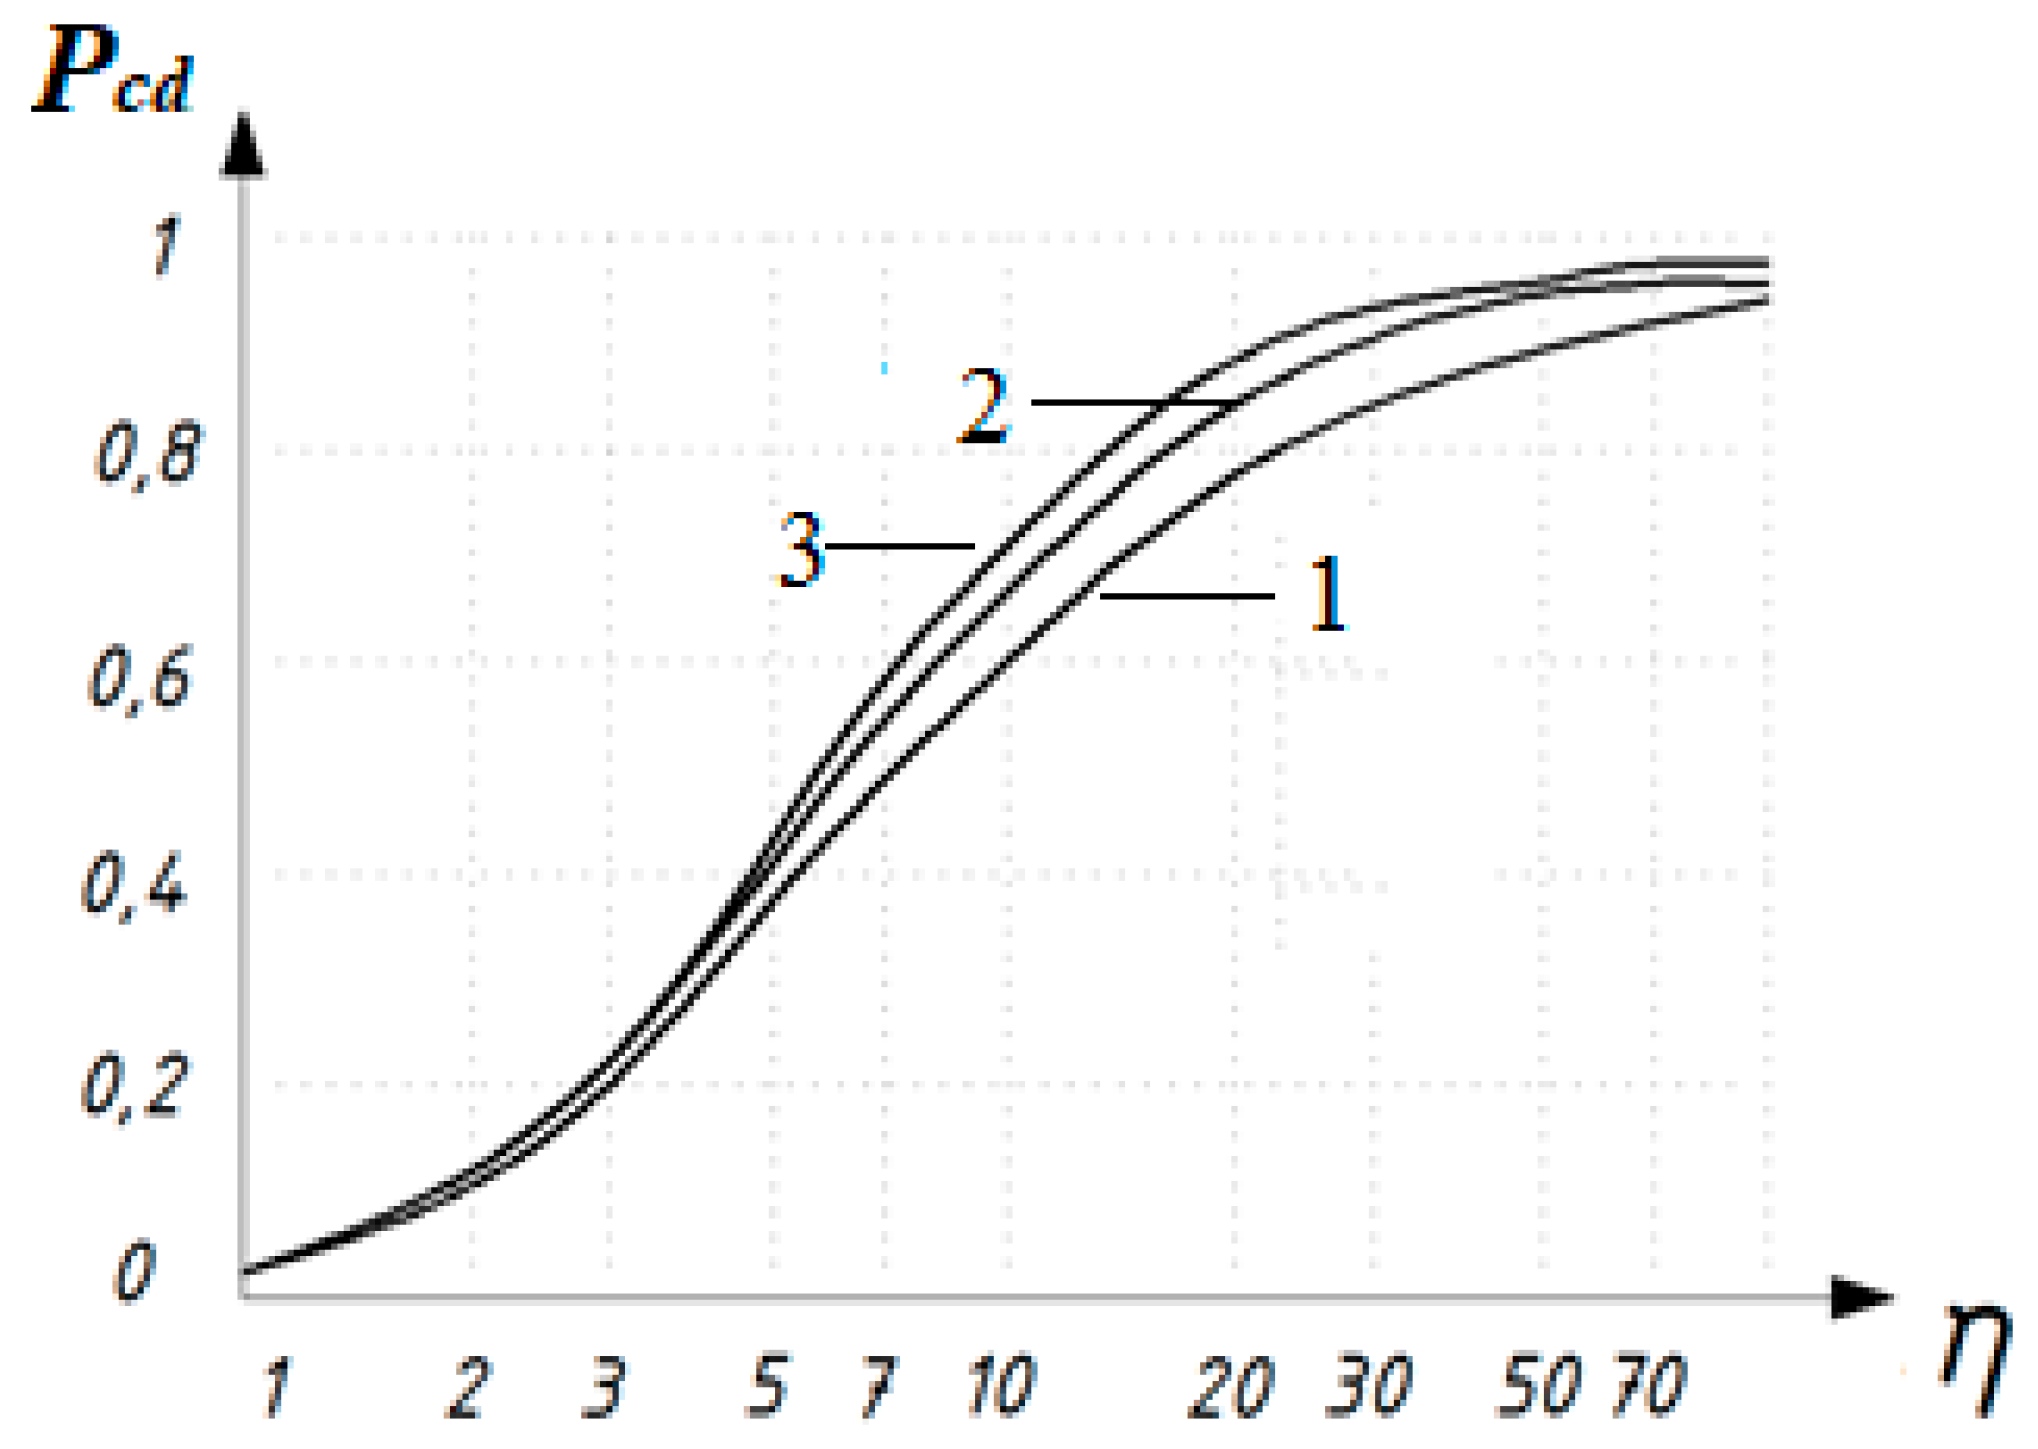
Figure 5.
Dependence of losses in the signal-to-noise threshold ratio on the probability of a false alarm of the – detection criterion compared with optimal detection for the Gaussian distribution.
Figure 5.
Dependence of losses in the signal-to-noise threshold ratio on the probability of a false alarm of the – detection criterion compared with optimal detection for the Gaussian distribution.
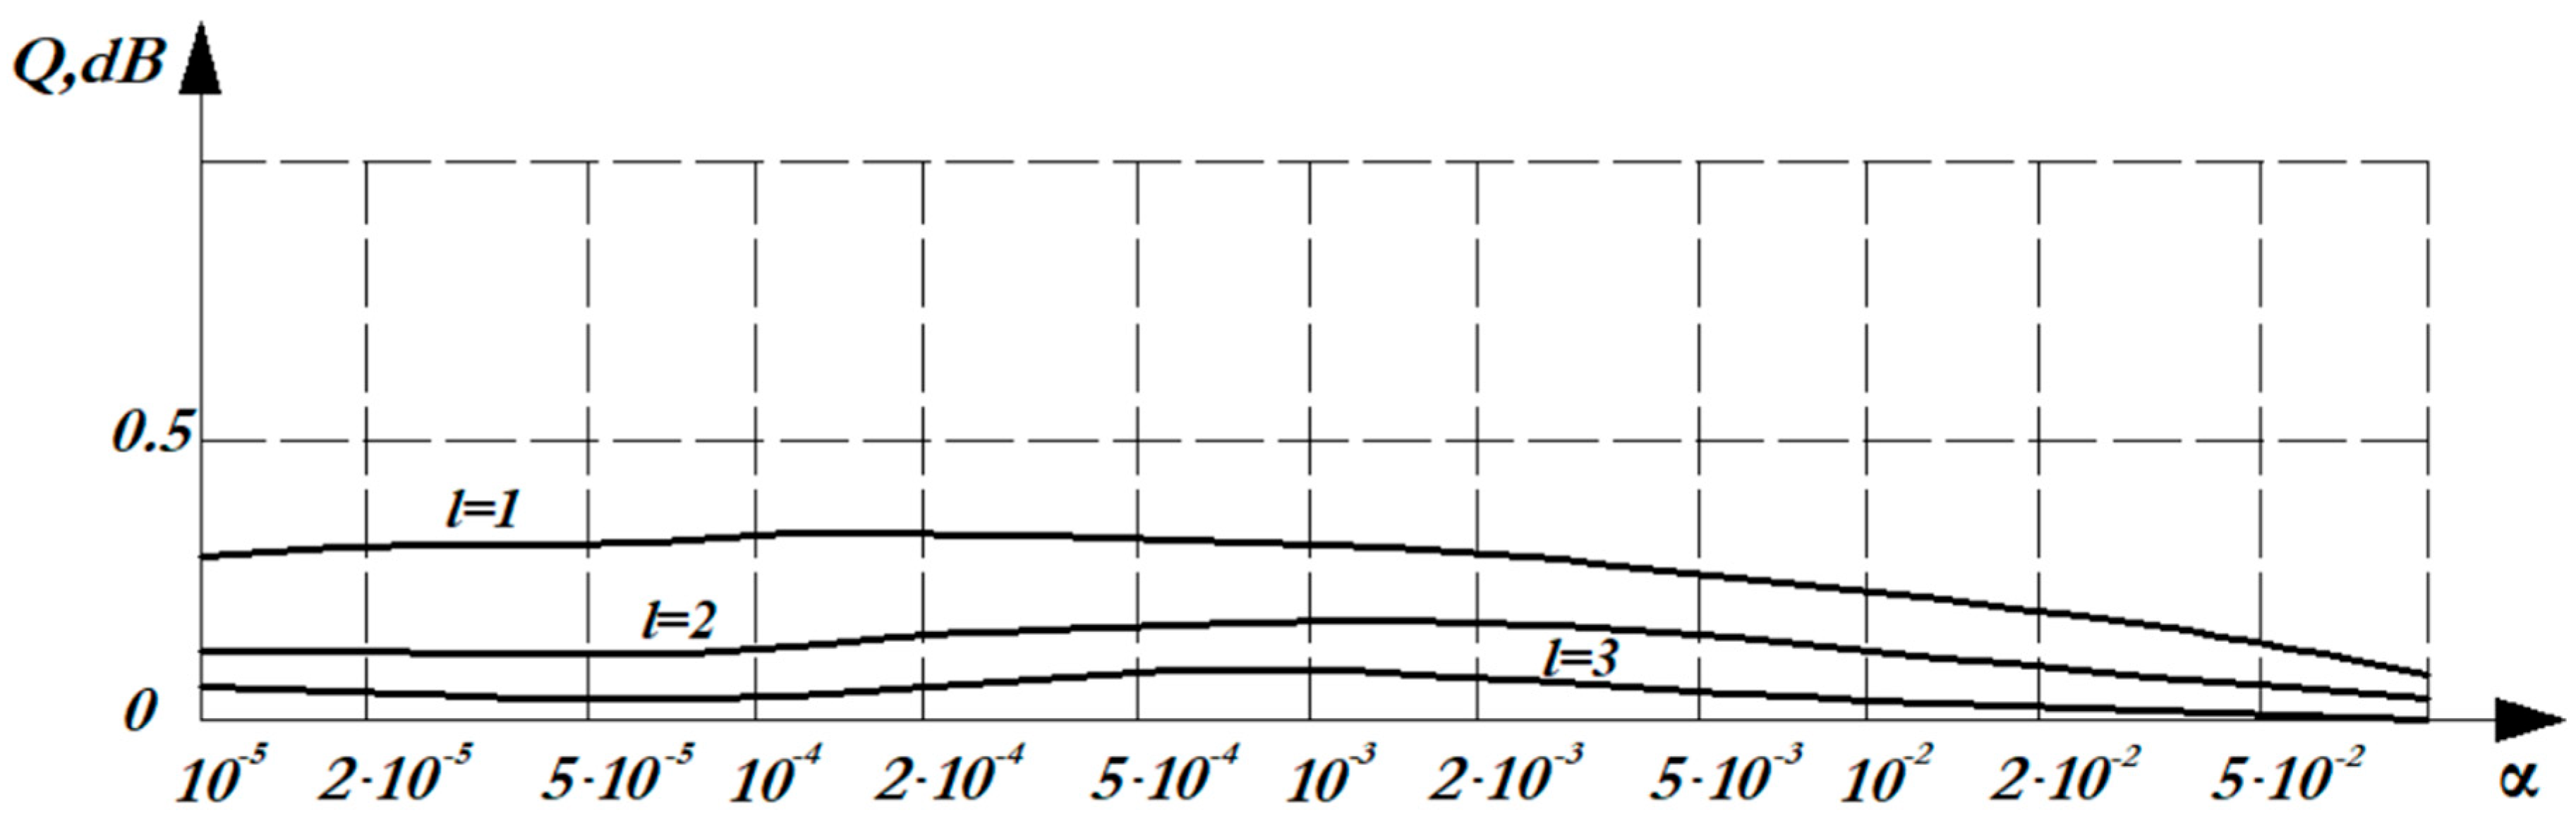
Figure 6.
Dependence of losses in the signal–to-noise threshold ratio on the probability.of a false alarm of the β - detection criterion in comparison with optimal detection for the Rayleigh distribution.
Figure 6.
Dependence of losses in the signal–to-noise threshold ratio on the probability.of a false alarm of the β - detection criterion in comparison with optimal detection for the Rayleigh distribution.
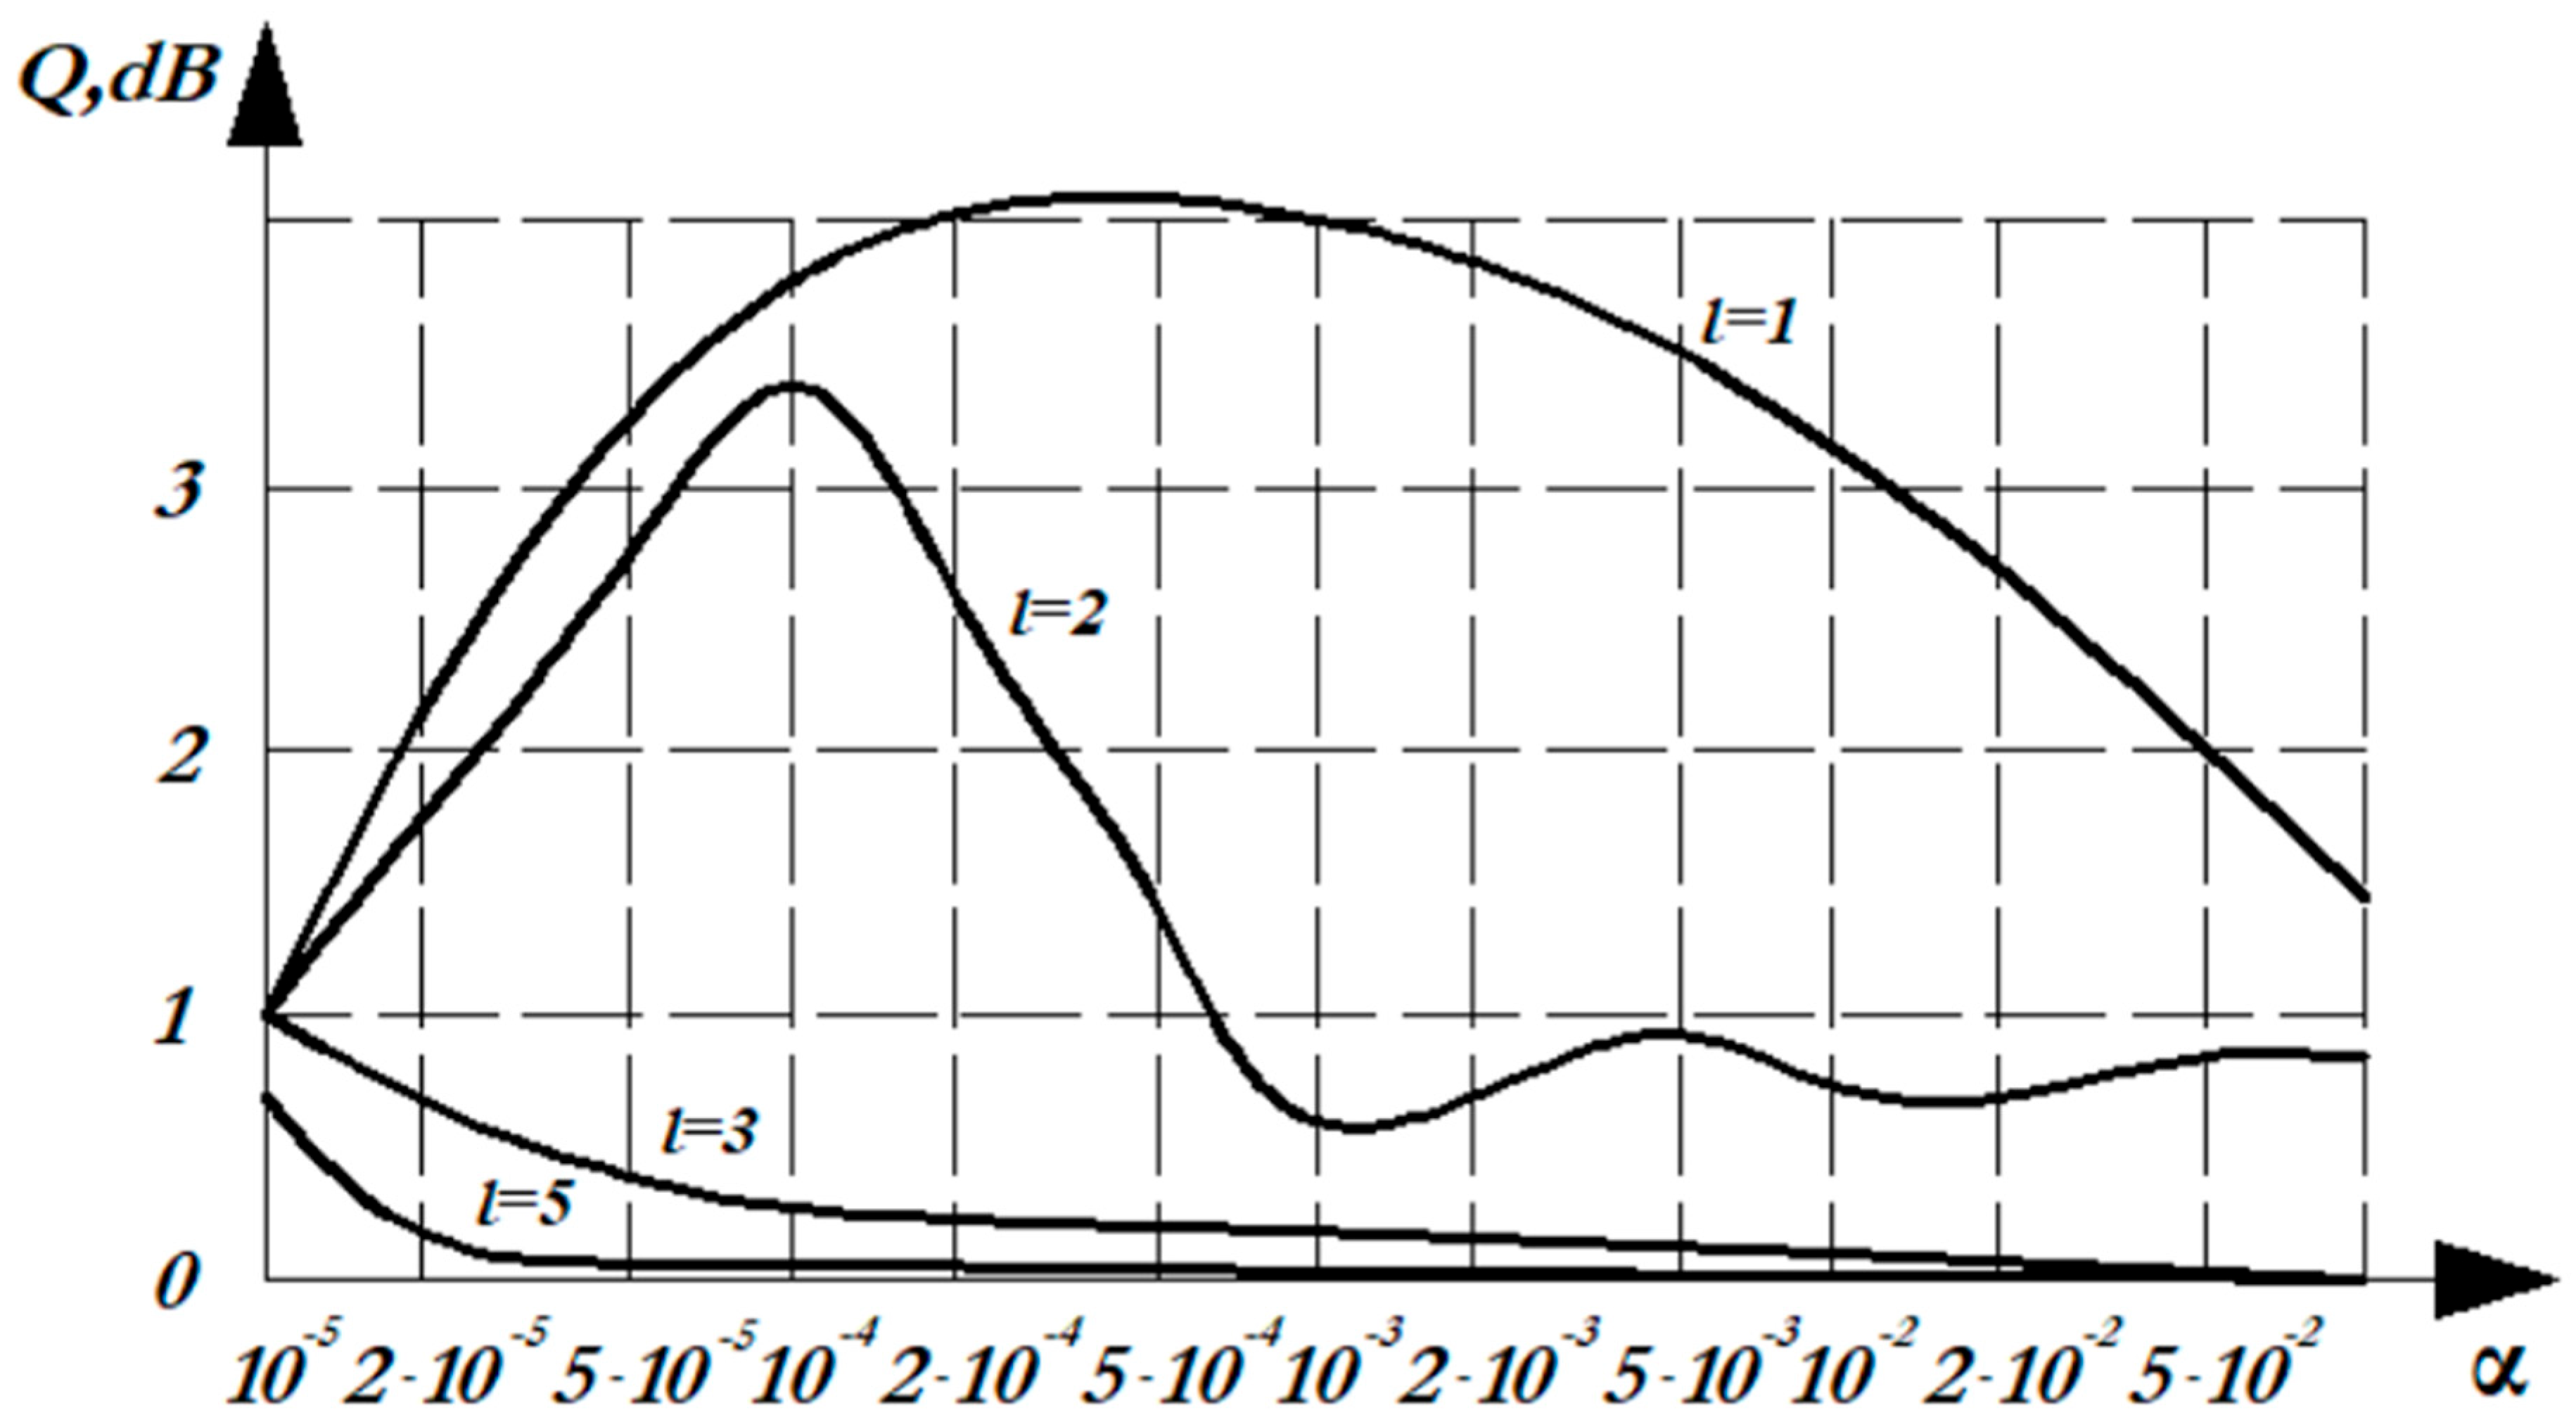
Figure 7.
Dependence of losses in the signal–to-noise threshold ratio on the probability.of a false alarm of the -detection criterion compared with the optimal detection for the Rayleigh-Rice distribution.
Figure 7.
Dependence of losses in the signal–to-noise threshold ratio on the probability.of a false alarm of the -detection criterion compared with the optimal detection for the Rayleigh-Rice distribution.
Disclaimer/Publisher’s Note: The statements, opinions and data contained in all publications are solely those of the individual author(s) and contributor(s) and not of MDPI and/or the editor(s). MDPI and/or the editor(s) disclaim responsibility for any injury to people or property resulting from any ideas, methods, instructions or products referred to in the content. |
© 2025 by the authors. Licensee MDPI, Basel, Switzerland. This article is an open access article distributed under the terms and conditions of the Creative Commons Attribution (CC BY) license (http://creativecommons.org/licenses/by/4.0/).
Copyright: This open access article is published under a Creative Commons CC BY 4.0 license, which permit the free download, distribution, and reuse, provided that the author and preprint are cited in any reuse.


